1 2 7 8 9 10 11 12 - nsf
TRANSCRIPT

1
Non-rainfall moisture: a key driver of microbial respiration from standing litter in arid, semiarid, 1
and mesic grasslands 2
3
Running title: non-rainfall moisture decomposition 4
5
Sarah Evans1*, Katherine E. O. Todd-Brown2, Kathryn Jacobson3, Peter Jacobson3 6
7
Research article, for submission to: Ecosystems 8
9
1Kellogg Biological Station, Ecology, Evolutionary Biology, and Behavior Program, Department of 10
Integrative Biology, Department of Microbiology and Molecular Genetics, Michigan State University, 11
Hickory Corners, MI, USA 12
2Pacific Northwest National Laboratory, Richland, WA, USA, Wilfred Laurier University, Waterloo, 13
Ontario, Canada, Engineering School of Sustainable Infrastructure & Environment, University of Florida, 14
Gainesville, FL 15
3Department of Biology, Grinnell College, Grinnell, IA, USA 16
17
*Corresponding author email: [email protected], 256-337-2482 18
19
Author contributions: KJ and PJ conceived the empirical study and collected data with assistance from 20
SE. KTB and SE conceived and performed the meteorological analysis and modeling. SE was lead author 21
but all authors contributed to writing the paper. 22
23
Current data and code stored at: https://github.com/ktoddbrown/NRM_litter_decay 24

2
25
Abstract 26
Models assume that rainfall is the major moisture source driving decomposition. Non-rainfall moisture 27
(NRM: high humidity, dew, and fog) can also induce standing litter decomposition, but there have been 28
few measurements of NRM-mediated decomposition across sites and no efforts to extrapolate the 29
contribution of NRM to larger scales to assess whether this mechanism can improve model predictions. 30
Here we show that NRM is an important, year-round source of moisture in grassland sites with 31
contrasting moisture regimes using field measurements and modeling. We first characterized NRM 32
frequency and measured NRM-mediated decomposition at two sites in the Namib Desert, Namibia 33
(hyperarid desert) and at one site in Iowa, USA (tallgrass prairie). NRM was frequent at all sites (85-99% 34
of hours that litter was likely to be wet were attributed to NRM) and tended to occur in cool, high-35
humidity periods for several hours or more at a time. NRM also resulted in CO2 release from microbes in 36
standing litter at all sites when litter became sufficiently wet (>5% gravimetric moisture for fine litter and 37
>13% for coarse), and significantly contributed to mass loss, particularly in the western Namib site that 38
received almost no rain. When we modeled annual mass loss induced by NRM and rain and extrapolated 39
our characterization of NRM decomposition to a final semiarid site (Sevilleta, New Mexico), we found 40
that models driven by rainfall alone underestimated mass loss, while including NRM resulted in estimates 41
within the range of observed mass loss. Together these findings suggest that NRM is an important 42
missing component in quantitative and conceptual models of litter decomposition, but there is nuance 43
involved in modeling NRM at larger scales. Specifically, temperature and physical features of the 44
substrate emerge as factors that affect the microbial response to litter wetting under NRM in our sites, and 45
require further study. Hourly humidity can provide an adequate proxy of NRM frequency, but site-46
specific calibration with litter wetness is needed to accurately attribute decomposition to periods when 47
NRM wets litter. Greater recognition of NRM-driven decomposition and its interaction with other 48
processes like photodegradation is needed, especially since fog, dew, and humidity are likely to shift 49
under future climates. 50

3
Key words (6-10): fog, dew, non-rainfall moisture (NRM), standing litter, microbial decomposition, 51
drylands, semiarid, mesic, modeling 52
Manuscript highlights: 53
• Non-rainfall moisture (NRM; humidity, fog, dew) induces decomposition in grasslands 54
• NRM decomposition depends on substrate type and occurs at colder times than rain 55
• Including NRM (instead of rain alone) improved predictions of litter decomposition 56
57
58

4
59 Introduction 60
Decomposition of plant litter and soil organic matter adds more carbon dioxide (CO2) to the 61
atmosphere than fossil fuel use (Schlesinger and Andrews 2000). Thus, relatively small changes in 62
decomposition will have large impacts on atmospheric CO2 concentrations and carbon-climate feedbacks. 63
Despite this importance, our understanding of decomposition, and ability to predict how it will change 64
under future climates, is limited. In particular, ecosystem models, most of which use rainfall and 65
temperature as the major climatic drivers of decomposition, consistently underestimate litter decay rates 66
in drylands (Whitford and others 1981; Throop and Archer 2009), suggesting that mechanisms relevant to 67
decomposition in these areas are omitted. Indeed, recent studies show that previously unrecognized 68
processes such as photodegradation and soil-litter-mixing drive significant surface litter decomposition 69
(Austin and Vivanco 2006; Gallo and others 2006; Throop and Archer 2009; Barnes and others 2011; 70
King and others 2012; Baker and others 2015; Lin and others 2018). 71
An additional phenomenon that may explain underestimation of decomposition in drylands – and 72
potentially other systems – is the stimulation of microbial decomposition by non-rainfall moisture 73
(NRM), or fog, dew, and high humidity. In semi-arid Mediterranean grasslands, Dirks and others (2010) 74
estimated that decomposition in the absence of both rain and photodegradation accounted for an 18% 75
reduction in litter mass, which constituted up to 50% of annual decomposition in this system. They did 76
not directly measure the effect of NRM on decomposition but hypothesized that the decomposition they 77
observed in rainless periods was driven by atmospheric water vapor. Gliksman and others (2016) 78
quantified the influence of NRM-mediated decomposition (hereafter ‘NRM decomposition’) on mass loss 79
at semiarid sites by manipulating microclimate and saw a significant decrease in mass loss in litter bags 80
when NRM and UV were excluded. The role of NRM in decomposition may extend beyond water-limited 81
areas as well (Newell and others 1985; Kuehn and others 2004). For instance in wetlands, Kuehn et al. 82
(2004) observed diel mineralization cycles of standing litter during rainless periods that corresponded 83
with nightly dew formation, with CO2 flux rates comparable to that emitted from soils and sediments. 84

5
Despite accumulating evidence that attests to the potential importance of NRM as a driver of 85
decomposition, there have been few attempts to generalize the processes that control NRM decomposition 86
across biomes or scale NRM decomposition across space and time. Before NRM can be incorporated into 87
conceptual and quantitative models, we need to know more about controls on NRM decomposition and 88
the best approaches for characterizing NRM frequency and duration in different ecosystems. Studies 89
examining mechanistic controls on NRM decomposition, many performed in the laboratory, have 90
highlighted several underlying drivers of NRM decomposition. Dirks and others (2010) suggested that 91
microbial activity drove litter decay in rainless periods because variation in mass loss and litter nitrogen 92
were explained by litter water‐vapor uptake. We showed that litter collected from the Namib Desert 93
exhibited significant CO2-C flux rates under laboratory-simulated nighttime dew and fog (Jacobson and 94
others 2015), beginning within 5 minutes after gravimetric moisture exceeded a critical threshold and 95
lasting for 10 hours (as long as litter was wet). We also found that substrate type may be an important 96
control on NRM decomposition; short periods (2 hours) of >95% relative humidity (RH) induced 97
microbial respiration, but only in fine-textured litter (e.g. grass leaves) and not in coarse tiller stems 98
(Jacobson and others 2015). Further, litter position affects NRM decomposition – standing litter becomes 99
wetter with nighttime humidity and has higher mass loss than surface litter (Almagro and others 2015; 100
Wang and others 2017a; Gliksman and others 2018) – highlighting the importance of position on 101
measurements of both NRM frequency (Sentelhas and others 2008) and litter decomposition. 102
In addition to increased mechanistic knowledge of NRM decomposition, studies of this 103
phenomenon at regional and annual scales are also needed. Few attempts have been made to characterize 104
NRM across biomes, and even fewer to extrapolate its contribution to heterotrophic respiration or annual 105
mass loss. This is in contrast to the vast efforts made to monitor rainfall frequency and understand the 106
effect of rainfall on soil moisture and soil respiration. Climatic variables that help predict occurrence of 107
NRM, like diel RH and temperature, are different from those describing water from rainfall (McHugh and 108
others 2015), and direct measurements of condensed water resulting from NRM such as leaf wetness 109
sensor measurements are rarely included in standard meteorological measurements (Uclés and others 110

6
2016) or collected while measuring litter decomposition. Further, measurements of humidity are typically 111
made at standard height of 1.5 m, rather than at lower heights near standing litter, where RH may differ 112
due to the influence of soil and vegetation on temperature and water availability (Ritter and others 2019). 113
We tested the overarching hypothesis that NRM is an important, year-round source of moisture in 114
xeric and mesic grasslands by 1) offering a first-time quantification of NRM’s contribution to annual 115
mass loss relative to rain, 2) describing the factors that control NRM decomposition, and the conditions 116
under which it occurs, and 3) assessing the ability of different approaches to estimate NRM frequency and 117
NRM decomposition. 118
We took a coupled empirical-modeling approach to meet these goals. We first quantified NRM 119
type, frequency, and duration, and measured microbial respiration (CO2 flux) and annual mass loss of 120
standing litter under NRM at three grassland locations with different moisture regimes (a hyper-arid site 121
in the western Namib Desert with high NRM; an arid site in the eastern Namib Desert with infrequent 122
NRM; and a mesic site in an Iowan grassland with high rainfall and NRM). These empirical field 123
measurements allowed us to assess the conditions under which NRM decomposition occurs, and develop 124
predictive relationships between NRM meteorology and decomposition. Using this information, we 125
modeled annual mass loss when excluding and including NRM (in addition to rain) at each site. We 126
applied our model that extrapolated mass loss attributed to rain and NRM to an additional site, Sevilleta, 127
New Mexico, to test the robustness of our estimate of NRM decomposition at a semi-arid grassland. 128
129
Methods 130
Site descriptions 131
Our entire study (NRM characterization, CO2-C flux measurements, and modeling) included 132
analysis efforts in three regions: the Namib Desert (Namibia), Iowa tallgrass prairie (USA) (Fig. 1, Table 133
1), and a New Mexico semiarid grassland (USA) (Fig. S1, Table 1). We took empirical measurements 134
(CO2-C flux and mass loss from litter, and direct measurement of NRM) at two sites in the Namib with 135
contrasting moisture regimes, and one site in Iowa. We chose sites in the Namib (hyperarid desert) 136
7
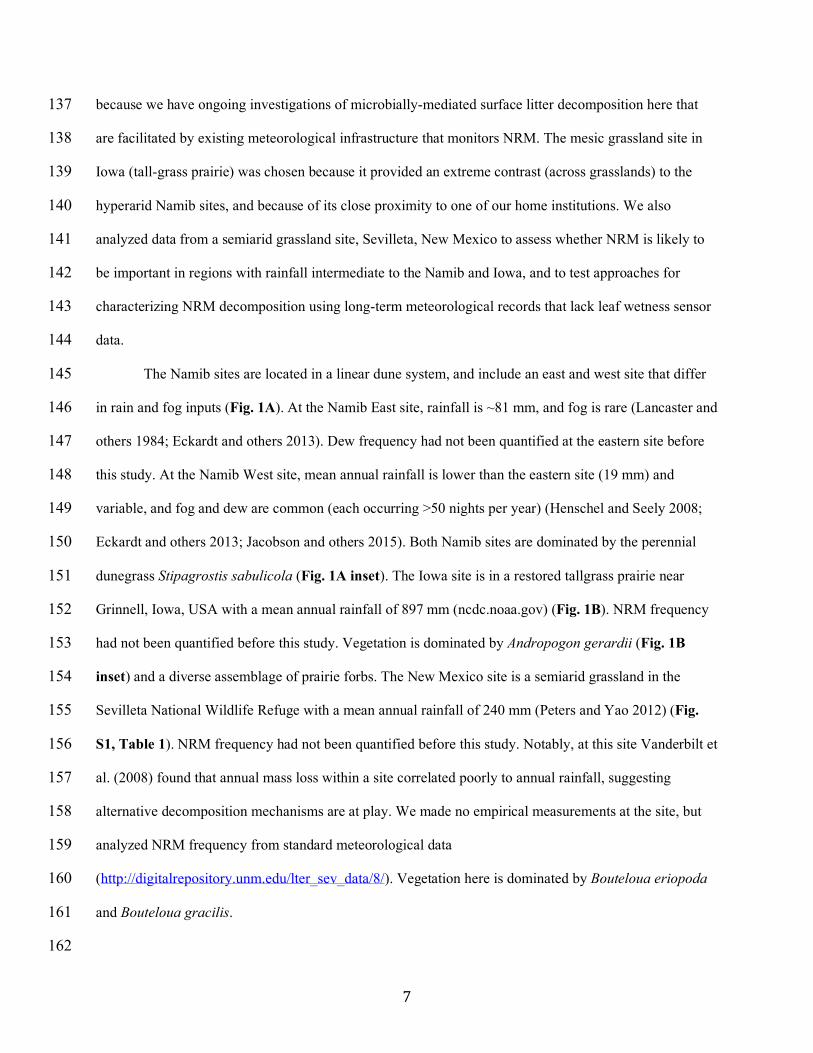
because we have ongoing investigations of microbially-mediated surface litter decomposition here that 137
are facilitated by existing meteorological infrastructure that monitors NRM. The mesic grassland site in 138
Iowa (tall-grass prairie) was chosen because it provided an extreme contrast (across grasslands) to the 139
hyperarid Namib sites, and because of its close proximity to one of our home institutions. We also 140
analyzed data from a semiarid grassland site, Sevilleta, New Mexico to assess whether NRM is likely to 141
be important in regions with rainfall intermediate to the Namib and Iowa, and to test approaches for 142
characterizing NRM decomposition using long-term meteorological records that lack leaf wetness sensor 143
data. 144
The Namib sites are located in a linear dune system, and include an east and west site that differ 145
in rain and fog inputs (Fig. 1A). At the Namib East site, rainfall is ~81 mm, and fog is rare (Lancaster and 146
others 1984; Eckardt and others 2013). Dew frequency had not been quantified at the eastern site before 147
this study. At the Namib West site, mean annual rainfall is lower than the eastern site (19 mm) and 148
variable, and fog and dew are common (each occurring >50 nights per year) (Henschel and Seely 2008; 149
Eckardt and others 2013; Jacobson and others 2015). Both Namib sites are dominated by the perennial 150
dunegrass Stipagrostis sabulicola (Fig. 1A inset). The Iowa site is in a restored tallgrass prairie near 151
Grinnell, Iowa, USA with a mean annual rainfall of 897 mm (ncdc.noaa.gov) (Fig. 1B). NRM frequency 152
had not been quantified before this study. Vegetation is dominated by Andropogon gerardii (Fig. 1B 153
inset) and a diverse assemblage of prairie forbs. The New Mexico site is a semiarid grassland in the 154
Sevilleta National Wildlife Refuge with a mean annual rainfall of 240 mm (Peters and Yao 2012) (Fig. 155
S1, Table 1). NRM frequency had not been quantified before this study. Notably, at this site Vanderbilt et 156
al. (2008) found that annual mass loss within a site correlated poorly to annual rainfall, suggesting 157
alternative decomposition mechanisms are at play. We made no empirical measurements at the site, but 158
analyzed NRM frequency from standard meteorological data 159
(http://digitalrepository.unm.edu/lter_sev_data/8/). Vegetation here is dominated by Bouteloua eriopoda 160
and Bouteloua gracilis. 161
162

8
Meteorological measurements and analysis of NRM frequency using leaf wetness sensors 163
We assessed meteorological conditions at Namib West, Namib East, Iowa, and Sevilleta sites 164
(Table 1) by taking advantage of existing infrastructure and datasets, and adding capabilities where 165
necessary. Namib West is equipped with a SASSCAL meteorological station (http://www.sasscal.org/), 166
which houses a Campbell CS215-L temperature and humidity probe positioned at 2 m, a Juvik fog 167
collector, and a leaf wetness sensor (Campbell 237-L, uncoated, 10 cm height). The Juvik fog collector is 168
an omnidirectional, cylindrical aluminum fog screen, positioned at a height of 1.5 m (Juvik and Nullet 169
1995), and fitted onto a Young tipping rain gauge (Y52203, Young Company, Michigan, USA). At 170
Namib East, we monitored air temperature and relative humidity (RH) (height: 150 cm), rainfall and leaf 171
wetness (height: 25 cm) using a HOBO data logger and sensors (H21-002, S-THB-M002, Davis S-RGD-172
M002, S-LWA-M003) (Onset Computer Corp., USA). 173
A similar meteorological array was used at the Iowa site, except that the RH and temperature 174
sensors were positioned at a height of 65 cm, which was in the midst of the prairie vegetation. An 175
automated tipping-bucket rain gauge (HOBO, RG3-M, 15.24 cm diameter, 0.2 mm resolution) was placed 176
nearby at an elevation of 1.5 m. In Sevilleta, New Mexico, we analyzed NRM frequency from data 177
recorded at the Deep Well Meteorological Station (No. 40), including hourly RH, rainfall, and air 178
temperature. RH and temperature sensors were positioned at a height of 2.5 m. Instrumentation details can 179
be found at http://digitalrepository.unm.edu/lter_sev_data/8/. Leaf wetness data were not recorded at 180
Sevilleta. In sum, meteorological arrays differed slightly across sites. The most important differences 181
were the height of the leaf wetness sensor relative to the plant canopy, and leaf wetness units. We 182
addressed differences in units by converting continuous leaf wetness to categorical when comparing 183
across sites, and sensor height differences by stating in the results when we think the height of the sensor 184
impacted our findings. 185
We estimated total wet hours due to NRM at a site by using either (1) the number of hours leaf 186
sensors were wet, (2) the number of hours that exceeded an RH threshold (Sentelhas and others 2008) or 187

9
(3) a function (‘likelihood wet’) that estimated the likelihood a sensor would be wet, based on RH. A wet 188
hour was attributed to rain if rainfall was detected during that hour. 189
Leaf wetness sensors (Fig. 2E) have been widely used by plant pathologists to estimate periods of 190
wetness that are independent of rainfall (Rowlandson and others 2015), and in other studies to estimate 191
NRM (Gotsch and others 2014; Gliksman and others 2017) by measuring water droplets and films on 192
electronic grid surfaces. In sensors that measured wetness on a discrete scale (Campbell 237-L, Namib 193
West), the wet-dry transition occurred at ~150 kohm; for continuous-scale (%) wetness sensors (Iowa, 194
Namib East), we conservatively defined ‘dry’ periods as those below 10% wetness. We estimated wet 195
hours from RH by totaling hours that RH exceeded either 75% RH (low threshold) or 90% RH (higher 196
threshold), as informed by previous work (Sentelhas and others 2008). Finally, we determined the 197
relationship between wetness sensor readings and RH at each site, developing a function (“likelihood 198
wet”) for the likelihood that the leaf wetness sensor indicated ‘wet’ for a given RH. These likelihood 199
curves were remarkably similar across sites (Fig. S3), justifying use of the mean curve to estimate the 200
number of hours in each site that the sensor was wet (with an uncertainty band based on the between-site 201
variation), including the Sevilleta site, as derived from RH. This estimate of wet hours was used to 202
extrapolate CO2 loss over time (see last section). 203
Having defined wet hours (as determined by leaf wetness in Iowa and the Namib Desert, and a 204
likelihood function in Sevilleta), we calculated the mean temperature and humidity associated with NRM 205
and rain within each site during these events. We were also interested in the duration of a typical rain and 206
NRM event, which required that we delineate the start and end to an event. In our analysis, events were 207
initiated by at least 2 wet hours in a row (to exclude spurious wet hours) and ended at the first 2 dry hours 208
detected. Delineation of events was not possible in Iowa because leaf wetness sensors were often 209
continuously wet for weeks at a time, likely due to the location of the sensor within the prairie canopy. 210
Thus, in contrast to the drier sites, many ‘events’ at the Iowa site could include both rain and NRM. 211
Please see https://github.com/ktoddbrown/NRM_litter_decay for the code associated with this analysis. 212
213
10
Empirical measurements of mass loss and respiration in the field 214
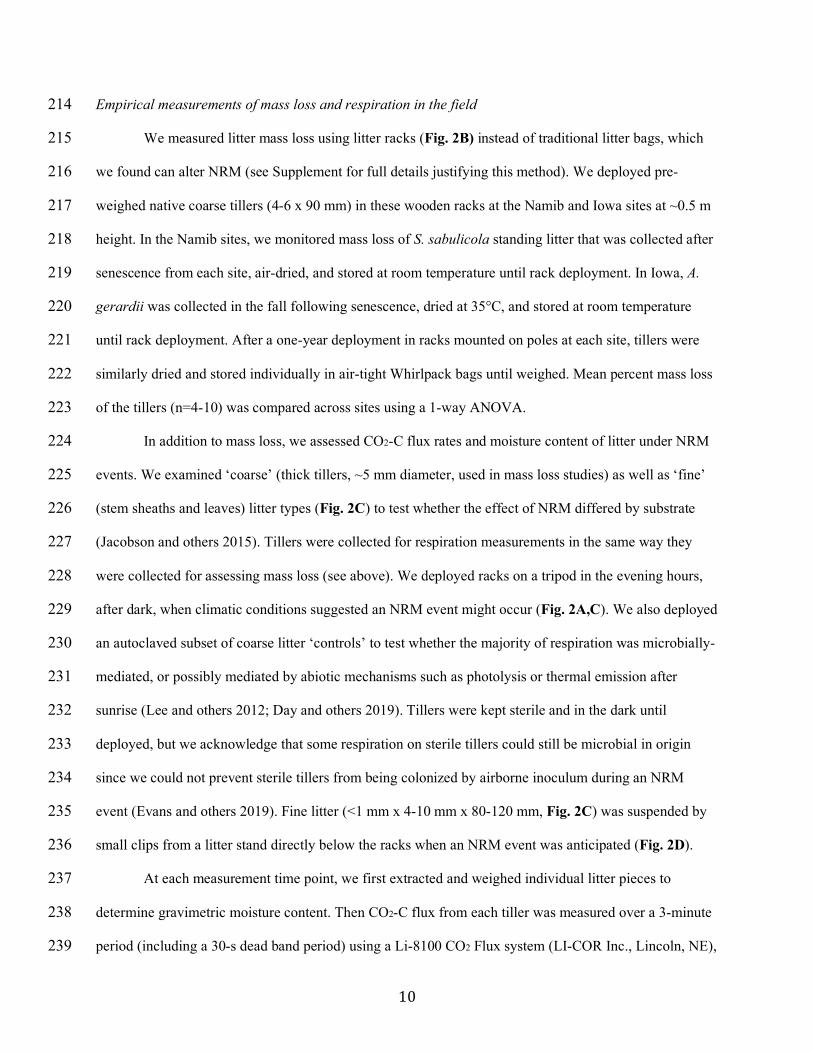
We measured litter mass loss using litter racks (Fig. 2B) instead of traditional litter bags, which 215
we found can alter NRM (see Supplement for full details justifying this method). We deployed pre-216
weighed native coarse tillers (4-6 x 90 mm) in these wooden racks at the Namib and Iowa sites at ~0.5 m 217
height. In the Namib sites, we monitored mass loss of S. sabulicola standing litter that was collected after 218
senescence from each site, air-dried, and stored at room temperature until rack deployment. In Iowa, A. 219
gerardii was collected in the fall following senescence, dried at 35°C, and stored at room temperature 220
until rack deployment. After a one-year deployment in racks mounted on poles at each site, tillers were 221
similarly dried and stored individually in air-tight Whirlpack bags until weighed. Mean percent mass loss 222
of the tillers (n=4-10) was compared across sites using a 1-way ANOVA. 223
In addition to mass loss, we assessed CO2-C flux rates and moisture content of litter under NRM 224
events. We examined ‘coarse’ (thick tillers, ~5 mm diameter, used in mass loss studies) as well as ‘fine’ 225
(stem sheaths and leaves) litter types (Fig. 2C) to test whether the effect of NRM differed by substrate 226
(Jacobson and others 2015). Tillers were collected for respiration measurements in the same way they 227
were collected for assessing mass loss (see above). We deployed racks on a tripod in the evening hours, 228
after dark, when climatic conditions suggested an NRM event might occur (Fig. 2A,C). We also deployed 229
an autoclaved subset of coarse litter ‘controls’ to test whether the majority of respiration was microbially-230
mediated, or possibly mediated by abiotic mechanisms such as photolysis or thermal emission after 231
sunrise (Lee and others 2012; Day and others 2019). Tillers were kept sterile and in the dark until 232
deployed, but we acknowledge that some respiration on sterile tillers could still be microbial in origin 233
since we could not prevent sterile tillers from being colonized by airborne inoculum during an NRM 234
event (Evans and others 2019). Fine litter (<1 mm x 4-10 mm x 80-120 mm, Fig. 2C) was suspended by 235
small clips from a litter stand directly below the racks when an NRM event was anticipated (Fig. 2D). 236
At each measurement time point, we first extracted and weighed individual litter pieces to 237
determine gravimetric moisture content. Then CO2-C flux from each tiller was measured over a 3-minute 238
period (including a 30-s dead band period) using a Li-8100 CO2 Flux system (LI-COR Inc., Lincoln, NE), 239

11
equipped with a small (~55 ml) respiration chamber (LI-COR 6400-89). The majority of CO2-C flux 240
measurements were made at night when it was dark and cool (or, after sunrise, at temperatures <25°C and 241
out of direct sunlight) so photolysis and thermal degradation were unlikely or minimal. After 242
measurement, litter pieces were immediately replaced in the rack or stand. At the conclusion of the NRM 243
event, litter was dried at 35°C to determine gravimetric moisture, and CO2-C flux was expressed on a dry 244
weight basis, as is standard when assessing litter. 245
We first analyzed whether respiration observed under NRM was microbial in origin by 246
comparing CO2 flux rates of sterilized to unsterilized pieces of litter (t-test, n=5-10). We tested controls 247
for NRM respiration and gravimetric moisture using multiple linear regression. We included all replicate 248
litter pieces in a sampling time point after finding no significant effect of rack (p>0.1) or event (p>0.1), 249
and excluding points at the end of events, which were under-sampled (see Results). With this dataset 250
(N=128), we tested (1) the effect of site, gravimetric moisture, and litter type, on respiration; and (2) the 251
effect of leaf wetness and litter type on gravimetric moisture at Iowa and Namib sites. Since CO2 flux at 252
Namib East and West sites did not differ in response to any of these environmental drivers, we combined 253
into one ‘Namib’ site. All statistical analyses were performed in R v. 3.4.0 (R Core Team 2017). 254
255
Extrapolation of CO2 flux across space and time 256
We assumed that microbially-mediated decomposition occurred during wet periods at all sites, as 257
supported by our field observations. We used our empirical measurements of gravimetric moisture and 258
litter respiration to determine the CO2-C flux associated with a wet hour. We calculated the mean CO2-C 259
flux (with 90% quantiles) when litter was above 15% gravimetric moisture (an approximate threshold for 260
respiration turning ‘on’ across sites, see Fig. 4A), and estimated CO2-C loss at all sites by multiplying this 261
flux rate by estimated wet hours as defined by likelihood wet function (see above for alternative 262
approaches for calculating wet hours that were not used for the CO2 extrapolation). We were unable to 263
directly correct for temperature in our study (e.g. using a Q10 sensitivity) and suggest future studies do so. 264
However, we measured CO2 flux under a relatively broad temperature range, and capture the resulting 265

12
variation in respiration rates in the 90% quantiles, which are used to generate the confidence intervals 266
surrounding our mass loss estimates. We were also not able to connect gravimetric moisture directly to 267
leaf wetness or meteorological conditions (beyond a coarse ‘wet/dry’), and look forward to future studies 268
addressing this gap. To facilitate comparisons across sites, which had slightly different measurement 269
periods, we converted extrapolated CO2 flux to an annual scale. Although the goal of our study was not to 270
develop models for mass loss, we did measure mass loss in the field at these sites and we wanted to 271
compare our extrapolated estimates that included and excluded NRM to these mass loss values. To do 272
this, we calculated a CO2-flux-based ‘extrapolated mass loss’, converting C to litter mass by assuming 273
50% of mass was C (Schlesinger 1977), but acknowledge that we did not measure other processes that 274
contribute to mass loss, like leaching of dissolved organic C or other trace gas loss. 275
276
Results 277
Characterization of non-rainfall moisture (NRM) across sites 278
Despite the large difference in rainfall across the sites (Table 1), many aspects of NRM were 279
similar. For instance, the proportion of wet hours attributed to NRM was exceedingly high (85.0-99.1%), 280
and NRM generally occurred during humid (81%-93%) and cool (12-13°C) periods for several hours or 281
more (Table S3, Fig. S2), conditions sufficient to induce microbial activity. We observed substantially 282
more total NRM wet hours compared to rainfall-wet hours at all sites. In the Namib sites, temperature 283
during NRM was generally lower than it was during rain, and RH was higher (Table 2, Table S2). In 284
Iowa, NRM occurred across a broader range of temperatures than in the Namib (Table 2), and at more 285
similar temperatures to those in rain periods. In addition to their far greater frequency, NRM events may 286
also last longer than rain events (Fig. S2), but we could not test this comprehensively because of the few 287
rain events in the Namib sites, and the challenge in delineating events in the Iowa site. Specifically, 288
wetness sensors measured many-day wet periods in Iowa, especially in the summer months, because of 289
the consistently high humidity at the height of the sensor (65 cm) resulting from the dense vegetation 290
canopy that traps soil-derived moisture. In the Namib, NRM events were longer in Namib West (7.3 h) 291

13
than Namib East (6.0 h) (p=0.007) (Fig. S2). A general caveat to these trends is that our sampling period 292
was a single year, not long-term mean annual NRM frequency. We have no reason to assume our NRM 293
data are unique to this year and note that annual precipitation means for our sampling periods are similar 294
to or slightly lower than published long-term means at each site (Table 1). 295
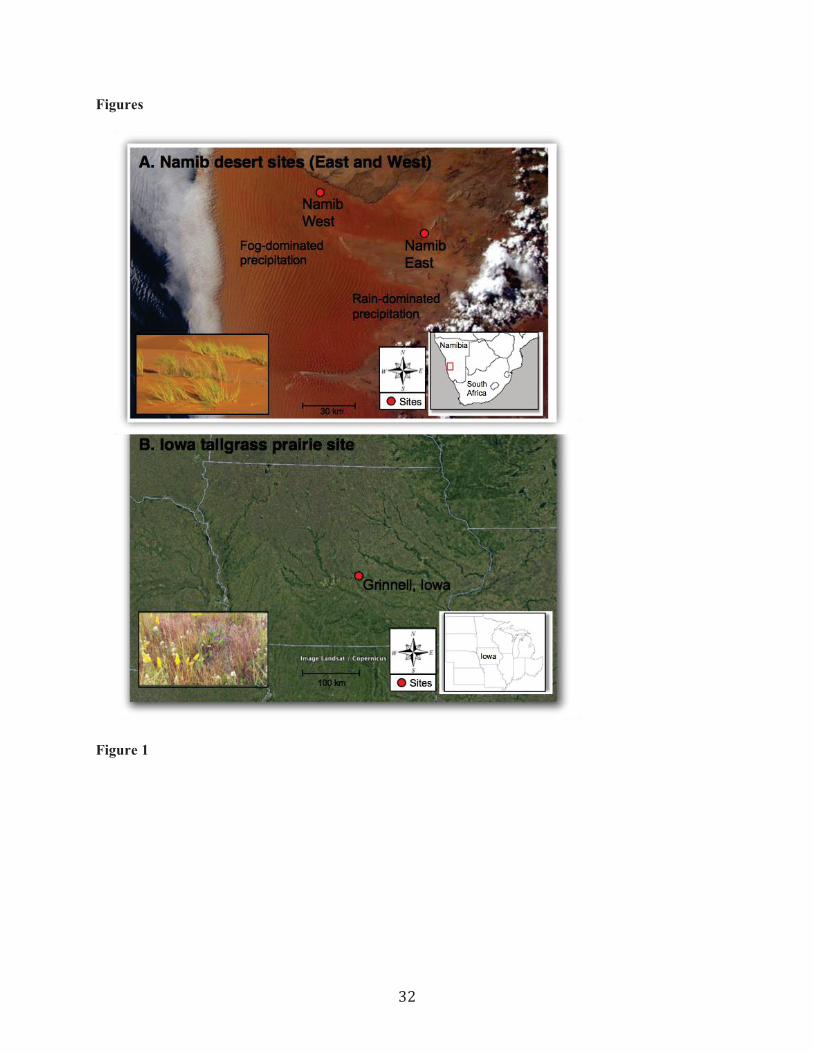
The different approaches for estimating wet hours (wetness sensor, high humidity, and a 296
likelihood function) were generally comparable within a site, and consistently estimated more wet hours 297
due to NRM than wet hours attributed to rain (Fig. 3). Estimates of wet hours from leaf wetness sensors 298
fell within the range of estimates generated using RH threshold, but the RH threshold chosen (75% vs. 299
90%) had a large impact on the proportional contribution of NRM to wet hours in a site (Fig. 3). An RH 300
of 85% produced estimates near those measured by leaf wetness sensors. A “likelihood wet” function also 301
produced wet estimates similar to those measured by leaf wetness at each site (Fig. S3, Fig. 3), which also 302
indicated that our estimates of wetness frequency at Sevilleta were similar to what we would have 303
measured with a leaf wetness sensor. 304
305
Field measurements of NRM-induced litter respiration 306
We observed significant CO2 release under multiple NRM events from standing litter in both arid 307
and mesic grassland systems (Table S3). In a typical NRM event in the Namib that induced respiration 308
(Fig. 4), CO2 flux were typically first detected (i.e. above background levels) during the night as 309
temperatures decreased and RH increased. Rates of CO2 flux were sustained with high litter moisture 310
during the night-time hours, then decreased in the morning as RH decreased and temperature increased 311
(Fig. 4B & C). Notably, in this event, microbial respiration decreased before litter moisture, but in other 312
events, microbial respiration continued when leaf wetness was ‘dry’ and moisture was very low (Table 313
S3). CO2-C flux rates at a single time point were as high as 109.58 g CO2-C/g litter/hour (mean across 314
N=5 pieces of fine litter during fog in Namib West) (Table S3). The majority of CO2 flux was mediated 315
by microbial activity; sterile tillers exposed to NRM had very low CO2 flux rates that were significantly 316
lower than microbial respiration from nonsterile tillers (Table S4). Since it was difficult to predict when 317

14
dew would occur, we started most CO2 flux measurements in the middle of an event (Fig 4A), so we 318
know less about moisture levels that induce respiration under NRM. Events generally ended by mid-319
morning (09:00) (Fig. 4C) but on three occasions we observed tillers that were slightly wet (5-10% 320
gravimetric moisture) and respiring at low levels into the late morning and early afternoon, even though 321
the leaf wetness sensor measured zero (Table S3, Fig. 4). 322
We used a regression approach to test the generality of the response of respiration to NRM across 323
litter type, site, and precipitation type (rainfall, fog, dew, high humidity) in the Namib and Iowa. Since we 324
were interested in controls on the maximum and sustained respiration flux, and did not have the sample 325
size to determine the conditions under which respiration ceased, we excluded all CO2-C flux 326
measurements that occurred while litter was drying (e.g. at the end of an event) from regression analysis 327
(Table S3, right column). NRM induced significant respiration at Namib West (where fog is common), 328
but also at Iowa and Namib East sites (Fig. 4, Table S3), verifying that microbial activity under NRM is 329
not unique to sites where fog is frequent, or to hyper-arid systems. 330
Gravimetric moisture explained 60% of respiration under NRM across sites (p<0.001) (Fig. 5A), 331
although it explained little variation in Iowa (y=0.209x+27.88, R2=0.06, p<0.001), compared to the 332
Namib (y=0.88x+7.38, R2=0.71, p=0.038, Fig. 5A). There was no difference in CO2-C flux response 333
between the two Namib sites. The slope of respiration response differed between Namib and Iowa sites, 334
however (p<0.05 to reject the null of equal slopes). CO2 flux measured from fine litter in Iowa was more 335
constrained at the wetter end, but this may be explained by the fact that sampling in Iowa took place 336
during cooler events (mean temperature for fine litter NRM events in Iowa=8.4°C and Namib=14.9°C, 337
Table S3), rather than differences in microbial community activity across sites. Litter type significantly 338
affected the extent of litter wet up during NRM (p<0.001). Fine litter (leaves and tiller sheaths, see Fig. 339
2C) became wetter than coarse litter (tillers) under the same leaf wetness (Fig. 5B), and generally 340
exhibited higher CO2 flux (Fig. 5A). 341
We also tested whether rain versus NRM events have different effects on litter wetness and CO2 342
flux. We did not measure flux under rain in enough rain events to assess this statistically, but our data 343

15
suggest that NRM events result in at least as much wet-up and C loss as rain events. During the rain event 344
we documented in Iowa, mean flux was 28.33 g CO2-C/g litter/hour (N=5), within the range of flux 345
observed under NRM events (0.166 – 37.91 g CO2-C/g litter/hour, Table S3). During a relatively large 346
rain event at the Namib West site (12.8 mm, 6 June 2016), coarse litter gravimetric moisture was similar 347
to moisture reached under typical NRM events (maximum 32% under rain, 35% under NRM), and fine 348
litter actually became more wet under NRM than rain (maximum 20.5% under rain and 145% under 349
NRM) (Table S3). We did not discern any differences in moisture or flux patterns between NRM types 350
(fog versus dew; p-value > 0.05, N=5 dew and N=3 fog events). 351
352
Contribution of NRM to annual decomposition 353
Litter mass loss, measured empirically, was highest in Iowa and generally low in the arid and 354
hyper-arid Namib sites (Fig. 6). Notably, mass loss in the in Namib West was similar to – and even 355
trending higher than – mass loss in Namib East (but not significantly different, p=0.66), a site with more 356
rainfall but less NRM (Table 2, Fig. S2). The exclusion of NRM (that is, using rain as the only driver of 357
decomposition) resulted in very low estimates of extrapolated annual mass loss at all sites (Fig. 7). 358
Incorporating NRM resulted in a ~6-fold increase in extrapolated-mass loss at the most mesic Iowa site, 359
to a >100-fold increase at the hyper-arid Namib West site (Fig. 7). The height of the sensors in Iowa, 360
which were beneath the plant canopy unlike sensors at other sites, may have contributed to the high NRM 361
measured at in Iowa because plant transpiration leads to high RH. Using rainfall hours alone 362
underestimated observed mass loss in the sites where it was measured (Namib and Iowa, lines, Fig. 7, 363
standardized to annual scale), while NRM+Rain-extrapolated estimates fell within the range of observed 364
values. This is true even though extrapolation calculations did not include photodegradation (photolysis 365
or photopriming) but rather based on respiration rates made on litter stored in the dark and assessed at 366
night. This omission (or other assumptions in the extrapolation) could have contributed to 367
underestimation of observed mass loss at high-UV sites like Namib East. At Sevilleta, when NRM was 368
included, extrapolated mass loss was closer to observed values, which previous studies have estimated to 369
16
be 10% for A. gerardii (Brandt and others 2010) and 20.1% for B. eriopoda (Vanderbilt and others 2008). 370
We took caution in using these values as comparison because they were determined by litterbags, which 371
could underestimate observed NRM decomposition (see Supplemental Methods). 372
Estimates of extrapolated mass loss that included NRM had large confidence intervals (Fig. 7). 373
The primary source of this uncertainty was the wide range of potential CO2 flux rates that can be induced 374
under wet conditions (refer to data in Fig. 5), rather than uncertainty surrounding the estimations or 375
extrapolation of NRM duration (Fig. S4). Even when NRM duration was directly measured using leaf 376
wetness sensors, removing the uncertainty introduced by duration estimates, confidence intervals for the 377
overall CO2 flux rates remained large (Fig. S4C). Still, other factors did introduce some variation in 378
estimated NRM duration. There were some differences in the relationship between leaf wetness and RH at 379
different sites; for example sensors became wet at slightly lower RH values at Namib East than at Namib 380
West (Fig. S3). The global RH function predicting leaf wetness (Fig. S3) was also in line with previous 381
estimates; predicted sensors were more likely to be wet than dry around 82% RH. Finally, as noted above, 382
we also examined the accuracy of estimating wet days using an RH threshold approach. While we did not 383
use this approach for our primary extrapolation of mass loss (in Fig. 7), we did find that the RH threshold 384
chosen is extremely important. Decomposition estimates were very sensitive to the threshold value chosen 385
(75%-90% in this study, Fig. 3 and Fig. S4), reiterating the need for site-specific calibrations of wetness 386
sensor-RH relationships. A well-chosen threshold would probably generate similar estimates as the RH-387
wetness relationship that we could generate with our leaf wetness data. 388
389
Discussion 390
NRM contributes to annual mass loss of standing litter across grassland types 391
Our empirical measurements demonstrated that NRM (fog, dew, high humidity) is an important, 392
year-round driver of standing litter decomposition in sites representing distinct grassland systems, and 393
that similar NRM events that induce microbial activity are frequent in semi-arid grasslands as well. We 394
estimated that in all sites, 85-99% of wet hours were attributable to NRM, and as informed by on-the-395

17
ground respiration measurements, NRM was a large contributor to annual decomposition of standing litter 396
at all sites – greater than that of rainfall. Our goal was not to produce a predictive decomposition model – 397
this will require larger empirical datasets, and incorporation of other factors like temperature. Still, our 398
first effort to scale contributions of NRM does show that including NRM produced values much closer to 399
measured mass loss. Our extrapolation was imperfect because it is based only on losses from CO2-C flux, 400
but it demonstrates what many other studies have suggested (Dirks and others 2010; Jacobson and others 401
2015; McHugh and others 2015; Gliksman and others 2017): that NRM is not just a fleeting stimulator of 402
occasional heterotrophic CO2 flux, but rather an important driver of surface litter decomposition on an 403
annual scale, in many grassland types. 404
In dryland sites, many decomposition models that use rainfall as the sole moisture source 405
underestimate empirical observations of litter mass loss (Parton and others 2007; Adair and others 2008; 406
Brandt and others 2010; Currie and others 2010), even though it is an important predictor of mass loss in 407
more mesic systems. Our study suggests that exclusion of NRM from models could contribute to this 408
underestimation. This is first highlighted by our empirical measurements: one year of mass loss in a site 409
with almost no rain but high NRM (Namib West) had slightly higher mass loss than another site with 410
higher rainfall but lower NRM (Namib East). Furthermore, mass loss estimates were substantially closer 411
to observed values when NRM was included in our model extrapolation. Other mechanisms, in particular 412
photodegradation, are also likely to be important in dryland decomposition, and have improved model 413
predictions of dryland decomposition (Brandt and others 2010; Adair and others 2017). Photodegradation 414
may be an especially important stimulator of decomposition when it interacts with – and facilitates – 415
microbial decomposition (Foereid and others 2010; Gliksman and others 2017; Day and others 2018); in 416
fact, the contribution of high-UV periods to decomposition may be negligible without intermittent, 417
microbially-active wet periods (Lin and others 2018), at least as long as the system is generally moisture-418
limited (Smith and others 2010). Our study shows that NRM could provide these wet periods that induce 419
microbial activity, as suggested by Jacobson and others (2015) and Gliksman and others (2016). We 420

18
found that NRM delivers these essential wet periods on a diel scale, and contributes more wet hours for 421
microbial activity than rainfall, which may not be the best indicator of water availability. 422
NRM was also the primary contributor to wet periods in our mesic grassland site (93% of total 423
wet hours), highlighting the ubiquity of NRM-induced wetness across grassland systems. A recent 424
analysis of dew frequency across the U.S. also demonstrated that dew frequency is high (occurring in up 425
to 95% of nights) and variable in grasslands, and dependent on nighttime humidity (Ritter and others 426
2019). We found that excluding periods of NRM in our rain-only model resulted in mass loss estimates 427
much lower than observed values, which is seemingly at odds with the relatively good performance of 428
traditional (rain-driven) decomposition models in mesic grasslands (Parton and others 2007; Adair and 429
others 2008). We suspect that this is because relative humidity (RH) is included in many traditional 430
models, thus implicitly allowing NRM to influence water availability in soils and litter (e.g. Parton and 431
others (2001)); whereas our rain-only extrapolation did not. An implicit approach might be sufficient to 432
predict RH-induced wetness that is due to retention of moisture (through reduced evapotranspiration) in 433
the soil-grass canopy system. However, this approach would not capture NRM decomposition resulting 434
from shorter-term (e.g. diel) RH fluctuations, which are frequent in xeric systems. 435
436
Controls on NRM decomposition of surface litter 437
Our empirical measurements of NRM-induced respiration in the field show that moisture 438
thresholds under NRM are similar to those observed in previous studies and in the laboratory. Respiration 439
‘turned on’ under NRM around 13-20% gravimetric moisture, depending on litter type, which narrows 440
our previous estimates (10.5-30%), and is remarkably close to minimum thresholds for initiation of litter 441
respiration reported in previous laboratory studies (10-20%) (Bartholomew and Norman 1947; Nagy and 442
Macauley 1982) and under high humidity in the field (10%) (Gliksman and others 2017). Thresholds for 443
initiating vs. ceasing respiration may differ due to physical properties of the litter (e.g. coarse tillers vs 444
fine litter), physiological controls on microbial community resuscitation and desiccation, or how litter 445
wets and dries relative to the distribution of microbial biomass, which changes as litter ages (unpublished 446

19
data, Logan et al. in prep). We did not have sufficient replication to fully describe the progression of 447
moisture and microbial dynamics over a single NRM event, but we observed periods when microbial 448
activity was decoupled from litter moisture, suggesting measurements over single events are needed. 449
Our findings reiterate that NRM frequently induces moisture levels sufficient for microbial 450
activity, and standing litter will respire when sufficiently moist, no matter if from rain or NRM. CO2 flux 451
rates measured from litter were primarily driven by gravimetric moisture, but response was also 452
modulated by other factors, like litter type. Finer portions of litter reached higher wetness and exhibited 453
higher CO2 flux, compared to coarse tillers under the same conditions, corroborating previous laboratory 454
measurements (Jacobson and others 2015). Differences in moisture absorbance are likely due to 455
differences in surface area to volume ratio or to physical properties; for example, the waxy cuticle on 456
coarse stems resists moisture uptake, while fine litter absorbs it readily. High proportions of fine litter 457
could thus cause NRM to have a greater impact on decomposition. In the Namib, fine litter constituted 458
roughly 50% of S. sabulicola standing litter (unpublished data), but this proportion could be higher in 459
systems dominated by annual grasses. Substrate has been known to be have a strong influence on dew 460
formation (Beysens 1995), and early studies recognized that litter type influenced the RH at which litter 461
becomes wet (Bartholomew and Norman 1947). However, physical properties are an under-recognized 462
modulator of decomposition compared to chemical properties like C:N, and may be especially important 463
for decay of standing litter under NRM. In general, an important goal for future work will be to link 464
standard meteorological descriptors of NRM to litter moisture content. The wide range of moisture 465
contents that litter achieved under NRM drove high variation in CO2 flux. Since we were unable to link 466
NRM meteorological variables directly to moisture content, we were left with greater uncertainty in our 467
modeled mass loss estimates (Fig. 7, Fig. S4). 468
Going forward, NRM event duration (e.g. number of hours wet) will be an essential variable for 469
estimating the contribution of NRM to decomposition at any site. Unlike rainfall-induced activity, NRM-470
induced wetness is not easily captured by water amount or yield. Dawson and Goldsmith (2018) recently 471
estimated the contributions of rain to leaf wetness, and Ritter and others (2019) estimated dew from a 472
20
network of radiometers, but in general quantifications of wet periods stimulated by all forms of NRM – 473
fog, dew, and high relative humidity – are lacking. We found that leaf wetness sensors accurately 474
recorded most NRM events, but could underestimate NRM decomposition because litter can be wet and 475
respiring for longer than sensors read ‘wet’. Placement of any sensor at the height of the litter of interest 476
will be essential, as reiterated by the recent analysis of dew (Ritter and others 2019). Ideally, any effort to 477
quantify decomposition-relevant NRM at a site would start with simultaneous measurements of hourly 478
RH, leaf wetness (each at the height of the litter of interest (Sentelhas and others 2008)), and litter 479
gravimetric moisture, potentially taking advantage of novel methods (Wang and others 2015). These data 480
could serve to calibrate estimates of NRM to identify events likely to induce decomposition, and also to 481
estimate wet hours from leaf wetness or RH in past (or to-be-collected) standard meteorological data. 482
With no previous knowledge of these relationships at a site, our data suggest that assuming wet hours 483
occur above a threshold of 85% RH, which is also a measured threshold for fungal activity (Dix and 484
Webster 1995), can be a good starting point for estimating NRM. 485
We found that NRM events also correspond to particular meteorological conditions that may need 486
to be accounted for as we determine the cumulative contribution of these periods to annual mass loss. For 487
instance, NRM occurs at lower temperatures than rain events in dry sites (Table 2), in line with the 488
relatively lower water holding capacity of cooler air. Previous investigations of microbes in drylands 489
focus on traits allowing survival at extremely high temperatures (Sterflinger and others 2012), but many 490
of these organisms have broad thermal optima (e.g. (Sterflinger and others 2012; Jacobson and others 491
2015)), and may actually be more active during cool moist NRM periods (Jacobson and others 2015). 492
From a modeling perspective, even though NRM decomposition might respond to temperature and 493
moisture in a similar way to rainfall-mediated decomposition, because NRM consistently occurs at cooler 494
temperatures, it might induce lower hourly microbial respiration. Future studies of microbial traits that 495
influence rain- and NRM-decomposition should examine activity at temperatures relevant to these events, 496
rather than the thermal extremes during which microbes are desiccated and inactive. 497
498

21
Broader role of NRM in ecosystems 499
The ecological effects of NRM decomposition could extend far beyond decomposition of surface 500
litter during NRM periods, as we documented here. In drylands, nighttime NRM may be a key component 501
that alternates with daytime photodegradation to induce greater decomposition than these processes 502
contribute individually (Almagro and others 2015; Gliksman and others 2017; Lin and others 2018). 503
NRM and UV-PAR can also contribute to surface priming in standing litter (Wang and others 2017a), and 504
the resulting leaching of DOC can contribute to soil carbon dynamics (Campbell and others 2016). 505
Finally, we previously showed that NRM decomposition increased surface nitrogen content in grass litter 506
2-fold, and that termites preferentially consumed this litter (Jacobson and others 2015). Termites and 507
other detritivores are essential prey for higher trophic levels in most arid ecosystems (Crawford and Seely 508
1995). The importance of NRM-mediated decomposition may cascade through trophic levels independent 509
of the effects of rainfall on subsurface decomposition. 510
Even more broadly, additional studies are needed to understand the differential effect of NRM on 511
carbon sources and sinks, particularly in grasslands, where surface litter may comprise more than two-512
thirds of annual net primary production (Polis 1991). In addition to litter decomposer communities, NRM 513
can also stimulate surface soil crusts, lichen fields, and hypoliths (Wang and others 2017b), plant growth 514
(Dawson and Goldsmith 2018), and soil microbial activity (Carbone and others 2011). In the Namib, 515
NRM stimulates the growth of perennial bunch grasses as it drips from aboveground structures to shallow 516
roots (Ebner and others 2011), and nutrients leached via these moisture droplets could be recycled to 517
growing plant material and contribute to nutrient islands (e.g. (Abrams and others 1997)). NRM may also 518
influence these processes as it alters the timing of moisture availability, an important regulator of 519
biogeochemical dynamics in grasslands (Jacobson and Jacobson 1998; Austin and others 2004; Borken 520
and Matzner 2009), but one in which NRM is not currently considered. 521
Accurately predicting carbon dynamics worldwide relies on an improved understanding of the 522
drivers of decomposition processes. We demonstrated that NRM is an important component of 523
decomposition of surface litter in hyper-arid and mesic grasslands, and our first effort to model NRM 524

22
highlights the complexities involved in using this component to improve mass loss predictions. In future 525
decades, the frequency and duration of fog, dew, and RH are predicted to shift (Haensler and others 2011; 526
Engelbrecht and others 2015; Tomaszkiewicz and others 2016), and may already be changing. Takle 527
(2011) reports that Iowa has experienced an increase in summer dew-point temperature over the last 528
several decades, yielding an increase in atmospheric water vapor over the period. Additional monitoring 529
is needed to assess shifts in NRM. Notably, changes in fog and dew patterns may be distinct from one 530
another (e.g. in the Namib (Kaseke and others 2017; Wang and others 2017b)), and from shifts in rainfall. 531
Our study shows – with empirical evidence and extrapolation – that shifts in both rain and NRM will need 532
to be accounted for to accurately predict future decomposition rates. 533
534 535
Acknowledgements 536
We thank Robert Logan for insightful discussions and field assistance, and Robert and Esbeiry Cordova-537
Ortiz for helpful comments on the manuscript. We also thank Gobabeb Research and Training Centre and 538
Roland Vogt for meteorological insight and data acquisition. We thank two anonymous reviewers in a 539
previous submission of this manuscript to Ecosystems. Samples were collected under Namibia Ministry 540
of Environment and Tourism research/collecting permit number 2228/2016. PJ and KJ received funding 541
from Grinnell College, and SE from Michigan State University, and National Geographic Society 542
(WW440-16 to SE). KTB is grateful for the support of the Linus Pauling Distinguished Postdoctoral 543
Fellowship program, part of the Laboratory Directed Research and Development Program at Pacific 544
Northwest National Laboratory, a multiprogram national laboratory operated by Battelle for the U.S. 545
Department of Energy. This is Kellogg Biological Station contribution number 2128. 546
547
References 548
Abrams MM, Jacobson PJ, Jacobson KM, Seely MK. 1997. Survey of soil chemical properties across a 549
landscape in the Namib Desert. Journal of Arid Environments 35: 29–38. 550

23
Adair EC, Parton WJ, Del Grosso SJ, Silver WL, Harmon ME, Hall SA, Burke IC, Hart SC. 2008. Simple 551
three-pool model accurately describes patterns of long-term litter decomposition in diverse climates. 552
Global Change Biology 14: 2636–60. 553
Adair EC, Parton WJ, King JY, Brandt LA, Lin Y. 2017. Accounting for photodegradation dramatically 554
improves prediction of carbon losses in dryland systems. Ecosphere 8: e01892. 555
Almagro M, Maestre FT, Martínez-López J, Valencia E, Rey A. 2015. Climate change may reduce litter 556
decomposition while enhancing the contribution of photodegradation in dry perennial Mediterranean 557
grasslands. Soil Biology and Biochemistry 90: 214–23. 558
Austin AT, Vivanco L. 2006. Plant litter decomposition in a semi-arid ecosystem controlled by 559
photodegradation. Nature 442: 555–8. 560
Austin AT, Yahdjian L, Stark JM, Belnap J, Porporato A, Norton U, Ravetta D, Schaeffer SM. 2004. 561
Water pulses and biogeochemical cycles in arid and semiarid ecosystems. Oecologia 141: 221–35. 562
Baker NR, Allison SD, Frey SD. 2015. Ultraviolet photodegradation facilitates microbial litter 563
decomposition in a Mediterranean climate. Ecology 96: 1994–2003. 564
Barnes PW, Throop HL, Hewins DB, Abbene ML, Archer SR. 2011. Soil coverage reduces 565
photodegradation and promotes the development of soil-microbial films on dryland leaf litter. 566
Ecosystems 15: 311–21. 567
Bartholomew W V, Norman AG. 1947. The threshold moisture content for active decomposition of some 568
mature plant materials. Soil Science Society Proceedings 11: 270–9. 569
Beysens D. 1995. The formation of dew. Atmospheric Research 39: 215–37. 570
Borken W, Matzner E. 2009. Reappraisal of drying and wetting effects on C and N mineralization and 571
fluxes in soils. Global Change Biology 15: 808–24. 572
Brandt L, King JY, Hobbie SE, Milchunas DG, Sinsabaugh RL. 2010. The Role of Photodegradation in 573
Surface Litter Decomposition Across a Grassland Ecosystem Precipitation Gradient. Ecosystems 13: 574
765–81. 575
Campbell EE, Parton WJ, Soong JL, Paustian K, Hobbs NT, Cotrufo MF. 2016. Using litter chemistry 576

24
controls on microbial processes to partition litter carbon fluxes with the Litter Decomposition and 577
Leaching (LIDEL) model. Soil Biology and Biochemistry 100: 160–74. 578
Carbone MS, Still CJ, Ambrose AR, Dawson TE, Williams AP, Boot CM, Schaeffer SM, Schimel JP. 579
2011. Seasonal and episodic moisture controls on plant and microbial contributions to soil 580
respiration. Oecologia 167: 265–78. 581
Crawford CS, Seely MK. 1995. Detritus mass loss in the Namib Desert dunefield : influence of termites, 582
gerbils and exposure to surface conditions. Journal of African Zoology 108: 49–54. 583
Currie WS, Harmon ME, Burke IC, Hart SC, Parton WJ, Silver W. 2010. Cross-biome transplants of 584
plant litter show decomposition models extend to a broader climatic range but lose predictability at 585
the decadal time scale. Global Change Biology 16: 1744–61. 586
Dawson TE, Goldsmith GR. 2018. The value of wet leaves. New Phytologist 219: 1156–69. 587
Day TA, Bliss MS, Placek SK, Tomes AR, Guénon R. 2019. Thermal abiotic emission of CO2 and CH4 588
from leaf litter and its significance in a photodegradation assessment. Ecosphere 10: e02745. 589
Day TA, Bliss MS, Tomes AR, Ruhland CT, Guénon R. 2018. Desert leaf litter decay: coupling of 590
microbial respiration, water-soluble fractions and photodegradation. Global Change Biology 24: 591
5454–70. 592
Dirks I, Navon Y, Kanas D, Dumbur R, Grünzweig JM. 2010. Atmospheric water vapor as driver of litter 593
decomposition in Mediterranean shrubland and grassland during rainless seasons. Global Change 594
Biology 16: 2799–812. 595
Dix N, Webster J. 1995. Fungal Ecology. Chapman & Hall, London. 596
Ebner M, Miranda T, Roth-Nebelsick A. 2011. Efficient fog harvesting by Stipagrostis sabulicola (Namib 597
dune bushman grass). Journal of Arid Environments 75: 524–31. 598
Eckardt FD, Soderberg K, Coop LJ, Muller A, Vickery KJ, Grandin RD, Jack C, Kapalanga TS, 599
Henschel J. 2013. The nature of moisture at Gobabeb, in the central Namib Desert. Journal of Arid 600
Environments 93: 7–19. 601
Engelbrecht F, Adegoke J, Bopape M, Naidoo M, Garland R, Thatcher M, McGregor J, Katzfey J, 602

25
Werner M, Ichoku C, Batebe C. 2015. Projections of rapidly rising temperatures over Africa under 603
low mitigation. Environmental Research Letters 10: 085004. 604
Evans SE, Dueker ME, Logan JR, Weathers KC. 2019. The biology of fog: results from coastal Maine 605
and Namib Desert reveal common drivers of fog microbial composition. Science of the Total 606
Environment 647: 1547–56. 607
Foereid B, Bellarby J, Meier-Augenstein W, Kemp H. 2010. Does light exposure make plant litter more 608
degradable? Plant and Soil 333: 275–85. 609
Gallo ME, Sinsabaugh RL, Cabaniss SE. 2006. The role of ultraviolet radiation in litter decomposition in 610
arid ecosystems. Applied Soil Ecology 34: 82–91. 611
Gliksman D, Navon Y, Dumbur R, Grunzweig JM. 2018. Higher rates of decomposition in standing vs . 612
surface litter in a Mediterranean ecosystem during the dry and the wet seasons. Plant and Soil 428: 613
427–39. 614
Gliksman D, Rey A, Seligmann R, Dumbur R, Sperling O, Navon Y, Haenel S, De Angelis P, Arnone JA, 615
Gruenzweig JM. 2017. Biotic degradation at night, abiotic degradation at day: Positive feedbacks on 616
litter decomposition in drylands. Global Change Biology 23: 1–11. 617
Gotsch SG, Asbjornsen H, Holwerda F, Goldsmith GR, Weintraub AE, Dawson TE. 2014. Foggy days 618
and dry nights determine crown-level water balance in a seasonal tropical montane cloud forest. 619
Plant, Cell and Environment 37: 261–72. 620
Haensler A, Cermak J, Hagemann S, Jacob D. 2011. Will the southern african west coast fog be affected 621
by future climate change?: Results of an initial fog projection using a regional climate model. 622
Erdkunde 65: 261–75. 623
Henschel JR, Seely MK. 2008. Ecophysiology of atmospheric moisture in the Namib Desert. 624
Atmospheric Research 87: 362–8. 625
Hochstrasser T, Kroel-Dulay G, Peters DPC, Gosz JR. 2002. Vegetation and Climate Characteristics of 626
and and Semi-Arid Grasslands in North America and Their Biome Transition Zone. Journal of Arid 627
Environments 51: 55–78. 628
26
Jacobson K, Van Diepeningen A, Evans S, Fritts R, Gemmel P, Marsho C, Seely M, Wenndt A, Yang X, 629
Jacobson P. 2015. Non-rainfall moisture activates fungal decomposition of surface litter in the 630
Namib Sand Sea. PLoS ONE 10: e0126977. 631
Jacobson KM, Jacobson PJ. 1998. Rainfall regulates decomposition of buried cellulose in the Namib 632
Desert. Journal of Arid Environments 38: 571–83. 633
Juvik JO, Nullet D. 1995. Comments on “A Proposed Standard Fog Collector for Use in High-Elevation 634
Regions”. Journal of Applied Meteorology 34: 2108–10. 635
Kaseke KF, Wang L, Seely MK. 2017. Nonrainfall water origins and formation mechanisms. Scientific 636
Advances 3: 1–9. 637
King JY, Brandt LA, Adair EC. 2012. Shedding light on plant litter decomposition: advances, 638
implications and new directions in understanding the role of photodegradation. Biogeochemistry 639
111: 57–81. 640
Kuehn KA, Steiner D, Gessner MO. 2004. Diel mineralization patterns of standing-dead plant litter: 641
Implications for CO2 flux from wetlands. Ecology 85: 2504–18. 642
Lancaster J, Lancaster N, Seely MK. 1984. Climate of the central Namib Desert. Madoqua 14:5–61. 643
Lee H, Rahn T, Throop H. 2012. An accounting of C-based trace gas release during abiotic plant litter 644
degradation. Global Change Biology 18: 1185–95. 645
Lin Y, Karlen SD, Ralph J, King JY. 2018. Short-term facilitation of microbial litter decomposition by 646
ultraviolet radiation. Science of the Total Environment 615: 838–48. 647
McHugh T, Morrissey EM, Reed SC, Hungate B, Schwartz E. 2015. Water from air: an overlooked 648
source of moisture in arid and semiarid regions. Scientific Reports 5: 13767. 649
Nagy LA, Macauley BJ. 1982. Eucalyptus leaf-litter decomposition: Effects of relative humidity and 650
substrate moisture content. Soil Biology and Biochemistry 14: 233–6. 651
Newell SY, Fallon RD, Cal Rodriguez RM, Groene LC. 1985. Influence of rain, tidal wetting and relative 652
humidity on release of carbon dioxide by standing-dead salt-marsh plants. Oecologia 68: 73–9. 653
Parton W, Morgan JA, Kelly RH, Ojima DS. 2001. Modeling soil C responses to environmental change in 654

27
grassland systems. In: Follett R, Kimble J, Lal R, editors. The potential of US grazing lands to 655
sequester carbon and mitigate the greenhouse effect. CRC Press. pp 371–98. 656
Parton W, Silver WL, Burke IC, Grassens L, Harmon ME, Currie WS, King JY, Adair EC, Brandt LA, 657
Hart SC, Fasth B. 2007. Global-scale similarities in nitrogen release patterns during long-term 658
decomposition. Science 315: 361–4. 659
Peters DP, Yao J. 2012. Long-term experimental loss of foundation species: consequences for dynamics 660
at ecotones across heterogeneous landscapes. Ecosphere 3: art27-23. 661
Polis G. 1991. Foodwebs in desert communities: complexity via diversity and omnivory. In: The Ecology 662
of Desert Communities. Tuscon: University of Arizona Press. pp 383–438. 663
R Core Team. 2017. R: A Language and Environment for Statistical Computing. R Foundation for 664
Statistical Computing, Vienna, Austria. 665
Ritter F, Berkelhammer M, Beysens D. 2019. Dew frequency across the US from a network of in situ 666
radiometers. Hydrology and Earth System Sciences 23: 1179-1197. 667
Rowlandson T, Gleason M, Sentelhas P, Gillespie T, Thomas C, Hornbuckle B. 2015. Reconsidering Leaf 668
Wetness Duration Determination for Plant Disease Management. Plant Disease 99: 310–9. 669
Schlesinger WH. 1977. Carbon balance in terrestrial detritus. Annual Review of Ecology and Systematics 670
8: 51–81. 671
Schlesinger WH, Andrews JA. 2000. Soil respiration and the global carbon cycle. Biogeochemistry 48: 672
7–20. 673
Sentelhas PC, Dalla Marta A, Orlandini S, Santos EA, Gillespie TJ, Gleason ML. 2008. Suitability of 674
relative humidity as an estimator of leaf wetness duration. Agricultural and Forest Meteorology 148: 675
392–400. 676
Smith WK, Gao W, Steltzer H, Wallenstein MD, Tree R. 2010. Moisture availability influences the effect 677
of ultraviolet-B radiation on leaf litter decomposition. Global Change Biology 16: 484–95. 678
Sterflinger K, Tesei D, Zakharova K. 2012. Fungi in hot and cold deserts with particular reference to 679
microcolonial fungi. Fungal Ecology 5: 453–62. 680

28
Takle ES. 2011. Climate Changes in Iowa. In: Cruse R, Jackson LL, Mutel CF, Rogovska NP, Swenson 681
D, Takle ES, Baer N, Brees A, Grayson R, Sharp K, editors. ClImate Change Impacts on Iowa 2010 682
Policy Recommendations: Report to the Governor and the Iowa General Assembly. pp 1–33. 683
Throop HL, Archer SR. 2009. Resolving the dryland decomposition conundrum: some new perspectives 684
on potential drivers. In: Progress in Botany. pp 171–94. 685
Tomaszkiewicz M, Abou Najm M, Beysens D, Alameddine I, Bou Zeid E, El-Fadel M. 2016. Projected 686
climate change impacts upon dew yield in the Mediterranean basin. Science of the Total 687
Environment 566–567: 1339–48. 688
Uclés O, Villagarcía L, Cantón Y, Domingo F. 2016. Partitioning of non rainfall water input regulated by 689
soil cover type. Catena 139: 265–70. 690
Vanderbilt KL, White CS, Hopkins O, Craig JA. 2008. Aboveground decomposition in arid 691
environments: Results of a long-term study in central New Mexico. Journal of Arid Environments 692
72: 696–709. 693
Wang J, Liu L, Wang X, Yang S, Zhang B, Li P, Qiao C, Deng M, Liu W. 2017a. High night-time 694
humidity and dissolved organic carbon content support rapid decomposition of standing litter in a 695
semi-arid landscape. Functional Ecology 31: 1659–68. 696
Wang L, Kaseke KF, Seely MK. 2017b. Effects of non-rainfall water inputs on ecosystem functions. 4. 697
Wang L, Throop HL, Gill T. 2015. A novel method to continuously monitor litter moisture - a 698
microcosm-based experiment. Journal of Arid Environments 115: 10–3. 699
Whitford W, Meentemeyer V, Seastedt T. 1981. Exceptions to the AET model: deserts and clear-cut 700
forest. Ecology 62: 275–7. 701

29
Table 1. Site and meteorological details for the four sites studied. 702 Namib East Namib West Iowa Sevilleta
Site coordinates S 23.7835 E 15.7796
S 23.5604 E 15.0410
N 41.7568 W 92.7151
N 34.3592 W 106.691
Mean annual temp (°C)+ 23.1 21.0 8.84 13.5
Mean annual rainfall (mm)+ 81 19 897 232
Mean relative humidity (%)+ 32 49 69± 40
Met measurement dates 6/24/15 - 6/4/16 6/15/15 - 6/16/16 3/9/16 - 1/6/17 1/1/11 - 1/1/16
Met measurement length (d) 346 367 303 1825 +Citation for mean climate variables: Namib West (Lancaster and others 1984; Eckardt and others 2013) Namib East 703 (Henschel and Seely 2008; Eckardt and others 2013; Jacobson and others 2015), Sevilleta (Hochstrasser and others 704 2002), Iowa (ncdc.noaa.gov, climate station GHCND:USC00133473; 705 https://www.currentresults.com/Weather/Iowa/humidity-annual.php for relative humidity) 706 refers to meteorological measurements made in this study, reported in Table 2 707 708
709

30
710 Table 2. Summary of non-rainfall moisture (NRM) and rain across sites. Wet hour indicates an hour 711 when a leaf wetness sensor is wet (see Methods for approach at Sevilleta), either due to NRM (left) or 712 rain (right). 713
Namib East Namib West Iowa Sevilleta
NRM Rain NRM Rain NRM Rain NRM§ Rain
Rainfall (mm) 67.2 12.2 867.1 198.8
Total time wet (hours) 391 47 1508 13 4918 346 1039 183
% of total hours 4.0% 0.5% 17.4% 0.1% 72.3% 4.8% 11.9% 2.1%
% of wet hours 89.2% 10.7% 99.1% 0.9% 93.4% 6.6% 85.0% 15.0%
Mean RH (%) +/- SD+ 81.1 ±11.6 68.0 ±19.9 87.7 ±9.0 72.8 ±8.8 93.5 ±7.0 97.9 ±5.9 83.6 ±9.2 77.0 ±17.2
Mean Temp (°C) +/- SD 12.5 ±6.6 21.5 ±5.3 12.9 ±4.0 18.2 ±2.5 12.8 ±10.1 13.0 ±7.6 3.9 ±9.5 12.6 ±8.5
All data reported over a year time period. We standardized by dataset length and reported on a per year 714 basis to facilitate comparisons across sites. 715 § Since we did not use leaf wetness sensors to quantify wet hours at Sevilleta, as we did at other sites, 716 NRM wet hours here was estimated from ‘likelihood wet’ function (see Methods). 717 +Standard deviation of the mean 718 719
720

31
721 Figure captions 722
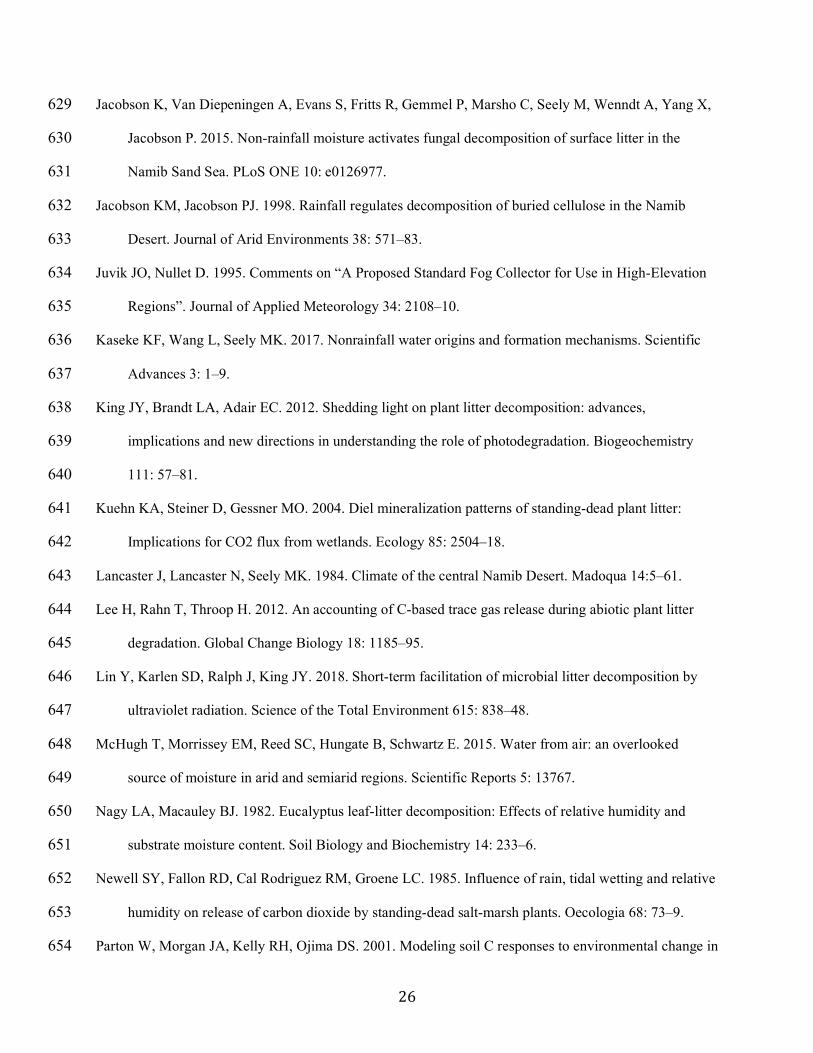
Figure 1. Site descriptions. This study was conducted in: A: the Namib Desert, Namibia, at the NRM-723 dominated ‘Namib West’ site and rain-dominated ‘Namib East’ site. We measured microbial CO2-C flux 724 from Stipagrastis sabulicola, the dominant plant (inset). B: Iowa tallgrass prairie in Grinnell, Iowa. We 725 measured litter flux from Andropogon gerardii, the dominant plant. Inset shows diverse mix characteristic 726 of tallgrass prairie. 727 728 Figure 2: Photographs of standing litter and methodologies. A: Measurement of litter gravimetric 729 moisture and flux in litter rack, and associated portable meteorological station at Namib West. B: Litter 730 rack mimicking standing coarse litter in situ, shown with droplets from NRM. C: Different litter types: 731 fine (leaves) and coarse (tillers, >2mm diameter), shown here on S. sabulicola. D: Fine litter hanging 732 below coarse litter racks during NRM exposure. E: Leaf wetness sensor containing condensed water 733 during an NRM event. 734 735 Figure 3. Estimates of the time litter is wet, as a fraction of each site’s measurement period (see Table 1), 736 as estimated by different approaches. ‘Likelihood of wet’ was used to extrapolate mass loss. Red dot: 737 raining time (wet hour was attributed to rain if rainfall was detected during that hour). Black dot: wet 738 hours as estimated by leaf wetness sensors. Blue line: likelihood of a wet sensor (‘likelihood wet’ 739 function) for a given relative humidity, based on relationships at Iowa and the Namib. Purple line: 740 estimates using RH threshold, with the lower bound using a threshold of 75% and upper bound, 90%, and 741 open purple circle showing 85%. 742 743 Figure 4. Response of standing S. sabulicola (coarse) litter to one dew event at Namib West on 3 June 744 2015 (see Table S3 for all events). A: mean CO2-C flux rates, measured from coarse litter, B: gravimetric 745 moisture (n=10, dashes represent 1 SE above and below the mean represented by symbols), and C: 746 meteorological parameters over the course of one night (W=wet and D=dry leaf wetness reading). CO2-C 747 flux was generally higher from fine litter (Table S3). Dew began around 19:00, when leaf wetness read 748 “slightly wet” and relative humidity was 83%. 749 750 Figure 5. (A) Under NRM, gravimetric moisture was positively related to CO2-C flux for the Namib 751 (combined East and West, y=0.88x+7.38, R2=0.71, p=0.038) and Iowa (y=0.209x+27.88, R2=0.06, 752 p<0.001). (B) Under NRM, gravimetric moisture content of fine litter increased significantly more than 753 that of coarse litter under the same leaf wetness, as measured by leaf wetness sensors (reject null of equal 754 slope, p=0.01). 755 756 Figure 6. Mass loss of standing litter in mesic (Iowa) and hyperarid (Namib) sites that had different rain 757 and NRM regimes. Box shows upper and lower quartiles and line within the box represents the median. 758 Litter was native (S. sabulicola in Namib sites, A. gerardii in Iowa) coarse grass ‘tillers’ deployed in 759 standing litter racks at the height of native standing litter. Different letters represent significant (p<0.01) 760 differences (pairwise t-tests) among mean mass loss in Iowa (N=5, 303 days deployment), Namib East 761 (N=5, 343 days), and Namib West (N=26, 344 days). 762 763 Figure 7. Model-extrapolated litter mass loss when NRM-decomposition is excluded (“Rain”) and 764 included (“Rain+NRM”). Wet hours were defined by wetness likelihood function for all sites, and 95% 765 confidence intervals include uncertainty generated from variation in respiration data and wetness duration 766 estimates (see Fig. S4 for uncertainty separated). Black solid lines show observed mean mass loss at each 767 site (not measured at Sevilleta), standardized to an annual scale to facilitate comparison. 768
32

33
Figure 2
34
Figure 3

35
Figure 4

36
Figure 5

37
Figure 6

38
Figure 7