1 1 slide a point estimator cannot be expected to provide the a point estimator cannot be expected...
TRANSCRIPT

1 1 Slide Slide
A point estimator cannot be expected to provide theA point estimator cannot be expected to provide the exact value of the population parameter.exact value of the population parameter. A point estimator cannot be expected to provide theA point estimator cannot be expected to provide the exact value of the population parameter.exact value of the population parameter.
An An interval estimateinterval estimate can be computed by adding and can be computed by adding and subtracting a subtracting a margin of errormargin of error to the point estimate. to the point estimate.
An An interval estimateinterval estimate can be computed by adding and can be computed by adding and subtracting a subtracting a margin of errormargin of error to the point estimate. to the point estimate.
Point Estimate +/Point Estimate +/ Margin of Error Margin of Error
The purpose of an interval estimate is to provideThe purpose of an interval estimate is to provide information about how close the point estimate is toinformation about how close the point estimate is to the value of the parameter.the value of the parameter.
The purpose of an interval estimate is to provideThe purpose of an interval estimate is to provide information about how close the point estimate is toinformation about how close the point estimate is to the value of the parameter.the value of the parameter.
Margin of Error and the Interval EstimateMargin of Error and the Interval Estimate
Chapter 8 - Interval Estimation

2 2 Slide Slide
Interval Estimate of a Population Mean: Known
In order to develop an interval estimate of a In order to develop an interval estimate of a population mean, the margin of error must be population mean, the margin of error must be computed using either:computed using either:
• the population standard deviation the population standard deviation , or , or
• the sample standard deviation the sample standard deviation ss
is rarely known exactly, but often a good is rarely known exactly, but often a good estimate can be obtained based on historical estimate can be obtained based on historical data or other information.data or other information.
We refer to such cases as the We refer to such cases as the known known case. case.
The general form of an interval estimate of a The general form of an interval estimate of a population mean ispopulation mean is
The general form of an interval estimate of a The general form of an interval estimate of a population mean ispopulation mean is
Margin of Errorx Margin of Errorx

3 3 Slide Slide
There is a 1 There is a 1 probability that the value of a probability that the value of asample mean will provide a margin of error of sample mean will provide a margin of error of or less.or less.
z x /2z x /2
/2/2 /2/21 - of all values1 - of all valuesxx
Sampling distribution of
Sampling distribution of xx
xx
z x /2z x /2z x /2z x /2
Interval Estimate of a Population Mean:
Known

4 4 Slide Slide
/2/2 /2/21 - of all values1 - of all valuesxx
Sampling distribution of
Sampling distribution of xx
xx
z x /2z x /2z x /2z x /2
[------------------------- -------------------------][------------------------- -------------------------]
[------------------------- -------------------------][------------------------- -------------------------]
xx
intervalintervaldoes notdoes notinclude include
intervalintervalDoes not Does not includes includes
Interval Estimate of a Population Mean:
Known
xxxx

5 5 Slide Slide
Interval Estimate ofInterval Estimate of
Interval Estimate of a Population Mean:
Known
x zn
/2x zn
/2
where: is the sample meanwhere: is the sample mean 1 -1 - is the confidence coefficient is the confidence coefficient zz/2 /2 is the is the zz value providing an area of value providing an area of /2 in the upper tail of the standard /2 in the upper tail of the standard
normal probability distributionnormal probability distribution is the population standard deviationis the population standard deviation nn is the sample size is the sample size
xx

6 6 Slide Slide
Interval Estimate of a Population Mean:
Known Values of Values of zz/2/2 for the Most Commonly for the Most Commonly
Used Confidence LevelsUsed Confidence Levels
90% .10 .05 .9500 90% .10 .05 .9500 1.645 1.645
Confidence TableConfidence Table Level Level /2 Look-up Area /2 Look-up Area zz/2/2
95% .05 .025 .9750 95% .05 .025 .9750 1.960 1.960 99% .01 .005 .9950 99% .01 .005 .9950 2.576 2.576
7 7 Slide Slide
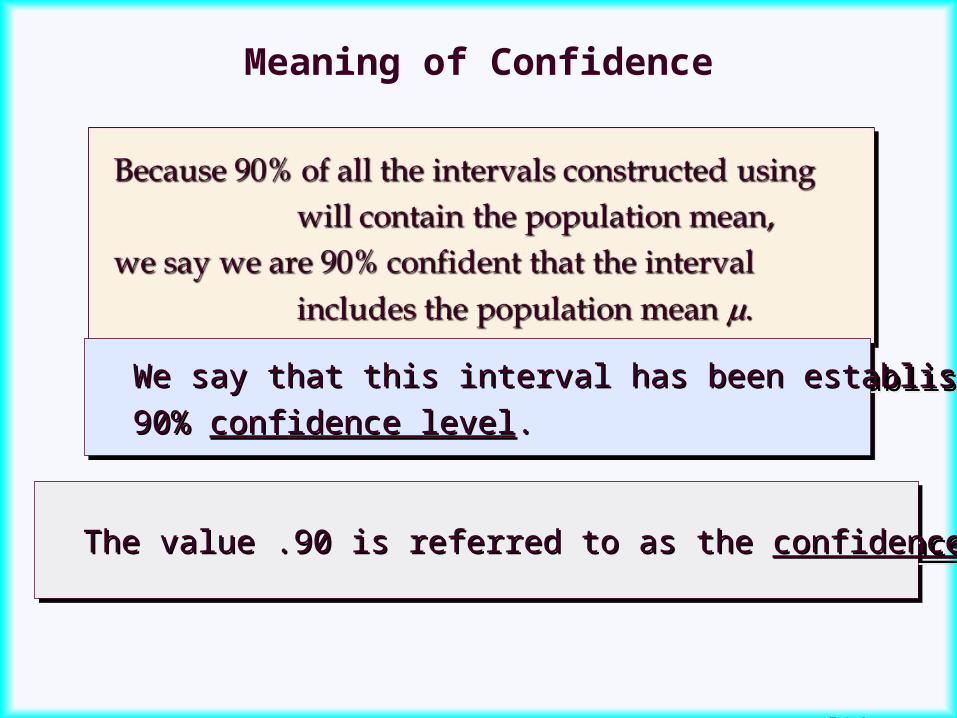
Meaning of Confidence
We say that this interval has been established at theWe say that this interval has been established at the
90% 90% confidence levelconfidence level..
We say that this interval has been established at theWe say that this interval has been established at the
90% 90% confidence levelconfidence level..
The value .90 is referred to as the The value .90 is referred to as the confidenceconfidence coefficientcoefficient.. The value .90 is referred to as the The value .90 is referred to as the confidenceconfidence coefficientcoefficient..

8 8 Slide Slide
Interval Estimate of a Population Mean:
Known Example: Discount SoundsExample: Discount Sounds
Discount Sounds has 260 retail outlets Discount Sounds has 260 retail outlets throughoutthroughout
the United States. The firm is evaluating a the United States. The firm is evaluating a potentialpotential
location for a new outlet, based in part, on the location for a new outlet, based in part, on the meanmean
annual income of the individuals in the annual income of the individuals in the marketingmarketing
area of the new location.area of the new location.
A sample of size A sample of size nn = 36 was taken; the = 36 was taken; the sample sample
mean income is $41,100. The population is mean income is $41,100. The population is notnot
believed to be highly skewed. The population believed to be highly skewed. The population standard deviation is estimated to be $4,500, standard deviation is estimated to be $4,500,
and theand theconfidence coefficient to be used in the confidence coefficient to be used in the
interval interval estimate is .95.estimate is .95.

9 9 Slide Slide
95% of the sample means that can be observed95% of the sample means that can be observed
are within are within ++ 1.96 of the population mean 1.96 of the population mean . . x xThe margin of error is: The margin of error is:
/ 2
4,5001.96 1,470
36z
n
/ 2
4,5001.96 1,470
36z
n Thus, at 95% confidence, the margin of errorThus, at 95% confidence, the margin of error is $1,470. is $1,470.
Interval Estimate of a Population Mean:
Known Example: Discount SoundsExample: Discount Sounds

10 10
Slide Slide
Interval estimate of Interval estimate of is: is:
Interval Estimate of a Population Mean:
Known
We are We are 95% confident95% confident that the interval contains the that the interval contains the
population mean.population mean.
$41,100 + $1,470or
$39,630 to $42,570
Example: Discount SoundsExample: Discount Sounds

11 11
Slide Slide
Interval Estimate of a Population Mean:
Known
90% 1234 $39,866 90% 1234 $39,866 to $42,334 to $42,334
Confidence MarginConfidence Margin Level of Error Interval EstimateLevel of Error Interval Estimate
95% 1470 $39,630 to 95% 1470 $39,630 to $42,570$42,570
99% 1932 $39,168 to 99% 1932 $39,168 to $43,032 $43,032
Example: Discount SoundsExample: Discount Sounds
In order to have a higher degree of confidence,In order to have a higher degree of confidence,
the margin of error and thus the width of thethe margin of error and thus the width of the
confidence interval must be larger.confidence interval must be larger.

12 12
Slide Slide
Interval Estimate of a Population Mean:
Known Adequate Sample SizeAdequate Sample Size
In most applications, a sample size of In most applications, a sample size of nn = 30 is = 30 is adequate.adequate. In most applications, a sample size of In most applications, a sample size of nn = 30 is = 30 is adequate.adequate.
If the population distribution is highly skewed orIf the population distribution is highly skewed or contains outliers, a sample size of 50 or more iscontains outliers, a sample size of 50 or more is recommended.recommended.
If the population distribution is highly skewed orIf the population distribution is highly skewed or contains outliers, a sample size of 50 or more iscontains outliers, a sample size of 50 or more is recommended.recommended.
If the population is not normally distributed but isIf the population is not normally distributed but is roughly symmetric, a sample size as small as 15 roughly symmetric, a sample size as small as 15 will suffice.will suffice.
If the population is not normally distributed but isIf the population is not normally distributed but is roughly symmetric, a sample size as small as 15 roughly symmetric, a sample size as small as 15 will suffice.will suffice.
If the population is believed to be at leastIf the population is believed to be at least approximately normal, a sample size of less than 15approximately normal, a sample size of less than 15 can be used.can be used.
If the population is believed to be at leastIf the population is believed to be at least approximately normal, a sample size of less than 15approximately normal, a sample size of less than 15 can be used.can be used.

13 13
Slide Slide
Interval Estimate of a Population Mean:
Unknown If an estimate of the population standard If an estimate of the population standard
deviation deviation cannot be developed prior to cannot be developed prior to sampling, we use the sample standard sampling, we use the sample standard deviation deviation ss to estimate to estimate . . This is the This is the unknown unknown case. case.
In this case, the interval estimate for In this case, the interval estimate for is based is based on the on the tt distribution. distribution.
(We’ll assume for now that the population is (We’ll assume for now that the population is normally distributed.)normally distributed.)

14 14
Slide Slide
The The t t distribution distribution is a family of similar probability distributions. is a family of similar probability distributions. The The t t distribution distribution is a family of similar probability distributions. is a family of similar probability distributions.
t Distribution
A specific A specific tt distribution depends on a parameter distribution depends on a parameter known as the known as the degrees of freedomdegrees of freedom.. A specific A specific tt distribution depends on a parameter distribution depends on a parameter known as the known as the degrees of freedomdegrees of freedom..
Degrees of freedom refer to the number of independent Degrees of freedom refer to the number of independent pieces of information that go into the computation of pieces of information that go into the computation of ss..Degrees of freedom refer to the number of independent Degrees of freedom refer to the number of independent pieces of information that go into the computation of pieces of information that go into the computation of ss..
A A tt distribution with more degrees of freedom has distribution with more degrees of freedom has less dispersion.less dispersion. A A tt distribution with more degrees of freedom has distribution with more degrees of freedom has less dispersion.less dispersion.
As the degrees of freedom increases, the difference between As the degrees of freedom increases, the difference between the the tt distribution and the standard normal probability distribution and the standard normal probabilitydistribution becomes smaller and smaller.distribution becomes smaller and smaller.
As the degrees of freedom increases, the difference between As the degrees of freedom increases, the difference between the the tt distribution and the standard normal probability distribution and the standard normal probabilitydistribution becomes smaller and smaller.distribution becomes smaller and smaller.

15 15
Slide Slide
t Distribution
StandardStandardnormalnormal
distributiondistribution
tt distributiondistribution(20 degrees(20 degreesof freedom)of freedom)
tt distributiondistribution(10 degrees(10 degrees
of of freedomfreedom))
00zz, , tt
For more than 100 degrees of freedom, the standard normal For more than 100 degrees of freedom, the standard normal zz value provides a good approximation to the value provides a good approximation to the tt value value

16 16
Slide Slide
Interval EstimateInterval Estimate
x tsn
/2x tsn
/2
where: 1 -where: 1 - = the confidence coefficient = the confidence coefficient
tt/2 /2 == the the tt value providing an area of value providing an area of /2/2 in the upper tail of a in the upper tail of a t t distribution distribution with with nn - 1 degrees of freedom - 1 degrees of freedom ss = the sample standard deviation = the sample standard deviation
Interval Estimate of a Population Mean:
Unknown

17 17
Slide Slide
A reporter for a student newspaper is writing anA reporter for a student newspaper is writing an
article on the cost of off-campus housing. A samplearticle on the cost of off-campus housing. A sample
of 16 efficiency apartments within a half-mile ofof 16 efficiency apartments within a half-mile of
campus resulted in a sample mean of $750 per campus resulted in a sample mean of $750 per monthmonth
and a sample standard deviation of $55.and a sample standard deviation of $55.
Interval Estimate of a Population Mean:
Unknown Example: Apartment RentsExample: Apartment Rents
Let us provide a 95% confidence interval Let us provide a 95% confidence interval estimateestimate
of the mean rent per month for the population of the mean rent per month for the population of of
efficiency apartments within a half-mile of efficiency apartments within a half-mile of campus.campus.
We will assume this population to be normallyWe will assume this population to be normally
distributed.distributed.

18 18
Slide Slide
At 95% confidence, At 95% confidence, = .05, and = .05, and /2 = .025./2 = .025.
In the In the tt distribution table we see that distribution table we see that tt.025.025 = 2.131. = 2.131.tt.025.025 is based on is based on nn 1 = 16 1 = 16 1 = 15 degrees of freedom. 1 = 15 degrees of freedom.
Interval Estimate of a Population Mean:
Unknown
Degrees Area in Upper Tail
of Freedom .20 .100 .050 .025 .010 .005
15 .866 1.341 1.753 2.131 2.602 2.947
16 .865 1.337 1.746 2.120 2.583 2.921
17 .863 1.333 1.740 2.110 2.567 2.898
18 .862 1.330 1.734 2.101 2.520 2.878
19 .861 1.328 1.729 2.093 2.539 2.861
. . . . . . .

19 19
Slide Slide
.025
sx t
n .025
sx t
n
We are 95% confident that the mean rent per monthWe are 95% confident that the mean rent per monthfor the population of efficiency apartments within afor the population of efficiency apartments within ahalf-mile of campus is between $720.70 and $779.30.half-mile of campus is between $720.70 and $779.30.
Interval EstimateInterval Estimate
Interval Estimate of a Population Mean:
Unknown
55750 2.131 750 29.30
16
55750 2.131 750 29.30
16
MarginMarginof Errorof Error

20 20
Slide Slide
Interval Estimate of a Population Mean:
Unknown Adequate Sample SizeAdequate Sample Size
If the population distribution is highly skewed orIf the population distribution is highly skewed or contains outliers, a sample size of 50 or more iscontains outliers, a sample size of 50 or more is recommended.recommended.
If the population distribution is highly skewed orIf the population distribution is highly skewed or contains outliers, a sample size of 50 or more iscontains outliers, a sample size of 50 or more is recommended.recommended.
x tsn
/2x tsn
/2

21 21
Slide Slide
Interval Estimate of a Population Mean:
Unknown Adequate Sample Size (continued)Adequate Sample Size (continued)
If the population is believed to be at leastIf the population is believed to be at least approximately normal, a sample size of less than 15approximately normal, a sample size of less than 15 can be used.can be used.
If the population is believed to be at leastIf the population is believed to be at least approximately normal, a sample size of less than 15approximately normal, a sample size of less than 15 can be used.can be used.
If the population is not normally distributed but isIf the population is not normally distributed but is roughly symmetric, a sample size as small as 15 roughly symmetric, a sample size as small as 15 will suffice.will suffice.
If the population is not normally distributed but isIf the population is not normally distributed but is roughly symmetric, a sample size as small as 15 roughly symmetric, a sample size as small as 15 will suffice.will suffice.

22 22
Slide Slide
Summary of Interval Estimation Procedures
for a Population Mean
Can theCan thepopulation standardpopulation standard
deviation deviation be assumed be assumed known ?known ?
UseUse
YesYes NoNo
/ 2
sx t
n / 2
sx t
nUseUse/ 2x z
n
/ 2x zn
KnownKnownCaseCase
UnknownUnknownCaseCase
Use the sampleUse the samplestandard deviationstandard deviation
ss to estimate to estimate

23 23
Slide Slide
Let Let EE = the desired margin of error. = the desired margin of error. Let Let EE = the desired margin of error. = the desired margin of error.
EE is the amount added to and subtracted from the is the amount added to and subtracted from the point estimate to obtain an interval estimate.point estimate to obtain an interval estimate. EE is the amount added to and subtracted from the is the amount added to and subtracted from the point estimate to obtain an interval estimate.point estimate to obtain an interval estimate.
Sample Size for an Interval Estimateof a Population Mean
If a desired margin of error is selected prior toIf a desired margin of error is selected prior to sampling, the sample size necessary to satisfy thesampling, the sample size necessary to satisfy the margin of error can be determined.margin of error can be determined.
If a desired margin of error is selected prior toIf a desired margin of error is selected prior to sampling, the sample size necessary to satisfy thesampling, the sample size necessary to satisfy the margin of error can be determined.margin of error can be determined.

24 24
Slide Slide
Sample Size for an Interval Estimateof a Population Mean
E zn
/2E zn
/2
nz
E
( )/ 22 2
2n
z
E
( )/ 22 2
2
Margin of Error Margin of Error
Necessary Sample Size Necessary Sample Size

25 25
Slide Slide
Sample Size for an Interval Estimateof a Population Mean
The Necessary Sample Size equation requires aThe Necessary Sample Size equation requires a value for the population standard deviation value for the population standard deviation . . The Necessary Sample Size equation requires aThe Necessary Sample Size equation requires a value for the population standard deviation value for the population standard deviation . .
If If is unknown, a preliminary or is unknown, a preliminary or planning valueplanning value for for can be used in the equation. can be used in the equation. If If is unknown, a preliminary or is unknown, a preliminary or planning valueplanning value for for can be used in the equation. can be used in the equation.
1. Use the estimate of the population standard1. Use the estimate of the population standard deviation computed in a previous study.deviation computed in a previous study. 1. Use the estimate of the population standard1. Use the estimate of the population standard deviation computed in a previous study.deviation computed in a previous study.
2. Use a pilot study to select a preliminary study and2. Use a pilot study to select a preliminary study and use the sample standard deviation from the study.use the sample standard deviation from the study. 2. Use a pilot study to select a preliminary study and2. Use a pilot study to select a preliminary study and use the sample standard deviation from the study.use the sample standard deviation from the study.
3. Use judgment or a “best guess” for the value of 3. Use judgment or a “best guess” for the value of . . 3. Use judgment or a “best guess” for the value of 3. Use judgment or a “best guess” for the value of . .

26 26
Slide Slide
Recall that Discount Sounds is evaluating aRecall that Discount Sounds is evaluating apotential location for a new retail outlet, based inpotential location for a new retail outlet, based inpart, on the mean annual income of the individuals inpart, on the mean annual income of the individuals inthe marketing area of the new location.the marketing area of the new location.
Sample Size for an Interval Estimateof a Population Mean
Example: Discount SoundsExample: Discount Sounds
Suppose that Discount Sounds’ Suppose that Discount Sounds’ management teammanagement team
wants an estimate of the population mean such wants an estimate of the population mean such thatthat
there is a .95 probability that the sampling there is a .95 probability that the sampling error iserror is
$500 or less.$500 or less.
How large a sample size is needed to meet How large a sample size is needed to meet thethe
required precision?required precision?

27 27
Slide Slide
At 95% confidence, At 95% confidence, zz.025.025 = 1.96. Recall that = 1.96. Recall that = 4,500.= 4,500.
zn
/2 500zn
/2 500
2 2
2
(1.96) (4,500)311.17 312
(500)n
2 2
2
(1.96) (4,500)311.17 312
(500)n
Sample Size for an Interval Estimateof a Population Mean
A sample of size 312 is needed to reach a desiredA sample of size 312 is needed to reach a desired
precision of precision of ++ $500 at 95% confidence. $500 at 95% confidence.

28 28
Slide Slide
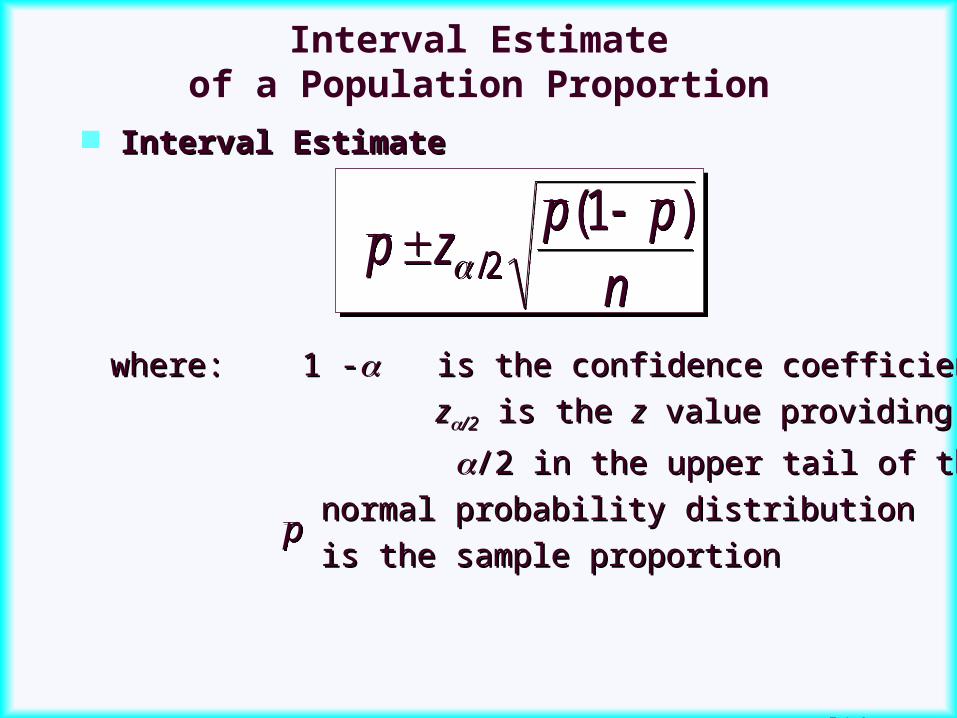
Interval Estimateof a Population Proportion
The general form of an interval estimate of aThe general form of an interval estimate of a population proportion ispopulation proportion is
The general form of an interval estimate of aThe general form of an interval estimate of a population proportion ispopulation proportion is
Margin of Errorp Margin of Errorp
pp
pp

29 29
Slide Slide
/2/2 /2/2
Interval Estimateof a Population Proportion
Normal Approximation of Sampling Distribution Normal Approximation of Sampling Distribution of of
pp
Samplingdistribution of
Samplingdistribution of pp
(1 )p
p p
n
(1 )p
p p
n
pppp
/ 2 pz / 2 pz / 2 pz / 2 pz
1 - of all values1 - of all valuespp
30 30
Slide Slide
Interval EstimateInterval Estimate
Interval Estimateof a Population Proportion
p zp pn
/
( )2
1p z
p pn
/
( )2
1
where: 1 -where: 1 - is the confidence coefficient is the confidence coefficient
zz/2 /2 is the is the zz value providing an area of value providing an area of
/2 in the upper tail of the standard/2 in the upper tail of the standard
normal probability distributionnormal probability distribution
is the sample proportionis the sample proportionpp
31 31
Slide Slide
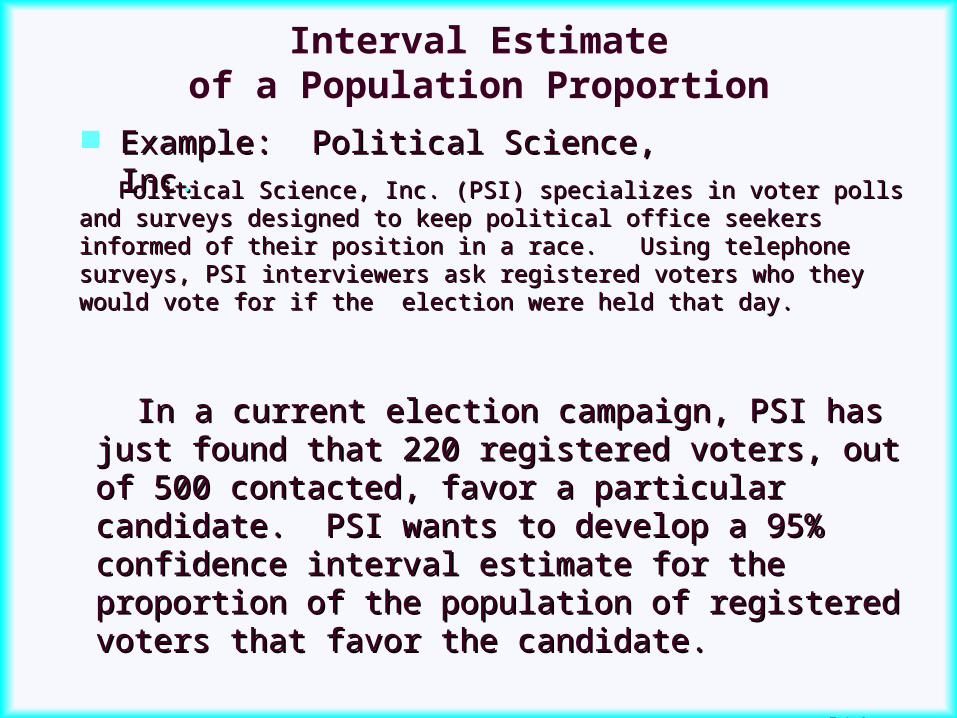
Political Science, Inc. (PSI) specializes in voter polls and Political Science, Inc. (PSI) specializes in voter polls and surveys designed to keep political office seekers informed of surveys designed to keep political office seekers informed of their position in a race. Using telephone surveys, PSI their position in a race. Using telephone surveys, PSI interviewers ask registered voters who they would vote for if interviewers ask registered voters who they would vote for if the election were held that day. the election were held that day.
Interval Estimateof a Population Proportion
Example: Political Science, IncExample: Political Science, Inc..
In a current election campaign, PSI has just found In a current election campaign, PSI has just found that 220 registered voters, out of 500 contacted, that 220 registered voters, out of 500 contacted, favor a particular candidate. PSI wants to develop favor a particular candidate. PSI wants to develop a 95% confidence interval estimate for the a 95% confidence interval estimate for the proportion of the population of registered voters proportion of the population of registered voters that favor the candidate.that favor the candidate.

32 32
Slide Slide
p zp pn
/
( )2
1p z
p pn
/
( )2
1
where: where: nn = 500, = 220/500 = .44, = 500, = 220/500 = .44, zz/2 /2 = = 1.961.96pp
Interval Estimateof a Population Proportion
PSI is 95% confident that the proportion of all votersPSI is 95% confident that the proportion of all voters
that favor the candidate is between .3965 and .4835.that favor the candidate is between .3965 and .4835.PSI is 95% confident that the proportion of all votersPSI is 95% confident that the proportion of all voters
that favor the candidate is between .3965 and .4835.that favor the candidate is between .3965 and .4835.
.44(1 .44).44 1.96
500
.44(1 .44)
.44 1.96500
.44 .0435 .44 .0435

33 33
Slide Slide
Solving for the necessary sample size, we Solving for the necessary sample size, we getget
Margin of ErrorMargin of Error
Sample Size for an Interval Estimateof a Population Proportion
/ 2
(1 )p pE z
n
/ 2
(1 )p pE z
n
2/ 2
2
( ) (1 )z p pn
E
2
/ 22
( ) (1 )z p pn
E
However, will not be known until after we have However, will not be known until after we have selected the sample. We will use the planning valueselected the sample. We will use the planning value
pp** for . for .
pp
pp

34 34
Slide Slide
Sample Size for an Interval EstimateSample Size for an Interval Estimateof a Population Proportionof a Population Proportion
The planning value The planning value pp** can be chosen by: can be chosen by:
1. Using the sample proportion from a 1. Using the sample proportion from a previous sample of the same or similar previous sample of the same or similar units, orunits, or
2. Selecting a preliminary sample and 2. Selecting a preliminary sample and using theusing the
sample proportion from this sample.sample proportion from this sample.
3. Use judgment or a “best guess” for a 3. Use judgment or a “best guess” for a pp* * value.value.
4. Otherwise, use .50 as the 4. Otherwise, use .50 as the pp* value.* value.
2 * */ 2
2
( ) (1 )z p pn
E
2 * *
/ 22
( ) (1 )z p pn
E
Necessary Sample SizeNecessary Sample Size

35 35
Slide Slide
Suppose that PSI would like a .99 probability thatSuppose that PSI would like a .99 probability that
the sample proportion is within + .03 of thethe sample proportion is within + .03 of the
population proportion.population proportion.
How large a sample size is needed to meet theHow large a sample size is needed to meet the
required precision? (A previous sample of similarrequired precision? (A previous sample of similar
units yielded .44 for the sample proportion.)units yielded .44 for the sample proportion.)
Sample Size for an Interval Estimateof a Population Proportion
Example: Political Science, IncExample: Political Science, Inc..
36 36
Slide Slide
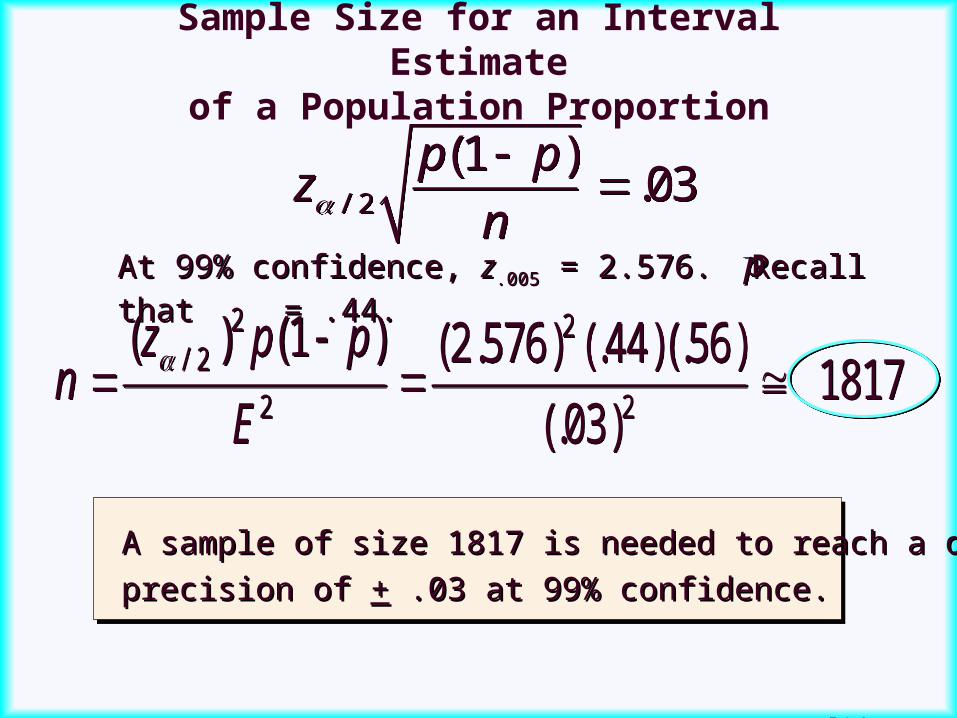
At 99% confidence, At 99% confidence, zz.005.005 = 2.576. Recall that = 2.576. Recall that = .44.= .44.
pp
A sample of size 1817 is needed to reach a desiredA sample of size 1817 is needed to reach a desired
precision of precision of ++ .03 at 99% confidence. .03 at 99% confidence.
2 2/ 2
2 2
( ) (1 ) (2.576) (.44)(.56) 1817
(.03)
z p pn
E
2 2
/ 2
2 2
( ) (1 ) (2.576) (.44)(.56) 1817
(.03)
z p pn
E
Sample Size for an Interval Estimateof a Population Proportion
/ 2
(1 ).03
p pz
n
/ 2
(1 ).03
p pz
n