1-1 chapter 1 introduction to operations management* *based on the 10 th edition of the stevenson...
TRANSCRIPT

1-1
Chapter 1Chapter 1
Introduction to Operations Management*
*Based on the 10th edition of the Stevenson text

1-2
Operations ManagementOperations Management
Operations Management is:
The management of systems or processes that create goods and/or provide services
Operations Management affects: Companies’ ability to compete Nation’s ability to compete internationally

1-3
The functional area of management that is responsible forsystems that create goods or provide services. This encompasses the acquisition of resources (labor,material, operating budget, and facilities) and the conversion of their inputs to outputs using one or moretransformation processes. This includes planning, coordinating, and controlling the elements (includingthe resources) that comprise the process.
OPERATIONS MANAGEMENT*
*Sometimes referred to as Production, Production and Operations Management, and Resources Management.

1-4
Responsibilities of Operations Management
• Planning
Products and services
– Capacity– Location–
– Make or buy– Layout– Projects– Scheduling
• Controlling– Inventory– Quality
• Organizing– Degree of centralization– Subcontracting
• StaffingHiring/laying off–
– Use of Overtime
• DirectingIncentive plans–
– Issuance of work orders– Job assignments

1-5
The OrganizationThe Organization
The Three Basic Functions
Organization
Finance Operations Marketing
Figure 1.1

1-6
Value-Added ProcessValue-Added Process
The operations function involves the conversion of inputs into outputs
Inputs Land Labor Capital
Transformation/Conversion
process
Outputs Goods Services
Control
Feedback
FeedbackFeedback
Value added
Figure 1.2

1-7
Value-Added & Product Value-Added & Product PackagesPackages
Value-added is the difference between the cost of inputs and the value or price of outputs.
Product packages are a combination of goods and services.
Product packages can make a company more competitive.

1-8
Automobile assembly, steel making
Home remodeling, retail sales
Automobile Repair, fast food
Goods-service ContinuumGoods-service ContinuumFigure 1.3
Computer repair, restaurant meal
Song writing, software development
Goods Service
Surgery, teaching

1-9
Food ProcessorFood Processor
Inputs Processing Outputs
Raw Vegetables Cleaning Canned vegetables Metal Sheets Making cans
Water CuttingEnergy CookingLabor PackingBuilding LabelingEquipment
Table 1.2

1-10
Hospital ProcessHospital Process
Inputs Processing Outputs
Doctors, nurses Examination Healthy patientsHospital Surgery
Medical Supplies MonitoringEquipment MedicationLaboratories Therapy
Table 1.2

1-11
Manufacturing or Service?Manufacturing or Service?
Tangible Act

1-12
Production of Goods vs. Delivery of Production of Goods vs. Delivery of ServicesServices
Production of goods – tangible output Delivery of services – an act Service job categories
Government Wholesale/retail Financial services Healthcare Personal services Business services Education

1-13
Goods vs ServiceGoods vs Service
Characteristic Goods Service
Customer contact Low High
Uniformity of input High Low
Labor content Low High
Uniformity of output High Low
Output Tangible Intangible
Measurement of productivity Easy Difficult
Opportunity to correct problems High Low
Inventory Much Little
Evaluation Easier Difficult
Patentable Usually Not usual

1-14
Operations Management includes: Forecasting Capacity planning Scheduling Managing inventories Assuring quality Motivating employees Deciding where to locate facilities Supply chain management And more . . .(like project management)
Scope of Operations ManagementScope of Operations Management

1-15
Types of OperationsTypes of OperationsTable 1.4
Operations ExamplesGoods Producing Farming, mining, construction,
manufacturing, power generationStorage/Transportation Warehousing, trucking, mail
service, moving, taxis, buses,hotels, airlines
Exchange Retailing, wholesaling, banking,renting, leasing, library, loans
Entertainment Films, radio and television,concerts, recording
Communication Newspapers, radio and televisionnewscasts, telephone, satellites

1-16
Year Mfg. Service45 79 2150 72 2855 72 2860 68 3265 64 3670 64 3675 58 4280 44 4685 43 5790 35 6595 25 7500 30 70
02 25 75
U.S. Manufacturing vs. Service Employment
0102030405060708090
45 50 55 60 65 70 75 80 85 90 95 00 02 05
Year
Per
cent
Mfg.
Service
Figure 1.4

1-17
Decline in Manufacturing JobsDecline in Manufacturing Jobs
Productivity Increasing productivity allows companies to
maintain or increase their output using fewer workers
Outsourcing Some manufacturing work has been outsourced
to more productive companies

1-18
Why Manufacturing MattersWhy Manufacturing Matters
Over 18 million workers in manufacturing jobs
Accounts for over 70% of value of U.S. exports
Average full-time compensation about 20% higher than average of all workers
Manufacturing workers more likely to have benefits
Productivity growth in manufacturing in the last 5 years is more than double U.S. economy

1-19
Why Manufacturing MattersWhy Manufacturing Matters
More than half of the total R&D performed is in the manufacturing industries
Manufacturing workers in California earn an average of about $25,000 more a year than service workers
When a California manufacturing job is lost, an average of 2.5 service jobs are lost

1-20
Challenges of Managing Challenges of Managing ServicesServices
Service jobs are often less structured than manufacturing jobs
Customer contact is higher Worker skill levels are lower Services hire many low-skill, entry-level workers Employee turnover is higher Input variability is higher Service performance can be affected by worker’s
personal factors

1-21
Operations Management Operations Management Decision MakingDecision Making
Models Quantitative approaches Analysis of trade-offs Systems approach Establishing priorities Ethics

1-22
Key Decisions of Operations Key Decisions of Operations ManagersManagers
WhatWhat resources/what amounts
WhenNeeded/scheduled/ordered
WhereWork to be done
HowDesigned
WhoTo do the work

1-23
Decision MakingDecision Making
System Design– capacity– location– arrangement of departments– product and service planning– acquisition and placement of
equipment

1-24
Decision MakingDecision Making
System operation– personnel– inventory– scheduling– project
management– quality assurance

1-25
Decision MakingDecision Making
Models Quantitative approaches Analysis of trade-offs Systems approach

1-26
ModelsModels
A model is an abstraction of reality.
– Physical– Schematic– Mathematical
What are the pros and cons of models?
Tradeoffs

1-27

1-28

1-29
E = mc2

1-30
Models Are BeneficialModels Are Beneficial
Easy to use, less expensive Require users to organize Increase understanding of the problem Enable “what if” questions Consistent tool for evaluation and
standardized format Power of mathematics

1-31
Limitations of ModelsLimitations of Models
Quantitative information may be emphasized over qualitative
Models may be incorrectly applied and results misinterpreted
Nonqualified users may not comprehend the rules on how to use the model
Use of models does not guarantee good decisions

1-32
Quantitative ApproachesQuantitative Approaches
• Linear programming
• Queuing Techniques
• Inventory models
• Project models
• Statistical models

1-33
Analysis of Trade-OffsAnalysis of Trade-Offs
Decision on the amount of inventory to stock
Increased cost of holding inventory
vs. Level of customer service
1-34
Systems ApproachSystems Approach
“The whole is greater than the sum of the parts.”
SuboptimizationSuboptimization

1-35
Pareto PhenomenonPareto Phenomenon
• A few factors account for a high percentage of the occurrence of some event(s).
• 80/20 Rule - 80% of problems are caused by 20% of the activities.
How do we identify the vital few?

1-36
Ethical IssuesEthical Issues
Financial statements Worker safety Product safety Quality Environment Community Hiring/firing workers Closing facilities Worker’s rights

1-37
Business Operations OverlapBusiness Operations Overlap
Operations
Finance
Figure 1.5
Marketing
1-38
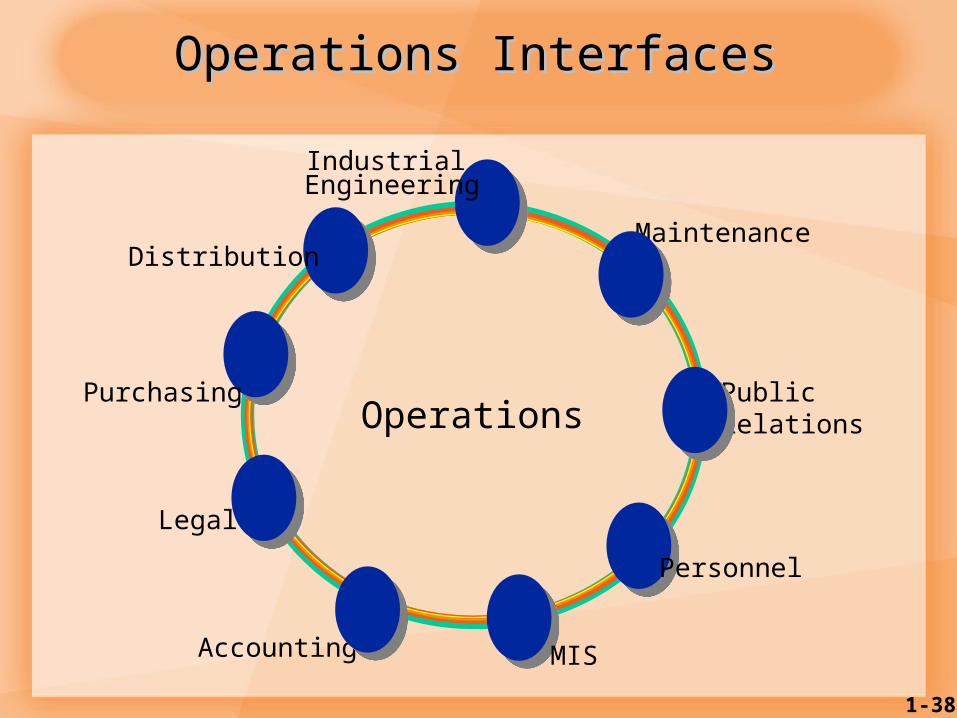
Operations InterfacesOperations Interfaces
Public Relations
Accounting
IndustrialEngineering
Operations
Maintenance
Personnel
Purchasing
Distribution
MIS
Legal

1-39
Historical Evolution of Operations Historical Evolution of Operations ManagementManagement
Industrial revolution (1770’s) Scientific management (1911)
Mass production Interchangeable parts Division of labor
Human relations movement (1920-60) Decision models (1915, 1960-70’s) Influence of Japanese manufacturers
Table 1.7

1-40
Trends in BusinessTrends in Business
Major trends The Internet, e-commerce, e-business Management technology Globalization Management of supply chains Outsourcing Agility Ethical behavior

1-41
Management TechnologyManagement Technology
Technology: The application of scientific discoveries to the development and improvement of goods and services
Product and service technology Process technology Information technology

1-42
Suppliers’ Suppliers
DirectSuppliers Producer Distributor Final
Consumer
Simple Product Supply ChainSimple Product Supply ChainFigure 1.7
Supply Chain: A sequence of activitiesAnd organizations involved in producingAnd delivering a good or service

1-43
Stage of Production Value Added
Value of Product
Farmer produces and harvests wheat $0.15 $0.15
Wheat transported to mill $0.08 $0.23
Mill produces flour $0.15 $0.38
Flour transported to baker $0.08 $0.46
Baker produces bread $0.54 $1.00
Bread transported to grocery store $0.08 $1.08
Grocery store displays and sells bread $0.21 $1.29
Total Value-Added $1.29
A Supply Chain for BreadA Supply Chain for Bread

1-44
Other Important TrendsOther Important Trends
Ethical behavior Operations strategy Working with fewer resources Revenue management Process analysis and improvement Increased regulation and product liability Lean production