1 1 0 budget master 2013 - 2014x
TRANSCRIPT

CONTENTS

Town of Cambridge Page No.
1 INTRODUCTION
Council 1.1
Declaration of Rates and Charges 1.2
1. Budget Snapshot 1.4
2. Overview 1.5
3. General Funding 1.8
4. Operations 1.10
4.1 Operating Revenue 1.10
4.2 Operating Expenditure 1.12
5. Capital and Non-Capital Works 1.14
5.1 Capital Works 1.15
5.2 Building Capital Works 1.16
5.3 Furniture and Equipment Capital Purchases 1.16
5.4 Plant and Equipment Capital Purchases 1.16
5.5 Infrastructure Capital Works 1.17
5.6 Non-Capital Works 1.18
6. Loans 1.19
7. Reserves and Endowment Lands Account 1.19
8. Integrated Planning and Reporting 1.21
2 STATUTORY BUDGET AND NOTES
Statutory Budgets
Operating Budget 2.1
Rate Setting Budget 2.3
Notes
Note 1 Significant Accounting Policies 2.5
Note 2 Functions/Activities 2.12
Note 3 Operating Revenue and Expenditure 2.13
Note 4 Rating and Valuations - General Rates 2.14
Note 5 Fees and Charges 2.17
Note 6 Contributions/Grants 2.18
Note 7 Disposal of Assets 2.19
Note 8 Gain on Disposal of Land 2.19
Note 9 Capital Works Program 2.20
Note 10 Depreciation and Amortisation 2.21
Note 11 Member's of Council Remuneration 2.22
Note 12 Cash at Bank/Investments 2.23
Note 13 Loan Facilities 2.25
Note 14 Reserves 2.26
Note 15 Endowment Lands Account 2.28
Note 16 Determination of Opening Funds 2.29
Note 17 Trading Undertaking 2.30
Note 18 Major Trading Undertaking 2.30
Note 19 Major Land Transaction 2.31
Note 20 Monies Held in Trust 2.32
Budget Contents
_______________________________________________________________________________________

Town of Cambridge Page No.Budget Contents
3 OPERATING BUDGET
Operating Budget by Program 3.1
Operating Budget by Nature and Type 3.2
General Purpose Funding 3.3
Governance 3.4
Law, Order and Public Safety 3.5
Health 3.6
Education and Welfare 3.7
Community Amenities 3.8
Recreation and Culture 3.9
Transport 3.10
Economic Services 3.11
Other Property and Services 3.12
General Purpose Funding
Financial Services - Rates 3.13
General Purpose Grants 3.15
General Financing 3.15
Governance
Members Expenses 3.16
Governance Management 3.17
Human Resources 3.18
Administration - General 3.19
Administration - Customer Services 3.20
Administration - Document Management 3.21
Financial Services - General 3.22
Financial Services - Purchasing/Accounts 3.23
Financial Services - Payroll 3.24
Information Technology 3.25
Administration Centre 3.26
Law, Order and Public Safety
Animal Control 3.27
Ranger Services - Other 3.28
Beach Inspections 3.29
Compliance 3.30
Surf Life Saving Clubs 3.31
Community Safety 3.32
Health
Health 3.33
Education and Welfare
Cambridge Senior Services - HACC 3.34
Welfare Services 3.35
Youth Services 3.36
Community Amenities
Waste Management 3.37
Planning 3.38
Sustainability Management 3.39
Recreation & Culture
Wembley Community Centre 3.40
Leederville Town Hall 3.41
The Boulevard Centre 3.42
Bold Park Aquatic Centre 3.43
Ocean Beaches 3.46
Clubs - Leased Premises 3.50
Sports Grounds 3.51
Parks 3.54
Wembley Golf Complex 3.57
Recreation Services 3.66
Cambridge Library 3.67
Quarry Amphitheatre 3.68
_______________________________________________________________________________________
Town of Cambridge Page No.Budget Contents
3 OPERATING BUDGET continued …
Transport
Road Infrastructure 3.69
Road Reserves 3.70
Depot 3.71
Parking Control 3.72
Economic Services
Building Control 3.73
Swimming Pool Inspections 3.74
Other Property and Services
Works and Engineering - Public Works Overheads 3.75
Parks and Landscape - Public Works Overheads 3.77
Works and Engineering - Plant Operation Costs 3.79
Parks and Landscape - Plant Operation Costs 3.80
Building Management 3.81
Asset Management 3.82
Other Property 3.83
4 CAPITAL BUDGET
Capital Budget Summary 4.1
Land 4.2
Buildings 4.2
Furniture and Equipment 4.3
Plant and Equipment 4.4
Infrastructure - Parks and Reserves 4.5
Infrastructure - Roads and Lanes 4.6
Infrastructure - Drainage 4.7
Infrastructure - Footpaths 4.7
Infrastructure - Bus Shelters 4.8
5 RESERVE/ENDOWMENT LANDS ACCOUNT BUDGET
RESERVE BUDGET 5.1
Area Improvement
General 5.2
Wembley/West Leederville Area 5.2
Aged Care Services and Facilities 5.2
Community Facilities
General 5.3
Wembley Community Centre 5.3
Cambridge Senior Services 5.3
Wembley Golf Complex 5.3
The Boulevard Centre 5.3
Asset Management
Plant 5.4
Light Fleet 5.4
Equipment 5.4
Infrastructure 5.4
Waste Management 5.5
Clubs and Associations - Buildings 5.6
Clubs and Associations - Synthetic Courts and Lighting Funds 5.6
Clubs and Associations - Car Parks and Surroundings 5.6
ENDOWMENT LANDS ACCOUNT BUDGET 5.7
Endowment Lands Account 5.8
_______________________________________________________________________________________

Town of Cambridge Page No.Budget Contents
6 MISCELLANEOUS SCHEDULES
Budget Summary 6.1
Application of General Purpose Funds 6.2
Major Projects 6.3
Carried Forward Items 6.5
Disposal of Assets 6.6
Operating Revenue Schedules
Contributions/Grants for the Development of Assets 6.8
Operating Expenditure Schedules
Employee Expenses 6.9
Information Systems 6.10
Building Maintenance 6.12
Works Costing Information 6.13
Non-Capital Works 6.14
Programs 6.16
Depreciation 6.18
Activity Based Costing 6.20
7 FEES AND CHARGES 7.1
_______________________________________________________________________________________

INTRODUCTION
Town of Cambridge Budget Report
Page 1.1
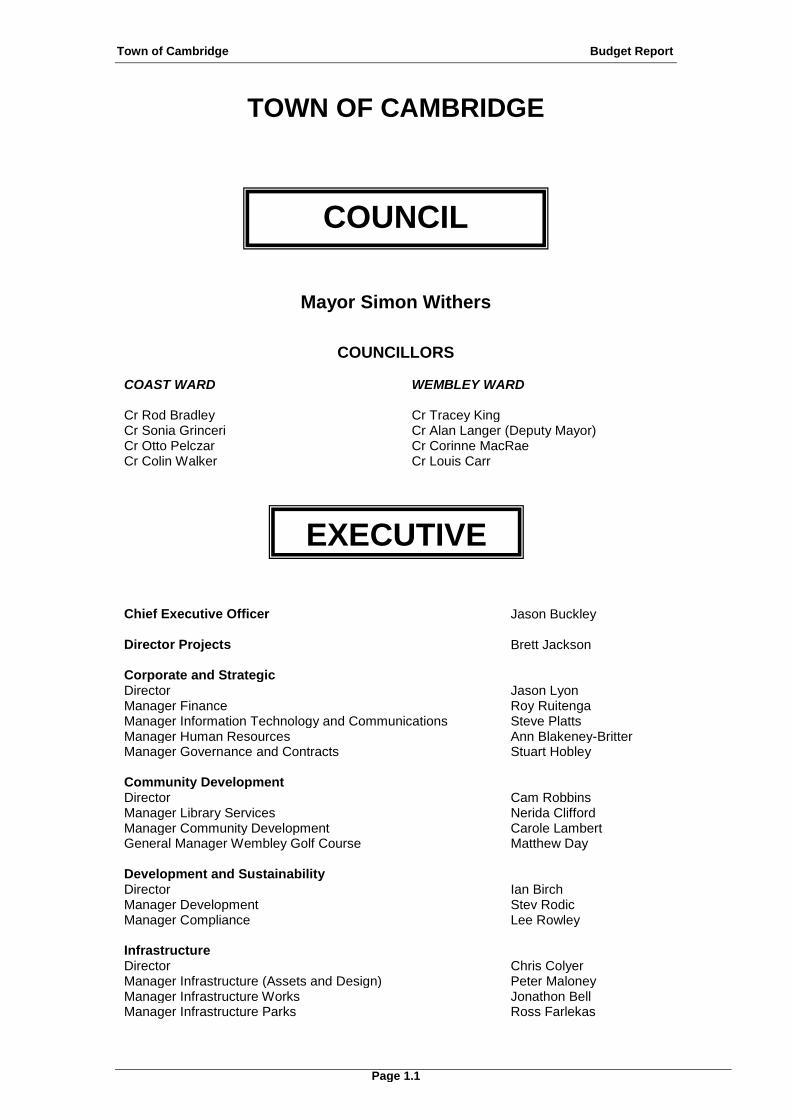
TOWN OF CAMBRIDGE
Mayor Simon Withers
COUNCILLORS
COAST WARD
WEMBLEY WARD
Cr Rod Bradley Cr Tracey King Cr Sonia Grinceri Cr Alan Langer (Deputy Mayor) Cr Otto Pelczar Cr Corinne MacRae Cr Colin Walker Cr Louis Carr
Chief Executive Officer Jason Buckley Director Projects Brett Jackson Corporate and Strategic Director Jason Lyon Manager Finance Roy Ruitenga Manager Information Technology and Communications Steve Platts Manager Human Resources Ann Blakeney-Britter Manager Governance and Contracts Stuart Hobley Community Development Director Cam Robbins Manager Library Services Nerida Clifford Manager Community Development Carole Lambert General Manager Wembley Golf Course Matthew Day Development and Sustainability Director Ian Birch Manager Development Stev Rodic Manager Compliance Lee Rowley Infrastructure Director Chris Colyer Manager Infrastructure (Assets and Design) Peter Maloney Manager Infrastructure Works Jonathon Bell Manager Infrastructure Parks Ross Farlekas
COUNCIL
EXECUTIVE
Town of Cambridge Budget Report
Page 1.2
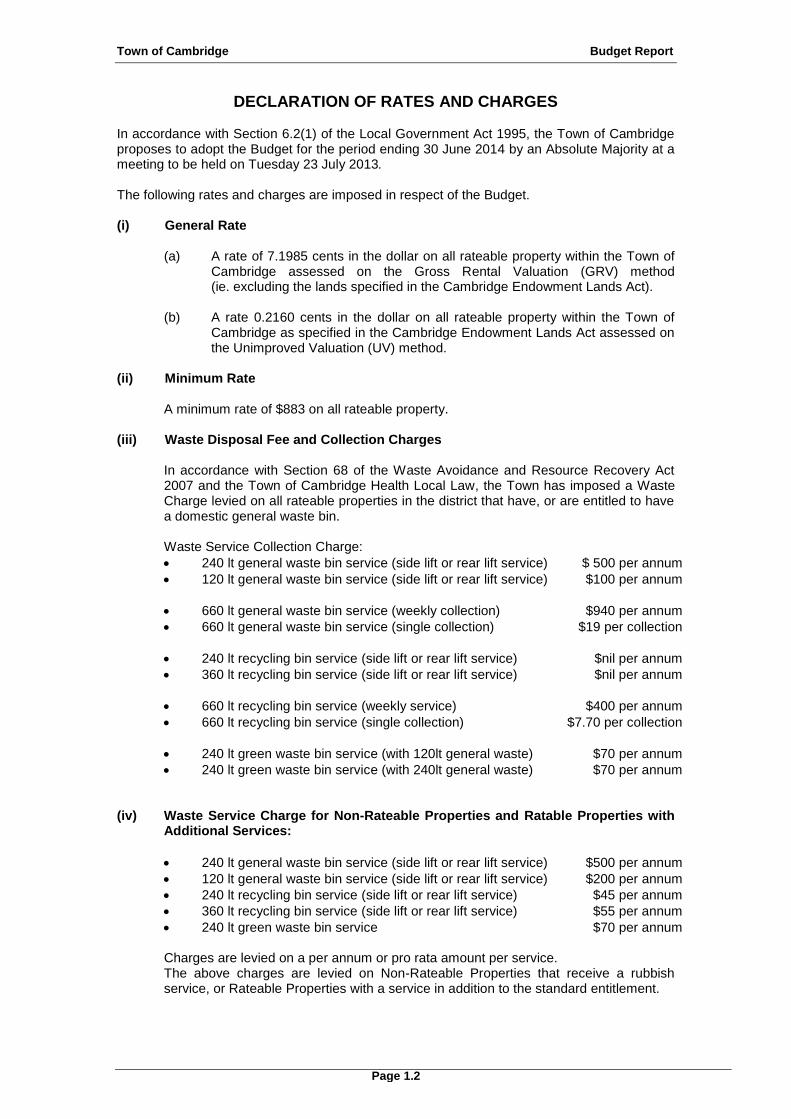
DECLARATION OF RATES AND CHARGES In accordance with Section 6.2(1) of the Local Government Act 1995, the Town of Cambridge proposes to adopt the Budget for the period ending 30 June 2014 by an Absolute Majority at a meeting to be held on Tuesday 23 July 2013. The following rates and charges are imposed in respect of the Budget. (i) General Rate
(a) A rate of 7.1985 cents in the dollar on all rateable property within the Town of Cambridge assessed on the Gross Rental Valuation (GRV) method (ie. excluding the lands specified in the Cambridge Endowment Lands Act).
(b) A rate 0.2160 cents in the dollar on all rateable property within the Town of
Cambridge as specified in the Cambridge Endowment Lands Act assessed on the Unimproved Valuation (UV) method.
(ii) Minimum Rate
A minimum rate of $883 on all rateable property. (iii) Waste Disposal Fee and Collection Charges In accordance with Section 68 of the Waste Avoidance and Resource Recovery Act
2007 and the Town of Cambridge Health Local Law, the Town has imposed a Waste Charge levied on all rateable properties in the district that have, or are entitled to have a domestic general waste bin.
Waste Service Collection Charge:
240 lt general waste bin service (side lift or rear lift service) $ 500 per annum
120 lt general waste bin service (side lift or rear lift service) $100 per annum
660 lt general waste bin service (weekly collection) $940 per annum
660 lt general waste bin service (single collection) $19 per collection
240 lt recycling bin service (side lift or rear lift service) $nil per annum
360 lt recycling bin service (side lift or rear lift service) $nil per annum
660 lt recycling bin service (weekly service) $400 per annum
660 lt recycling bin service (single collection) $7.70 per collection
240 lt green waste bin service (with 120lt general waste) $70 per annum
240 lt green waste bin service (with 240lt general waste) $70 per annum (iv) Waste Service Charge for Non-Rateable Properties and Ratable Properties with
Additional Services:
240 lt general waste bin service (side lift or rear lift service) $500 per annum
120 lt general waste bin service (side lift or rear lift service) $200 per annum
240 lt recycling bin service (side lift or rear lift service) $45 per annum
360 lt recycling bin service (side lift or rear lift service) $55 per annum
240 lt green waste bin service $70 per annum Charges are levied on a per annum or pro rata amount per service. The above charges are levied on Non-Rateable Properties that receive a rubbish service, or Rateable Properties with a service in addition to the standard entitlement.

Town of Cambridge Budget Report
Page 1.3
Bin Exchange Charge for upsizes and downsizes during the financial year:
Exchange 120 lt for a 240 lt general waste bin $77
Exchange 240 lt for a 120 lt general waste bin $nil (v) Additional Waste Bin Charges:
Supply additional 240 lt general waste bin $70
Supply additional 240 lt recycling bin in excess of policy $70
Supply additional 360 lt recycling bin in excess of policy $90
Supply additional 240 lt green waste bin $80
Supply and deliver 660 lt waste bin $600
(vi) Instalment Administration Fee and Interest
An Administration Fee of $7.00 per instalment and instalment interest of 5.5% be charged on rates and service charges for those ratepayers selecting the instalment option in accordance with Section 6.45(3) and 6.13 of the Local Government Act 1995. The administration fee or instalment interest will not apply to entitled pensioners or eligible seniors.
(vii) Late Payment Interest Late payment interest of 11% per annum, calculated on a daily basis, to be charged on rates and service charges which are outstanding from the due date (35 days after issue of the assessment notice) until the date prior to the outstanding amounts being paid, in accordance with Section 6.51(1) of the Local Government Act 1995. Late payment interest shall not apply to entitled pensioners or eligible seniors.
(viii) Fees and Charges
The fees and charges to be imposed have been adopted in accordance with the supporting schedule of fees and charges included in the Budget.
SIMON WITHERS JASON BUCKLEY MAYOR CHIEF EXECUTIVE OFFICER
23 July 2013
Town of Cambridge Budget Report
Page 1.4
2013/2014 - BUDGET REPORT
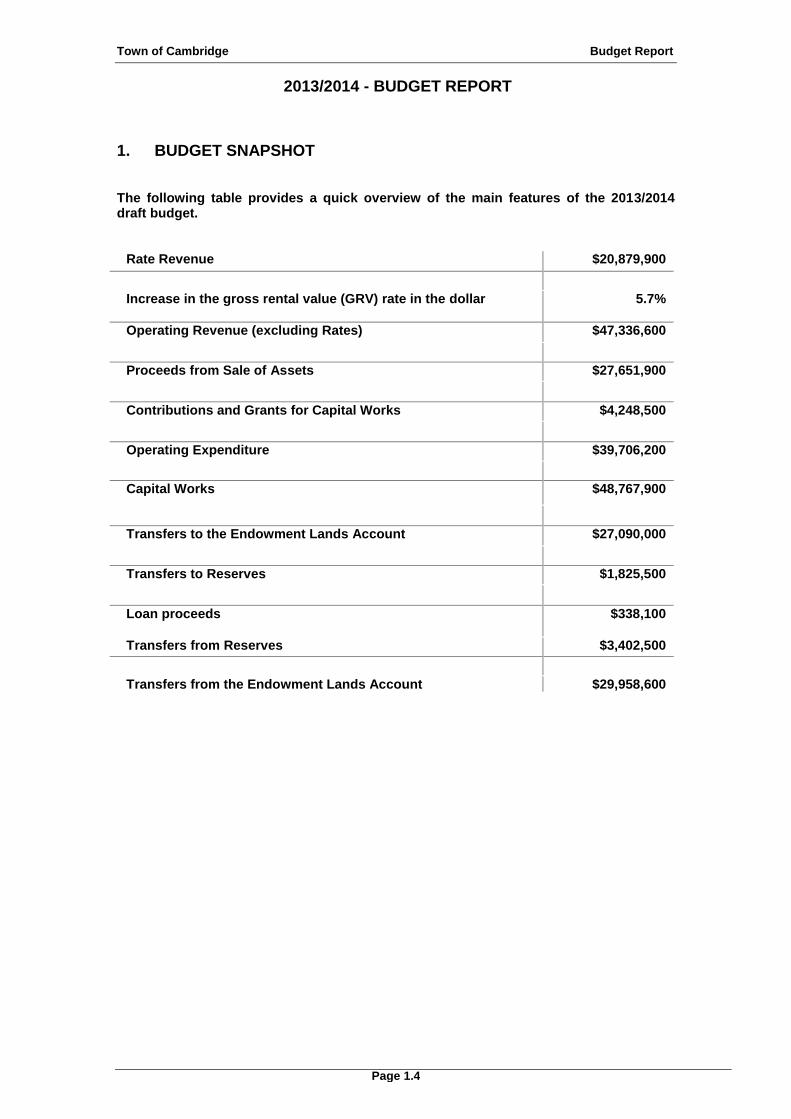
1. BUDGET SNAPSHOT The following table provides a quick overview of the main features of the 2013/2014 draft budget.
Rate Revenue $20,879,900
Increase in the gross rental value (GRV) rate in the dollar 5.7%
Operating Revenue (excluding Rates) $47,336,600
Proceeds from Sale of Assets $27,651,900
Contributions and Grants for Capital Works $4,248,500
Operating Expenditure $39,706,200
Capital Works $48,767,900
Transfers to the Endowment Lands Account $27,090,000
Transfers to Reserves $1,825,500
Loan proceeds $338,100
Transfers from Reserves $3,402,500
Transfers from the Endowment Lands Account $29,958,600
Town of Cambridge Budget Report
Page 1.5
2. OVERVIEW This budget reflects the first year we are required to implement the integrated planning and reporting framework. An additional section has been included on the integration of the corporate business plan, projects, strategies and actions with the annual budget at the end of this introduction. The 2013/2014 budget for the Town of Cambridge has been developed by applying a 5.7% increase in the rate in the dollar applied to the gross rental value (GRV) of rateable properties. This increase reflects the underlying increase in costs and allows the rate funds allocated to infrastructure renewal to be increased.
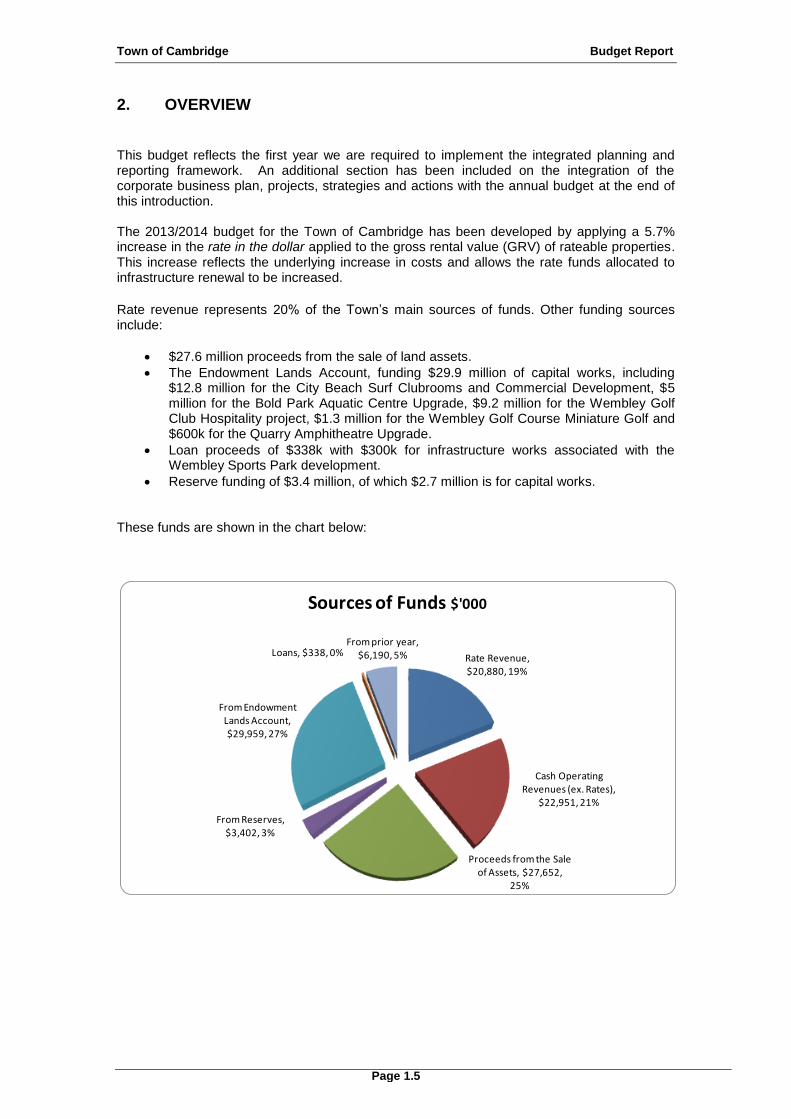
Rate revenue represents 20% of the Town’s main sources of funds. Other funding sources include:
$27.6 million proceeds from the sale of land assets.
The Endowment Lands Account, funding $29.9 million of capital works, including $12.8 million for the City Beach Surf Clubrooms and Commercial Development, $5 million for the Bold Park Aquatic Centre Upgrade, $9.2 million for the Wembley Golf Club Hospitality project, $1.3 million for the Wembley Golf Course Miniature Golf and $600k for the Quarry Amphitheatre Upgrade.
Loan proceeds of $338k with $300k for infrastructure works associated with the Wembley Sports Park development.
Reserve funding of $3.4 million, of which $2.7 million is for capital works. These funds are shown in the chart below:
Rate Revenue, $20,880, 19%
Cash Operating Revenues (ex. Rates),
$22,951, 21%
Proceeds from the Sale of Assets, $27,652,
25%
From Reserves, $3,402, 3%
From Endowment Lands Account, $29,959, 27%
Loans, $338, 0%From prior year,
$6,190, 5%
Sources of Funds $'000

Town of Cambridge Budget Report
Page 1.6
Budgeted cash operating expenses total $33 million. In addition, an amount of $27.1 million is transferred to the Endowment Lands Account from land sales and interest earned and similarly, $1.8 million is transferred to Reserves from land sales, (Tamala Park $500k), club contributions, interest, and rates.
Capital works total $48.8 million and features $2.4 million for the Wembley Sports Park - Matthews Netball Centre and infrastructure works, $14.8 million for the City Beach Surf Clubrooms and Commercial Development, $6 million for the Bold Park Aquatic Centre Upgrade, $8.5 million for the design and construction of the Wembley Golf Course Hospitality project, $1.3 million for the design and construction of the Wembley Golf Course Miniature Golf project, $1.3 million for Stage 1 for street enhancement of Cambridge Street and $1 million for the replacement of the Administration Centre's air conditioning with the balance being made up primarily of parks and roads infrastructure works. The main items in the capital works program, new for this year, are listed on the following page.
Cash Operating Expenses, $33,751,
30.2%
Capital Expenses, $48,768, 43.6%
To Endowment Lands Account, $27,090,
24.2%
To Reserves, $1,826, 1.6%
Repayment of Debt Principal, $347, 0.3%
Application of Funds $'000
Town of Cambridge Budget Report
Page 1.7
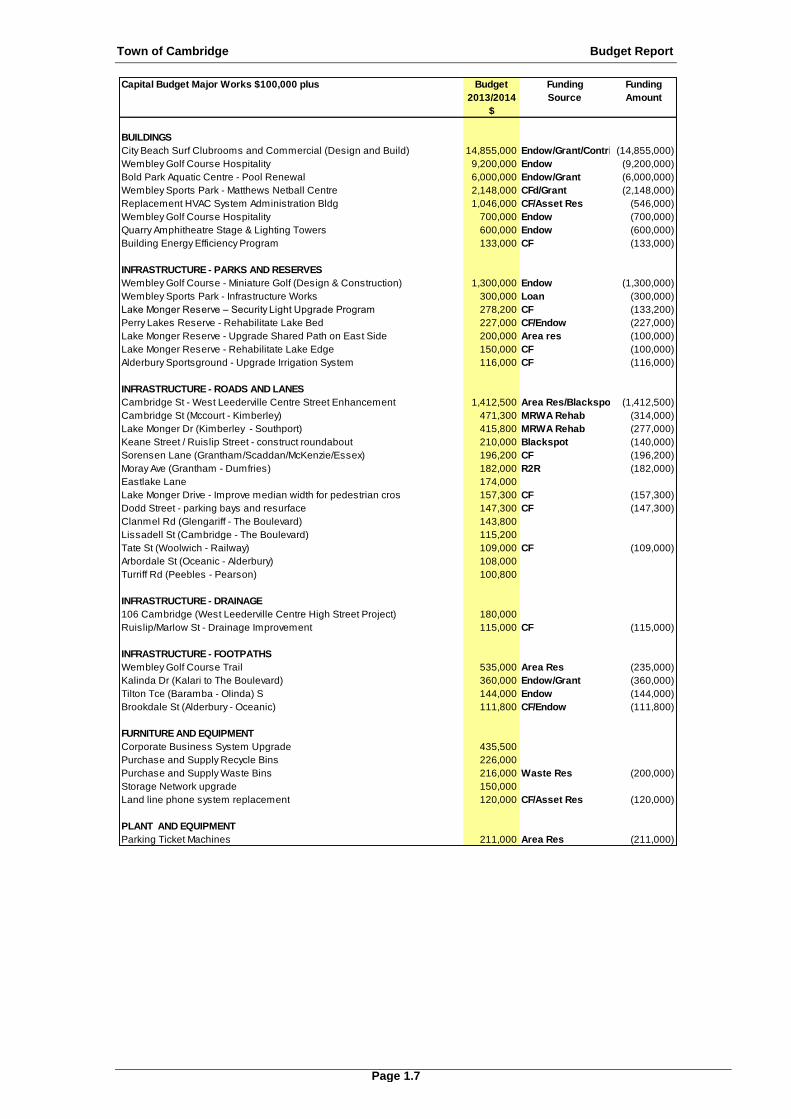
Capital Budget Major Works $100,000 plus Budget Funding Funding
2013/2014 Source Amount
$
BUILDINGS
City Beach Surf Clubrooms and Commercial (Design and Build) 14,855,000 Endow/Grant/Contribution(14,855,000)
Wembley Golf Course Hospitality 9,200,000 Endow (9,200,000)
Bold Park Aquatic Centre - Pool Renewal 6,000,000 Endow/Grant (6,000,000)
Wembley Sports Park - Matthews Netball Centre 2,148,000 CFd/Grant (2,148,000)
Replacement HVAC System Administration Bldg 1,046,000 CF/Asset Res (546,000)
Wembley Golf Course Hospitality 700,000 Endow (700,000)
Quarry Amphitheatre Stage & Lighting Towers 600,000 Endow (600,000)
Building Energy Efficiency Program 133,000 CF (133,000)
INFRASTRUCTURE - PARKS AND RESERVES
Wembley Golf Course - Miniature Golf (Design & Construction) 1,300,000 Endow (1,300,000)
Wembley Sports Park - Infrastructure Works 300,000 Loan (300,000)
Lake Monger Reserve – Security Light Upgrade Program 278,200 CF (133,200)
Perry Lakes Reserve - Rehabilitate Lake Bed 227,000 CF/Endow (227,000)
Lake Monger Reserve - Upgrade Shared Path on East Side 200,000 Area res (100,000)
Lake Monger Reserve - Rehabilitate Lake Edge 150,000 CF (100,000)
Alderbury Sportsground - Upgrade Irrigation System 116,000 CF (116,000)
INFRASTRUCTURE - ROADS AND LANES
Cambridge St - West Leederville Centre Street Enhancement 1,412,500 Area Res/Blackspot (1,412,500)
Cambridge St (Mccourt - Kimberley) 471,300 MRWA Rehab (314,000)
Lake Monger Dr (Kimberley - Southport) 415,800 MRWA Rehab (277,000)
Keane Street / Ruislip Street - construct roundabout 210,000 Blackspot (140,000)
Sorensen Lane (Grantham/Scaddan/McKenzie/Essex) 196,200 CF (196,200)
Moray Ave (Grantham - Dumfries) 182,000 R2R (182,000)
Eastlake Lane 174,000
Lake Monger Drive - Improve median width for pedestrian cros 157,300 CF (157,300)
Dodd Street - parking bays and resurface 147,300 CF (147,300)
Clanmel Rd (Glengariff - The Boulevard) 143,800
Lissadell St (Cambridge - The Boulevard) 115,200
Tate St (Woolwich - Railway) 109,000 CF (109,000)
Arbordale St (Oceanic - Alderbury) 108,000
Turriff Rd (Peebles - Pearson) 100,800
INFRASTRUCTURE - DRAINAGE
106 Cambridge (West Leederville Centre High Street Project) 180,000
Ruislip/Marlow St - Drainage Improvement 115,000 CF (115,000)
INFRASTRUCTURE - FOOTPATHS
Wembley Golf Course Trail 535,000 Area Res (235,000)
Kalinda Dr (Kalari to The Boulevard) 360,000 Endow/Grant (360,000)
Tilton Tce (Baramba - Olinda) S 144,000 Endow (144,000)
Brookdale St (Alderbury - Oceanic) 111,800 CF/Endow (111,800)
FURNITURE AND EQUIPMENT
Corporate Business System Upgrade 435,500
Purchase and Supply Recycle Bins 226,000
Purchase and Supply Waste Bins 216,000 Waste Res (200,000)
Storage Network upgrade 150,000
Land line phone system replacement 120,000 CF/Asset Res (120,000)
PLANT AND EQUIPMENT
Parking Ticket Machines 211,000 Area Res (211,000)
Town of Cambridge Budget Report
Page 1.8
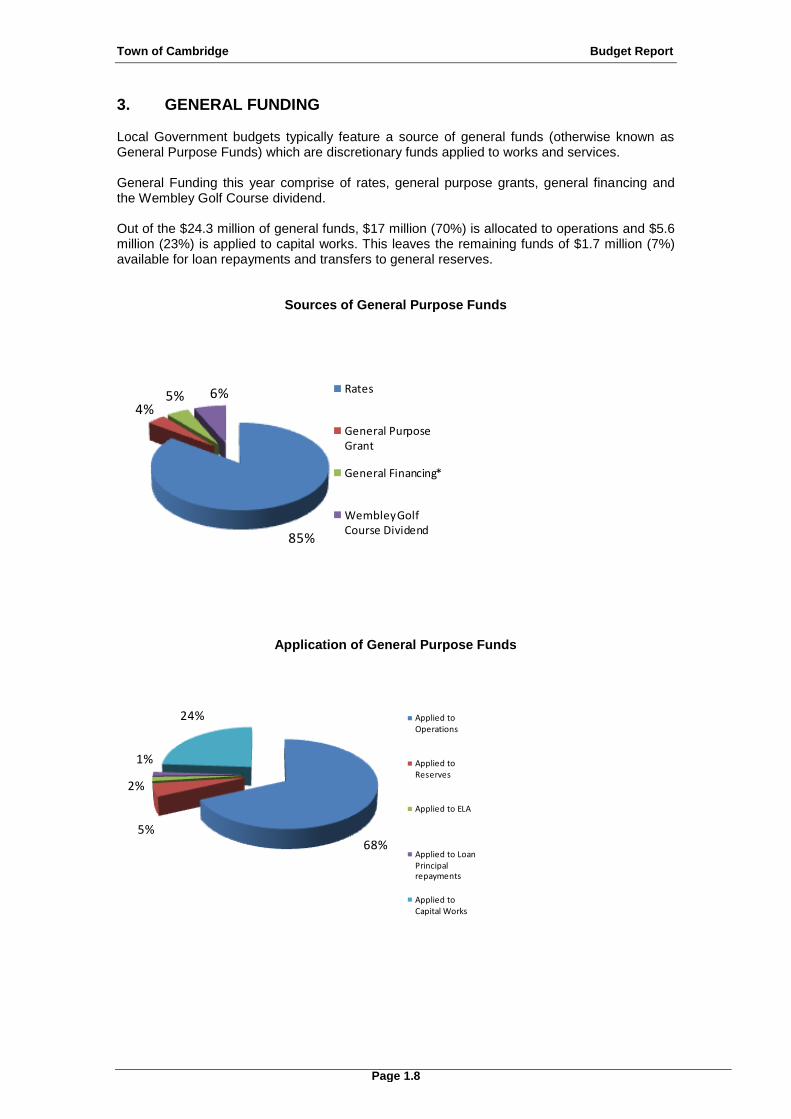
3. GENERAL FUNDING Local Government budgets typically feature a source of general funds (otherwise known as General Purpose Funds) which are discretionary funds applied to works and services. General Funding this year comprise of rates, general purpose grants, general financing and the Wembley Golf Course dividend. Out of the $24.3 million of general funds, $17 million (70%) is allocated to operations and $5.6 million (23%) is applied to capital works. This leaves the remaining funds of $1.7 million (7%) available for loan repayments and transfers to general reserves.
Sources of General Purpose Funds
Application of General Purpose Funds
85%
4%5% 6% Rates
General Purpose Grant
General Financing*
Wembley Golf Course Dividend
68%5%
2%
1%
24% Applied to Operations
Applied to Reserves
Applied to ELA
Applied to Loan Principal repayments
Applied to Capital Works
Town of Cambridge Budget Report
Page 1.9
Application of General Purpose Funds Budget Budget Budget Budget
2012/2013 2013/2014 %
Change $ Change
$ $ +/(-) +/(-)
General Purpose Funding
Rates 19,530,000 20,879,900 6.9% 1,349,900
General Purpose Grant 916,200 934,000 1.9% 17,800
General Financing* 1,324,400 1,098,000 (17.1%) (226,400)
Wembley Golf Course Dividend 1,580,000 1,580,000 0.0% 0
Total General Purpose Funds 23,350,600 24,491,900 4.9% 1,141,300
Application of General Purpose Funds
Applied to Operations 16,193,600 16,713,400 3.2% 519,800
Applied to Reserves 1,367,100 1,175,500 (14.0%) (191,600)
Applied to ELA 550,000 390,000 (29.1%) (160,000)
Applied to Loan Principal repayments 334,500 346,900 3.7% 12,400
18,445,200 18,625,800 1.0% 180,600
Applied to Capital Works:
Land & Buildings 184,000 593,000 222.3% 409,000
Furniture and Equipment 250,000 1,268,000 407.2% 1,018,000
Plant and Equipment 98,500 66,500 (32.5%) (32,000)
Infrastructure - Parks and Reserves 596,800 578,000 (3.2%) (18,800)
Infrastructure - Roads and Lanes 2,590,600 1,820,300 (29.7%) (770,300)
Infrastructure - Drainage 583,000 582,000 (0.2%) (1,000)
Infrastructure - Footpaths 574,500 933,300 62.5% 358,800
Infrastructure - Bus Shelters 28,000 25,000 (10.7%) (3,000)
4,905,400 5,866,100 19.6% 960,700
Total Application of Funds 23,350,600 24,491,900 4.9% 1,141,300
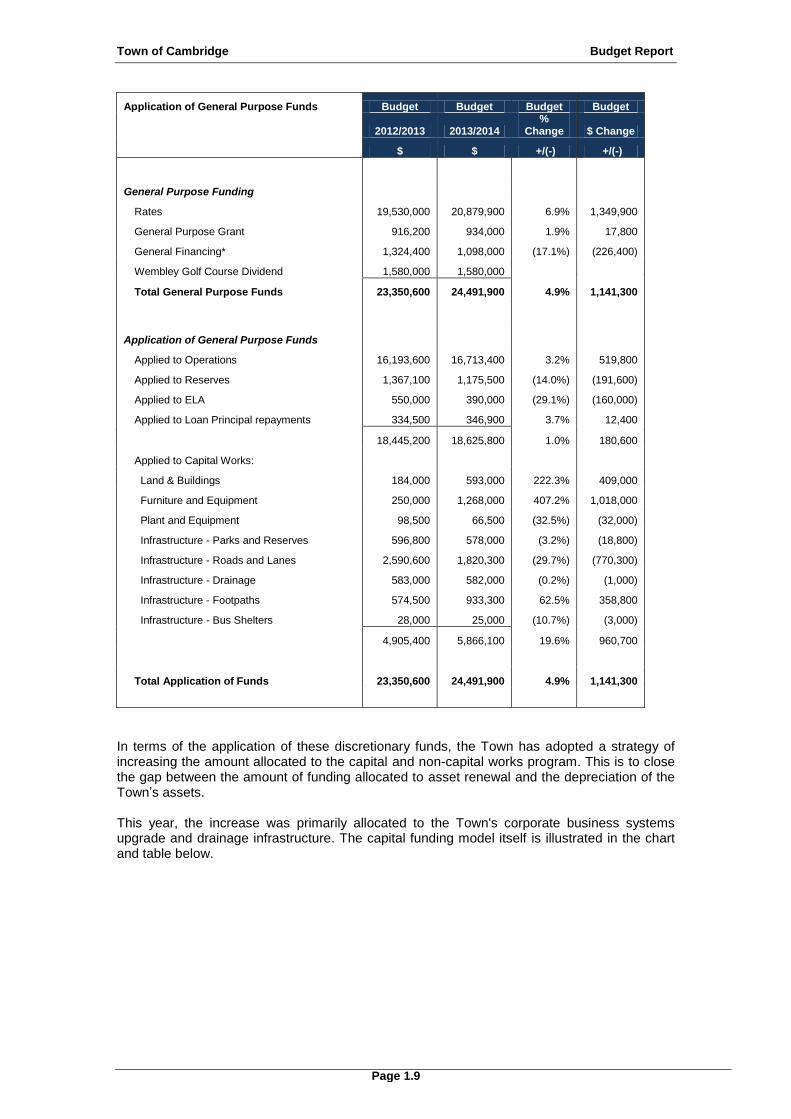
In terms of the application of these discretionary funds, the Town has adopted a strategy of increasing the amount allocated to the capital and non-capital works program. This is to close the gap between the amount of funding allocated to asset renewal and the depreciation of the Town’s assets. This year, the increase was primarily allocated to the Town's corporate business systems upgrade and drainage infrastructure. The capital funding model itself is illustrated in the chart and table below.

Town of Cambridge Budget Report
Page 1.10
Of note, the Town achieved its initial target of covering depreciation with rates allocated to asset renewal in 2012/2013. However, the strategy needs to continue, as deprecation is based on the historical cost of an asset, not its current renewal costs. Over the next few years the Town will be moving towards recording its entire infrastructure asset base at the current value and as a result, it will reset its asset-renewal-from-rates target.
4. OPERATIONS 4.1 Operating Revenues
$0
$5
$10
$15
$20
$25M
illio
ns
Asset Funding from Rates
Total Rate Revenue Asset funding from rates
Asset Depreciation
Budget Budget Budget
2011/2012 2012/2013 2013/2014
Depreciation (A) $5,632,100 $5,936,500 $5,955,500
Capital Asset Works $4,452,200 $4,905,400 $5,866,000
Non-Capital Asset Works $887,900 $810,900 $1,015,500
Reserve Transfers: future renew al $560,000 $734,000 $567,000
Total Works & Provisions (B) $5,900,100 $6,450,300 $7,448,500
Difference (A) - (B) -$268,000 -$513,800 -$1,493,000
Percentage of Rates 31.6% 32.6% 36.4%
Budget Budget Budget Budget
2012/2013 2013/2014 % Change $ Change
$ $ +/(-) +/(-)
REVENUE
Rates $19,530,000 $20,879,900 6.9% $1,349,900
Operating Grants,Subsidies and Contributions $1,618,800 $2,315,100 43.0% $696,300
Non Operating Grants,Subsidies and Contributions $7,682,700 $4,268,500 (44.4%) ($3,414,200)
Profit on asset disposals $14,960,700 $24,537,200 64.0% $9,576,500
Fees and charges $14,286,800 $14,611,300 2.3% $324,500
Interest earnings $1,482,400 $1,259,000 (15.1%) ($223,400)
Other revenue/income $449,400 $345,500 (23.1%) ($103,900)
$60,010,800 $68,216,500 13.7% 8,205,700
Town of Cambridge Budget Report
Page 1.11
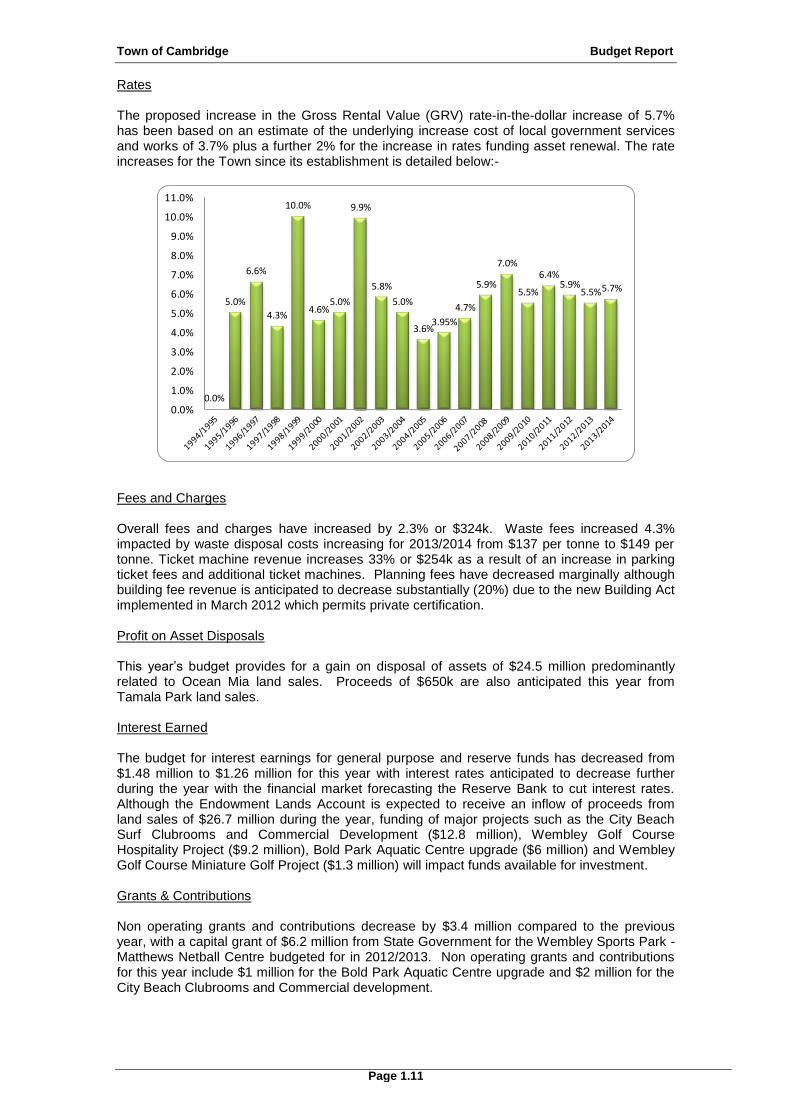
Rates The proposed increase in the Gross Rental Value (GRV) rate-in-the-dollar increase of 5.7% has been based on an estimate of the underlying increase cost of local government services and works of 3.7% plus a further 2% for the increase in rates funding asset renewal. The rate increases for the Town since its establishment is detailed below:-
Fees and Charges Overall fees and charges have increased by 2.3% or $324k. Waste fees increased 4.3% impacted by waste disposal costs increasing for 2013/2014 from $137 per tonne to $149 per tonne. Ticket machine revenue increases 33% or $254k as a result of an increase in parking ticket fees and additional ticket machines. Planning fees have decreased marginally although building fee revenue is anticipated to decrease substantially (20%) due to the new Building Act implemented in March 2012 which permits private certification. Profit on Asset Disposals This year’s budget provides for a gain on disposal of assets of $24.5 million predominantly related to Ocean Mia land sales. Proceeds of $650k are also anticipated this year from Tamala Park land sales. Interest Earned The budget for interest earnings for general purpose and reserve funds has decreased from $1.48 million to $1.26 million for this year with interest rates anticipated to decrease further during the year with the financial market forecasting the Reserve Bank to cut interest rates. Although the Endowment Lands Account is expected to receive an inflow of proceeds from land sales of $26.7 million during the year, funding of major projects such as the City Beach Surf Clubrooms and Commercial Development ($12.8 million), Wembley Golf Course Hospitality Project ($9.2 million), Bold Park Aquatic Centre upgrade ($6 million) and Wembley Golf Course Miniature Golf Project ($1.3 million) will impact funds available for investment. Grants & Contributions Non operating grants and contributions decrease by $3.4 million compared to the previous year, with a capital grant of $6.2 million from State Government for the Wembley Sports Park - Matthews Netball Centre budgeted for in 2012/2013. Non operating grants and contributions for this year include $1 million for the Bold Park Aquatic Centre upgrade and $2 million for the City Beach Clubrooms and Commercial development.
0.0%
5.0%
6.6%
4.3%
10.0%
4.6%5.0%
9.9%
5.8%
5.0%
3.6%3.95%
4.7%
5.9%
7.0%
5.5%
6.4%5.9%
5.5%5.7%
0.0%
1.0%
2.0%
3.0%
4.0%
5.0%
6.0%
7.0%
8.0%
9.0%
10.0%
11.0%
Town of Cambridge Budget Report
Page 1.12
4.2 Operating Expenditures
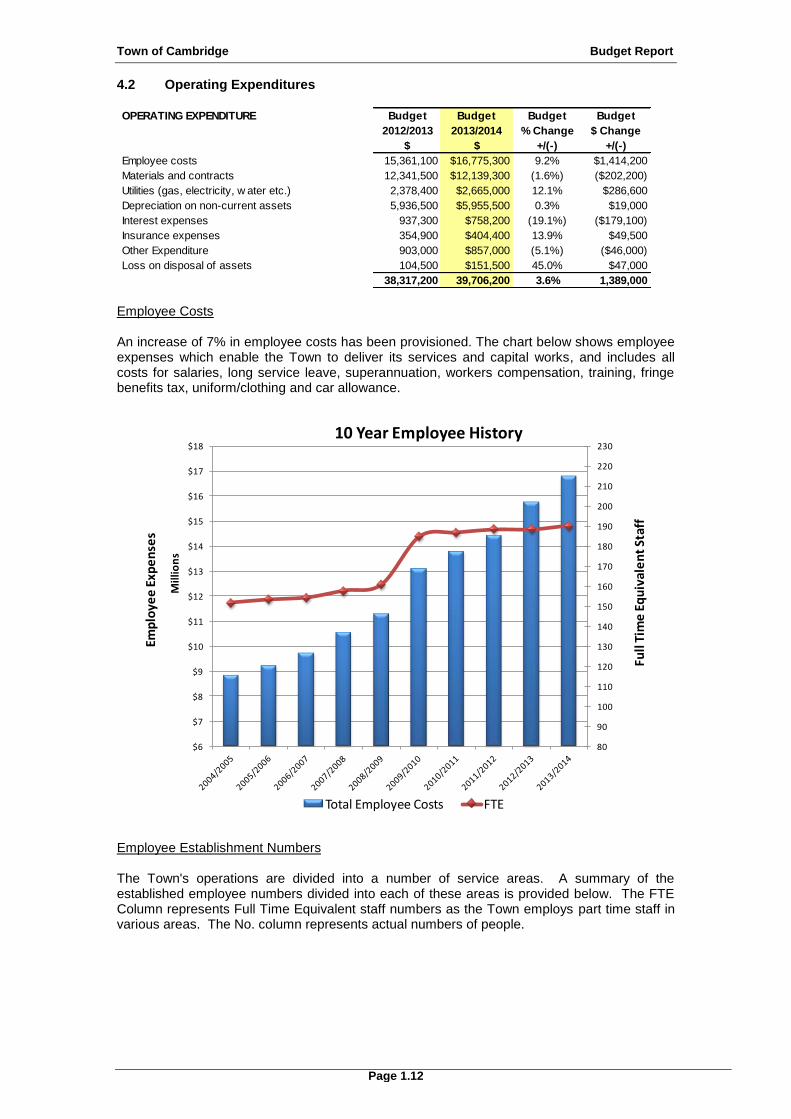
Employee Costs An increase of 7% in employee costs has been provisioned. The chart below shows employee expenses which enable the Town to deliver its services and capital works, and includes all costs for salaries, long service leave, superannuation, workers compensation, training, fringe benefits tax, uniform/clothing and car allowance.
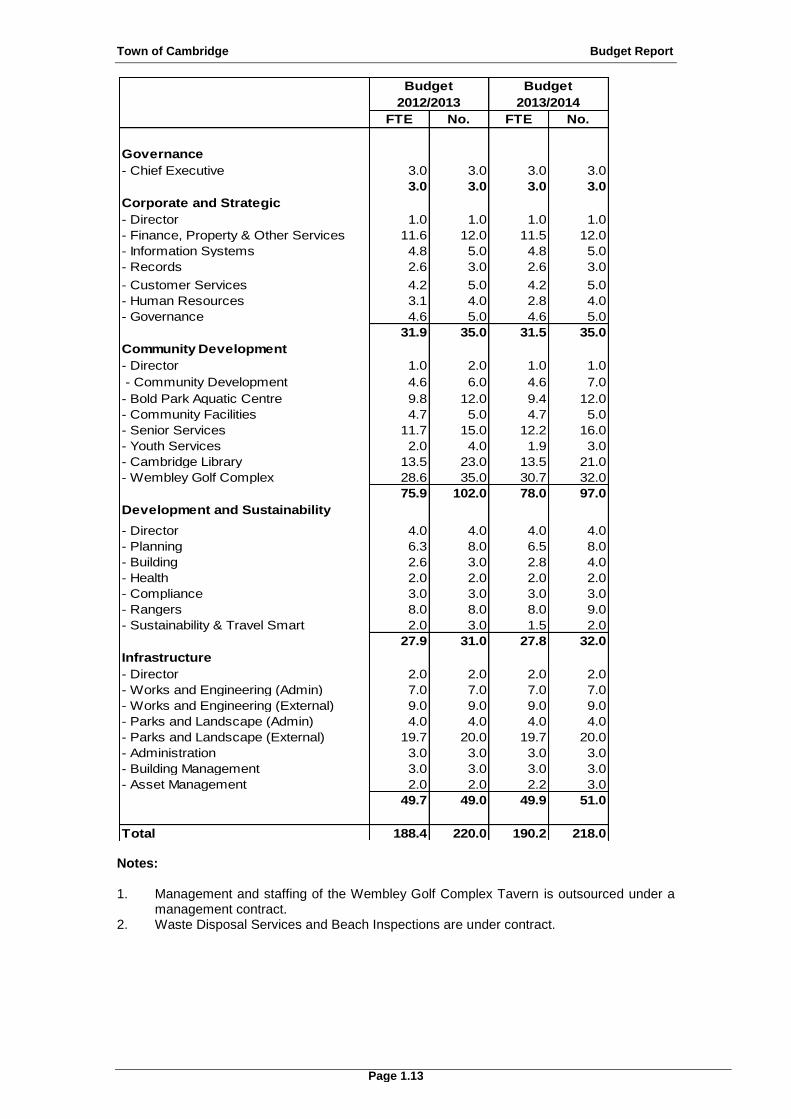
Employee Establishment Numbers The Town's operations are divided into a number of service areas. A summary of the established employee numbers divided into each of these areas is provided below. The FTE Column represents Full Time Equivalent staff numbers as the Town employs part time staff in various areas. The No. column represents actual numbers of people.
OPERATING EXPENDITURE Budget Budget Budget Budget
2012/2013 2013/2014 % Change $ Change
$ $ +/(-) +/(-)
Employee costs 15,361,100 $16,775,300 9.2% $1,414,200
Materials and contracts 12,341,500 $12,139,300 (1.6%) ($202,200)
Utilities (gas, electricity, w ater etc.) 2,378,400 $2,665,000 12.1% $286,600
Depreciation on non-current assets 5,936,500 $5,955,500 0.3% $19,000
Interest expenses 937,300 $758,200 (19.1%) ($179,100)
Insurance expenses 354,900 $404,400 13.9% $49,500
Other Expenditure 903,000 $857,000 (5.1%) ($46,000)
Loss on disposal of assets 104,500 $151,500 45.0% $47,000
38,317,200 39,706,200 3.6% 1,389,000
80
90
100
110
120
130
140
150
160
170
180
190
200
210
220
230
$6
$7
$8
$9
$10
$11
$12
$13
$14
$15
$16
$17
$18
Full
Tim
e E
qu
ival
en
t St
aff
Emp
loye
e E
xpe
nse
s
Mill
ion
s
10 Year Employee History
Total Employee Costs FTE
Town of Cambridge Budget Report
Page 1.13
Notes: 1. Management and staffing of the Wembley Golf Complex Tavern is outsourced under a
management contract. 2. Waste Disposal Services and Beach Inspections are under contract.
FTE No. FTE No.
Governance
- Chief Executive 3.0 3.0 3.0 3.0
3.0 3.0 3.0 3.0
Corporate and Strategic
- Director 1.0 1.0 1.0 1.0
- Finance, Property & Other Services 11.6 12.0 11.5 12.0
- Information Systems 4.8 5.0 4.8 5.0
- Records 2.6 3.0 2.6 3.0
- Customer Services 4.2 5.0 4.2 5.0
- Human Resources 3.1 4.0 2.8 4.0
- Governance 4.6 5.0 4.6 5.0
31.9 35.0 31.5 35.0
Community Development
- Director 1.0 2.0 1.0 1.0
- Community Development 4.6 6.0 4.6 7.0
- Bold Park Aquatic Centre 9.8 12.0 9.4 12.0
- Community Facilities 4.7 5.0 4.7 5.0
- Senior Services 11.7 15.0 12.2 16.0
- Youth Services 2.0 4.0 1.9 3.0
- Cambridge Library 13.5 23.0 13.5 21.0
- Wembley Golf Complex 28.6 35.0 30.7 32.0
75.9 102.0 78.0 97.0
Development and Sustainability
- Director 4.0 4.0 4.0 4.0
- Planning 6.3 8.0 6.5 8.0
- Building 2.6 3.0 2.8 4.0
- Health 2.0 2.0 2.0 2.0
- Compliance 3.0 3.0 3.0 3.0
- Rangers 8.0 8.0 8.0 9.0
- Sustainability & Travel Smart 2.0 3.0 1.5 2.0
27.9 31.0 27.8 32.0
Infrastructure
- Director 2.0 2.0 2.0 2.0
- Works and Engineering (Admin) 7.0 7.0 7.0 7.0
- Works and Engineering (External) 9.0 9.0 9.0 9.0
- Parks and Landscape (Admin) 4.0 4.0 4.0 4.0
- Parks and Landscape (External) 19.7 20.0 19.7 20.0
- Administration 3.0 3.0 3.0 3.0
- Building Management 3.0 3.0 3.0 3.0
- Asset Management 2.0 2.0 2.2 3.0
49.7 49.0 49.9 51.0
Total 188.4 220.0 190.2 218.0
Budget Budget
2012/2013 2013/2014
Town of Cambridge Budget Report
Page 1.14
Materials and Contracts Materials and contracts costs have decreased by 1.6% compared to last year's budget. A number of one off programs and events for 2012/2013 and not in this year's budget contribute towards the decrease. Interest Expenses Interest expense has decreased by 19% with the interest rate in relation to the $11 million loan for the Wembley Golf Course driving range and pro shop development having decreased significantly during the 2012/2013 financial year and forecast to decrease further as financial markets anticipate further interest rate cuts by the Reserve Bank of Australia..
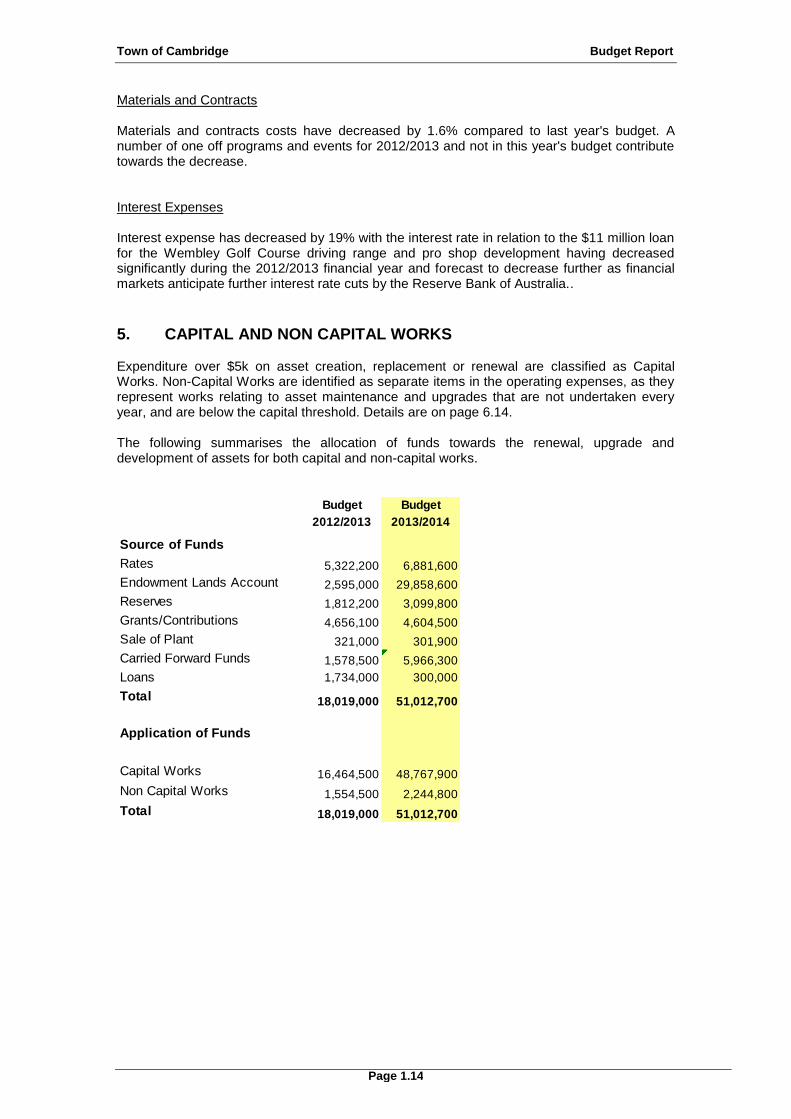
5. CAPITAL AND NON CAPITAL WORKS Expenditure over $5k on asset creation, replacement or renewal are classified as Capital Works. Non-Capital Works are identified as separate items in the operating expenses, as they represent works relating to asset maintenance and upgrades that are not undertaken every year, and are below the capital threshold. Details are on page 6.14. The following summarises the allocation of funds towards the renewal, upgrade and development of assets for both capital and non-capital works.
Budget Budget
2012/2013 2013/2014
Source of Funds
Rates 5,322,200 6,881,600
Endowment Lands Account 2,595,000 29,858,600
Reserves 1,812,200 3,099,800
Grants/Contributions 4,656,100 4,604,500
Sale of Plant 321,000 301,900
Carried Forward Funds 1,578,500 5,966,300
Loans 1,734,000 300,000
Total 18,019,000 51,012,700
Application of Funds
Capital Works 16,464,500 48,767,900
Non Capital Works 1,554,500 2,244,800
Total 18,019,000 51,012,700
Town of Cambridge Budget Report
Page 1.15
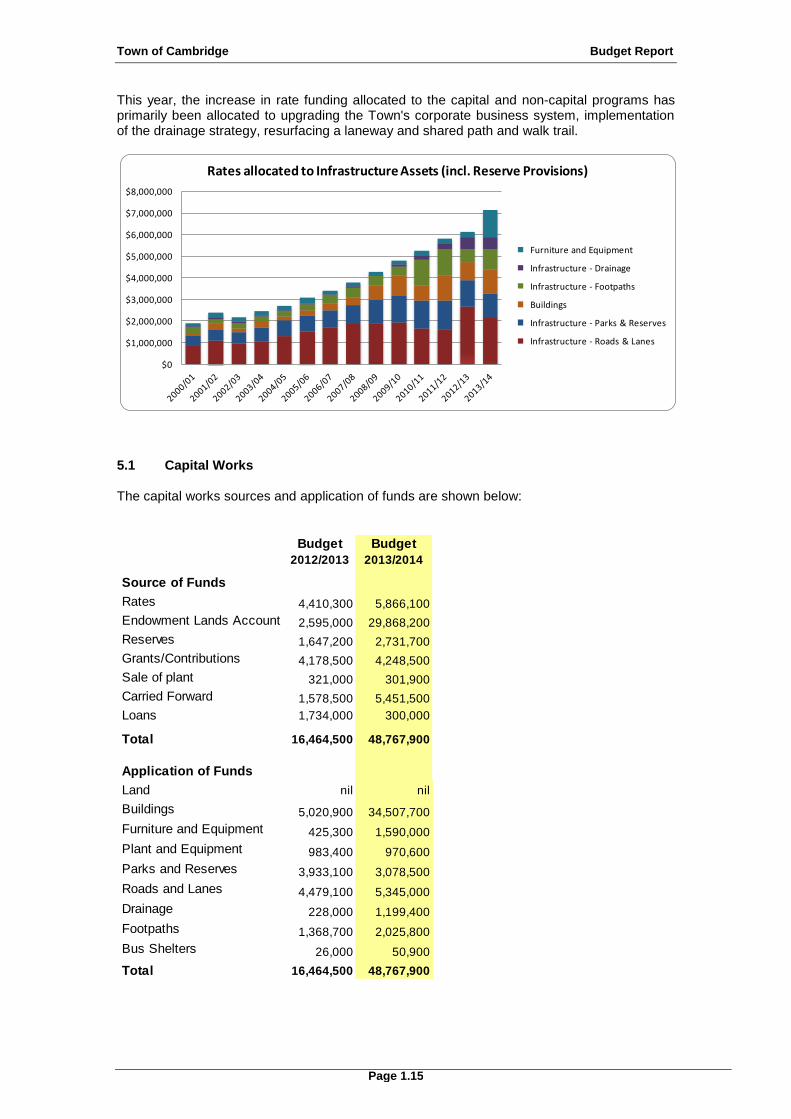
This year, the increase in rate funding allocated to the capital and non-capital programs has primarily been allocated to upgrading the Town's corporate business system, implementation of the drainage strategy, resurfacing a laneway and shared path and walk trail.
5.1 Capital Works The capital works sources and application of funds are shown below:
$0
$1,000,000
$2,000,000
$3,000,000
$4,000,000
$5,000,000
$6,000,000
$7,000,000
$8,000,000
Rates allocated to Infrastructure Assets (incl. Reserve Provisions)
Furniture and Equipment
Infrastructure - Drainage
Infrastructure - Footpaths
Buildings
Infrastructure - Parks & Reserves
Infrastructure - Roads & Lanes
Budget Budget
2012/2013 2013/2014
4,410,300 5,866,100
2,595,000 29,868,200
1,647,200 2,731,700
4,178,500 4,248,500
321,000 301,900
1,578,500 5,451,500
1,734,000 300,000
16,464,500 48,767,900
Land nil nil
Buildings 5,020,900 34,507,700
425,300 1,590,000
983,400 970,600
3,933,100 3,078,500
4,479,100 5,345,000
228,000 1,199,400
1,368,700 2,025,800
26,000 50,900
16,464,500 48,767,900
Loans
Grants/Contributions
Sale of plant
Carried Forward
Rates
Endowment Lands Account
Reserves
Application of Funds
Total
Source of Funds
Drainage
Furniture and Equipment
Roads and Lanes
Parks and Reserves
Plant and Equipment
Total
Bus Shelters
Footpaths
Town of Cambridge Budget Report
Page 1.16
5.2 Building Capital Works City Beach Surf Clubrooms & Commercial Development A total project budget of $14.85M is provided for the construction of the City Beach Surf Clubrooms and three separate restaurant/café/kiosk premises. The amount will be fully funded from the Endowment Lands Account. The Council is still to make a final decision on the project, which is expected in August 2013. The current project timeline has the buildings completed by October 2014. Wembley Sports Park - Matthews Netball Centre The construction of the Matthews Netball Centre and associated infrastructure at the Wembley Sports Park is completed at $2.14M. This has been funded by a State Government capital contribution. Other components of the project can be found under the infrastructure section of this report. Wembley Golf Course Hospitality Project Detailed design and construction of a new hospitality premises at the Wembley Golf Course budgeted for at a cost of $9.2 million. The current concept consists of a modern restaurant and bar, function centre, kiosk and revitalized golfer change rooms. Bold Park Aquatic Centre Upgrade The Bold Park Aquatic Centre, was constructed in 1975, and is nearing the end of its useful life. A provision of $6 million has been allowed for the refurbishment/expansion of the buildings, and upgrade of the car park, children's pool, pool shell, surrounds, heating and filtration system remediation works; HVAC Air Conditioning System Administration Centre An amount of $1 million provided for the replacement of the administration centre's air conditioning system with $500k funded by the Asset Management Reserve and the remainder being carried forward funds. . The Quarry Amphitheatre Upgrade An amount of $600,000 has been allocated to provide a new stage surface, lighting towers/ground support, and modifications to electrical infrastructure which is funded from the Endowment Lands Account, 5.3 Furniture and Equipment Capital Purchases The main budget items are a major upgrade of the Town's Corporate Business System at a total cost of $890,000 and the replacement of the Town's telephone system at a cost of $120,000 which is carried forward from the 2012/2013 financial year and is fully funded from the Asset Management Reserve. 5.4 Plant and Equipment Capital Purchases An amount of $760k has been budgeted for plant and equipment acquisitions for the 2013/2014 financial year with $302,000 being received from the trade-in of vehicles and plant. An amount of $211k has also been set aside for the purchase of an additional seventeen parking ticket machines to be funded from the Area Improvement Reserve.
Town of Cambridge Budget Report
Page 1.17
5.5 Infrastructure capital works Parks and Reserves Proposed works amount to $3 million including carried forward works of $700k. The significant projects included are:
Lake Monger Reserve – An amount of $728k set aside in the budget, including $333k of carried forward funds, for the following projects: rehabilitation of the lake's edge, upgrading of security lights and upgrading the shared path (eastern side) and recreation activities infrastructure.
Perry Lakes Reserve - Rehabilitate Lake Bed. An amount of $227k has been carried forward to produce a rehabilitation plan for the lakes and undertake appropriate
Wembley Sports Park Infrastructure Works - An amount of $300k has been set aside for the construction of infrastructure works, including a modified intersection on Selby Street at Alderbury Street.
Wembley Golf Course Miniature Golf Project - A provision of $1.3 million has been allocated for the establishment of a state of the art landscaped miniature golf course, the first of its kind in Western Australia, which will provide an opportunity to open up the course to more of the community and promote the game of golf to the next generation of potential golfers.
Roads and Lanes The total roads and lanes spend is $5.3 million for the budget year, of which $967,000 is funded by government grants, $675,000 from reserves and $1.2 million of funding carried forward from the 2012/2013 financial year. Major road works projects include:
West Leederville Centre - Cambridge Street Enhancement Stage 1 (Northwood Street to Holyrood Street). This project is completed with a provision of $1.4 million.
Keane Street - Roundabout construction totaling $210,000.
The road surfacing budget totals $2.4 million enabling roads to be resurfaced in accordance with the Town's road resurfacing program. The major resealing works occur at Lake Monger Dr (Kimberley - Southport) and Cambridge St (Mccourt - Kimberley) and roads to recovery project Moray Ave (Grantham - Dumfries). The budget also provides for the upgrade of the Eastlake Laneway at a cost of $174,000 and Sorensen Lane at a cost of $196,200 carried forward from the 2012/2013 financial year. Drainage Following a number of intense storms over the past two years, the Town has undertaken a review of its drainage network capability and in February 2012, Council adopted a three year program to upgrade the drainage network. An amount of $1.2 million, including $617k of carried forward works, has been set aside for drainage projects, in accordance with year two of the three-year program.
Town of Cambridge Budget Report
Page 1.18
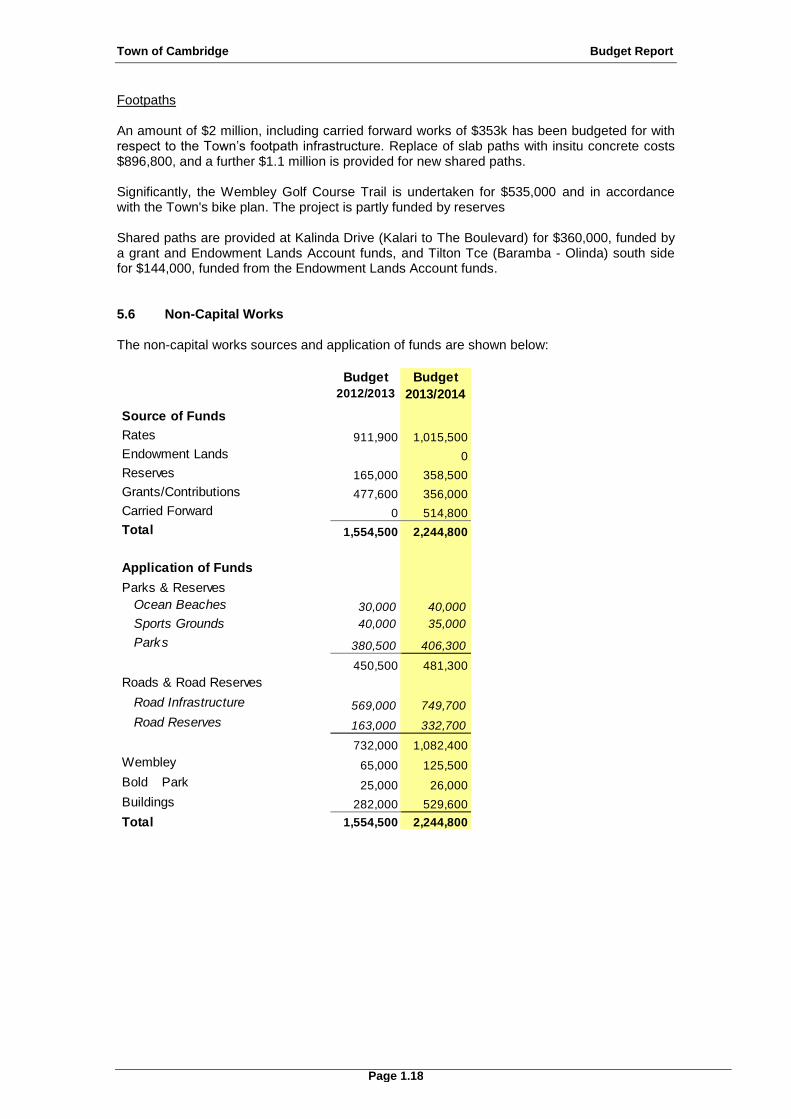
Footpaths An amount of $2 million, including carried forward works of $353k has been budgeted for with respect to the Town’s footpath infrastructure. Replace of slab paths with insitu concrete costs $896,800, and a further $1.1 million is provided for new shared paths. Significantly, the Wembley Golf Course Trail is undertaken for $535,000 and in accordance with the Town's bike plan. The project is partly funded by reserves Shared paths are provided at Kalinda Drive (Kalari to The Boulevard) for $360,000, funded by a grant and Endowment Lands Account funds, and Tilton Tce (Baramba - Olinda) south side for $144,000, funded from the Endowment Lands Account funds. 5.6 Non-Capital Works The non-capital works sources and application of funds are shown below:
Budget Budget
2012/2013 2013/2014
911,900 1,015,500
0
165,000 358,500
477,600 356,000
0 514,800
1,554,500 2,244,800
30,000 40,000
40,000 35,000
380,500 406,300
450,500 481,300
569,000 749,700
163,000 332,700
732,000 1,082,400
Wembley
Golf 65,000 125,500
Bold Park
Aquatic 25,000 26,000
Buildings 282,000 529,600
1,554,500 2,244,800
Road Infrastructure
Parks
Road Reserves
Roads & Road Reserves
Ocean Beaches
Sports Grounds
Parks & Reserves
Application of Funds
Reserves
Source of Funds
Rates
Total
Endowment Lands
Account
Grants/Contributions
Carried Forward
Total
Town of Cambridge Budget Report
Page 1.19
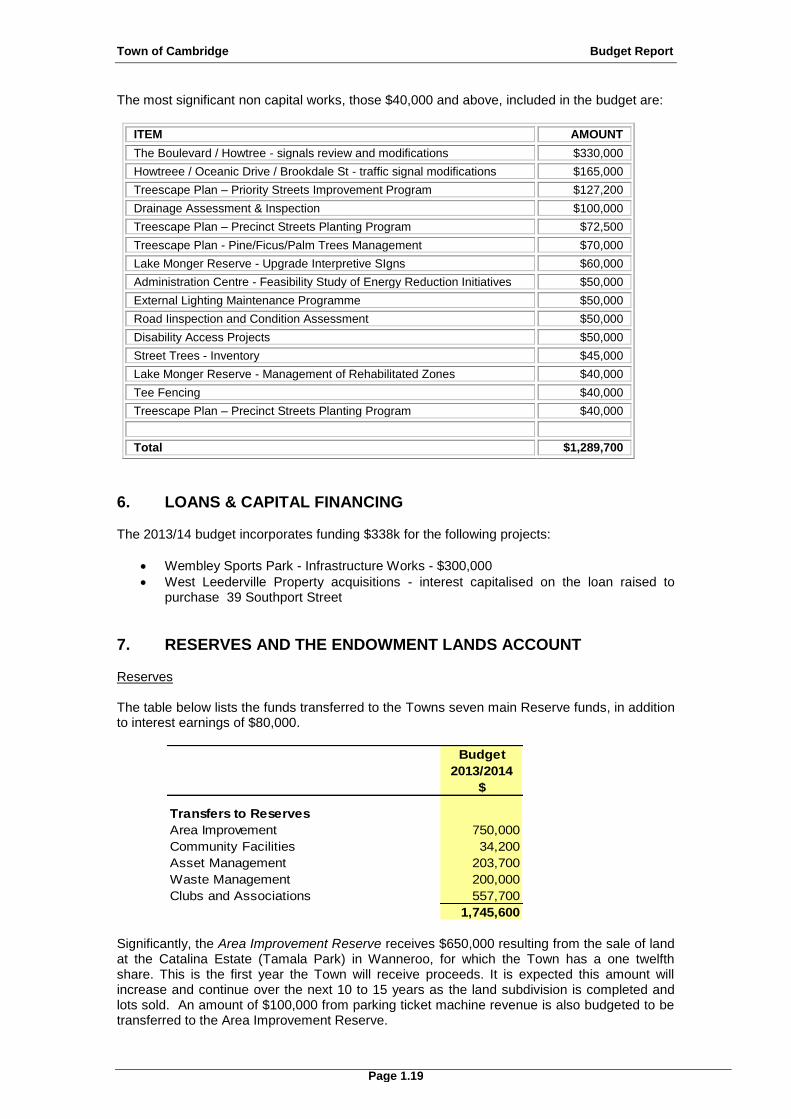
The most significant non capital works, those $40,000 and above, included in the budget are:
ITEM AMOUNT
The Boulevard / Howtree - signals review and modifications $330,000
Howtreee / Oceanic Drive / Brookdale St - traffic signal modifications $165,000
Treescape Plan – Priority Streets Improvement Program $127,200
Drainage Assessment & Inspection $100,000
Treescape Plan – Precinct Streets Planting Program $72,500
Treescape Plan - Pine/Ficus/Palm Trees Management $70,000
Lake Monger Reserve - Upgrade Interpretive SIgns $60,000
Administration Centre - Feasibility Study of Energy Reduction Initiatives $50,000
External Lighting Maintenance Programme $50,000
Road Iinspection and Condition Assessment $50,000
Disability Access Projects $50,000
Street Trees - Inventory $45,000
Lake Monger Reserve - Management of Rehabilitated Zones $40,000
Tee Fencing $40,000
Treescape Plan – Precinct Streets Planting Program $40,000
Total $1,289,700
6. LOANS & CAPITAL FINANCING The 2013/14 budget incorporates funding $338k for the following projects:
Wembley Sports Park - Infrastructure Works - $300,000
West Leederville Property acquisitions - interest capitalised on the loan raised to purchase 39 Southport Street
7. RESERVES AND THE ENDOWMENT LANDS ACCOUNT Reserves The table below lists the funds transferred to the Towns seven main Reserve funds, in addition to interest earnings of $80,000.
Significantly, the Area Improvement Reserve receives $650,000 resulting from the sale of land at the Catalina Estate (Tamala Park) in Wanneroo, for which the Town has a one twelfth share. This is the first year the Town will receive proceeds. It is expected this amount will increase and continue over the next 10 to 15 years as the land subdivision is completed and lots sold. An amount of $100,000 from parking ticket machine revenue is also budgeted to be transferred to the Area Improvement Reserve.
Budget
2013/2014
$
Transfers to Reserves
Area Improvement 750,000
Community Facilities 34,200
Asset Management 203,700
Waste Management 200,000
Clubs and Associations 557,700
1,745,600

Town of Cambridge Budget Report
Page 1.20
The Asset Management Reserve receives $203,700 of funding for a transfer of $180,000 to cover change-over prices for plant and vehicles. The Waste Management Reserve has an amount of 200,000 deposited for the amortisation of waste bins, which are charged through the waste fee. The Clubs and Associations - Buildings Reserve receives $340,600 of funding attributable to contributions from the Town and Community Associations under the new community leasing policy. The Clubs and Associations - Synthetic Court and Lightings Reserve receives $176,500 of funding attributable to contributions from the Town and Community Associations under the new community leasing policy. The Clubs and Associations - Car Parks and Surroundings Reserve receives $40,600 of funding attributable to contributions from the Town and Community Associations under the new community leasing policy. Below, transfers from reserves for works and services are summarised.
Drawing on the Area Improvement Reserve are the following items:
Cambridge St (Northwood - Holyrood) Street Enhancement $675,000
Wembley Golf Course Trail $235,000
Parking Ticket Machines $211,000
Leederville Link Project $100,000
Lake Monger Reserve - Upgrade Shared Path on East Side $100,000
Wembley Sports Park - Pat Goodridge Pavilion Redevelopment $50,000 Drawing on the Asset Management Reserve is $500,000 for the replacement of the air condition at the Town's Administration Centre. The balance of the draw is for the replacement of vehicles. Likewise, drawing on the Community Facilities Reserve are the following items:
The Boulevard Centre $91,500
Wembley Community Centre $37,000
YMCA Out of School Care Facility $29,000
The Waste Management Reserve features transfers for the purchase of new bins of $200k. The Clubs and Associations - Buildings Reserve provides a transfer of $638,700 for maintenance of sports clubs leased buildings, including non capital works. The Floreat Surf Life Saving Club and YMCC Hockey Club receive and significant portion due to the age of the building. Details can be found in the miscellaneous budget schedules.
Budget
2013/2014
$
Transfers from Reserves
Area Improvement 1,420,100
Community Facilities 159,000
Asset Management 984,700
Waste Management 200,000
Clubs and Associations 638,700
3,402,500
Town of Cambridge Budget Report
Page 1.21
The Endowment Lands Account A total of $26.7 million is transferred to the Endowment Lands Account, from the net proceeds of Ocean Mia land sales (31 single residential lots and 2 multi residential lots). Applications of the ELA funds total $29.9 million and includes:
the City Beach SLSC Buildings and Commercial Facilities Development of $12.8 million;
the Wembley Golf Course Hospitality Project $9.2 million
Bold Park Aquatic Centre Renewal - funding of $6 million
The Wembley Golf Course Miniature Golf Project $1.3 million
Quarry Amphitheatre - Stage Timber Decking (Replace) and upgrade - funding of $600,000;
Perry Lakes Reserve - Rehabilitate Lake Bed - funding of $227,000.
Shared Paths Kalinda Dr (Kalari to The Boulevard) - funding of $180,000 and Tilton Tce (Baramba - Olinda) - funding of $144,000
Replacement of slabs with insitu concrete for footpath Brookdale St (Alderbury-Oceanic) - funding of $111,800.
Ocean Mia sales and marketing costs - $100,000
In addition, an existing ‘internal loan’ to the Wembley Golf Complex for the driving range project sees interest paid to the ELA of $133,000.
8. INTEGRATED PLANNING AND REPORTING This budget has been prepared as an integrated component of the Town’s Strategic Community Plan. The Plan, which was developed over a nine month period was adopted by Council in May 2013. It responds to the priorities of the Community revolving around Community Life, Neighbourhood Planning, the Natural Environment and Council Governance. Specific projects and actions are included in the Town’s Corporate Business Plan, which was informed by the Financial, Workforce and Strategic Asset Plans, and by the draft Land Use Planning Strategy. Some of the major projects and actions include: Our Community Life
City Beach Surf Club & Commercial Precinct development
Improved paths and lighting at Lake Monger
Advancing the next stage of the Wembley Sports Park masterplan
Redevelopment of the Bold Park Aquatic Centre
Our Planned Neighbourhoods
Provision to advance the housing options study and commence the commercial
centres strategy
A specific budget for the Leederville Link project
Implementation of the West Leederville Centre (Cambridge High Street) project

Town of Cambridge Budget Report
Page 1.22
Our Natural Environment
Implementation of the Biodiversity Plan
Implementation of initiatives to improve energy efficiency including PV Panels
Further reductions in the household waste sent to Landfill
Our Council
Improved website and communications;
Improved asset management systems, planning and asset renewal
Design and construction of the Wembley Golf Course Hospitality.
JASON LYON JASON BUCKLEY DIRECTOR CORPORATE & STRATEGIC CHIEF EXECUTIVE OFFICER 23 July 2013

STATUTORY BUDGET
AND NOTES

Town of Cambridge
Operating Budget
For the Year Ending 30 June 2014
Actual Budget Est. Actual Budget
2011/2012 2012/2013 30 Jun 2013 2013/2014
Notes $ $ $ $
REVENUE
General Purpose Funding (21,379,828) (21,545,800) (21,963,605) (23,175,900)
Governance (100,231) (95,000) (94,790) (54,000)
Law, Order and Public Safety (57,530) (55,500) (75,713) (73,800)
Health (57,755) (57,900) (60,575) (51,000)
Education and Welfare (1,006,651) (1,019,500) (1,053,104) (1,076,100)
Community Amenities (2,109,852) (2,489,000) (2,262,685) (2,560,000)
Recreation and Culture (8,514,467) (9,471,700) (9,441,861) (9,548,500)
Transport (1,853,830) (1,946,300) (1,888,785) (2,364,000)
Economic Services (690,603) (567,000) (436,460) (465,000)
Other Property and Services (189,822) (119,700) (52,497) (62,500)
3 (35,960,569) (37,367,400) (37,330,075) (39,430,800)
EXPENDITURE
General Purpose Funding 613,004 588,300 573,217 594,400
Governance 1,415,853 1,542,000 1,467,569 1,730,000
Law, Order and Public Safety 1,003,991 1,464,000 1,442,716 1,480,400
Health 438,678 470,800 452,368 501,000
Education and Welfare 1,425,496 1,575,800 1,532,873 1,704,500
Community Amenities 5,405,331 5,644,900 5,149,360 5,886,600
Recreation and Culture 15,778,147 16,980,200 16,915,978 17,285,000
Transport 6,750,877 7,278,300 6,985,285 7,748,900
Economic Services 629,915 705,800 647,345 600,500
Other Property and Services 1,930,648 1,962,600 2,113,519 2,023,400
3 35,391,940 38,212,700 37,280,232 39,554,700
Net (Increase)/Decrease (568,629) 845,300 (49,843) 123,900
CONTRIBUTIONS/GRANTS FOR THE
DEVELOPMENT OF ASSETS
General Purpose Funding
Governance
Law, Order and Public Safety (2,060,000)
Health
Education and Welfare (44,493) (26,500)
Community Amenities (162,500)
Recreation and Culture (1,339,502) (6,727,000) (5,484,038) (1,015,000)
Transport (683,116) (955,700) (778,101) (1,147,000)
Other Property and Services (4,765,053)
Net contributions/grants 6(a) (6,950,171) (7,682,700) (6,306,632) (4,248,500)
DISPOSAL OF ASSETS
Governance 26,166 6,400 20,917 34,300
Law, Order and Public Safety 12,757 29,000 6,477 13,400
Health 6,900 6,500
Education and Welfare 12,505 6,900
Community Amenities 4,149 9,200 11,315 19,500
Recreation and Culture (10,542) 15,600 7,989 3,400
Transport 470,530 3,700 8,977
Economic Services 11,208
Other Property and Services (1,711,996) (14,933,900) (7,284,142) (24,462,800)
(Gain)/Loss on Disposal 7 (1,185,223) (14,856,200) (7,228,467) (24,385,700)
Change in net assets resulting from operations
(Gain)/Reduction 12(d) (8,704,023) (21,693,600) (13,584,941) (28,510,300)
________________________________________________________________________________________Page 2.1

Town of Cambridge
Cash Flow Budget
For the Year Ending 30 June 2014
Actual Budget Est. Actual Budget
2011/2012 2012/2013 30 Jun 2013 2013/2014
Notes $ $ $ $
Cash flows from operating activities
Payments
Employee costs (14,508,264) (15,361,100) (15,718,596) (16,775,300)
Materials and contracts (14,340,483) (12,341,500) (11,559,616) (12,139,300)
Utilities (gas, electricity, water, etc.) (1,580,099) (2,378,400) (2,462,797) (2,665,000)
Insurance expenses 24 (330,865) (354,900) (374,680) (404,400)
Interest Payments 13 (653,835) (899,200) (590,004) (720,100)
Other expenditure (596,557) (907,900) (693,883) (857,100)
(32,010,103) (32,243,000) (31,399,576) (33,561,200)
Receipts
Rates 4 18,148,317 19,530,000 19,490,687 20,879,900
Grants and subsidies (operating) 2,783,989 1,545,700 2,085,823 2,289,100
Contributions, reimbursements and donations 63,343 326,600 49,840 247,900
Service charges 4 2,532 30,000 0 3,200
Fees and charges 5 14,067,707 14,286,800 13,764,603 14,611,300
Interest earnings 12(c) 1,553,024 1,482,400 1,477,344 1,259,000
Other revenue/income 436,641 454,400 372,248 345,500
Goods and Services Tax Refund 650,096 600,000 697,661 750,000
37,705,649 38,255,900 37,938,205 40,385,900
Net cash from operating activities 12(d) 5,695,546 6,012,900 6,538,629 6,824,700
Cash flows from investing activities
Payments
Purchase of land (998,591) (3,000,000) (75,627) 0
Purchase of infrastructure (5,246,159) (10,552,900) (5,131,482) (11,699,600)
Purchase of buildings (486,169) (10,881,800) (11,183,505) (34,507,700)
Purchase of office furniture and equipment (447,101) (719,000) (598,528) (1,590,000)
Purchase of external plant and equipment (1,780,880) (752,000) (738,438) (970,600)
Purchase of Investment (15,000) 0
Purchase of land held for resale (135,022)
Work in progress (1,623,623) (400,000) (700,000)
10 (10,717,545) (26,320,700) (17,727,580) (49,467,900)
Receipts
Grants/contributions for development of Assets 2,062,462 7,682,700 6,306,632 4,268,500
Disposal of land 2,244,820 17,951,700 7,619,388 27,350,000
Disposal of external plant and equipment 507,757 26,300 360,863 80,800
Proceeds from investments matured 519,735
7 5,334,774 25,660,700 14,286,883 31,699,300
Net cash from investing activities (5,382,771) (660,000) (3,440,698) (17,768,600)
Cash flows from financing activities
Increase/(Decrease) in deposits and bonds (971,093) 50,000 (16,741) (100,000)
Proceeds from borrowing 13 1,019,061 3,413,100 114,422 338,100
Repayments of borrowing 13 (113,391) (334,500) (130,206) (346,900)
(65,423) 3,128,600 (32,525) (108,800)
Net increase/(decrease) in cash held 247,352 8,481,500 3,065,406 (11,052,700)
Cash at 1 July 18,954,322 21,284,500 19,201,674 22,267,100
Cash at 30 June 12(a)(b) 19,201,674 29,766,000 22,267,081 11,214,400
________________________________________________________________________________________Page 2.2

Town of Cambridge
Rate Setting Budget
For the Year Ending 30 June 2014
Actual Budget Est. Actual Budget
2011/2012 2012/2013 30 Jun 2013 2013/2014
$ $ $ $
REVENUE
General Purpose Funding (Excluding Rates) (3,130,930) (2,015,800) (2,472,918) (2,296,000)
Governance (100,231) (95,000) (94,790) (54,000)
Law, Order and Public Safety (57,530) (55,500) (75,713) (73,800)
Health (57,755) (57,900) (60,575) (51,000)
Education and Welfare (1,006,651) (1,019,500) (1,053,104) (1,076,100)
Community Amenities (2,109,852) (2,489,000) (2,262,685) (2,560,000)
Recreation and Culture (8,514,467) (9,471,700) (9,441,861) (9,548,500)
Transport (1,853,830) (1,946,300) (1,888,785) (2,364,000)
Economic Services (690,603) (567,000) (436,460) (465,000)
Other Property and Services (189,822) (119,700) (52,497) (62,500)
(17,711,671) (17,837,400) (17,839,388) (18,550,900)
LESS: EXPENDITURE
General Purpose Funding 613,004 588,300 573,217 594,400
Governance 1,415,853 1,522,400 1,467,569 1,730,000
Law, Order and Public Safety 1,003,991 1,464,000 1,442,716 1,480,400
Health 438,678 470,800 452,368 501,000
Education and Welfare 1,425,496 1,575,800 1,532,873 1,704,500
Community Amenities 5,405,331 5,626,700 5,149,360 5,886,600
Recreation and Culture 15,778,146 16,980,200 16,915,978 17,285,000
Transport 6,750,877 7,254,900 6,985,285 7,748,900
Economic Services 629,915 672,400 647,345 600,500
Other Property and Services 1,930,651 1,962,600 2,113,519 2,023,400
35,391,942 38,118,100 37,280,232 39,554,700
(Increase)/Decrease 17,680,271 20,280,700 19,440,844 21,003,800
ADD:
Contributions for the development of assets 6,950,171 7,682,700 6,306,632 4,248,500
Proceeds from sale of assets 2,752,577 18,301,500 7,925,788 27,651,900
Depreciation written back 5,800,516 5,936,500 5,791,125 5,955,500
Investments in Mindarie and Tamala Park 166,521
Interest Capitalised - Southport Street 4,714
Deferred Rates (Non Current) (396,276)
Provision for Employee Long Service Leave (309,386)
14,968,837 31,920,700 20,023,545 37,855,900
(Increase)/Decrease 2,711,434 (11,640,000) (582,701) (16,852,100)
LESS: CAPITAL PROGRAM
Land 998,591 3,000,000 75,627 0
Buildings 486,169 10,878,800 11,183,505 34,507,700
Furniture and equipment 447,101 676,000 598,528 1,590,000
Plant and equipment 1,780,880 752,000 738,438 970,600
Infrastructure :
- parks and reserves 4,125,829 2,787,200 1,207,194 3,078,500
- roads and lanes 3,897,218 5,597,100 2,714,355 5,345,000
- drainage 952,356 847,000 254,462 1,199,400
- footpaths 1,010,812 1,213,300 953,351 2,025,800
- bus shelters 24,997 28,000 2,120 50,900
- work in progress 1,623,619
Ocean Mia Development Costs capitalised 40,078
Repayment of Debt Principal 89,044 334,500 130,206 346,900
Transfers to Reserves 3,253,161 6,894,100 6,990,446 1,825,500
Transfers to Endowment Lands Account 1,381,469 12,917,700 2,380,751 27,090,000
20,111,324 45,925,700 27,228,983 78,030,300
PLUS: FUNDING SOURCES
Reserves Utilised 3,047,531 3,387,500 2,624,417 3,402,500
Endowment Lands Account Utilised 1,125,438 3,581,500 2,231,091 29,958,600
Loans 990,000 3,413,100 114,422 338,100
Opening Funds 3,475,923 4,373,600 4,373,600 6,190,100
Less: Closing Funds (4,065,032) (6,190,100)
4,573,860 14,755,700 3,153,431 39,889,300
TO BE MADE UP FROM RATES (18,248,898) (19,530,000) (23,492,851) (21,288,900)
RATES RAISED (18,248,898) (19,530,000) (19,490,687) (20,879,900)
DIFFERENCE 0 0 (4,002,165) (409,000)
_________________________________________________________________________________________________________
Page 2.3

Town of Cambridge
Rating Information
For the Year Ending 30 June 2013
No. Rateable Rate in $ Yield No. Rateable Min Rate Yield No. Rateable Yield
Value $ $0.00 $ Value $ $ $ Value $ $
2013/2014 Budget
General Rate - Gross Rental Value
Residential 6.8103 cents in the dollar 5,027 106,067,500 7.26194 7,635,200 962 9,349,500 883 849,400 5,989 115,417,000 8,484,600
Commercial 6.8103 cents in the dollar 425 30,117,100 7.26194 2,168,000 13 114,000 883 11,500 438 30,231,100 2,179,500
Interim Rates 183,100
Written Off
5,452 136,184,600 9,803,200 975 9,463,500 860,900 6,427 145,648,100 10,847,200
General Rate - Unimproved Value
Residential 0.2024 cents in the dollar 4,410 4,557,720,000 0.175697 9,845,200 103 17,850,000 883 90,900 4,513 4,575,570,000 9,936,100
Commercial 0.2024 cents in the dollar 10 36,100,000 0.175697 78,000 2 528,000 883 1,800 12 36,628,000 79,800
Interim Rates 16,800
Written Off
4,420 4,593,820,000 9,923,200 105 18,378,000 92,700 4,525 4,612,198,000 10,032,700
Total Rates Levied 9,872 19,726,400 1080 953,600 10,952 20,879,900
2012/2013 Budget
General Rate - Gross Rental Value
Residential 6.8103 cents in the dollar 4,948 102,835,700 7.26194 7,003,400 952 9,239,000 836 795,900 5,900 112,074,700 7,799,300
Commercial 6.8103 cents in the dollar 423 29,826,900 7.26194 2,031,300 13 114,000 836 10,900 436 29,940,900 2,042,200
Interim Rates 196,000
Written Off
5,371 132,662,600 9,034,700 965 9,353,000 806,800 6,336 142,015,600 10,037,500
General Rate - Unimproved Value
Residential 0.2024 cents in the dollar 4,406 4,609,180,000 0.175697 9,329,900 103 18,100,000 836 86,100 4,509 4,627,280,000 9,416,000
Commercial 0.2024 cents in the dollar 10 28,660,000 0.175697 58,000 2 528,000 836 1,700 12 29,188,000 59,700
Interim Rates 16,000
Written Off
4,416 4,637,840,000 9,387,900 105 18,628,000 87,800 4,521 4,656,468,000 9,491,700
Total Rates Levied 9,787 18,422,600 1,070 894,600 10,857 19,529,200
Note: Independent Retirement Living Accomodation are now shown as sepearate properties and account (in part) for the increase in th enumber of properties.
General Rates Minimum Rates Total Rates
_________________________________________________________________________________________________________________________________________________Page 2.4

Town of Cambridge Budget Notes
Page 2.5
1. SIGNIFICANT ACCOUNTING POLICIES
The significant accounting policies which have been adopted in the preparation of this budget are:
(a) Basis of Preparation
The budget and financial report has been prepared to comply with applicable Australian Accounting Standards (as they apply to local governments and not for profit entities) and disclosure requirements of the Local Government Act 1995 and Local Government (Financial Management) Regulations 1996. The budget and financial report has been prepared on the accrual basis under the convention of historical cost accounting as modified by the accounting treatment relating to the revaluation of financial assets and liabilities at fair value through profit and loss and certain classes of non-current assets.
Critical Accounting Estimates The preparation of a budget and financial report in conformity with Australian Accounting Standards
requires management to make judgments, estimates and assumptions that effect the application of policies and reported amounts of assets and liabilities, income and expenses.
The estimates and associated assumptions are based on historical experience and various other factors
that are believed to be reasonable under the circumstances. The results of this experience and other factors combine to form the basis of making judgments about carrying values of assets and liabilities not readily apparent from other sources. Actual results may differ from these estimates.
(b) The Local Government Reporting Entity
All Funds through which the Council controls resources to carry on its functions have been included in the budget. In the process of reporting on the local government as a single unit, all transactions and balances between those Funds (for example, loans and transfers between Funds) have been eliminated. All monies held in the Trust Fund are excluded from the budget, but a separate statement of those monies appears at Note 20 of this budget.
(c) Property, Plant and Equipment
(i) Capitalisation of Non-Current Assets Property, plant and equipment acquired during the reporting period are brought to account at cost
or if acquired other than by purchase, at fair value. Fixed assets other than infrastructure assets are capitalised if the cost exceeds $1,000.
Infrastructure assets are capitalised if the cost or valuation exceeds the following for each type of infrastructure. Parks and Reserves $10,000 Roads and Lanes $10,000 Drainage $10,000 Footpaths $ 2,000 Bus Shelters $ 2,000 Underpasses $10,000 The Chief Executive Officer or nominee has discretion to capitalise assets with a value less than $1,000 having regard to the nature of the item.

Town of Cambridge Budget Notes
Page 2.6
1. SIGNIFICANT ACCOUNTING POLICIES (continued)
(ii) Non-Current Assets
All assets are initially recognised at cost. Cost is determined as the fair value of the assets given as consideration plus costs incidental to the acquisition. For assets acquired at no cost or for nominal consideration, cost is determined as fair value at the date of acquisition. The cost of non current assets constructed by the Council includes the cost of all materials used in construction, direct labour on the project and an appropriate proportion of variable and fixed overhead.
(iii) Depreciation of Non-Current Assets
All non-current assets having a limited useful life (i.e. excluding freehold land) are systematically depreciated over their estimated useful lives in a manner which reflects the consumption of the service potential embodied in those assets. Depreciation is recognised on a straight-line basis, using rates which are reviewed each reporting period. The major depreciation periods are:-
CATEGORY USEFUL LIFE DEPRECIATION
RATE Buildings - General 40 Years 2.5% - Minor 10 Years 10% Office Furniture and Equipment - Furniture 5-10 Years 20%-10% - Non Electrical Equipment 10 Years 10% - Electrical Equipment 4 Years 25% - Computer Equipment and Software 3 Years 33.3% External Plant and Equipment - Mobile Plant 3-10 Years 33.3%-10% - Light Fleet 5-10 Years 20%-10% - Fixed Plant 10 Years 10% - Equipment 3-5 Years 33.3%-20% Infrastructure - Parks and Reserves 5-75 Years 20%-1.5% - Roads and Lanes 20-50 Years 5%-2% - Drainage 50-75 Years 2%-1.3% - Footpaths 50 Years 2% - Bus Shelters 20 Years 5% - Underpasses 60 Years 1.6%
Assets are depreciated from the date of acquisition or, in respect of internally constructed assets, from the time an asset is completed and held ready for use.
(d) Land Under Roads Acquired on or before 30 June 2008 – Council has elected not to recognise the value of lands under roads acquired on or before 30 June 2008
in accordance with AASB 1051. Acquired on or before 1 July 2008 – Land under roads acquired after 30 June 2008 is accounted for in accordance with AASB 116 –
Property, Plant and Equipment. However, Local Government (Financial Management) Regulation 16 prohibits the recognition of land under roads as asset that is crown land, but vested under the control or management of the local government.
Local Government (Financial Management) Regulation 4 states that where the Accounting Standard is
inconsistent with the provisions of the regulations, the provisions of the regulations prevail to the extent of that inconsistency.
Town of Cambridge Budget Notes
Page 2.7
1. SIGNIFICANT ACCOUNTING POLICIES (continued) Consequently, any land under roads acquired on or after 1 July 2008 is not included as an asset of the
Council. (e) Rates, Grants, Donations and Other Contributions
Rates, grants, donations and other contributions are recognised as revenues when the Council obtains control over the assets comprising the contributions.
The rating and reporting periods of the Council coincide. All rates levied for the year are recognised as revenues. All outstanding rates are collectable and therefore, no provision will be made for doubtful debts. Provision for other bad and doubtful debts is made where considered necessary.
Control over granted assets is normally obtained upon their receipt. Unreceived contributions over which the Council has no control are not recognised as receivables. Where conditional contributions are received in advance and therefore recognised as revenues in that accounting period and the conditions on which those funds are to be expended are undischarged as at the reporting date, the nature of and amounts pertaining to those undischarged conditions are disclosed in the notes to the budget. Contributions received in advance and subject to undischarged conditions are classified as “Restricted Assets” and reported separately in the notes accompanying the budget. These notes also disclose the amount of contributions recognised as revenues in a previous reporting period which were obtained in respect of the Council's operations for the current reporting period.
(f) Cash and Cash Equivalents
Items described in the Balance Sheet as “Cash and Cash Equivalents” include short term fixed, at-call deposits of cash that are readily convertible to known amounts of cash and which are subject to an insignificant risk of changes in value and cash managed funds held with banks or other authorised financial institutions. The Council holds no bonds or shares. All investments (excluding cash managed funds) are valued at cost and interest earnings on those investments are recognised as revenue as they accrue.
(g) Inventories
Inventories are valued at the lower of cost and net realisable value. Net realisable value is the estimated selling price in the ordinary course of business less the estimated costs of completion and the estimated costs necessary to make the sale. Inventories held from trading are classified as current even if not expected to be realised in the next twelve months.
(h) Land Held for Resale Land held for development and/or resale is valued at the lower of cost and net realisable value. Cost
includes the cost of development and interest incurred on the financing of that land during its development. Interest and holding charges incurred after development is complete are recognised as expenses.
Revenue arising from the sale of property is recognised in the Income Statement as at the time of signing a binding contract of sale
Land held for resale is classified as current except where it is held as non-current based on Council’s intentions to release for sale.

Town of Cambridge Budget Notes
Page 2.8
1. SIGNIFICANT ACCOUNTING POLICIES (continued) (i) Investments and Other Financial Assets
Classification Council classifies its investments in the following categories: financial assets at fair value through profit or loss, loans and receivables, held-to-maturity investments and available-for-sale financial assets. The classification depends on the purpose for which the investments were acquired. Management determines the classification of its investments at initial recognition and, in the case of assets classified as held-to-maturity, re-evaluates this designation at each reporting date.
(i) Financial assets at fair value through profit and loss
Financial assets at fair value through profit or loss are financial assets held for trading. A financial asset is classified in this category if acquired principally for the purpose of selling in the short term. Derivatives are classified as held for trading unless they are designated as hedges. Assets in this category are classified as current assets.
(ii) Loans and receivables
Loans and receivables are non-derivative financial assets with fixed or determinable payments that are not quoted in an active market. They are included in current assets, except for those with maturities greater than 12 months after the balance sheet date which are classified as non-current assets. Loans and receivables are included in trade and other receivables in the balance sheet.
(iii) Held-to-maturity investments
Held-to-maturity investments are non-derivative financial assets with fixed or determinable payments and fixed maturities that the Council’s management has the positive intention and ability to hold to maturity. If Council were to sell other than an insignificant amount of held-to-maturity financial assets, the whole category would be tainted and reclassified as available-for-sale. Held-to-maturity financial assets are included in non-current assets, except for those with maturities less than 12 months from the reporting date, which are classified as current assets.
(iv) Available-for-sale financial assets
Available-for-sale financial assets, comprising principally marketable equity securities, are non-derivatives that are either designated in this category or not classified in any of the other categories. They are included in non-current assets unless management intends to dispose of the investment within 12 months of the balance sheet date. Investments are designated as available-for-sale if they do not have fixed maturities and fixed or determinable payments and management intends to hold them for the medium to long term.
Recognition and derecognition Regular purchases and sales of financial assets are recognised on trade-date – the date on which Council commits to purchase or sell the asset. Investments are initially recognised at fair value plus transaction costs for all financial assets not carried at fair value through profit or loss. Financial assets carried at fair value through profit or loss are initially recognised at fair value and transaction costs are expensed in the income statement. Financial assets are derecognised when the rights to receive cash flows from the financial assets have expired or have been transferred and Council has transferred substantially all the risks and rewards of ownership. When securities classified as available-for-sale are sold, the accumulated fair value adjustments recognised in equity are included in the income statement as gains and losses from investment securities.
Town of Cambridge Budget Notes
Page 2.9
1. SIGNIFICANT ACCOUNTING POLICIES (continued) Subsequent measurement Loans and receivables and held-to-maturity investments are carried at amortised cost using the effective interest method. Available-for-sale financial assets and financial assets at fair value through profit and loss are subsequently carried at fair value. Gains or losses arising from changes in the fair value of the financial assets at fair value through profit or loss category are presented in the income statement within other income or other expenses in the period in which they arise. Dividend income from financial assets at fair value through profit and loss is recognised in the income statement as part of revenue from continuing operations when Council’s right to receive payments is established. Changes in the fair value of other monetary and non-monetary securities classified as available-for-sale are recognised in equity.
Impairment Council assesses at each balance date whether there is objective evidence that a financial asset or group of financial assets is impaired. In the case of equity securities classified as available-for-sale, a significant or prolonged decline in the fair value of a security below its cost is considered as an indicator that the securities are impaired. If any such evidence exists for available-for-sale financial assets, the cumulative loss - measured as the difference between the acquisition cost and the current fair value, less any impairment loss on that financial asset previously recognised in profit or loss - is removed from equity and recognised in the income statement. Impairment losses recognised in the income statement on equity instruments classified as available-for-sale are not reversed through the income statement.
(j) Estimation of Fair Value
The fair value of financial assets and financial liabilities must be estimated for recognition and measurement or for disclosure purposes. The fair value of financial instruments traded in active markets is based on quoted market prices at the balance sheet date. The fair value of financial instruments that are not traded in an active market is determined using valuation techniques. Council uses a variety of methods and makes assumptions that are based on market conditions existing at each balance date. These include the use of recent arm’s length transactions, reference to other instruments that are substantially the same, discounted cash flow analysis, and option pricing models making maximum use of market inputs and relying as little as possible on entity-specific inputs. Quoted market prices or dealer quotes for similar instruments are used for long-term debt instruments held. Other techniques, such as estimated discounted cash flows, are used to determine fair value for the remaining financial instruments. The nominal value less estimated credit adjustments of trade receivables and payables are assumed to approximate their fair values. The fair value of financial liabilities for disclosure purposes is estimated by discounting the future contractual cash flows at the current market interest rate that is available to the Council for similar financial instruments.
(k) Impairment of Assets
In accordance with Australian Accounting Standards the Council's assets, other than inventories, are assessed at each reporting date to determine whether there is any indication they may be impaired. Where such an indication exists, an estimate of the recoverable amount of the asset is made in accordance with AASB 136 'Impairment of Assets' and appropriate adjustments made. An impairment loss is recognised whenever the carrying amount of an asset or its cash generating unit exceeds its recoverable amount. Impairment losses are recognised in the Income Statement. For non-cash generating assets such as roads, drains, public buildings and the like, value in use is represented by the depreciated replacement cost of the asset.
Town of Cambridge Budget Notes
Page 2.10
1. SIGNIFICANT ACCOUNTING POLICIES (continued)
(l) Employee Entitlements
(i) Leave Entitlements
The provision for employee benefits relates to the amounts expected to be paid for annual leave and long service leave and are calculated as follows: Annual Leave and Long Service Leave (Short Term Benefits) The provision for employee benefits to annual leave and long service leave expected to be settled in 12 months represents the amount that the Town of Cambridge has a present obligation to pay resulting from employees services provided to balance date.
The provisions have been calculated based on remuneration rates the Council expects to pay and includes related on-costs. Long Service Leave (Long Term Benefits) The provision for employee benefits to long service leave expected to be settled in more than 12 months represents the present value of the estimated future outflows to be made by the employer resulting from the employees’ service to balance date using the projected unit credit method. Consideration is given to expected future wage and salary levels, experience of employee departures and periods of service. Expected future payments are discounted using market yields at balance date on national government bonds with terms to maturity and currency that match as closely as possible, the estimated future cash outflows. Where the Council does not have the unconditional right to defer settlement beyond 12 months, the liability is recognised as a current liability. In respect of employees who have transferred to the Town of Cambridge from other Local Government Authorities, Council's liability for long service leave is recorded in the statement of financial position net of contributions due from other Local Government Authorities.
(ii) Superannuation The Council meets the statutory requirements of the Superannuation Guarantee Act by contributing the minimum 9% to the WA Local Government Superannuation Plan or the City of Perth Superannuation Scheme depending on the employee's membership status. The Council also contributes an additional 4% to the WA Local Government Superannuation Plan and an additional 5% to the City of Perth Superannuation Scheme where voluntary contributions are made by employees. The Council contributions are charged against revenue in the financial years to which the payments relate.
(m) Interest-bearing Loans and Borrowings
All loans and borrowings are initially recognised at the fair value of the consideration received less directly attributable transaction costs. Borrowings are classified as current liabilities unless the Council has an unconditional right to defer settlement of the liability for at least 12 months after the balance sheet date.
(n) Trade and Other Payables
Trade payables and other payables are carried at amortised cost. They are recognised when the Town becomes obliged to make future payments resulting from the purchase of goods and services. The amounts are unsecured and are usually paid within thirty days of recognition.

Town of Cambridge Budget Notes
Page 2.11
1. SIGNIFICANT ACCOUNTING POLICIES (continued)
(o) Provisions
Provisions are recognised when: The council has a present legal or constructive obligation as a result of past events; it is more likely than not that an outflow of resources will be required to settle the obligation; and the amount has been reliably estimated. Provisions are not recognised for future operating losses. Where there are a number of similar obligations, the likelihood that an outflow will be required in settlement is determined by considering the class of obligations as a whole. A provision is recognised even if the likelihood of an outflow with respect to any one item included in the same class of obligations may be small.
(p) Trade and other Receivables Trade receivables, which generally have 30 - 90 day terms, are recognised in balance sheet at cost. Collectability of trade receivables is reviewed on an ongoing basis. Debts that are known to be
uncollectable are written off when identified. A provision for impairment of receivables is raised when there is objective evidence that they will not be collectable.
(q) Borrowing Costs
Borrowing costs are recognised as an expense when incurred except where they are directly attributable to the acquisition, construction or production of a qualifying asset. Where this is the case, they are capitalised as part of the cost of the particular asset.
(r) Rounding
All figures shown in the budget, other than a rate in the dollar are rounded to the nearest $100 for budget items and to the nearest ($) for actual results. Some minor variations between Schedules may result.
(s) Comparatives
Comparative figures are, where appropriate, reclassified as to be comparable with the figures presented for the current budget year. Unless otherwise stated, the budget comparative figures shown in this budget document relate to the original budget estimates for the relevant item of disclosure.
(t) Interest in Joint Venture
The Council is a participant in both the Mindarie Regional Council and Tamala Park Regional Council with six other Councils, namely the Cities of Joondalup, Wanneroo, Stirling, Perth and the Town's of Vincent and Victoria Park. Interest in Joint Venture is accounted for by applying the equity method. Under this method of accounting interest in a jointly controlled entity is initially recorded at cost and adjusted thereafter for the post acquisition change in the venturer’s share of net assets of the jointly controlled entity.
(u) Variance from Budget
Variations arising during the 2013/2014 financial year between budget and actual results exceeding $30,000 as a permanent variance or $100,000 as a timing variance from year to date budget will be considered to be material in accordance with AASB 1031 and reported upon to Council on a monthly basis together with explanations for such variations arising.
Town of Cambridge Budget Notes
Page 2.12
2. FUNCTIONS/ACTIVITIES
In order to discharge its responsibilities to the community, the Council has developed a set of operational and financial objectives. These objectives have been established both on an overall basis reflected by the Council’s Strategic Plan and for each of its broad activities/programs. These objectives provide a framework for the future direction of the Town of Cambridge.
These objectives have been established from the strategic direction set by Council, whose vision is to create communities of choice. Encapsulating this vision, it is the Town’s aim to:
• Promote a sense of community;
• Plan for active centres of recreation, shopping and business
• Provide attractive and inviting public spaces
• Ensure an accessible community with emphasis on local
The four key areas that align the strategic direction to the activities and programs of the Town are:
1. Planning for our community 2. Delivering our services 3. Environmental leadership and 4. Capacity to deliver
The Operating Statements are presented in a program format using the following classifications:-
(a) General Purpose Funding General rate revenue, interest for late payment, ex gratia rates, general purpose grants, untied road grants, interest on deferred rates, investment returns.
(b) Governance Members of Council, civic receptions and functions, public relations, electoral, administration, finance.
(c) Law, Order and Public Safety Fire prevention, including the Emergency Services Levy, clearing for fire hazards, animal control, dog pound, local law control, public security, civil emergency services, beach inspections, surf lifesaving clubs, neighbourhood watch.
(d) Health Maternal and infant health, food control, health inspections.
(e) Education and Welfare Pre-schools, child care centres, aged and disabled services, welfare administration, youth services, donations to welfare organisations.
(f) Community Amenities
Rubbish collections, recycling, refuse site operations, public litter bins, town planning control/studies, environmental management.
(g) Recreation and Culture Public halls, civic centres, beaches and swimming pool, golf complex, parks, sports grounds, sports clubs, community recreation programs, library, community arts program, amphitheatre.

Town of Cambridge Budget Notes
Page 2.13
2. FUNCTIONS/ACTIVITIES (Continued)
(h) Transport Roads, footpaths, rights of way, drainage, road verges, median strips, underpasses, street lighting, street cleaning, street trees, traffic surveys, traffic management, depot, underground power.
(i) Economic Services Building control, swimming pool inspections.
(j) Other Property and Services Public works overheads, plant/vehicle operations, other property.
3. OPERATING REVENUE AND EXPENDITURE
Classified by Nature and Type
Budget Budget 2012/2013 2013/2014 Operating Revenue
Rates $19,530,000 $20,879,900
Operating Grants,Subsidies and Contributions $1,618,800 $2,315,100
Non Operating Grants,Subsidies and Contributions $7,682,700 $4,268,500
Profit on asset disposals $14,960,700 $24,537,200
Fees and charges $14,286,800 $14,611,300
Interest earnings $1,482,400 $1,259,000
Other revenue/income $449,400 $345,500
$60,010,800 $68,216,500 EXPENDITURE
Employee costs $15,361,100 $16,775,300
Materials and contracts $12,341,500 $12,139,300
Utilities (gas, electricity, water etc.) $2,378,400 $2,665,000
Depreciation on non-current assets $5,936,500 $5,955,500
Interest expenses $937,300 $758,200
Insurance expenses $354,900 $404,400
Other Expenditure $903,000 $857,000
Loss on disposal of assets $104,500 $151,500
$38,317,200 $39,706,200 Change in net assets resulting from operations $21,693,600 $28,510,300
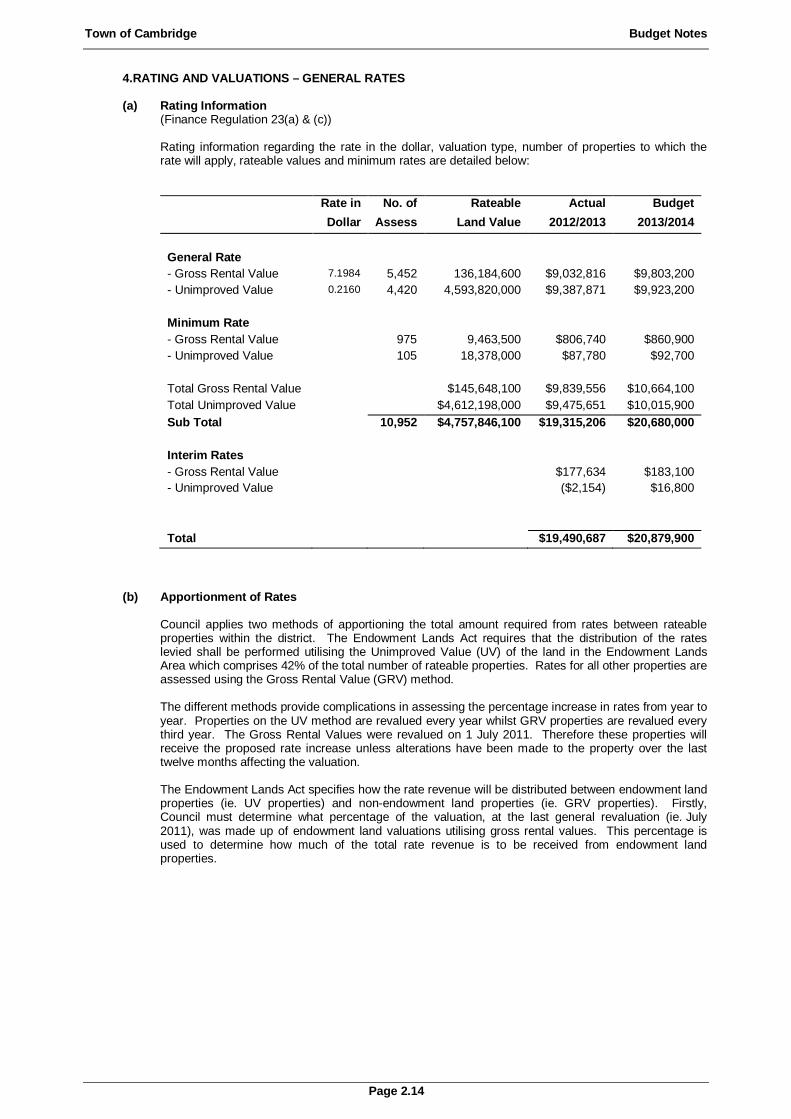
Town of Cambridge Budget Notes
Page 2.14
4. RATING AND VALUATIONS – GENERAL RATES
(a) Rating Information (Finance Regulation 23(a) & (c))
Rating information regarding the rate in the dollar, valuation type, number of properties to which the rate will apply, rateable values and minimum rates are detailed below:
Rate in No. of Rateable Actual Budget Dollar Assess Land Value 2012/2013 2013/2014 General Rate
- Gross Rental Value 7.1984 5,452 136,184,600 $9,032,816 $9,803,200
- Unimproved Value 0.2160 4,420 4,593,820,000 $9,387,871 $9,923,200
Minimum Rate
- Gross Rental Value 975 9,463,500 $806,740 $860,900
- Unimproved Value 105 18,378,000 $87,780 $92,700
Total Gross Rental Value $145,648,100 $9,839,556 $10,664,100
Total Unimproved Value $4,612,198,000 $9,475,651 $10,015,900
Sub Total 10,952 $4,757,846,100 $19,315,206 $20,680,000
Interim Rates
- Gross Rental Value $177,634 $183,100
- Unimproved Value ($2,154) $16,800
Total $19,490,687 $20,879,900
(b) Apportionment of Rates
Council applies two methods of apportioning the total amount required from rates between rateable properties within the district. The Endowment Lands Act requires that the distribution of the rates levied shall be performed utilising the Unimproved Value (UV) of the land in the Endowment Lands Area which comprises 42% of the total number of rateable properties. Rates for all other properties are assessed using the Gross Rental Value (GRV) method. The different methods provide complications in assessing the percentage increase in rates from year to year. Properties on the UV method are revalued every year whilst GRV properties are revalued every third year. The Gross Rental Values were revalued on 1 July 2011. Therefore these properties will receive the proposed rate increase unless alterations have been made to the property over the last twelve months affecting the valuation. The Endowment Lands Act specifies how the rate revenue will be distributed between endowment land properties (ie. UV properties) and non-endowment land properties (ie. GRV properties). Firstly, Council must determine what percentage of the valuation, at the last general revaluation (ie. July 2011), was made up of endowment land valuations utilising gross rental values. This percentage is used to determine how much of the total rate revenue is to be received from endowment land properties.
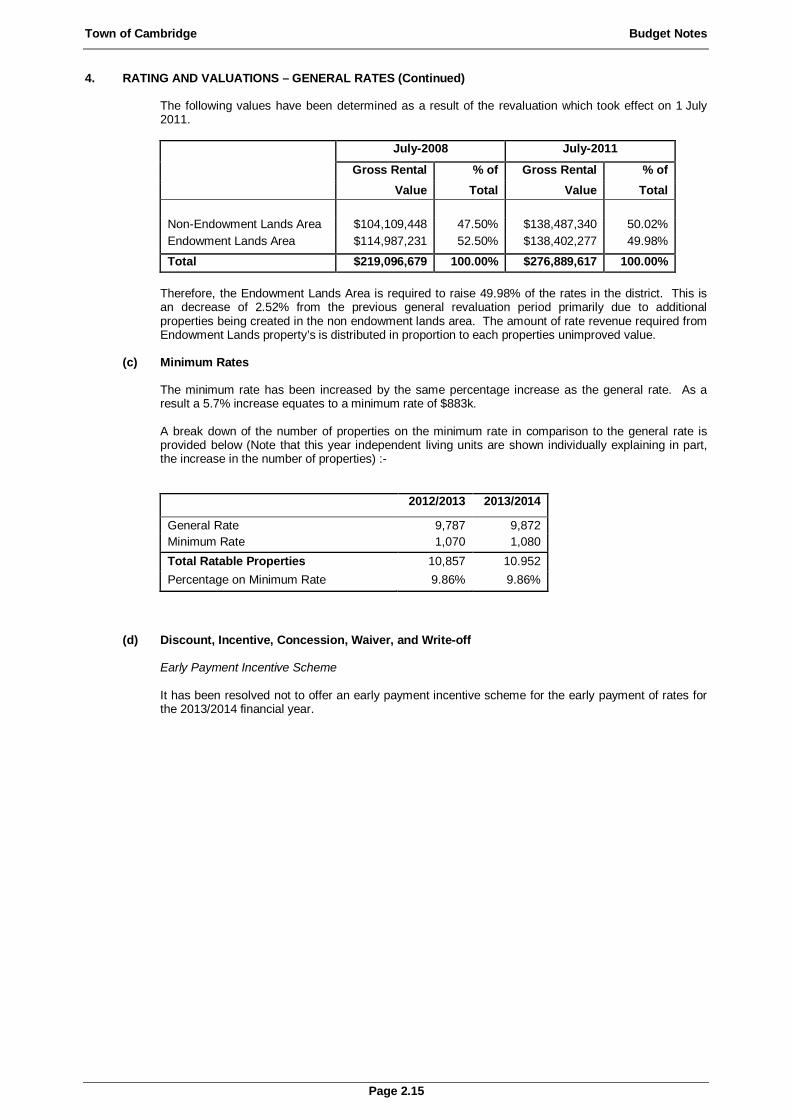
Town of Cambridge Budget Notes
Page 2.15
4. RATING AND VALUATIONS – GENERAL RATES (Continued)
The following values have been determined as a result of the revaluation which took effect on 1 July 2011.
July-2008 July-2011
Gross Rental % of Gross Rental % of Value Total Value Total
Non-Endowment Lands Area $104,109,448 47.50% $138,487,340 50.02%
Endowment Lands Area $114,987,231 52.50% $138,402,277 49.98%
Total $219,096,679 100.00% $276,889,617 100.00%
Therefore, the Endowment Lands Area is required to raise 49.98% of the rates in the district. This is an decrease of 2.52% from the previous general revaluation period primarily due to additional properties being created in the non endowment lands area. The amount of rate revenue required from Endowment Lands property’s is distributed in proportion to each properties unimproved value.
(c) Minimum Rates
The minimum rate has been increased by the same percentage increase as the general rate. As a result a 5.7% increase equates to a minimum rate of $883k. A break down of the number of properties on the minimum rate in comparison to the general rate is provided below (Note that this year independent living units are shown individually explaining in part, the increase in the number of properties) :-
2012/2013 2013/2014
General Rate 9,787 9,872
Minimum Rate 1,070 1,080
Total Ratable Properties 10,857 10.952
Percentage on Minimum Rate 9.86% 9.86%
(d) Discount, Incentive, Concession, Waiver, and Write-off
Early Payment Incentive Scheme It has been resolved not to offer an early payment incentive scheme for the early payment of rates for the 2013/2014 financial year.
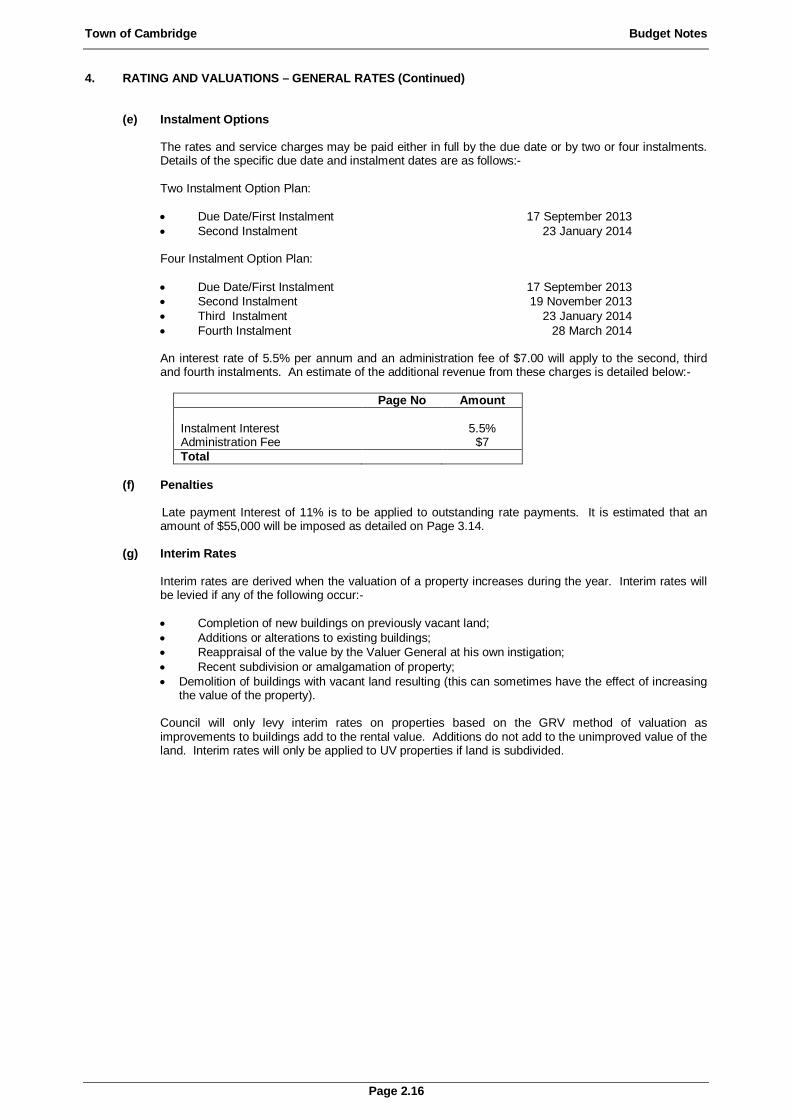
Town of Cambridge Budget Notes
Page 2.16
4. RATING AND VALUATIONS – GENERAL RATES (Continued)
(e) Instalment Options
The rates and service charges may be paid either in full by the due date or by two or four instalments. Details of the specific due date and instalment dates are as follows:- Two Instalment Option Plan:
• Due Date/First Instalment 17 September 2013
• Second Instalment 23 January 2014
Four Instalment Option Plan:
• Due Date/First Instalment 17 September 2013
• Second Instalment 19 November 2013
• Third Instalment 23 January 2014
• Fourth Instalment 28 March 2014 An interest rate of 5.5% per annum and an administration fee of $7.00 will apply to the second, third and fourth instalments. An estimate of the additional revenue from these charges is detailed below:-
Page No Amount Instalment Interest 5.5% Administration Fee $7
Total
(f) Penalties
Late payment Interest of 11% is to be applied to outstanding rate payments. It is estimated that an amount of $55,000 will be imposed as detailed on Page 3.14.
(g) Interim Rates
Interim rates are derived when the valuation of a property increases during the year. Interim rates will be levied if any of the following occur:-
• Completion of new buildings on previously vacant land;
• Additions or alterations to existing buildings;
• Reappraisal of the value by the Valuer General at his own instigation;
• Recent subdivision or amalgamation of property;
• Demolition of buildings with vacant land resulting (this can sometimes have the effect of increasing the value of the property).
Council will only levy interim rates on properties based on the GRV method of valuation as improvements to buildings add to the rental value. Additions do not add to the unimproved value of the land. Interim rates will only be applied to UV properties if land is subdivided.

Town of Cambridge Budget Notes
Page 2.17
5. FEES AND CHARGES (To be updated)
(a) Schedule of Fees and Charges (Finance Regulation 22(1)(g) A schedule of fees and charges adopted by the Town and used in the preparation of the budget is attached at schedule 7.
(b) Summary of Revenue from Fees and Charges (Finance Regulation 25) An estimate of the total revenue from fees and charges included in the budget by program is detailed below:-
Program Budget Budget 2012/2013 2013/2014 General Purpose Funding $75,000 $79,000
Governance $45,000 $44,000
Law, Order & Public Safety $53,000 $58,400
Health $57,000 $50,400
Education & Welfare $125,000 $126,000
Community Amenities $2,485,500 $2,560,000
Recreation & Culture $9,146,600 $9,266,000
Transport $1,606,000 $1,844,500
Economic Services $560,000 $460,000
Other Property & Services $133,700 $123,000
Total $14,286,800 $14,611,300

Town of Cambridge Budget Notes
Page 2.18
6. CONTRIBUTION/GRANTS
(a) Contributions for the Development of Assets
Contributions for the development of assets is recorded as operating revenue and is brought to account in the Operating Budget under the respective program to which the asset relates. Details of the contributions included in the budget are provided below:
Asset Description Source Amount
Law, Order and Public SafetyCapital GrantSurf Club -City Beach $950,000
$950,000
Capital ContributionCoP Surf Life Saving Club - New Surf Club Premises (includes lotteries grant) $1,110,000
$1,110,000
Education and WelfareCapital ContributionSenior Service Changeover Vehicle $26,500
$26,500
Recreation and CultureCapital GrantDepartment of TransportDepartment of Transport - Upgrade City Beach Groyne State $10,000
Kalinda Dr (Kalari to The Boulevard) State $180,000
Department of Sport and RecreationPool Renewal - CSRFF State $1,000,000
$1,190,000
Capital ContributionReabold Tennis Club - Install Aiir Conditioning - Split System (2) $5,000
$5,000
TransportMain Roads Western Australia (MRWA) - BlackspotGrantham /Crosby - intersection traffic islands MRWA $24,000
Keane Street/Ruislip St - construct roundabout MRWA $140,000
Cambridge St (Northwood to Holyrood) Street Enhancement MRWA $30,000
$194,000
Main Roads Western Australia (MRWA) - RehabilitationCambridge St (McCourt - Kimberley) MRWA $314,000
Lake Monger Dr (Kimberley - Southport) MRWA $277,000
$591,000
Roads to RecoveryMoray Ave (Grantham - Dumfries) Federal $182,000
$182,000
Total $4,248,500
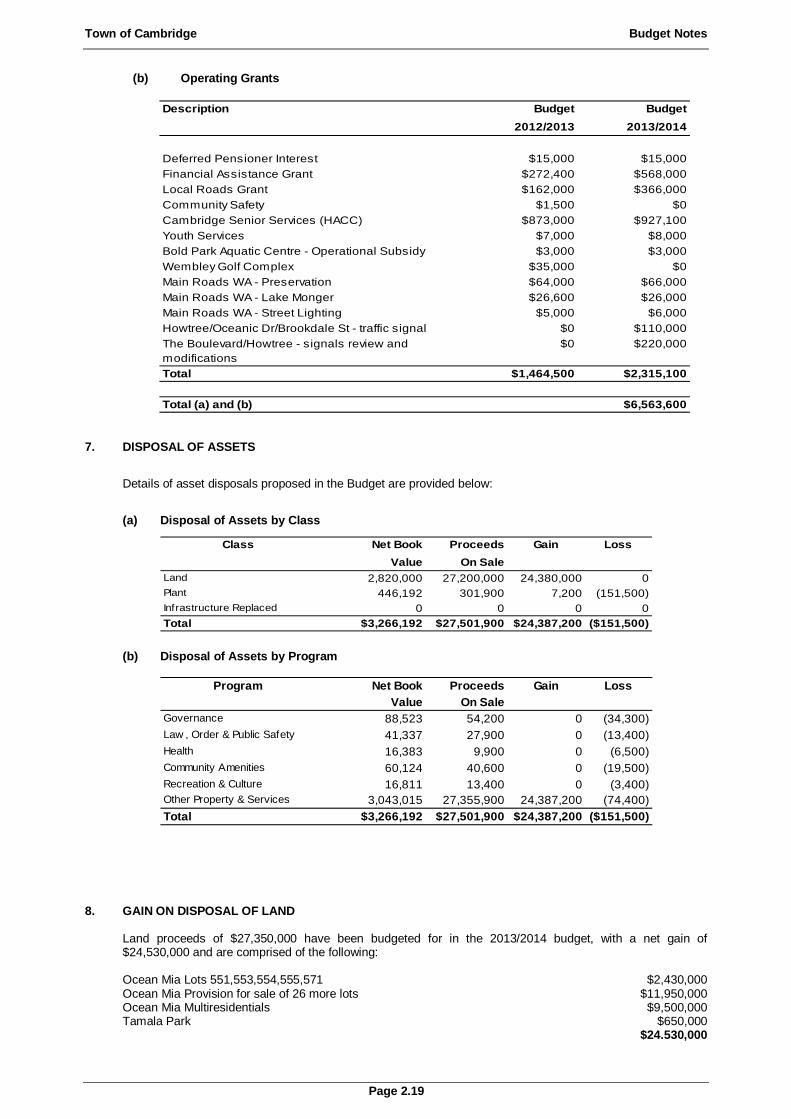
Town of Cambridge Budget Notes
Page 2.19
(b) Operating Grants
Budget Budget2012/2013 2013/2014
Deferred Pensioner Interest $15,000 $15,000
Financial Assistance Grant $272,400 $568,000
Local Roads Grant $162,000 $366,000
Community Safety $1,500 $0
Cambridge Senior Services (HACC) $873,000 $927,100
Youth Services $7,000 $8,000
Bold Park Aquatic Centre - Operational Subsidy $3,000 $3,000
Wembley Golf Complex $35,000 $0
Main Roads WA - Preservation $64,000 $66,000
Main Roads WA - Lake Monger $26,600 $26,000
Main Roads WA - Street Lighting $5,000 $6,000
Howtree/Oceanic Dr/Brookdale St - traffic signal $0 $110,000
$0 $220,000
Total $1,464,500 $2,315,100
Total (a) and (b) $6,563,600
The Boulevard/Howtree - signals review and
modifications
Description
7. DISPOSAL OF ASSETS
Details of asset disposals proposed in the Budget are provided below:
(a) Disposal of Assets by Class
Net Book ProceedsValue On Sale
Land 2,820,000 27,200,000 24,380,000 0
Plant 446,192 301,900 7,200 (151,500)
Infrastructure Replaced 0 0 0 0
Total $3,266,192 $27,501,900 $24,387,200 ($151,500)
Class Gain Loss
(b) Disposal of Assets by Program
Net Book ProceedsValue On Sale
Governance 88,523 54,200 0 (34,300)
Law , Order & Public Safety 41,337 27,900 0 (13,400)
Health 16,383 9,900 0 (6,500)
Community Amenities 60,124 40,600 0 (19,500)
Recreation & Culture 16,811 13,400 0 (3,400)
Other Property & Services 3,043,015 27,355,900 24,387,200 (74,400)
Total $3,266,192 $27,501,900 $24,387,200 ($151,500)
Program Gain Loss
8. GAIN ON DISPOSAL OF LAND
Land proceeds of $27,350,000 have been budgeted for in the 2013/2014 budget, with a net gain of $24,530,000 and are comprised of the following: Ocean Mia Lots 551,553,554,555,571 $2,430,000 Ocean Mia Provision for sale of 26 more lots $11,950,000 Ocean Mia Multiresidentials $9,500,000 Tamala Park $650,000
$24.530,000

Town of Cambridge Budget Notes
Page 2.20
9. CAPITAL WORKS PROGRAM
Capital Works Program by program and class are provided below. Further details are included in the Capital Budget on Page 4.1. (a) Capital Works by Program
Program Budget Budget 2012/2013 2013/2014
Governance $4,105,000 $2,631,300
Education and Welfare $0 $26,500
Community Amenities $196,000 $528,000
Recreation and Culture $13,685,500 $37,163,200
Transport $7,764,700 $8,297,100
Other Property and Services $154,500 $121,800
Total $25,905,700 $48,767,900
(b) Capital Works by Class
Class Budget Budget 2012/2013 2013/2014
Land $3,000,000 $0
Buildings $10,881,800 $34,507,700
Furniture & Equipment $719,000 $1,590,000
Plant & Equipment $752,000 $970,600
Infrastructure – Paris & Reserves $2,788,200 $3,078,500
Infrastructure – Roads & Lanes $5,598,100 $5,345,000
Infrastructure – Drainage $875,000 $1,199,400
Infrastructure – Footpaths $1,263,600 $2,025,800
Infrastructure - Bus Shelters $28,000 $50,900
Total 25,905,700 48,767,900
(c) Uncompleted Works and Services
A detailed list of uncompleted works and services brought forward from the prior year is shown on Page 6.6. The full amount of these works and services has been brought forward to enable the works to be completed in the next financial year. Part of these works is funded from reserves, the Endowment Lands Account, loans or grants. The remainder is funded from the surplus funds from 2012/2013.
A summary of operating and capital works and services carried forward is provided below: Budget 2013/2014 Surplus Reserve Endow
Lands Total
Operating 738,600 65,800 0 804,400
Capital 3,303,500 884,100 639,600 4,827,200
Total 4,042,100 949,900 639,600 5,631,600
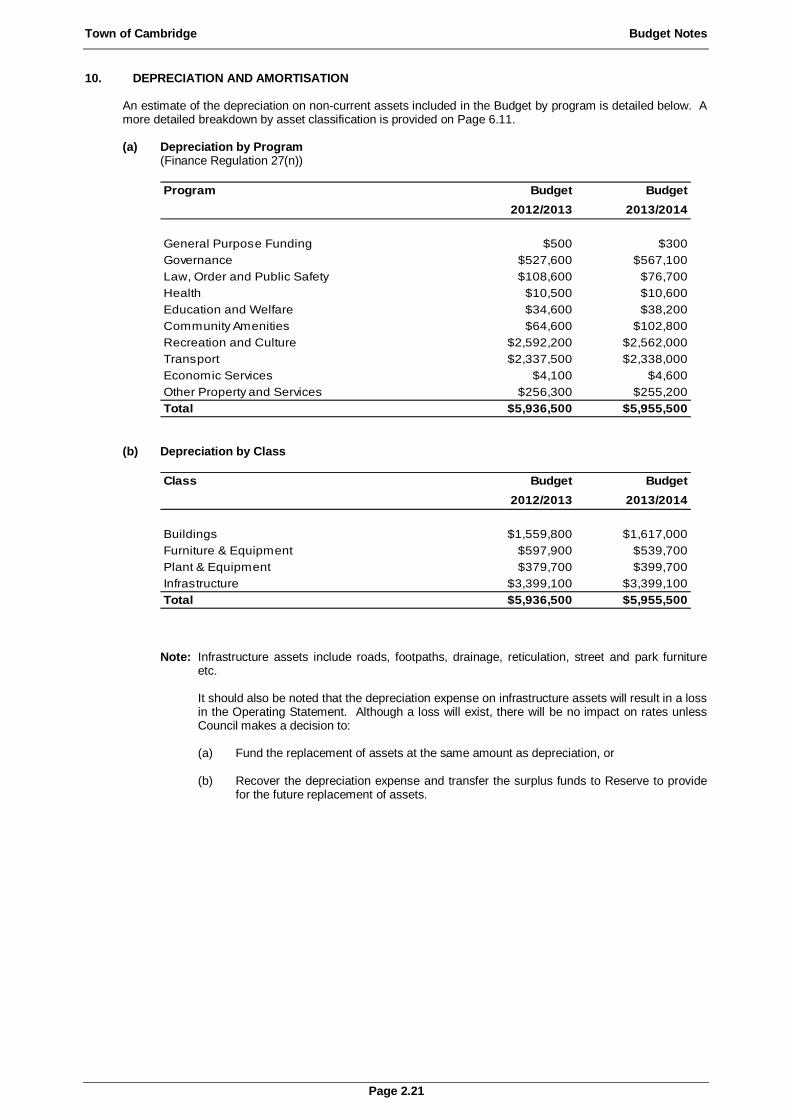
Town of Cambridge Budget Notes
Page 2.21
10. DEPRECIATION AND AMORTISATION
An estimate of the depreciation on non-current assets included in the Budget by program is detailed below. A more detailed breakdown by asset classification is provided on Page 6.11.
(a) Depreciation by Program
(Finance Regulation 27(n))
Budget Budget2012/2013 2013/2014
General Purpose Funding $500 $300
Governance $527,600 $567,100
Law, Order and Public Safety $108,600 $76,700
Health $10,500 $10,600
Education and Welfare $34,600 $38,200
Community Amenities $64,600 $102,800
Recreation and Culture $2,592,200 $2,562,000
Transport $2,337,500 $2,338,000
Economic Services $4,100 $4,600
Other Property and Services $256,300 $255,200
Total $5,936,500 $5,955,500
Program
(b) Depreciation by Class
Budget Budget2012/2013 2013/2014
Buildings $1,559,800 $1,617,000
Furniture & Equipment $597,900 $539,700
Plant & Equipment $379,700 $399,700
Infrastructure $3,399,100 $3,399,100
Total $5,936,500 $5,955,500
Class
Note: Infrastructure assets include roads, footpaths, drainage, reticulation, street and park furniture etc. It should also be noted that the depreciation expense on infrastructure assets will result in a loss in the Operating Statement. Although a loss will exist, there will be no impact on rates unless Council makes a decision to: (a) Fund the replacement of assets at the same amount as depreciation, or (b) Recover the depreciation expense and transfer the surplus funds to Reserve to provide
for the future replacement of assets.
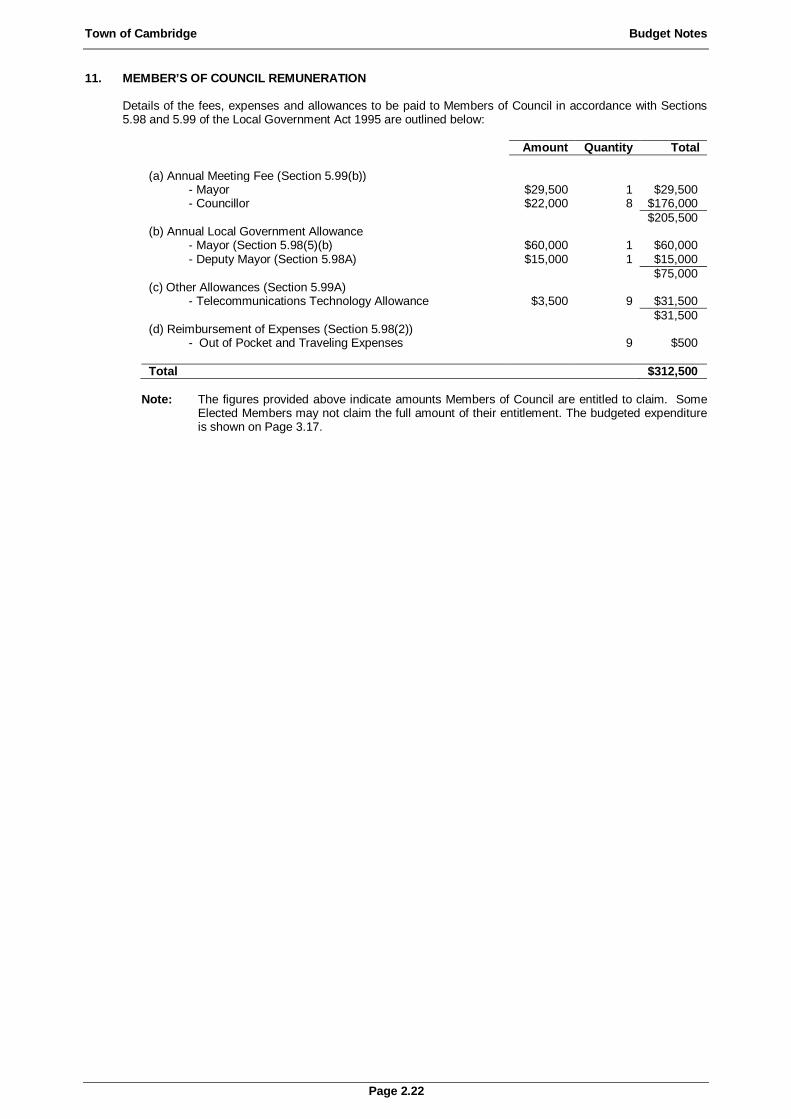
Town of Cambridge Budget Notes
Page 2.22
11. MEMBER’S OF COUNCIL REMUNERATION Details of the fees, expenses and allowances to be paid to Members of Council in accordance with Sections
5.98 and 5.99 of the Local Government Act 1995 are outlined below:
Amount Quantity Total (a) Annual Meeting Fee (Section 5.99(b)) - Mayor $29,500 1 $29,500 - Councillor $22,000 8 $176,000
$205,500 (b) Annual Local Government Allowance - Mayor (Section 5.98(5)(b) $60,000 1 $60,000
- Deputy Mayor (Section 5.98A) $15,000 1 $15,000
$75,000 (c) Other Allowances (Section 5.99A) - Telecommunications Technology Allowance $3,500 9 $31,500
$31,500 (d) Reimbursement of Expenses (Section 5.98(2)) - Out of Pocket and Traveling Expenses 9 $500
Total $312,500
Note: The figures provided above indicate amounts Members of Council are entitled to claim. Some Elected Members may not claim the full amount of their entitlement. The budgeted expenditure is shown on Page 3.17.
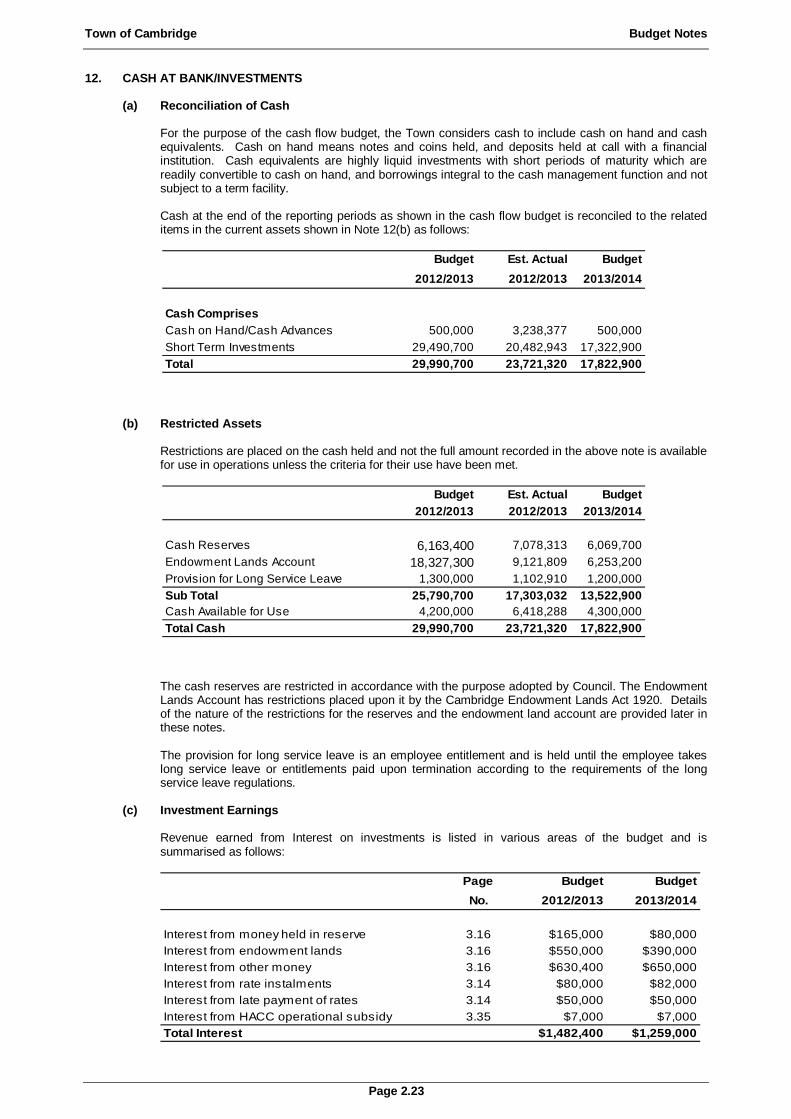
Town of Cambridge Budget Notes
Page 2.23
12. CASH AT BANK/INVESTMENTS
(a) Reconciliation of Cash
For the purpose of the cash flow budget, the Town considers cash to include cash on hand and cash equivalents. Cash on hand means notes and coins held, and deposits held at call with a financial institution. Cash equivalents are highly liquid investments with short periods of maturity which are readily convertible to cash on hand, and borrowings integral to the cash management function and not subject to a term facility. Cash at the end of the reporting periods as shown in the cash flow budget is reconciled to the related items in the current assets shown in Note 12(b) as follows:
(b) Restricted Assets
Restrictions are placed on the cash held and not the full amount recorded in the above note is available for use in operations unless the criteria for their use have been met.
The cash reserves are restricted in accordance with the purpose adopted by Council. The Endowment Lands Account has restrictions placed upon it by the Cambridge Endowment Lands Act 1920. Details of the nature of the restrictions for the reserves and the endowment land account are provided later in these notes. The provision for long service leave is an employee entitlement and is held until the employee takes long service leave or entitlements paid upon termination according to the requirements of the long service leave regulations.
(c) Investment Earnings
Revenue earned from Interest on investments is listed in various areas of the budget and is summarised as follows:
Page Budget BudgetNo. 2012/2013 2013/2014
Interest from money held in reserve 3.16 $165,000 $80,000
Interest from endowment lands 3.16 $550,000 $390,000
Interest from other money 3.16 $630,400 $650,000
Interest from rate instalments 3.14 $80,000 $82,000
Interest from late payment of rates 3.14 $50,000 $50,000
Interest from HACC operational subsidy 3.35 $7,000 $7,000
Total Interest $1,482,400 $1,259,000
Budget Est. Actual Budget2012/2013 2012/2013 2013/2014
Cash ComprisesCash on Hand/Cash Advances 500,000 3,238,377 500,000
Short Term Investments 29,490,700 20,482,943 17,322,900
Total 29,990,700 23,721,320 17,822,900
Budget Est. Actual Budget2012/2013 2012/2013 2013/2014
Cash Reserves 6,163,400 7,078,313 6,069,700
Endowment Lands Account 18,327,300 9,121,809 6,253,200
Provision for Long Service Leave 1,300,000 1,102,910 1,200,000
Sub Total 25,790,700 17,303,032 13,522,900Cash Available for Use 4,200,000 6,418,288 4,300,000
Total Cash 29,990,700 23,721,320 17,822,900
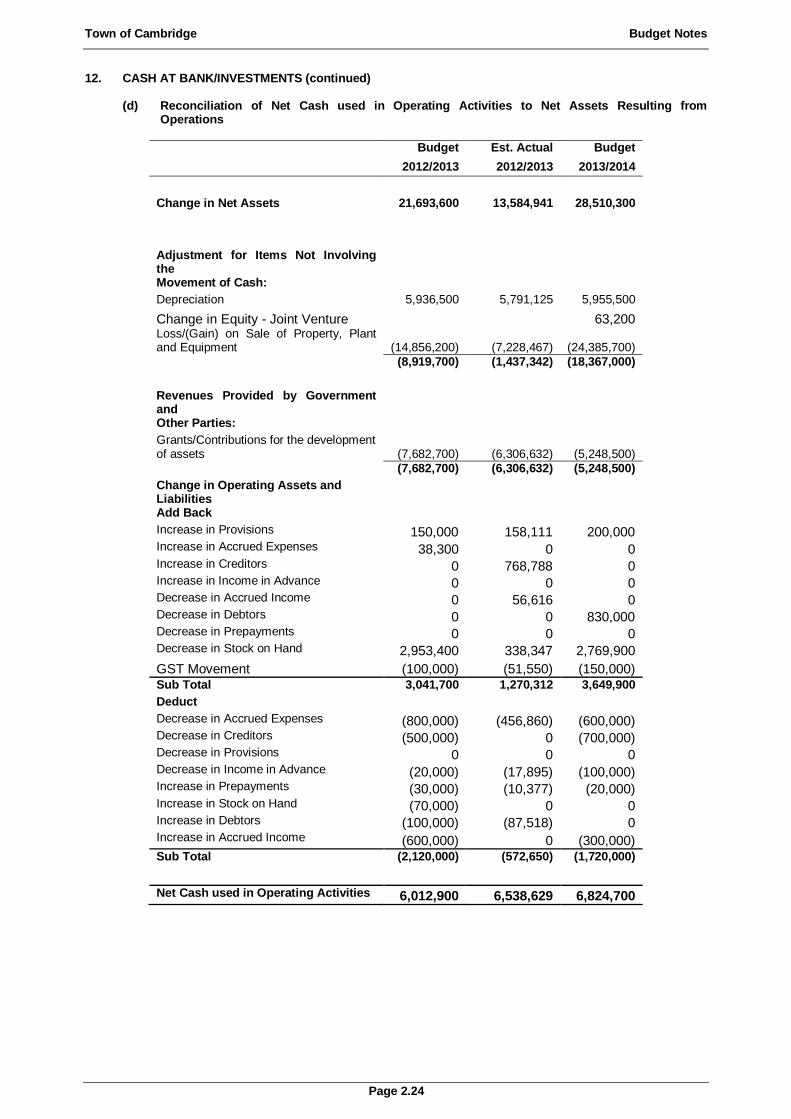
Town of Cambridge Budget Notes
Page 2.24
12. CASH AT BANK/INVESTMENTS (continued)
(d) Reconciliation of Net Cash used in Operating Activities to Net Assets Resulting from Operations
Budget Est. Actual Budget 2012/2013 2012/2013 2013/2014
Change in Net Assets 21,693,600 13,584,941 28,510,300
Adjustment for Items Not Involving the
Movement of Cash:
Depreciation 5,936,500 5,791,125 5,955,500
Change in Equity - Joint Venture
63,200 Loss/(Gain) on Sale of Property, Plant and Equipment (14,856,200) (7,228,467) (24,385,700)
(8,919,700) (1,437,342) (18,367,000)
Revenues Provided by Government and
Other Parties: Grants/Contributions for the development
of assets (7,682,700) (6,306,632) (5,248,500)
(7,682,700) (6,306,632) (5,248,500) Change in Operating Assets and Liabilities
Add Back Increase in Provisions 150,000 158,111 200,000
Increase in Accrued Expenses 38,300 0 0 Increase in Creditors 0 768,788 0 Increase in Income in Advance 0 0 0 Decrease in Accrued Income 0 56,616 0 Decrease in Debtors 0 0 830,000 Decrease in Prepayments 0 0 0 Decrease in Stock on Hand 2,953,400 338,347 2,769,900
GST Movement (100,000) (51,550) (150,000) Sub Total 3,041,700 1,270,312 3,649,900 Deduct
Decrease in Accrued Expenses (800,000) (456,860) (600,000) Decrease in Creditors (500,000) 0 (700,000) Decrease in Provisions 0 0 0 Decrease in Income in Advance (20,000) (17,895) (100,000) Increase in Prepayments (30,000) (10,377) (20,000) Increase in Stock on Hand (70,000) 0 0 Increase in Debtors (100,000) (87,518) 0 Increase in Accrued Income (600,000) 0 (300,000) Sub Total (2,120,000) (572,650) (1,720,000)
Net Cash used in Operating Activities 6,012,900 6,538,629 6,824,700
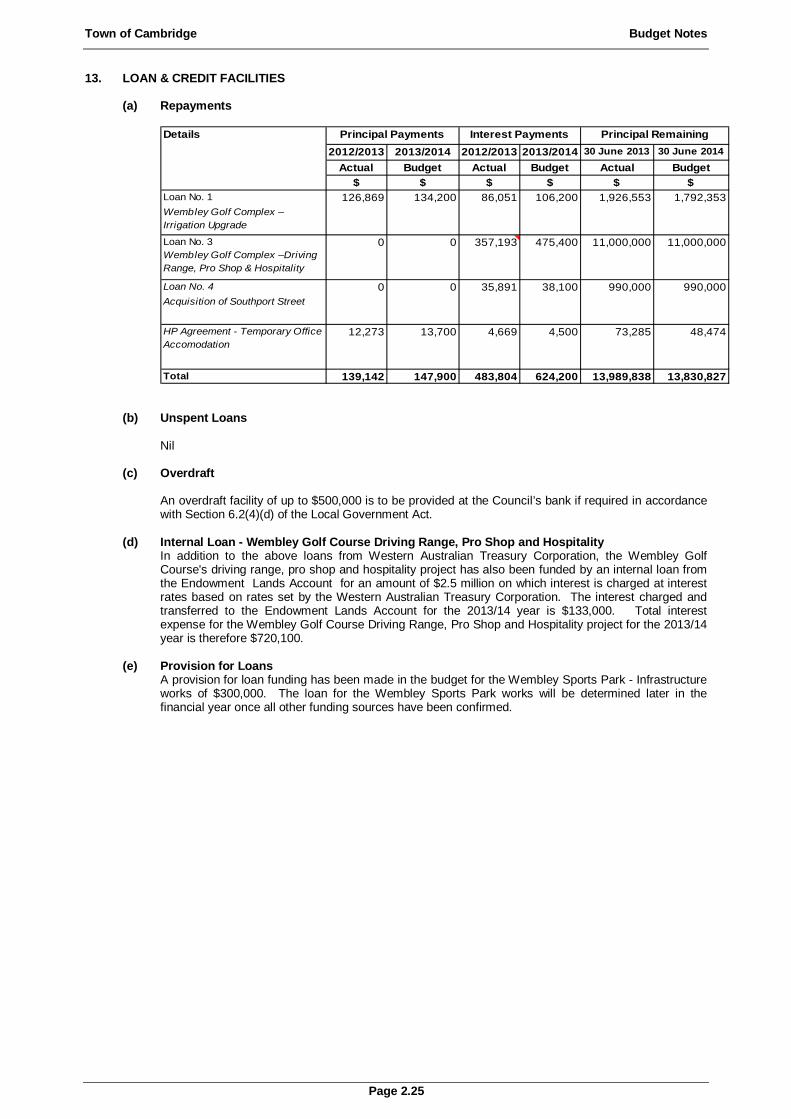
Town of Cambridge Budget Notes
Page 2.25
13. LOAN & CREDIT FACILITIES
(a) Repayments Details
2012/2013 2013/2014 2012/2013 2013/2014 30 June 2013 30 June 2014Actual Budget Actual Budget Actual Budget
$ $ $ $ $ $Loan No. 1
Loan No. 4 Acquisition of Southport Street
Total 139,142 147,900 483,804 624,200 13,989,838 13,830,827
38,100
1,926,553 1,792,353
990,000 990,000
106,200
11,000,000
Principal Remaining
11,000,000
48,47473,285HP Agreement - Temporary Office Accomodation
12,273 13,700 4,5004,669
0
Principal Payments
0
Interest Payments
475,400
126,869 134,200 86,051
357,193Loan No. 3
Wembley Golf Complex –Driving Range, Pro Shop & Hospitality
0 0 35,891
Wembley Golf Complex – Irrigation Upgrade
(b) Unspent Loans
Nil (c) Overdraft
An overdraft facility of up to $500,000 is to be provided at the Council’s bank if required in accordance with Section 6.2(4)(d) of the Local Government Act.
(d) Internal Loan - Wembley Golf Course Driving Range, Pro Shop and Hospitality In addition to the above loans from Western Australian Treasury Corporation, the Wembley Golf Course's driving range, pro shop and hospitality project has also been funded by an internal loan from the Endowment Lands Account for an amount of $2.5 million on which interest is charged at interest rates based on rates set by the Western Australian Treasury Corporation. The interest charged and transferred to the Endowment Lands Account for the 2013/14 year is $133,000. Total interest expense for the Wembley Golf Course Driving Range, Pro Shop and Hospitality project for the 2013/14 year is therefore $720,100.
(e) Provision for Loans A provision for loan funding has been made in the budget for the Wembley Sports Park - Infrastructure works of $300,000. The loan for the Wembley Sports Park works will be determined later in the financial year once all other funding sources have been confirmed.
Town of Cambridge Budget Notes
Page 2.26
14. RESERVES
Council maintains various reserves, which provide financial resources for projects and for items requiring urgent attention during the year, which have not been budgeted for. Full details on Reserves are shown on Pages 5.1 to 5.6.
(a) Purpose of Cash Backed Reserves
(i) Area Improvement Reserve To provide funds for the acquisition and development of assets excluding community recreation
facilities or the provision of services that are in the view of the Council beneficial and provides improvements to areas within the district of the Town.
(ii) Community Facilities Reserve
To provide funds for acquisition and development of community facilities in the Town. (iii) Asset Management Reserve
To provide a source of funds for future asset replacement. This reserve recognises the need to make provision for the future replacement of assets having regard to the depreciating nature of non-current assets. The amount in this reserve is to be accumulated over the useful life of the assets and expended on replacement as considered appropriate.
The reserve provides for the acquisition and replacement of the Town’s plant, equipment and infrastructure. “Plant, equipment and Infrastructure” shall be defined to mean trucks, loaders, cars, utilities, rollers, tractors, movers, computers, photocopies, buildings, roads, footpaths, drainage, parks, reticulation and similar.
(iv) Waste Management Reserve
To provide funds for the provision of waste management services, including recycling. These services may include acquisition of assets such as land, buildings, plant and equipment, mobile rubbish bins, etc. The reserve also provides for the expenses relating to the Tamala Park land in which the Town has an ownership interest.
(v) Clubs and Associations Reserves
(i) Clubs and Associations - Buildings This reserve was established in accordance with the Town's new community leasing
policy to provide funding for ongoing building maintenance for the various facilities.. Contributions are made by both the Town and the Community Associations and held by the Council for this purpose.
(ii) Clubs and Associations - Synthetic Court and Lightings This reserve was established in accordance with the Town's new community leasing
policy to provide replacement of synthetic courts and lighting infrastructure where applicable. Contributions are made by both the Town and Community Associations and held by the Council for this purpose.
(iii) Clubs and Associations - Car Parks and Surroundings This reserve was established in accordance with the Town's new community leasing
policy to provide for the replacement of car parks and surroundings where applicable. Contributions are made by both the Town and Community Associations and held by the Council for this purpose.

Town of Cambridge Budget Notes
Page 2.27
14. RESERVES (Continued)
(b) Details of Reserve Accounts Details of transactions expected to occur on the Reserves are outlined below:
Opening Transfers Transfers ClosingBalance from to Balance
1 July Operations Operations 30 June
Actual 2012/2013 (estimated Jun13)Area Improvement 1,254,231 5,548,959 1,225,667 5,577,523
Community Facilities 103,020 151,887 123,665 131,242
Asset Management 884,753 687,900 621,111 951,541
Waste Management 104,785 152,186 252,844 4,127
Clubs & Associations 365,496 449,515 401,130 413,881
Total 2,712,284 6,990,446 2,624,417 7,078,313
Budget 2013/2014Area Improvement 6,241,100 780,000 1,420,100 5,601,000
Community Facilities 131,300 37,700 159,000 10,000
Asset Management 856,300 234,000 984,700 105,600
Waste Management 4,100 203,600 200,000 7,700
Clubs & Associations 413,900 570,200 638,700 345,400
Total 7,646,700 1,825,500 3,402,500 6,069,700
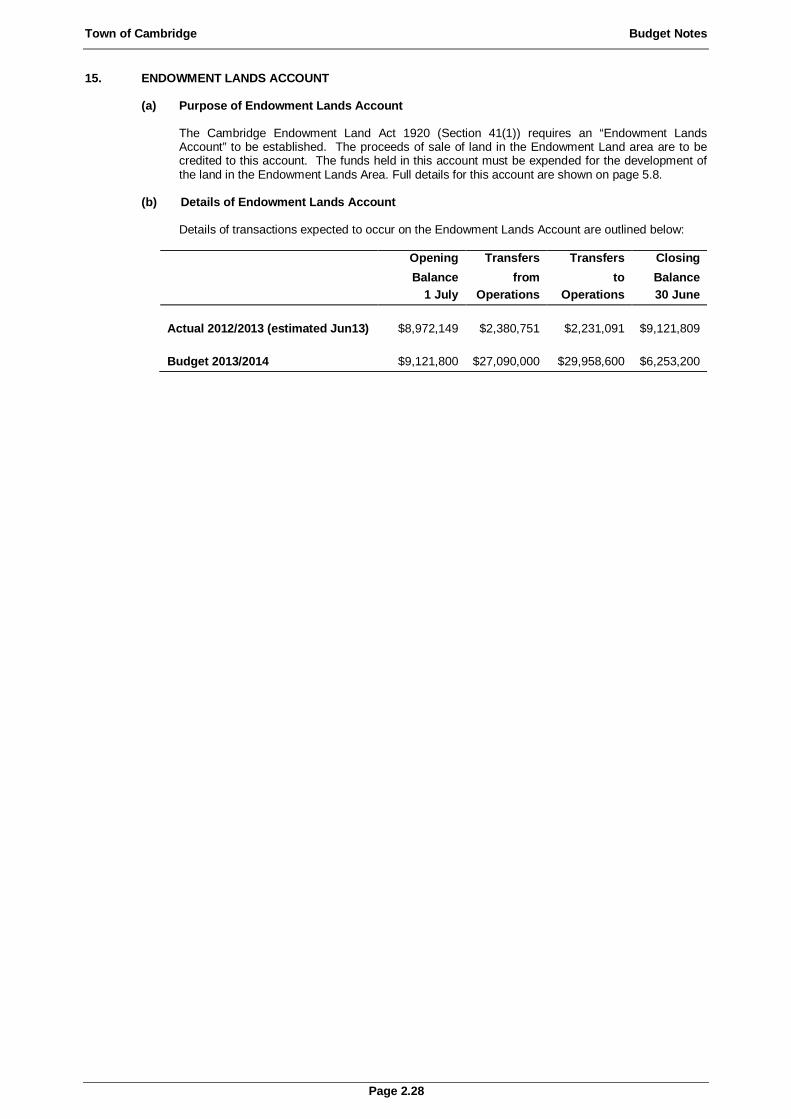
Town of Cambridge Budget Notes
Page 2.28
15. ENDOWMENT LANDS ACCOUNT
(a) Purpose of Endowment Lands Account The Cambridge Endowment Land Act 1920 (Section 41(1)) requires an “Endowment Lands Account” to be established. The proceeds of sale of land in the Endowment Land area are to be credited to this account. The funds held in this account must be expended for the development of the land in the Endowment Lands Area. Full details for this account are shown on page 5.8.
(b) Details of Endowment Lands Account Details of transactions expected to occur on the Endowment Lands Account are outlined below:
Opening Transfers Transfers Closing Balance from to Balance 1 July Operations Operations 30 June
Actual 2012/2013 (estimated Jun13) $8,972,149 $2,380,751 $2,231,091 $9,121,809
Budget 2013/2014 $9,121,800 $27,090,000 $29,958,600 $6,253,200

Town of Cambridge Budget Notes
Page 2.29
16. DETERMINATION OF OPENING FUNDS
(a) Net Current Assets The surplus/deficit represents the amount to be brought forward from the previous financial period. The Local Government Act requires Council to carry forward any surplus or deficit from the previous year and take it into account in preparing the Budget and imposing the rates and charges for the ensuing year. The position at the commencement of the financial year is represented by the net current assets at 1 July 2012. The details of the net current assets are outlined below:
Surplus as at 30 June 2013 includes carried forward funds of $6,190,100 (b) Determining the Budget Deficiency
The budget deficiency represents the amount that must be raised in rates to meet the balance of the expenditure requirements not provided for by alternative revenue sources. This deficiency is shown in the Rate Setting Budget Page 2.3. This budget is used to eliminate items that are not used to calculate the budget deficiency such as:
• Reserves that remain unexpended at year end;
• Depreciation of non-current assets;
• Gain/(Loss) on disposal of assets;
• Restricted assets that remain unused at year-end.
This budget takes into account the surplus/deficit funds brought forward for capital and operating projects not completed prior to 30 June 2013. The carried forward amounts have been applied to complete these projects in 2013/2014. A summary of the carried forward amounts applied to incomplete works and surplus allocated is detailed on Page 6.5 and 6.6.
Est. Actual Budget30-Jun-13 30-Jun-14
Current AssetsCash 3,238,377 500,000
Investments 20,482,943 17,323,200
Receivables Current 3,303,804 1,100,000
Other 90,653 100,000
Inventories 253,492 285,000
Total Current Assets 27,369,269 19,308,200
Current LiabilitiesPayables 2,564,046 4,200,300
Provisions Current 2,042,459 2,400,000
Borrowings 166,607 135,000
Total Current Liabilities 4,773,112 6,735,300
Net 22,596,157 12,572,900
Less Restricted AssetsReserves 7,078,313 6,069,700
Endowment Lands Account 9,121,809 6,253,200
Provisions 205,935 250,000
Total Restricted Assets 16,406,057 12,572,900
Net Current Assets 6,190,100 (0)
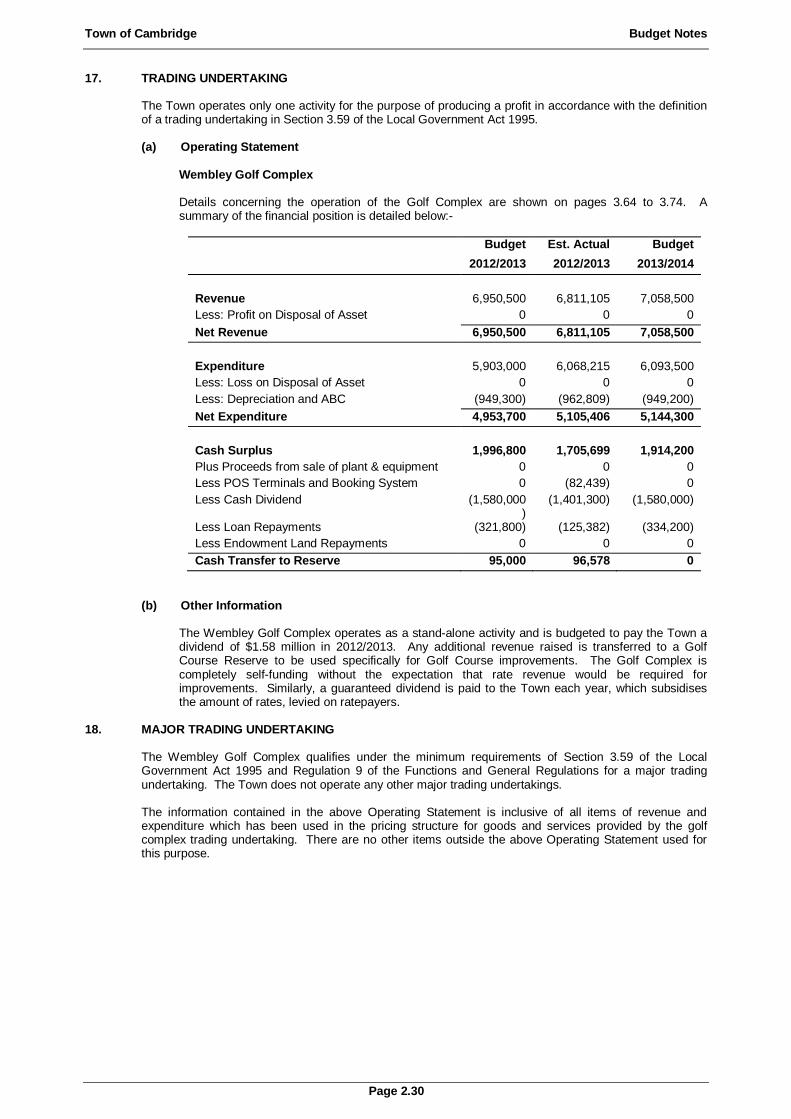
Town of Cambridge Budget Notes
Page 2.30
17. TRADING UNDERTAKING The Town operates only one activity for the purpose of producing a profit in accordance with the definition of a trading undertaking in Section 3.59 of the Local Government Act 1995. (a) Operating Statement
Wembley Golf Complex Details concerning the operation of the Golf Complex are shown on pages 3.64 to 3.74. A summary of the financial position is detailed below:-
Budget Est. Actual Budget 2012/2013 2012/2013 2013/2014
Revenue 6,950,500 6,811,105 7,058,500
Less: Profit on Disposal of Asset 0 0 0
Net Revenue 6,950,500 6,811,105 7,058,500
Expenditure 5,903,000 6,068,215 6,093,500
Less: Loss on Disposal of Asset 0 0 0
Less: Depreciation and ABC (949,300) (962,809) (949,200)
Net Expenditure 4,953,700 5,105,406 5,144,300
Cash Surplus 1,996,800 1,705,699 1,914,200 Plus Proceeds from sale of plant & equipment 0 0 0
Less POS Terminals and Booking System 0 (82,439) 0
Less Cash Dividend (1,580,000)
(1,401,300) (1,580,000)
Less Loan Repayments (321,800) (125,382) (334,200)
Less Endowment Land Repayments 0 0 0
Cash Transfer to Reserve 95,000 96,578 0
(b) Other Information
The Wembley Golf Complex operates as a stand-alone activity and is budgeted to pay the Town a dividend of $1.58 million in 2012/2013. Any additional revenue raised is transferred to a Golf Course Reserve to be used specifically for Golf Course improvements. The Golf Complex is completely self-funding without the expectation that rate revenue would be required for improvements. Similarly, a guaranteed dividend is paid to the Town each year, which subsidises the amount of rates, levied on ratepayers.
18. MAJOR TRADING UNDERTAKING The Wembley Golf Complex qualifies under the minimum requirements of Section 3.59 of the Local Government Act 1995 and Regulation 9 of the Functions and General Regulations for a major trading undertaking. The Town does not operate any other major trading undertakings. The information contained in the above Operating Statement is inclusive of all items of revenue and expenditure which has been used in the pricing structure for goods and services provided by the golf complex trading undertaking. There are no other items outside the above Operating Statement used for this purpose.
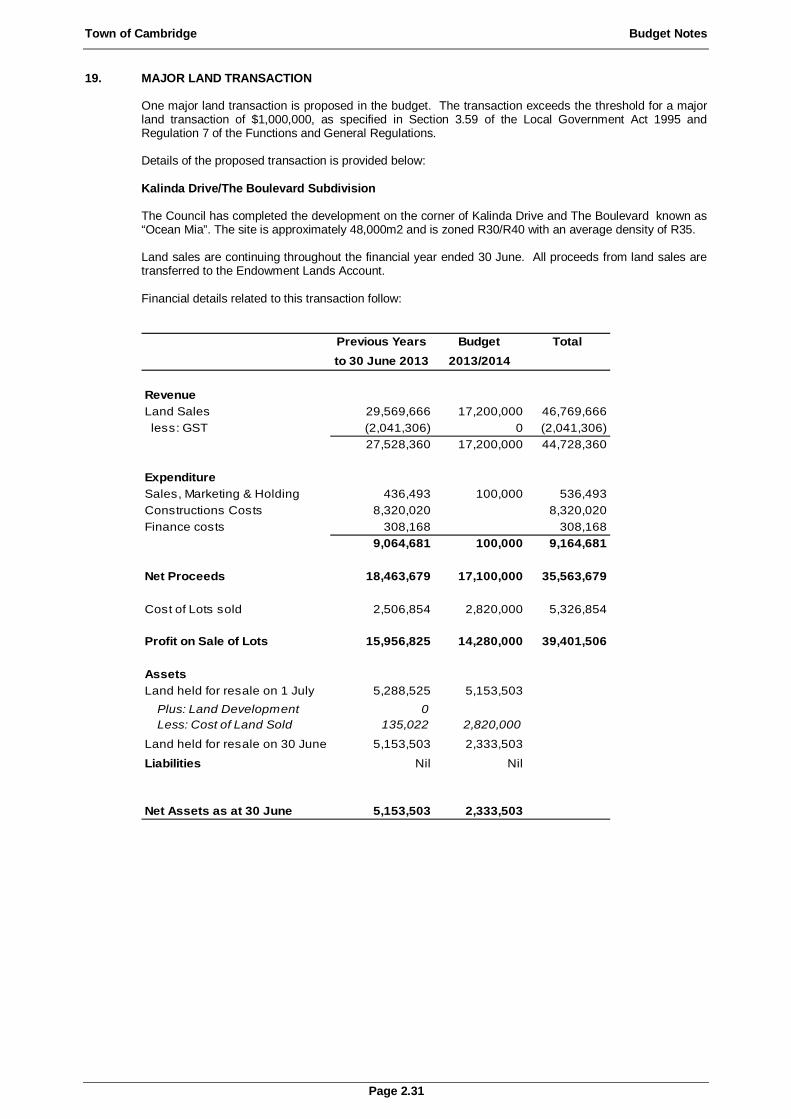
Town of Cambridge Budget Notes
Page 2.31
19. MAJOR LAND TRANSACTION One major land transaction is proposed in the budget. The transaction exceeds the threshold for a major land transaction of $1,000,000, as specified in Section 3.59 of the Local Government Act 1995 and Regulation 7 of the Functions and General Regulations. Details of the proposed transaction is provided below:
Kalinda Drive/The Boulevard Subdivision The Council has completed the development on the corner of Kalinda Drive and The Boulevard known as “Ocean Mia”. The site is approximately 48,000m2 and is zoned R30/R40 with an average density of R35. Land sales are continuing throughout the financial year ended 30 June. All proceeds from land sales are transferred to the Endowment Lands Account. Financial details related to this transaction follow:
Previous Years Budget Totalto 30 June 2013 2013/2014
RevenueLand Sales 29,569,666 17,200,000 46,769,666
less: GST (2,041,306) 0 (2,041,306)
27,528,360 17,200,000 44,728,360
ExpenditureSales, Marketing & Holding 436,493 100,000 536,493
Constructions Costs 8,320,020 8,320,020
Finance costs 308,168 308,168
9,064,681 100,000 9,164,681
Net Proceeds 18,463,679 17,100,000 35,563,679
Cost of Lots sold 2,506,854 2,820,000 5,326,854
Profit on Sale of Lots 15,956,825 14,280,000 39,401,506
Assets Land held for resale on 1 July 5,288,525 5,153,503
Plus: Land Development 0Less: Cost of Land Sold 135,022 2,820,000
Land held for resale on 30 June 5,153,503 2,333,503
Liabilities Nil Nil
Net Assets as at 30 June 5,153,503 2,333,503
Town of Cambridge Budget Notes
Page 2.32
20. MONIES HELD IN TRUST A trust account has been established for funds held by Council over which it has no control. This only applies to unclaimed monies as detailed below:- Unclaimed Monies Money held by the Town for which it is unable to locate the payee. A summary of the expected financial transactions for this account during the year is detailed below: Balance 1 July 2013 $1,478,000 Receipts 30,000 Payments $100,000 Balance 30 June 2014 $1,408,000

OPERATING BUDGET

Town of Cambridge
Operating Budget Summary by Program
For the Year Ending 30 June 2014
Page Actual Budget Est. Actual Budget
No. 2011/2012 2012/2013 30 Jun 2013 2013/2014
$ $ $ $
REVENUE
General Purpose Funding 3.3 (21,379,828) (21,545,800) (21,963,605) (23,175,900)
Governance 3.4 (100,231) (97,100) (73,873) (54,000)
Law, Order and Public Safety 3.5 (57,530) (55,500) (69,236) (2,133,800)
Health 3.6 (57,755) (57,900) (60,575) (51,000)
Education and Welfare 3.7 (1,006,651) (1,019,500) (1,097,597) (1,102,600)
Community Amenities 3.8 (2,272,352) (2,489,000) (2,251,370) (2,560,000)
Recreation and Culture 3.9 (9,926,307) (16,198,700) (14,917,910) (10,563,500)
Transport 3.10 (2,536,946) (2,902,000) (2,657,909) (3,511,000)
Economic Services 3.11 (690,603) (567,000) (436,460) (465,000)
Other Property and Services 3.12 (6,696,022) (15,078,300) (7,336,639) (24,599,700)
(44,724,225) (60,010,800) (50,865,173) (68,216,500)
EXPENDITURE
General Purpose Funding 3.3 613,004 588,300 573,217 594,400
Governance 3.4 1,442,019 1,550,500 1,467,569 1,764,300
Law, Order and Public Safety 3.5 1,016,748 1,493,000 1,442,716 1,493,800
Health 3.6 438,678 477,700 452,368 507,500
Education and Welfare 3.7 1,438,001 1,582,700 1,532,873 1,704,500
Community Amenities 3.8 5,409,480 5,654,100 5,149,360 5,906,100
Recreation and Culture 3.9 15,839,943 16,995,800 16,915,978 17,288,400
Transport 3.10 7,221,407 7,282,000 6,985,285 7,748,900
Economic Services 3.11 641,123 705,800 647,345 600,500
Other Property and Services 3.12 1,959,799 1,987,300 2,113,519 2,097,800
36,020,202 38,317,200 37,280,232 39,706,200
CHANGE IN NET ASSETS
RESULTING FROM OPERATIONS (8,704,023) (21,693,600) (13,584,941) (28,510,300)
________________________________________________________________________________________
Page 3.1
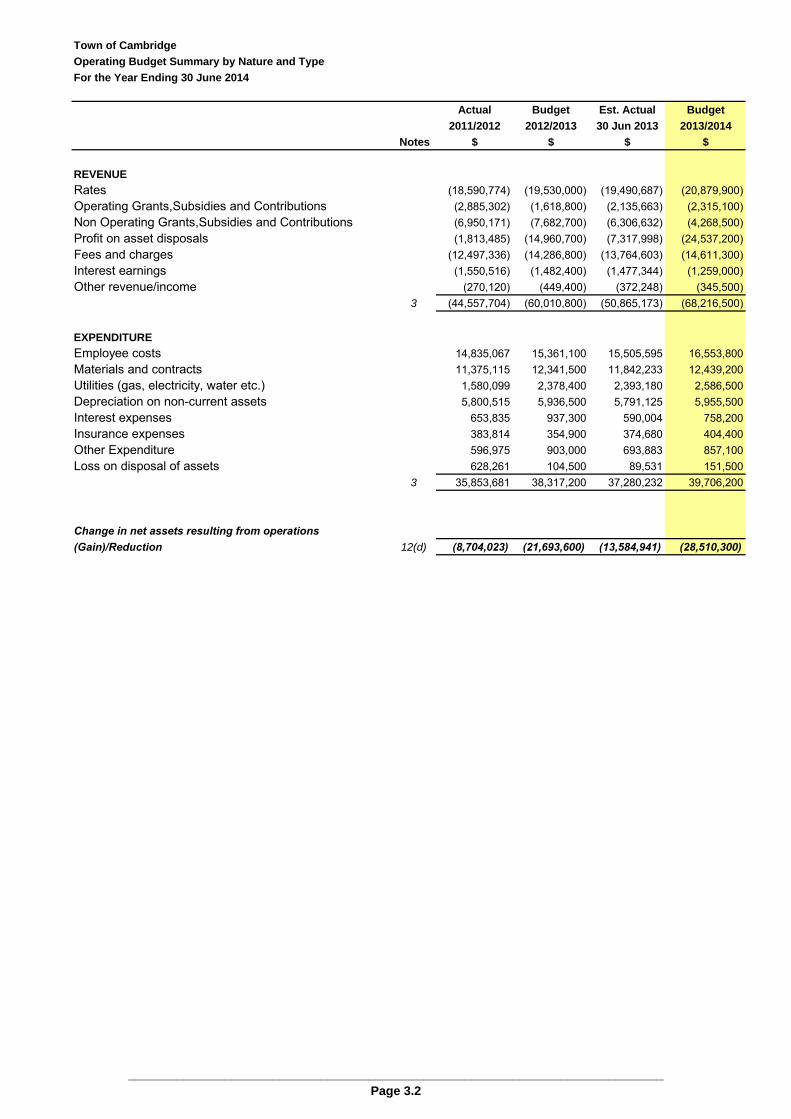
Town of Cambridge
Operating Budget Summary by Nature and Type
For the Year Ending 30 June 2014
Actual Budget Est. Actual Budget
2011/2012 2012/2013 30 Jun 2013 2013/2014
Notes $ $ $ $
REVENUE
Rates (18,590,774) (19,530,000) (19,490,687) (20,879,900)Operating Grants,Subsidies and Contributions (2,885,302) (1,618,800) (2,135,663) (2,315,100)Non Operating Grants,Subsidies and Contributions (6,950,171) (7,682,700) (6,306,632) (4,268,500)Profit on asset disposals (1,813,485) (14,960,700) (7,317,998) (24,537,200)Fees and charges (12,497,336) (14,286,800) (13,764,603) (14,611,300)Interest earnings (1,550,516) (1,482,400) (1,477,344) (1,259,000)Other revenue/income (270,120) (449,400) (372,248) (345,500)
3 (44,557,704) (60,010,800) (50,865,173) (68,216,500)
EXPENDITURE
Employee costs 14,835,067 15,361,100 15,505,595 16,553,800Materials and contracts 11,375,115 12,341,500 11,842,233 12,439,200Utilities (gas, electricity, water etc.) 1,580,099 2,378,400 2,393,180 2,586,500Depreciation on non-current assets 5,800,515 5,936,500 5,791,125 5,955,500Interest expenses 653,835 937,300 590,004 758,200Insurance expenses 383,814 354,900 374,680 404,400Other Expenditure 596,975 903,000 693,883 857,100Loss on disposal of assets 628,261 104,500 89,531 151,500
3 35,853,681 38,317,200 37,280,232 39,706,200
Change in net assets resulting from operations(Gain)/Reduction 12(d) (8,704,023) (21,693,600) (13,584,941) (28,510,300)
______________________________________________________________________________
Page 3.2
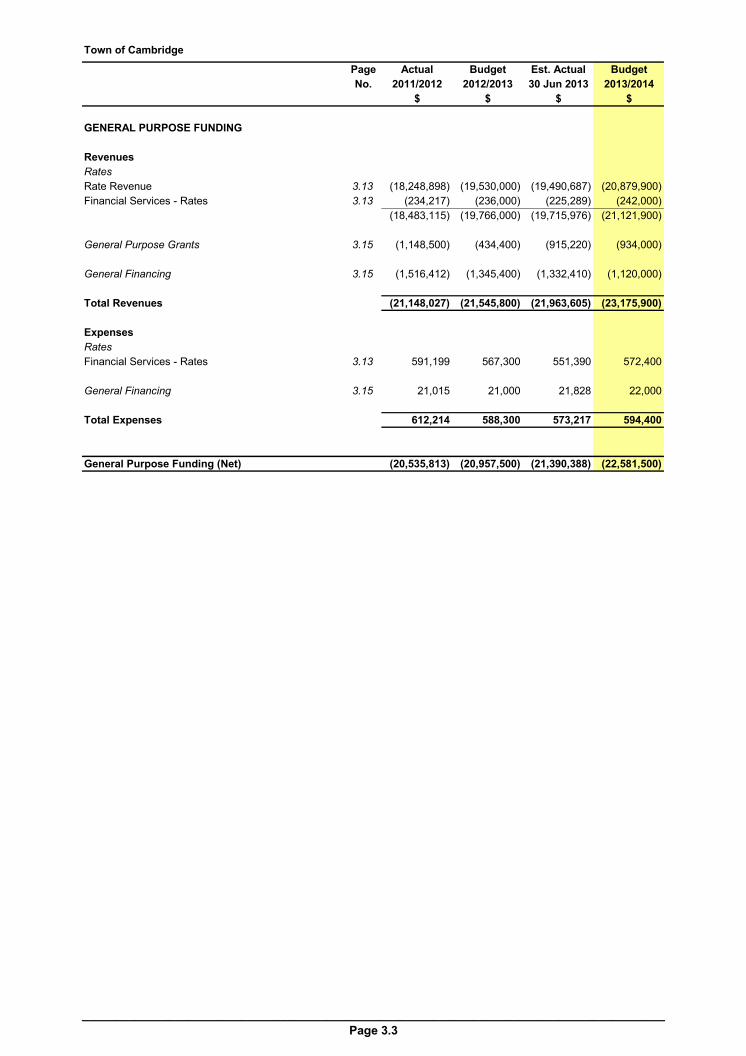
Town of Cambridge
Page Actual Budget Est. Actual Budget
No. 2011/2012 2012/2013 30 Jun 2013 2013/2014
$ $ $ $
GENERAL PURPOSE FUNDING
Revenues
Rates
Rate Revenue 3.13 (18,248,898) (19,530,000) (19,490,687) (20,879,900)
Financial Services - Rates 3.13 (234,217) (236,000) (225,289) (242,000)
(18,483,115) (19,766,000) (19,715,976) (21,121,900)
General Purpose Grants 3.15 (1,148,500) (434,400) (915,220) (934,000)
General Financing 3.15 (1,516,412) (1,345,400) (1,332,410) (1,120,000)
Total Revenues (21,148,027) (21,545,800) (21,963,605) (23,175,900)
Expenses
Rates
Financial Services - Rates 3.13 591,199 567,300 551,390 572,400
General Financing 3.15 21,015 21,000 21,828 22,000
Total Expenses 612,214 588,300 573,217 594,400
General Purpose Funding (Net) (20,535,813) (20,957,500) (21,390,388) (22,581,500)
________________________________________________________________________________________
Page 3.3
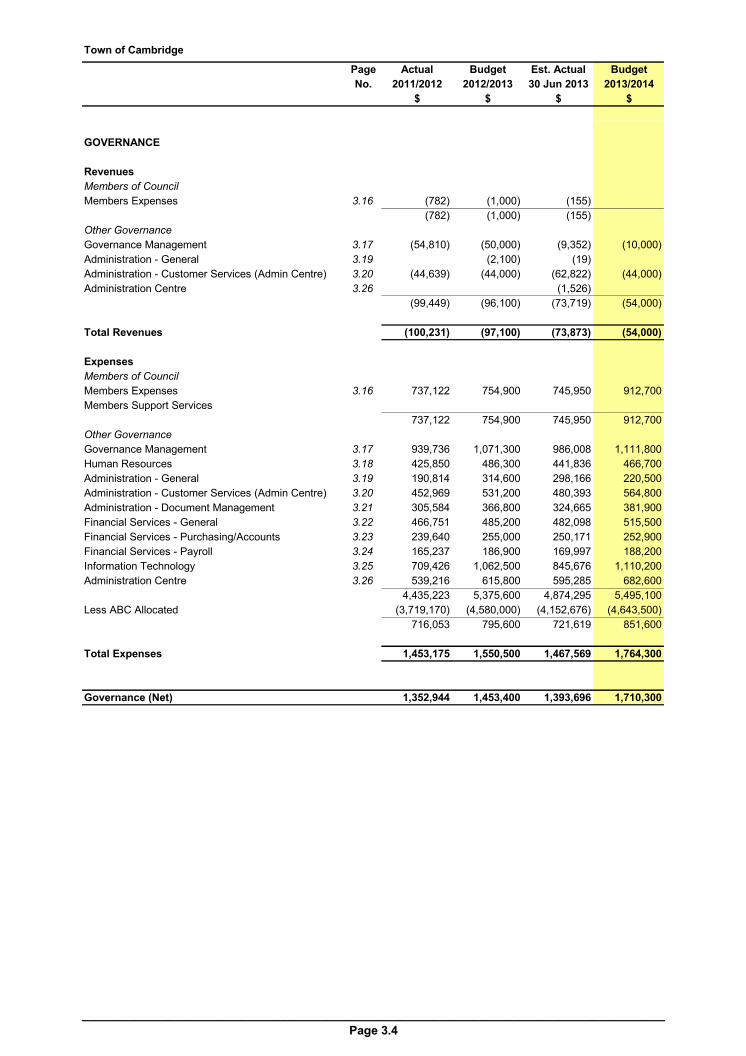
Town of Cambridge
Page Actual Budget Est. Actual Budget
No. 2011/2012 2012/2013 30 Jun 2013 2013/2014
$ $ $ $
GOVERNANCE
Revenues
Members of Council
Members Expenses 3.16 (782) (1,000) (155) 0
(782) (1,000) (155) 0
Other Governance
Governance Management 3.17 (54,810) (50,000) (9,352) (10,000)
Administration - General 3.19 0 (2,100) (19) 0
Administration - Customer Services (Admin Centre) 3.20 (44,639) (44,000) (62,822) (44,000)
Administration Centre 3.26 0 (1,526)
(99,449) (96,100) (73,719) (54,000)
Total Revenues (100,231) (97,100) (73,873) (54,000)
Expenses
Members of Council
Members Expenses 3.16 737,122 754,900 745,950 912,700
Members Support Services 0 0 0 0
737,122 754,900 745,950 912,700
Other Governance
Governance Management 3.17 939,736 1,071,300 986,008 1,111,800
Human Resources 3.18 425,850 486,300 441,836 466,700
Administration - General 3.19 190,814 314,600 298,166 220,500
Administration - Customer Services (Admin Centre) 3.20 452,969 531,200 480,393 564,800
Administration - Document Management 3.21 305,584 366,800 324,665 381,900
Financial Services - General 3.22 466,751 485,200 482,098 515,500
Financial Services - Purchasing/Accounts 3.23 239,640 255,000 250,171 252,900
Financial Services - Payroll 3.24 165,237 186,900 169,997 188,200
Information Technology 3.25 709,426 1,062,500 845,676 1,110,200
Administration Centre 3.26 539,216 615,800 595,285 682,600
4,435,223 5,375,600 4,874,295 5,495,100
Less ABC Allocated (3,719,170) (4,580,000) (4,152,676) (4,643,500)
716,053 795,600 721,619 851,600
Total Expenses 1,453,175 1,550,500 1,467,569 1,764,300
Governance (Net) 1,352,944 1,453,400 1,393,696 1,710,300
________________________________________________________________________________________
Page 3.4
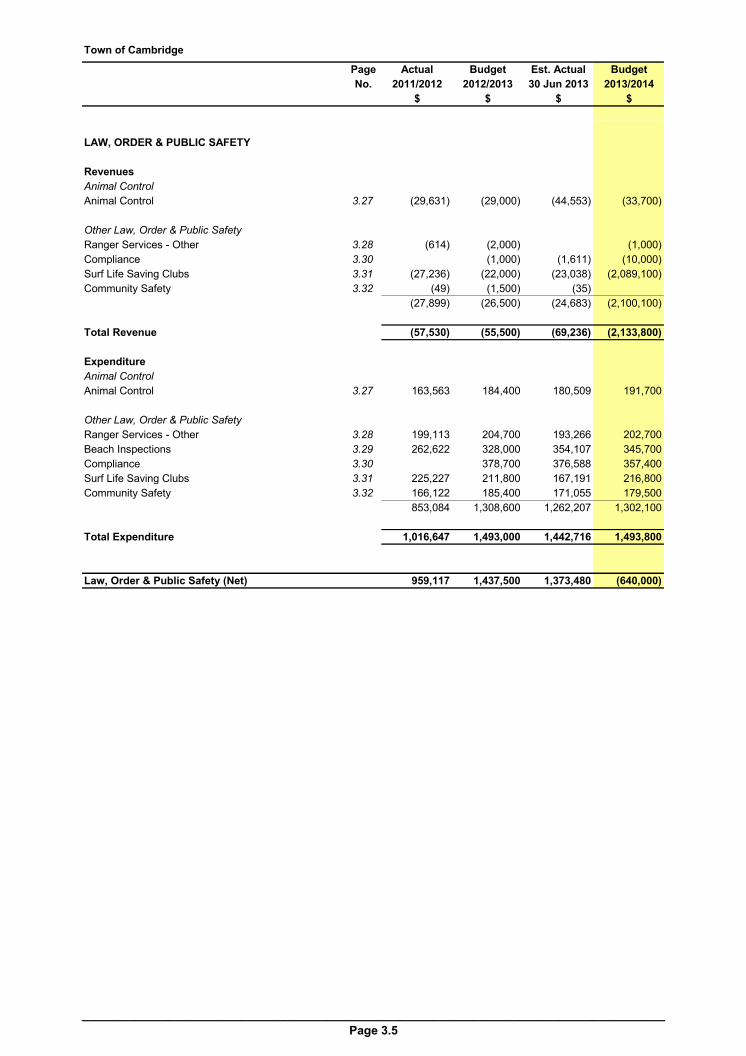
Town of Cambridge
Page Actual Budget Est. Actual Budget
No. 2011/2012 2012/2013 30 Jun 2013 2013/2014
$ $ $ $
LAW, ORDER & PUBLIC SAFETY
Revenues
Animal Control
Animal Control 3.27 (29,631) (29,000) (44,553) (33,700)
Other Law, Order & Public Safety
Ranger Services - Other 3.28 (614) (2,000) 0 (1,000)
Compliance 3.30 0 (1,000) (1,611) (10,000)
Surf Life Saving Clubs 3.31 (27,236) (22,000) (23,038) (2,089,100)
Community Safety 3.32 (49) (1,500) (35) 0
(27,899) (26,500) (24,683) (2,100,100)
Total Revenue (57,530) (55,500) (69,236) (2,133,800)
Expenditure
Animal Control
Animal Control 3.27 163,563 184,400 180,509 191,700
Other Law, Order & Public Safety
Ranger Services - Other 3.28 199,113 204,700 193,266 202,700
Beach Inspections 3.29 262,622 328,000 354,107 345,700
Compliance 3.30 0 378,700 376,588 357,400
Surf Life Saving Clubs 3.31 225,227 211,800 167,191 216,800
Community Safety 3.32 166,122 185,400 171,055 179,500
853,084 1,308,600 1,262,207 1,302,100
Total Expenditure 1,016,647 1,493,000 1,442,716 1,493,800
Law, Order & Public Safety (Net) 959,117 1,437,500 1,373,480 (640,000)
________________________________________________________________________________________
Page 3.5
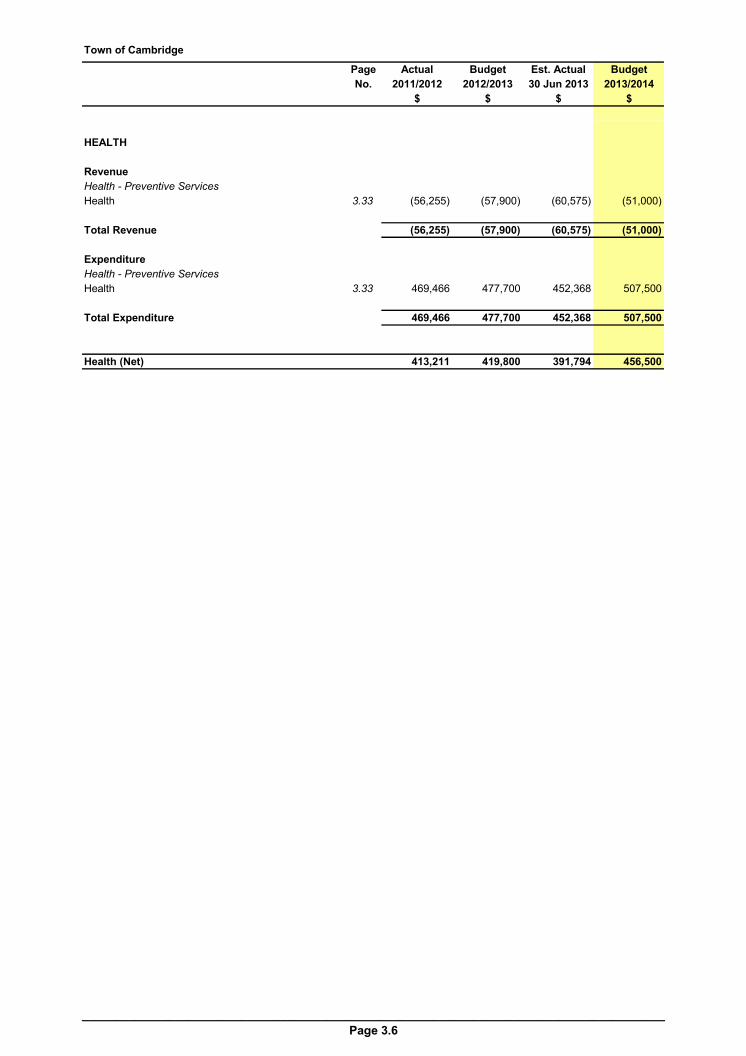
Town of Cambridge
Page Actual Budget Est. Actual Budget
No. 2011/2012 2012/2013 30 Jun 2013 2013/2014
$ $ $ $
HEALTH
Revenue
Health - Preventive Services
Health 3.33 (56,255) (57,900) (60,575) (51,000)
Total Revenue (56,255) (57,900) (60,575) (51,000)
Expenditure
Health - Preventive Services
Health 3.33 469,466 477,700 452,368 507,500
Total Expenditure 469,466 477,700 452,368 507,500
Health (Net) 413,211 419,800 391,794 456,500
________________________________________________________________________________________
Page 3.6

Town of Cambridge
Page Actual Budget Est. Actual Budget
No. 2011/2012 2012/2013 30 Jun 2013 2013/2014
$ $ $ $
EDUCATION & WELFARE
Revenue
Aged & Disabled
Cambridge Senior Services - HACC 3.34 (992,576) (1,011,500) (1,094,509) (1,093,100)
(992,576) (1,011,500) (1,094,509) (1,093,100)
Other Welfare
Youth Services 3.36 (14,075) (8,000) (3,088) (9,500)
(14,075) (8,000) (3,088) (9,500)
Total Revenue (1,006,651) (1,019,500) (1,097,597) (1,102,600)
Expenditure
Aged & Disabled
Cambridge Senior Services - HACC 3.34 1,081,680 1,138,100 1,145,238 1,213,000
1,081,680 1,138,100 1,145,238 1,213,000
Other Welfare
Welfare Services 3.35 109,681 141,300 96,640 176,600
Youth Services 3.36 271,171 303,300 290,995 314,900
380,852 444,600 387,636 491,500
Total Expenditure 1,462,532 1,582,700 1,532,873 1,704,500
Education & Welfare (Net) 455,881 563,200 435,277 601,900
________________________________________________________________________________________
Page 3.7

Town of Cambridge
Page Actual Budget Est. Actual Budget
No. 2011/2012 2012/2013 30 Jun 2013 2013/2014
$ $ $ $
COMMUNITY AMENITIES
Revenue
Sanitation
Waste Management 3.37 (1,771,902) (1,976,000) (1,780,577) (2,059,000)
Town Planning & Regional Development
Planning 3.38 (603,223) (513,000) (470,102) (501,000)
Sustainability Management 3.39 (273) 0 (691) 0
(603,496) (513,000) (470,793) (501,000)
Total Revenue (2,375,398) (2,489,000) (2,251,370) (2,560,000)
Expenditure
Sanitation
Waste Management 3.37 3,977,833 3,991,300 3,755,537 4,166,700
Town Planning & Regional Development
Planning 3.38 1,233,193 1,251,400 1,009,673 1,311,500
Sustainability Management 3.39 314,013 411,400 384,150 427,900
1,547,205 1,662,800 1,393,824 1,739,400
Total Expenditure 5,525,038 5,654,100 5,149,360 5,906,100
Community Amenities (Net) 3,149,640 3,165,100 2,897,990 3,346,100
________________________________________________________________________________________
Page 3.8
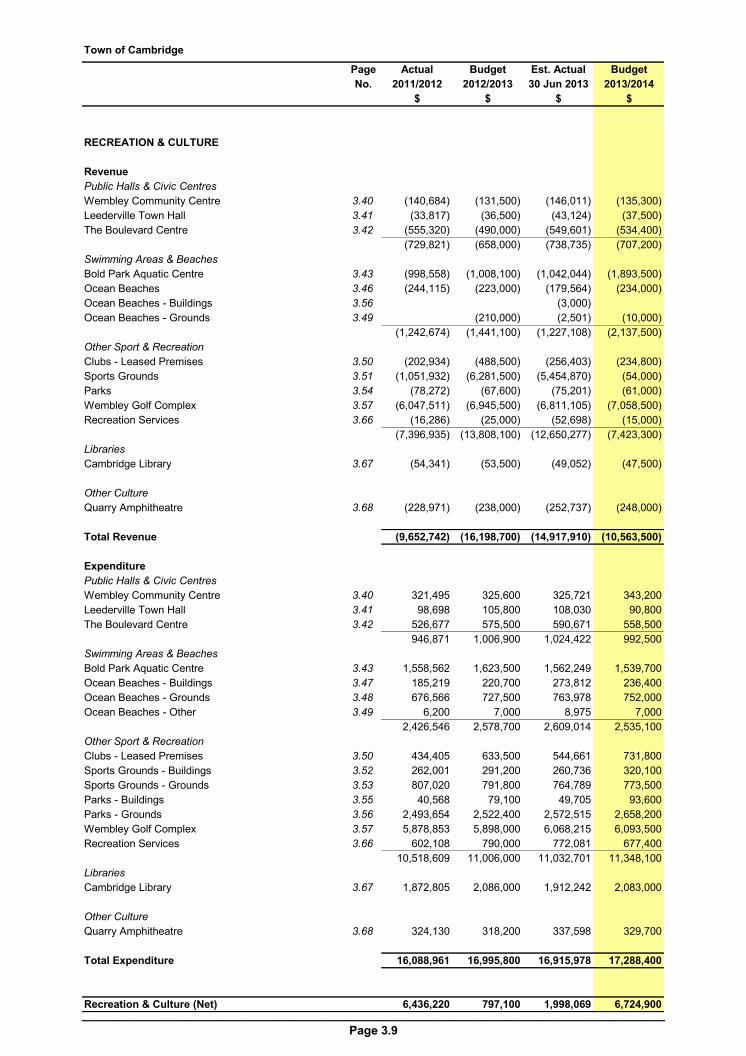
Town of Cambridge
Page Actual Budget Est. Actual Budget
No. 2011/2012 2012/2013 30 Jun 2013 2013/2014
$ $ $ $
RECREATION & CULTURE
Revenue
Public Halls & Civic Centres
Wembley Community Centre 3.40 (140,684) (131,500) (146,011) (135,300)
Leederville Town Hall 3.41 (33,817) (36,500) (43,124) (37,500)
The Boulevard Centre 3.42 (555,320) (490,000) (549,601) (534,400)
(729,821) (658,000) (738,735) (707,200)
Swimming Areas & Beaches
Bold Park Aquatic Centre 3.43 (998,558) (1,008,100) (1,042,044) (1,893,500)
Ocean Beaches 3.46 (244,115) (223,000) (179,564) (234,000)
Ocean Beaches - Buildings 3.56 0 0 (3,000) 0
Ocean Beaches - Grounds 3.49 0 (210,000) (2,501) (10,000)
(1,242,674) (1,441,100) (1,227,108) (2,137,500)
Other Sport & Recreation
Clubs - Leased Premises 3.50 (202,934) (488,500) (256,403) (234,800)
Sports Grounds 3.51 (1,051,932) (6,281,500) (5,454,870) (54,000)
Parks 3.54 (78,272) (67,600) (75,201) (61,000)
Wembley Golf Complex 3.57 (6,047,511) (6,945,500) (6,811,105) (7,058,500)
Recreation Services 3.66 (16,286) (25,000) (52,698) (15,000)
(7,396,935) (13,808,100) (12,650,277) (7,423,300)
Libraries
Cambridge Library 3.67 (54,341) (53,500) (49,052) (47,500)
Other Culture
Quarry Amphitheatre 3.68 (228,971) (238,000) (252,737) (248,000)
Total Revenue (9,652,742) (16,198,700) (14,917,910) (10,563,500)
Expenditure
Public Halls & Civic Centres
Wembley Community Centre 3.40 321,495 325,600 325,721 343,200
Leederville Town Hall 3.41 98,698 105,800 108,030 90,800
The Boulevard Centre 3.42 526,677 575,500 590,671 558,500
946,871 1,006,900 1,024,422 992,500
Swimming Areas & Beaches
Bold Park Aquatic Centre 3.43 1,558,562 1,623,500 1,562,249 1,539,700
Ocean Beaches - Buildings 3.47 185,219 220,700 273,812 236,400
Ocean Beaches - Grounds 3.48 676,566 727,500 763,978 752,000
Ocean Beaches - Other 3.49 6,200 7,000 8,975 7,000
2,426,546 2,578,700 2,609,014 2,535,100
Other Sport & Recreation
Clubs - Leased Premises 3.50 434,405 633,500 544,661 731,800
Sports Grounds - Buildings 3.52 262,001 291,200 260,736 320,100
Sports Grounds - Grounds 3.53 807,020 791,800 764,789 773,500
Parks - Buildings 3.55 40,568 79,100 49,705 93,600
Parks - Grounds 3.56 2,493,654 2,522,400 2,572,515 2,658,200
Wembley Golf Complex 3.57 5,878,853 5,898,000 6,068,215 6,093,500
Recreation Services 3.66 602,108 790,000 772,081 677,400
10,518,609 11,006,000 11,032,701 11,348,100
Libraries
Cambridge Library 3.67 1,872,805 2,086,000 1,912,242 2,083,000
Other Culture
Quarry Amphitheatre 3.68 324,130 318,200 337,598 329,700
Total Expenditure 16,088,961 16,995,800 16,915,978 17,288,400
Recreation & Culture (Net) 6,436,220 797,100 1,998,069 6,724,900________________________________________________________________________________________
Page 3.9

Town of Cambridge
Page Actual Budget Est. Actual Budget
No. 2011/2012 2012/2013 30 Jun 2013 2013/2014
$ $ $ $
TRANSPORT
Revenue
Maintenance Streets, Roads, Depots
Road Infrastructure 3.69 (952,654) (1,296,000) (1,036,736) (1,646,000)
Road Reserves 3.70 (80,100) (90,000) (85,326) (90,500)
Depot 3.71
(1,032,754) (1,386,000) (1,122,062) (1,736,500)
Parking Facilities
Parking Control 3.72 (1,448,123) (1,516,000) (1,535,847) (1,774,500)
Total Revenue (2,480,876) (2,902,000) (2,657,909) (3,511,000)
Expenditure
Maintenance Streets, Roads, Depots
Road Infrastructure 3.69 4,480,584 4,713,900 4,654,941 5,157,200
Road Reserves 3.70 1,208,548 1,648,000 1,461,781 1,630,500
Depot 3.71 306,294 327,500 315,127 341,300
- Less Allocated (306,295) (327,500) (315,127) (317,000)
5,689,131 6,361,900 6,116,722 6,812,000
Parking Facilities
Parking Control 3.72 860,775 920,100 868,562 936,900
Total Expenditure 6,549,906 7,282,000 6,985,285 7,748,900
Transport (Net) 4,069,030 4,380,000 4,327,376 4,237,900
________________________________________________________________________________________
Page 3.10

Town of Cambridge
Page Actual Budget Est. Actual Budget
No. 2011/2012 2012/2013 30 Jun 2013 2013/2014
$ $ $ $
ECONOMIC SERVICES
Revenue
Building Control
Building Control 3.73 (559,400) (567,000) (435,915) (462,000)
Swimming Pool Inspections 3.74 (131,005) 0 (545) (3,000)
(690,405) (567,000) (436,460) (465,000)
Total Revenue (690,405) (567,000) (436,460) (465,000)
Expenditure
Building Control
Building Control 3.73 586,233 565,400 556,256 597,500
Swimming Pool Inspections 3.74 23,932 140,400 91,090 3,000
610,166 705,800 647,345 600,500
Total Expenditure 610,166 705,800 647,345 600,500
Economic Services (Net) (80,239) 138,800 210,885 135,500
________________________________________________________________________________________
Page 3.11
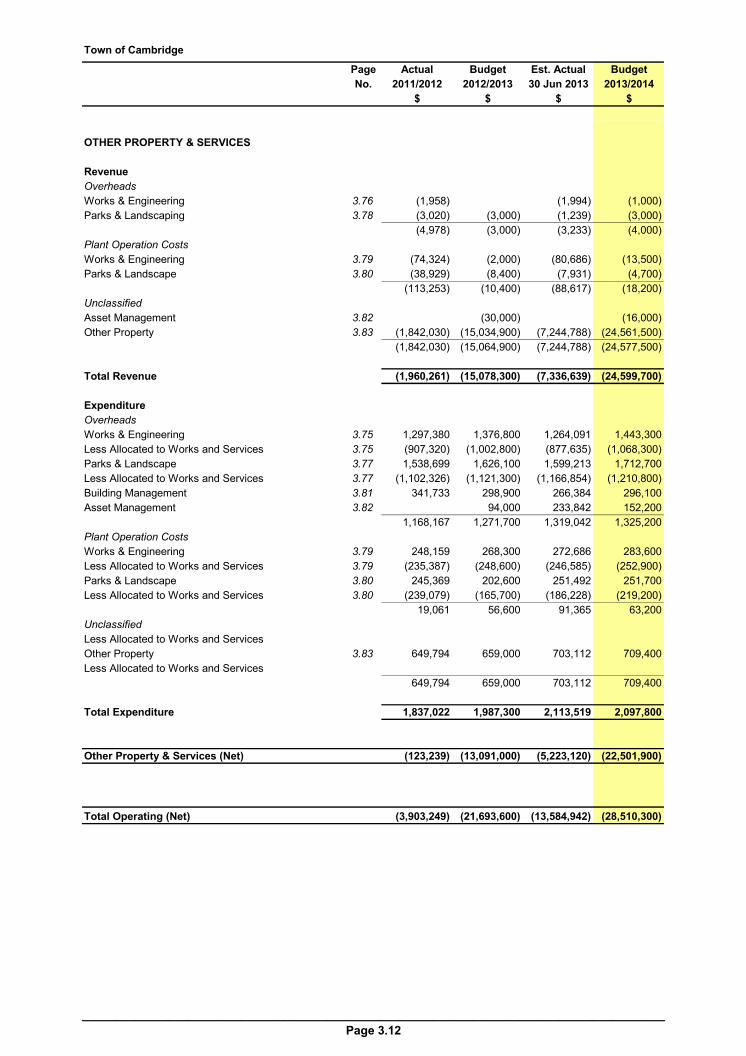
Town of Cambridge
Page Actual Budget Est. Actual Budget
No. 2011/2012 2012/2013 30 Jun 2013 2013/2014
$ $ $ $
OTHER PROPERTY & SERVICES
Revenue
Overheads
Works & Engineering 3.76 (1,958) 0 (1,994) (1,000)
Parks & Landscaping 3.78 (3,020) (3,000) (1,239) (3,000)
(4,978) (3,000) (3,233) (4,000)
Plant Operation Costs
Works & Engineering 3.79 (74,324) (2,000) (80,686) (13,500)
Parks & Landscape 3.80 (38,929) (8,400) (7,931) (4,700)
(113,253) (10,400) (88,617) (18,200)
Unclassified
Asset Management 3.82 0 (30,000) 0 (16,000)
Other Property 3.83 (1,842,030) (15,034,900) (7,244,788) (24,561,500)
(1,842,030) (15,064,900) (7,244,788) (24,577,500)
Total Revenue (1,960,261) (15,078,300) (7,336,639) (24,599,700)
Expenditure
Overheads
Works & Engineering 3.75 1,297,380 1,376,800 1,264,091 1,443,300
Less Allocated to Works and Services 3.75 (907,320) (1,002,800) (877,635) (1,068,300)
Parks & Landscape 3.77 1,538,699 1,626,100 1,599,213 1,712,700
Less Allocated to Works and Services 3.77 (1,102,326) (1,121,300) (1,166,854) (1,210,800)
Building Management 3.81 341,733 298,900 266,384 296,100
Asset Management 3.82 0 94,000 233,842 152,200
1,168,167 1,271,700 1,319,042 1,325,200
Plant Operation Costs
Works & Engineering 3.79 248,159 268,300 272,686 283,600
Less Allocated to Works and Services 3.79 (235,387) (248,600) (246,585) (252,900)
Parks & Landscape 3.80 245,369 202,600 251,492 251,700
Less Allocated to Works and Services 3.80 (239,079) (165,700) (186,228) (219,200)
19,061 56,600 91,365 63,200
Unclassified
Less Allocated to Works and Services 0 0 0 0
Other Property 3.83 649,794 659,000 703,112 709,400
Less Allocated to Works and Services 0 0 0 0
649,794 659,000 703,112 709,400
Total Expenditure 1,837,022 1,987,300 2,113,519 2,097,800
Other Property & Services (Net) (123,239) (13,091,000) (5,223,120) (22,501,900)
Total Operating (Net) (3,903,249) (21,693,600) (13,584,942) (28,510,300)
________________________________________________________________________________________
Page 3.12

OPERATING BUDGET
SCHEDULE
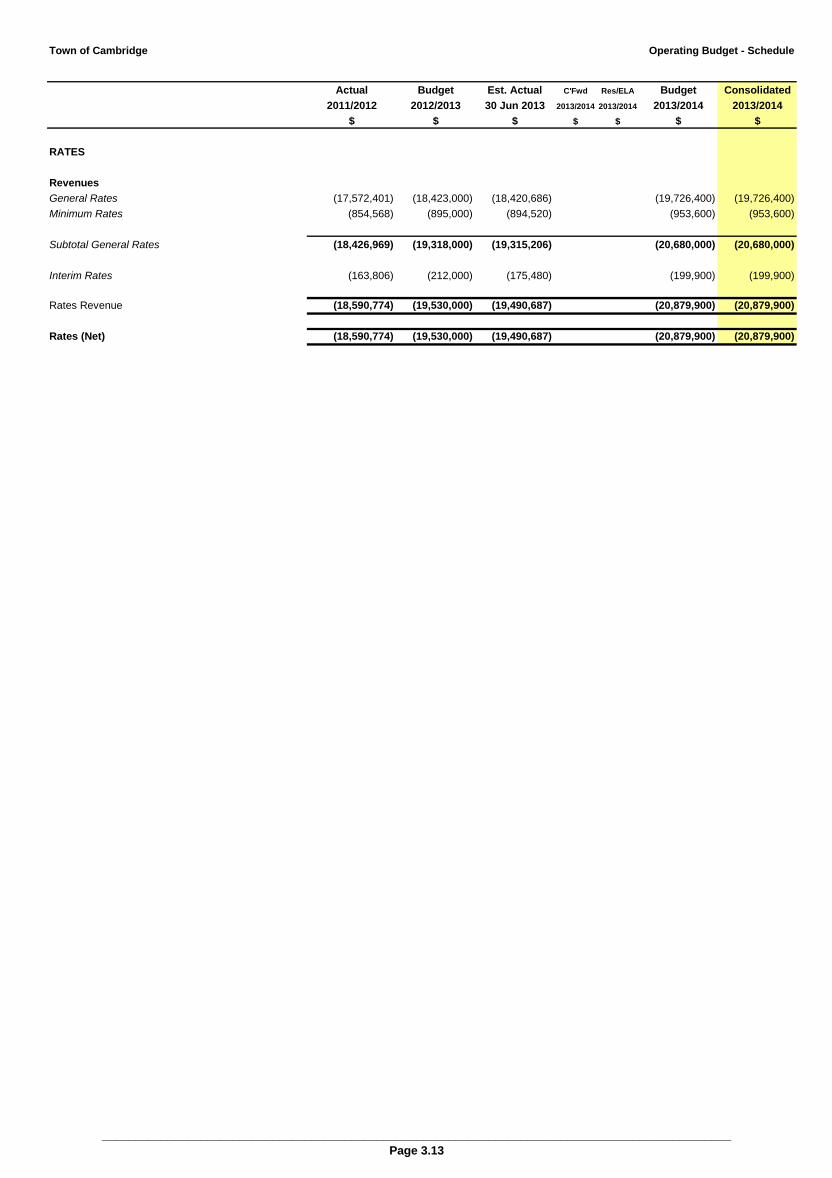
Town of Cambridge Operating Budget - Schedule
Actual Budget Est. Actual C'Fwd Res/ELA Budget Consolidated
2011/2012 2012/2013 30 Jun 2013 2013/2014 2013/2014 2013/2014 2013/2014
$ $ $ $ $ $ $
RATES
Revenues
General Rates (17,572,401) (18,423,000) (18,420,686) (19,726,400) (19,726,400)
Minimum Rates (854,568) (895,000) (894,520) (953,600) (953,600)
Subtotal General Rates (18,426,969) (19,318,000) (19,315,206) (20,680,000) (20,680,000)
Interim Rates (163,806) (212,000) (175,480) (199,900) (199,900)
Rates Revenue (18,590,774) (19,530,000) (19,490,687) (20,879,900) (20,879,900)
Rates (Net) (18,590,774) (19,530,000) (19,490,687) (20,879,900) (20,879,900)
________________________________________________________________________________________________
Page 3.13
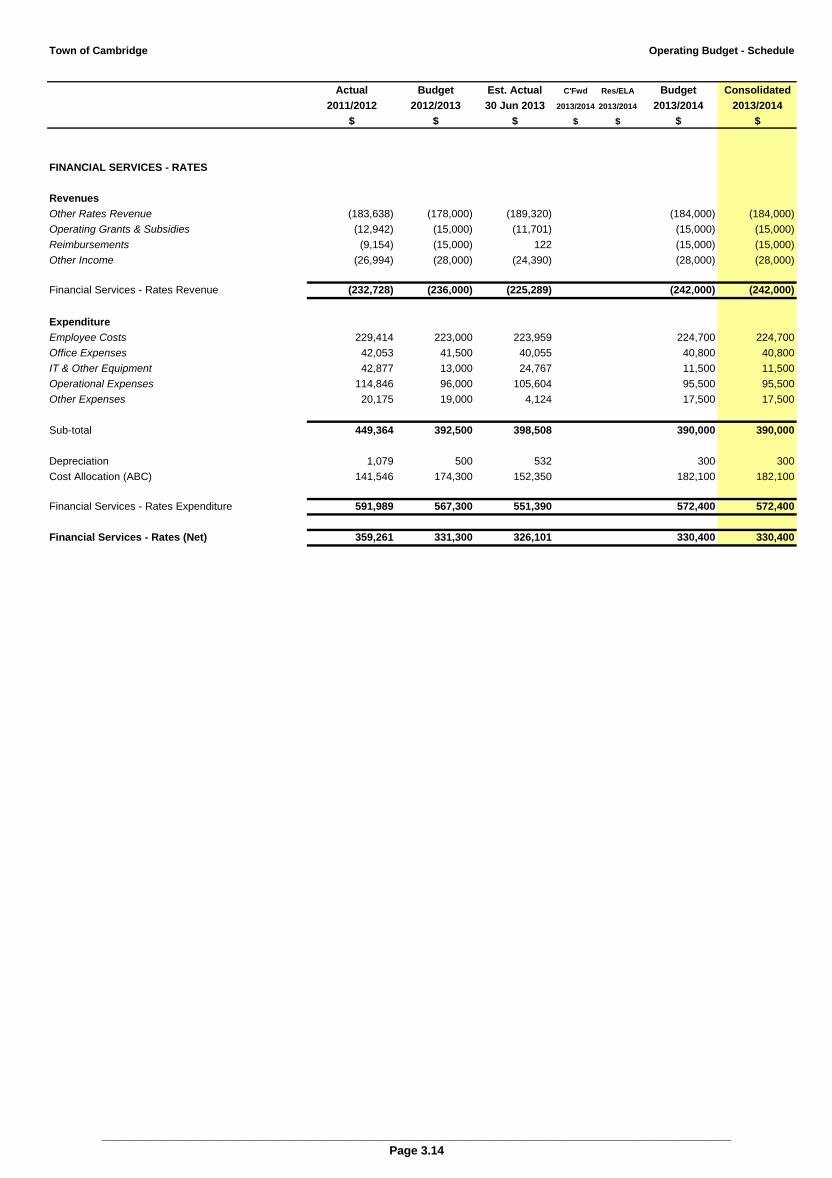
Town of Cambridge Operating Budget - Schedule
Actual Budget Est. Actual C'Fwd Res/ELA Budget Consolidated
2011/2012 2012/2013 30 Jun 2013 2013/2014 2013/2014 2013/2014 2013/2014
$ $ $ $ $ $ $
FINANCIAL SERVICES - RATES
Revenues
Other Rates Revenue (183,638) (178,000) (189,320) (184,000) (184,000)
Operating Grants & Subsidies (12,942) (15,000) (11,701) (15,000) (15,000)
Reimbursements (9,154) (15,000) 122 (15,000) (15,000)
Other Income (26,994) (28,000) (24,390) (28,000) (28,000)
Financial Services - Rates Revenue (232,728) (236,000) (225,289) (242,000) (242,000)
Expenditure
Employee Costs 229,414 223,000 223,959 224,700 224,700
Office Expenses 42,053 41,500 40,055 40,800 40,800
IT & Other Equipment 42,877 13,000 24,767 11,500 11,500
Operational Expenses 114,846 96,000 105,604 95,500 95,500
Other Expenses 20,175 19,000 4,124 17,500 17,500
Sub-total 449,364 392,500 398,508 390,000 390,000
Depreciation 1,079 500 532 300 300
Cost Allocation (ABC) 141,546 174,300 152,350 182,100 182,100
Financial Services - Rates Expenditure 591,989 567,300 551,390 572,400 572,400
Financial Services - Rates (Net) 359,261 331,300 326,101 330,400 330,400
________________________________________________________________________________________________
Page 3.14

Town of Cambridge Operating Budget - Schedule
Actual Budget Est. Actual C'Fwd Res/ELA Budget Consolidated
2011/2012 2012/2013 30 Jun 2013 2013/2014 2013/2014 2013/2014 2013/2014
$ $ $ $ $ $ $
GENERAL PURPOSE GRANTS
Revenues
Operating Grants & Subsidies (1,148,500) (434,400) (915,220) (934,000) (934,000)
General Purpose Grants Revenue (1,148,500) (434,400) (915,220) (934,000) (934,000)
GENERAL FINANCING
Revenues
Interest Earnings (1,519,326) (1,345,400) (1,332,410) (1,120,000) (1,120,000)
General Financing Revenue (1,519,326) (1,345,400) (1,332,410) (1,120,000) (1,120,000)
Expenditure
Operational Expenses 21,015 21,000 21,828 22,000 22,000
General Financing Expenditure 21,015 21,000 21,828 22,000 22,000
General Financing (Net) (1,498,311) (1,324,400) (1,310,582) (1,098,000) (1,098,000)
________________________________________________________________________________________________
Page 3.15

Town of Cambridge Operating Budget - Schedule
Actual Budget Est. Actual C'Fwd Res/ELA Budget Consolidated
2011/2012 2012/2013 30 Jun 2013 2013/2014 2013/2014 2013/2014 2013/2014
$ $ $ $ $ $ $
MEMBERS EXPENSES
Revenues
Fees & Charges - Non-Local Govt Property (782) (1,000) (155)
Members Expenses Revenue (782) (1,000) (155)
Expenditure
Employee Costs 190,214 173,300 196,184 173,800 173,800
Office Expenses 3,748 4,500 2,738 4,500 4,500
IT & Other Equipment 14,619 16,500 8,770 10,500 10,500
Operational Expenses 29,139 35,300 35,323 37,300 37,300
Other Expenses 264,015 248,500 239,370 403,500 403,500
Sub-total 501,735 478,100 482,386 629,600 629,600
Depreciation 729 700 729 700 700
Cost Allocation (ABC) 236,899 276,100 262,835 282,400 282,400
Members Expenses Expenditure 739,363 754,900 745,950 912,700 912,700
Members Expenses (Net) 738,581 753,900 745,796 912,700 912,700
________________________________________________________________________________________________
Page 3.16
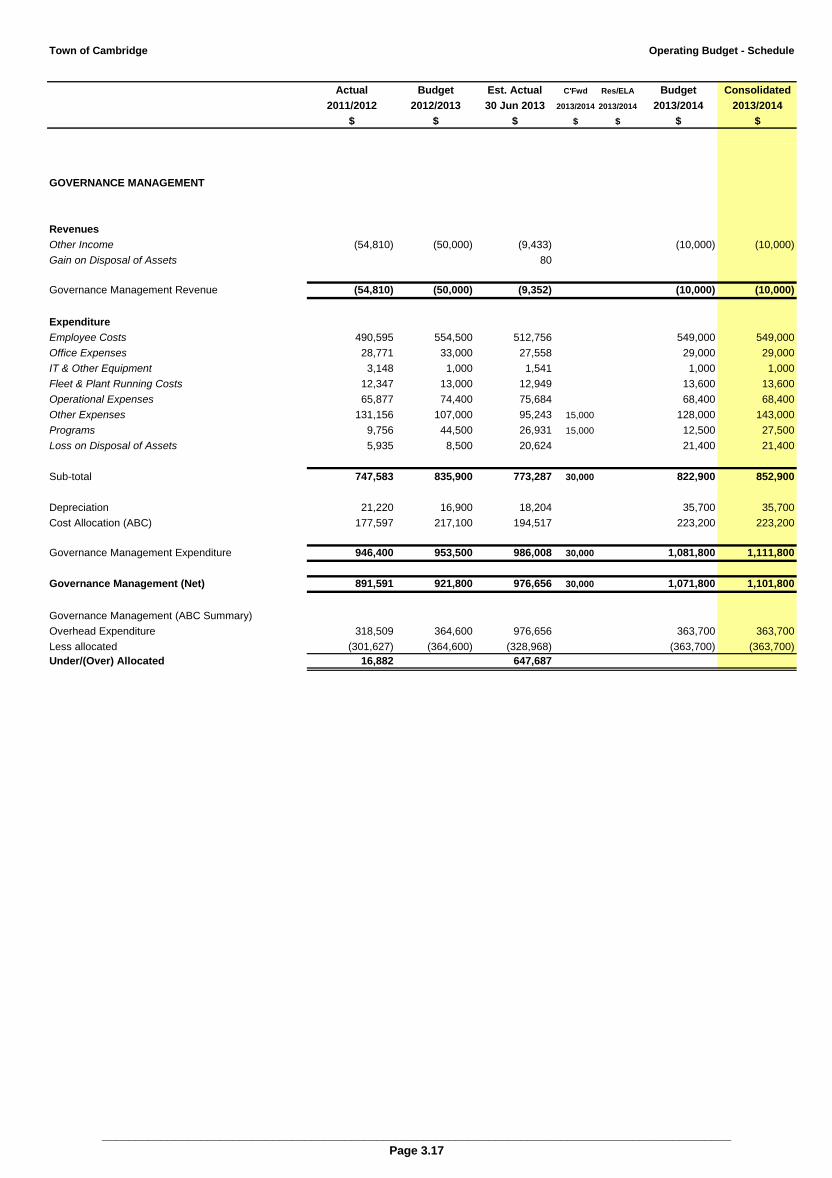
Town of Cambridge Operating Budget - Schedule
Actual Budget Est. Actual C'Fwd Res/ELA Budget Consolidated
2011/2012 2012/2013 30 Jun 2013 2013/2014 2013/2014 2013/2014 2013/2014
$ $ $ $ $ $ $
GOVERNANCE MANAGEMENT
Revenues
Other Income (54,810) (50,000) (9,433) (10,000) (10,000)
Gain on Disposal of Assets 80
Governance Management Revenue (54,810) (50,000) (9,352) (10,000) (10,000)
Expenditure
Employee Costs 490,595 554,500 512,756 549,000 549,000
Office Expenses 28,771 33,000 27,558 29,000 29,000
IT & Other Equipment 3,148 1,000 1,541 1,000 1,000
Fleet & Plant Running Costs 12,347 13,000 12,949 13,600 13,600
Operational Expenses 65,877 74,400 75,684 68,400 68,400
Other Expenses 131,156 107,000 95,243 15,000 128,000 143,000
Programs 9,756 44,500 26,931 15,000 12,500 27,500
Loss on Disposal of Assets 5,935 8,500 20,624 21,400 21,400
Sub-total 747,583 835,900 773,287 30,000 822,900 852,900
Depreciation 21,220 16,900 18,204 35,700 35,700
Cost Allocation (ABC) 177,597 217,100 194,517 223,200 223,200
Governance Management Expenditure 946,400 953,500 986,008 30,000 1,081,800 1,111,800
Governance Management (Net) 891,591 921,800 976,656 30,000 1,071,800 1,101,800
Governance Management (ABC Summary)
Overhead Expenditure 318,509 364,600 976,656 363,700 363,700
Less allocated (301,627) (364,600) (328,968) (363,700) (363,700)
Under/(Over) Allocated 16,882 647,687
________________________________________________________________________________________________
Page 3.17
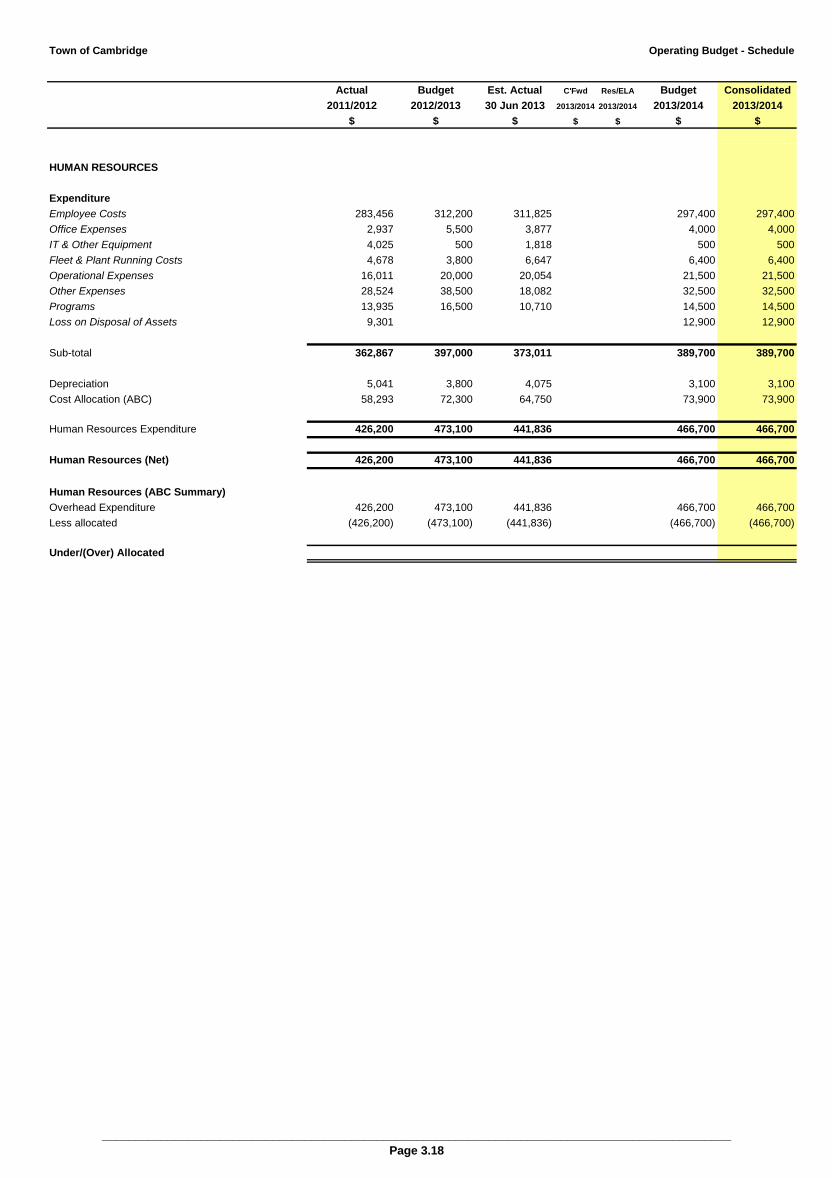
Town of Cambridge Operating Budget - Schedule
Actual Budget Est. Actual C'Fwd Res/ELA Budget Consolidated
2011/2012 2012/2013 30 Jun 2013 2013/2014 2013/2014 2013/2014 2013/2014
$ $ $ $ $ $ $
HUMAN RESOURCES
Expenditure
Employee Costs 283,456 312,200 311,825 297,400 297,400
Office Expenses 2,937 5,500 3,877 4,000 4,000
IT & Other Equipment 4,025 500 1,818 500 500
Fleet & Plant Running Costs 4,678 3,800 6,647 6,400 6,400
Operational Expenses 16,011 20,000 20,054 21,500 21,500
Other Expenses 28,524 38,500 18,082 32,500 32,500
Programs 13,935 16,500 10,710 14,500 14,500
Loss on Disposal of Assets 9,301 12,900 12,900
Sub-total 362,867 397,000 373,011 389,700 389,700
Depreciation 5,041 3,800 4,075 3,100 3,100
Cost Allocation (ABC) 58,293 72,300 64,750 73,900 73,900
Human Resources Expenditure 426,200 473,100 441,836 466,700 466,700
Human Resources (Net) 426,200 473,100 441,836 466,700 466,700
Human Resources (ABC Summary)
Overhead Expenditure 426,200 473,100 441,836 466,700 466,700
Less allocated (426,200) (473,100) (441,836) (466,700) (466,700)
Under/(Over) Allocated
________________________________________________________________________________________________
Page 3.18
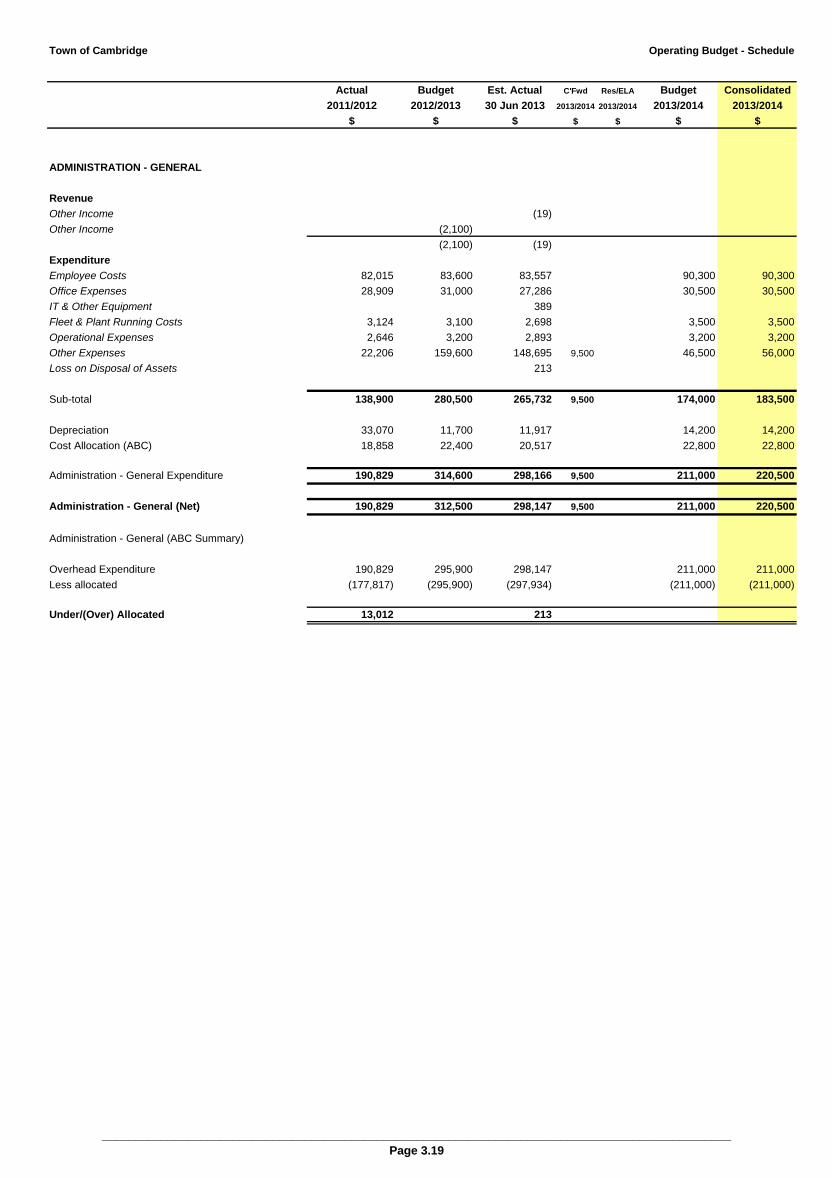
Town of Cambridge Operating Budget - Schedule
Actual Budget Est. Actual C'Fwd Res/ELA Budget Consolidated
2011/2012 2012/2013 30 Jun 2013 2013/2014 2013/2014 2013/2014 2013/2014
$ $ $ $ $ $ $
ADMINISTRATION - GENERAL
Revenue
Other Income (19)
Other Income (2,100)
(2,100) (19)
Expenditure
Employee Costs 82,015 83,600 83,557 90,300 90,300
Office Expenses 28,909 31,000 27,286 30,500 30,500
IT & Other Equipment 389
Fleet & Plant Running Costs 3,124 3,100 2,698 3,500 3,500
Operational Expenses 2,646 3,200 2,893 3,200 3,200
Other Expenses 22,206 159,600 148,695 9,500 46,500 56,000
Loss on Disposal of Assets 213
Sub-total 138,900 280,500 265,732 9,500 174,000 183,500
Depreciation 33,070 11,700 11,917 14,200 14,200
Cost Allocation (ABC) 18,858 22,400 20,517 22,800 22,800
Administration - General Expenditure 190,829 314,600 298,166 9,500 211,000 220,500
Administration - General (Net) 190,829 312,500 298,147 9,500 211,000 220,500
Administration - General (ABC Summary)
Overhead Expenditure 190,829 295,900 298,147 211,000 211,000
Less allocated (177,817) (295,900) (297,934) (211,000) (211,000)
Under/(Over) Allocated 13,012 213
________________________________________________________________________________________________
Page 3.19
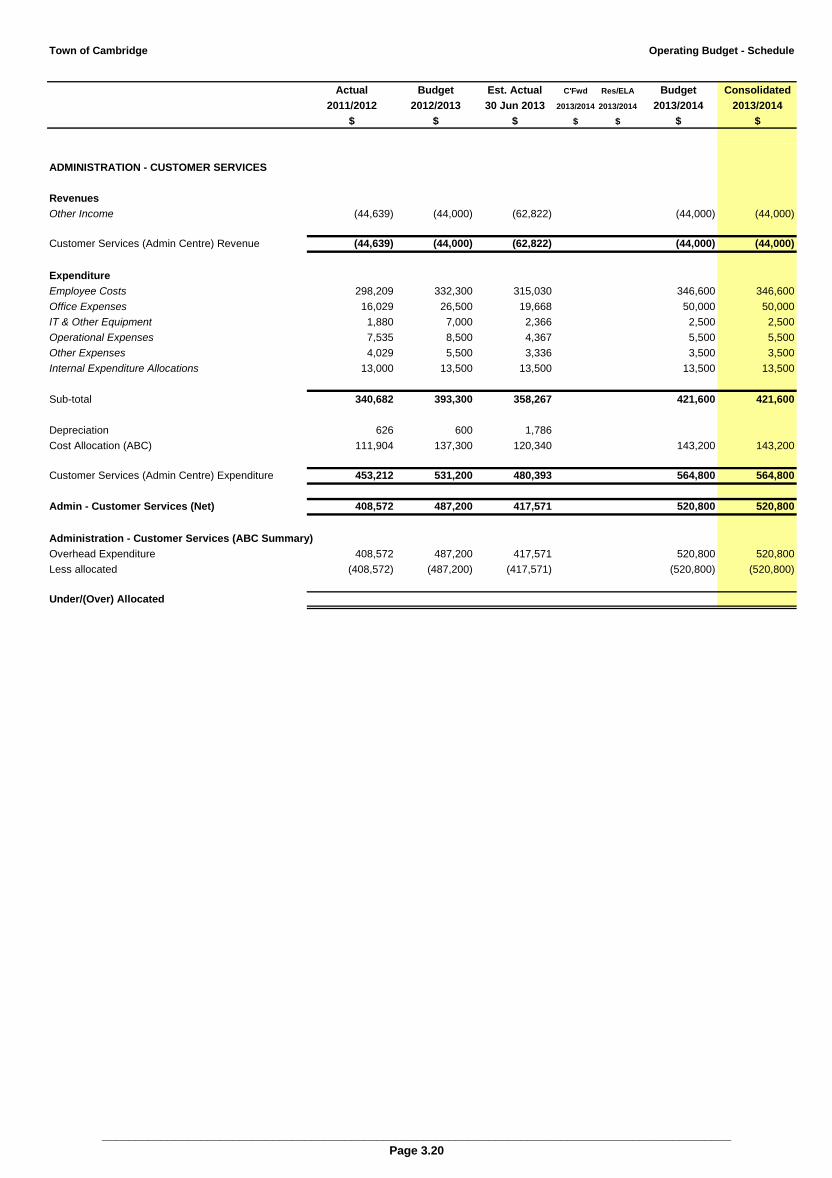
Town of Cambridge Operating Budget - Schedule
Actual Budget Est. Actual C'Fwd Res/ELA Budget Consolidated
2011/2012 2012/2013 30 Jun 2013 2013/2014 2013/2014 2013/2014 2013/2014
$ $ $ $ $ $ $
ADMINISTRATION - CUSTOMER SERVICES
Revenues
Other Income (44,639) (44,000) (62,822) (44,000) (44,000)
Customer Services (Admin Centre) Revenue (44,639) (44,000) (62,822) (44,000) (44,000)
Expenditure
Employee Costs 298,209 332,300 315,030 346,600 346,600
Office Expenses 16,029 26,500 19,668 50,000 50,000
IT & Other Equipment 1,880 7,000 2,366 2,500 2,500
Operational Expenses 7,535 8,500 4,367 5,500 5,500
Other Expenses 4,029 5,500 3,336 3,500 3,500
Internal Expenditure Allocations 13,000 13,500 13,500 13,500 13,500
Sub-total 340,682 393,300 358,267 421,600 421,600
Depreciation 626 600 1,786
Cost Allocation (ABC) 111,904 137,300 120,340 143,200 143,200
Customer Services (Admin Centre) Expenditure 453,212 531,200 480,393 564,800 564,800
Admin - Customer Services (Net) 408,572 487,200 417,571 520,800 520,800
Administration - Customer Services (ABC Summary)
Overhead Expenditure 408,572 487,200 417,571 520,800 520,800
Less allocated (408,572) (487,200) (417,571) (520,800) (520,800)
Under/(Over) Allocated
________________________________________________________________________________________________
Page 3.20
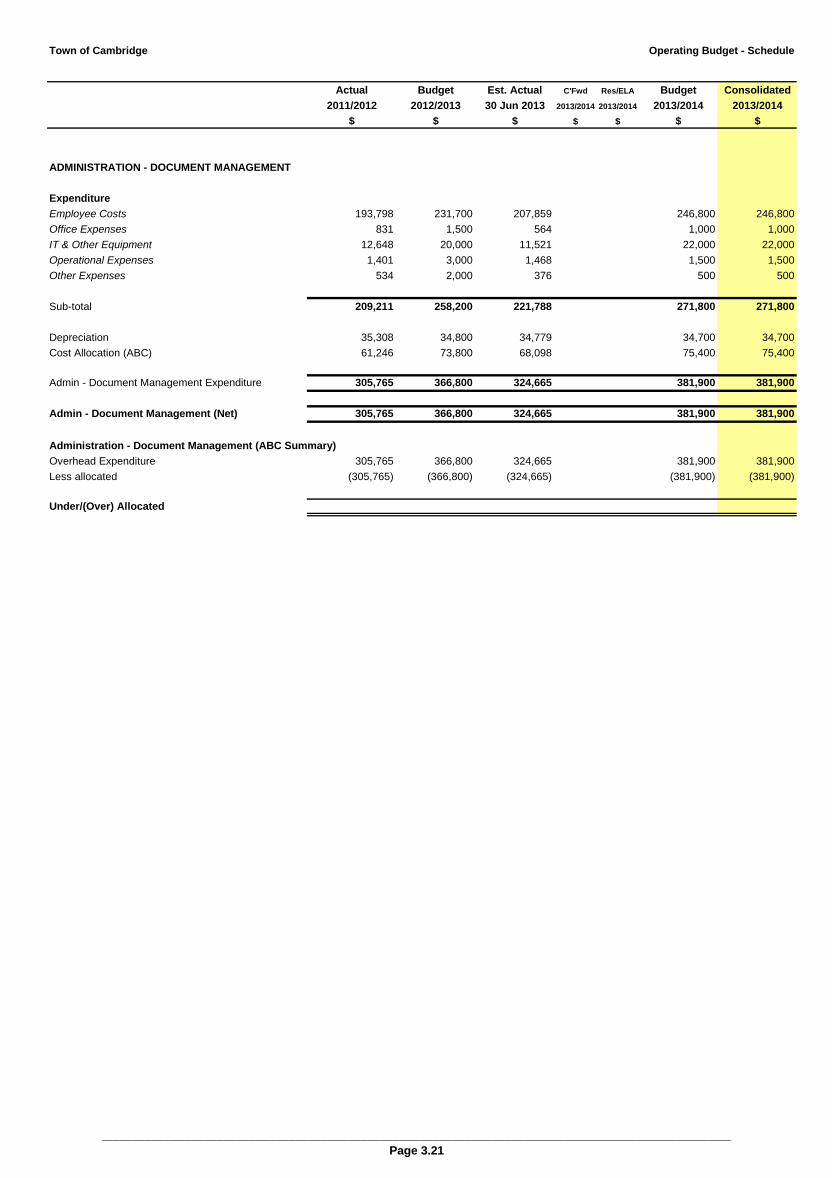
Town of Cambridge Operating Budget - Schedule
Actual Budget Est. Actual C'Fwd Res/ELA Budget Consolidated
2011/2012 2012/2013 30 Jun 2013 2013/2014 2013/2014 2013/2014 2013/2014
$ $ $ $ $ $ $
ADMINISTRATION - DOCUMENT MANAGEMENT
Expenditure
Employee Costs 193,798 231,700 207,859 246,800 246,800
Office Expenses 831 1,500 564 1,000 1,000
IT & Other Equipment 12,648 20,000 11,521 22,000 22,000
Operational Expenses 1,401 3,000 1,468 1,500 1,500
Other Expenses 534 2,000 376 500 500
Sub-total 209,211 258,200 221,788 271,800 271,800
Depreciation 35,308 34,800 34,779 34,700 34,700
Cost Allocation (ABC) 61,246 73,800 68,098 75,400 75,400
Admin - Document Management Expenditure 305,765 366,800 324,665 381,900 381,900
Admin - Document Management (Net) 305,765 366,800 324,665 381,900 381,900
Administration - Document Management (ABC Summary)
Overhead Expenditure 305,765 366,800 324,665 381,900 381,900
Less allocated (305,765) (366,800) (324,665) (381,900) (381,900)
Under/(Over) Allocated
________________________________________________________________________________________________
Page 3.21
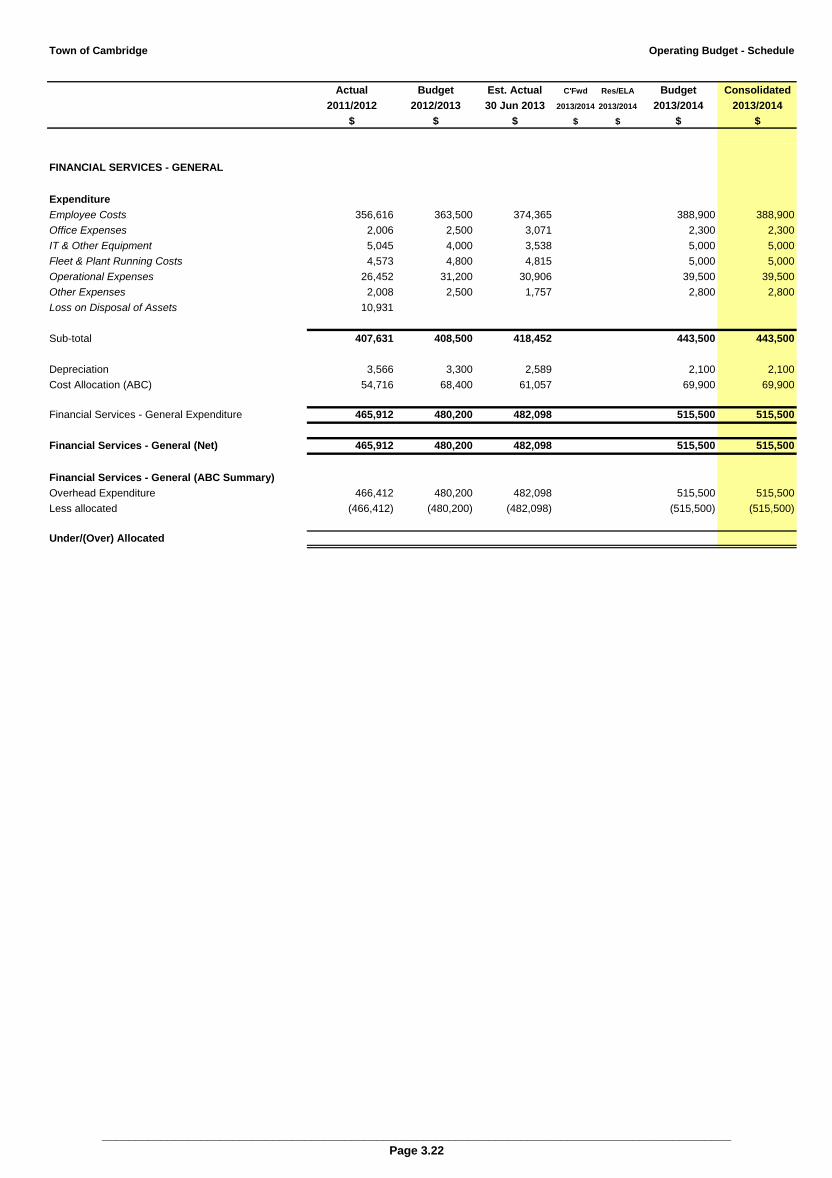
Town of Cambridge Operating Budget - Schedule
Actual Budget Est. Actual C'Fwd Res/ELA Budget Consolidated
2011/2012 2012/2013 30 Jun 2013 2013/2014 2013/2014 2013/2014 2013/2014
$ $ $ $ $ $ $
FINANCIAL SERVICES - GENERAL
Expenditure
Employee Costs 356,616 363,500 374,365 388,900 388,900
Office Expenses 2,006 2,500 3,071 2,300 2,300
IT & Other Equipment 5,045 4,000 3,538 5,000 5,000
Fleet & Plant Running Costs 4,573 4,800 4,815 5,000 5,000
Operational Expenses 26,452 31,200 30,906 39,500 39,500
Other Expenses 2,008 2,500 1,757 2,800 2,800
Loss on Disposal of Assets 10,931
Sub-total 407,631 408,500 418,452 443,500 443,500
Depreciation 3,566 3,300 2,589 2,100 2,100
Cost Allocation (ABC) 54,716 68,400 61,057 69,900 69,900
Financial Services - General Expenditure 465,912 480,200 482,098 515,500 515,500
Financial Services - General (Net) 465,912 480,200 482,098 515,500 515,500
Financial Services - General (ABC Summary)
Overhead Expenditure 466,412 480,200 482,098 515,500 515,500
Less allocated (466,412) (480,200) (482,098) (515,500) (515,500)
Under/(Over) Allocated
________________________________________________________________________________________________
Page 3.22
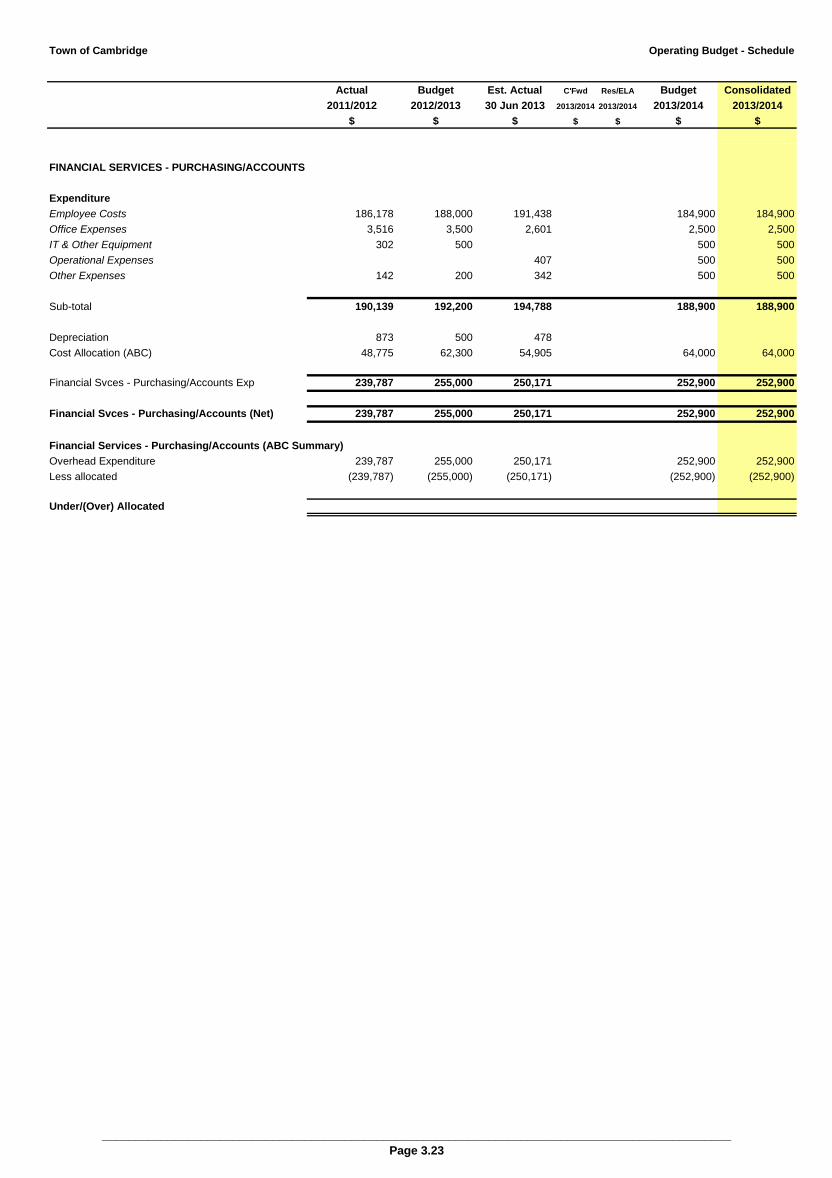
Town of Cambridge Operating Budget - Schedule
Actual Budget Est. Actual C'Fwd Res/ELA Budget Consolidated
2011/2012 2012/2013 30 Jun 2013 2013/2014 2013/2014 2013/2014 2013/2014
$ $ $ $ $ $ $
FINANCIAL SERVICES - PURCHASING/ACCOUNTS
Expenditure
Employee Costs 186,178 188,000 191,438 184,900 184,900
Office Expenses 3,516 3,500 2,601 2,500 2,500
IT & Other Equipment 302 500 500 500
Operational Expenses 407 500 500
Other Expenses 142 200 342 500 500
Sub-total 190,139 192,200 194,788 188,900 188,900
Depreciation 873 500 478
Cost Allocation (ABC) 48,775 62,300 54,905 64,000 64,000
Financial Svces - Purchasing/Accounts Exp 239,787 255,000 250,171 252,900 252,900
Financial Svces - Purchasing/Accounts (Net) 239,787 255,000 250,171 252,900 252,900
Financial Services - Purchasing/Accounts (ABC Summary)
Overhead Expenditure 239,787 255,000 250,171 252,900 252,900
Less allocated (239,787) (255,000) (250,171) (252,900) (252,900)
Under/(Over) Allocated
________________________________________________________________________________________________
Page 3.23
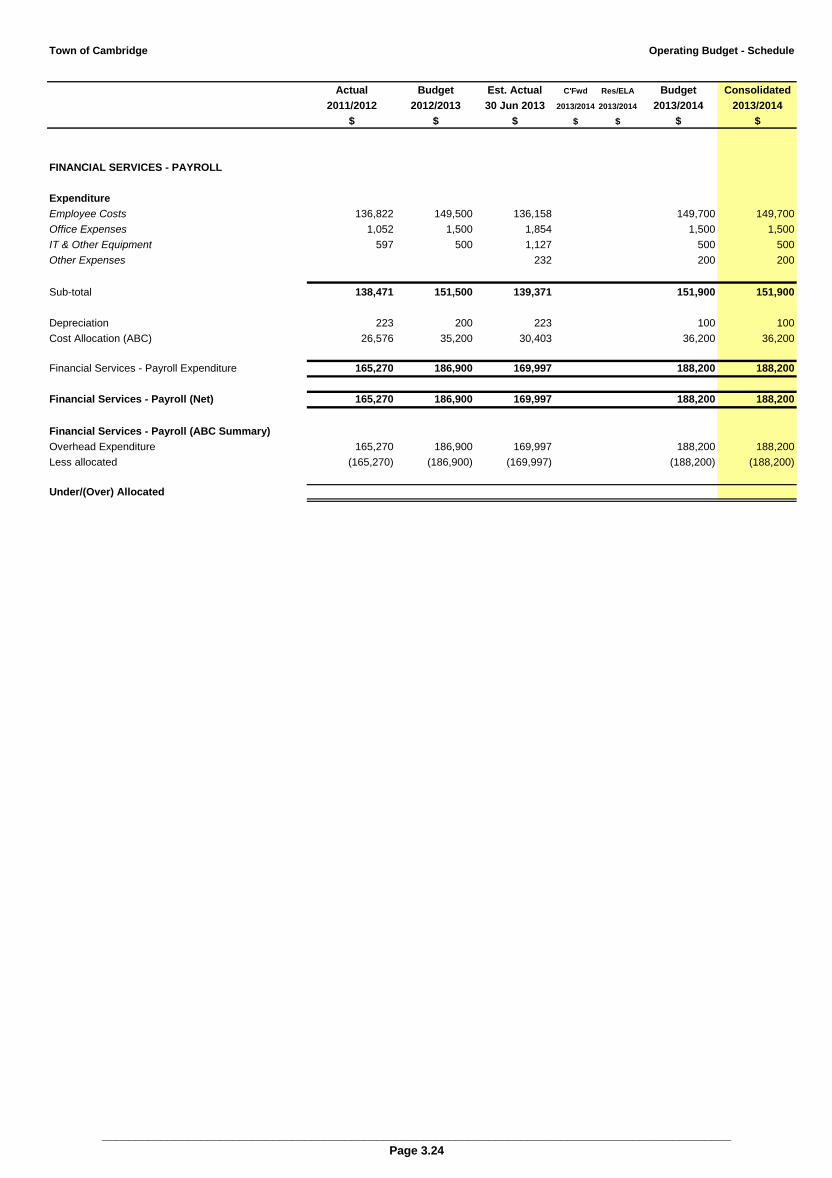
Town of Cambridge Operating Budget - Schedule
Actual Budget Est. Actual C'Fwd Res/ELA Budget Consolidated
2011/2012 2012/2013 30 Jun 2013 2013/2014 2013/2014 2013/2014 2013/2014
$ $ $ $ $ $ $
FINANCIAL SERVICES - PAYROLL
Expenditure
Employee Costs 136,822 149,500 136,158 149,700 149,700
Office Expenses 1,052 1,500 1,854 1,500 1,500
IT & Other Equipment 597 500 1,127 500 500
Other Expenses 232 200 200
Sub-total 138,471 151,500 139,371 151,900 151,900
Depreciation 223 200 223 100 100
Cost Allocation (ABC) 26,576 35,200 30,403 36,200 36,200
Financial Services - Payroll Expenditure 165,270 186,900 169,997 188,200 188,200
Financial Services - Payroll (Net) 165,270 186,900 169,997 188,200 188,200
Financial Services - Payroll (ABC Summary)
Overhead Expenditure 165,270 186,900 169,997 188,200 188,200
Less allocated (165,270) (186,900) (169,997) (188,200) (188,200)
Under/(Over) Allocated
________________________________________________________________________________________________
Page 3.24
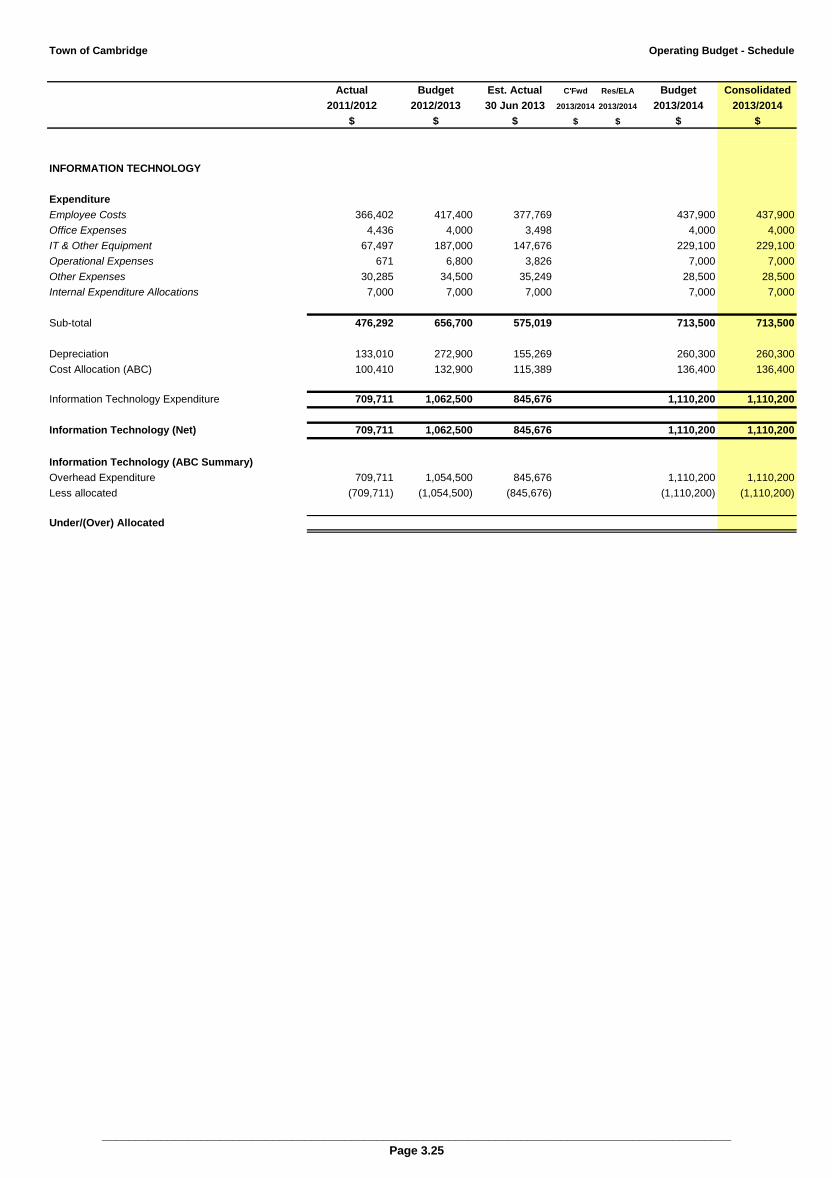
Town of Cambridge Operating Budget - Schedule
Actual Budget Est. Actual C'Fwd Res/ELA Budget Consolidated
2011/2012 2012/2013 30 Jun 2013 2013/2014 2013/2014 2013/2014 2013/2014
$ $ $ $ $ $ $
INFORMATION TECHNOLOGY
Expenditure
Employee Costs 366,402 417,400 377,769 437,900 437,900
Office Expenses 4,436 4,000 3,498 4,000 4,000
IT & Other Equipment 67,497 187,000 147,676 229,100 229,100
Operational Expenses 671 6,800 3,826 7,000 7,000
Other Expenses 30,285 34,500 35,249 28,500 28,500
Internal Expenditure Allocations 7,000 7,000 7,000 7,000 7,000
Sub-total 476,292 656,700 575,019 713,500 713,500
Depreciation 133,010 272,900 155,269 260,300 260,300
Cost Allocation (ABC) 100,410 132,900 115,389 136,400 136,400
Information Technology Expenditure 709,711 1,062,500 845,676 1,110,200 1,110,200
Information Technology (Net) 709,711 1,062,500 845,676 1,110,200 1,110,200
Information Technology (ABC Summary)
Overhead Expenditure 709,711 1,054,500 845,676 1,110,200 1,110,200
Less allocated (709,711) (1,054,500) (845,676) (1,110,200) (1,110,200)
Under/(Over) Allocated
________________________________________________________________________________________________
Page 3.25
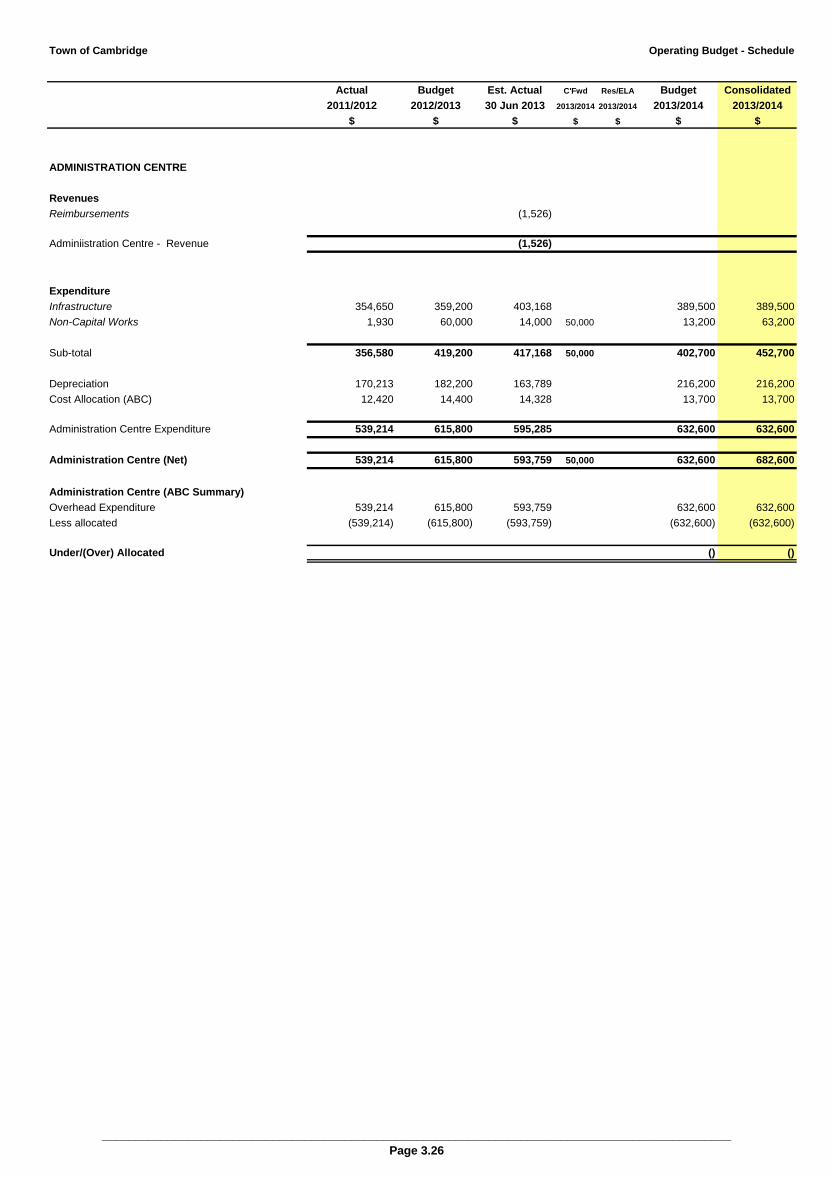
Town of Cambridge Operating Budget - Schedule
Actual Budget Est. Actual C'Fwd Res/ELA Budget Consolidated
2011/2012 2012/2013 30 Jun 2013 2013/2014 2013/2014 2013/2014 2013/2014
$ $ $ $ $ $ $
ADMINISTRATION CENTRE
Revenues
Reimbursements (1,526)
Adminiistration Centre - Revenue (1,526)
Expenditure
Infrastructure 354,650 359,200 403,168 389,500 389,500
Non-Capital Works 1,930 60,000 14,000 50,000 13,200 63,200
Sub-total 356,580 419,200 417,168 50,000 402,700 452,700
Depreciation 170,213 182,200 163,789 216,200 216,200
Cost Allocation (ABC) 12,420 14,400 14,328 13,700 13,700
Administration Centre Expenditure 539,214 615,800 595,285 632,600 632,600
Administration Centre (Net) 539,214 615,800 593,759 50,000 632,600 682,600
Administration Centre (ABC Summary)
Overhead Expenditure 539,214 615,800 593,759 632,600 632,600
Less allocated (539,214) (615,800) (593,759) (632,600) (632,600)
Under/(Over) Allocated () ()
________________________________________________________________________________________________
Page 3.26
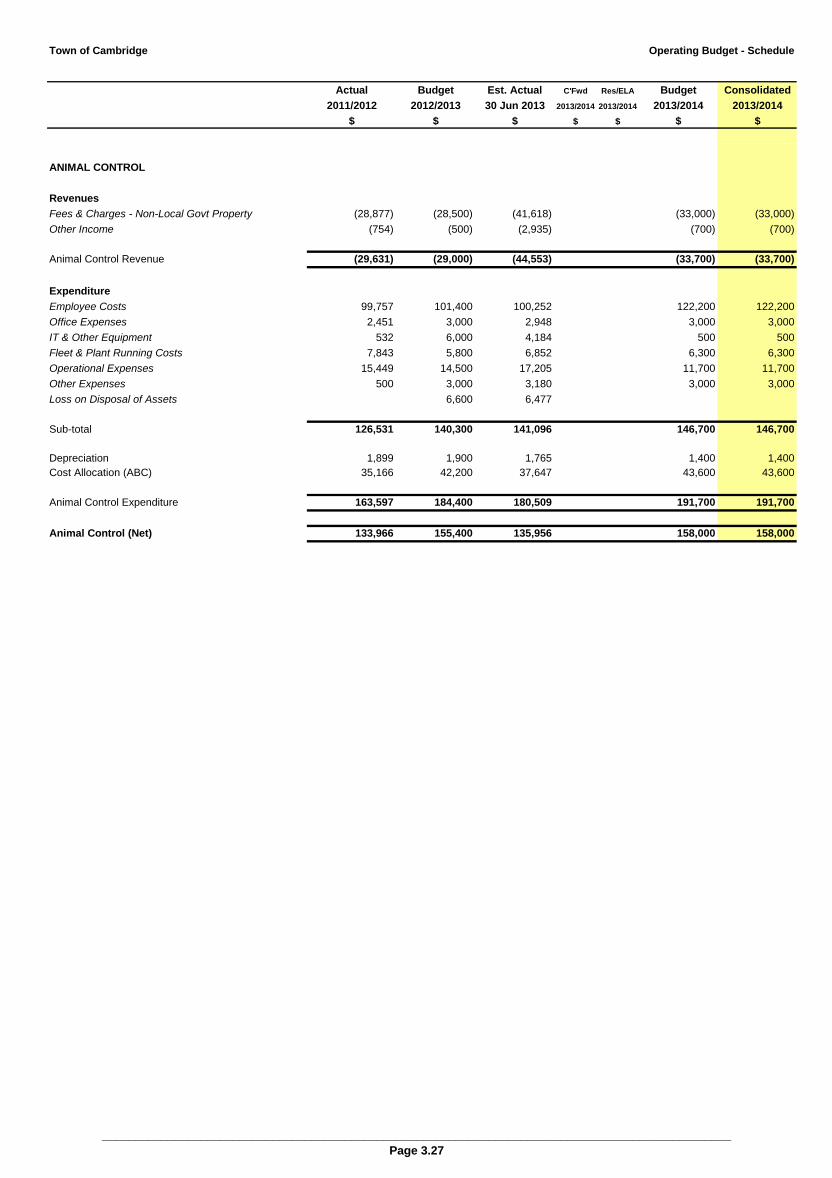
Town of Cambridge Operating Budget - Schedule
Actual Budget Est. Actual C'Fwd Res/ELA Budget Consolidated
2011/2012 2012/2013 30 Jun 2013 2013/2014 2013/2014 2013/2014 2013/2014
$ $ $ $ $ $ $
ANIMAL CONTROL
Revenues
Fees & Charges - Non-Local Govt Property (28,877) (28,500) (41,618) (33,000) (33,000)
Other Income (754) (500) (2,935) (700) (700)
Animal Control Revenue (29,631) (29,000) (44,553) (33,700) (33,700)
Expenditure
Employee Costs 99,757 101,400 100,252 122,200 122,200
Office Expenses 2,451 3,000 2,948 3,000 3,000
IT & Other Equipment 532 6,000 4,184 500 500
Fleet & Plant Running Costs 7,843 5,800 6,852 6,300 6,300
Operational Expenses 15,449 14,500 17,205 11,700 11,700
Other Expenses 500 3,000 3,180 3,000 3,000
Loss on Disposal of Assets 6,600 6,477
Sub-total 126,531 140,300 141,096 146,700 146,700
Depreciation 1,899 1,900 1,765 1,400 1,400
Cost Allocation (ABC) 35,166 42,200 37,647 43,600 43,600
Animal Control Expenditure 163,597 184,400 180,509 191,700 191,700
Animal Control (Net) 133,966 155,400 135,956 158,000 158,000
________________________________________________________________________________________________
Page 3.27
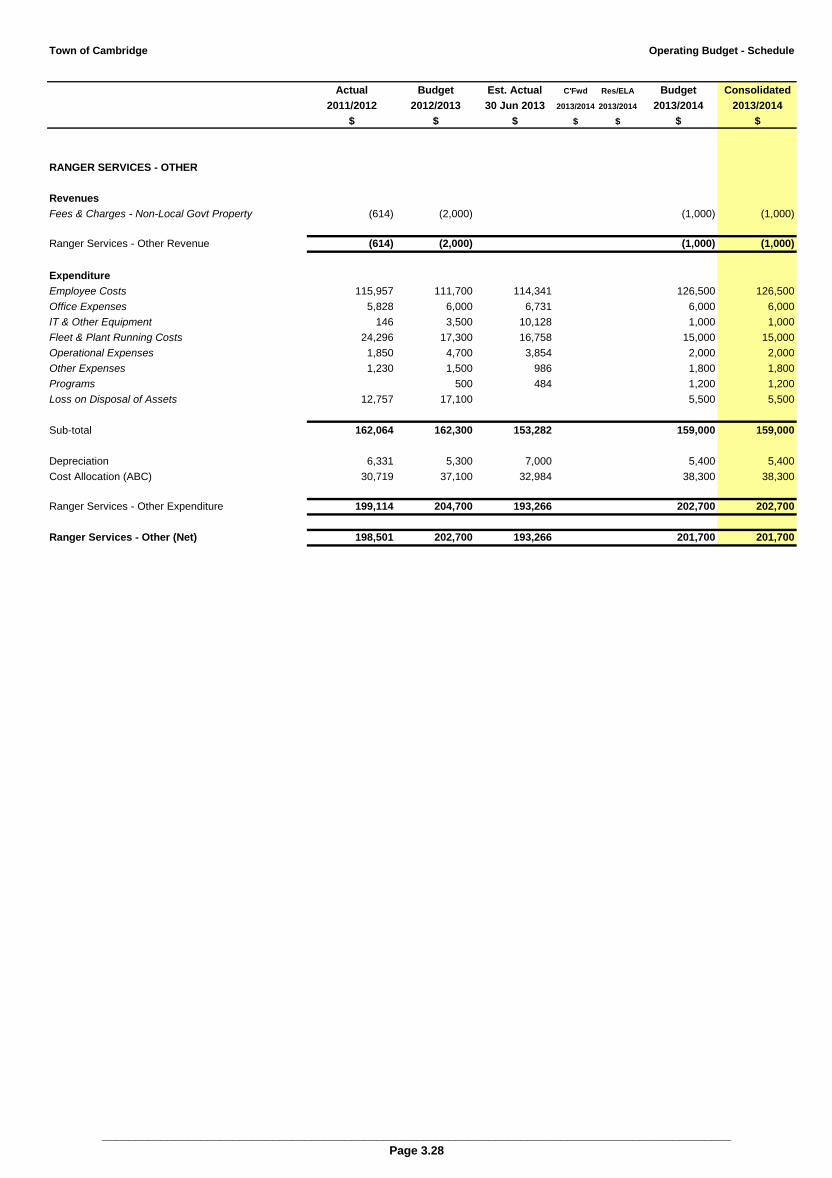
Town of Cambridge Operating Budget - Schedule
Actual Budget Est. Actual C'Fwd Res/ELA Budget Consolidated
2011/2012 2012/2013 30 Jun 2013 2013/2014 2013/2014 2013/2014 2013/2014
$ $ $ $ $ $ $
RANGER SERVICES - OTHER
Revenues
Fees & Charges - Non-Local Govt Property (614) (2,000) (1,000) (1,000)
Ranger Services - Other Revenue (614) (2,000) (1,000) (1,000)
Expenditure
Employee Costs 115,957 111,700 114,341 126,500 126,500
Office Expenses 5,828 6,000 6,731 6,000 6,000
IT & Other Equipment 146 3,500 10,128 1,000 1,000
Fleet & Plant Running Costs 24,296 17,300 16,758 15,000 15,000
Operational Expenses 1,850 4,700 3,854 2,000 2,000
Other Expenses 1,230 1,500 986 1,800 1,800
Programs 500 484 1,200 1,200
Loss on Disposal of Assets 12,757 17,100 5,500 5,500
Sub-total 162,064 162,300 153,282 159,000 159,000
Depreciation 6,331 5,300 7,000 5,400 5,400
Cost Allocation (ABC) 30,719 37,100 32,984 38,300 38,300
Ranger Services - Other Expenditure 199,114 204,700 193,266 202,700 202,700
Ranger Services - Other (Net) 198,501 202,700 193,266 201,700 201,700
________________________________________________________________________________________________
Page 3.28
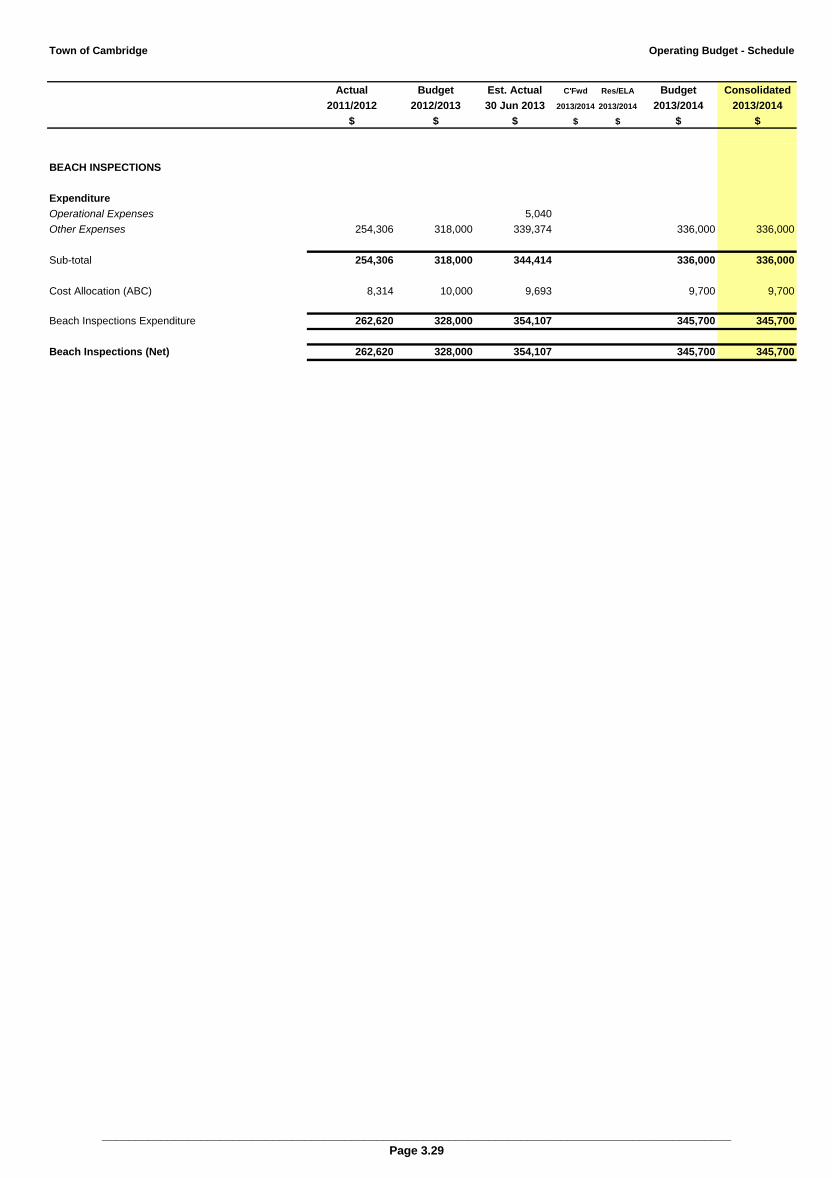
Town of Cambridge Operating Budget - Schedule
Actual Budget Est. Actual C'Fwd Res/ELA Budget Consolidated
2011/2012 2012/2013 30 Jun 2013 2013/2014 2013/2014 2013/2014 2013/2014
$ $ $ $ $ $ $
BEACH INSPECTIONS
Expenditure
Operational Expenses 5,040
Other Expenses 254,306 318,000 339,374 336,000 336,000
Sub-total 254,306 318,000 344,414 336,000 336,000
Cost Allocation (ABC) 8,314 10,000 9,693 9,700 9,700
Beach Inspections Expenditure 262,620 328,000 354,107 345,700 345,700
Beach Inspections (Net) 262,620 328,000 354,107 345,700 345,700
________________________________________________________________________________________________
Page 3.29

Town of Cambridge Operating Budget - Schedule
Actual Budget Est. Actual C'Fwd Res/ELA Budget Consolidated
2011/2012 2012/2013 30 Jun 2013 2013/2014 2013/2014 2013/2014 2013/2014
$ $ $ $ $ $ $
COMPLIANCE
Revenues
Fees & Charges - Non-Local Govt Property (1,000) (1,611) (10,000) (10,000)
Building Control Revenue (1,000) (1,611) (10,000) (10,000)
Expenditure
Employee Costs 278,700 253,448 280,000 280,000
Office Expenses 5,000 882 1,500 1,500
IT & Other Equipment 5,500 1,847 500 500
Fleet & Plant Running Costs 6,000 7,851 8,000 8,000
Operational Expenses 38,500 75,952 20,500 20,500
Other Expenses 10,500 8,640 10,500 10,500
Loss on Disposal of Assets 5,300 7,900 7,900
Sub-total 349,500 348,620 328,900 328,900
Depreciation 3,700 3,660 3,700 3,700
Cost Allocation (ABC) 25,500 24,309 24,800 24,800
Building Control Expenditure 378,700 376,588 357,400 357,400
Building Control (Net) 377,700 374,978 347,400 347,400
________________________________________________________________________________________________
Page 3.30
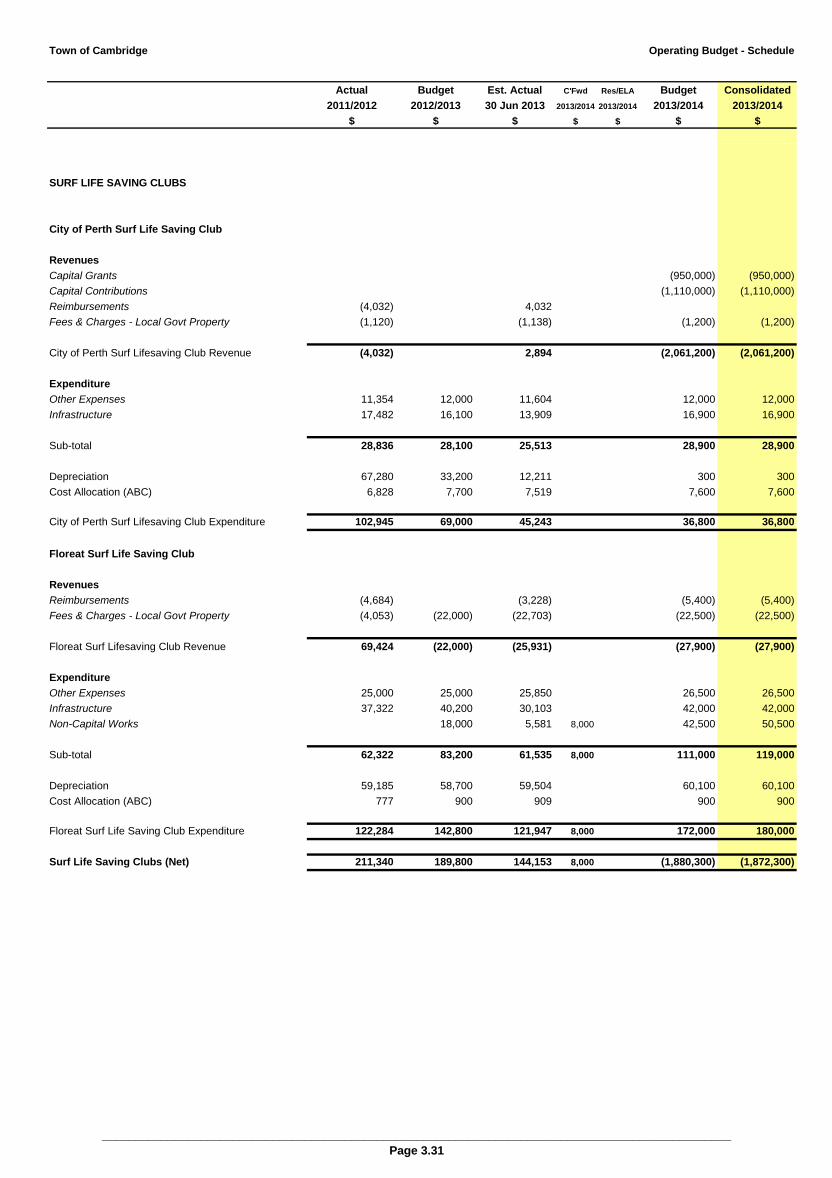
Town of Cambridge Operating Budget - Schedule
Actual Budget Est. Actual C'Fwd Res/ELA Budget Consolidated
2011/2012 2012/2013 30 Jun 2013 2013/2014 2013/2014 2013/2014 2013/2014
$ $ $ $ $ $ $
SURF LIFE SAVING CLUBS
City of Perth Surf Life Saving Club
Revenues
Capital Grants (950,000) (950,000)
Capital Contributions (1,110,000) (1,110,000)
Reimbursements (4,032) 4,032
Fees & Charges - Local Govt Property (1,120) (1,138) (1,200) (1,200)
City of Perth Surf Lifesaving Club Revenue (4,032) 2,894 (2,061,200) (2,061,200)
Expenditure
Other Expenses 11,354 12,000 11,604 12,000 12,000
Infrastructure 17,482 16,100 13,909 16,900 16,900
Sub-total 28,836 28,100 25,513 28,900 28,900
Depreciation 67,280 33,200 12,211 300 300
Cost Allocation (ABC) 6,828 7,700 7,519 7,600 7,600
City of Perth Surf Lifesaving Club Expenditure 102,945 69,000 45,243 36,800 36,800
Floreat Surf Life Saving Club
Revenues
Reimbursements (4,684) (3,228) (5,400) (5,400)
Fees & Charges - Local Govt Property (4,053) (22,000) (22,703) (22,500) (22,500)
Floreat Surf Lifesaving Club Revenue 69,424 (22,000) (25,931) (27,900) (27,900)
Expenditure
Other Expenses 25,000 25,000 25,850 26,500 26,500
Infrastructure 37,322 40,200 30,103 42,000 42,000
Non-Capital Works 18,000 5,581 8,000 42,500 50,500
Sub-total 62,322 83,200 61,535 8,000 111,000 119,000
Depreciation 59,185 58,700 59,504 60,100 60,100
Cost Allocation (ABC) 777 900 909 900 900
Floreat Surf Life Saving Club Expenditure 122,284 142,800 121,947 8,000 172,000 180,000
Surf Life Saving Clubs (Net) 211,340 189,800 144,153 8,000 (1,880,300) (1,872,300)
________________________________________________________________________________________________
Page 3.31
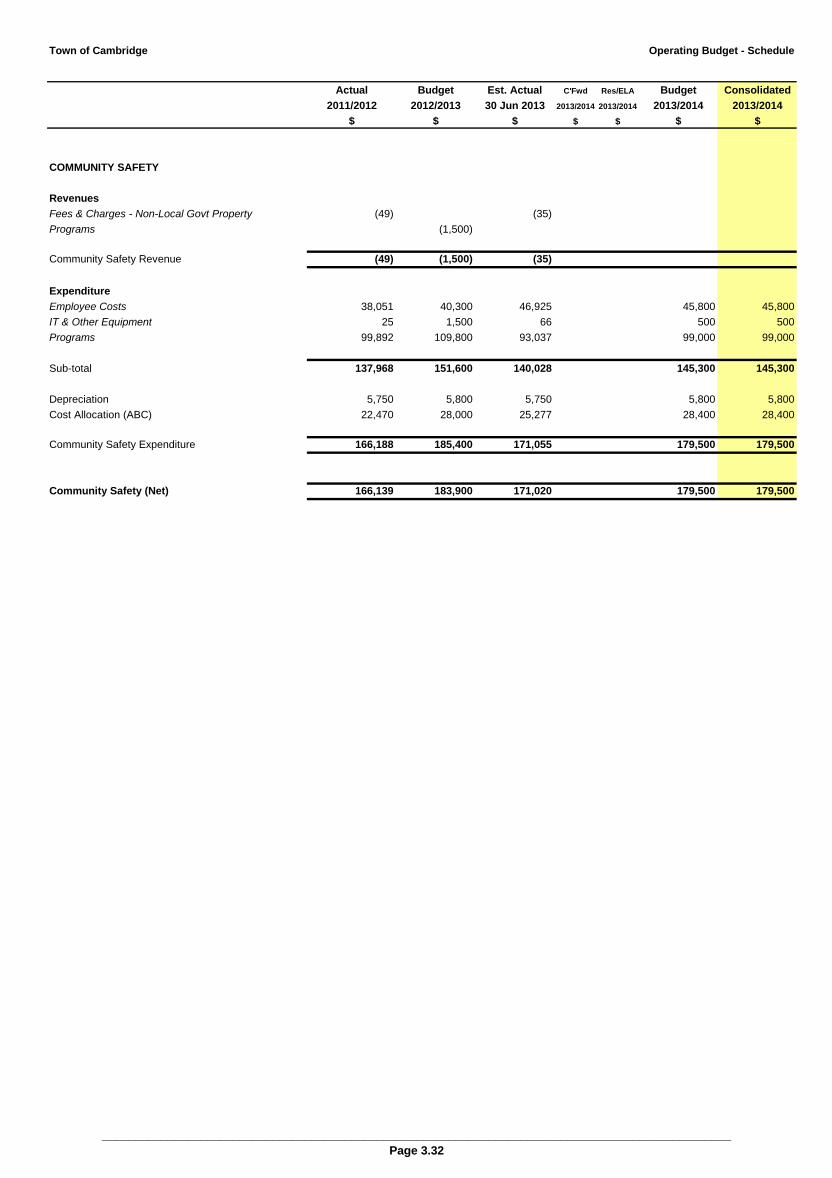
Town of Cambridge Operating Budget - Schedule
Actual Budget Est. Actual C'Fwd Res/ELA Budget Consolidated
2011/2012 2012/2013 30 Jun 2013 2013/2014 2013/2014 2013/2014 2013/2014
$ $ $ $ $ $ $
COMMUNITY SAFETY
Revenues
Fees & Charges - Non-Local Govt Property (49) (35)
Programs (1,500)
Community Safety Revenue (49) (1,500) (35)
Expenditure
Employee Costs 38,051 40,300 46,925 45,800 45,800
IT & Other Equipment 25 1,500 66 500 500
Programs 99,892 109,800 93,037 99,000 99,000
Sub-total 137,968 151,600 140,028 145,300 145,300
Depreciation 5,750 5,800 5,750 5,800 5,800
Cost Allocation (ABC) 22,470 28,000 25,277 28,400 28,400
Community Safety Expenditure 166,188 185,400 171,055 179,500 179,500
Community Safety (Net) 166,139 183,900 171,020 179,500 179,500
________________________________________________________________________________________________
Page 3.32

Town of Cambridge Operating Budget - Schedule
Actual Budget Est. Actual C'Fwd Res/ELA Budget Consolidated
2011/2012 2012/2013 30 Jun 2013 2013/2014 2013/2014 2013/2014 2013/2014
$ $ $ $ $ $ $
HEALTH
Revenues
Fees & Charges - Non-Local Govt Property (55,135) (55,000) (51,701) (45,400) (45,400)
Other Income (2,620) (2,900) (8,874) (5,600) (5,600)
Health Revenue (57,755) (57,900) (60,575) (51,000) (51,000)
Expenditure
Employee Costs 298,111 308,200 298,451 343,500 343,500
Office Expenses 4,676 4,000 4,461 3,700 3,700
IT & Other Equipment 4,650 5,000 8,537 1,800 1,800
Fleet & Plant Running Costs 7,899 5,600 5,961 3,700 3,700
Operational Expenses 12,341 15,900 13,735 14,100 14,100
Other Expenses 11,724 13,500 12,503 12,700 12,700
Loss on Disposal of Assets 6,900 6,500 6,500
Sub-total 339,401 359,100 343,648 386,000 386,000
Depreciation 11,639 10,500 11,862 10,600 10,600
Cost Allocation (ABC) 87,637 108,100 96,858 110,900 110,900
Health Expenditure 438,678 477,700 452,368 507,500 507,500
Health (Net) 380,923 419,800 391,794 456,500 456,500
________________________________________________________________________________________________
Page 3.33

Town of Cambridge Operating Budget - Schedule
Actual Budget Est. Actual C'Fwd Res/ELA Budget Consolidated
2011/2012 2012/2013 30 Jun 2013 2013/2014 2013/2014 2013/2014 2013/2014
$ $ $ $ $ $ $
CAMBRIDGE SENIOR SERVICES - HACC
Revenues
Operating Grants & Subsidies (873,213) (873,000) (908,142) (927,100) (927,100)
Non-Operating Grants & Subsidies (44,493) (26,500) (26,500)
Interest Earnings (6,386) (7,000) (7,924) (7,000) (7,000)
Fees (108,288) (124,500) (122,265) (125,500) (125,500)
Other Income (4,690) (7,000) (11,685) (7,000) (7,000)
Cambridge Senior Services - HACC Revenue (992,576) (1,011,500) (1,094,509) (1,093,100) (1,093,100)
Expenditure
Employee Costs 806,217 867,500 890,953 947,700 947,700
Office Expenses 6,892 7,100 9,325 7,100 7,100
IT & Other Equipment 26,557 13,000 14,715 13,200 13,200
Fleet & Plant Running Costs 18,573 17,200 20,981 22,400 22,400
Operational Expenses 2,702 4,500 2,874 4,500 4,500
Other Expenses 59,914 58,500 52,015 52,200 52,200
Infrastructure 7,262 8,000 6,680 8,000 8,000
Loss on Disposal of Assets 12,505 6,900
Internal Expenditure Allocations 25,000 20,000 20,000 20,000 20,000
Sub-total 965,622 1,002,700 1,017,543 1,075,100 1,075,100
Depreciation 25,771 25,400 26,795 28,400 28,400
Cost Allocation (ABC) 90,456 110,000 100,901 109,500 109,500
Cambridge Senior Services - HACC Expenditure 1,081,849 1,138,100 1,145,238 1,213,000 1,213,000
Cambridge Senior Services - HACC (Net) 89,273 126,600 50,729 119,900 119,900
Less Partial Costs Allocated (72,456) (92,000) (85,901) (91,500) (91,500)
Less Loss on Disposal of Assets (12,505) (6,900)
Less Depreciation (25,771) (25,400) (26,795) (28,400) (28,400)
Transfer to/(from) Reserve 21,459 (2,300) 61,966
Cambridge Senior Services - HACC (Net)
________________________________________________________________________________________________
Page 3.34
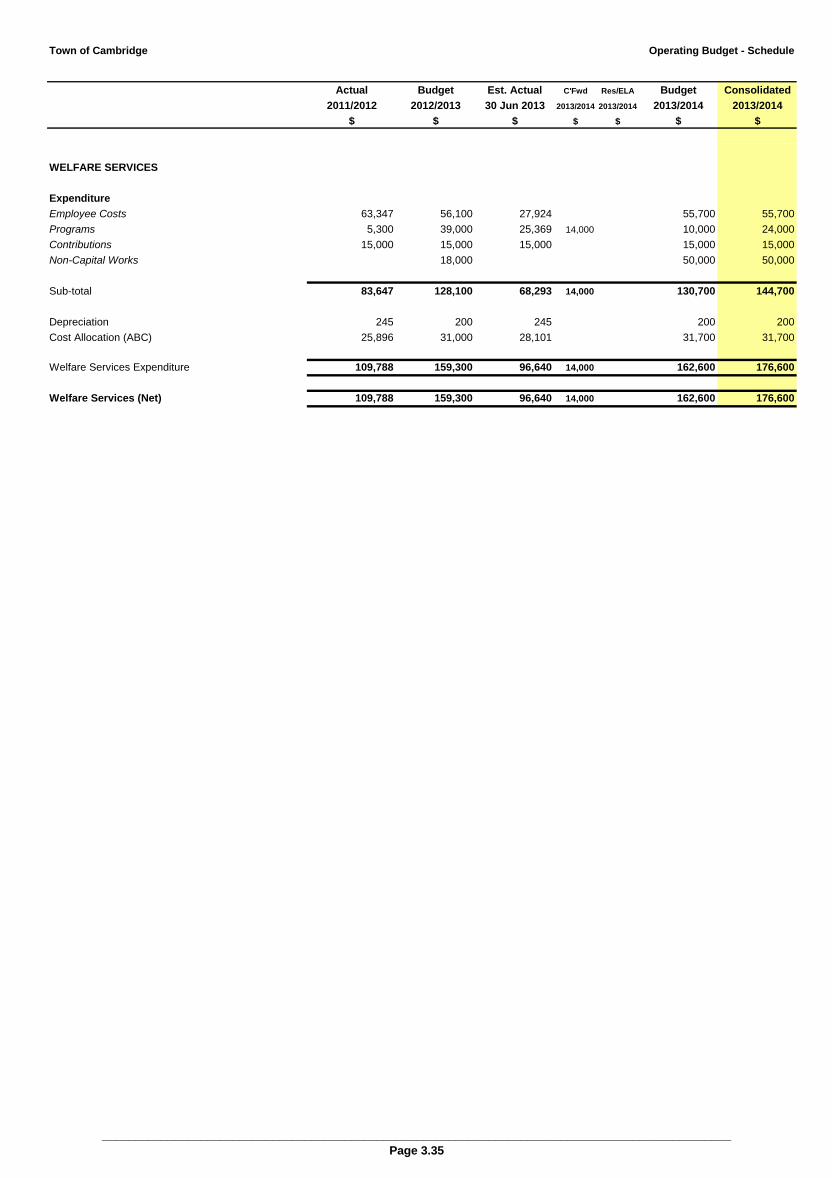
Town of Cambridge Operating Budget - Schedule
Actual Budget Est. Actual C'Fwd Res/ELA Budget Consolidated
2011/2012 2012/2013 30 Jun 2013 2013/2014 2013/2014 2013/2014 2013/2014
$ $ $ $ $ $ $
WELFARE SERVICES
Expenditure
Employee Costs 63,347 56,100 27,924 55,700 55,700
Programs 5,300 39,000 25,369 14,000 10,000 24,000
Contributions 15,000 15,000 15,000 15,000 15,000
Non-Capital Works 18,000 50,000 50,000
Sub-total 83,647 128,100 68,293 14,000 130,700 144,700
Depreciation 245 200 245 200 200
Cost Allocation (ABC) 25,896 31,000 28,101 31,700 31,700
Welfare Services Expenditure 109,788 159,300 96,640 14,000 162,600 176,600
Welfare Services (Net) 109,788 159,300 96,640 14,000 162,600 176,600
________________________________________________________________________________________________
Page 3.35
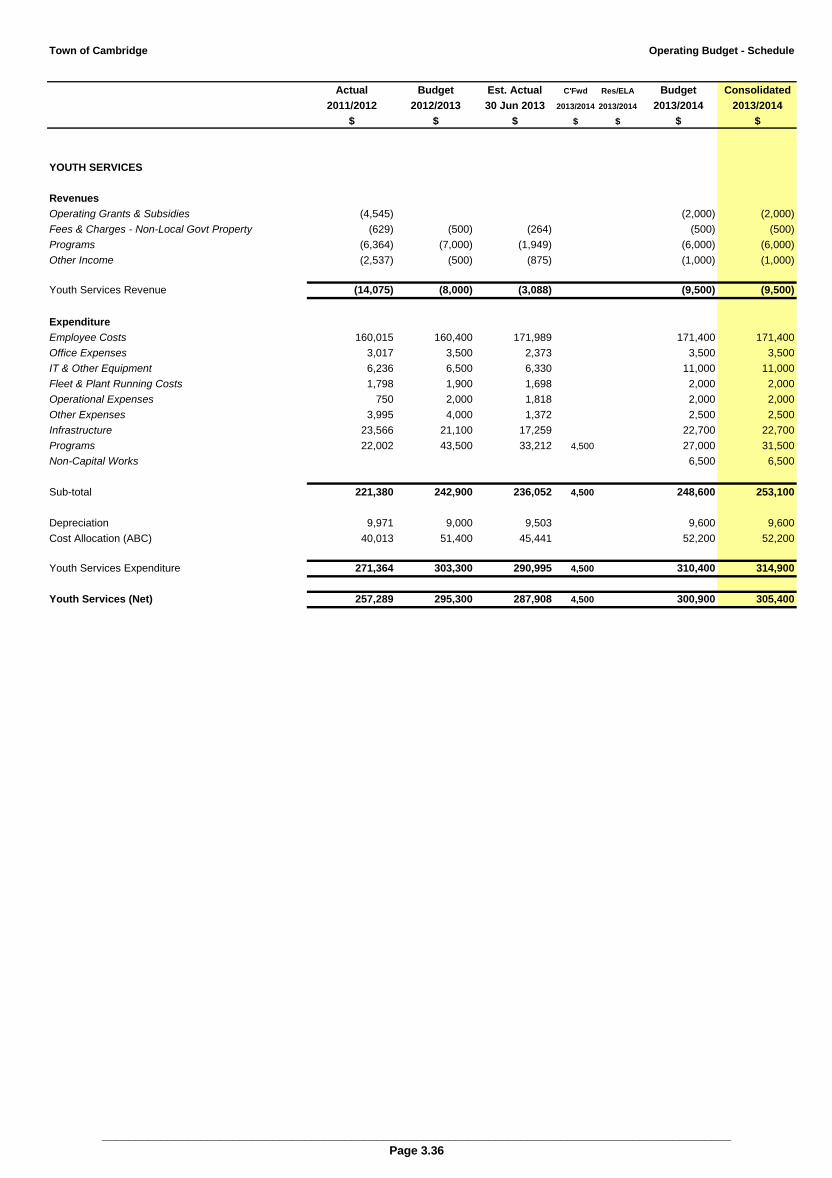
Town of Cambridge Operating Budget - Schedule
Actual Budget Est. Actual C'Fwd Res/ELA Budget Consolidated
2011/2012 2012/2013 30 Jun 2013 2013/2014 2013/2014 2013/2014 2013/2014
$ $ $ $ $ $ $
YOUTH SERVICES
Revenues
Operating Grants & Subsidies (4,545) (2,000) (2,000)
Fees & Charges - Non-Local Govt Property (629) (500) (264) (500) (500)
Programs (6,364) (7,000) (1,949) (6,000) (6,000)
Other Income (2,537) (500) (875) (1,000) (1,000)
Youth Services Revenue (14,075) (8,000) (3,088) (9,500) (9,500)
Expenditure
Employee Costs 160,015 160,400 171,989 171,400 171,400
Office Expenses 3,017 3,500 2,373 3,500 3,500
IT & Other Equipment 6,236 6,500 6,330 11,000 11,000
Fleet & Plant Running Costs 1,798 1,900 1,698 2,000 2,000
Operational Expenses 750 2,000 1,818 2,000 2,000
Other Expenses 3,995 4,000 1,372 2,500 2,500
Infrastructure 23,566 21,100 17,259 22,700 22,700
Programs 22,002 43,500 33,212 4,500 27,000 31,500
Non-Capital Works 6,500 6,500
Sub-total 221,380 242,900 236,052 4,500 248,600 253,100
Depreciation 9,971 9,000 9,503 9,600 9,600
Cost Allocation (ABC) 40,013 51,400 45,441 52,200 52,200
Youth Services Expenditure 271,364 303,300 290,995 4,500 310,400 314,900
Youth Services (Net) 257,289 295,300 287,908 4,500 300,900 305,400
________________________________________________________________________________________________
Page 3.36
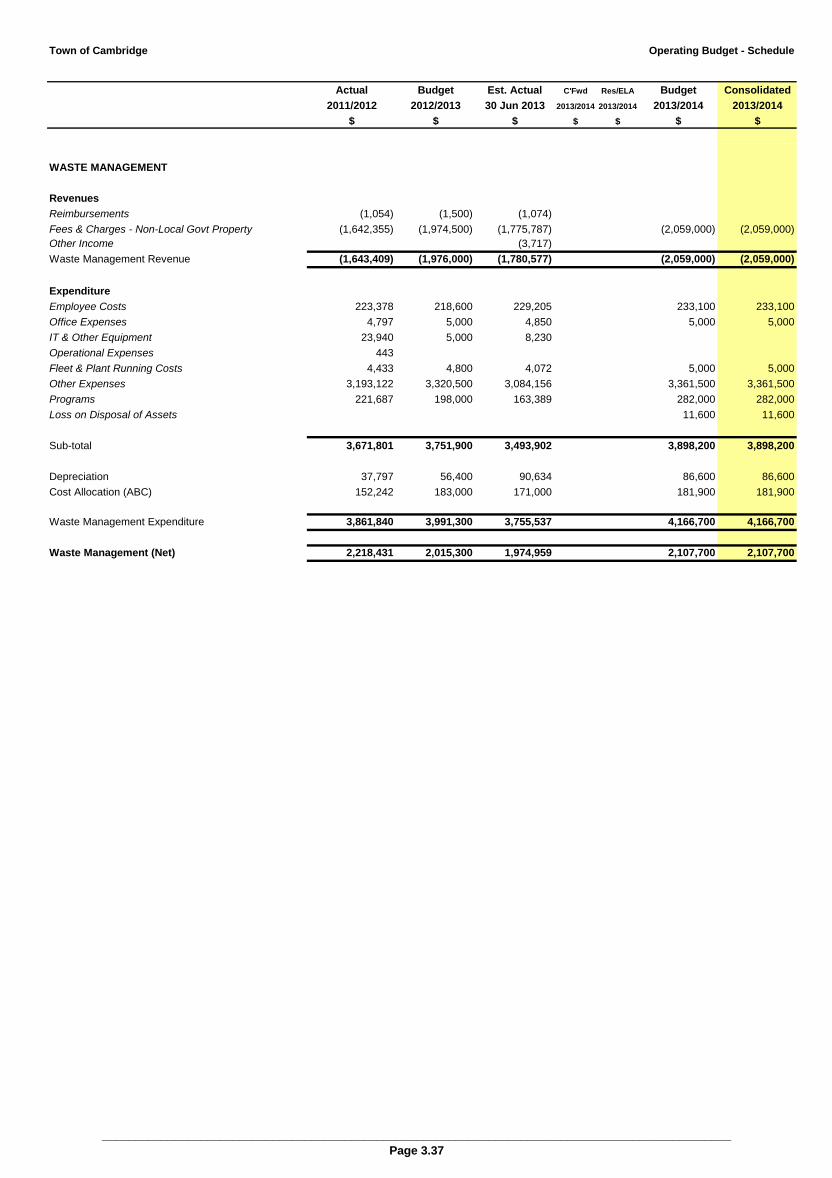
Town of Cambridge Operating Budget - Schedule
Actual Budget Est. Actual C'Fwd Res/ELA Budget Consolidated
2011/2012 2012/2013 30 Jun 2013 2013/2014 2013/2014 2013/2014 2013/2014
$ $ $ $ $ $ $
WASTE MANAGEMENT
Revenues
Reimbursements (1,054) (1,500) (1,074)
Fees & Charges - Non-Local Govt Property (1,642,355) (1,974,500) (1,775,787) (2,059,000) (2,059,000)
Other Income (3,717)
Waste Management Revenue (1,643,409) (1,976,000) (1,780,577) (2,059,000) (2,059,000)
Expenditure
Employee Costs 223,378 218,600 229,205 233,100 233,100
Office Expenses 4,797 5,000 4,850 5,000 5,000
IT & Other Equipment 23,940 5,000 8,230
Operational Expenses 443
Fleet & Plant Running Costs 4,433 4,800 4,072 5,000 5,000
Other Expenses 3,193,122 3,320,500 3,084,156 3,361,500 3,361,500
Programs 221,687 198,000 163,389 282,000 282,000
Loss on Disposal of Assets 11,600 11,600
Sub-total 3,671,801 3,751,900 3,493,902 3,898,200 3,898,200
Depreciation 37,797 56,400 90,634 86,600 86,600
Cost Allocation (ABC) 152,242 183,000 171,000 181,900 181,900
Waste Management Expenditure 3,861,840 3,991,300 3,755,537 4,166,700 4,166,700
Waste Management (Net) 2,218,431 2,015,300 1,974,959 2,107,700 2,107,700
________________________________________________________________________________________________
Page 3.37
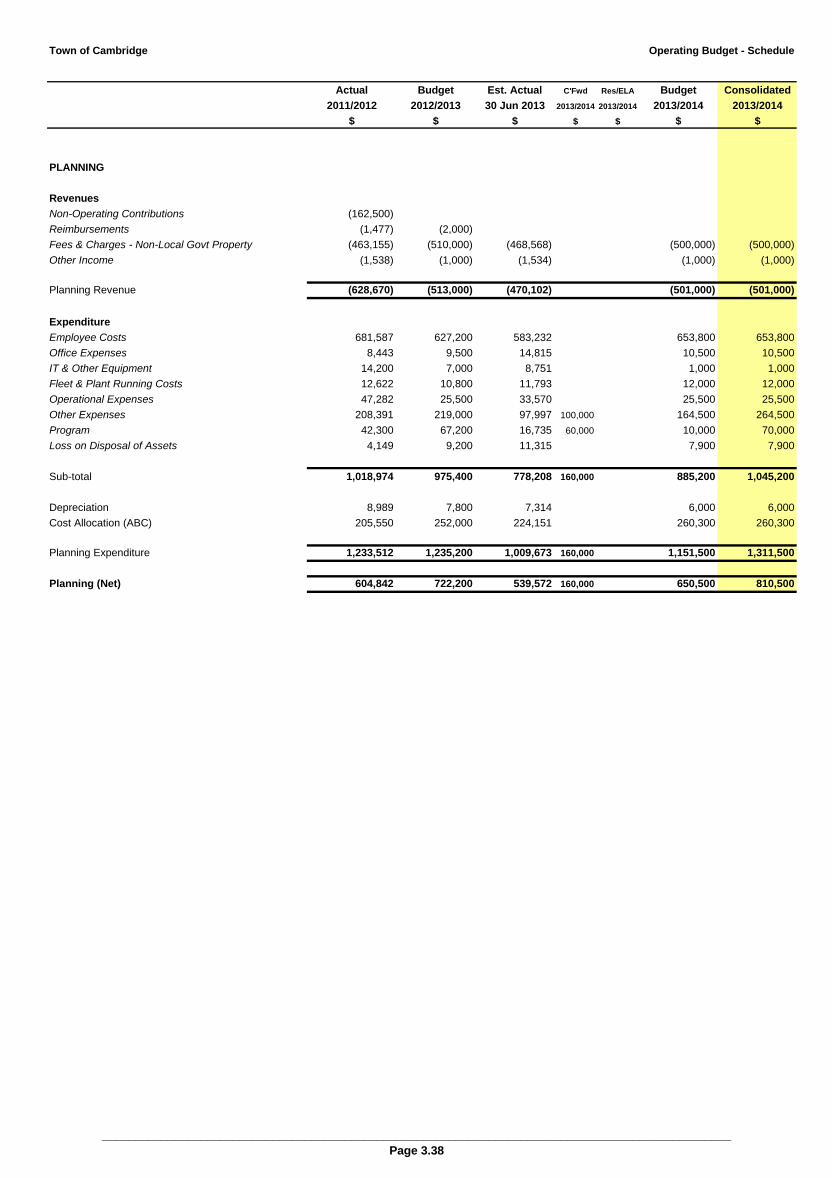
Town of Cambridge Operating Budget - Schedule
Actual Budget Est. Actual C'Fwd Res/ELA Budget Consolidated
2011/2012 2012/2013 30 Jun 2013 2013/2014 2013/2014 2013/2014 2013/2014
$ $ $ $ $ $ $
PLANNING
Revenues
Non-Operating Contributions (162,500)
Reimbursements (1,477) (2,000)
Fees & Charges - Non-Local Govt Property (463,155) (510,000) (468,568) (500,000) (500,000)
Other Income (1,538) (1,000) (1,534) (1,000) (1,000)
Planning Revenue (628,670) (513,000) (470,102) (501,000) (501,000)
Expenditure
Employee Costs 681,587 627,200 583,232 653,800 653,800
Office Expenses 8,443 9,500 14,815 10,500 10,500
IT & Other Equipment 14,200 7,000 8,751 1,000 1,000
Fleet & Plant Running Costs 12,622 10,800 11,793 12,000 12,000
Operational Expenses 47,282 25,500 33,570 25,500 25,500
Other Expenses 208,391 219,000 97,997 100,000 164,500 264,500
Program 42,300 67,200 16,735 60,000 10,000 70,000
Loss on Disposal of Assets 4,149 9,200 11,315 7,900 7,900
Sub-total 1,018,974 975,400 778,208 160,000 885,200 1,045,200
Depreciation 8,989 7,800 7,314 6,000 6,000
Cost Allocation (ABC) 205,550 252,000 224,151 260,300 260,300
Planning Expenditure 1,233,512 1,235,200 1,009,673 160,000 1,151,500 1,311,500
Planning (Net) 604,842 722,200 539,572 160,000 650,500 810,500
________________________________________________________________________________________________
Page 3.38
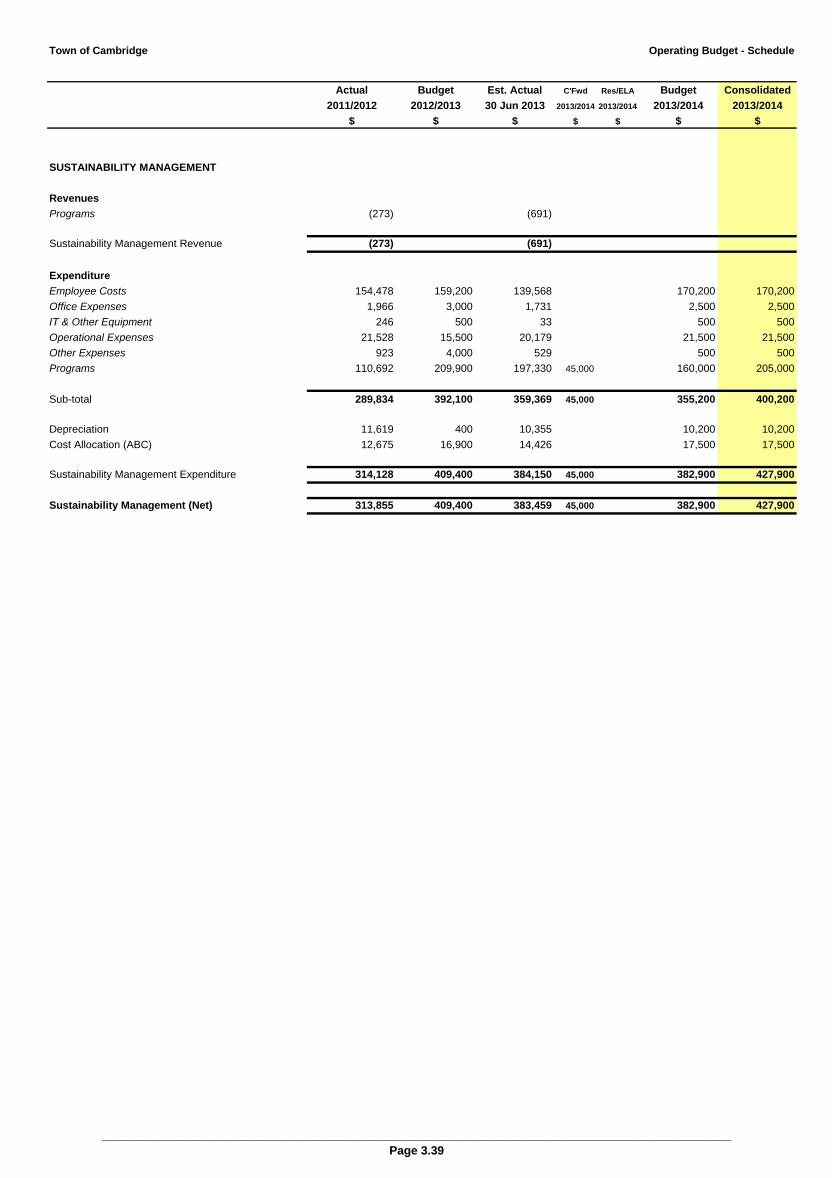
Town of Cambridge Operating Budget - Schedule
Actual Budget Est. Actual C'Fwd Res/ELA Budget Consolidated
2011/2012 2012/2013 30 Jun 2013 2013/2014 2013/2014 2013/2014 2013/2014
$ $ $ $ $ $ $
SUSTAINABILITY MANAGEMENT
Revenues
Programs (273) (691)
Sustainability Management Revenue (273) (691)
Expenditure
Employee Costs 154,478 159,200 139,568 170,200 170,200
Office Expenses 1,966 3,000 1,731 2,500 2,500
IT & Other Equipment 246 500 33 500 500
Operational Expenses 21,528 15,500 20,179 21,500 21,500
Other Expenses 923 4,000 529 500 500
Programs 110,692 209,900 197,330 45,000 160,000 205,000
Sub-total 289,834 392,100 359,369 45,000 355,200 400,200
Depreciation 11,619 400 10,355 10,200 10,200
Cost Allocation (ABC) 12,675 16,900 14,426 17,500 17,500
Sustainability Management Expenditure 314,128 409,400 384,150 45,000 382,900 427,900
Sustainability Management (Net) 313,855 409,400 383,459 45,000 382,900 427,900
________________________________________________________________________________________________
Page 3.39

Town of Cambridge Operating Budget - Schedule
Actual Budget Est. Actual C'Fwd Res/ELA Budget Consolidated
2011/2012 2012/2013 30 Jun 2013 2013/2014 2013/2014 2013/2014 2013/2014
$ $ $ $ $ $ $
WEMBLEY COMMUNITY CENTRE
Revenues
Reimbursements (72)
Fees & Charges - Local Govt Property (115,200) (111,000) (125,839) (114,300) (114,300)
Internal Revenue Allocations (25,000) (20,000) (20,000) (20,000) (20,000)
Programs (55) (500) (500)
Other Income (358) (500) (172) (500) (500)
Wembley Community Centre Revenue (140,684) (131,500) (146,011) (135,300) (135,300)
Expenditure
Employee Costs 89,035 84,600 85,611 89,800 89,800
Office Expenses 2,761 2,500 2,448 2,600 2,600
IT & Other Equipment 4,850 4,000 3,852 4,400 4,400
Operational Expenses 1,717 2,600 1,582 2,000 2,000
Other Expenses 3,012 2,500 327 2,000 2,000
Infrastructure 103,591 110,800 121,123 126,600 126,600
Programs 1,500 1,689 1,500 1,500
Non-Capital Works 5,135 15,000 10,280 13,000 13,000
Sub-total 210,099 223,500 226,912 241,900 241,900
Depreciation 75,165 75,400 74,249 74,500 74,500
Cost Allocation (ABC) 21,962 26,700 24,559 26,800 26,800
Wembley Community Centre Expenditure 307,226 325,600 325,721 343,200 343,200
166,542 194,100 179,710 207,900 207,900
Less Depreciation (75,165) (75,400) (74,249) (74,500) (74,500)
Less Costs Allocated (21,962) (26,700) (24,559) (26,800) (26,800)
Less Council Subsidy (69,540) (77,000) (64,167) (92,600) (92,600)
Transfer to/(from) Community Facilities Reserve (15,000) (16,735) (14,000) (14,000)
(166,667) (194,100) (179,710) (207,900) (207,900)
Wembley Community Centre (Net) (125)
________________________________________________________________________________________________
Page 3.40

Town of Cambridge Operating Budget - Schedule
Actual Budget Est. Actual C'Fwd Res/ELA Budget Consolidated
2011/2012 2012/2013 30 Jun 2013 2013/2014 2013/2014 2013/2014 2013/2014
$ $ $ $ $ $ $
LEEDERVILLE TOWN HALL
Revenues
Hire Fees (33,817) (36,500) (43,124) (37,500) (37,500)
Leederville Town Hall Revenue (33,817) (36,500) (43,124) (37,500) (37,500)
Expenditure
Employee Costs 36,926 24,100 33,793 25,100 25,100
IT & Other Equipment 681 500 500 500
Operational Expenses 693 900 400 1,000 1,000
Infrastructure 18,089 21,700 17,355 22,500 22,500
Non-Capital Works 15,000 13,180
Sub-total 56,389 62,200 64,727 49,100 49,100
Depreciation 38,209 38,700 38,713 36,800 36,800
Cost Allocation (ABC) 4,112 4,900 4,590 4,900 4,900
Leederville Town Hall Expenditure 98,709 105,800 108,030 90,800 90,800
Leederville Town Hall (Net) 64,892 69,300 64,907 53,300 53,300
________________________________________________________________________________________________
Page 3.41
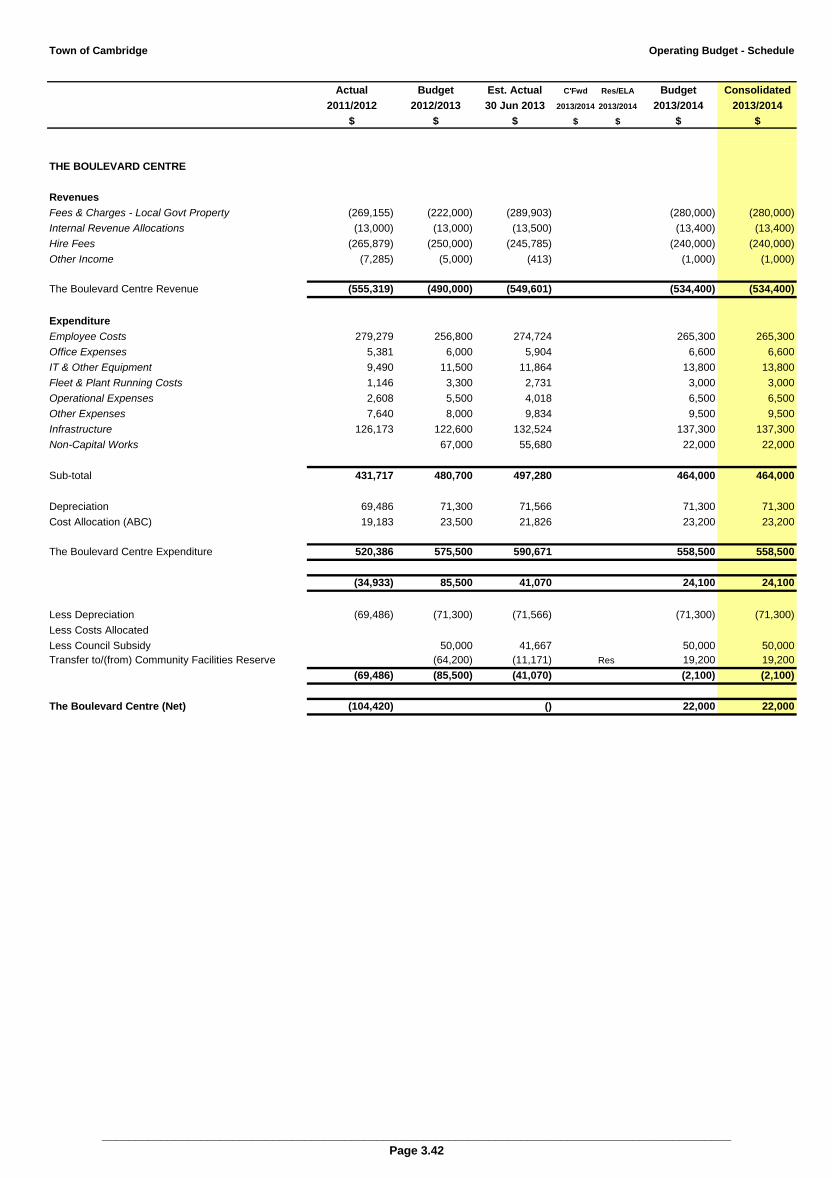
Town of Cambridge Operating Budget - Schedule
Actual Budget Est. Actual C'Fwd Res/ELA Budget Consolidated
2011/2012 2012/2013 30 Jun 2013 2013/2014 2013/2014 2013/2014 2013/2014
$ $ $ $ $ $ $
THE BOULEVARD CENTRE
Revenues
Fees & Charges - Local Govt Property (269,155) (222,000) (289,903) (280,000) (280,000)
Internal Revenue Allocations (13,000) (13,000) (13,500) (13,400) (13,400)
Hire Fees (265,879) (250,000) (245,785) (240,000) (240,000)
Other Income (7,285) (5,000) (413) (1,000) (1,000)
The Boulevard Centre Revenue (555,319) (490,000) (549,601) (534,400) (534,400)
Expenditure
Employee Costs 279,279 256,800 274,724 265,300 265,300
Office Expenses 5,381 6,000 5,904 6,600 6,600
IT & Other Equipment 9,490 11,500 11,864 13,800 13,800
Fleet & Plant Running Costs 1,146 3,300 2,731 3,000 3,000
Operational Expenses 2,608 5,500 4,018 6,500 6,500
Other Expenses 7,640 8,000 9,834 9,500 9,500
Infrastructure 126,173 122,600 132,524 137,300 137,300
Non-Capital Works 67,000 55,680 22,000 22,000
Sub-total 431,717 480,700 497,280 464,000 464,000
Depreciation 69,486 71,300 71,566 71,300 71,300
Cost Allocation (ABC) 19,183 23,500 21,826 23,200 23,200
The Boulevard Centre Expenditure 520,386 575,500 590,671 558,500 558,500
(34,933) 85,500 41,070 24,100 24,100
Less Depreciation (69,486) (71,300) (71,566) (71,300) (71,300)
Less Costs Allocated
Less Council Subsidy 50,000 41,667 50,000 50,000
Transfer to/(from) Community Facilities Reserve (64,200) (11,171) Res 19,200 19,200
(69,486) (85,500) (41,070) (2,100) (2,100)
The Boulevard Centre (Net) (104,420) () 22,000 22,000
________________________________________________________________________________________________
Page 3.42

Town of Cambridge Operating Budget - Schedule
Actual Budget Est. Actual C'Fwd Res/ELA Budget Consolidated
2011/2012 2012/2013 30 Jun 2013 2013/2014 2013/2014 2013/2014 2013/2014
$ $ $ $ $ $ $
BOLD PARK AQUATIC CENTRE
Pool Services
Revenues
Operating Grants & Subsidies (3,000) (3,000) (3,000) (3,000)
Non-Operating Grants & Subsidies (1,000,000) (1,000,000)
Operating Contributions Donations/Sponsorship (1,000) (1,000) (1,000) (1,000) (1,000)
Reimbursements (9,890)
Fees & Charges - Non-Local Govt Property (53) (100) ()
Fees & Charges - Local Govt Property (558,976) (598,500) (594,492) (506,500) (506,500)
Hire Fees (26,121) (27,000) (29,210) (24,500) (24,500)
Programs (183,109) (162,000) (205,588) (177,500) (177,500)
Other Income (3,073) (1,000) (57) (1,000) (1,000)
Gain on Disposal of Assets
Bold Park Aquatic Centre - Pool Services Revenue (775,333) (792,600) (840,238) (1,713,500) (1,713,500)
Expenditure
Employee Costs 772,176 816,400 804,855 779,100 779,100
Office Expenses 9,031 10,000 8,601 8,500 8,500
IT & Other Equipment 6,166 9,000 5,980 6,300 6,300
Fleet & Plant Running Costs 4,067 4,200 3,352 4,500 4,500
Operational Expenses 4,707 9,000 5,964 9,000 9,000
Other Expenses 74,265 83,500 86,002 63,500 63,500
Infrastructure 226,987 216,700 193,422 165,600 165,600
Programs 53,407 59,000 64,819 59,500 59,500
Non-Capital Works 17,500 8,500 2,887 26,000 26,000
Loss on Disposal of Assets 3,400 3,400
Sub-total 1,168,306 1,216,300 1,175,882 1,125,400 1,125,400
Depreciation 147,714 138,000 155,289 160,700 160,700
Cost Allocation (ABC) 125,686 155,700 141,293 155,600 155,600
Bold Park Aquatic - Pool Services Expenditure 1,441,706 1,510,000 1,472,463 1,441,700 1,441,700
________________________________________________________________________________________________
Page 3.43

Town of Cambridge Operating Budget - Schedule
Actual Budget Est. Actual C'Fwd Res/ELA Budget Consolidated
2011/2012 2012/2013 30 Jun 2013 2013/2014 2013/2014 2013/2014 2013/2014
$ $ $ $ $ $ $
BOLD PARK AQUATIC CENTRE
Bold Park Aquatic Centre - Kiosk
Revenues
Merchandise Sales (56,230) (65,500) (51,027) (45,000) (45,000)
Bold Park Aquatic Centre - Kiosk Revenue (56,230) (65,500) (51,027) (45,000) (45,000)
Expenditure
Merchandise Purchases 32,601 35,000 28,366 28,000 28,000
Sub-total 32,601 35,000 28,366 28,000 28,000
Bold Park Aquatic Centre - Kiosk Expenditure 32,601 35,000 28,366 28,000 28,000
BOLD PARK AQUATIC CENTRE
Bold Park Aquatic Centre - Swim Shop
Revenues
Merchandise Sales (144,603) (150,000) (150,779) (135,000) (135,000)
Bold Park Aquatic Centre - Swim Shop Revenue (144,603) (150,000) (150,779) (135,000) (135,000)
Expenditure
Merchandise Purchases 78,531 78,500 61,419 70,000 70,000
Sub-total 78,531 78,500 61,419 70,000 70,000
Bold Park Aquatic - Swim Shop Expenditure 78,531 78,500 61,419 70,000 70,000
________________________________________________________________________________________________
Page 3.44
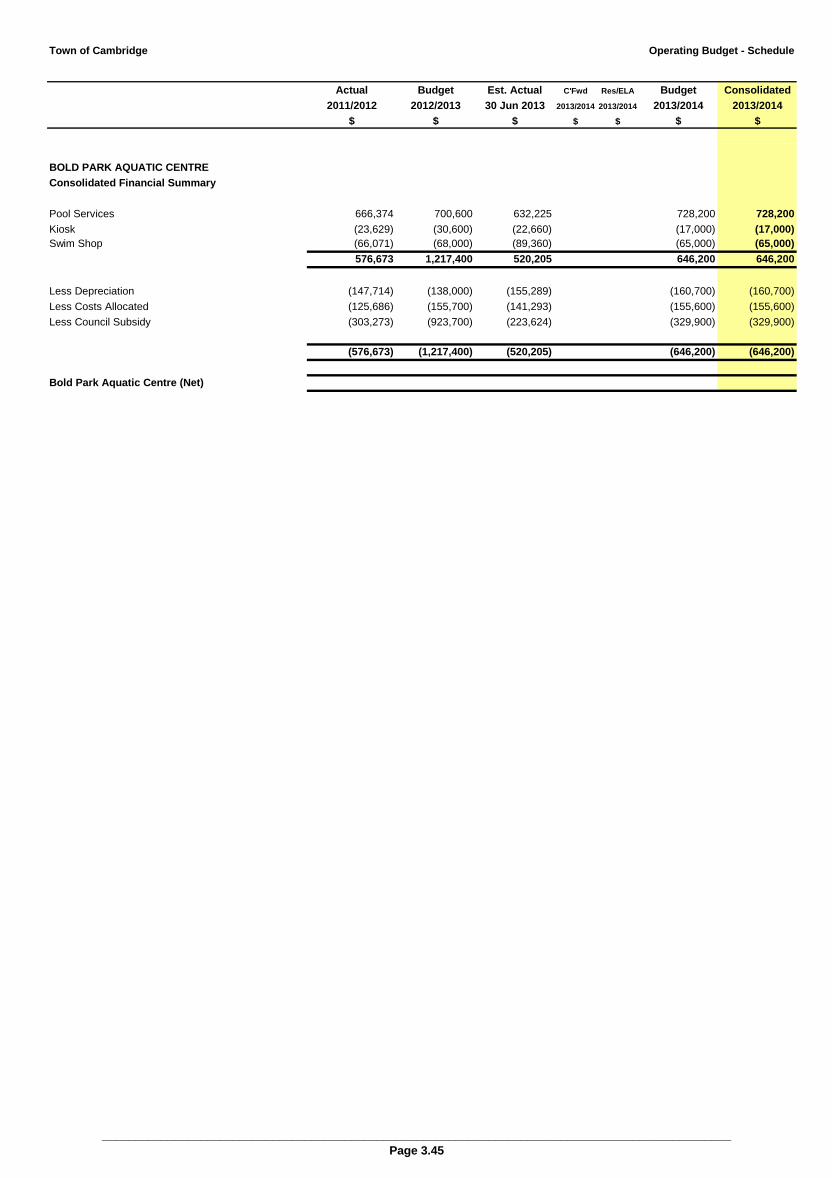
Town of Cambridge Operating Budget - Schedule
Actual Budget Est. Actual C'Fwd Res/ELA Budget Consolidated
2011/2012 2012/2013 30 Jun 2013 2013/2014 2013/2014 2013/2014 2013/2014
$ $ $ $ $ $ $
BOLD PARK AQUATIC CENTRE
Consolidated Financial Summary
Pool Services 666,374 700,600 632,225 728,200 728,200
Kiosk (23,629) (30,600) (22,660) (17,000) (17,000)
Swim Shop (66,071) (68,000) (89,360) (65,000) (65,000)
576,673 1,217,400 520,205 646,200 646,200
Less Depreciation (147,714) (138,000) (155,289) (160,700) (160,700)
Less Costs Allocated (125,686) (155,700) (141,293) (155,600) (155,600)
Less Council Subsidy (303,273) (923,700) (223,624) (329,900) (329,900)
(576,673) (1,217,400) (520,205) (646,200) (646,200)
Bold Park Aquatic Centre (Net)
________________________________________________________________________________________________
Page 3.45

Town of Cambridge Operating Budget - Schedule
Actual Budget Est. Actual C'Fwd Res/ELA Budget Consolidated
2011/2012 2012/2013 30 Jun 2013 2013/2014 2013/2014 2013/2014 2013/2014
$ $ $ $ $ $ $
OCEAN BEACHES
Revenues
Fees & Charges - Local Govt Property (13,489) (10,000) (7,591) (10,000) (10,000)
Lease Income (231,923) (213,000) (171,973) (224,000) (224,000)
Ocean Beaches - Revenue Revenue (245,412) (223,000) (179,564) (234,000) (234,000)
Ocean Beaches - Revenue (Net) (245,412) (223,000) (179,564) (234,000) (234,000)
________________________________________________________________________________________________
Page 3.46
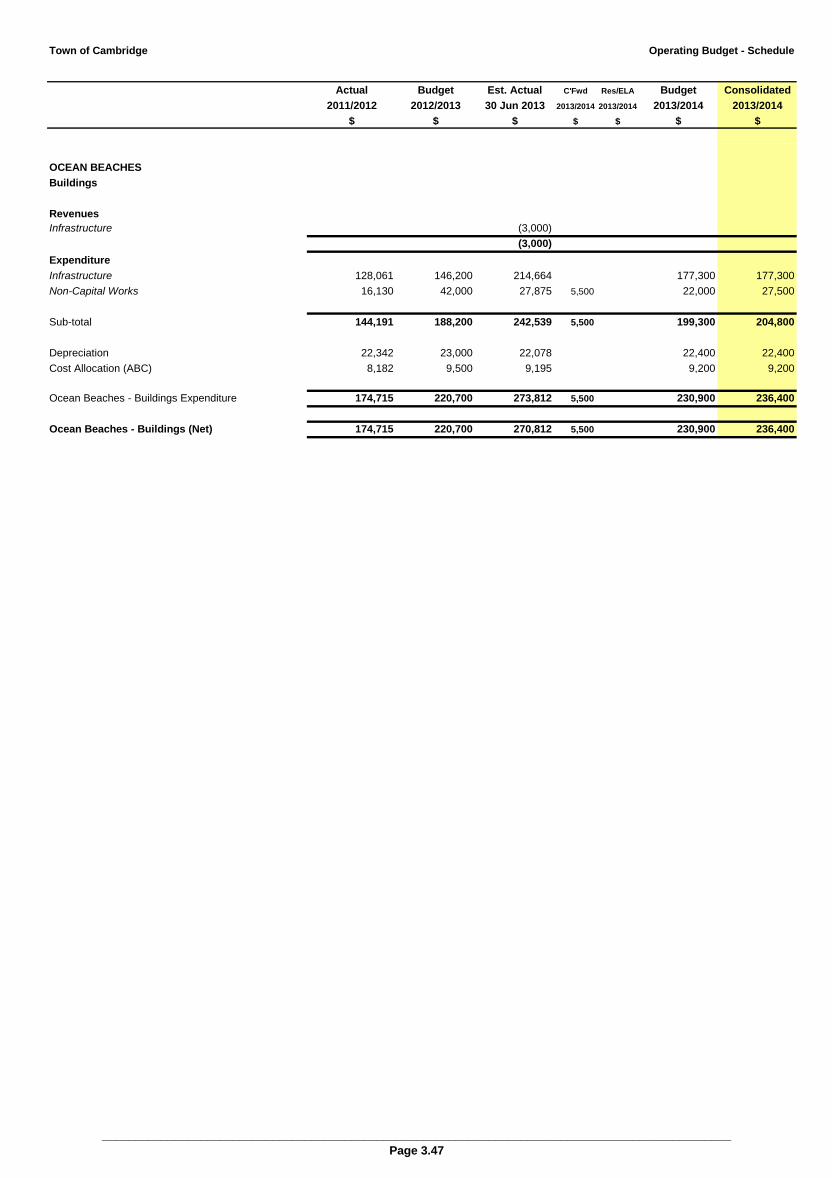
Town of Cambridge Operating Budget - Schedule
Actual Budget Est. Actual C'Fwd Res/ELA Budget Consolidated
2011/2012 2012/2013 30 Jun 2013 2013/2014 2013/2014 2013/2014 2013/2014
$ $ $ $ $ $ $
OCEAN BEACHES
Buildings
Revenues
Infrastructure (3,000)
(3,000)
Expenditure
Infrastructure 128,061 146,200 214,664 177,300 177,300
Non-Capital Works 16,130 42,000 27,875 5,500 22,000 27,500
Sub-total 144,191 188,200 242,539 5,500 199,300 204,800
Depreciation 22,342 23,000 22,078 22,400 22,400
Cost Allocation (ABC) 8,182 9,500 9,195 9,200 9,200
Ocean Beaches - Buildings Expenditure 174,715 220,700 273,812 5,500 230,900 236,400
Ocean Beaches - Buildings (Net) 174,715 220,700 270,812 5,500 230,900 236,400
________________________________________________________________________________________________
Page 3.47

Town of Cambridge Operating Budget - Schedule
Actual Budget Est. Actual C'Fwd Res/ELA Budget Consolidated
2011/2012 2012/2013 30 Jun 2013 2013/2014 2013/2014 2013/2014 2013/2014
$ $ $ $ $ $ $
OCEAN BEACHES
Grounds
Revenues
Reimbursements -Insurance Claims (2,501)
Capital Grants (210,000) (10,000) (10,000)
Ocean Beaches - Revenue Revenue (210,000) (2,501) (10,000) (10,000)
Expenditure
Infrastructure 445,210 442,200 479,196 481,000 481,000
Non-Capital Works 21,270 53,400 53,623 40,000 40,000
466,480 495,600 532,819 521,000 521,000
Depreciation 217,497 205,900 205,931 205,900 205,900
Cost Allocation (ABC) 22,155 26,000 25,228 25,100 25,100
Ocean Beaches - Grounds Expenditure 706,131 727,500 763,978 752,000 752,000
Ocean Beaches - Grounds (Net) 706,131 517,500 761,477 742,000 742,000
________________________________________________________________________________________________
Page 3.48
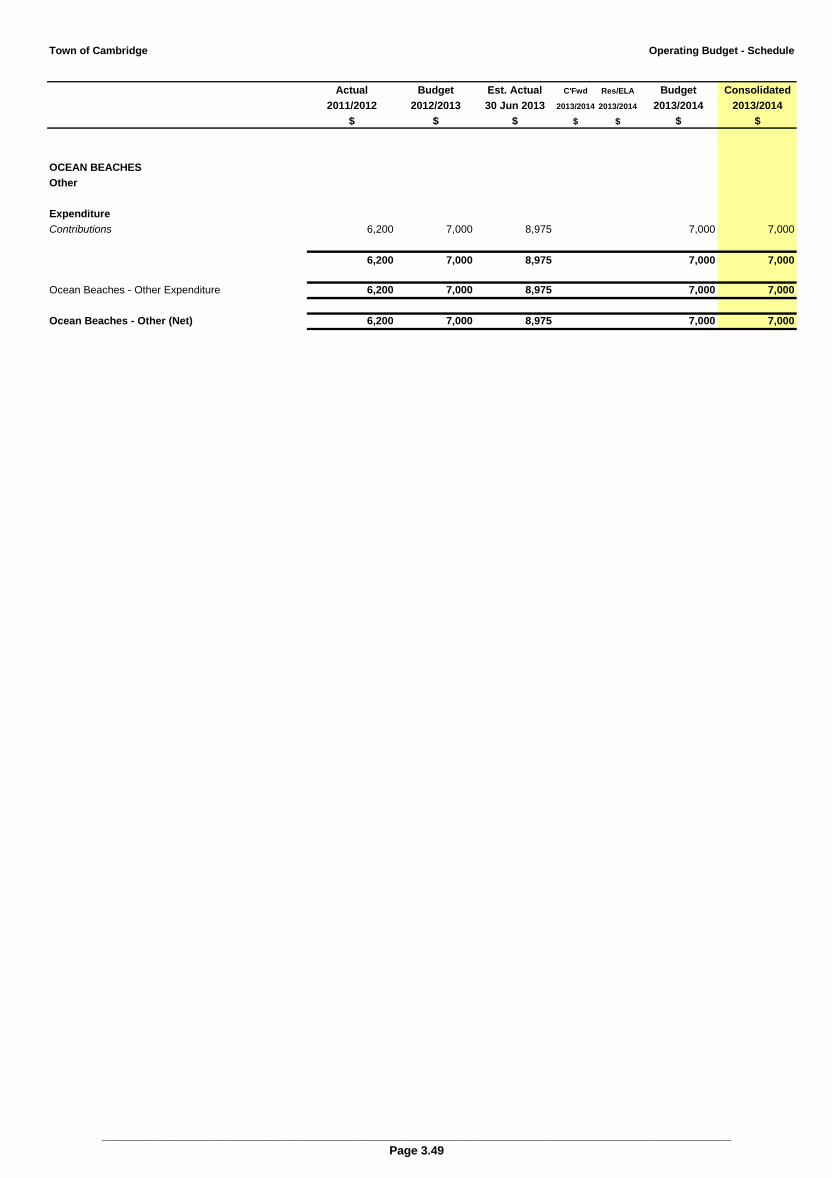
Town of Cambridge Operating Budget - Schedule
Actual Budget Est. Actual C'Fwd Res/ELA Budget Consolidated
2011/2012 2012/2013 30 Jun 2013 2013/2014 2013/2014 2013/2014 2013/2014
$ $ $ $ $ $ $
OCEAN BEACHES
Other
Expenditure
Contributions 6,200 7,000 8,975 7,000 7,000
6,200 7,000 8,975 7,000 7,000
Ocean Beaches - Other Expenditure 6,200 7,000 8,975 7,000 7,000
Ocean Beaches - Other (Net) 6,200 7,000 8,975 7,000 7,000
________________________________________________________________________________________________
Page 3.49

Town of Cambridge Operating Budget - Schedule
Actual Budget Est. Actual C'Fwd Res/ELA Budget Consolidated
2011/2012 2012/2013 30 Jun 2013 2013/2014 2013/2014 2013/2014 2013/2014
$ $ $ $ $ $ $
CLUBS - LEASED PREMISES
Revenues
Capital Grants (82,000)
Capital Contributions (205,000) (84,038) (20,000) (5,000) (25,000)
Infrastructure (207,749) (201,500) (172,365) (209,800) (209,800)
Clubs - Leased Premises Revenue (207,749) (488,500) (256,403) (20,000) (214,800) (234,800)
Expenditure
Employee Costs 60,800 58,766 63,500 63,500
IT & Other Equipment 487
Fleet & Plant Running Costs 2,129 3,300 3,300
Infrastructure 154,212 180,200 174,739 188,000 188,000
Non-Capital Works 600 98,000 30,017 57,800 138,500 196,300
154,812 339,000 266,138 57,800 393,300 451,100
Depreciation 275,251 289,700 273,876 276,000 276,000
Cost Allocation (ABC) 4,207 4,800 4,647 4,700 4,700
Clubs - Leased Premises Expenditure 434,269 633,500 544,661 57,800 674,000 731,800
Clubs - Leased Premises (Net) 226,520 145,000 288,258 37,800 459,200 497,000
________________________________________________________________________________________________
Page 3.50
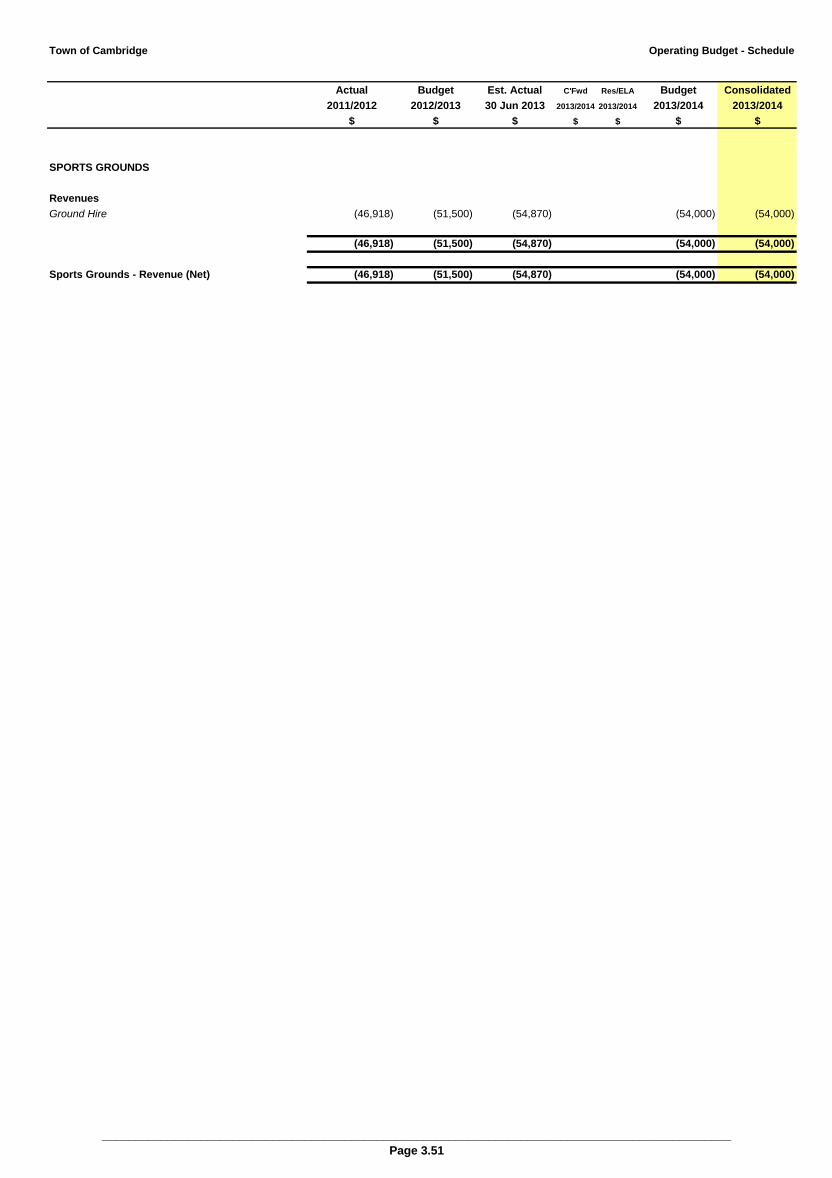
Town of Cambridge Operating Budget - Schedule
Actual Budget Est. Actual C'Fwd Res/ELA Budget Consolidated
2011/2012 2012/2013 30 Jun 2013 2013/2014 2013/2014 2013/2014 2013/2014
$ $ $ $ $ $ $
SPORTS GROUNDS
Revenues
Ground Hire (46,918) (51,500) (54,870) (54,000) (54,000)
(46,918) (51,500) (54,870) (54,000) (54,000)
Sports Grounds - Revenue (Net) (46,918) (51,500) (54,870) (54,000) (54,000)
________________________________________________________________________________________________
Page 3.51
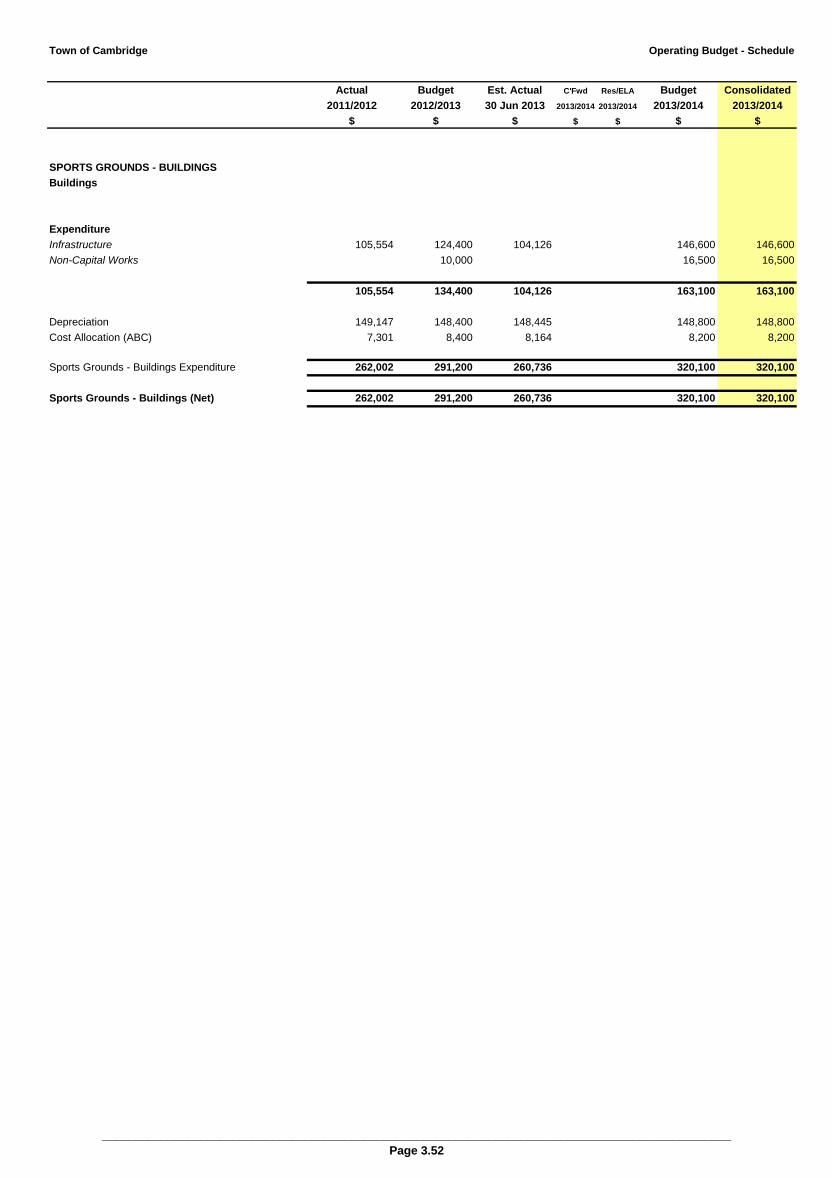
Town of Cambridge Operating Budget - Schedule
Actual Budget Est. Actual C'Fwd Res/ELA Budget Consolidated
2011/2012 2012/2013 30 Jun 2013 2013/2014 2013/2014 2013/2014 2013/2014
$ $ $ $ $ $ $
SPORTS GROUNDS - BUILDINGS
Buildings
Expenditure
Infrastructure 105,554 124,400 104,126 146,600 146,600
Non-Capital Works 10,000 16,500 16,500
105,554 134,400 104,126 163,100 163,100
Depreciation 149,147 148,400 148,445 148,800 148,800
Cost Allocation (ABC) 7,301 8,400 8,164 8,200 8,200
Sports Grounds - Buildings Expenditure 262,002 291,200 260,736 320,100 320,100
Sports Grounds - Buildings (Net) 262,002 291,200 260,736 320,100 320,100
________________________________________________________________________________________________
Page 3.52
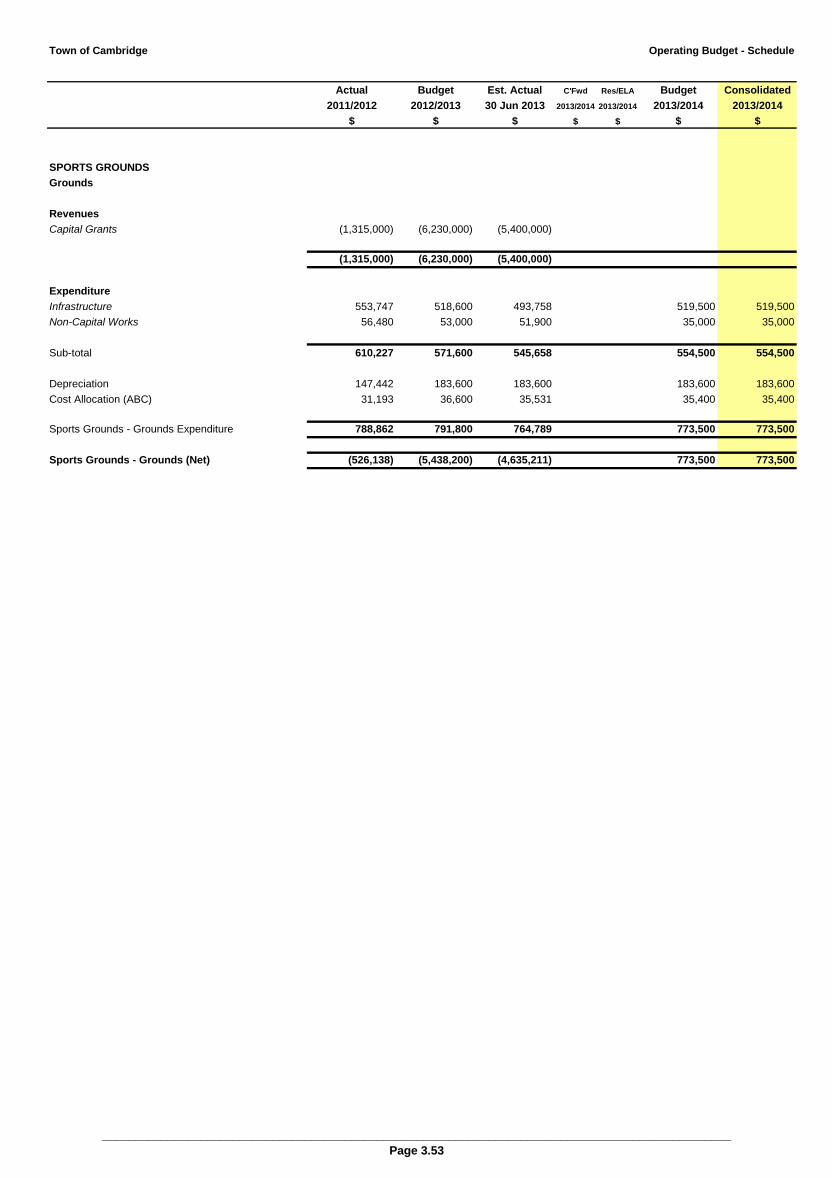
Town of Cambridge Operating Budget - Schedule
Actual Budget Est. Actual C'Fwd Res/ELA Budget Consolidated
2011/2012 2012/2013 30 Jun 2013 2013/2014 2013/2014 2013/2014 2013/2014
$ $ $ $ $ $ $
SPORTS GROUNDS
Grounds
Revenues
Capital Grants (1,315,000) (6,230,000) (5,400,000)
(1,315,000) (6,230,000) (5,400,000)
Expenditure
Infrastructure 553,747 518,600 493,758 519,500 519,500
Non-Capital Works 56,480 53,000 51,900 35,000 35,000
Sub-total 610,227 571,600 545,658 554,500 554,500
Depreciation 147,442 183,600 183,600 183,600 183,600
Cost Allocation (ABC) 31,193 36,600 35,531 35,400 35,400
Sports Grounds - Grounds Expenditure 788,862 791,800 764,789 773,500 773,500
Sports Grounds - Grounds (Net) (526,138) (5,438,200) (4,635,211) 773,500 773,500
________________________________________________________________________________________________
Page 3.53
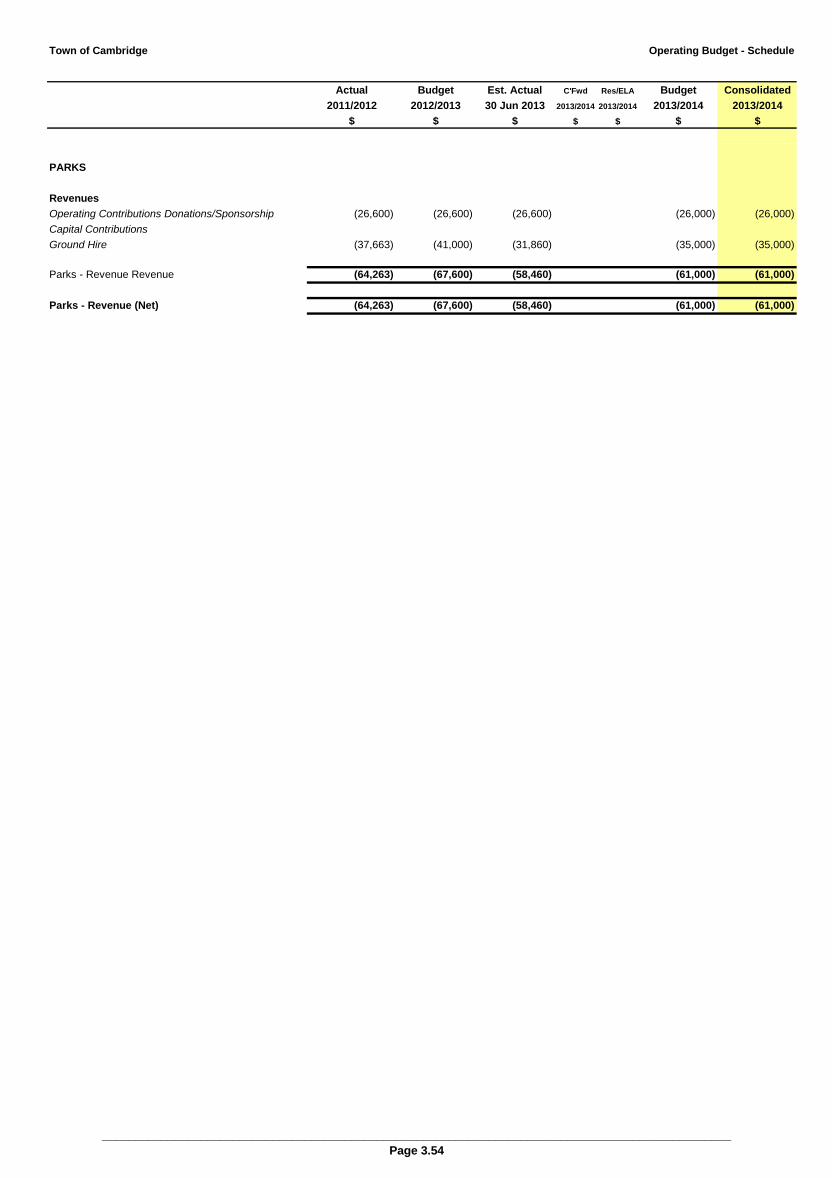
Town of Cambridge Operating Budget - Schedule
Actual Budget Est. Actual C'Fwd Res/ELA Budget Consolidated
2011/2012 2012/2013 30 Jun 2013 2013/2014 2013/2014 2013/2014 2013/2014
$ $ $ $ $ $ $
PARKS
Revenues
Operating Contributions Donations/Sponsorship (26,600) (26,600) (26,600) (26,000) (26,000)
Capital Contributions
Ground Hire (37,663) (41,000) (31,860) (35,000) (35,000)
Parks - Revenue Revenue (64,263) (67,600) (58,460) (61,000) (61,000)
Parks - Revenue (Net) (64,263) (67,600) (58,460) (61,000) (61,000)
________________________________________________________________________________________________
Page 3.54

Town of Cambridge Operating Budget - Schedule
Actual Budget Est. Actual C'Fwd Res/ELA Budget Consolidated
2011/2012 2012/2013 30 Jun 2013 2013/2014 2013/2014 2013/2014 2013/2014
$ $ $ $ $ $ $
PARKS
Buildings
Expenditure
Infrastructure 33,577 54,400 42,869 62,600 62,600
Non-Capital Works 17,500 17,500 6,600 24,100
Sub-total 33,577 71,900 42,869 17,500 69,200 86,700
Depreciation 5,559 5,500 5,160 5,200 5,200
Cost Allocation (ABC) 1,432 1,700 1,676 1,700 1,700
Parks - Buildings Expenditure 40,568 79,100 49,705 17,500 76,100 93,600
Parks - Buildings (Net) 40,568 79,100 49,705 17,500 76,100 93,600
________________________________________________________________________________________________
Page 3.55
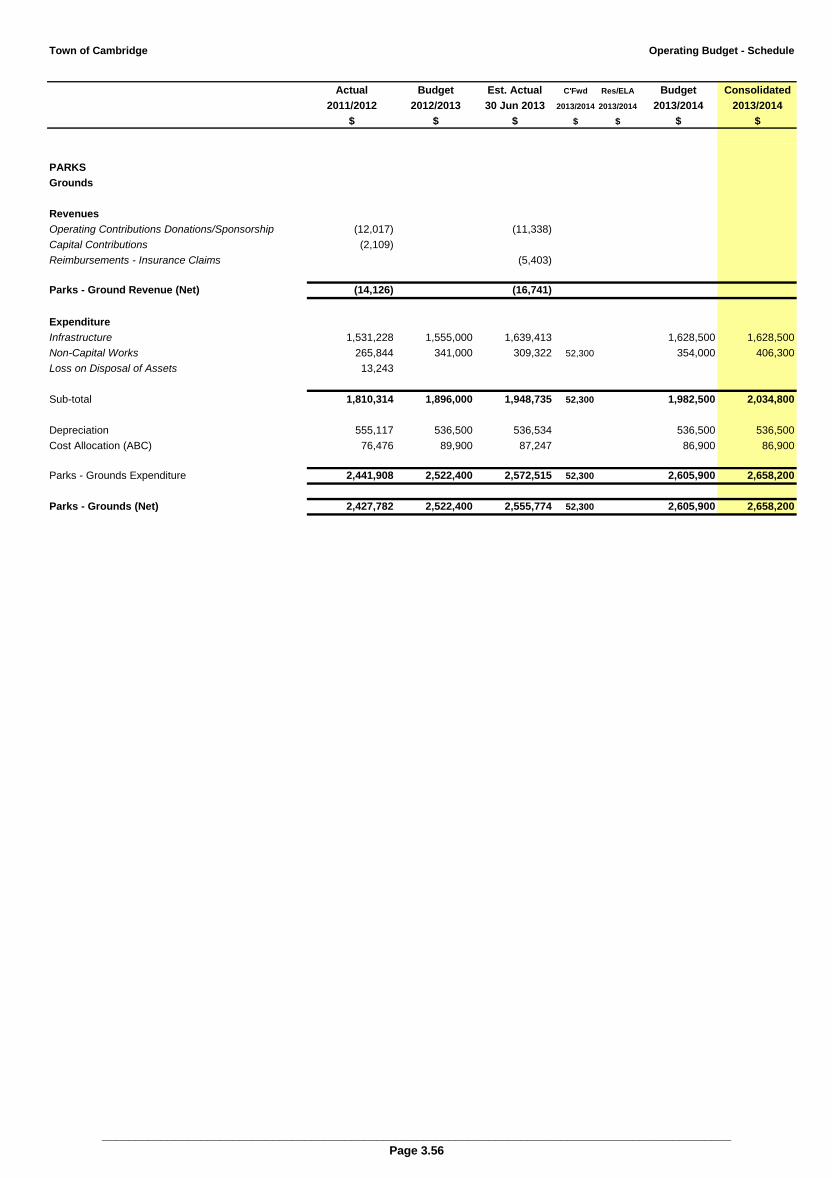
Town of Cambridge Operating Budget - Schedule
Actual Budget Est. Actual C'Fwd Res/ELA Budget Consolidated
2011/2012 2012/2013 30 Jun 2013 2013/2014 2013/2014 2013/2014 2013/2014
$ $ $ $ $ $ $
PARKS
Grounds
Revenues
Operating Contributions Donations/Sponsorship (12,017) (11,338)
Capital Contributions (2,109)
Reimbursements - Insurance Claims (5,403)
Parks - Ground Revenue (Net) (14,126) (16,741)
Expenditure
Infrastructure 1,531,228 1,555,000 1,639,413 1,628,500 1,628,500
Non-Capital Works 265,844 341,000 309,322 52,300 354,000 406,300
Loss on Disposal of Assets 13,243
Sub-total 1,810,314 1,896,000 1,948,735 52,300 1,982,500 2,034,800
Depreciation 555,117 536,500 536,534 536,500 536,500
Cost Allocation (ABC) 76,476 89,900 87,247 86,900 86,900
Parks - Grounds Expenditure 2,441,908 2,522,400 2,572,515 52,300 2,605,900 2,658,200
Parks - Grounds (Net) 2,427,782 2,522,400 2,555,774 52,300 2,605,900 2,658,200
________________________________________________________________________________________________
Page 3.56
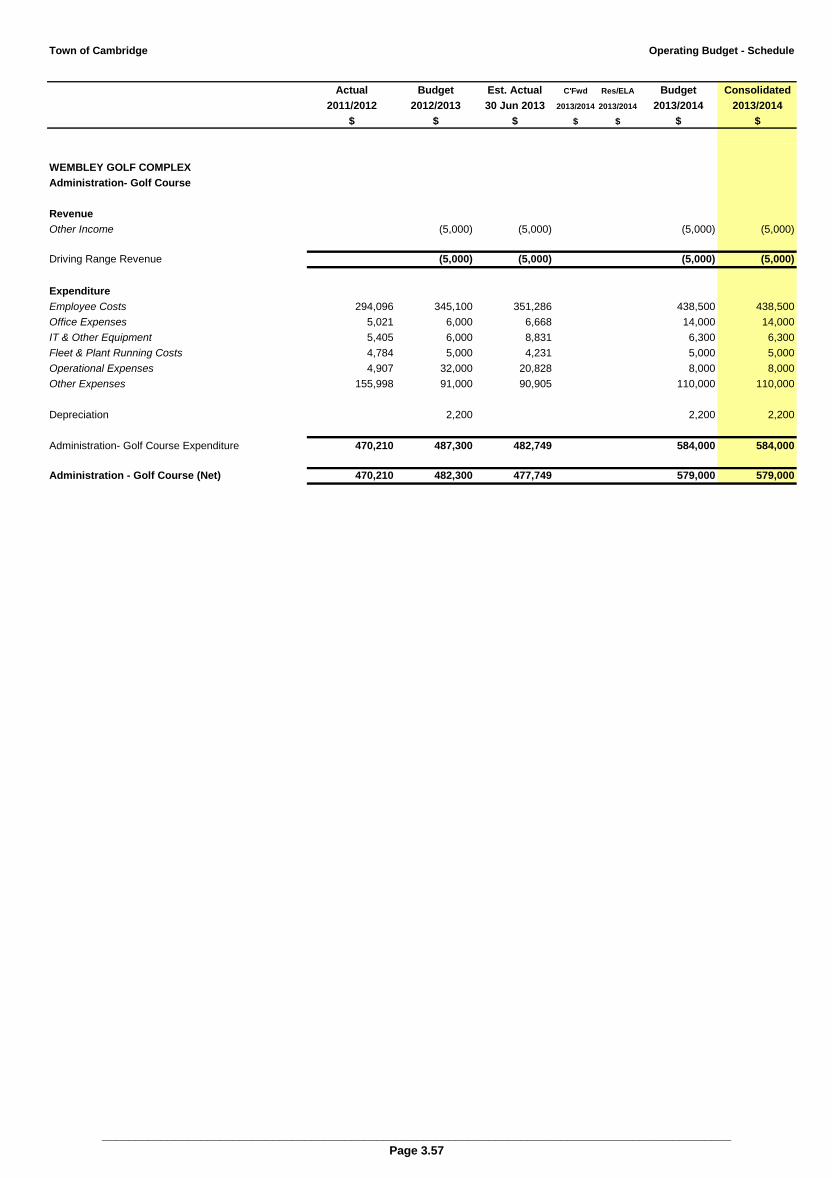
Town of Cambridge Operating Budget - Schedule
Actual Budget Est. Actual C'Fwd Res/ELA Budget Consolidated
2011/2012 2012/2013 30 Jun 2013 2013/2014 2013/2014 2013/2014 2013/2014
$ $ $ $ $ $ $
WEMBLEY GOLF COMPLEX
Administration- Golf Course
Revenue
Other Income (5,000) (5,000) (5,000) (5,000)
Driving Range Revenue (5,000) (5,000) (5,000) (5,000)
Expenditure
Employee Costs 294,096 345,100 351,286 438,500 438,500
Office Expenses 5,021 6,000 6,668 14,000 14,000
IT & Other Equipment 5,405 6,000 8,831 6,300 6,300
Fleet & Plant Running Costs 4,784 5,000 4,231 5,000 5,000
Operational Expenses 4,907 32,000 20,828 8,000 8,000
Other Expenses 155,998 91,000 90,905 110,000 110,000
Depreciation 2,200 2,200 2,200
Administration- Golf Course Expenditure 470,210 487,300 482,749 584,000 584,000
Administration - Golf Course (Net) 470,210 482,300 477,749 579,000 579,000
________________________________________________________________________________________________
Page 3.57

Town of Cambridge Operating Budget - Schedule
Actual Budget Est. Actual C'Fwd Res/ELA Budget Consolidated
2011/2012 2012/2013 30 Jun 2013 2013/2014 2013/2014 2013/2014 2013/2014
$ $ $ $ $ $ $
WEMBLEY GOLF COMPLEX
Wembley Golf Complex - Driving Range
Revenues
Merchandise Sales (66,000) (12,085) (54,000) (54,000)
Fees & Charges - Local Govt Property (1,734,030) (1,980,500) (2,025,942) (2,010,000) (2,010,000)
Merchandise Sales (5,653) (12,000) (9,570) (12,000) (12,000)
Driving Range Revenue (1,739,683) (2,058,500) (2,047,596) (2,076,000) (2,076,000)
Expenditure
Employee Costs 524,196 74,500 267,259 213,900 213,900
Office Expenses 1,729 3,000 942 3,000 3,000
Fleet & Plant Running Costs 10,413 10,300 9,665 1,500 1,500
Operational Expenses 52,361 371,300 291,836 321,500 321,500
Interest Expenses 424,437 540,100 310,655 421,200 421,200
Infrastructure 177,986 154,300 187,766 153,300 153,300
Other Expenses 87,587 91,000 75,428 92,000 92,000
Sub-total 1,278,709 1,244,500 1,143,551 1,206,400 1,206,400
Depreciation 318,972 317,500 361,785 347,400 347,400
Driving Range Expenditure 1,597,682 1,562,000 1,505,336 1,553,800 1,553,800
Wembley Golf Driving Range (Net) (142,002) (496,500) (542,260) (522,200) (522,200)
________________________________________________________________________________________________
Page 3.58
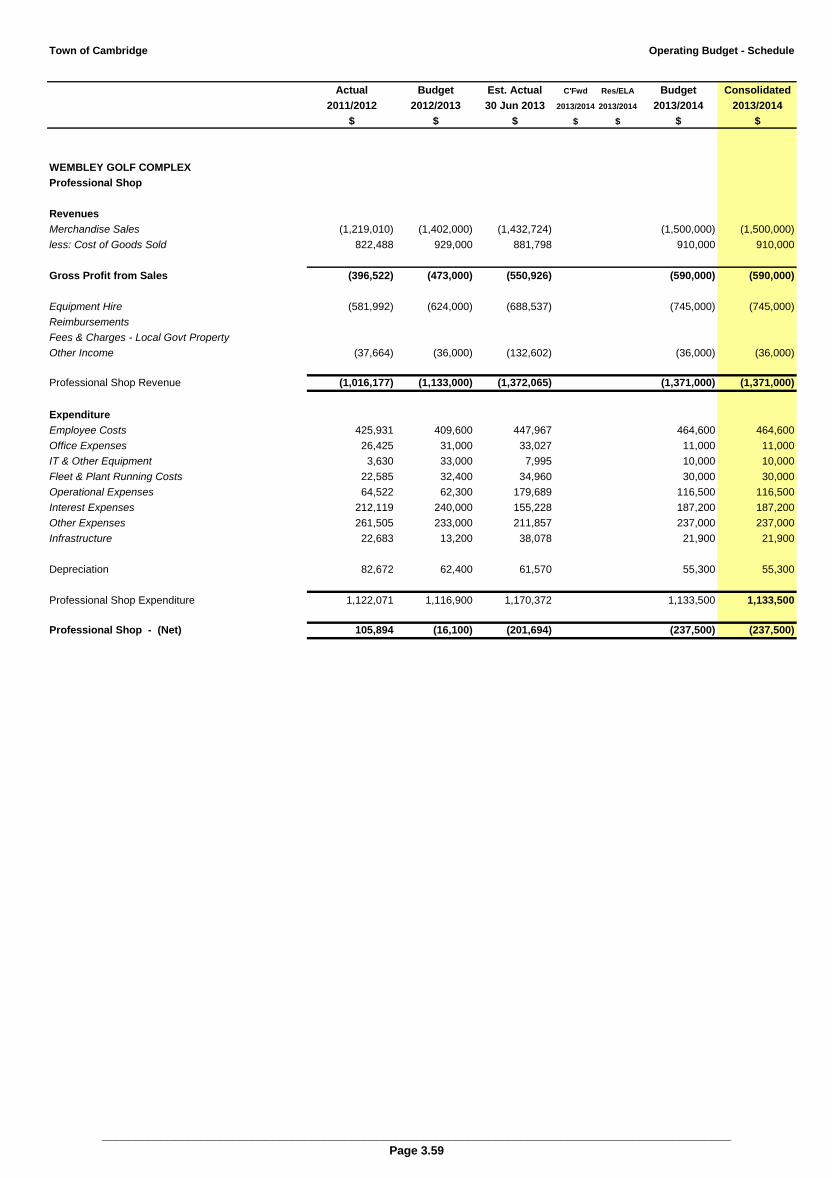
Town of Cambridge Operating Budget - Schedule
Actual Budget Est. Actual C'Fwd Res/ELA Budget Consolidated
2011/2012 2012/2013 30 Jun 2013 2013/2014 2013/2014 2013/2014 2013/2014
$ $ $ $ $ $ $
WEMBLEY GOLF COMPLEX
Professional Shop
Revenues
Merchandise Sales (1,219,010) (1,402,000) (1,432,724) (1,500,000) (1,500,000)
less: Cost of Goods Sold 822,488 929,000 881,798 910,000 910,000
Gross Profit from Sales (396,522) (473,000) (550,926) (590,000) (590,000)
Equipment Hire (581,992) (624,000) (688,537) (745,000) (745,000)
Reimbursements
Fees & Charges - Local Govt Property
Other Income (37,664) (36,000) (132,602) (36,000) (36,000)
Professional Shop Revenue (1,016,177) (1,133,000) (1,372,065) (1,371,000) (1,371,000)
Expenditure
Employee Costs 425,931 409,600 447,967 464,600 464,600
Office Expenses 26,425 31,000 33,027 11,000 11,000
IT & Other Equipment 3,630 33,000 7,995 10,000 10,000
Fleet & Plant Running Costs 22,585 32,400 34,960 30,000 30,000
Operational Expenses 64,522 62,300 179,689 116,500 116,500
Interest Expenses 212,119 240,000 155,228 187,200 187,200
Other Expenses 261,505 233,000 211,857 237,000 237,000
Infrastructure 22,683 13,200 38,078 21,900 21,900
Depreciation 82,672 62,400 61,570 55,300 55,300
Professional Shop Expenditure 1,122,071 1,116,900 1,170,372 1,133,500 1,133,500
Professional Shop - (Net) 105,894 (16,100) (201,694) (237,500) (237,500)
________________________________________________________________________________________________
Page 3.59
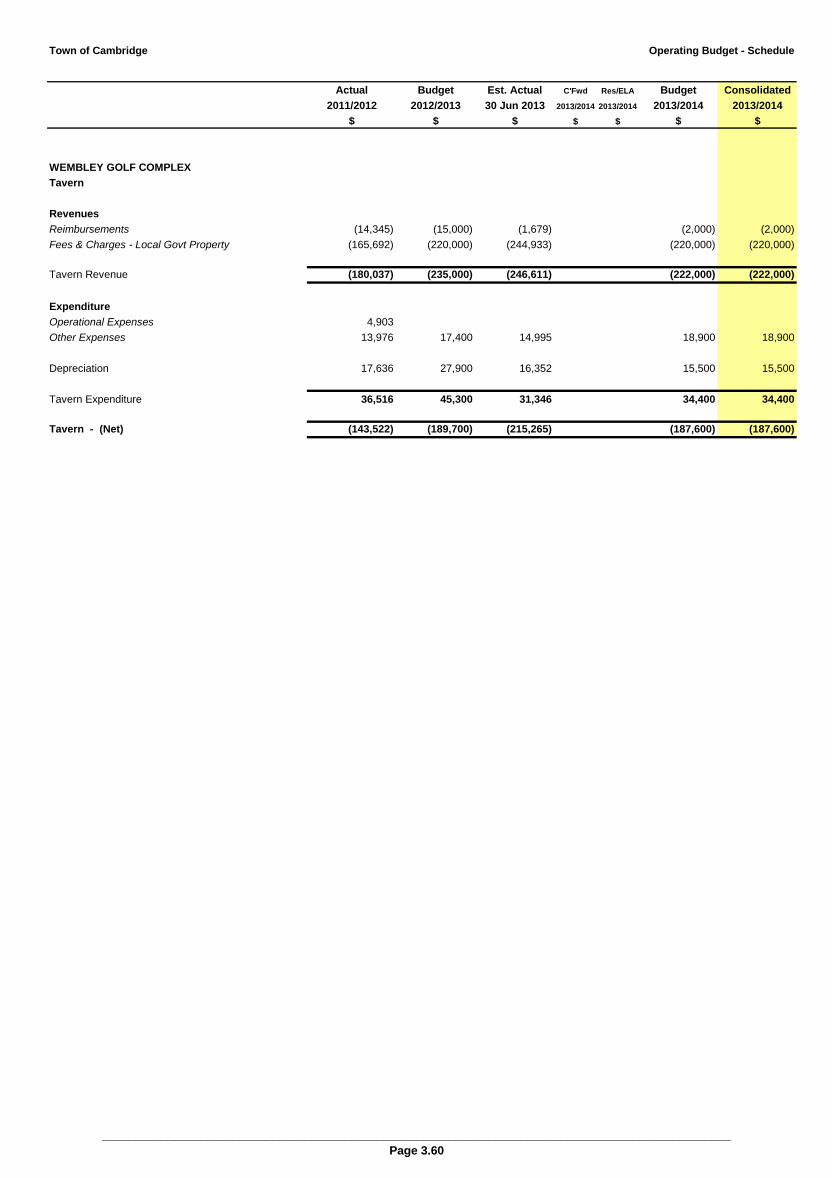
Town of Cambridge Operating Budget - Schedule
Actual Budget Est. Actual C'Fwd Res/ELA Budget Consolidated
2011/2012 2012/2013 30 Jun 2013 2013/2014 2013/2014 2013/2014 2013/2014
$ $ $ $ $ $ $
WEMBLEY GOLF COMPLEX
Tavern
Revenues
Reimbursements (14,345) (15,000) (1,679) (2,000) (2,000)
Fees & Charges - Local Govt Property (165,692) (220,000) (244,933) (220,000) (220,000)
Tavern Revenue (180,037) (235,000) (246,611) (222,000) (222,000)
Expenditure
Operational Expenses 4,903
Other Expenses 13,976 17,400 14,995 18,900 18,900
Depreciation 17,636 27,900 16,352 15,500 15,500
Tavern Expenditure 36,516 45,300 31,346 34,400 34,400
Tavern - (Net) (143,522) (189,700) (215,265) (187,600) (187,600)
________________________________________________________________________________________________
Page 3.60
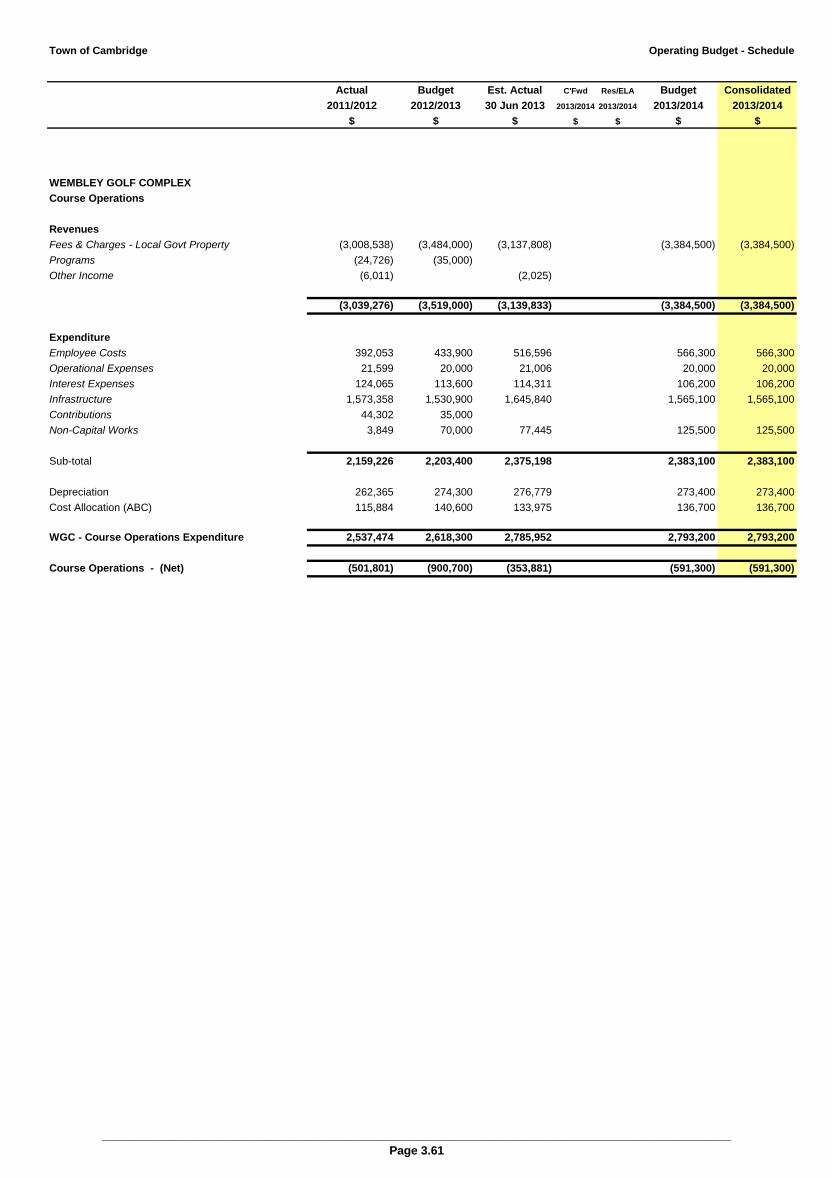
Town of Cambridge Operating Budget - Schedule
Actual Budget Est. Actual C'Fwd Res/ELA Budget Consolidated
2011/2012 2012/2013 30 Jun 2013 2013/2014 2013/2014 2013/2014 2013/2014
$ $ $ $ $ $ $
WEMBLEY GOLF COMPLEX
Course Operations
Revenues
Fees & Charges - Local Govt Property (3,008,538) (3,484,000) (3,137,808) (3,384,500) (3,384,500)
Programs (24,726) (35,000)
Other Income (6,011) (2,025)
(3,039,276) (3,519,000) (3,139,833) (3,384,500) (3,384,500)
Expenditure
Employee Costs 392,053 433,900 516,596 566,300 566,300
Operational Expenses 21,599 20,000 21,006 20,000 20,000
Interest Expenses 124,065 113,600 114,311 106,200 106,200
Infrastructure 1,573,358 1,530,900 1,645,840 1,565,100 1,565,100
Contributions 44,302 35,000
Non-Capital Works 3,849 70,000 77,445 125,500 125,500
Sub-total 2,159,226 2,203,400 2,375,198 2,383,100 2,383,100
Depreciation 262,365 274,300 276,779 273,400 273,400
Cost Allocation (ABC) 115,884 140,600 133,975 136,700 136,700
WGC - Course Operations Expenditure 2,537,474 2,618,300 2,785,952 2,793,200 2,793,200
Course Operations - (Net) (501,801) (900,700) (353,881) (591,300) (591,300)
________________________________________________________________________________________________
Page 3.61
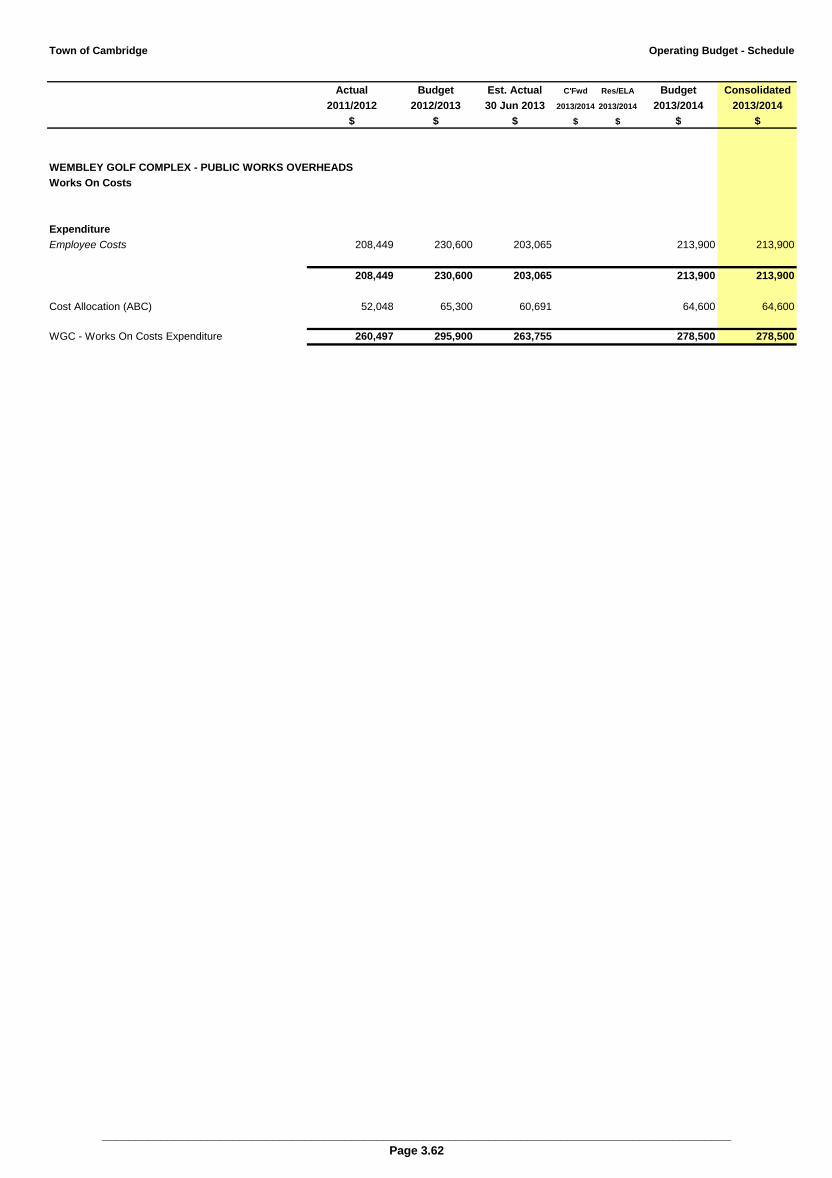
Town of Cambridge Operating Budget - Schedule
Actual Budget Est. Actual C'Fwd Res/ELA Budget Consolidated
2011/2012 2012/2013 30 Jun 2013 2013/2014 2013/2014 2013/2014 2013/2014
$ $ $ $ $ $ $
WEMBLEY GOLF COMPLEX - PUBLIC WORKS OVERHEADS
Works On Costs
Expenditure
Employee Costs 208,449 230,600 203,065 213,900 213,900
208,449 230,600 203,065 213,900 213,900
Cost Allocation (ABC) 52,048 65,300 60,691 64,600 64,600
WGC - Works On Costs Expenditure 260,497 295,900 263,755 278,500 278,500
________________________________________________________________________________________________
Page 3.62

Town of Cambridge Operating Budget - Schedule
Actual Budget Est. Actual C'Fwd Res/ELA Budget Consolidated
2011/2012 2012/2013 30 Jun 2013 2013/2014 2013/2014 2013/2014 2013/2014
$ $ $ $ $ $ $
WEMBLEY GOLF COMPLEX - PUBLIC WORKS OVERHEADS
Works Overheads
Expenditure
Employee Costs 122,016 120,000 112,736 125,300 125,300
Office Expenses 4,004 5,000 3,278 5,000 5,000
IT & Other Equipment 3,931 7,000 5,378 7,000 7,000
Fleet & Plant Running Costs 3,827 4,500 8,111 4,500 4,500
Operational Expenses 2,597 2,000 1,091 2,000 2,000
Other Expenses 446 500 909 500 500
136,821 139,000 131,504 144,300 144,300
Depreciation 333 300 333 200 200
Cost Allocation (ABC) 29,424 37,400 33,681 37,600 37,600
WGC - Works Overheads Expenditure 166,577 176,700 165,518 182,100 182,100
WGC - Public Works Overheads (Net) 427,074 472,600 429,273 460,600 460,600
Wembley Golf Complex - Public Works Overheads (ABC Summary)
Overhead Expenditure (4,812) 472,600 10,182 460,600 460,600
Less Overhead Recovered (437,249) (411,500) (419,091) (472,500) (472,500)
Under/(Over) Allocated (10,175) 61,100 10,182 (11,900) (11,900)
________________________________________________________________________________________________
Page 3.63

Town of Cambridge Operating Budget - Schedule
Actual Budget Est. Actual C'Fwd Res/ELA Budget Consolidated
2011/2012 2012/2013 30 Jun 2013 2013/2014 2013/2014 2013/2014 2013/2014
$ $ $ $ $ $ $
WEMBLEY GOLF COMPLEX
Plant Operations
Revenues
Reimbursements
Gain on Disposal of Assets (72,338)
WGC - Plant Operations Revenue (72,338)
Expenditure
IT & Other Equipment 2,766 3,500 2,116 3,000 3,000
Fleet & Plant Running Costs 144,036 115,000 138,714 115,000 115,000
Other Expenses 126,101 205,000 209,000 205,000 205,000
Loss on Disposal of Assets 40,944
313,847 323,500 349,831 323,000 323,000
Depreciation 30,684 10,000 6,608 5,300 5,300
Cost Allocation (ABC) 9,830 11,400 11,036 11,000 11,000
WGC - Plant Operations Expenditure 354,362 344,900 367,474 339,300 339,300
Less Overhead Recovered (275,562) (332,800) (285,197) (332,800) (332,800)
Under/(Over) Allocated 78,800 12,100 82,277 6,500 6,500
________________________________________________________________________________________________
Page 3.64
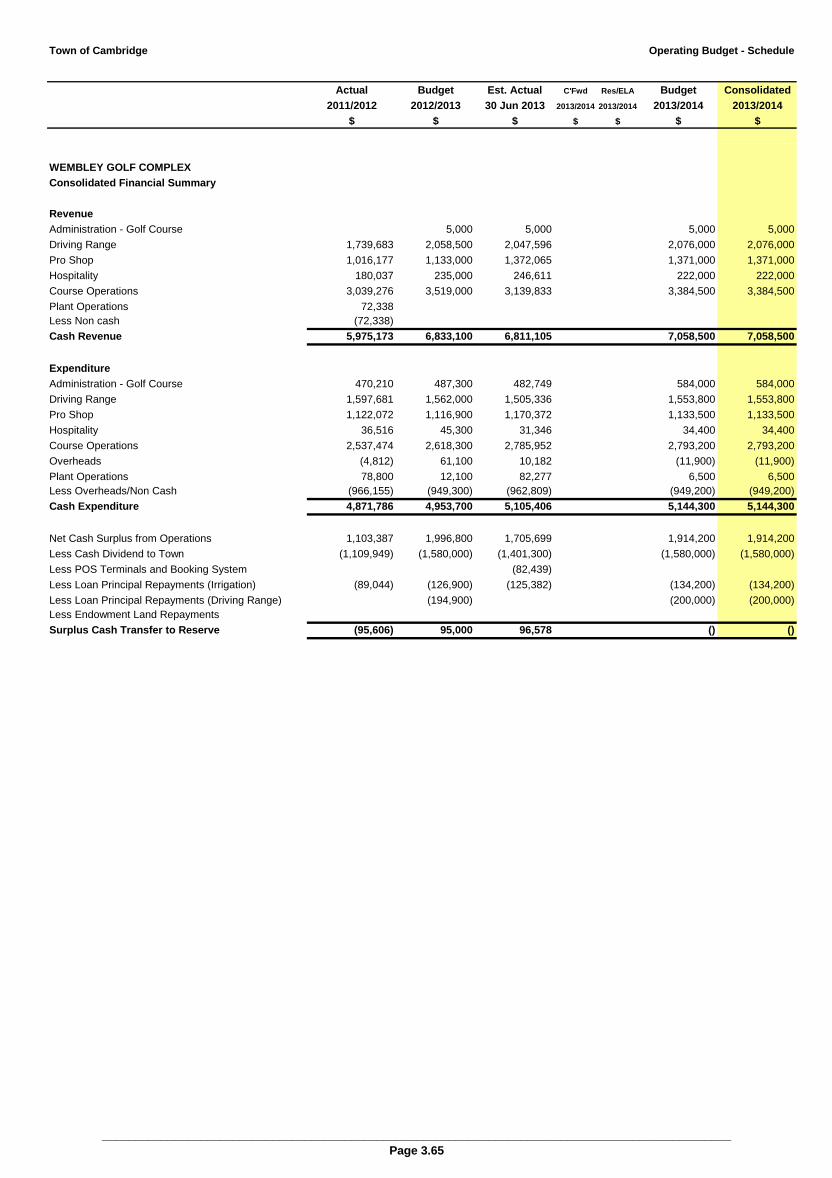
Town of Cambridge Operating Budget - Schedule
Actual Budget Est. Actual C'Fwd Res/ELA Budget Consolidated
2011/2012 2012/2013 30 Jun 2013 2013/2014 2013/2014 2013/2014 2013/2014
$ $ $ $ $ $ $
WEMBLEY GOLF COMPLEX
Consolidated Financial Summary
Revenue
Administration - Golf Course 5,000 5,000 5,000 5,000
Driving Range 1,739,683 2,058,500 2,047,596 2,076,000 2,076,000
Pro Shop 1,016,177 1,133,000 1,372,065 1,371,000 1,371,000
Hospitality 180,037 235,000 246,611 222,000 222,000
Course Operations 3,039,276 3,519,000 3,139,833 3,384,500 3,384,500
Plant Operations 72,338
Less Non cash (72,338)
Cash Revenue 5,975,173 6,833,100 6,811,105 7,058,500 7,058,500
Expenditure
Administration - Golf Course 470,210 487,300 482,749 584,000 584,000
Driving Range 1,597,681 1,562,000 1,505,336 1,553,800 1,553,800
Pro Shop 1,122,072 1,116,900 1,170,372 1,133,500 1,133,500
Hospitality 36,516 45,300 31,346 34,400 34,400
Course Operations 2,537,474 2,618,300 2,785,952 2,793,200 2,793,200
Overheads (4,812) 61,100 10,182 (11,900) (11,900)
Plant Operations 78,800 12,100 82,277 6,500 6,500
Less Overheads/Non Cash (966,155) (949,300) (962,809) (949,200) (949,200)
Cash Expenditure 4,871,786 4,953,700 5,105,406 5,144,300 5,144,300
Net Cash Surplus from Operations 1,103,387 1,996,800 1,705,699 1,914,200 1,914,200
Less Cash Dividend to Town (1,109,949) (1,580,000) (1,401,300) (1,580,000) (1,580,000)
Less POS Terminals and Booking System (82,439)
Less Loan Principal Repayments (Irrigation) (89,044) (126,900) (125,382) (134,200) (134,200)
Less Loan Principal Repayments (Driving Range) (194,900) (200,000) (200,000)
Less Endowment Land Repayments
Surplus Cash Transfer to Reserve (95,606) 95,000 96,578 () ()
________________________________________________________________________________________________
Page 3.65
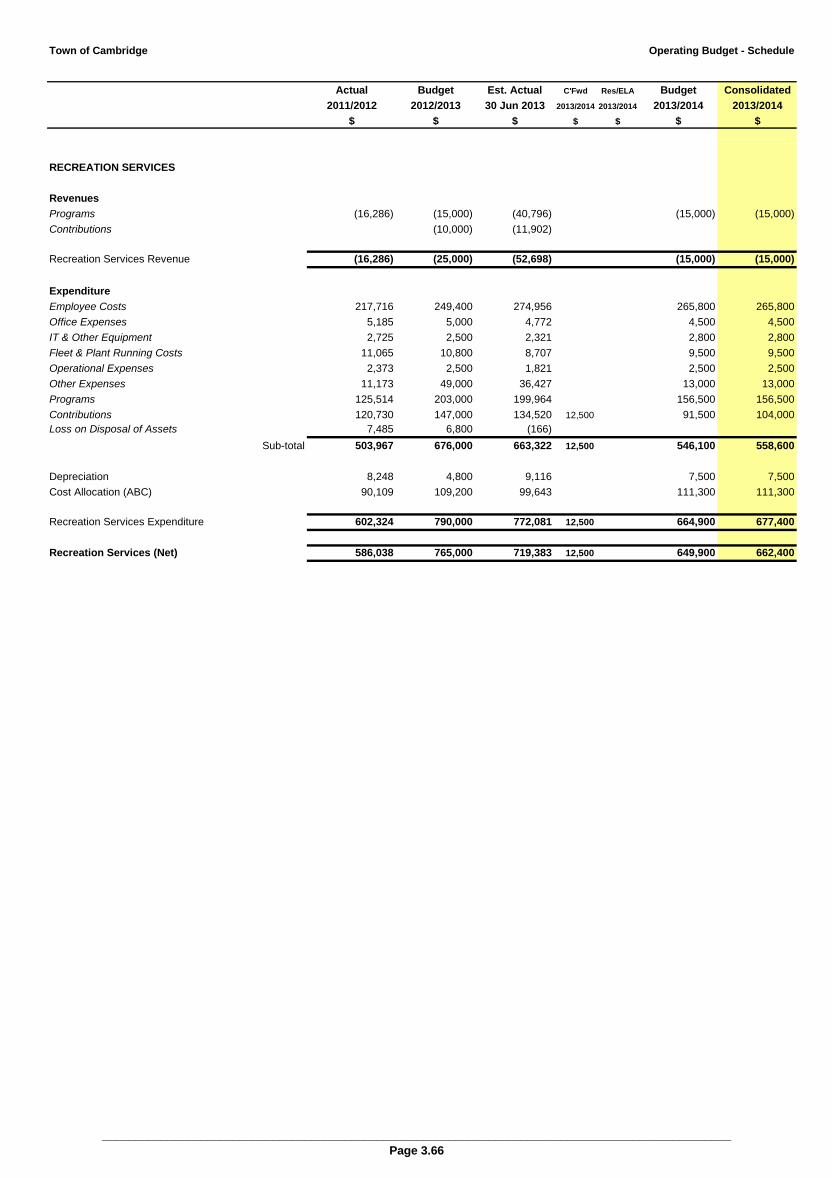
Town of Cambridge Operating Budget - Schedule
Actual Budget Est. Actual C'Fwd Res/ELA Budget Consolidated
2011/2012 2012/2013 30 Jun 2013 2013/2014 2013/2014 2013/2014 2013/2014
$ $ $ $ $ $ $
RECREATION SERVICES
Revenues
Programs (16,286) (15,000) (40,796) (15,000) (15,000)
Contributions (10,000) (11,902)
Recreation Services Revenue (16,286) (25,000) (52,698) (15,000) (15,000)
Expenditure
Employee Costs 217,716 249,400 274,956 265,800 265,800
Office Expenses 5,185 5,000 4,772 4,500 4,500
IT & Other Equipment 2,725 2,500 2,321 2,800 2,800
Fleet & Plant Running Costs 11,065 10,800 8,707 9,500 9,500
Operational Expenses 2,373 2,500 1,821 2,500 2,500
Other Expenses 11,173 49,000 36,427 13,000 13,000
Programs 125,514 203,000 199,964 156,500 156,500
Contributions 120,730 147,000 134,520 12,500 91,500 104,000
Loss on Disposal of Assets 7,485 6,800 (166)
Sub-total 503,967 676,000 663,322 12,500 546,100 558,600
Depreciation 8,248 4,800 9,116 7,500 7,500
Cost Allocation (ABC) 90,109 109,200 99,643 111,300 111,300
Recreation Services Expenditure 602,324 790,000 772,081 12,500 664,900 677,400
Recreation Services (Net) 586,038 765,000 719,383 12,500 649,900 662,400
________________________________________________________________________________________________
Page 3.66

Town of Cambridge Operating Budget - Schedule
Actual Budget Est. Actual C'Fwd Res/ELA Budget Consolidated
2011/2012 2012/2013 30 Jun 2013 2013/2014 2013/2014 2013/2014 2013/2014
$ $ $ $ $ $ $
CAMBRIDGE LIBRARY
Revenues
Fees & Charges - Non-Local Govt Property (45,962) (45,500) (41,651) (39,500) (39,500)
Fees & Charges - Local Govt Property (975) (1,000) (345) (1,000) (1,000)
Internal Revenue Allocations (7,000) (7,000) (7,000) (7,000) (7,000)
Other Income (405) (56)
Cambridge Library Revenue (54,341) (53,500) (49,052) (47,500) (47,500)
Expenditure
Employee Costs 1,121,017 1,167,200 1,101,077 1,183,800 1,183,800
Office Expenses 37,456 39,000 37,928 40,500 40,500
IT & Other Equipment 24,525 36,100 35,803 39,000 39,000
Fleet & Plant Running Costs 6,043 4,700 5,593 5,500 5,500
Operational Expenses 28,915 30,500 25,506 31,000 31,000
Other Expenses 67,324 62,800 60,430 59,000 59,000
Infrastructure 144,757 179,100 163,160 189,900 189,900
Non-Capital Works 5,500 5,280 5,000 5,000
Loss on Disposal of Assets 8,800 7,486
Sub-total 1,430,037 1,533,700 1,442,263 1,553,700 1,553,700
Depreciation 120,413 142,100 119,932 107,800 107,800
Cost Allocation (ABC) 302,530 410,200 350,048 421,500 421,500
Cambridge Library Expenditure 1,852,980 2,086,000 1,912,242 2,083,000 2,083,000
Cambridge Library (Net) 1,798,639 2,032,500 1,863,191 2,035,500 2,035,500
________________________________________________________________________________________________
Page 3.67
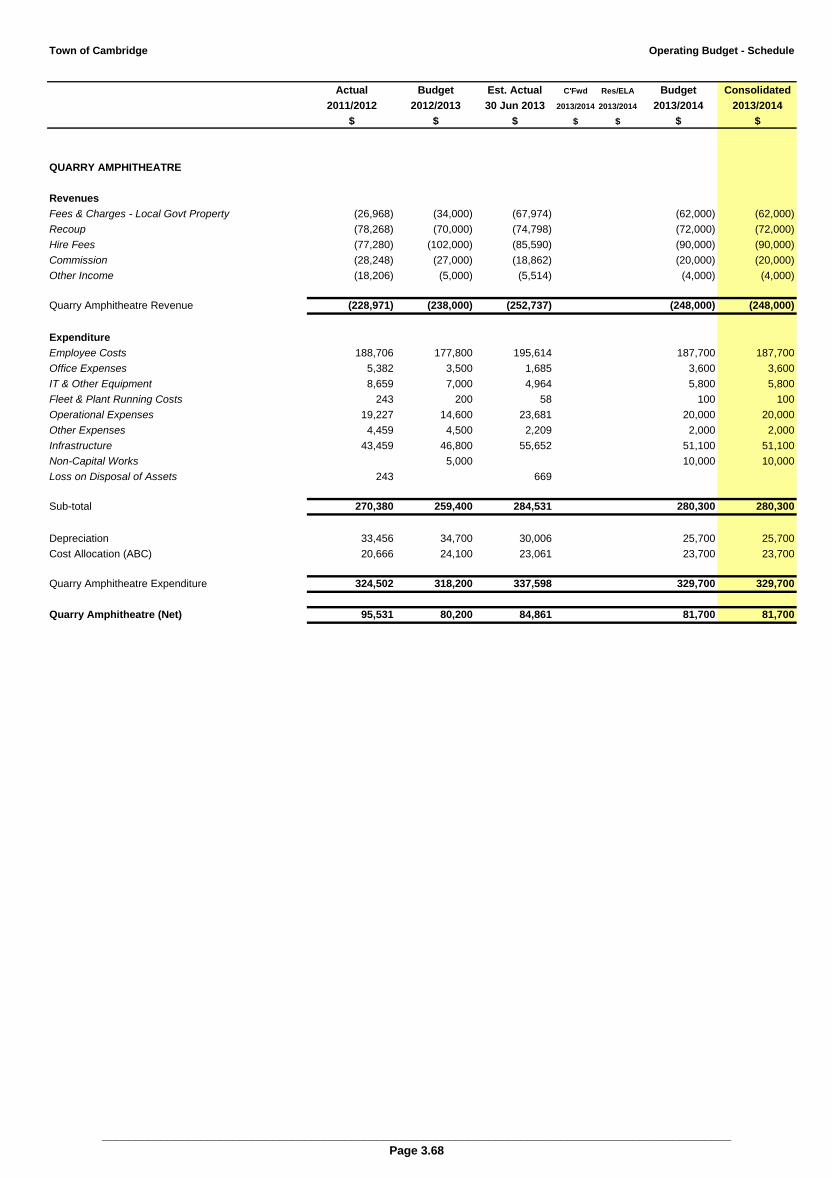
Town of Cambridge Operating Budget - Schedule
Actual Budget Est. Actual C'Fwd Res/ELA Budget Consolidated
2011/2012 2012/2013 30 Jun 2013 2013/2014 2013/2014 2013/2014 2013/2014
$ $ $ $ $ $ $
QUARRY AMPHITHEATRE
Revenues
Fees & Charges - Local Govt Property (26,968) (34,000) (67,974) (62,000) (62,000)
Recoup (78,268) (70,000) (74,798) (72,000) (72,000)
Hire Fees (77,280) (102,000) (85,590) (90,000) (90,000)
Commission (28,248) (27,000) (18,862) (20,000) (20,000)
Other Income (18,206) (5,000) (5,514) (4,000) (4,000)
Quarry Amphitheatre Revenue (228,971) (238,000) (252,737) (248,000) (248,000)
Expenditure
Employee Costs 188,706 177,800 195,614 187,700 187,700
Office Expenses 5,382 3,500 1,685 3,600 3,600
IT & Other Equipment 8,659 7,000 4,964 5,800 5,800
Fleet & Plant Running Costs 243 200 58 100 100
Operational Expenses 19,227 14,600 23,681 20,000 20,000
Other Expenses 4,459 4,500 2,209 2,000 2,000
Infrastructure 43,459 46,800 55,652 51,100 51,100
Non-Capital Works 5,000 10,000 10,000
Loss on Disposal of Assets 243 669
Sub-total 270,380 259,400 284,531 280,300 280,300
Depreciation 33,456 34,700 30,006 25,700 25,700
Cost Allocation (ABC) 20,666 24,100 23,061 23,700 23,700
Quarry Amphitheatre Expenditure 324,502 318,200 337,598 329,700 329,700
Quarry Amphitheatre (Net) 95,531 80,200 84,861 81,700 81,700
________________________________________________________________________________________________
Page 3.68

Town of Cambridge Operating Budget - Schedule
Actual Budget Est. Actual C'Fwd Res/ELA Budget Consolidated
2011/2012 2012/2013 30 Jun 2013 2013/2014 2013/2014 2013/2014 2013/2014
$ $ $ $ $ $ $
ROAD INFRASTRUCTURE
Revenues
Operating Grants & Subsidies (65,743) (69,000) (70,851) (72,000) (72,000)
Reimbursements (15,139) (25,000) (8,016) (14,000) (14,000)
Fees & Charges - Non-Local Govt Property (70,102) (90,000) (8,429) (70,000) (70,000)
MRWA Rehabilitation (230,096) (698,200) (583,201) (591,000) (591,000)
MRWA Blackspot (310,134) (194,300) (169,269) (524,000) (524,000)
Roads to Recovery (182,900) (182,500) (182,900) (182,000) (182,000)
Capital Grants (41,226) (180,000) (180,000)
Capital Contributions (20,000) (25,000)
Other Income (13,734) (12,000) (14,070) (13,000) (13,000)
Road Infrastructure Revenue (949,074) (1,296,000) (1,036,736) (1,646,000) (1,646,000)
Expenditure
Operational Expenses 63,722 60,000 65,182 60,000 60,000
Infrastructure 1,972,492 1,956,000 2,054,358 2,027,000 2,027,000
Programs 1,414 3,000 1,471 12,000 12,000
Non-Capital Works 241,040 348,400 248,429 94,700 655,000 749,700
Recoverable Works 14,500 25,000 8,889 14,000 14,000
Loss on Disposal of Assets 470,530
Sub-total 2,763,698 2,392,400 2,378,329 94,700 2,768,000 2,862,700
Depreciation 2,232,325 2,185,900 2,167,680 2,185,900 2,185,900
Cost Allocation (ABC) 95,581 112,200 108,932 108,600 108,600
Road Infrastructure Expenditure 5,091,605 4,690,500 4,654,941 94,700 5,062,500 5,157,200
Road Infrastructure (Net) 4,142,531 3,394,500 3,618,205 94,700 3,416,500 3,511,200
________________________________________________________________________________________________
Page 3.69
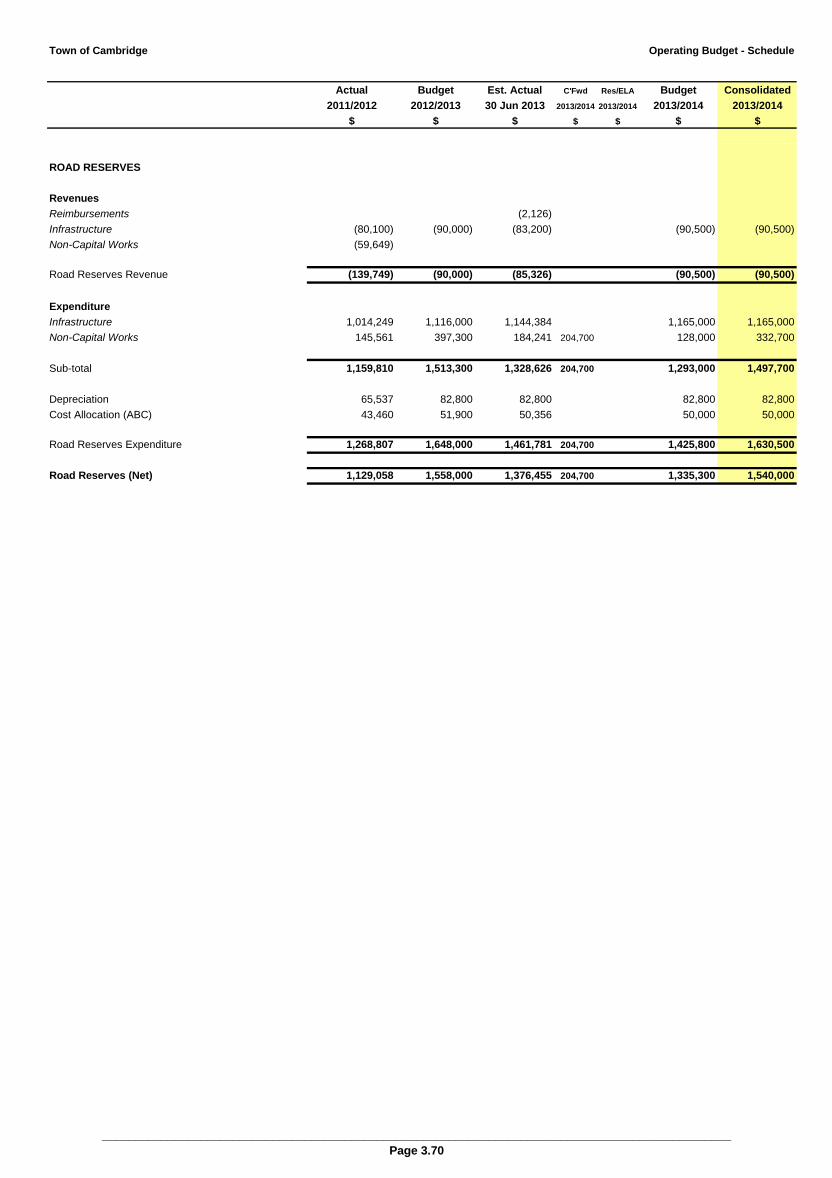
Town of Cambridge Operating Budget - Schedule
Actual Budget Est. Actual C'Fwd Res/ELA Budget Consolidated
2011/2012 2012/2013 30 Jun 2013 2013/2014 2013/2014 2013/2014 2013/2014
$ $ $ $ $ $ $
ROAD RESERVES
Revenues
Reimbursements (2,126)
Infrastructure (80,100) (90,000) (83,200) (90,500) (90,500)
Non-Capital Works (59,649)
Road Reserves Revenue (139,749) (90,000) (85,326) (90,500) (90,500)
Expenditure
Infrastructure 1,014,249 1,116,000 1,144,384 1,165,000 1,165,000
Non-Capital Works 145,561 397,300 184,241 204,700 128,000 332,700
Sub-total 1,159,810 1,513,300 1,328,626 204,700 1,293,000 1,497,700
Depreciation 65,537 82,800 82,800 82,800 82,800
Cost Allocation (ABC) 43,460 51,900 50,356 50,000 50,000
Road Reserves Expenditure 1,268,807 1,648,000 1,461,781 204,700 1,425,800 1,630,500
Road Reserves (Net) 1,129,058 1,558,000 1,376,455 204,700 1,335,300 1,540,000
________________________________________________________________________________________________
Page 3.70
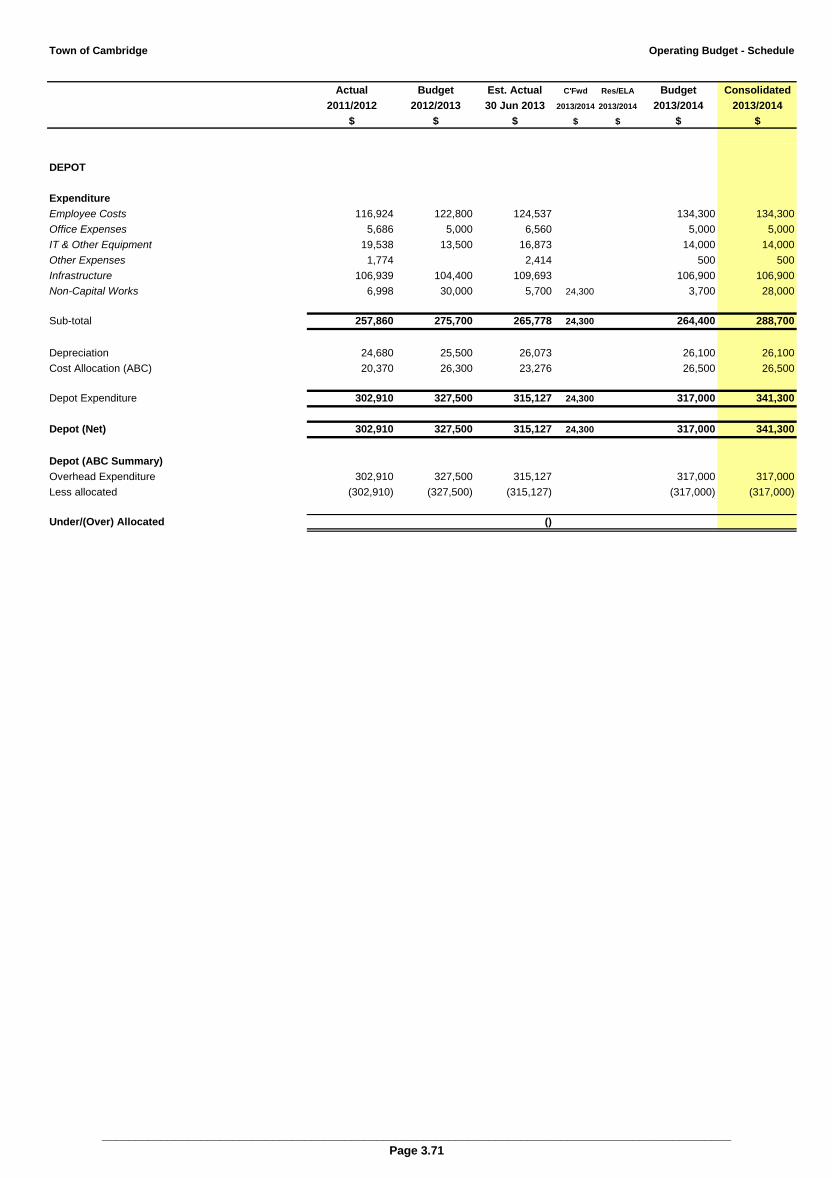
Town of Cambridge Operating Budget - Schedule
Actual Budget Est. Actual C'Fwd Res/ELA Budget Consolidated
2011/2012 2012/2013 30 Jun 2013 2013/2014 2013/2014 2013/2014 2013/2014
$ $ $ $ $ $ $
DEPOT
Expenditure
Employee Costs 116,924 122,800 124,537 134,300 134,300
Office Expenses 5,686 5,000 6,560 5,000 5,000
IT & Other Equipment 19,538 13,500 16,873 14,000 14,000
Other Expenses 1,774 2,414 500 500
Infrastructure 106,939 104,400 109,693 106,900 106,900
Non-Capital Works 6,998 30,000 5,700 24,300 3,700 28,000
Sub-total 257,860 275,700 265,778 24,300 264,400 288,700
Depreciation 24,680 25,500 26,073 26,100 26,100
Cost Allocation (ABC) 20,370 26,300 23,276 26,500 26,500
Depot Expenditure 302,910 327,500 315,127 24,300 317,000 341,300
Depot (Net) 302,910 327,500 315,127 24,300 317,000 341,300
Depot (ABC Summary)
Overhead Expenditure 302,910 327,500 315,127 317,000 317,000
Less allocated (302,910) (327,500) (315,127) (317,000) (317,000)
Under/(Over) Allocated ()
________________________________________________________________________________________________
Page 3.71
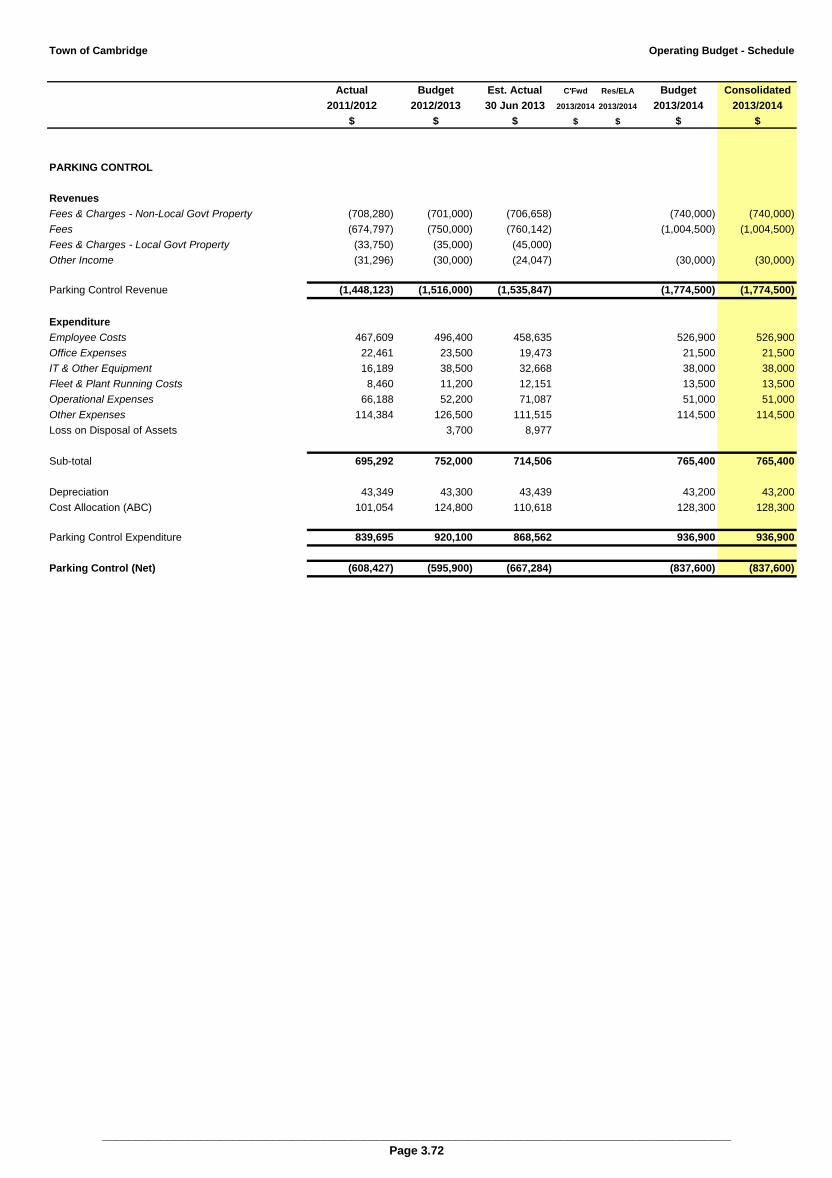
Town of Cambridge Operating Budget - Schedule
Actual Budget Est. Actual C'Fwd Res/ELA Budget Consolidated
2011/2012 2012/2013 30 Jun 2013 2013/2014 2013/2014 2013/2014 2013/2014
$ $ $ $ $ $ $
PARKING CONTROL
Revenues
Fees & Charges - Non-Local Govt Property (708,280) (701,000) (706,658) (740,000) (740,000)
Fees (674,797) (750,000) (760,142) (1,004,500) (1,004,500)
Fees & Charges - Local Govt Property (33,750) (35,000) (45,000)
Other Income (31,296) (30,000) (24,047) (30,000) (30,000)
Parking Control Revenue (1,448,123) (1,516,000) (1,535,847) (1,774,500) (1,774,500)
Expenditure
Employee Costs 467,609 496,400 458,635 526,900 526,900
Office Expenses 22,461 23,500 19,473 21,500 21,500
IT & Other Equipment 16,189 38,500 32,668 38,000 38,000
Fleet & Plant Running Costs 8,460 11,200 12,151 13,500 13,500
Operational Expenses 66,188 52,200 71,087 51,000 51,000
Other Expenses 114,384 126,500 111,515 114,500 114,500
Loss on Disposal of Assets 3,700 8,977
Sub-total 695,292 752,000 714,506 765,400 765,400
Depreciation 43,349 43,300 43,439 43,200 43,200
Cost Allocation (ABC) 101,054 124,800 110,618 128,300 128,300
Parking Control Expenditure 839,695 920,100 868,562 936,900 936,900
Parking Control (Net) (608,427) (595,900) (667,284) (837,600) (837,600)
________________________________________________________________________________________________
Page 3.72
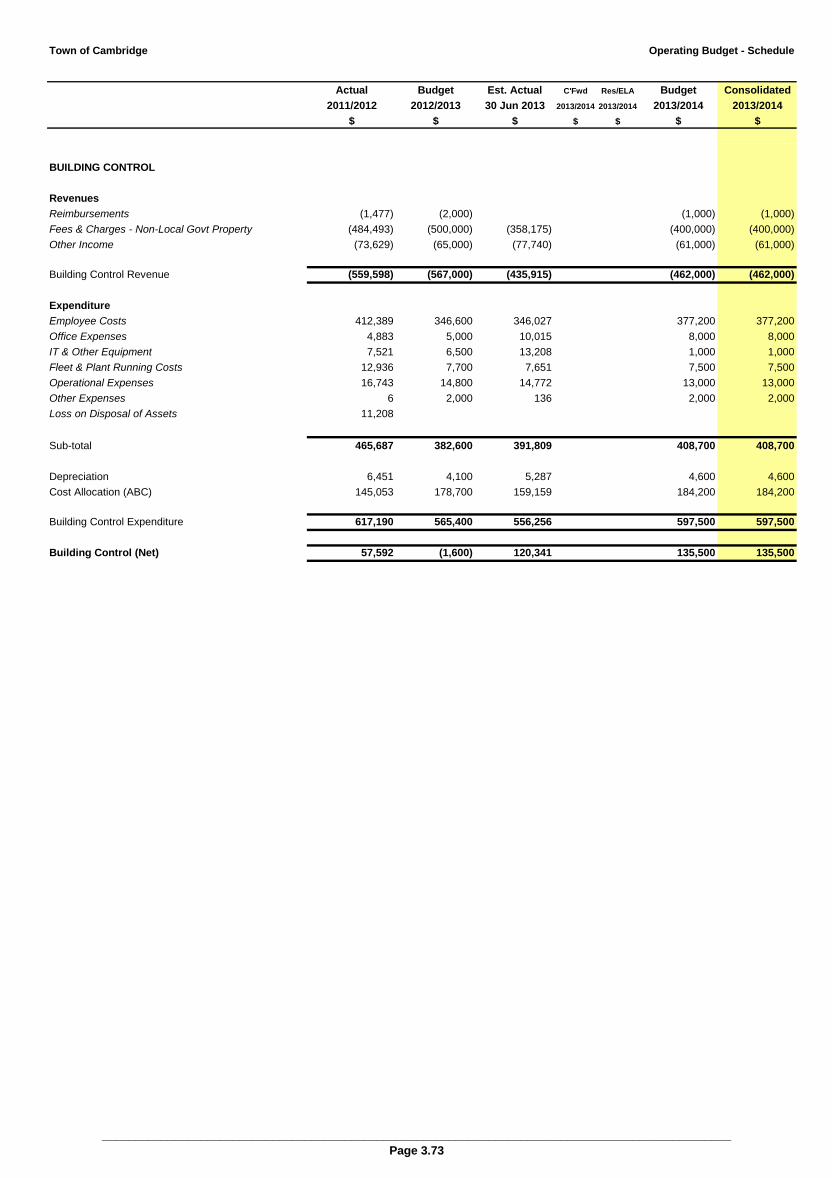
Town of Cambridge Operating Budget - Schedule
Actual Budget Est. Actual C'Fwd Res/ELA Budget Consolidated
2011/2012 2012/2013 30 Jun 2013 2013/2014 2013/2014 2013/2014 2013/2014
$ $ $ $ $ $ $
BUILDING CONTROL
Revenues
Reimbursements (1,477) (2,000) (1,000) (1,000)
Fees & Charges - Non-Local Govt Property (484,493) (500,000) (358,175) (400,000) (400,000)
Other Income (73,629) (65,000) (77,740) (61,000) (61,000)
Building Control Revenue (559,598) (567,000) (435,915) (462,000) (462,000)
Expenditure
Employee Costs 412,389 346,600 346,027 377,200 377,200
Office Expenses 4,883 5,000 10,015 8,000 8,000
IT & Other Equipment 7,521 6,500 13,208 1,000 1,000
Fleet & Plant Running Costs 12,936 7,700 7,651 7,500 7,500
Operational Expenses 16,743 14,800 14,772 13,000 13,000
Other Expenses 6 2,000 136 2,000 2,000
Loss on Disposal of Assets 11,208
Sub-total 465,687 382,600 391,809 408,700 408,700
Depreciation 6,451 4,100 5,287 4,600 4,600
Cost Allocation (ABC) 145,053 178,700 159,159 184,200 184,200
Building Control Expenditure 617,190 565,400 556,256 597,500 597,500
Building Control (Net) 57,592 (1,600) 120,341 135,500 135,500
________________________________________________________________________________________________
Page 3.73
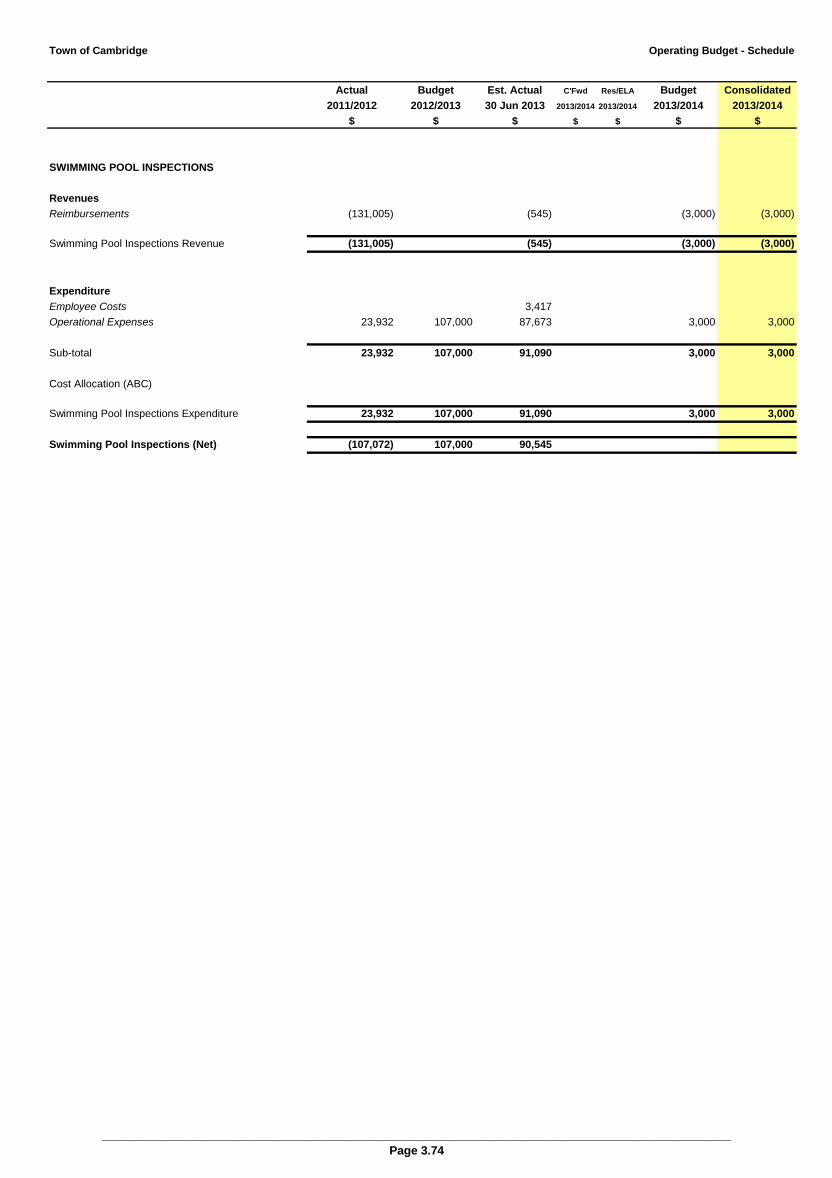
Town of Cambridge Operating Budget - Schedule
Actual Budget Est. Actual C'Fwd Res/ELA Budget Consolidated
2011/2012 2012/2013 30 Jun 2013 2013/2014 2013/2014 2013/2014 2013/2014
$ $ $ $ $ $ $
SWIMMING POOL INSPECTIONS
Revenues
Reimbursements (131,005) (545) (3,000) (3,000)
Swimming Pool Inspections Revenue (131,005) (545) (3,000) (3,000)
Expenditure
Employee Costs 3,417
Operational Expenses 23,932 107,000 87,673 3,000 3,000
Sub-total 23,932 107,000 91,090 3,000 3,000
Cost Allocation (ABC)
Swimming Pool Inspections Expenditure 23,932 107,000 91,090 3,000 3,000
Swimming Pool Inspections (Net) (107,072) 107,000 90,545
________________________________________________________________________________________________
Page 3.74
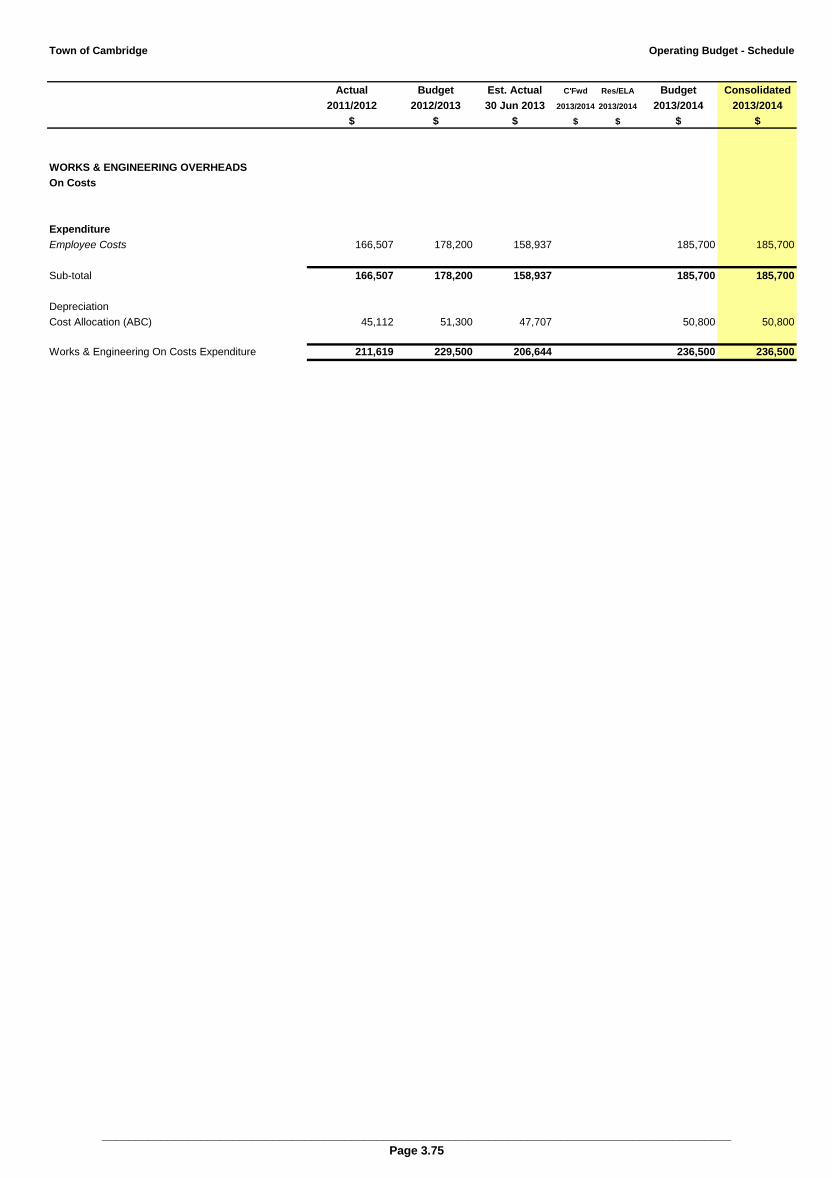
Town of Cambridge Operating Budget - Schedule
Actual Budget Est. Actual C'Fwd Res/ELA Budget Consolidated
2011/2012 2012/2013 30 Jun 2013 2013/2014 2013/2014 2013/2014 2013/2014
$ $ $ $ $ $ $
WORKS & ENGINEERING OVERHEADS
On Costs
Expenditure
Employee Costs 166,507 178,200 158,937 185,700 185,700
Sub-total 166,507 178,200 158,937 185,700 185,700
Depreciation
Cost Allocation (ABC) 45,112 51,300 47,707 50,800 50,800
Works & Engineering On Costs Expenditure 211,619 229,500 206,644 236,500 236,500
________________________________________________________________________________________________
Page 3.75

Town of Cambridge Operating Budget - Schedule
Actual Budget Est. Actual C'Fwd Res/ELA Budget Consolidated
2011/2012 2012/2013 30 Jun 2013 2013/2014 2013/2014 2013/2014 2013/2014
$ $ $ $ $ $ $
WORKS & ENGINEERING OVERHEADS
Overheads
Revenues
Reimbursements (1,958) (1,994)
Gain on Disposal of Assets (1,000) (1,000)
(1,958) (1,994) (1,000) (1,000)
Expenditure
Employee Costs 641,058 669,500 611,874 713,500 713,500
Office Expenses 23,536 20,000 24,128 21,500 21,500
IT & Other Equipment 15,684 14,000 11,044 13,500 13,500
Fleet & Plant Running Costs 27,165 24,300 21,133 23,500 23,500
Operational Expenses 38,596 50,800 45,085 48,500 48,500
Other Expenses 8,820 9,500 9,435 9,500 9,500
Infrastructure 4,280 5,100 522 5,000 5,000
Programs 13,168 12,000 11,088 14,000 14,000
Loss on Disposal of Assets 13,563 1,300 8,743 18,100 18,100
Sub-total 785,869 806,500 743,051 867,100 867,100
Depreciation 18,842 18,100 16,241 16,500 16,500
Cost Allocation (ABC) 275,590 322,700 298,156 323,200 323,200
Works & Engineering Overheads Expenditure 1,080,302 1,147,300 1,057,447 1,206,800 1,206,800
Less Overhead Recovered (907,320) (1,002,800) (877,635) (1,068,300) (1,068,300)
Works & Engineering Overheads (Net) 382,642 374,000 384,461 374,000 374,000
________________________________________________________________________________________________
Page 3.76

Town of Cambridge Operating Budget - Schedule
Actual Budget Est. Actual C'Fwd Res/ELA Budget Consolidated
2011/2012 2012/2013 30 Jun 2013 2013/2014 2013/2014 2013/2014 2013/2014
$ $ $ $ $ $ $
PARKS & LANDSCAPE OVERHEADS
On Costs
Expenditure
Employee Costs 392,777 378,800 418,234 409,800 409,800
392,777 378,800 418,234 409,800 409,800
Cost Allocation (ABC) 88,340 101,700 94,503 100,600 100,600
Parks & Landscape On Costs Expenditure 481,117 480,500 512,736 510,400 510,400
________________________________________________________________________________________________
Page 3.77

Town of Cambridge Operating Budget - Schedule
Actual Budget Est. Actual C'Fwd Res/ELA Budget Consolidated
2011/2012 2012/2013 30 Jun 2013 2013/2014 2013/2014 2013/2014 2013/2014
$ $ $ $ $ $ $
PARKS & LANDSCAPE OVERHEADS
Overheads
Revenues
Reimbursements (3,020) (3,000) (1,239) (3,000) (3,000)
Parks & Landscape Overheads Revenue (3,020) (3,000) (1,239) (3,000) (3,000)
Expenditure
Employee Costs 587,131 618,700 592,519 655,400 655,400
Office Expenses 13,524 13,500 19,910 15,000 15,000
IT & Other Equipment 11,385 5,000 5,462 5,500 5,500
Fleet & Plant Running Costs 11,624 13,200 13,405 11,500 11,500
Operational Expenses 60,889 71,100 71,177 71,300 71,300
Other Expenses 3,903 5,500 2,144 5,500 5,500
Infrastructure 7,553 8,900 915 9,000 9,000
Programs 2,106 3,500 2,268 3,500 3,500
Loss on Disposal of Assets 3,100 20,200 20,200
Sub-total 701,214 739,400 707,801 796,900 796,900
Depreciation 6,687 6,100 7,905 7,100 7,100
Cost Allocation (ABC) 343,852 400,100 370,772 398,300 398,300
Parks & Landscape Overheads Expenditure 1,051,754 1,145,600 1,086,477 1,202,300 1,202,300
Less Overhead Recovered (1,102,326) (1,121,300) (1,166,854) (1,210,800) (1,210,800)
Parks & Landscape Overheads (Net) 427,525 501,800 431,121 498,900 498,900
________________________________________________________________________________________________
Page 3.78
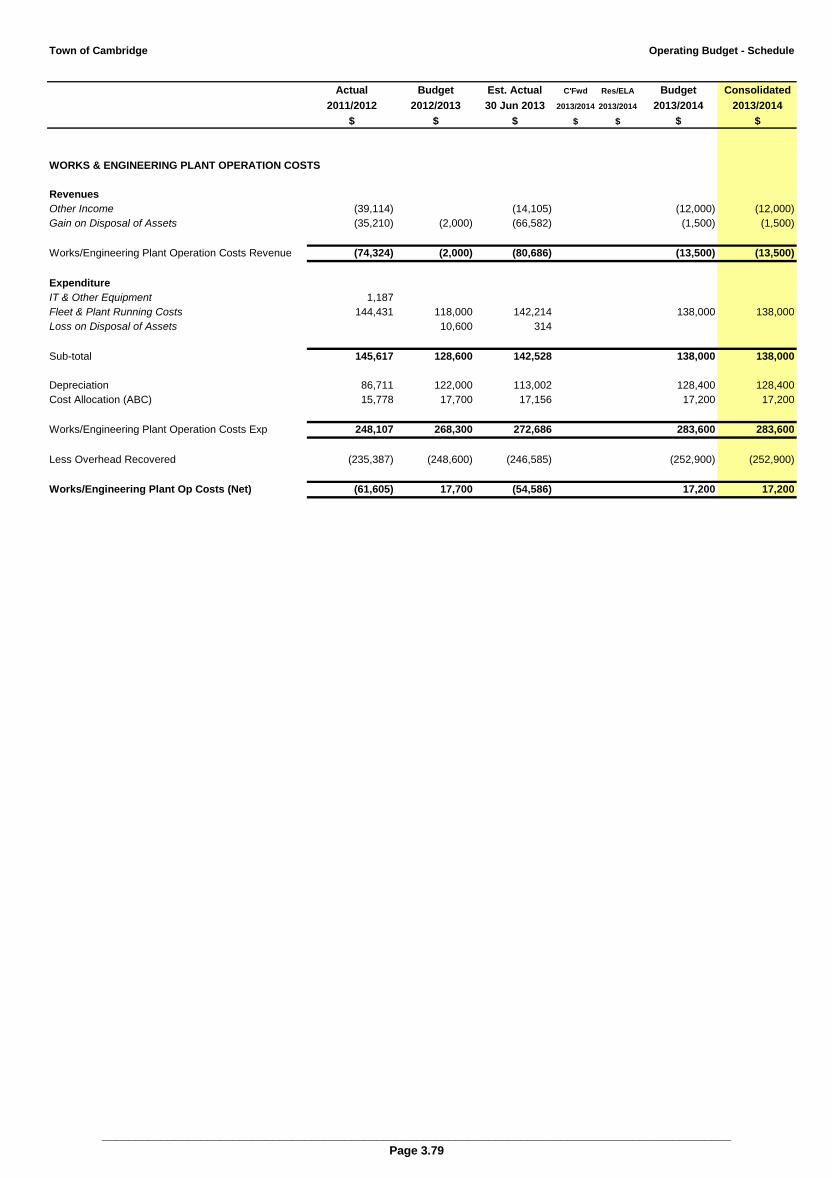
Town of Cambridge Operating Budget - Schedule
Actual Budget Est. Actual C'Fwd Res/ELA Budget Consolidated
2011/2012 2012/2013 30 Jun 2013 2013/2014 2013/2014 2013/2014 2013/2014
$ $ $ $ $ $ $
WORKS & ENGINEERING PLANT OPERATION COSTS
Revenues
Other Income (39,114) (14,105) (12,000) (12,000)
Gain on Disposal of Assets (35,210) (2,000) (66,582) (1,500) (1,500)
Works/Engineering Plant Operation Costs Revenue (74,324) (2,000) (80,686) (13,500) (13,500)
Expenditure
IT & Other Equipment 1,187
Fleet & Plant Running Costs 144,431 118,000 142,214 138,000 138,000
Loss on Disposal of Assets 10,600 314
Sub-total 145,617 128,600 142,528 138,000 138,000
Depreciation 86,711 122,000 113,002 128,400 128,400
Cost Allocation (ABC) 15,778 17,700 17,156 17,200 17,200
Works/Engineering Plant Operation Costs Exp 248,107 268,300 272,686 283,600 283,600
Less Overhead Recovered (235,387) (248,600) (246,585) (252,900) (252,900)
Works/Engineering Plant Op Costs (Net) (61,605) 17,700 (54,586) 17,200 17,200
________________________________________________________________________________________________
Page 3.79

Town of Cambridge Operating Budget - Schedule
Actual Budget Est. Actual C'Fwd Res/ELA Budget Consolidated
2011/2012 2012/2013 30 Jun 2013 2013/2014 2013/2014 2013/2014 2013/2014
$ $ $ $ $ $ $
PARKS & LANDSCAPE PLANT OPERATION COSTS
Revenues
Gain on Disposal of Assets (38,929) (8,400) (7,931) (4,700) (4,700)
Parks & Landscape Plant Op Costs Revenue (38,929) (8,400) (7,931) (4,700) (4,700)
Expenditure
IT & Other Equipment 705 4,140
Fleet & Plant Running Costs 153,816 100,900 136,263 115,000 115,000
Loss on Disposal of Assets 12,488 8,300 24,879 36,100 36,100
Sub-total 167,009 109,200 165,282 151,100 151,100
Depreciation 52,799 64,900 58,690 72,800 72,800
Cost Allocation (ABC) 25,456 28,500 27,519 27,800 27,800
Parks/Landscape Plant Operation Costs Exp 245,263 202,600 251,492 251,700 251,700
Less Overhead Recovered (239,079) (165,700) (186,228) (219,200) (219,200)
Parks/Landscape Plant Op Costs (Net) (32,745) 28,500 57,334 27,800 27,800
________________________________________________________________________________________________
Page 3.80
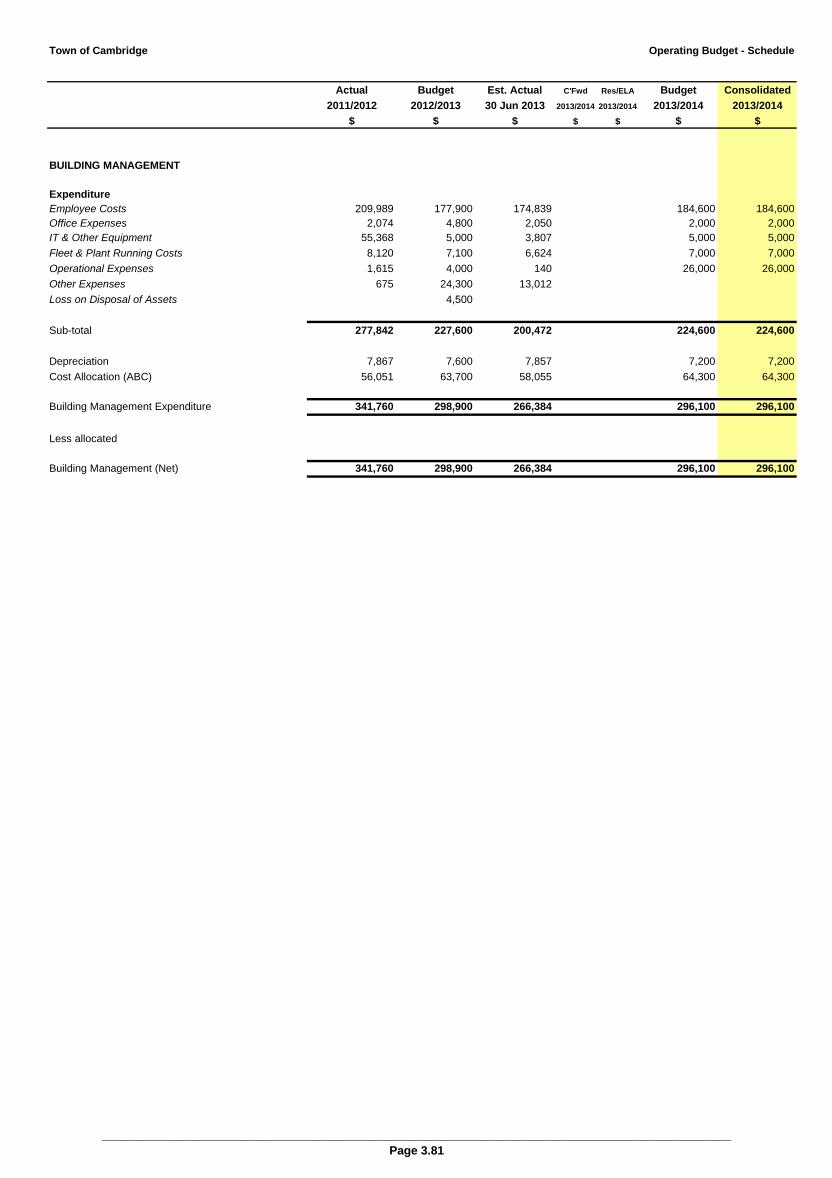
Town of Cambridge Operating Budget - Schedule
Actual Budget Est. Actual C'Fwd Res/ELA Budget Consolidated
2011/2012 2012/2013 30 Jun 2013 2013/2014 2013/2014 2013/2014 2013/2014
$ $ $ $ $ $ $
BUILDING MANAGEMENT
Expenditure
Employee Costs 209,989 177,900 174,839 184,600 184,600
Office Expenses 2,074 4,800 2,050 2,000 2,000
IT & Other Equipment 55,368 5,000 3,807 5,000 5,000
Fleet & Plant Running Costs 8,120 7,100 6,624 7,000 7,000
Operational Expenses 1,615 4,000 140 26,000 26,000
Other Expenses 675 24,300 13,012
Loss on Disposal of Assets 4,500
Sub-total 277,842 227,600 200,472 224,600 224,600
Depreciation 7,867 7,600 7,857 7,200 7,200
Cost Allocation (ABC) 56,051 63,700 58,055 64,300 64,300
Building Management Expenditure 341,760 298,900 266,384 296,100 296,100
Less allocated
Building Management (Net) 341,760 298,900 266,384 296,100 296,100
________________________________________________________________________________________________
Page 3.81

Town of Cambridge Operating Budget - Schedule
Actual Budget Est. Actual C'Fwd Res/ELA Budget Consolidated
2011/2012 2012/2013 30 Jun 2013 2013/2014 2013/2014 2013/2014 2013/2014
$ $ $ $ $ $ $
ASSET MANAGEMENT
Revenues
Reimbursements (30,000) (16,000) (16,000)
Asset Management Revenue (30,000) (16,000) (16,000)
Expenditure
Employee Costs 162,100 144,542 202,400 202,400
Office Expenses 1,204 500 500
IT & Other Equipment 61,500 85,252 95,200 95,200
Operational Expenses 30,000 321 14,100 40,000 54,100
Sub-total 253,600 231,319 14,100 338,100 352,200
Depreciation
Cost Allocation (ABC) 2,500 2,523 2,400 2,400
Asset Management Expenditure 256,100 233,842 14,100 340,500 354,600
Less allocated (162,100) (202,400) (202,400)
Asset Management (Net) 64,000 233,842 14,100 122,100 136,200
________________________________________________________________________________________________
Page 3.82

Town of Cambridge Operating Budget - Schedule
Actual Budget Est. Actual C'Fwd Res/ELA Budget Consolidated
2011/2012 2012/2013 30 Jun 2013 2013/2014 2013/2014 2013/2014 2013/2014
$ $ $ $ $ $ $
OTHER PROPERTY
Revenues
Reimbursements
Other Income (14,000) (10,000) (495) (8,500) (8,500)
Capital Contributions (4,765,053)
Lease Income (21,706) (50,200) (25,380) (48,000) (48,000)
Infrastructure (34,247) (19,000) (9,928) (20,000) (20,000)
Programs (75,777) (64,500) (73,262) (55,000) (55,000)
Gain on Disposal of Assets (1,609,053) (14,891,200) (7,135,723) (24,430,000) (24,430,000)
Other Property Revenue (6,519,836) (15,034,900) (7,244,788) (24,561,500) (24,561,500)
Expenditure
Employee Costs 288,572 271,500 287,162 286,400 286,400
Office Expenses 2,804 2,000 2,792 1,500 1,500
Other Expenses 29,106 33,000 30,852 32,000 32,000
Fleet & Plant Running Costs 2,560 3,200 3,053 3,000 3,000
Operational Expenses 116,697 129,000 173,772 133,000 133,000
Infrastructure 54,598 46,600 60,196 47,500 47,500
Non-Capital Works 60,000 43,522 17,000 17,000
Programs 211,484 27,000 34,223 116,000 116,000
Sub-total 705,820 572,300 635,573 636,400 636,400
Depreciation 26,123 37,600 23,263 23,200 23,200
Cost Allocation (ABC) 51,632 49,100 44,277 49,800 49,800
Other Property Expenditure 783,576 659,000 703,112 709,400 709,400
Less allocated
Other Property (Net) (5,736,261) (14,375,900) (6,541,676) (23,852,100) (23,852,100)
________________________________________________________________________________________________
Page 3.83

CAPITAL BUDGET

Town of Cambridge Capital Budget Summary
Page Funding Budget Funding Budget
No. 2011/2012 2011/2012 2013/2014 2013/2014
Total
$ $
CAPITAL FUNDING
Sale of Plant and Equipment 4.1 294,300 301,900
Grants 590,200 3,133,500
Contibutions 1,115,000
Loan proceeds 1,450,300 300,000
Transfers from reserves 2,159,200 2,741,300
Transfers from the ELA 10,882,400 29,858,600
Carried forward funds 2,727,300 5,451,500
Total Funding Excluding Rates 18,103,700 0 42,901,800
CAPITAL EXPENDITURE
By Class
Land 4.2 (565,300) 565,300 0 0
Buildings 4.2 (11,809,000) 12,275,000 (33,914,700) 34,507,700
Furniture and Equipment 4.3 (550,500) 808,200 (322,000) 1,590,000
Plant and Equipment 4.4 (1,043,500) 1,104,500 (904,100) 970,600
Infrastructure
Parks and Reserves 4.5 (1,302,000) 1,944,000 (2,500,500) 3,078,500
Roads and Lanes 4.6 (2,468,900) 4,025,000 (3,524,700) 5,345,000
Drainage 4.7 (78,700) 319,700 (617,400) 1,199,400
Footpaths 4.7 (285,800) 1,487,200 (1,092,500) 2,025,800
Bus Shelters 4.8 27,000 (25,900) 50,900
Total Expenditure - by Class (18,103,700) 22,555,900 (42,901,800) 48,767,900
By Program
Governance (1,116,800) 1,513,300 (1,210,800) 2,631,300
Law, Order and Public Safety (16,500) 21,500 0 0
Health 0 0
Education and Welfare 8,000 (26,500) 26,500
Community Amenities (360,000) 360,000 (200,000) 528,000
Recreation and Culture (13,110,500) 14,119,700 (36,106,200) 37,163,200
Transport (2,833,400) 5,858,900 (5,236,500) 8,297,100
Other Property and Services (666,500) 674,500 (121,800) 121,800
Total Expenditure - by Program (18,103,700) 22,555,900 (42,901,800) 48,767,900
Asset Management Summary
Total Replacement 8,496,600
Total Upgrade 4,021,500
Total new 36,249,800
Total Expenditure 48,767,900
_______________________________________________________________________________________________
Page 4.1

CAPITAL BUDGET
SCHEDULE
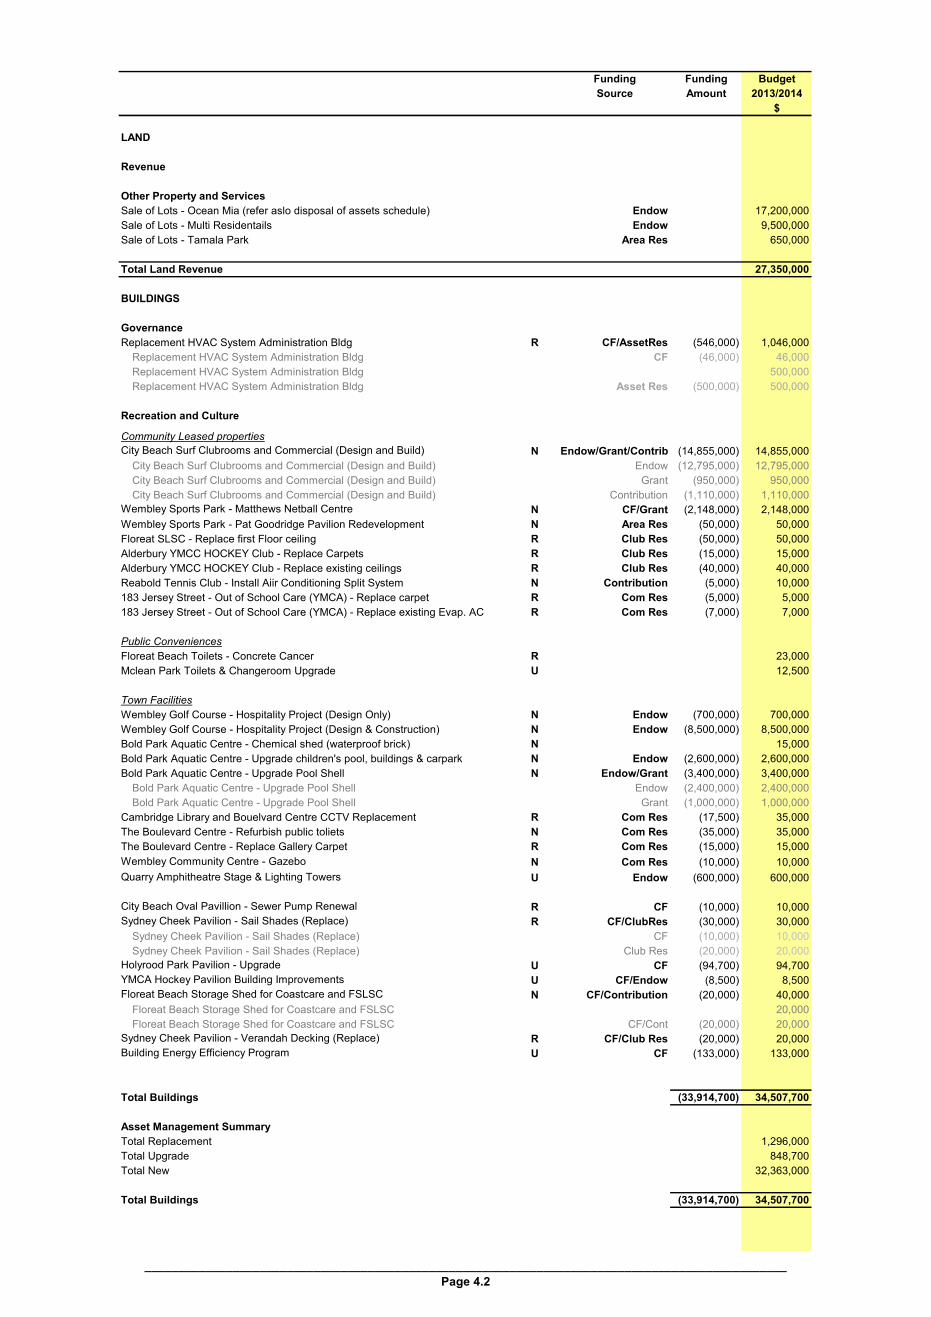
Town of Cambridge
Funding Funding Budget
Source Amount 2013/2014
$
LAND
Revenue
Other Property and Services
Sale of Lots - Ocean Mia (refer aslo disposal of assets schedule) Endow 17,200,000
Sale of Lots - Multi Residentails Endow 9,500,000
Sale of Lots - Tamala Park Area Res 650,000
Total Land Revenue 0 27,350,000
BUILDINGS
Governance
Replacement HVAC System Administration Bldg R CF/AssetRes (546,000) 1,046,000
Replacement HVAC System Administration Bldg CF (46,000) 46,000
Replacement HVAC System Administration Bldg 500,000
Replacement HVAC System Administration Bldg Asset Res (500,000) 500,000
Recreation and Culture
Community Leased properties
City Beach Surf Clubrooms and Commercial (Design and Build) N Endow/Grant/Contribution(14,855,000) 14,855,000
City Beach Surf Clubrooms and Commercial (Design and Build) Endow (12,795,000) 12,795,000
City Beach Surf Clubrooms and Commercial (Design and Build) Grant (950,000) 950,000
City Beach Surf Clubrooms and Commercial (Design and Build) Contribution (1,110,000) 1,110,000
Wembley Sports Park - Matthews Netball Centre N CF/Grant (2,148,000) 2,148,000
Wembley Sports Park - Pat Goodridge Pavilion Redevelopment N Area Res (50,000) 50,000
Floreat SLSC - Replace first Floor ceiling R Club Res (50,000) 50,000
Alderbury YMCC HOCKEY Club - Replace Carpets R Club Res (15,000) 15,000
Alderbury YMCC HOCKEY Club - Replace existing ceilings R Club Res (40,000) 40,000
Reabold Tennis Club - Install Aiir Conditioning Split System N Contribution (5,000) 10,000
183 Jersey Street - Out of School Care (YMCA) - Replace carpet R Com Res (5,000) 5,000
183 Jersey Street - Out of School Care (YMCA) - Replace existing Evap. AC R Com Res (7,000) 7,000
Public Conveniences
Floreat Beach Toilets - Concrete Cancer R 23,000
Mclean Park Toilets & Changeroom Upgrade U 12,500
Town Facilities
Wembley Golf Course - Hospitality Project (Design Only) N Endow (700,000) 700,000
Wembley Golf Course - Hospitality Project (Design & Construction) N Endow (8,500,000) 8,500,000
Bold Park Aquatic Centre - Chemical shed (waterproof brick) N 15,000
Bold Park Aquatic Centre - Upgrade children's pool, buildings & carpark N Endow (2,600,000) 2,600,000
Bold Park Aquatic Centre - Upgrade Pool Shell N Endow/Grant (3,400,000) 3,400,000
Bold Park Aquatic Centre - Upgrade Pool Shell Endow (2,400,000) 2,400,000
Bold Park Aquatic Centre - Upgrade Pool Shell Grant (1,000,000) 1,000,000
Cambridge Library and Bouelvard Centre CCTV Replacement R Com Res (17,500) 35,000
The Boulevard Centre - Refurbish public toliets N Com Res (35,000) 35,000
The Boulevard Centre - Replace Gallery Carpet R Com Res (15,000) 15,000
Wembley Community Centre - Gazebo N Com Res (10,000) 10,000
Quarry Amphitheatre Stage & Lighting Towers U Endow (600,000) 600,000
City Beach Oval Pavillion - Sewer Pump Renewal R CF (10,000) 10,000
Sydney Cheek Pavilion - Sail Shades (Replace) R CF/ClubRes (30,000) 30,000
Sydney Cheek Pavilion - Sail Shades (Replace) CF (10,000) 10,000
Sydney Cheek Pavilion - Sail Shades (Replace) Club Res (20,000) 20,000
Holyrood Park Pavilion - Upgrade U CF (94,700) 94,700
YMCA Hockey Pavilion Building Improvements U CF/Endow (8,500) 8,500
Floreat Beach Storage Shed for Coastcare and FSLSC N CF/Contribution (20,000) 40,000
Floreat Beach Storage Shed for Coastcare and FSLSC 20,000
Floreat Beach Storage Shed for Coastcare and FSLSC CF/Cont (20,000) 20,000
Sydney Cheek Pavilion - Verandah Decking (Replace) R CF/Club Res (20,000) 20,000
Building Energy Efficiency Program U CF (133,000) 133,000
Total Buildings (33,914,700) 34,507,700
Asset Management Summary
Total Replacement 1,296,000
Total Upgrade 848,700
Total New 32,363,000
Total Buildings (33,914,700) 34,507,700
_______________________________________________________________________________________________
Page 4.2
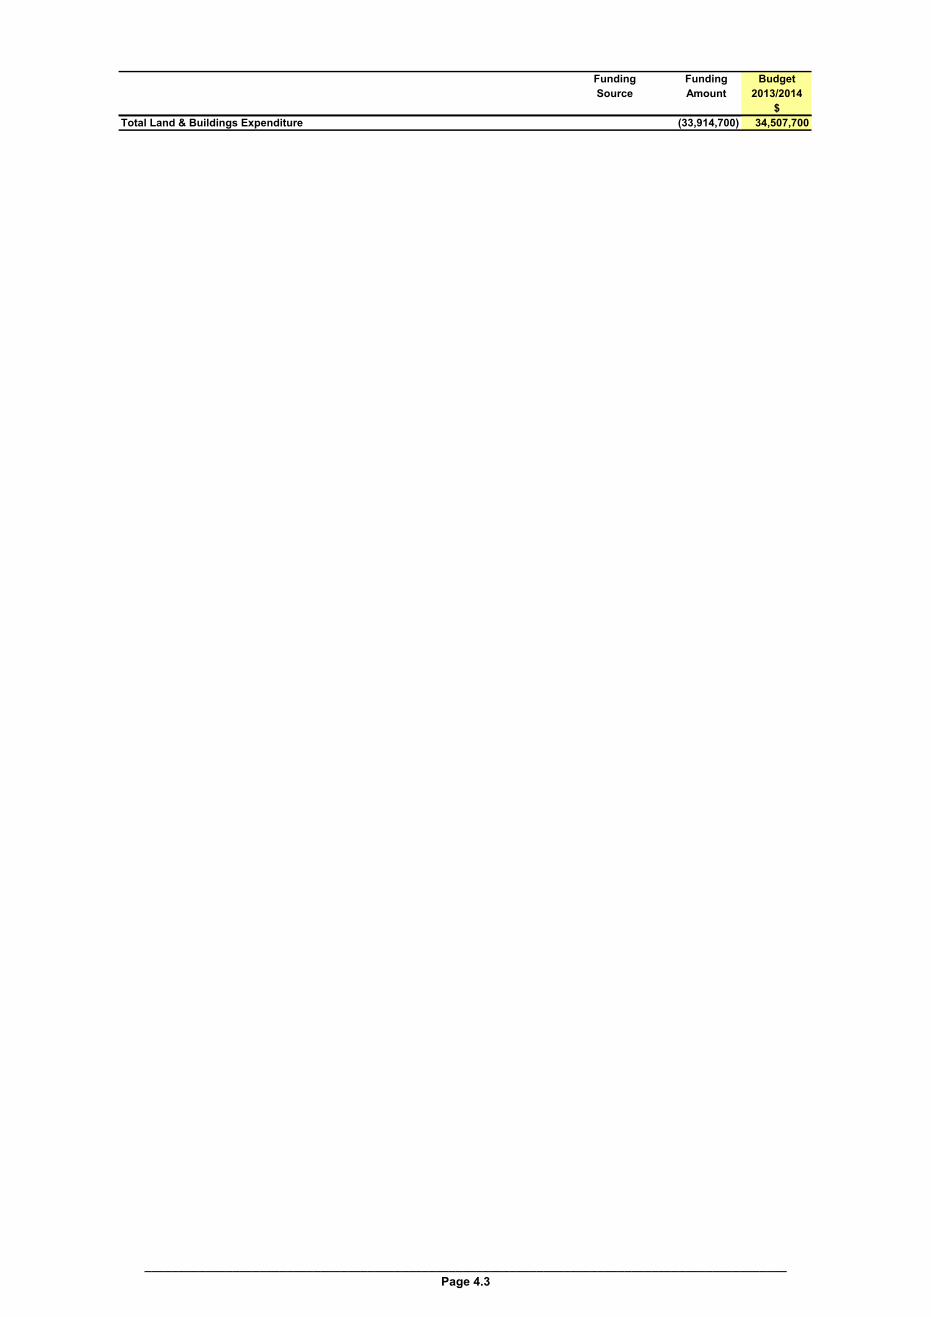
Town of Cambridge
Funding Funding Budget
Source Amount 2013/2014
$
Total Land & Buildings Expenditure (33,914,700) 34,507,700
_______________________________________________________________________________________________
Page 4.3

Town of Cambridge Capital Budget - Schedule
Funding Funding Budget Replace New
Source Amount 2013/2014
$
FURNITURE AND EQUIPMENT
Governance
All-in-One Desktop Computers (Training) 20,000 20,000
Intranet redevelopment 60,000 60,000
Town website upgrade 81,000 81,000
Electronic Content Management System upgrade 10,000 10,000
New and Replacement Servers for business system upgrade 40,000 40,000
Corporate Business System Upgrade 435,500 435,500
PC Replacement x12 15,000 15,000
Replacement Colour copier - Governanace 7,000 7,000
Replacement rack and fixtures 5,000 5,000
Storage Network upgrade 150,000 150,000
Upgrade to SQL Server 2008 R2 40,000 40,000
Windows 7 Upgrade Licences 17,000 17,000
Windows Desktop Deployment Toolkit 10,000 10,000
Meeting Room 1/ Reception Area tables 30,000 30,000
Land line phone system replacement CF/Asset Res (120,000) 120,000 120,000
(120,000) 1,040,500 1,040,500 0
Community Amenities
Purchase and Supply Waste Bins Waste Res (200,000) 216,000 216,000
Purchase and Supply Recycle Bins 226,000 226,000
Purchase and Supply Green Waste Bins 86,000 86,000
(200,000) 528,000 528,000 0
Recreation and Culture
Wembley Community Centre - Trestle tables and trolleys 8,000 8,000
The Boulevard Centre - Purchase of a flat screen TV Com Res (2,000) 2,000 2,000
Bold Park Aquatic Centre - Office chairs 2,000 2,000
Bold Park Aquatic Centre - Patio furniture replacement 6,000 6,000
Youth Centre - Television - Smart/Internet capable 1,500 1,500
Youth Centre - Chairs (6) and Table suited to meetings/craft 2,000 2,000
(2,000) 21,500 21,500 0
Total Furniture and Equipment (322,000) 1,590,000 1,590,000 0
Asset Management Summary
Total Replacement 1,590,000
Total Upgrade
Total new 0
Total Furniture and Equipment (322,000) 1,590,000 1,590,000 0
_______________________________________________________________________________________________
Page 4.3
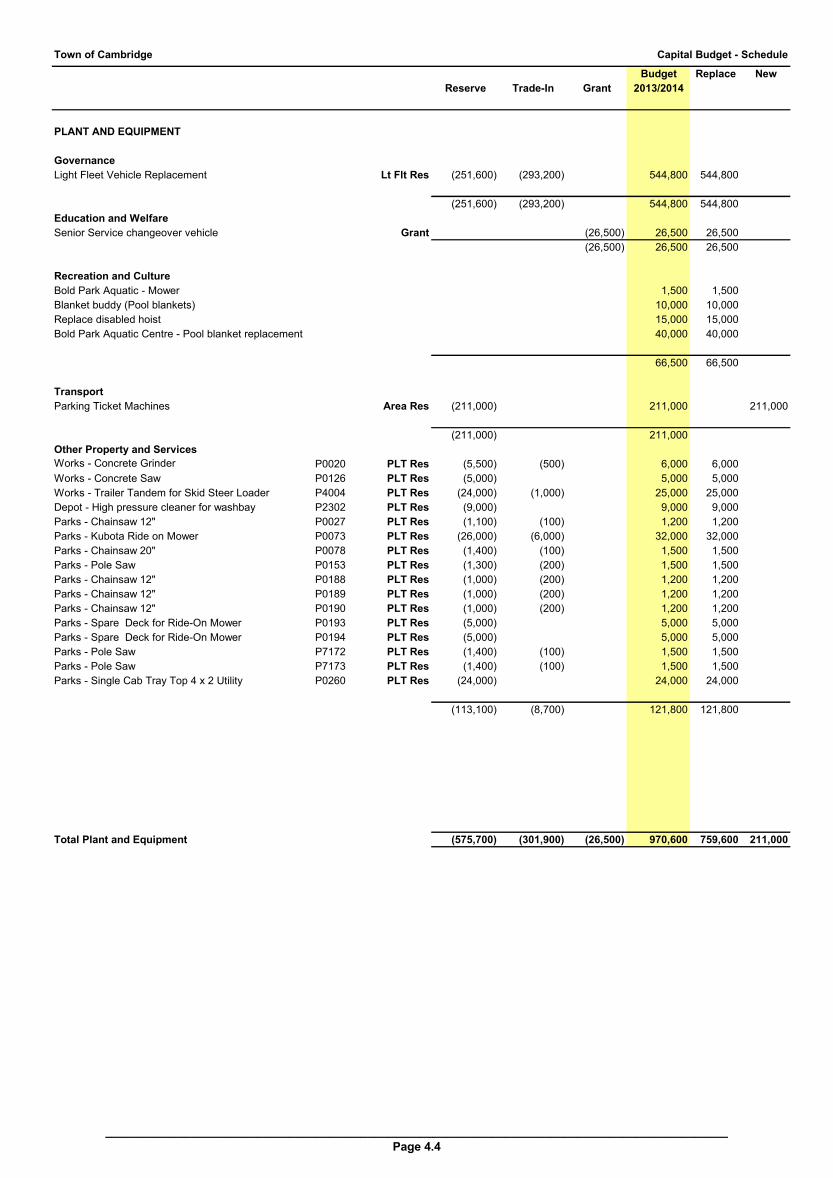
Town of Cambridge Capital Budget - Schedule
Budget Replace New
Reserve Trade-In Grant 2013/2014
PLANT AND EQUIPMENT
Governance
Light Fleet Vehicle Replacement Lt Flt Res (251,600) (293,200) 0 544,800 544,800
0
(251,600) (293,200) 0 544,800 544,800 0
Education and Welfare
Senior Service changeover vehicle Grant (26,500) 26,500 26,500
0 0 (26,500) 26,500 26,500 0
Recreation and Culture
Bold Park Aquatic - Mower 0 1,500 1,500
Blanket buddy (Pool blankets) 0 10,000 10,000
Replace disabled hoist 15,000 15,000
Bold Park Aquatic Centre - Pool blanket replacement 0 40,000 40,000
0 0
0 0 0 66,500 66,500 0
Transport
Parking Ticket Machines Area Res (211,000) 211,000 211,000
(211,000) 211,000
Other Property and Services
Works - Concrete Grinder P0020 PLT Res (5,500) (500) 0 6,000 6,000
Works - Concrete Saw P0126 PLT Res (5,000) 0 0 5,000 5,000
Works - Trailer Tandem for Skid Steer Loader P4004 PLT Res (24,000) (1,000) 0 25,000 25,000
Depot - High pressure cleaner for washbay P2302 PLT Res (9,000) 0 9,000 9,000
Parks - Chainsaw 12" P0027 PLT Res (1,100) (100) 0 1,200 1,200
Parks - Kubota Ride on Mower P0073 PLT Res (26,000) (6,000) 0 32,000 32,000
Parks - Chainsaw 20" P0078 PLT Res (1,400) (100) 0 1,500 1,500
Parks - Pole Saw P0153 PLT Res (1,300) (200) 0 1,500 1,500
Parks - Chainsaw 12" P0188 PLT Res (1,000) (200) 0 1,200 1,200
Parks - Chainsaw 12" P0189 PLT Res (1,000) (200) 0 1,200 1,200
Parks - Chainsaw 12" P0190 PLT Res (1,000) (200) 0 1,200 1,200
Parks - Spare Deck for Ride-On Mower P0193 PLT Res (5,000) 0 0 5,000 5,000
Parks - Spare Deck for Ride-On Mower P0194 PLT Res (5,000) 0 0 5,000 5,000
Parks - Pole Saw P7172 PLT Res (1,400) (100) 0 1,500 1,500
Parks - Pole Saw P7173 PLT Res (1,400) (100) 0 1,500 1,500
Parks - Single Cab Tray Top 4 x 2 Utility P0260 PLT Res (24,000) 0 0 24,000 24,000
0
(113,100) (8,700) 0 121,800 121,800 0
Total Plant and Equipment (575,700) (301,900) (26,500) 970,600 759,600 211,000
_______________________________________________________________________________________________
Page 4.4

Town of Cambridge Capital Budget - Schedule
Replace Funding Funding Budget Replace Upgrade New
Upgrade Source Amount 2013/2014
New $
INFRASTRUCTURE - PARKS AND RESERVES
Parks Construction
Beecroft Park - Replace AFL goals & install hockey/soccer Goals R 8,000 8,000
Beecroft Park – Replace Barbecue R 13,000 13,000
Birkdale Park - Install drainage next to tennis courts N 12,000 12,000
Challenger Park - Ecozone Trial U CF/Endow (20,000) 20,000 20,000
Challenger Park - landscaping adj. to north playground N 15,000 15,000
Civic/Administration Park - Replace Weather Station (irrigation
systems) R 19,000 19,000
Contingency Emergency Irrigation Repairs R 10,000 10,000
Gifford Gardens - Replace Bore and Pump No 197 R 65,000 65,000
Lake Monger Reserve - Rehabilitate Lake Edge U CF (100,000) 150,000 150,000
Lake Monger Reserve – Security Light Upgrade Program U CF (133,200) 278,200 278,200
Lake Monger Reserve - Upgrade Shared Path on East Side U Area Res (100,000) 200,000 200,000
Lake Monger Reserve - Car Park/toilet Design N CF (20,000) 20,000 20,000
Lake Monger Reserve - Recreation Activities infrastructure N CF (80,000) 80,000 80,000
Ocean Village Park East - Service Bore & Pump No: 149 U 16,000 16,000
Ocean Village Park west - Service Bore & Pump No: 156 U 16,000 16,000
Perry Lakes Reserve - Replace retractable bollards U 20,000 20,000
Rose Gardens - Service Bore & Pump No: 39 U 16,000 16,000
Perry Lakes Reserve - Rehabilitate Lake Bed U CF/Endow (227,000) 227,000 227,000
(680,200) 1,185,200 115,000 943,200 127,000
Sportsground Construction
City Beach Oval - Service Bore & Pump No: 36 U 16,000 16,000
Grantham Park - Service Bore & Pump No: 151 U 16,000 16,000
Wembley Sports Park - Infrastructure Works N Loan (300,000) 300,000 300,000
Alderbury Sportsground - Upgrade Irrigation System U CF (116,000) 116,000 116,000
(416,000) 448,000 0 148,000 300,000
Ocean Beaches Construction
Beaches & Dunes - Replace Beach Usage Signs U CF (10,000) 10,000 10,000
Beaches and Dunes - Upgrade Beach Access Paths U 15,000 15,000
City Beach Groyne Structural Assessment U Dep Trans (10,000) 20,000 20,000
City Beach Park - Service Bore & Pump No: 24 U 16,000 16,000
City Beach Park - Upgrade Beach Paths U CF (15,600) 15,600 15,600
Floreat Beach Park - Upgrade Barbecues U CF/Endow (68,700) 68,700 68,700
(104,300) 145,300 0 145,300 0
Golf Course Construction
Wembley Golf Course - Miniature Golf (Design & Construction) N Endow (1,300,000) 1,300,000 1,300,000
(1,300,000) 1,300,000 0 0 1,300,000
Total Infrastructure - Parks and Reserves (2,500,500) 3,078,500 115,000 1,236,500 1,727,000
Asset Management Summary
Total Replacement 115,000
Total Upgrade 1,236,500
Total new 1,727,000
Total Infrastructure - Parks and Reserves (2,500,500) 3,078,500 115,000 1,236,500 1,727,000
_______________________________________________________________________________________________
Page 4.5
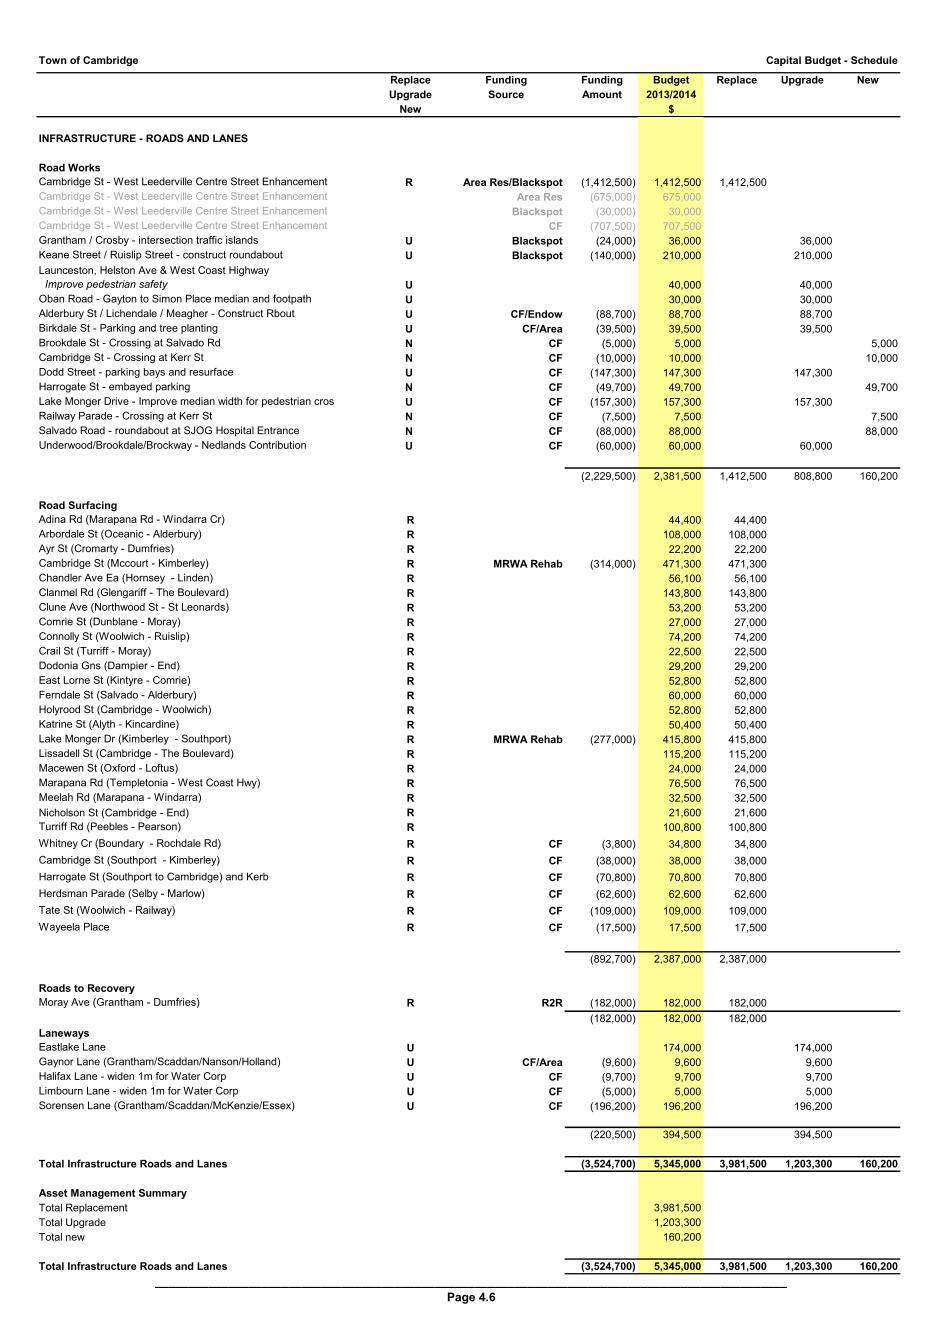
Town of Cambridge Capital Budget - Schedule
Replace Funding Funding Budget Replace Upgrade New
Upgrade Source Amount 2013/2014
New $
INFRASTRUCTURE - ROADS AND LANES
Road Works
Cambridge St - West Leederville Centre Street Enhancement R Area Res/Blackspot (1,412,500) 1,412,500 1,412,500
Cambridge St - West Leederville Centre Street Enhancement Area Res (675,000) 675,000
Cambridge St - West Leederville Centre Street Enhancement Blackspot (30,000) 30,000
Cambridge St - West Leederville Centre Street Enhancement CF (707,500) 707,500
Grantham / Crosby - intersection traffic islands U Blackspot (24,000) 36,000 36,000
Keane Street / Ruislip Street - construct roundabout U Blackspot (140,000) 210,000 210,000
Launceston, Helston Ave & West Coast Highway
Improve pedestrian safety U 40,000 40,000
Oban Road - Gayton to Simon Place median and footpath U 30,000 30,000
Alderbury St / Lichendale / Meagher - Construct Rbout U CF/Endow (88,700) 88,700 88,700
Birkdale St - Parking and tree planting U CF/Area (39,500) 39,500 39,500
Brookdale St - Crossing at Salvado Rd N CF (5,000) 5,000 5,000
Cambridge St - Crossing at Kerr St N CF (10,000) 10,000 10,000
Dodd Street - parking bays and resurface U CF (147,300) 147,300 147,300
Harrogate St - embayed parking N CF (49,700) 49,700 49,700
Lake Monger Drive - Improve median width for pedestrian cros U CF (157,300) 157,300 157,300
Railway Parade - Crossing at Kerr St N CF (7,500) 7,500 7,500
Salvado Road - roundabout at SJOG Hospital Entrance N CF (88,000) 88,000 88,000
Underwood/Brookdale/Brockway - Nedlands Contribution U CF (60,000) 60,000 60,000
(2,229,500) 2,381,500 1,412,500 808,800 160,200
Road Surfacing
Adina Rd (Marapana Rd - Windarra Cr) R 44,400 44,400
Arbordale St (Oceanic - Alderbury) R 108,000 108,000
Ayr St (Cromarty - Dumfries) R 22,200 22,200
Cambridge St (Mccourt - Kimberley) R MRWA Rehab (314,000) 471,300 471,300
Chandler Ave Ea (Hornsey - Linden) R 56,100 56,100
Clanmel Rd (Glengariff - The Boulevard) R 143,800 143,800
Clune Ave (Northwood St - St Leonards) R 53,200 53,200
Comrie St (Dunblane - Moray) R 27,000 27,000
Connolly St (Woolwich - Ruislip) R 74,200 74,200
Crail St (Turriff - Moray) R 22,500 22,500
Dodonia Gns (Dampier - End) R 29,200 29,200
East Lorne St (Kintyre - Comrie) R 52,800 52,800
Ferndale St (Salvado - Alderbury) R 60,000 60,000
Holyrood St (Cambridge - Woolwich) R 52,800 52,800
Katrine St (Alyth - Kincardine) R 50,400 50,400
Lake Monger Dr (Kimberley - Southport) R MRWA Rehab (277,000) 415,800 415,800
Lissadell St (Cambridge - The Boulevard) R 115,200 115,200
Macewen St (Oxford - Loftus) R 24,000 24,000
Marapana Rd (Templetonia - West Coast Hwy) R 76,500 76,500
Meelah Rd (Marapana - Windarra) R 32,500 32,500
Nicholson St (Cambridge - End) R 21,600 21,600
Turriff Rd (Peebles - Pearson) R 100,800 100,800
Whitney Cr (Boundary - Rochdale Rd) R CF (3,800) 34,800 34,800
Cambridge St (Southport - Kimberley) R CF (38,000) 38,000 38,000
Harrogate St (Southport to Cambridge) and Kerb R CF (70,800) 70,800 70,800
Herdsman Parade (Selby - Marlow) R CF (62,600) 62,600 62,600
Tate St (Woolwich - Railway) R CF (109,000) 109,000 109,000
Wayeela Place R CF (17,500) 17,500 17,500
(892,700) 2,387,000 2,387,000 0 0
Roads to Recovery
Moray Ave (Grantham - Dumfries) R R2R (182,000) 182,000 182,000
(182,000) 182,000 182,000 0 0
Laneways
Eastlake Lane U 174,000 174,000
Gaynor Lane (Grantham/Scaddan/Nanson/Holland) U CF/Area (9,600) 9,600 9,600
Halifax Lane - widen 1m for Water Corp U CF (9,700) 9,700 9,700
Limbourn Lane - widen 1m for Water Corp U CF (5,000) 5,000 5,000
Sorensen Lane (Grantham/Scaddan/McKenzie/Essex) U CF (196,200) 196,200 196,200
(220,500) 394,500 0 394,500 0
Total Infrastructure Roads and Lanes (3,524,700) 5,345,000 3,981,500 1,203,300 160,200
Asset Management Summary
Total Replacement 3,981,500
Total Upgrade 1,203,300
Total new 160,200
Total Infrastructure Roads and Lanes (3,524,700) 5,345,000 3,981,500 1,203,300 160,200
_______________________________________________________________________________________________
Page 4.6
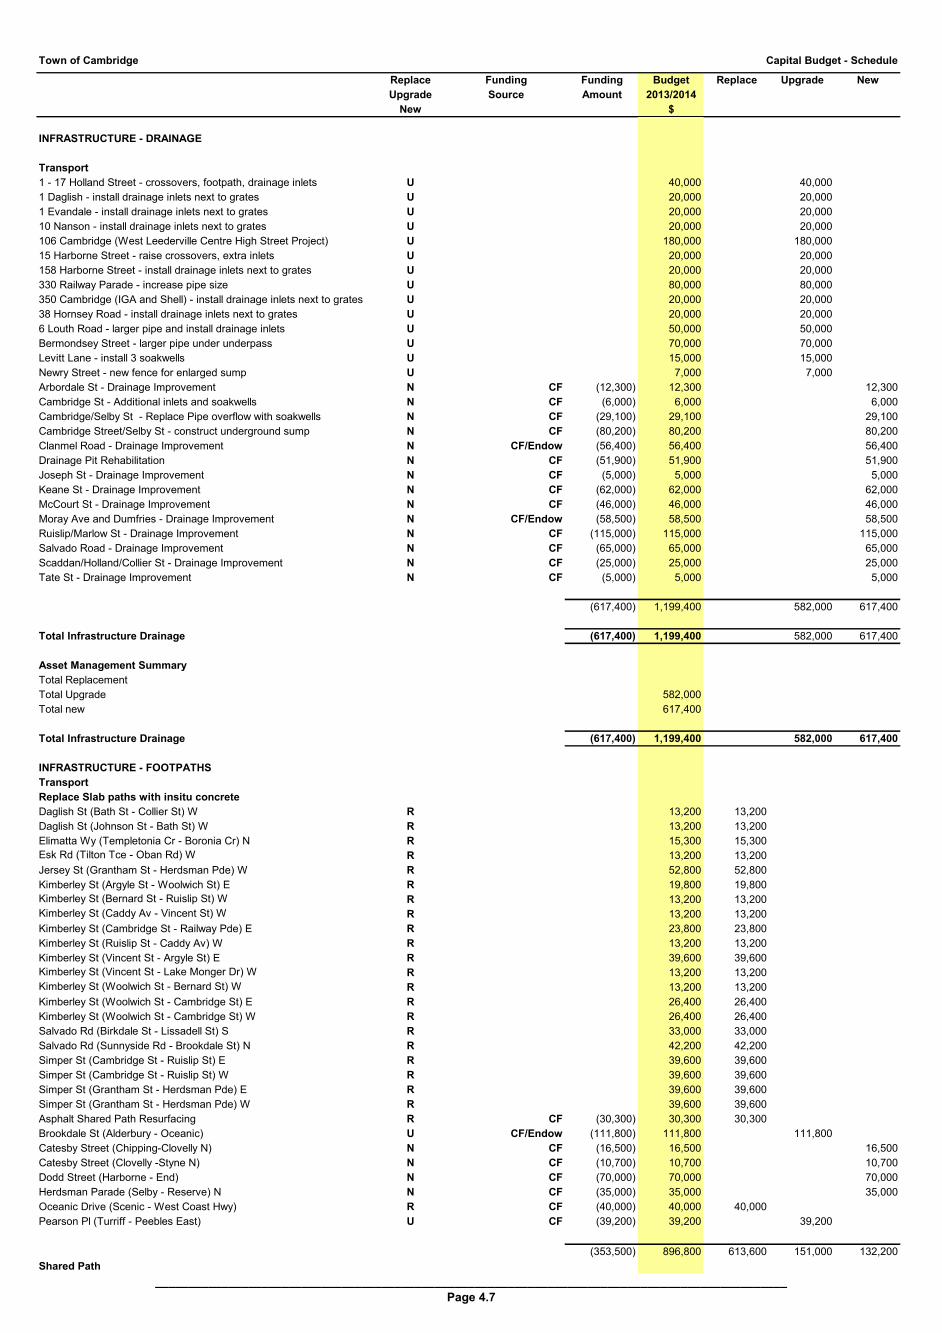
Town of Cambridge Capital Budget - Schedule
Replace Funding Funding Budget Replace Upgrade New
Upgrade Source Amount 2013/2014
New $
INFRASTRUCTURE - DRAINAGE
Transport
1 - 17 Holland Street - crossovers, footpath, drainage inlets U 40,000 40,000
1 Daglish - install drainage inlets next to grates U 20,000 20,000
1 Evandale - install drainage inlets next to grates U 20,000 20,000
10 Nanson - install drainage inlets next to grates U 20,000 20,000
106 Cambridge (West Leederville Centre High Street Project) U 180,000 180,000
15 Harborne Street - raise crossovers, extra inlets U 20,000 20,000
158 Harborne Street - install drainage inlets next to grates U 20,000 20,000
330 Railway Parade - increase pipe size U 80,000 80,000
350 Cambridge (IGA and Shell) - install drainage inlets next to grates U 20,000 20,000
38 Hornsey Road - install drainage inlets next to grates U 20,000 20,000
6 Louth Road - larger pipe and install drainage inlets U 50,000 50,000
Bermondsey Street - larger pipe under underpass U 70,000 70,000
Levitt Lane - install 3 soakwells U 15,000 15,000
Newry Street - new fence for enlarged sump U 7,000 7,000
Arbordale St - Drainage Improvement N CF (12,300) 12,300 12,300
Cambridge St - Additional inlets and soakwells N CF (6,000) 6,000 6,000
Cambridge/Selby St - Replace Pipe overflow with soakwells N CF (29,100) 29,100 29,100
Cambridge Street/Selby St - construct underground sump N CF (80,200) 80,200 80,200
Clanmel Road - Drainage Improvement N CF/Endow (56,400) 56,400 56,400
Drainage Pit Rehabilitation N CF (51,900) 51,900 51,900
Joseph St - Drainage Improvement N CF (5,000) 5,000 5,000
Keane St - Drainage Improvement N CF (62,000) 62,000 62,000
McCourt St - Drainage Improvement N CF (46,000) 46,000 46,000
Moray Ave and Dumfries - Drainage Improvement N CF/Endow (58,500) 58,500 58,500
Ruislip/Marlow St - Drainage Improvement N CF (115,000) 115,000 115,000
Salvado Road - Drainage Improvement N CF (65,000) 65,000 65,000
Scaddan/Holland/Collier St - Drainage Improvement N CF (25,000) 25,000 25,000
Tate St - Drainage Improvement N CF (5,000) 5,000 5,000
(617,400) 1,199,400 0 582,000 617,400
Total Infrastructure Drainage (617,400) 1,199,400 0 582,000 617,400
Asset Management Summary
Total Replacement 0
Total Upgrade 582,000
Total new 617,400
Total Infrastructure Drainage (617,400) 1,199,400 0 582,000 617,400
INFRASTRUCTURE - FOOTPATHS
Transport
Replace Slab paths with insitu concrete
Daglish St (Bath St - Collier St) W R 13,200 13,200
Daglish St (Johnson St - Bath St) W R 13,200 13,200
Elimatta Wy (Templetonia Cr - Boronia Cr) N R 15,300 15,300
Esk Rd (Tilton Tce - Oban Rd) W R 13,200 13,200
Jersey St (Grantham St - Herdsman Pde) W R 52,800 52,800
Kimberley St (Argyle St - Woolwich St) E R 19,800 19,800
Kimberley St (Bernard St - Ruislip St) W R 13,200 13,200
Kimberley St (Caddy Av - Vincent St) W R 13,200 13,200
Kimberley St (Cambridge St - Railway Pde) E R 23,800 23,800
Kimberley St (Ruislip St - Caddy Av) W R 13,200 13,200
Kimberley St (Vincent St - Argyle St) E R 39,600 39,600
Kimberley St (Vincent St - Lake Monger Dr) W R 13,200 13,200
Kimberley St (Woolwich St - Bernard St) W R 13,200 13,200
Kimberley St (Woolwich St - Cambridge St) E R 26,400 26,400
Kimberley St (Woolwich St - Cambridge St) W R 26,400 26,400
Salvado Rd (Birkdale St - Lissadell St) S R 33,000 33,000
Salvado Rd (Sunnyside Rd - Brookdale St) N R 42,200 42,200
Simper St (Cambridge St - Ruislip St) E R 39,600 39,600
Simper St (Cambridge St - Ruislip St) W R 39,600 39,600
Simper St (Grantham St - Herdsman Pde) E R 39,600 39,600
Simper St (Grantham St - Herdsman Pde) W R 39,600 39,600
Asphalt Shared Path Resurfacing R CF (30,300) 30,300 30,300
Brookdale St (Alderbury - Oceanic) U CF/Endow (111,800) 111,800 111,800
Catesby Street (Chipping-Clovelly N) N CF (16,500) 16,500 16,500
Catesby Street (Clovelly -Styne N) N CF (10,700) 10,700 10,700
Dodd Street (Harborne - End) N CF (70,000) 70,000 70,000
Herdsman Parade (Selby - Reserve) N N CF (35,000) 35,000 35,000
Oceanic Drive (Scenic - West Coast Hwy) R CF (40,000) 40,000 40,000
Pearson Pl (Turriff - Peebles East) U CF (39,200) 39,200 39,200
(353,500) 896,800 613,600 151,000 132,200
Shared Path
_______________________________________________________________________________________________
Page 4.7

Town of Cambridge Capital Budget - Schedule
Replace Funding Funding Budget Replace Upgrade New
Upgrade Source Amount 2013/2014
New $
Resurface shared path - Rochadale - (West Coast to Stevenson) R 90,000 90,000
Kalinda Dr (Kalari to The Boulevard) N Endow/Grant (360,000) 360,000
Kalinda Dr (Kalari to The Boulevard) N Grant (180,000) 180,000 180,000
Kalinda Dr (Kalari to The Boulevard) N Endow (180,000) 180,000 180,000
Wembley Golf Course Trail N Area Res (235,000) 535,000 535,000
Tilton Tce (Baramba - Olinda) S N Endow (144,000) 144,000 144,000
(739,000) 1,129,000 90,000 0 1,039,000
Total Infrastructure Footpaths (1,092,500) 2,025,800 703,600 151,000 1,171,200
Asset Management Summary
Total Replacement 703,600
Total Upgrade 151,000
Total new 1,171,200
Total Infrastructure Footpaths (1,092,500) 2,025,800 703,600 151,000 1,171,200
_______________________________________________________________________________________________
Page 4.8
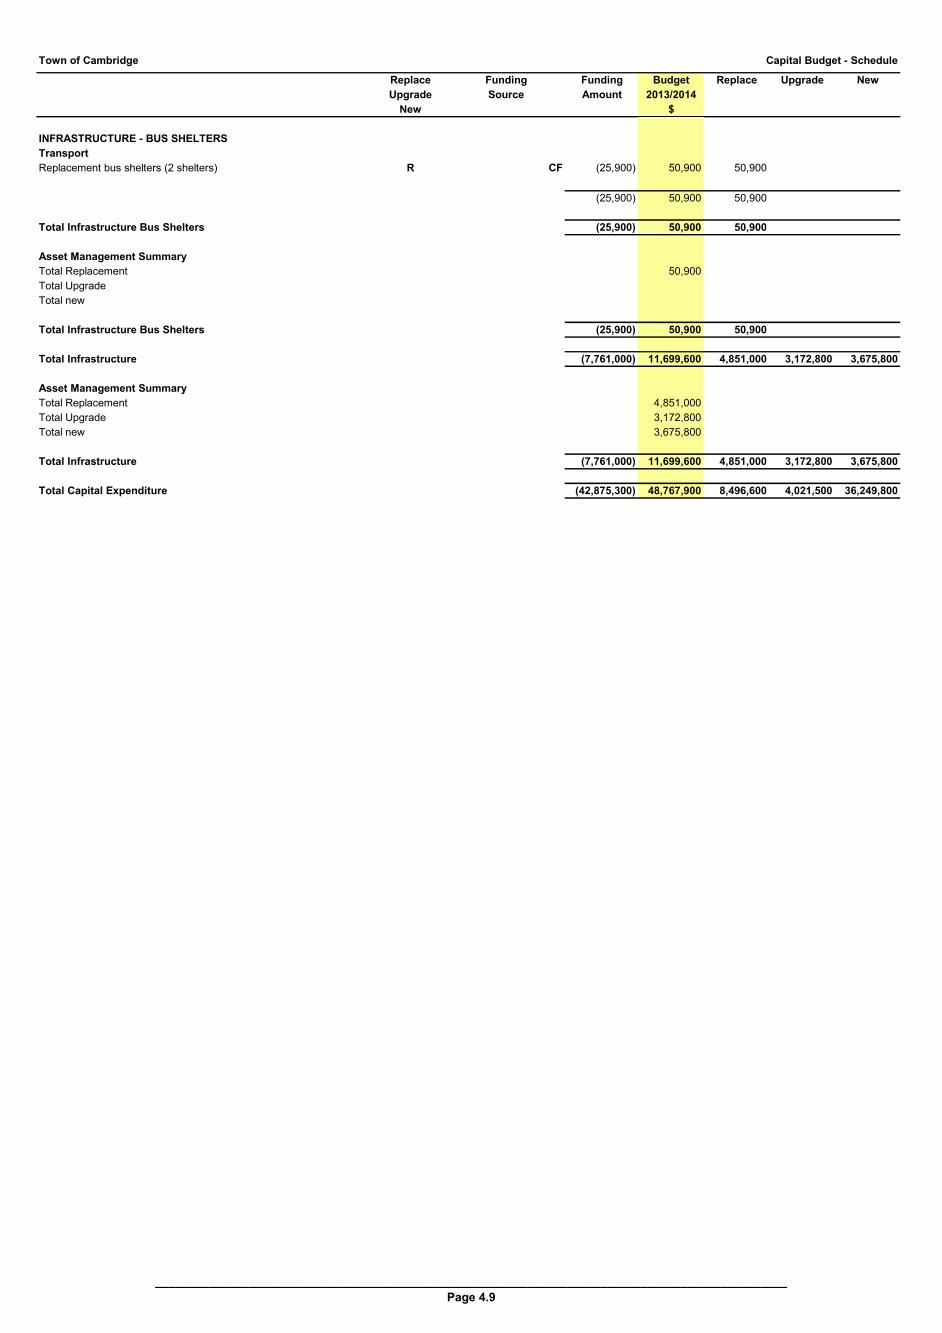
Town of Cambridge Capital Budget - Schedule
Replace Funding Funding Budget Replace Upgrade New
Upgrade Source Amount 2013/2014
New $
INFRASTRUCTURE - BUS SHELTERS
Transport
Replacement bus shelters (2 shelters) R CF (25,900) 50,900 50,900
(25,900) 50,900 50,900 0 0
Total Infrastructure Bus Shelters (25,900) 50,900 50,900
Asset Management Summary
Total Replacement 50,900
Total Upgrade 0
Total new 0
Total Infrastructure Bus Shelters (25,900) 50,900 50,900 0 0
Total Infrastructure (7,761,000) 11,699,600 4,851,000 3,172,800 3,675,800
Asset Management Summary
Total Replacement 4,851,000
Total Upgrade 3,172,800
Total new 3,675,800
Total Infrastructure (7,761,000) 11,699,600 4,851,000 3,172,800 3,675,800
Total Capital Expenditure (42,875,300) 48,767,900 8,496,600 4,021,500 36,249,800
_______________________________________________________________________________________________
Page 4.9
RESERVE/ENDOWMENT
LANDS ACCOUNT BUDGET
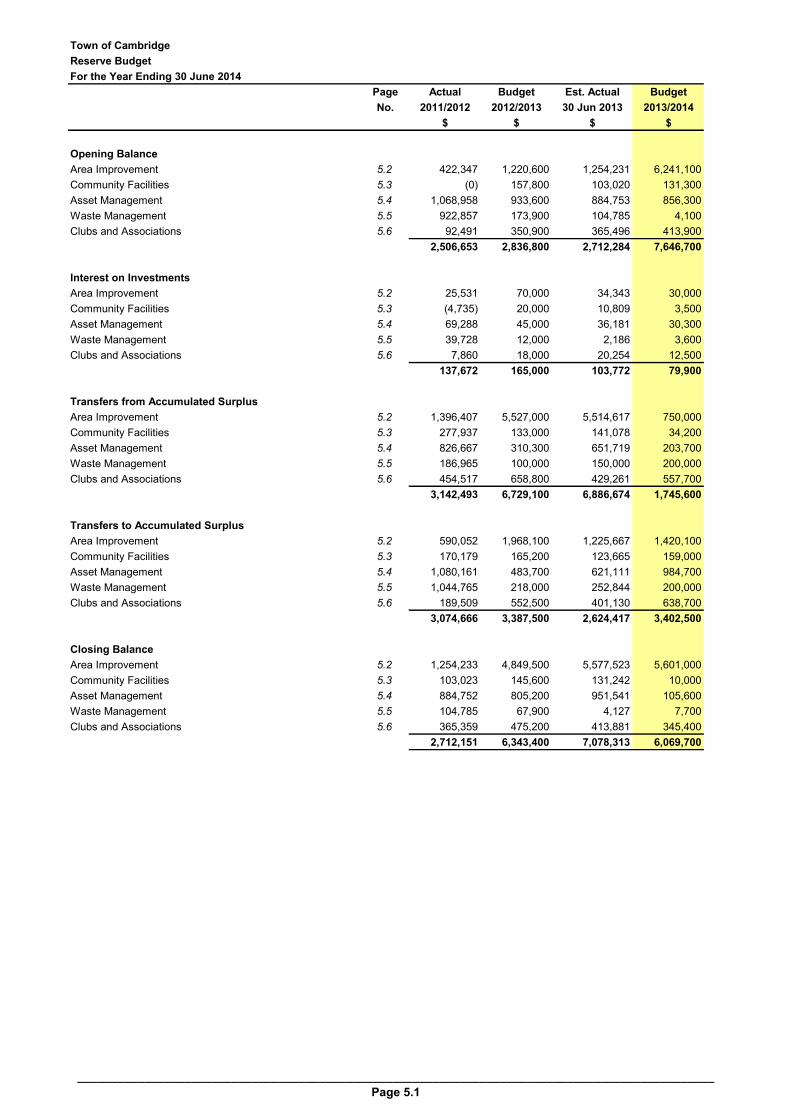
Town of Cambridge
Reserve Budget
For the Year Ending 30 June 2014
Page Actual Budget Est. Actual Budget
No. 2011/2012 2012/2013 30 Jun 2013 2013/2014
$ $ $ $
Opening Balance
Area Improvement 5.2 422,347 1,220,600 1,254,231 6,241,100
Community Facilities 5.3 (0) 157,800 103,020 131,300
Asset Management 5.4 1,068,958 933,600 884,753 856,300
Waste Management 5.5 922,857 173,900 104,785 4,100
Clubs and Associations 5.6 92,491 350,900 365,496 413,900
2,506,653 2,836,800 2,712,284 7,646,700
Interest on Investments
Area Improvement 5.2 25,531 70,000 34,343 30,000
Community Facilities 5.3 (4,735) 20,000 10,809 3,500
Asset Management 5.4 69,288 45,000 36,181 30,300
Waste Management 5.5 39,728 12,000 2,186 3,600
Clubs and Associations 5.6 7,860 18,000 20,254 12,500
137,672 165,000 103,772 79,900
Transfers from Accumulated Surplus
Area Improvement 5.2 1,396,407 5,527,000 5,514,617 750,000
Community Facilities 5.3 277,937 133,000 141,078 34,200
Asset Management 5.4 826,667 310,300 651,719 203,700
Waste Management 5.5 186,965 100,000 150,000 200,000
Clubs and Associations 5.6 454,517 658,800 429,261 557,700
3,142,493 6,729,100 6,886,674 1,745,600
Transfers to Accumulated Surplus
Area Improvement 5.2 590,052 1,968,100 1,225,667 1,420,100
Community Facilities 5.3 170,179 165,200 123,665 159,000
Asset Management 5.4 1,080,161 483,700 621,111 984,700
Waste Management 5.5 1,044,765 218,000 252,844 200,000
Clubs and Associations 5.6 189,509 552,500 401,130 638,700
3,074,666 3,387,500 2,624,417 3,402,500
Closing Balance
Area Improvement 5.2 1,254,233 4,849,500 5,577,523 5,601,000
Community Facilities 5.3 103,023 145,600 131,242 10,000
Asset Management 5.4 884,752 805,200 951,541 105,600
Waste Management 5.5 104,785 67,900 4,127 7,700
Clubs and Associations 5.6 365,359 475,200 413,881 345,400
2,712,151 6,343,400 7,078,313 6,069,700
_______________________________________________________________________________________________
Page 5.1

Town of Cambridge Reserve Budget - Schedule
Actual Budget Est. Actual Budget
2011/2012 2012/2013 30 Jun 2013 2013/2014
$ $ $ $
AREA IMPROVEMENT
Opening Balance
Developer Contributions 212,500 374,400 374,363 132,800
Wembley/West Leederville Area (278,198) 326,700 360,365 5,566,900
Aged Care Services and Facilities 488,045 519,500 519,503 541,400
422,347 1,220,600 1,254,231 6,241,100
Interest on Investment
Developer Contributions
Wembley/West Leederville Area (5,927) 45,000 12,449 12,200
Aged Care Services and Facilities 31,458 25,000 21,894 17,800
25,531 70,000 34,343 30,000
Transfers from Accumulated Surplus 0 0
Developer Contributions 162,500 0
Parking Ticket Machine Revenue 100,000
Wembley/West Leederville Area 1,233,907 5,527,000 6,178,209 650,000
1,396,407 5,527,000 5,514,617 750,000
Transfers to Accumulated Surplus
Wembley/West Leederville Area 589,417 984,132
- Wembley Sports Park - Pat Goodridge Pavilion Redevelopment 50,000
- Wembley Sports Park Infrastructure Works 664,000
- Cambridge St - West Leederville Centre Street Enhancement CF 675,000 675,000
- Wembley Golf Course Trail 235,000
- Lake Monger Reserve - Upgrade Shared Path on East Side 100,000
- Leederville Link Project 100,000
- Parking Ticket Machines 211,000
- Gaynor Lane (Grantham/Scaddan/Nanson/Holland) CF 197,000 9,600
- Demolition of 39 Southport Street 20,000
- Pat Goodridge Pavilion 30,000
- Cowden Park Shelter 30,000
- Civic/Administration Park - Replace Weather Station (irrigation systems) 50,000
- Cambridge St (Northwood - Kimberley) Street Enhancement 21,100
354,219 1,687,100 984,132 1,380,600
Developer cash in lieu 635 241,535
- Birkdale St (Cambridge - Newry) Parking improvements CF 0 281,000 39,500
635 281,000 241,535 39,500
Total Transfer to Accumulated Surplus 590,052 1,968,100 1,225,667 1,420,100
Closing Balance
Developer Contributions 374,363 93,400 132,828 93,300
Wembley/West Leederville Area 360,365 4,211,600 5,566,891 4,948,500
Aged Care Services and Facilities 519,503 544,500 541,397 559,200
1,254,231 4,849,500 6,241,115 5,601,000
________________________________________________________________________________________________
Page 5.2
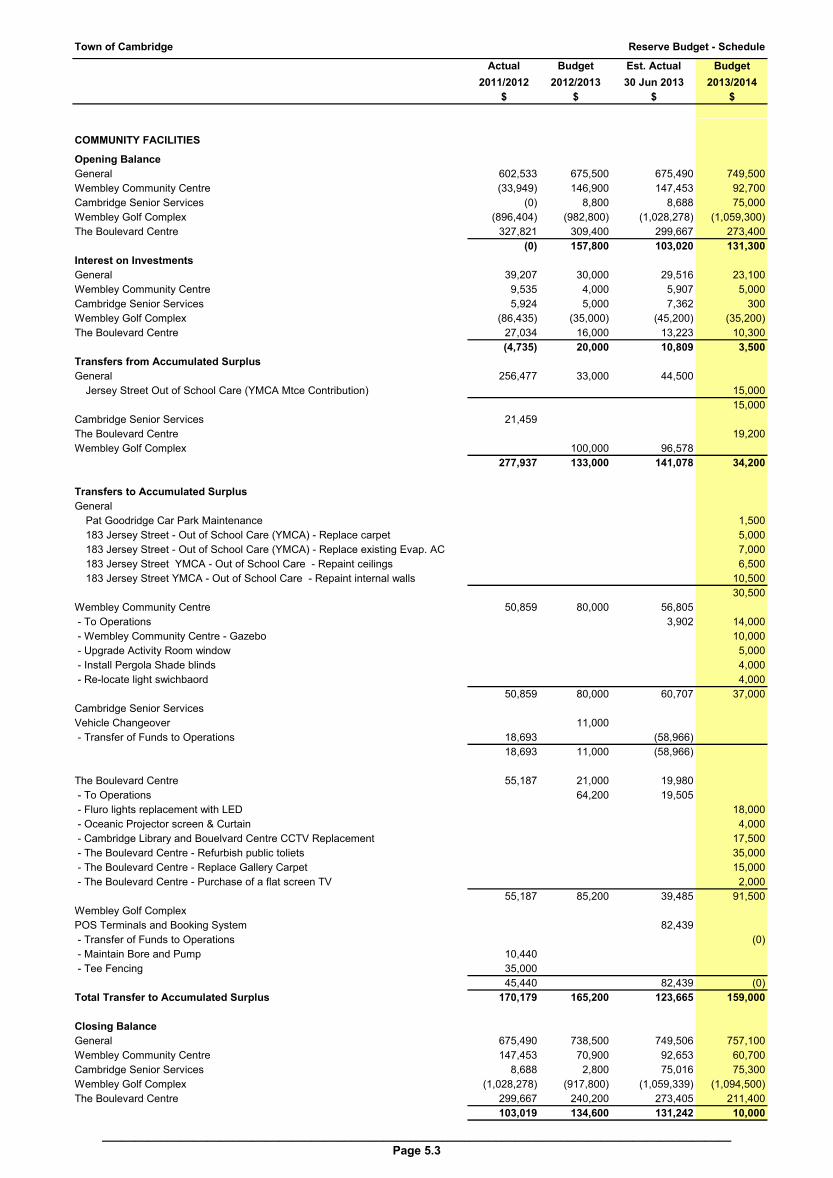
Town of Cambridge Reserve Budget - Schedule
Actual Budget Est. Actual Budget
2011/2012 2012/2013 30 Jun 2013 2013/2014
$ $ $ $
COMMUNITY FACILITIES
Opening Balance
General 602,533 675,500 675,490 749,500
Wembley Community Centre (33,949) 146,900 147,453 92,700
Cambridge Senior Services (0) 8,800 8,688 75,000
Wembley Golf Complex (896,404) (982,800) (1,028,278) (1,059,300)
The Boulevard Centre 327,821 309,400 299,667 273,400
(0) 157,800 103,020 131,300
Interest on Investments
General 39,207 30,000 29,516 23,100
Wembley Community Centre 9,535 4,000 5,907 5,000
Cambridge Senior Services 5,924 5,000 7,362 300
Wembley Golf Complex (86,435) (35,000) (45,200) (35,200)
The Boulevard Centre 27,034 16,000 13,223 10,300
(4,735) 20,000 10,809 3,500
Transfers from Accumulated Surplus
General 256,477 33,000 44,500
Jersey Street Out of School Care (YMCA Mtce Contribution) 15,000
15,000
Cambridge Senior Services 21,459
The Boulevard Centre 0 0 0 19,200
Wembley Golf Complex 0 100,000 96,578
277,937 133,000 141,078 34,200
Transfers to Accumulated Surplus
General
Pat Goodridge Car Park Maintenance 1,500
183 Jersey Street - Out of School Care (YMCA) - Replace carpet 5,000
183 Jersey Street - Out of School Care (YMCA) - Replace existing Evap. AC 7,000
183 Jersey Street YMCA - Out of School Care - Repaint ceilings 6,500
183 Jersey Street YMCA - Out of School Care - Repaint internal walls 10,500
30,500
Wembley Community Centre 50,859 80,000 56,805
- To Operations 3,902 14,000
- Wembley Community Centre - Gazebo 10,000
- Upgrade Activity Room window 5,000
- Install Pergola Shade blinds 4,000
- Re-locate light swichbaord 4,000
50,859 80,000 60,707 37,000
Cambridge Senior Services 0
Vehicle Changeover 11,000
- Transfer of Funds to Operations 18,693 (58,966) 0
18,693 11,000 (58,966) 0
The Boulevard Centre 55,187 21,000 19,980
- To Operations 64,200 19,505 0
- Fluro lights replacement with LED 18,000
- Oceanic Projector screen & Curtain 4,000
- Cambridge Library and Bouelvard Centre CCTV Replacement 17,500
- The Boulevard Centre - Refurbish public toliets 35,000
- The Boulevard Centre - Replace Gallery Carpet 15,000
- The Boulevard Centre - Purchase of a flat screen TV 2,000
55,187 85,200 39,485 91,500
Wembley Golf Complex
POS Terminals and Booking System 82,439
- Transfer of Funds to Operations (0)
- Maintain Bore and Pump 10,440
- Tee Fencing 35,000
45,440 0 82,439 (0)
Total Transfer to Accumulated Surplus 170,179 165,200 123,665 159,000
Closing Balance
General 675,490 738,500 749,506 757,100
Wembley Community Centre 147,453 70,900 92,653 60,700
Cambridge Senior Services 8,688 2,800 75,016 75,300
Wembley Golf Complex (1,028,278) (917,800) (1,059,339) (1,094,500)
The Boulevard Centre 299,667 240,200 273,405 211,400
103,019 134,600 131,242 10,000
________________________________________________________________________________________________
Page 5.3

Town of Cambridge Reserve Budget - Schedule
Actual Budget Est. Actual Budget
2011/2012 2012/2013 30 Jun 2013 2013/2014
$ $ $ $
ASSET MANAGEMENT
Opening Balance
Buildings 299,892 437,800 437,843 558,500
Plant 199,590 86,600 67,567 44,400
Light Fleet 449,786 280,300 280,266 241,500
Equipment 119,690 128,900 99,077 11,900
Infrastructure 0 0 (0) 0
1,068,958 933,600 884,753 856,300
Interest on Investment
Buildings 23,951 20,000 20,682 15,000
Plant 3,972 9,000 (393) 2,300
Light Fleet 32,171 13,000 7,815 9,600
Equipment 9,194 3,000 8,076 3,400
Infrastructure
69,288 45,000 36,181 30,300
Transfers from Accumulated Surplus
Buildings 114,000 114,000 114,000 15,000
Plant 449,746 16,300 79,743 8,700
Light Fleet 200,000 180,000 180,000
Proceeds from Sale of plants 65,728 457,976
Equipment (Surplus) (2,807)
Infrastructure 0 0
826,667 310,300 651,719 203,700
Transfers to Accumulated Surplus
Buildings 0 14,000
- Replacement HVAC System Administration Bldg 500,000
- Airconditioning Review 60,000
0 60,000 14,000 500,000
Plant 585,742 102,540
- Parks Plant 87,200 69,600
- Works Plant 5,000 43,500
585,742 92,200 102,540 113,100
Light Fleet 467,419 504,571
- Light Fleet Vehicle Replacement 200,500 251,600
- Single cab tray top 4*2 utility 0 0
467,419 200,500 504,571 251,600
Equipment 0 0
Admin - PABX Telephone System (Replace) CF 120,000 120,000
Transfer funds to Waste Management Reserve 27,000
27,000 120,000 0 120,000
Total Transfer to Accumulated Surplus 1,080,161 483,700 621,111 984,700
Closing Balance
Buildings 437,843 511,800 558,525 88,500
Plant 67,567 19,700 44,377 (57,700)
Light Fleet 280,266 272,800 241,485 179,500
Equipment 99,077 11,900 107,153 (104,700)
Infrastructure (0) 0 (0) 0
884,753 816,200 951,541 105,600
________________________________________________________________________________________________
Page 5.4
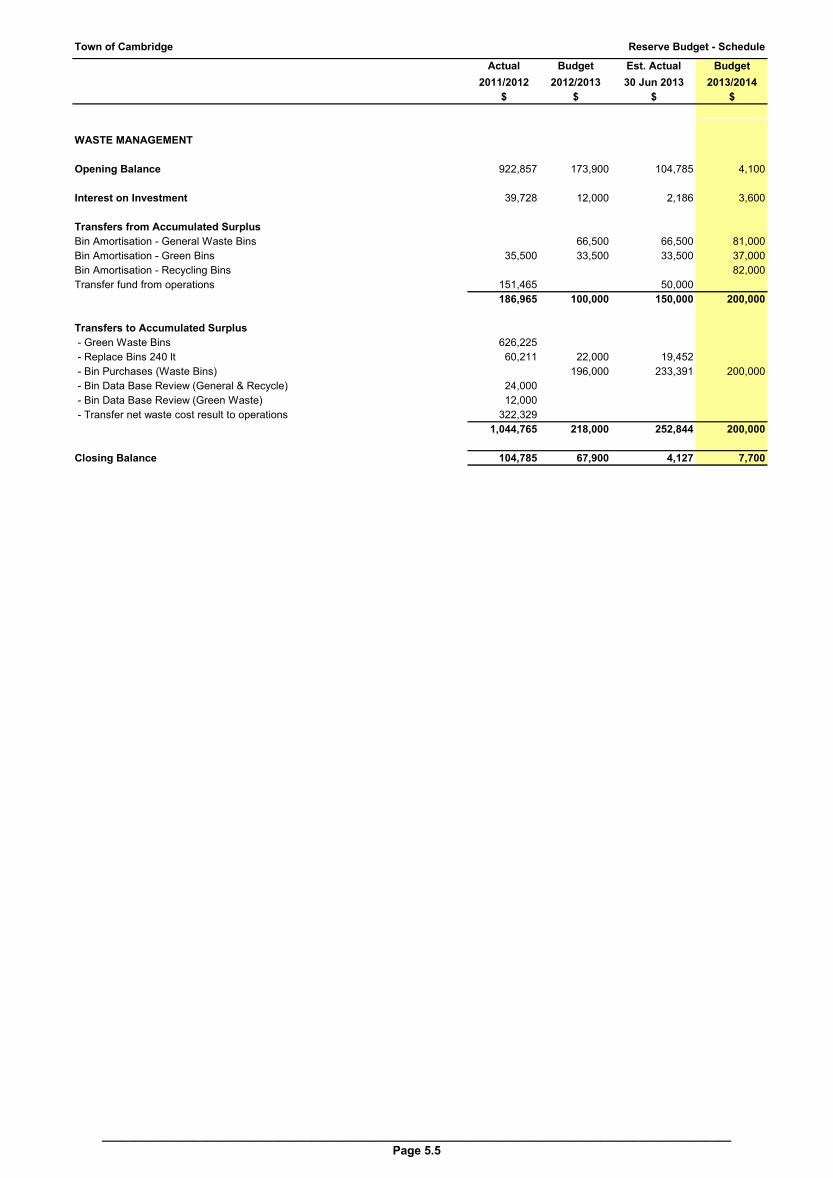
Town of Cambridge Reserve Budget - Schedule
Actual Budget Est. Actual Budget
2011/2012 2012/2013 30 Jun 2013 2013/2014
$ $ $ $
WASTE MANAGEMENT
Opening Balance 922,857 173,900 104,785 4,100
Interest on Investment 39,728 12,000 2,186 3,600
Transfers from Accumulated Surplus
Bin Amortisation - General Waste Bins 66,500 66,500 81,000
Bin Amortisation - Green Bins 35,500 33,500 33,500 37,000
Bin Amortisation - Recycling Bins 82,000
Transfer fund from operations 151,465 50,000
186,965 100,000 150,000 200,000
Transfers to Accumulated Surplus
- Green Waste Bins 626,225
- Replace Bins 240 lt 60,211 22,000 19,452
- Bin Purchases (Waste Bins) 196,000 233,391 200,000
- Bin Data Base Review (General & Recycle) 24,000
- Bin Data Base Review (Green Waste) 12,000
- Transfer net waste cost result to operations 322,329
1,044,765 218,000 252,844 200,000
Closing Balance 104,785 67,900 4,127 7,700
________________________________________________________________________________________________
Page 5.5
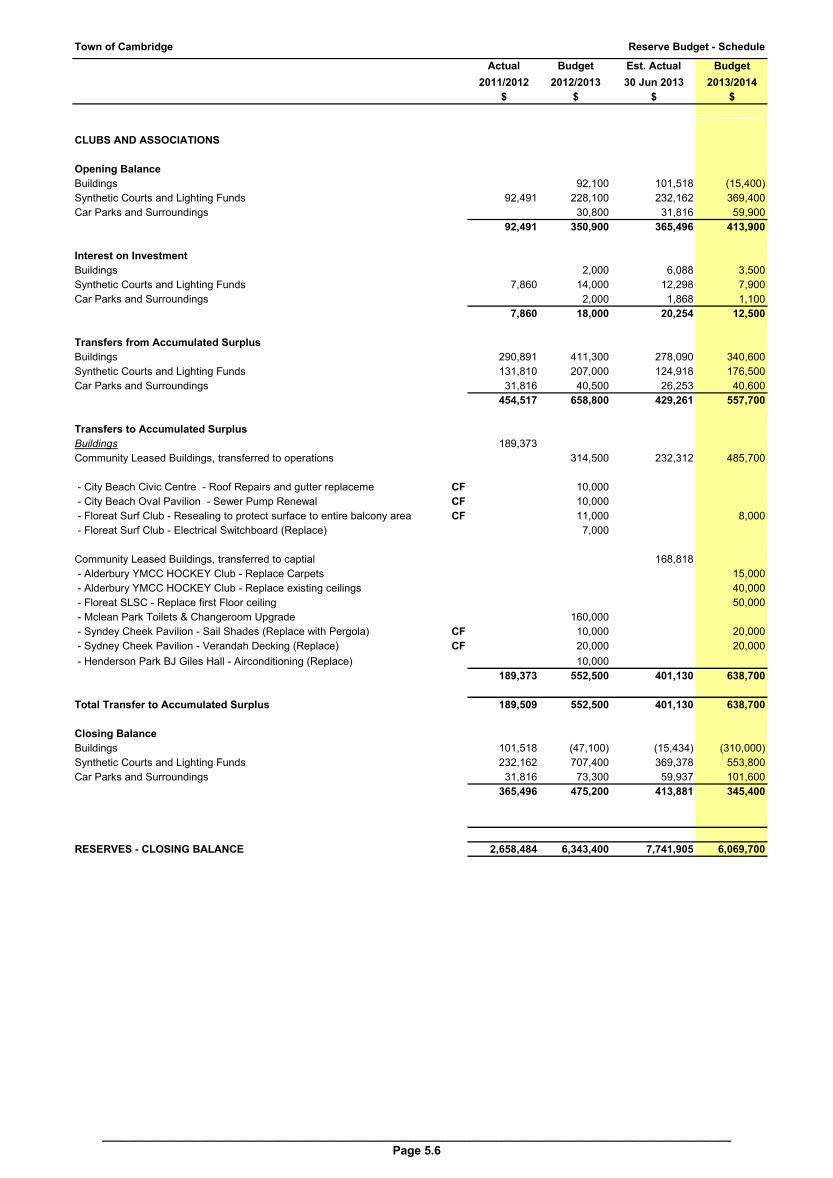
Town of Cambridge Reserve Budget - Schedule
Actual Budget Est. Actual Budget
2011/2012 2012/2013 30 Jun 2013 2013/2014
$ $ $ $
CLUBS AND ASSOCIATIONS
Opening Balance
Buildings 92,100 101,518 (15,400)
Synthetic Courts and Lighting Funds 92,491 228,100 232,162 369,400
Car Parks and Surroundings 30,800 31,816 59,900
92,491 350,900 365,496 413,900
Interest on Investment
Buildings 2,000 6,088 3,500
Synthetic Courts and Lighting Funds 7,860 14,000 12,298 7,900
Car Parks and Surroundings 2,000 1,868 1,100
7,860 18,000 20,254 12,500
Transfers from Accumulated Surplus
Buildings 290,891 411,300 278,090 340,600
Synthetic Courts and Lighting Funds 131,810 207,000 124,918 176,500
Car Parks and Surroundings 31,816 40,500 26,253 40,600
454,517 658,800 429,261 557,700
Transfers to Accumulated Surplus
Buildings 189,373
Community Leased Buildings, transferred to operations 314,500 232,312 485,700
- City Beach Civic Centre - Roof Repairs and gutter replaceme CF 10,000
- City Beach Oval Pavilion - Sewer Pump Renewal CF 10,000
- Floreat Surf Club - Resealing to protect surface to entire balcony area CF 11,000 8,000
- Floreat Surf Club - Electrical Switchboard (Replace) 7,000
Community Leased Buildings, transferred to captial 168,818
- Alderbury YMCC HOCKEY Club - Replace Carpets 15,000
- Alderbury YMCC HOCKEY Club - Replace existing ceilings 40,000
- Floreat SLSC - Replace first Floor ceiling 50,000
- Mclean Park Toilets & Changeroom Upgrade 160,000
- Syndey Cheek Pavilion - Sail Shades (Replace with Pergola) CF 10,000 20,000
- Sydney Cheek Pavilion - Verandah Decking (Replace) CF 20,000 20,000
- Henderson Park BJ Giles Hall - Airconditioning (Replace) 10,000
189,373 552,500 401,130 638,700
Total Transfer to Accumulated Surplus 189,509 552,500 401,130 638,700
Closing Balance
Buildings 101,518 (47,100) (15,434) (310,000)
Synthetic Courts and Lighting Funds 232,162 707,400 369,378 553,800
Car Parks and Surroundings 31,816 73,300 59,937 101,600
365,496 475,200 413,881 345,400
RESERVES - CLOSING BALANCE 2,658,484 6,343,400 7,741,905 6,069,700
________________________________________________________________________________________________
Page 5.6
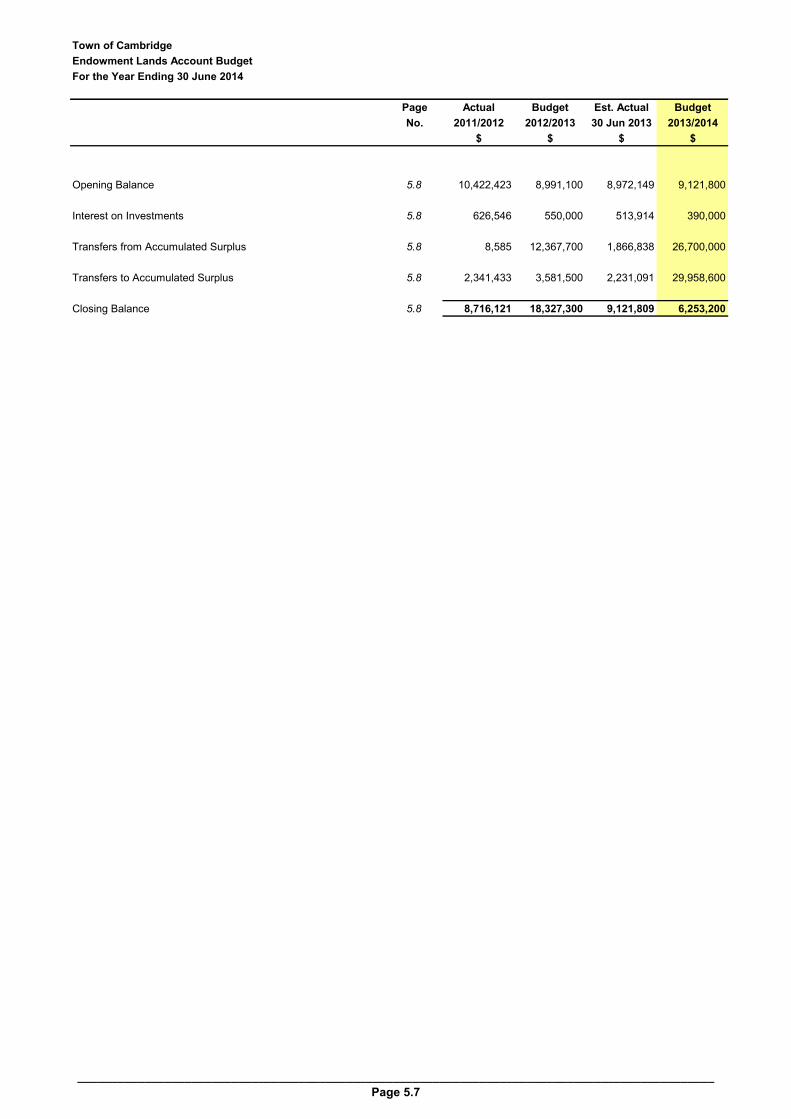
Town of Cambridge
Endowment Lands Account Budget
For the Year Ending 30 June 2014
Page Actual Budget Est. Actual Budget
No. 2011/2012 2012/2013 30 Jun 2013 2013/2014
$ $ $ $
Opening Balance 5.8 10,422,423 8,991,100 8,972,149 9,121,800
Interest on Investments 5.8 626,546 550,000 513,914 390,000
Transfers from Accumulated Surplus 5.8 8,585 12,367,700 1,866,838 26,700,000
Transfers to Accumulated Surplus 5.8 2,341,433 3,581,500 2,231,091 29,958,600
Closing Balance 5.8 8,716,121 18,327,300 9,121,809 6,253,200
_______________________________________________________________________________________________
Page 5.7
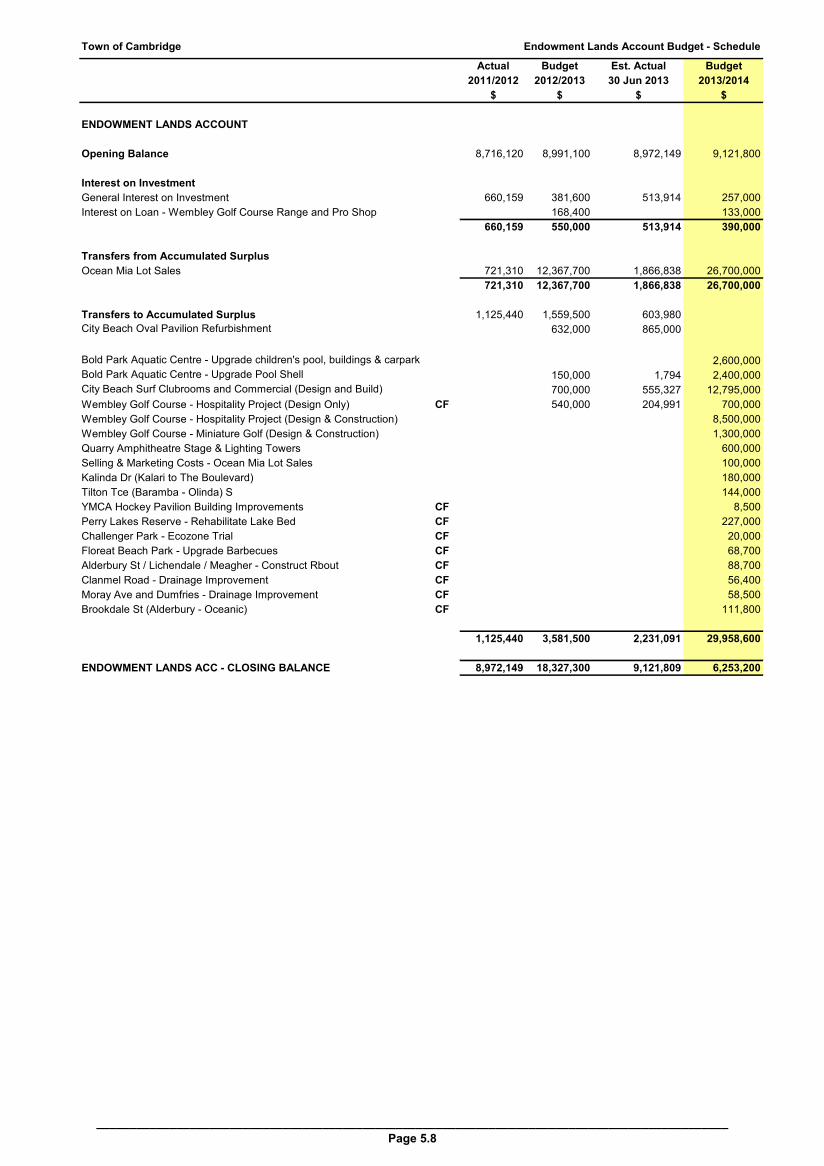
Town of Cambridge Endowment Lands Account Budget - Schedule
Actual Budget Est. Actual Budget
2011/2012 2012/2013 30 Jun 2013 2013/2014
$ $ $ $
ENDOWMENT LANDS ACCOUNT
Opening Balance 8,716,120 8,991,100 8,972,149 9,121,800
Interest on Investment
General Interest on Investment 660,159 381,600 513,914 257,000
Interest on Loan - Wembley Golf Course Range and Pro Shop 168,400 133,000
660,159 550,000 513,914 390,000
Transfers from Accumulated Surplus
Ocean Mia Lot Sales 721,310 12,367,700 1,866,838 26,700,000
721,310 12,367,700 1,866,838 26,700,000
Transfers to Accumulated Surplus 1,125,440 1,559,500 603,980
City Beach Oval Pavilion Refurbishment 632,000 865,000
Bold Park Aquatic Centre - Upgrade children's pool, buildings & carpark 2,600,000
Bold Park Aquatic Centre - Upgrade Pool Shell 150,000 1,794 2,400,000
City Beach Surf Clubrooms and Commercial (Design and Build) 700,000 555,327 12,795,000
Wembley Golf Course - Hospitality Project (Design Only) CF 540,000 204,991 700,000
Wembley Golf Course - Hospitality Project (Design & Construction) 8,500,000
Wembley Golf Course - Miniature Golf (Design & Construction) 1,300,000
Quarry Amphitheatre Stage & Lighting Towers 600,000
Selling & Marketing Costs - Ocean Mia Lot Sales 100,000
Kalinda Dr (Kalari to The Boulevard) 180,000
Tilton Tce (Baramba - Olinda) S 144,000
YMCA Hockey Pavilion Building Improvements CF 8,500
Perry Lakes Reserve - Rehabilitate Lake Bed CF 227,000
Challenger Park - Ecozone Trial CF 20,000
Floreat Beach Park - Upgrade Barbecues CF 68,700
Alderbury St / Lichendale / Meagher - Construct Rbout CF 88,700
Clanmel Road - Drainage Improvement CF 56,400
Moray Ave and Dumfries - Drainage Improvement CF 58,500
Brookdale St (Alderbury - Oceanic) CF 111,800
1,125,440 3,581,500 2,231,091 29,958,600
ENDOWMENT LANDS ACC - CLOSING BALANCE 8,972,149 18,327,300 9,121,809 6,253,200
_______________________________________________________________________________________________
Page 5.8

MISCELLANEOUS SCHEDULES
Budget Summary 6.1
Application of General Purpose Funds 6.2
Major Projects 6.3
Carried Forward Items 6.5
Disposal of Assets 6.6
Operating Revenue Schedules
Contributions/Grants for the Development of Assets 6.8
Operating Expenditure Schedules
Employee Expenses 6.9
Information Systems 6.10
Building Maintenance 6.12
Works Costing Information 6.13
Non-Capital Works 6.14
Programs 6.16
Depreciation 6.18
Activity Based Costing 6.20
Fees and Charges 7.1

Town of Cambridge
Budget Summary
For the Year Ending 30 June 2014
Page Actual Budget Est. Actual Budget
No. 2011/2012 2012/2013 30 Jun 2013 2013/2014
$ $ $ $
FUNDING SOURCE
Rate Revenue 3.13 18,249,104 19,530,000 19,490,687 20,879,900
Operating Revenues (excluding Rates) 3.1 26,475,121 40,480,800 31,374,487 47,336,600
Proceeds from the Sale of Assets 3.1 2,752,577 18,301,500 7,925,788 27,651,900
From Reserves 5.1 3,047,531 3,387,500 2,624,417 3,402,500
From Endowment Lands Account 5.8 1,125,438 3,581,500 2,231,091 29,958,600
Loans 2.3 990,000 3,413,100 114,422 338,100
Opening From Prior Year 7.5 3,475,923 4,373,600 4,373,600 6,190,100
Closing funds 0 0
56,115,694 93,068,000 68,134,492 135,757,700
Less (Gain)/Loss on Disposal of Assets 7.4 (1,185,223) (14,856,200) (7,228,467) (24,385,700)
Total 54,930,471 78,211,800 60,906,025 111,372,000
FUNDING APPLICATION
Operating Expenses 3.1 36,020,202 38,222,600 37,280,232 39,706,200
Capital Expenses 4.1 13,723,953 25,779,400 17,727,580 48,767,900
Purchase of Investment Tamala Park
Mindarie Principal Capitalised
Repayment of Debt Principal 89,044 334,500 130,206 346,900
To Reserves 5.1 3,113,190 6,894,100 6,990,446 1,825,500
To Endowment Lands Account 5.8 1,378,646 12,917,700 2,380,751 27,090,000
54,325,035 84,148,300 64,509,215 117,736,500
Less Depreciation 7.13 (5,800,516) (5,936,500) (5,791,125) (5,955,500)
Total 48,524,519 78,211,800 58,718,090 111,781,000
Surplus/(Deficit) 6,405,952 0 2,187,935 (409,000)
__________________________________________________________________________________________
Page 6.1

Town of Cambridge
Application of General Purpose Funds
For the Year Ending 30 June 2014
Application of General Purpose Funds Budget Budget Budget Budget
2012/2013 2013/2014 % Change $ Change
$ $ +/(-) +/(-)
General Purpose Funding
Rates 19,530,000 20,879,900 6.9% 1,349,900
General Purpose Grant 916,200 934,000 1.9% 17,800
General Financing* 1,324,400 1,098,000 (17.1%) (226,400)
Wembley Golf Course Dividend 1,580,000 1,580,000 0.0% 0
Total General Purpose Funds 23,350,600 24,491,900 4.9% 1,141,300
Application of General Purpose Funds
Applied to Operations 16,193,600 16,713,400 3.2% 519,800
Applied to Reserves 1,367,100 1,175,500 (14.0%) (191,600)
Applied to ELA 550,000 390,000 (29.1%) (160,000)
Applied to Loan Principal repayments 334,500 346,900 3.7% 12,400
18,445,200 18,625,800 1.0% 180,600
Applied to Capital Works:
Land & Buildings 184,000 593,000 222.3% 409,000
Furniture and Equipment 250,000 1,268,000 407.2% 1,018,000
Plant and Equipment 98,500 66,500 (32.5%) (32,000)
Infrastructure - Parks and Reserves 596,800 578,000 (3.2%) (18,800)
Infrastructure - Roads and Lanes 2,590,600 1,820,300 (29.7%) (770,300)
Infrastructure - Drainage 583,000 582,000 (0.2%) (1,000)
Infrastructure - Footpaths 574,500 933,300 62.5% 358,800
Infrastructure - Bus Shelters 28,000 25,000 (10.7%) (3,000)
4,905,400 5,866,100 19.6% 960,700
Total Application of Funds 23,350,600 24,491,900 4.9% 1,141,300
24%
____________________________________________________________________________________
Page 6.2

Town of Cambridge
Project Project to Actual to Buget Projected Buget Future Year Total
Description Date Actual 30 June 2012 2012/2013 2012/2013 2013/2014 Projection Project
$ $ $ $ $ $ $
WEMBLEY SPORTS PARK MATTHEWS NETBALL CENTRE
Sources of Funds
Grant Grant $1,315,000 $370,000 $7,170,000 $5,000,000 $2,110,000 $7,480,000
Municipal funds Muni $0 $0
$1,315,000 $370,000 $7,170,000 $5,000,000 $2,110,000 $0 $7,480,000
Project Expenditure
Courts, Netball Centre $60,000 $82,000 $7,170,000 $5,000,000 $2,148,000 $0 $7,230,000
Payment to State for Design $0 $250,000 $0 $0 $250,000
$60,000 $332,000 $7,170,000 $5,000,000 $2,148,000 $0 $7,480,000
CRxx.xx [Date] Approval of project budget
CRxx.xx [Date] Revision of Project Budget
WEMBLEY SPORTS PARK INFRASTRUCTURE WORKS
Sources of Funds
Rates Muni $133,000 $133,000
Res $0 $664,000 $4,867,000 $0 $0 $4,867,000
Loan Loan $300,000 $300,000 0 $300,000
$0 $133,000 $964,000 $4,867,000 $300,000 $0 $5,300,000
Project Expenditure
Roads, Intersection, Car Parks &
Oval $10,000 $73,000 $400,000 $4,303,000 $300,000 $0 $4,676,000
Payment to State for Design $0 $60,000 $0 $0 $60,000
Payment to State for Infra & $0 $0 $564,000 $564,000 $0 $564,000
$10,000 $133,000 $964,000 $4,867,000 $300,000 $0 $5,300,000
CRxx.xx [Date] Approval of project budget
CRxx.xx [Date] Revision of Project Budget
WEMBLEY SPORTS PARK PAT GOODRIDGE PAVILION REDEVELOPMENT
Sources of Funds
Grant / Club Grant $1,500,000 $1,500,000
Area Improvement Reserve Res $0 $30,000 $5,000 $225,000 $1,270,000 $1,500,000
$0 $0 $30,000 $5,000 $225,000 $2,770,000 $3,000,000
Project ExpenditurePat Goodridge Pavilion
Redevelopment $10,000 $0 $30,000 $5,000 $225,000 $2,770,000 $3,000,000
$10,000 $0 $30,000 $5,000 $225,000 $2,770,000 $3,000,000
CRxx.xx [Date] Approval of project budget
CRxx.xx [Date] Revision of Project Budget
CITY BEACH SURF CLUB & COMMERCIAL DEVELOPMENT
Sources of Funds
Grant for the Surf Club
redevelopment Grant $1,900,000 $1,900,000
Contribution from the Surf Club Contribution $160,000 $160,000
ELA:
ELA $52,500 $125,000 $6,187,500 $6,365,000
ELA $52,500 $175,000 $2,022,500 $2,250,000
Endowment Lands Account
(Board Riders) ELA $132,000 $132,000
Endowment Lands Account
(Amenities) ELA $55,000 $1,560,000 $1,615,000
ELA $100,000 $0 $700,000 $35,000 $2,893,000 $2,928,000
Subtotal ELA $105,000 $700,000 $390,000 $12,795,000 $0 $13,290,000
$100,000 $105,000 $700,000 $390,000 $14,855,000 $0 $15,350,000
Project Expenditure
City Beach Commercial
development $52,500 $210,000 $125,000 $3,937,500 $4,115,000
City Beach Surf Club $100,000 $52,500 $310,000 $175,000 $5,832,500 $6,060,000
City Beach Board Riders $132,000 $132,000
City Beach Amenities $70,000 $55,000 $1,560,000 $1,615,000City Beach Community
Infrastructure (landscape, etc.) $0 $110,000 $35,000 $2,393,000 $2,428,000
City Beach Seawall $1,000,000 $1,000,000
$200,000 $105,000 $700,000 $390,000 $14,855,000 $0 $15,350,000
CRxx.xx 22 July 2012 Approval of Project Budget
CR13.8 18 February 2013 Revision to Project Budget
This Schedule provides a summary of the Town's major projects over $500,000, spanning more than one financial year.
Endowment Lands Account (Commercial & 50% of $4.5M)
Endowment Lands Account (Surf Club 50% of $4.5M)
Endowment Lands Account (Community Infrastructure)
Area Improvement Re (incorporating $5M nursery site)
_____________________________________________________________________________________________
Page 6.3
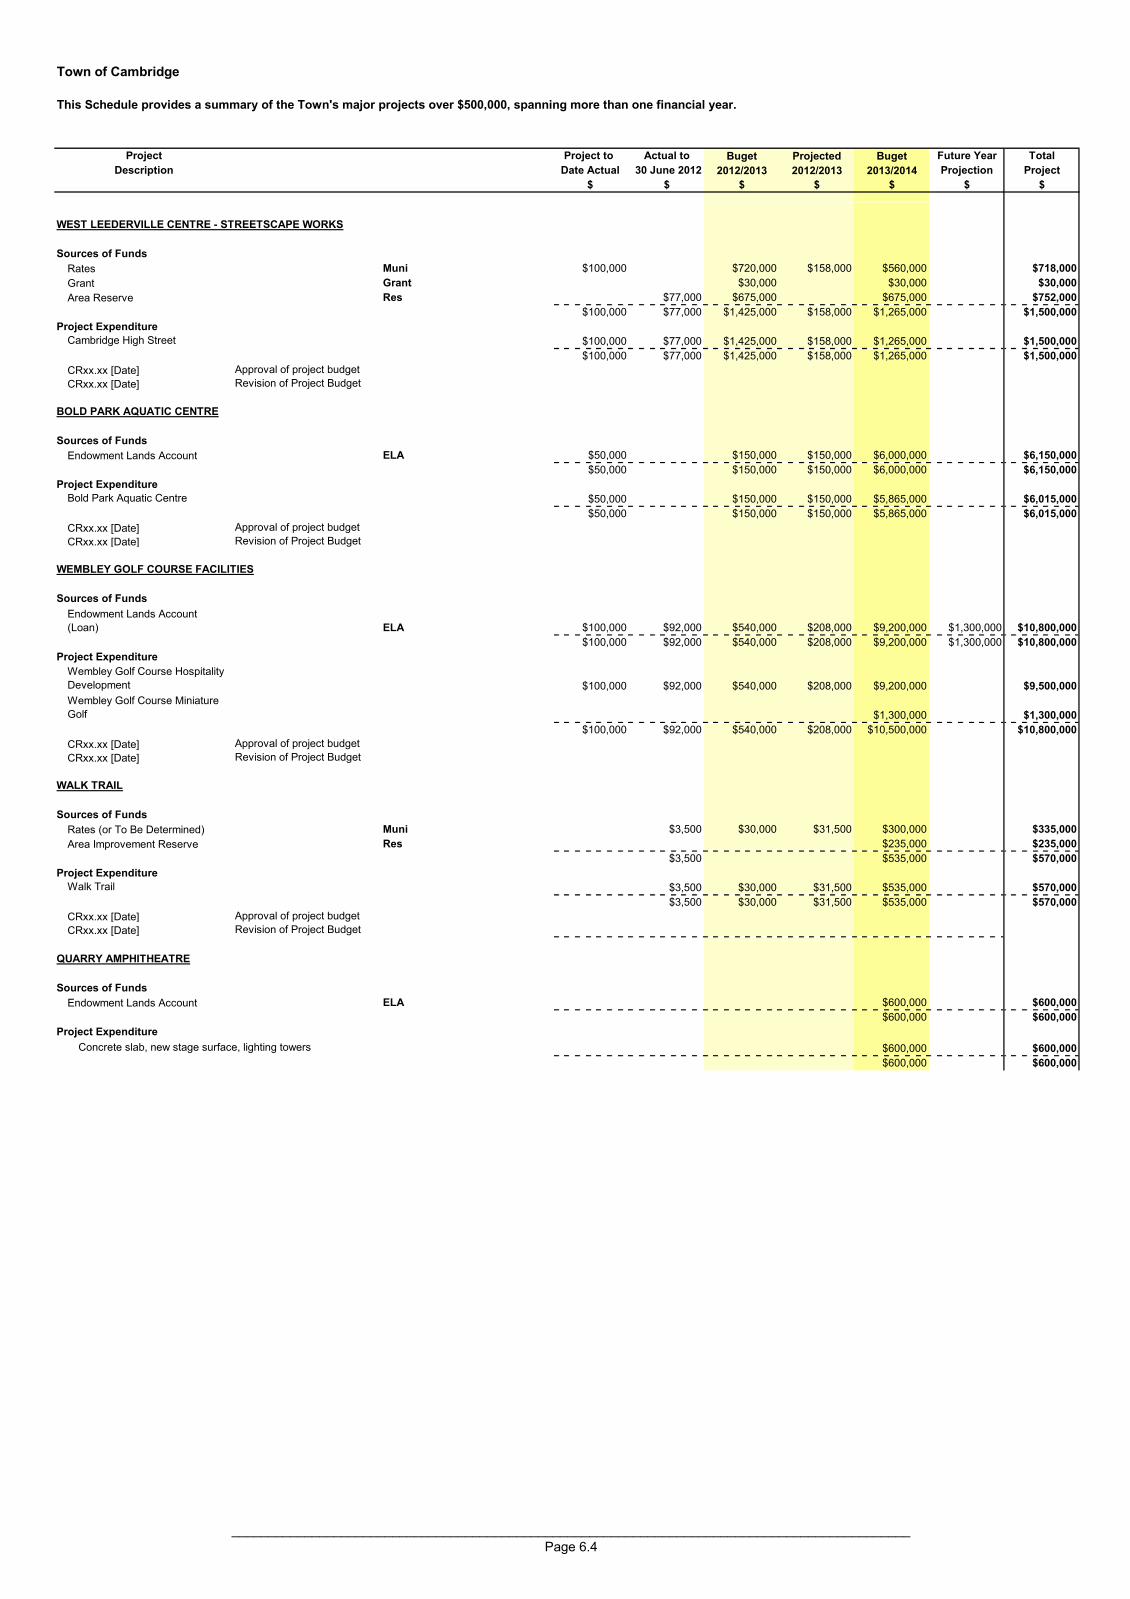
Town of Cambridge
Project Project to Actual to Buget Projected Buget Future Year Total
Description Date Actual 30 June 2012 2012/2013 2012/2013 2013/2014 Projection Project
$ $ $ $ $ $ $
This Schedule provides a summary of the Town's major projects over $500,000, spanning more than one financial year.
WEST LEEDERVILLE CENTRE - STREETSCAPE WORKS
Sources of Funds
Rates Muni $100,000 $0 $720,000 $158,000 $560,000 $718,000
Grant Grant $30,000 $30,000 $30,000
Area Reserve Res $77,000 $675,000 $675,000 $0 $752,000
$100,000 $77,000 $1,425,000 $158,000 $1,265,000 $0 $1,500,000
Project Expenditure
Cambridge High Street $100,000 $77,000 $1,425,000 $158,000 $1,265,000 $0 $1,500,000
$100,000 $77,000 $1,425,000 $158,000 $1,265,000 $0 $1,500,000
CRxx.xx [Date] Approval of project budget
CRxx.xx [Date] Revision of Project Budget
BOLD PARK AQUATIC CENTRE
Sources of Funds
Endowment Lands Account ELA $50,000 $0 $150,000 $150,000 $6,000,000 $0 $6,150,000
$50,000 $0 $150,000 $150,000 $6,000,000 $0 $6,150,000
Project Expenditure
Bold Park Aquatic Centre $50,000 $0 $150,000 $150,000 $5,865,000 $0 $6,015,000
$50,000 $0 $150,000 $150,000 $5,865,000 $0 $6,015,000
CRxx.xx [Date] Approval of project budget
CRxx.xx [Date] Revision of Project Budget
WEMBLEY GOLF COURSE FACILITIES
Sources of Funds
Endowment Lands Account
(Loan) ELA $100,000 $92,000 $540,000 $208,000 $9,200,000 $1,300,000 $10,800,000
$100,000 $92,000 $540,000 $208,000 $9,200,000 $1,300,000 $10,800,000
Project Expenditure
Wembley Golf Course Hospitality
Development $100,000 $92,000 $540,000 $208,000 $9,200,000 $9,500,000
Wembley Golf Course Miniature
Golf $0 $0 $0 $1,300,000 $1,300,000
$100,000 $92,000 $540,000 $208,000 $10,500,000 $0 $10,800,000
CRxx.xx [Date] Approval of project budget
CRxx.xx [Date] Revision of Project Budget
WALK TRAIL
Sources of Funds
Rates (or To Be Determined) Muni $0 $3,500 $30,000 $31,500 $300,000 $0 $335,000
Area Improvement Reserve Res $0 $0 $0 $0 $235,000 $0 $235,000
$0 $3,500 $0 $0 $535,000 $0 $570,000
Project Expenditure
Walk Trail $0 $3,500 $30,000 $31,500 $535,000 $0 $570,000
$0 $3,500 $30,000 $31,500 $535,000 $0 $570,000
CRxx.xx [Date] Approval of project budget
CRxx.xx [Date] Revision of Project Budget
QUARRY AMPHITHEATRE
Sources of Funds
Endowment Lands Account ELA $600,000 $0 $600,000
$600,000 $0 $600,000
Project Expenditure
$600,000 $0 $600,000
$600,000 $0 $600,000
Concrete slab, new stage surface, lighting towers
_____________________________________________________________________________________________
Page 6.4

Town of Cambridge Carried Forward Items
Surplus Reserve Endow Loan Other Total
Lands
$ $ $ $ $ $
Expenditure
Operating
Governance
Special Projects/Research 15,000 15,000
Regional Collaboration 15,000 15,000
Administration General 0
Community Engagement 9,500 9,500
0
Administration 0
Feasibility Study of Energy Reduction Initiatives 50,000 50,000
0
Surf Life Saving Clubs 0
FSLSC - Resealing to protect surface to entire balacony area 8,000 8,000
0
Welfare 0
Disability Services 14,000 14,000
0
Youth Services 0
Skate Park project 4,500 4,500
0
Planning 0
Town Planning Scheme Review 100,000 100,000
Leederville Link Contribution 60,000 60,000
Sustainability
Travel Smart Initiatives 27,000 27,000
WESROC Sustainability Project 4,500 4,500
Biodiversity (see also below for other works) 6,000 6,000
Various Parks - Biodiversity Action Plan (ex parks) 7,500 7,500
0
Ocean Beaches Buildings 0
City Beach Lookout Tower and Rails 5,500 5,500
0
Clubs - Leased Premises 0
City Beach Oval Pavillion - Sewer Pump Renewal 10,000 10,000
YMCC Hockey Pavilion - Render 15,000 15,000
Lake Monger Recreation Club - Re-paint all eave areas 5,000 5,000
YMCC Hockey Pavilion - Repaint fascias 5,000 5,000
City Beach Civic Centre - Roof Repairs and gutter replaceme 8,800 8,800
Lake Monger Recreation Club - Re-paint all external window f 5,000 5,000
YMCC Hockey Pavilion - Repaint kitchen walls 4,000 4,000
Lake Monger Recreation Club - Renew window blinds 5,000 5,000
0
Parks - Buildings 0
Cowden Park Toilets - Replace craking terrazzo 11,000 11,000
Cowden Park Toilets - Replace fixtures 6,500 6,500
0
Parks - Grounds 0
Lake Monger Reserve - Tree Planting Program in Lawn 5,000 5,000
Lake Monger Reserve - Upgrade Interpretive Signs 7,300 7,300
Park Improvement Concept Plans 40,000 40,000
0
Recreation Services 0
Heritage Trail Signage 12,500 12,500
0
Road Infrastructure 0
Howtree Pl/Brookdale St/Oceanic Dr Traffic signal modification (Blackspot funded) 51,900 51,900
Traffic Signals - disability access 42,800 42,800
0
Road Reserves 0
Street Trees - Inventory 45,000 45,000
Treescape Plan - Precinct Streets Planting Program 32,500 32,500
Treescape Plan - Priority Streets Improvement Program 127,200 127,200
0
Depot 0
Entry Gate 24,300 24,300
0
Asset Management 0
Consultants 14,100 14,100
Total Operating 738,600 65,800 0 0 0 804,400
________________________________________________________________________________________________________
Page 6.5
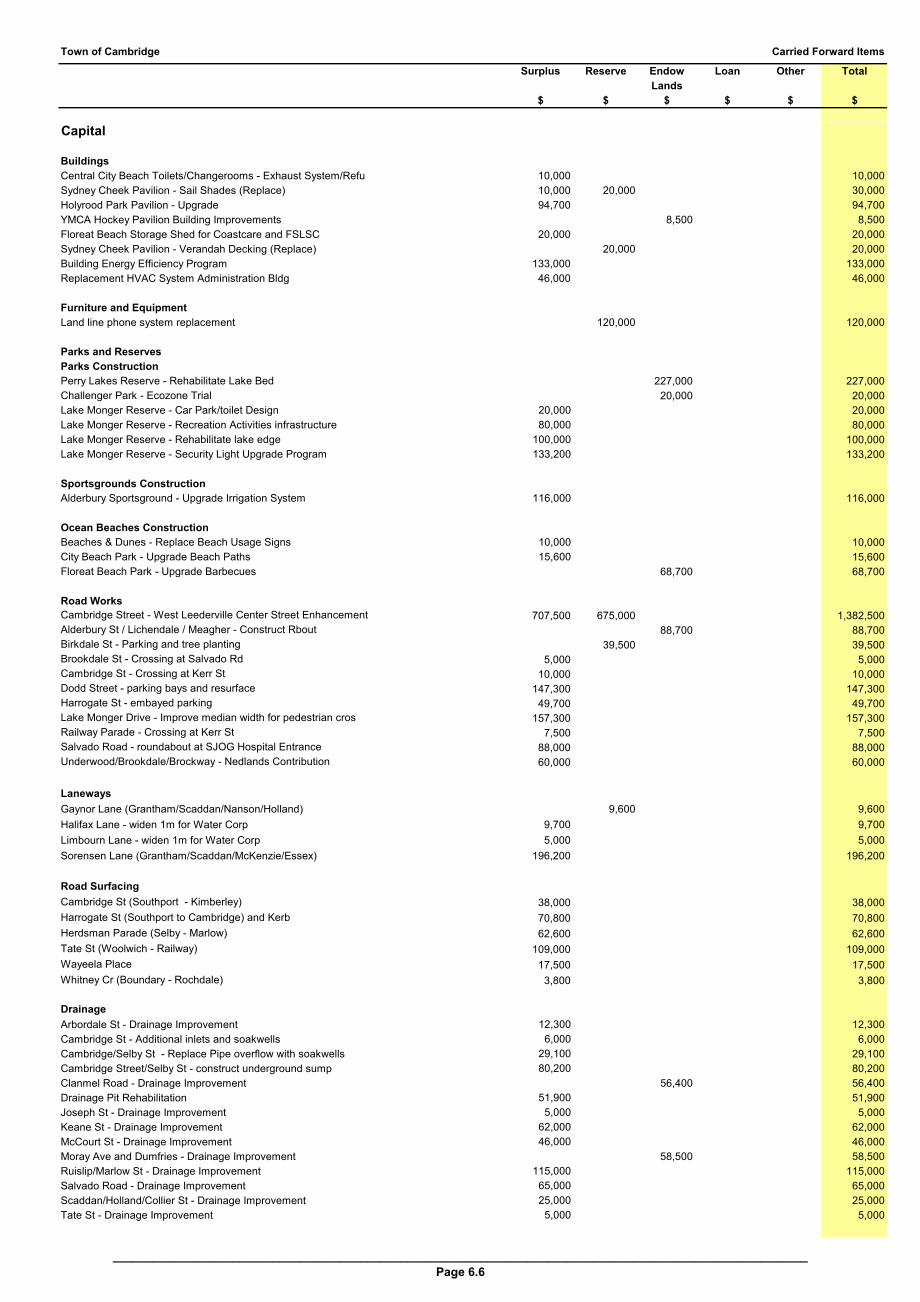
Town of Cambridge Carried Forward Items
Surplus Reserve Endow Loan Other Total
Lands
$ $ $ $ $ $
Capital
Buildings
Central City Beach Toilets/Changerooms - Exhaust System/Refu 10,000 10,000
Sydney Cheek Pavilion - Sail Shades (Replace) 10,000 20,000 30,000
Holyrood Park Pavilion - Upgrade 94,700 94,700
YMCA Hockey Pavilion Building Improvements 8,500 8,500
Floreat Beach Storage Shed for Coastcare and FSLSC 20,000 20,000
Sydney Cheek Pavilion - Verandah Decking (Replace) 20,000 20,000
Building Energy Efficiency Program 133,000 133,000
Replacement HVAC System Administration Bldg 46,000 46,000
0
Furniture and Equipment 0
Land line phone system replacement 120,000 120,000
0
Parks and Reserves 0
Parks Construction 0
Perry Lakes Reserve - Rehabilitate Lake Bed 227,000 227,000
Challenger Park - Ecozone Trial 20,000 20,000
Lake Monger Reserve - Car Park/toilet Design 20,000 20,000
Lake Monger Reserve - Recreation Activities infrastructure 80,000 80,000
Lake Monger Reserve - Rehabilitate lake edge 100,000 100,000
Lake Monger Reserve - Security Light Upgrade Program 133,200 133,200
0
Sportsgrounds Construction 0
Alderbury Sportsground - Upgrade Irrigation System 116,000 116,000
0
Ocean Beaches Construction 0
Beaches & Dunes - Replace Beach Usage Signs 10,000 10,000
City Beach Park - Upgrade Beach Paths 15,600 15,600
Floreat Beach Park - Upgrade Barbecues 68,700 68,700
0
Road Works 0
Cambridge Street - West Leederville Center Street Enhancement 707,500 675,000 1,382,500
Alderbury St / Lichendale / Meagher - Construct Rbout 88,700 88,700
Birkdale St - Parking and tree planting 39,500 39,500
Brookdale St - Crossing at Salvado Rd 5,000 5,000
Cambridge St - Crossing at Kerr St 10,000 10,000
Dodd Street - parking bays and resurface 147,300 147,300
Harrogate St - embayed parking 49,700 49,700
Lake Monger Drive - Improve median width for pedestrian cros 157,300 157,300
Railway Parade - Crossing at Kerr St 7,500 7,500
Salvado Road - roundabout at SJOG Hospital Entrance 88,000 88,000
Underwood/Brookdale/Brockway - Nedlands Contribution 60,000 60,000
0
Laneways 0
Gaynor Lane (Grantham/Scaddan/Nanson/Holland) 9,600 9,600
Halifax Lane - widen 1m for Water Corp 9,700 9,700
Limbourn Lane - widen 1m for Water Corp 5,000 5,000
Sorensen Lane (Grantham/Scaddan/McKenzie/Essex) 196,200 196,200
0
Road Surfacing 0
Cambridge St (Southport - Kimberley) 38,000 38,000
Harrogate St (Southport to Cambridge) and Kerb 70,800 70,800
Herdsman Parade (Selby - Marlow) 62,600 62,600
Tate St (Woolwich - Railway) 109,000 109,000
Wayeela Place 17,500 17,500
Whitney Cr (Boundary - Rochdale) 3,800 3,800
0
Drainage 0
Arbordale St - Drainage Improvement 12,300 12,300
Cambridge St - Additional inlets and soakwells 6,000 6,000
Cambridge/Selby St - Replace Pipe overflow with soakwells 29,100 29,100
Cambridge Street/Selby St - construct underground sump 80,200 80,200
Clanmel Road - Drainage Improvement 56,400 56,400
Drainage Pit Rehabilitation 51,900 51,900
Joseph St - Drainage Improvement 5,000 5,000
Keane St - Drainage Improvement 62,000 62,000
McCourt St - Drainage Improvement 46,000 46,000
Moray Ave and Dumfries - Drainage Improvement 58,500 58,500
Ruislip/Marlow St - Drainage Improvement 115,000 115,000
Salvado Road - Drainage Improvement 65,000 65,000
Scaddan/Holland/Collier St - Drainage Improvement 25,000 25,000
Tate St - Drainage Improvement 5,000 5,000
0
________________________________________________________________________________________________________
Page 6.6
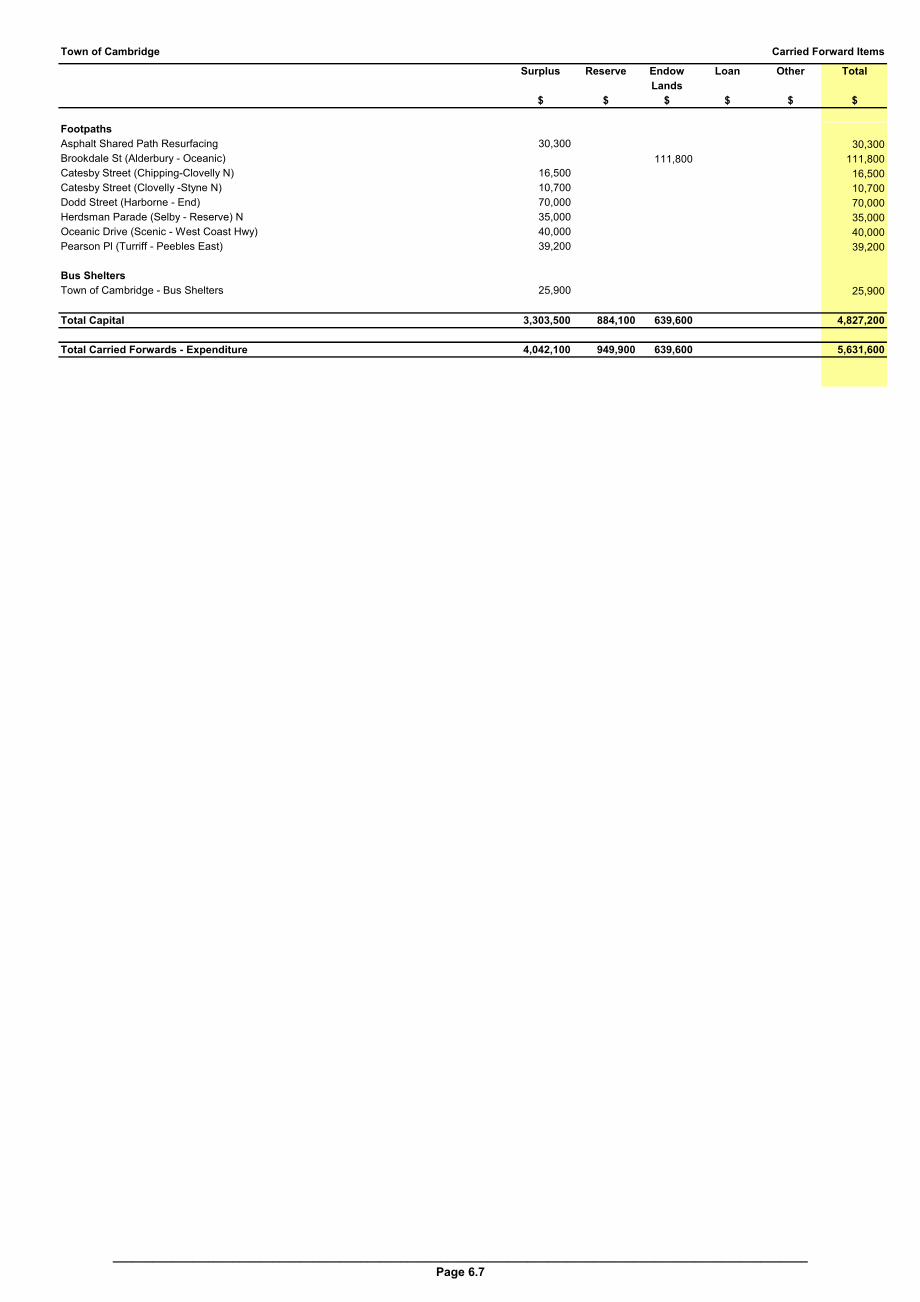
Town of Cambridge Carried Forward Items
Surplus Reserve Endow Loan Other Total
Lands
$ $ $ $ $ $
Footpaths 0
Asphalt Shared Path Resurfacing 30,300 30,300
Brookdale St (Alderbury - Oceanic) 111,800 111,800
Catesby Street (Chipping-Clovelly N) 16,500 16,500
Catesby Street (Clovelly -Styne N) 10,700 10,700
Dodd Street (Harborne - End) 70,000 70,000
Herdsman Parade (Selby - Reserve) N 35,000 35,000
Oceanic Drive (Scenic - West Coast Hwy) 40,000 40,000
Pearson Pl (Turriff - Peebles East) 39,200 39,200
0 0
Bus Shelters
Town of Cambridge - Bus Shelters 25,900 25,900
0
Total Capital 3,303,500 884,100 639,600 0 0 4,827,200
Total Carried Forwards - Expenditure 4,042,100 949,900 639,600 0 0 5,631,600
________________________________________________________________________________________________________
Page 6.7
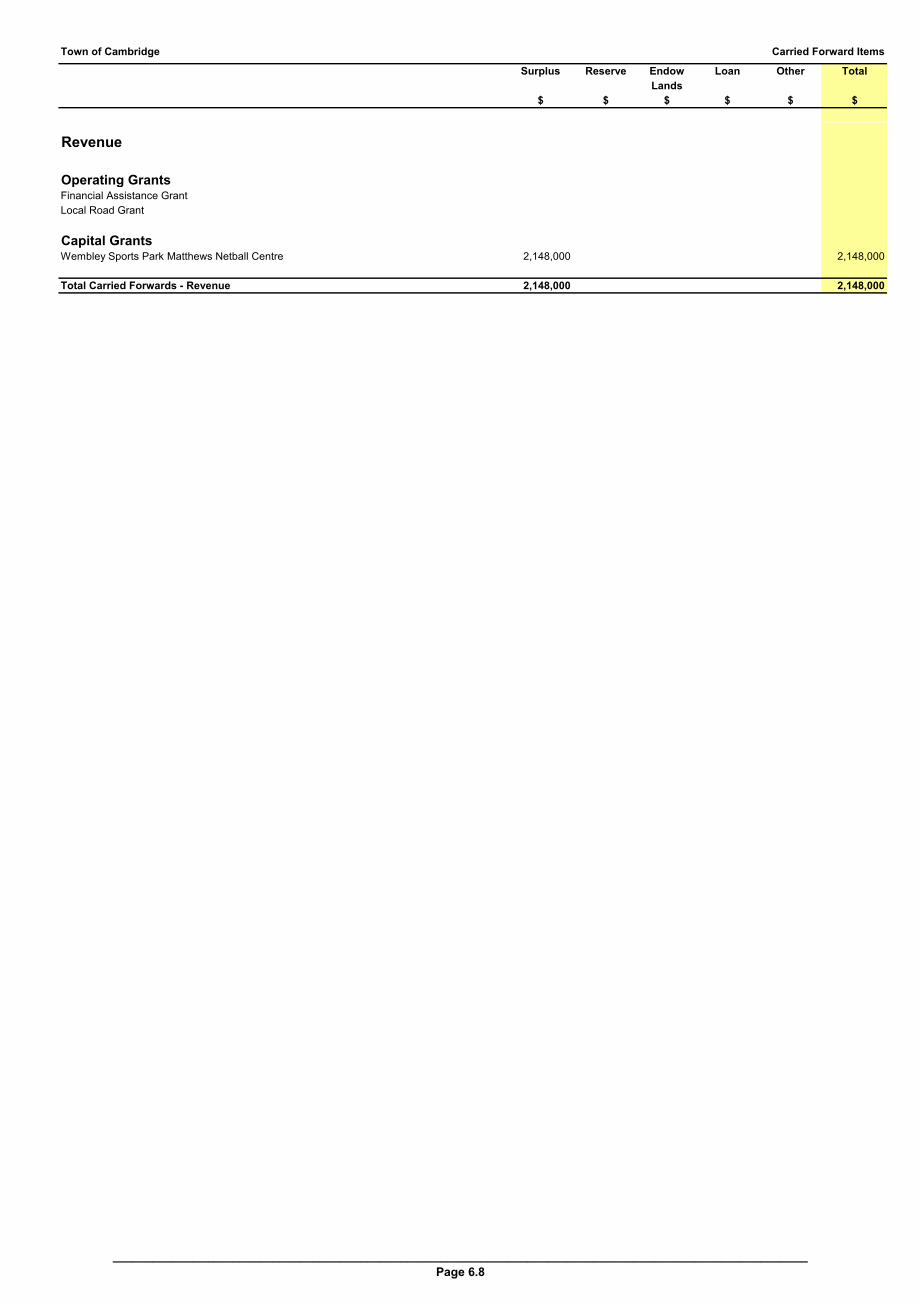
Town of Cambridge Carried Forward Items
Surplus Reserve Endow Loan Other Total
Lands
$ $ $ $ $ $
Revenue
Operating GrantsFinancial Assistance Grant 0 0
Local Road Grant 0 0
Capital GrantsWembley Sports Park Matthews Netball Centre 2,148,000 2,148,000
Total Carried Forwards - Revenue 2,148,000 0 0 0 0 2,148,000
________________________________________________________________________________________________________
Page 6.8
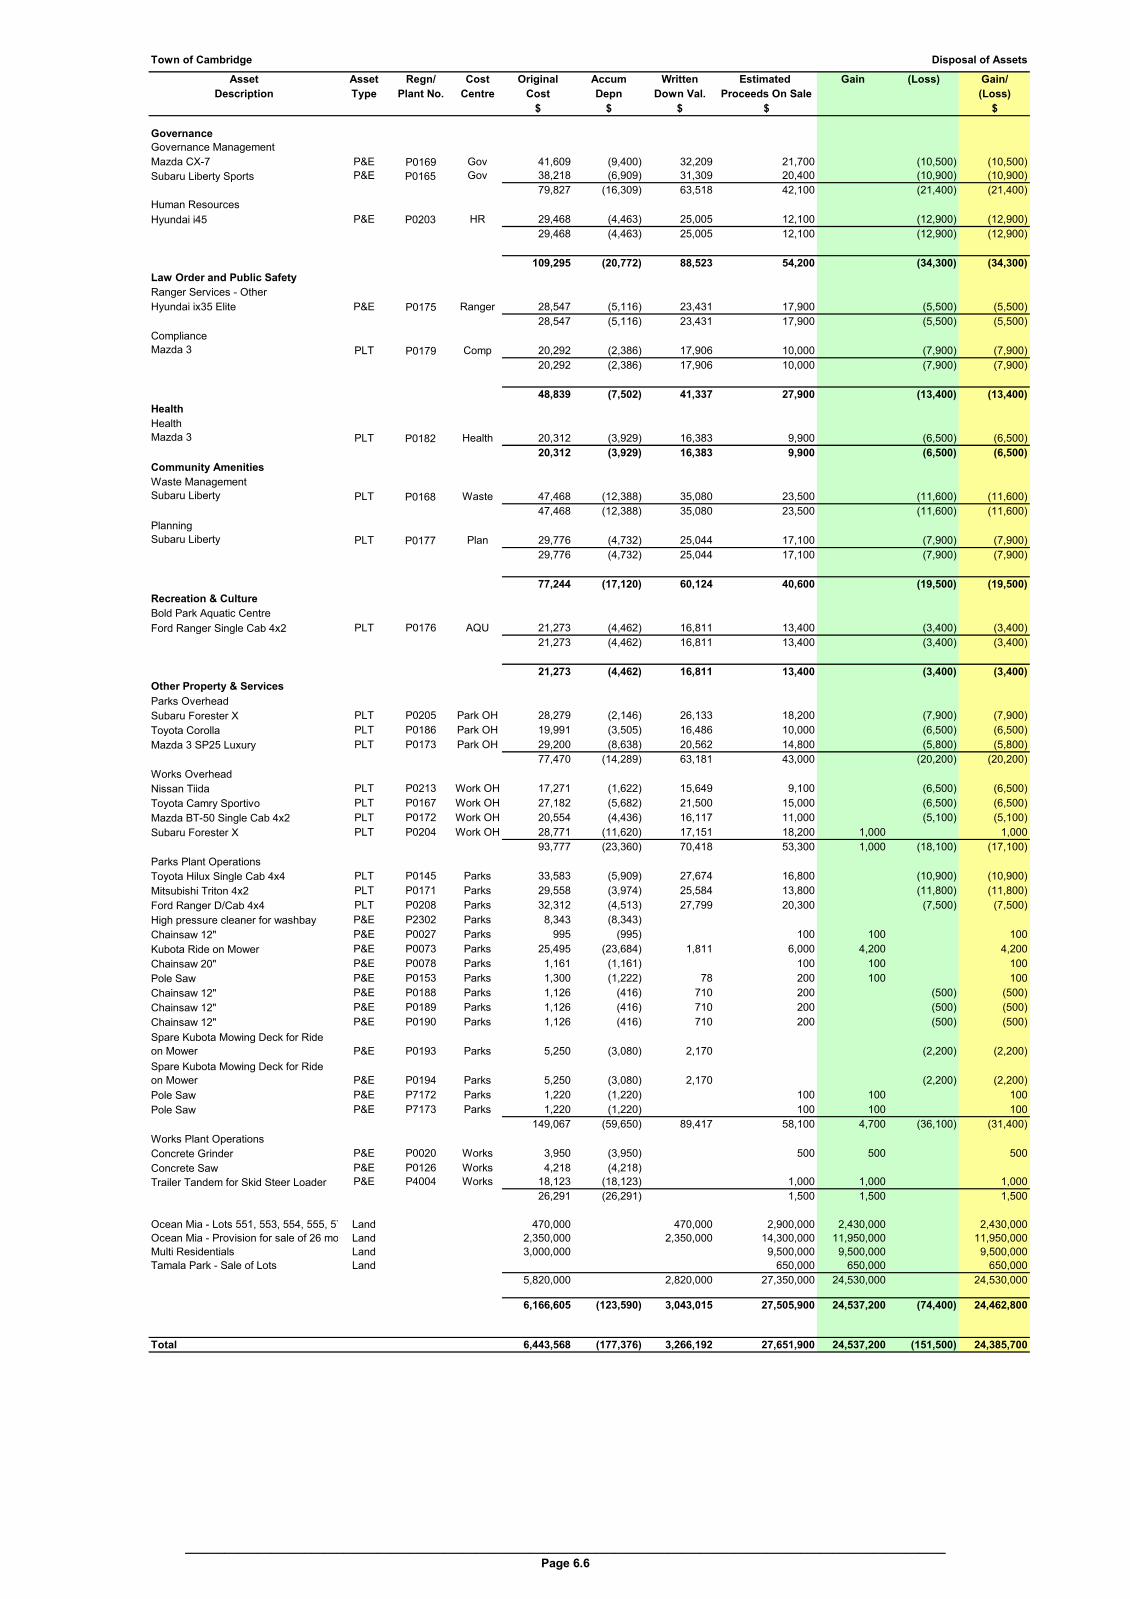
Town of Cambridge Disposal of Assets
Asset Asset Regn/ Cost Original Accum Written Estimated Gain (Loss) Gain/
Description Type Plant No. Centre Cost Depn Down Val. Proceeds On Sale (Loss)
$ $ $ $ $
Governance
Governance Management
Mazda CX-7 P&E P0169 Gov 41,609 (9,400) 32,209 21,700 0 (10,500) (10,500)
Subaru Liberty Sports P&E P0165 Gov 38,218 (6,909) 31,309 20,400 0 (10,900) (10,900)
79,827 (16,309) 63,518 42,100 0 (21,400) (21,400)
Human Resources
Hyundai i45 P&E P0203 HR 29,468 (4,463) 25,005 12,100 0 (12,900) (12,900)
29,468 (4,463) 25,005 12,100 0 (12,900) (12,900)
109,295 (20,772) 88,523 54,200 0 (34,300) (34,300)
Law Order and Public Safety
Ranger Services - Other
Hyundai ix35 Elite P&E P0175 Ranger 28,547 (5,116) 23,431 17,900 0 (5,500) (5,500)
28,547 (5,116) 23,431 17,900 0 (5,500) (5,500)
Compliance
Mazda 3 PLT P0179 Comp 20,292 (2,386) 17,906 10,000 0 (7,900) (7,900)
20,292 (2,386) 17,906 10,000 0 (7,900) (7,900)
48,839 (7,502) 41,337 27,900 0 (13,400) (13,400)
Health
Health
Mazda 3 PLT P0182 Health 20,312 (3,929) 16,383 9,900 0 (6,500) (6,500)
20,312 (3,929) 16,383 9,900 0 (6,500) (6,500)
Community Amenities
Waste Management
Subaru Liberty PLT P0168 Waste 47,468 (12,388) 35,080 23,500 0 (11,600) (11,600)
47,468 (12,388) 35,080 23,500 0 (11,600) (11,600)
Planning
Subaru Liberty PLT P0177 Plan 29,776 (4,732) 25,044 17,100 0 (7,900) (7,900)
29,776 (4,732) 25,044 17,100 0 (7,900) (7,900)
77,244 (17,120) 60,124 40,600 0 (19,500) (19,500)
Recreation & Culture
Bold Park Aquatic Centre
Ford Ranger Single Cab 4x2 PLT P0176 AQU 21,273 (4,462) 16,811 13,400 0 (3,400) (3,400)
21,273 (4,462) 16,811 13,400 0 (3,400) (3,400)
21,273 (4,462) 16,811 13,400 0 (3,400) (3,400)
Other Property & Services
Parks Overhead
Subaru Forester X PLT P0205 Park OH 28,279 (2,146) 26,133 18,200 0 (7,900) (7,900)
Toyota Corolla PLT P0186 Park OH 19,991 (3,505) 16,486 10,000 0 (6,500) (6,500)
Mazda 3 SP25 Luxury PLT P0173 Park OH 29,200 (8,638) 20,562 14,800 0 (5,800) (5,800)
77,470 (14,289) 63,181 43,000 0 (20,200) (20,200)
Works Overhead
Nissan Tiida PLT P0213 Work OH 17,271 (1,622) 15,649 9,100 0 (6,500) (6,500)
Toyota Camry Sportivo PLT P0167 Work OH 27,182 (5,682) 21,500 15,000 0 (6,500) (6,500)
Mazda BT-50 Single Cab 4x2 PLT P0172 Work OH 20,554 (4,436) 16,117 11,000 0 (5,100) (5,100)
Subaru Forester X PLT P0204 Work OH 28,771 (11,620) 17,151 18,200 1,000 0 1,000
93,777 (23,360) 70,418 53,300 1,000 (18,100) (17,100)
Parks Plant Operations
Toyota Hilux Single Cab 4x4 PLT P0145 Parks 33,583 (5,909) 27,674 16,800 0 (10,900) (10,900)
Mitsubishi Triton 4x2 PLT P0171 Parks 29,558 (3,974) 25,584 13,800 0 (11,800) (11,800)
Ford Ranger D/Cab 4x4 PLT P0208 Parks 32,312 (4,513) 27,799 20,300 0 (7,500) (7,500)
High pressure cleaner for washbay P&E P2302 Parks 8,343 (8,343) 0 0 0 0 0
Chainsaw 12" P&E P0027 Parks 995 (995) 0 100 100 0 100
Kubota Ride on Mower P&E P0073 Parks 25,495 (23,684) 1,811 6,000 4,200 0 4,200
Chainsaw 20" P&E P0078 Parks 1,161 (1,161) 0 100 100 0 100
Pole Saw P&E P0153 Parks 1,300 (1,222) 78 200 100 0 100
Chainsaw 12" P&E P0188 Parks 1,126 (416) 710 200 0 (500) (500)
Chainsaw 12" P&E P0189 Parks 1,126 (416) 710 200 0 (500) (500)
Chainsaw 12" P&E P0190 Parks 1,126 (416) 710 200 0 (500) (500)
Spare Kubota Mowing Deck for Ride
on Mower P&E P0193 Parks 5,250 (3,080) 2,170 0 0 (2,200) (2,200)
Spare Kubota Mowing Deck for Ride
on Mower P&E P0194 Parks 5,250 (3,080) 2,170 0 (2,200) (2,200)
Pole Saw P&E P7172 Parks 1,220 (1,220) 0 100 100 0 100
Pole Saw P&E P7173 Parks 1,220 (1,220) 0 100 100 0 100
149,067 (59,650) 89,417 58,100 4,700 (36,100) (31,400)
Works Plant Operations
Concrete Grinder P&E P0020 Works 3,950 (3,950) 0 500 500 0 500
Concrete Saw P&E P0126 Works 4,218 (4,218) 0 0 0 0
Trailer Tandem for Skid Steer Loader P&E P4004 Works 18,123 (18,123) 0 1,000 1,000 0 1,000
26,291 (26,291) 0 1,500 1,500 0 1,500
Ocean Mia - Lots 551, 553, 554, 555, 571 Land 470,000 470,000 2,900,000 2,430,000 0 2,430,000
Ocean Mia - Provision for sale of 26 more lotsLand 2,350,000 2,350,000 14,300,000 11,950,000 0 11,950,000
Multi Residentials Land 3,000,000 9,500,000 9,500,000 0 9,500,000
Tamala Park - Sale of Lots Land 650,000 650,000 0 650,000
5,820,000 0 2,820,000 27,350,000 24,530,000 0 24,530,000
6,166,605 (123,590) 3,043,015 27,505,900 24,537,200 (74,400) 24,462,800
Total 6,443,568 (177,376) 3,266,192 27,651,900 24,537,200 (151,500) 24,385,700
___________________________________________________________________________________________________________________
Page 6.6
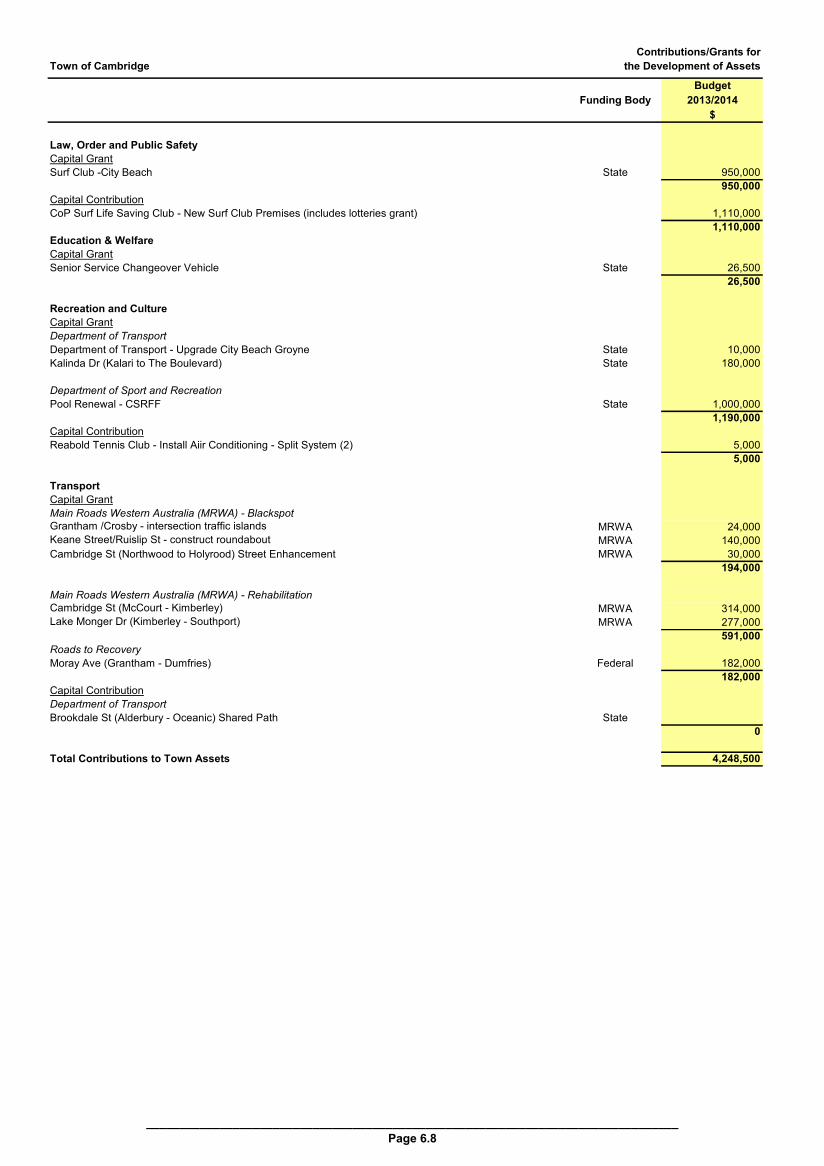
Town of Cambridge
Budget
Funding Body 2013/2014
$
Law, Order and Public Safety
Capital Grant
Surf Club -City Beach State 950,000
950,000
Capital Contribution
CoP Surf Life Saving Club - New Surf Club Premises (includes lotteries grant) 1,110,000
1,110,000
Education & Welfare
Capital Grant
Senior Service Changeover Vehicle State 26,500
26,500
Recreation and Culture
Capital Grant
Department of Transport
Department of Transport - Upgrade City Beach Groyne State 10,000
Kalinda Dr (Kalari to The Boulevard) State 180,000
Department of Sport and Recreation
Pool Renewal - CSRFF State 1,000,000
1,190,000
Capital Contribution
Reabold Tennis Club - Install Aiir Conditioning - Split System (2) 5,000
5,000
Transport
Capital Grant
Main Roads Western Australia (MRWA) - Blackspot
Grantham /Crosby - intersection traffic islands MRWA 24,000
Keane Street/Ruislip St - construct roundabout MRWA 140,000
Cambridge St (Northwood to Holyrood) Street Enhancement MRWA 30,000
194,000
Main Roads Western Australia (MRWA) - Rehabilitation
Cambridge St (McCourt - Kimberley) MRWA 314,000
Lake Monger Dr (Kimberley - Southport) MRWA 277,000
591,000
Roads to Recovery
Moray Ave (Grantham - Dumfries) Federal 182,000
182,000
Capital Contribution
Department of Transport
Brookdale St (Alderbury - Oceanic) Shared Path State
0
Total Contributions to Town Assets 4,248,500
Contributions/Grants for
the Development of Assets
________________________________________________________________________________
Page 6.8

Town of Cambridge Employee Expenses
Cost Centre Salaries Super Workers Training Car Fringe Uniform/ Other Total
Comp Allowance Benefits Tax Clothing Budget
$ $ $ $ $ $ $ $ $
General Purpose Funding
Financial Services - Rates 195,700 20,600 4,700 1,900 1,200 600 224,700
195,700 20,600 4,700 1,900 0 1,200 600 0 224,700
Governance
Members Support Services 150,000 16,600 3,600 1,500 1,700 400 173,800
Governance Management 461,600 55,000 11,100 4,500 15,900 900 549,000
Human Resources 237,600 28,900 5,600 2,300 4,200 800 50,000 329,400
Admin - General 72,100 9,900 1,700 2,100 4,400 100 90,300
Admin - Customer Services (Admin) 300,600 32,200 7,200 3,900 1,700 1,000 346,600
Admin - Records 210,000 25,400 5,000 4,100 1,700 600 246,800
Financial Services - General 335,100 37,300 7,900 3,200 4,600 800 388,900
Financial Services - Purchasing/Accounts 182,600 19,400 4,400 1,800 1,200 500 209,900
Financial Services - Payroll 126,300 17,500 3,100 1,200 1,200 400 149,700
Information Systems 366,300 39,800 8,700 16,800 1,000 4,400 900 437,900
2,442,200 282,000 58,300 41,400 1,000 41,000 6,400 50,000 2,922,300
Law, Order & Public Safety
Animal Control 101,500 12,800 2,500 1,000 3,700 700 122,200
Ranger Services - Other 104,500 13,400 2,500 1,000 4,500 600 126,500
Compliance 229,300 26,500 5,500 2,200 15,300 1,200 280,000
Community Safety 40,100 3,900 900 400 300 200 45,800
475,400 56,600 11,400 4,600 0 23,800 2,700 0 574,500
Health
Health 288,100 34,500 7,000 2,800 10,300 800 343,500
288,100 34,500 7,000 2,800 0 10,300 800 0 343,500
Education & Welfare
Cambridge Senior Services - HACC 806,100 98,600 19,500 5,100 8,900 6,300 3,200 947,700
Welfare Services 48,200 5,400 1,200 500 300 100 55,700
Youth Services 148,000 16,900 3,600 1,400 0 900 600 171,400
1,002,300 120,900 24,300 7,000 8,900 7,500 3,900 0 1,174,800
Community Amenities
Waste Management 197,000 24,000 4,800 1,900 4,900 500 233,100
Planning 566,800 57,300 13,500 5,600 8,900 1,700 653,800
Sustainability 143,000 19,600 3,500 1,400 2,300 400 170,200
Travelsmart 0 0 0 0 0 0 0 0
906,800 100,900 21,800 8,900 0 16,100 2,600 0 1,057,100
Recreation & Culture
Wembley Community Centre 78,200 7,900 1,900 800 400 300 300 89,800
Leederville Town Hall 22,100 2,200 500 200 100 25,100
The Boulevard Centre 228,600 27,000 5,600 1,700 900 900 600 265,300
Bold Park Aquatic Centre 683,900 68,200 16,300 6,500 1,700 2,500 779,100
Clubs - Leased Premises 56,200 5,200 1,300 600 0 200 63,500
Wembley Golf Complex - Operations 496,500 45,700 11,900 7,300 4,900 566,300
Wembley Golf Complex - On Costs 102,400 76,300 15,600 9,200 10,400 213,900
Wembley Golf Complex - Overheads 101,300 13,700 2,500 800 6,000 1,000 125,300
Wembley Golf Complex - Administraton 378,800 36,800 9,000 3,700 9,300 900 438,500
Wembley Golf Complex - Driving Range 189,300 17,500 4,500 1,700 0 900 213,900
Wembley Golf Complex - Pro Shop 340,800 31,400 8,200 5,700 3,500 389,600
Wembley Golf Complex - Tavern
Recreation Services 226,700 27,800 5,500 2,200 2,800 800 265,800
Cambridge Library 1,028,700 109,600 24,600 10,100 6,500 4,300 1,183,800
Quarry Amphitheatre 164,500 17,000 4,000 1,000 900 300 187,700
4,098,000 486,300 111,400 51,500 1,300 28,400 30,700 0 4,807,600
Transport
Depot 116,900 13,300 2,700 1,100 300 134,300
Parking Control 436,900 53,600 10,600 4,300 18,000 3,500 526,900
553,800 66,900 13,300 5,400 0 18,000 3,800 0 661,200
Economic Services
Building Control 318,400 36,000 7,600 3,100 11,100 1,000 377,200
318,400 36,000 7,600 3,100 0 11,100 1,000 0 377,200
Other Property & Services
Works & Engineering - On Costs 89,900 64,000 13,600 11,000 7,200 185,700
Works & Engineering - Overheads 599,200 72,700 14,500 5,900 15,800 1,400 4,000 713,500
Parks & Landscape - On Costs 190,900 152,700 27,900 22,300 16,000 409,800
Parks & Landscape - Overheads 537,300 70,100 13,000 5,200 24,600 1,200 4,000 655,400
Property Management 311,300 39,600 7,600 3,100 14,300 500 376,400
Building Management 154,800 21,200 3,700 1,500 3,000 400 184,600
Asset Management 174,300 21,600 4,300 1,700 0 500 202,400
2,057,700 441,900 84,600 50,700 0 57,700 27,200 8,000 2,727,800
Total 12,338,400 1,646,600 344,400 177,300 11,200 215,100 79,700 58,000 14,870,700
Allocated to Works and Services Jobs
Works Operations 472,800 0 0 0 0 472,800
Parks Operations 948,900 0 0 0 0 948,900
Wembley Golf Complex - course 544,000 0 0 0 0 544,000
1,965,700 0 0 0 0 0 0 0 1,965,700
14,304,100 1,646,600 344,400 177,300 11,200 215,100 79,700 58,000 16,836,400
_________________________________________________________________________________________________________________________________
Page 6.9

Town of Cambridge Information Systems Budget
Cost Daily Rate Consult Budget Actual Budget
Service Description Centre 2013/2014 Days 2012/2013 30 Jun 2013 2013/2014
$ $ $
Software Maintenance
Windows 7 Desktop support assurance Information Systems 5,000
VMWare Support Consultancy Information Systems 10,000
Windows 7 Deployment Assistance Information Systems 25,000
TechOne Technical support Information Systems 1,830 3.83 5,500 7,000
Website Support - Seamless Information Systems 1,830 0.00 3,000 0
Storage System Support/Consultancy Information Systems 5,000
8,500 3,414 52,000
TechOne (Finance One/Proclaim) Consulting Rates & Property 1,830 6.28 13,000 24,767 11,500
TechOne (Finance One/Proclaim) Consulting Finance 1,830 2.19 3,000 2,873 4,000
TechOne (Finance One/Proclaim) Consulting * Building Control 1,830 0.00 5,500 12,249 0
TechOne (Finance One/Proclaim) Consulting Document Management 1,830 2.19 0 4,000
TechOne (Finance One/Proclaim) Consulting * Health 1,830 0.00 5,000 6,213 0
TechOne (Finance One/Proclaim) Consulting * Rangers - Other 1,830 0.00 3,000 9,490 0
TechOne (Finance One/Proclaim) Consulting * Compliance 1,830 0.00 5,000 1,830 0
TechOne (Finance One/Proclaim) Consulting * Animal Control 1,830 0.00 5,000 59 0
TechOne (Finance One/Proclaim) Consulting * Parking Control 1,830 0.00 1,000 16,425 0
TechOne (Finance One/Proclaim) Consulting Project Management 1,830 0.00 0
TechOne (Finance One/Proclaim) Consulting * Planning 1,830 0.00 5,500 8,498 0
TechOne (Finance One/Proclaim) Consulting * Waste* 1,830 0.00 5,000 8,230 0
TechOne (Finance One/Proclaim) Consulting Asset Infrastructure Mgt 1,830 0.00 18,400 0
DMS Technical Support Asset Information Systems 3,000 10,500
Asset Finda Consulting and support Asset Infrastructure Mgt 30,000
AssetFinda Hosting Asset Infrastructure Mgt 5,000
* Where indicated, the 13/14 budget provision for support has been deleted due to the Ci Upgrade Project.
54,000 109,034 65,000
Total Software Maintenance 14 62,500 112,448 117,000
Software Licenses
Websense Web Filtering Information Systems 8,500 11,000
McAfee Security Suite Information Systems 6,000 8,000
Backup software Information Systems 12,000 2,000
Websense Email Filtering Information Systems 9,000 9,000
Interplan Annual Licence (600 monthly increase) Information Systems 11,000 18,000
Seamless Content Manager Information Systems 10,000 10,000
Technology One Corporate System Information Systems 20,000 26,000
Additional Microsoft Office Licences Information Systems 10,000 5,000
Additional windows licences - desktop Information Systems 2,000
Meeting room booking system replacement Information Systems 3,000
Telephony Hosting & Service Charges Information Systems (Reallocated to telephone budget in Customer Services) 0
SQL Server cals Information Systems 10,000
Ms Visio Software Licences for Licences Information Systems 1,100
Ms Project Software Licences for Licences Information Systems 1,400
Crystal Reports Software Licences Information Systems 1,600
Windows Server licences additional Information Systems 6,000
VMWare View Desktop Virtualisation Information Systems 26,000
VMware vSphere Licence Use and Support Information Systems 4,000
Email archiving & restore for Exchange 10 & Comvault Information Systems 6,000
TrackIT Help Desk Software Information Systems 1,000 1,000
VM Software for new server Information Systems 7,000
130,500 118,453 115,100
AMLIB annual maintenance/support (Library) Cambridge Library Cambridge Library 9,700 9,100
NetLoan Maintenance (Library) Cambridge Library Cambridge Library 4,200 3,400
Syndetics (Library) Cambridge Library Cambridge Library 4,700 4,400
Bibliotheca kiosks/security gate maintenance Cambridge Library 4,000
Library Wiki Cambridge Library 100 100
Z Server maintenance Cambridge Library 400
19,100 18,110 21,000
Map Info Licenses Asset Infrastructure Mgt 3,000 3,000
DMS Intramaps Licenses Asset Infrastructure Mgt 26,000 14,200
Nearmaps Asset Asset Infrastructure Mgt 25,000 12,500
Intramaps Public Hosting (Internet) Asset Infrastructure Mgt 5,500 6,800
Landgate SLIP Licence Asset Infrastructure Mgt 2,000 3,000
AssetFinda Asset Infrastructure Mgt 10,200
61,500 66,726 49,700
ECM Document Management Document Management 16,500 9,545 15,000
ECM Additional 10 Licences Document Management 0
16,500 9,545 15,000
SMS Software Maintenance Cambridge Senior Services 4,000 5,930 5,200
RMS Licence maintenance/support Wembley Community Centre 1,500 1,578 1,800
RMS Licence maintenance/support Boulevard Centre 1,500 1,578 1,800
RMS Licence maintenance/support Recreation Administration 1,500 1,578 1,800
RMS Licence maintenance/support Quarry Amphitheatre 1,500 1,578 1,800
POS Licence fee Bold Park Aquatic Centre 1,500 0 1,300
Adobe Creative Suite 6 Production Premium x 2 Youth Centre 4,000
Drafting software (Autocad) Infrastructure Works 4,000 0 3,500
Ticket Machine Software hosting Parking Control 22,000 0 22,000
Wembley Golf Course 1,000 625
Golf - Professional Shop 30,000 0
Total Software Licenses 296,100 235,247 244,000
________________________________________________________________________________Page 6.10
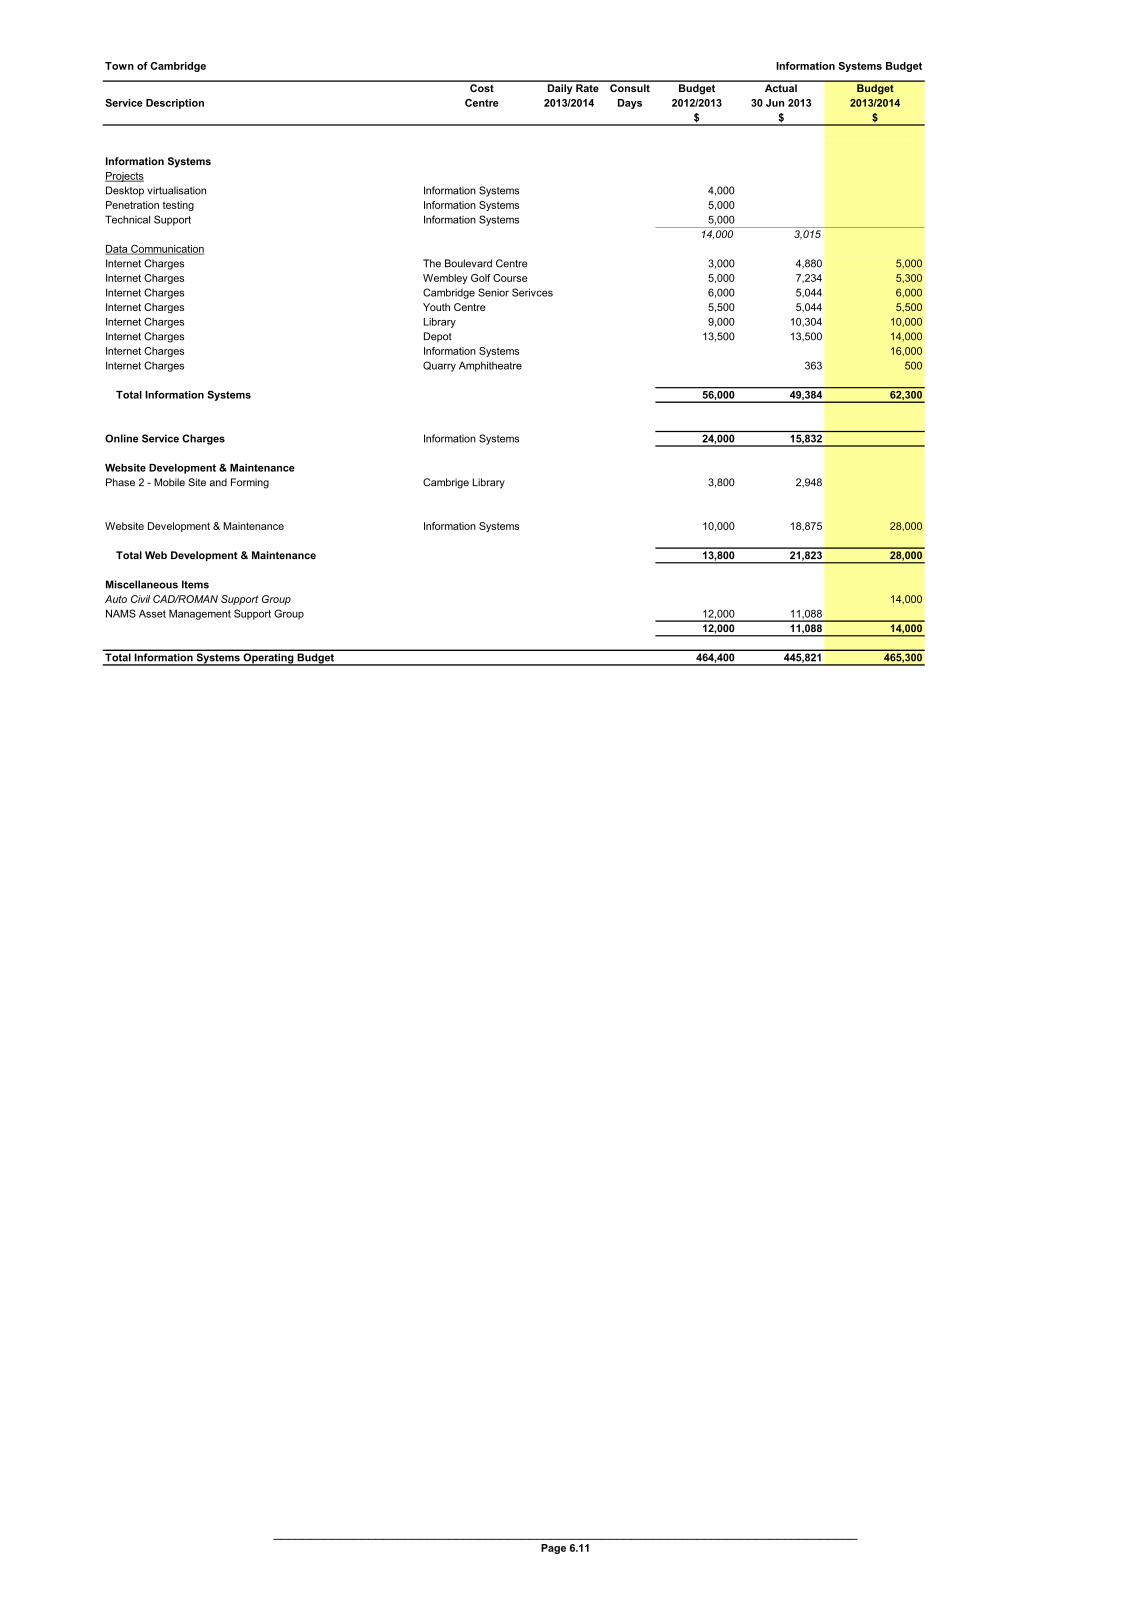
Town of Cambridge Information Systems Budget
Cost Daily Rate Consult Budget Actual Budget
Service Description Centre 2013/2014 Days 2012/2013 30 Jun 2013 2013/2014
$ $ $
Information Systems
Projects
Desktop virtualisation Information Systems 4,000
Penetration testing Information Systems 5,000
Technical Support Information Systems 5,000
14,000 3,015 0
Data Communication
Internet Charges The Boulevard Centre 3,000 4,880 5,000
Internet Charges Wembley Golf Course 5,000 7,234 5,300
Internet Charges Cambridge Senior Serivces 6,000 5,044 6,000
Internet Charges Youth Centre 5,500 5,044 5,500
Internet Charges Library 9,000 10,304 10,000
Internet Charges Depot 13,500 13,500 14,000
Internet Charges Information Systems 16,000
Internet Charges Quarry Amphitheatre 363 500
Total Information Systems 56,000 49,384 62,300
Online Service Charges Information Systems 24,000 15,832
Website Development & Maintenance
Phase 2 - Mobile Site and Forming Cambrige Library 3,800 2,948
Website Development & Maintenance Information Systems 10,000 18,875 28,000
Total Web Development & Maintenance 13,800 21,823 28,000
Miscellaneous Items
Auto Civil CAD/ROMAN Support Group 14,000
NAMS Asset Management Support Group 12,000 11,088
12,000 11,088 14,000
Total Information Systems Operating Budget 464,400 445,821 465,300
________________________________________________________________________________Page 6.11
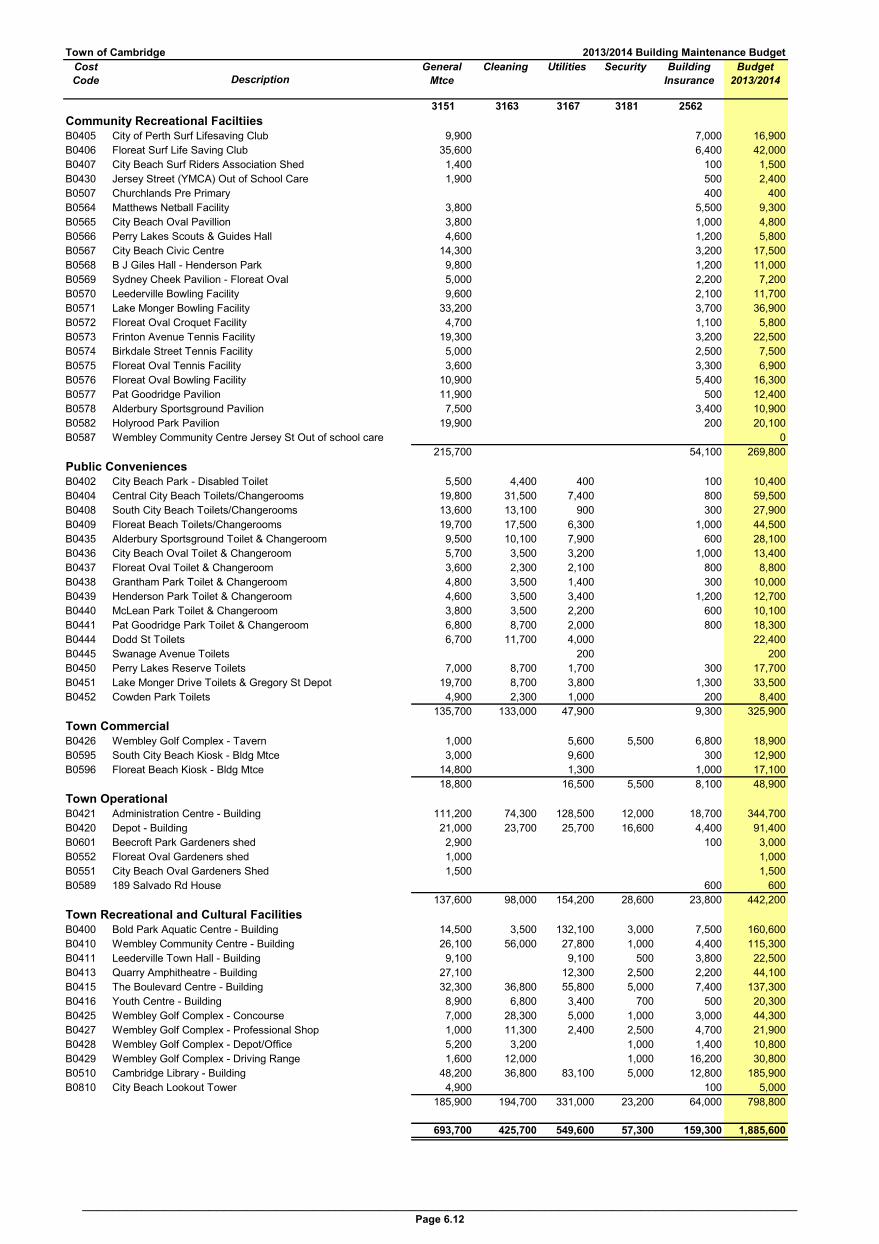
Town of Cambridge 2013/2014 Building Maintenance Budget
Cost
Code Description
General
Mtce
Cleaning Utilities Security Building
Insurance
Budget
2013/2014
3151 3163 3167 3181 2562
Community Recreational Faciltiies
B0405 City of Perth Surf Lifesaving Club 9,900 0 0 0 7,000 16,900
B0406 Floreat Surf Life Saving Club 35,600 0 0 0 6,400 42,000
B0407 City Beach Surf Riders Association Shed 1,400 0 0 0 100 1,500
B0430 Jersey Street (YMCA) Out of School Care 1,900 0 0 0 500 2,400
B0507 Churchlands Pre Primary 0 0 0 400 400
B0564 Matthews Netball Facility 3,800 0 0 0 5,500 9,300
B0565 City Beach Oval Pavillion 3,800 0 0 0 1,000 4,800
B0566 Perry Lakes Scouts & Guides Hall 4,600 0 0 0 1,200 5,800
B0567 City Beach Civic Centre 14,300 0 0 0 3,200 17,500
B0568 B J Giles Hall - Henderson Park 9,800 0 0 0 1,200 11,000
B0569 Sydney Cheek Pavilion - Floreat Oval 5,000 0 0 0 2,200 7,200
B0570 Leederville Bowling Facility 9,600 0 0 0 2,100 11,700
B0571 Lake Monger Bowling Facility 33,200 0 0 0 3,700 36,900
B0572 Floreat Oval Croquet Facility 4,700 0 0 0 1,100 5,800
B0573 Frinton Avenue Tennis Facility 19,300 0 0 0 3,200 22,500
B0574 Birkdale Street Tennis Facility 5,000 0 0 0 2,500 7,500
B0575 Floreat Oval Tennis Facility 3,600 0 0 0 3,300 6,900
B0576 Floreat Oval Bowling Facility 10,900 0 0 0 5,400 16,300
B0577 Pat Goodridge Pavilion 11,900 0 0 0 500 12,400
B0578 Alderbury Sportsground Pavilion 7,500 0 0 0 3,400 10,900
B0582 Holyrood Park Pavilion 19,900 0 0 0 200 20,100
B0587 Wembley Community Centre Jersey St Out of school care 0 0 0 0 0
215,700 0 0 0 54,100 269,800
Public Conveniences
B0402 City Beach Park - Disabled Toilet 5,500 4,400 400 0 100 10,400
B0404 Central City Beach Toilets/Changerooms 19,800 31,500 7,400 0 800 59,500
B0408 South City Beach Toilets/Changerooms 13,600 13,100 900 0 300 27,900
B0409 Floreat Beach Toilets/Changerooms 19,700 17,500 6,300 0 1,000 44,500
B0435 Alderbury Sportsground Toilet & Changeroom 9,500 10,100 7,900 0 600 28,100
B0436 City Beach Oval Toilet & Changeroom 5,700 3,500 3,200 0 1,000 13,400
B0437 Floreat Oval Toilet & Changeroom 3,600 2,300 2,100 0 800 8,800
B0438 Grantham Park Toilet & Changeroom 4,800 3,500 1,400 0 300 10,000
B0439 Henderson Park Toilet & Changeroom 4,600 3,500 3,400 0 1,200 12,700
B0440 McLean Park Toilet & Changeroom 3,800 3,500 2,200 0 600 10,100
B0441 Pat Goodridge Park Toilet & Changeroom 6,800 8,700 2,000 0 800 18,300
B0444 Dodd St Toilets 6,700 11,700 4,000 0 0 22,400
B0445 Swanage Avenue Toilets 0 0 200 0 0 200
B0450 Perry Lakes Reserve Toilets 7,000 8,700 1,700 0 300 17,700
B0451 Lake Monger Drive Toilets & Gregory St Depot 19,700 8,700 3,800 0 1,300 33,500
B0452 Cowden Park Toilets 4,900 2,300 1,000 0 200 8,400
135,700 133,000 47,900 0 9,300 325,900
Town Commercial
B0426 Wembley Golf Complex - Tavern 1,000 0 5,600 5,500 6,800 18,900
B0595 South City Beach Kiosk - Bldg Mtce 3,000 0 9,600 0 300 12,900
B0596 Floreat Beach Kiosk - Bldg Mtce 14,800 0 1,300 0 1,000 17,100
18,800 0 16,500 5,500 8,100 48,900
Town Operational
B0421 Administration Centre - Building 111,200 74,300 128,500 12,000 18,700 344,700
B0420 Depot - Building 21,000 23,700 25,700 16,600 4,400 91,400
B0601 Beecroft Park Gardeners shed 2,900 0 0 0 100 3,000
B0552 Floreat Oval Gardeners shed 1,000 0 0 0 0 1,000
B0551 City Beach Oval Gardeners Shed 1,500 0 0 0 0 1,500
B0589 189 Salvado Rd House 0 0 0 0 600 600
137,600 98,000 154,200 28,600 23,800 442,200
Town Recreational and Cultural Facilities
B0400 Bold Park Aquatic Centre - Building 14,500 3,500 132,100 3,000 7,500 160,600
B0410 Wembley Community Centre - Building 26,100 56,000 27,800 1,000 4,400 115,300
B0411 Leederville Town Hall - Building 9,100 0 9,100 500 3,800 22,500
B0413 Quarry Amphitheatre - Building 27,100 0 12,300 2,500 2,200 44,100
B0415 The Boulevard Centre - Building 32,300 36,800 55,800 5,000 7,400 137,300
B0416 Youth Centre - Building 8,900 6,800 3,400 700 500 20,300
B0425 Wembley Golf Complex - Concourse 7,000 28,300 5,000 1,000 3,000 44,300
B0427 Wembley Golf Complex - Professional Shop 1,000 11,300 2,400 2,500 4,700 21,900
B0428 Wembley Golf Complex - Depot/Office 5,200 3,200 0 1,000 1,400 10,800
B0429 Wembley Golf Complex - Driving Range 1,600 12,000 0 1,000 16,200 30,800
B0510 Cambridge Library - Building 48,200 36,800 83,100 5,000 12,800 185,900
B0810 City Beach Lookout Tower 4,900 0 0 0 100 5,000
185,900 194,700 331,000 23,200 64,000 798,800
693,700 425,700 549,600 57,300 159,300 1,885,600
________________________________________________________________________________________________Page 6.12

Town of Cambridge Job Costing Information
Annual 2013/2014 BUDGET
Description Account Budget Actual Overheads Plant Op Materials & Other Total
2012/2013 30 Jun 2013 on Salary Costs Contracts Expenses Budget
PARKS OPERATIONS
Operating Expenditure
Ocean Beaches - Grounds 51300 674,100 710,354 113,000 152,600 0 166,700 30,000 19,000 0 481,300
Sports Grounds - Grounds 54000 674,100 569,129 138,400 186,800 0 105,400 30,000 19,000 1,700 481,300
Parks - Grounds 56000 738,800 589,508 152,300 172,900 0 107,800 36,400 48,300 1,700 519,400
Road Reserves 71000 2,181,400 1,860,109 486,300 656,600 0 1,006,500 93,400 100,400 4,100 2,347,300
Other Cost Centers other than Parks 10,100 13,600 0 47,300 0 1,900 0 72,900
4,268,400 3,729,100 900,100 1,182,500 0 1,433,700 189,800 188,600 7,500 3,902,200
Non-Capital Expenditure
Ocean Beaches - Grounds 51300 53,400 53,623 0 0 0 0 0 0 0 0
Sports Grounds - Grounds 54000 53,400 11,273 0 0 0 40,000 0 0 0 40,000
Parks - Grounds 56000 53,000 35,277 0 0 0 52,300 0 0 0 52,300
Road Reserves 71000 381,000 219,214 0 0 0 294,000 0 0 0 294,000
540,800 319,387 0 0 0 386,300 0 0 0 386,300
Capital Expenditure
Building Construction 3450 7,200,000 8,568,241 0 0 0 0 0 0 0 0
Beaches Construction 3458 543,300 34,998 0 0 0 94,300 0 0 0 94,300
Sportsgrounds Construction 3459 543,300 10,450 0 0 0 116,000 0 0 0 116,000
Parks Construction 3460 1,158,400 661,354 0 0 0 580,200 0 0 0 580,200
Road Reserves Construction 3461 1,001,500 223,360 0 0 0 460,000 0 0 0 460,000
10,446,500 9,498,404 0 0 0 1,250,500 0 0 0 1,250,500
TOTAL PARKS OPERATIONS 15,255,700 13,546,891 900,100 1,182,500 0 3,070,500 189,800 188,600 7,500 5,539,000
WORKS OPERATIONS
Operating Expenditure
Road Infrastructure 70000 4,342,100 4,342,100 245,000 533,500 0 545,200 670,000 174,000 31,000 2,198,700
4,342,100 4,342,100 245,000 533,500 0 545,200 670,000 174,000 31,000 2,198,700
Non-Capital Expenditure
Road Infrastructure 70000 348,400 248,429 0 0 0 0 0 0 0 0
348,400 248,429 0 0 0 0 0 0 0 0
Capital Expenditure
Road Works Construction 3451 2,541,700 477,199 0 0 0 2,053,500 0 0 0 2,053,500
Right of Ways Construction 3452 2,541,700 455,658 102,200 235,100 0 220,500 0 42,000 0 599,800
Road Surfacing Construction 3454 463,200 189,971 0 0 0 355,000 0 0 0 355,000
Drainage Construction 3455 2,572,200 1,385,782 59,900 137,800 0 617,400 0 21,000 0 836,100
Footpath/Cycleway Construction 3456 847,000 150,280 18,700 43,000 0 353,500 0 12,800 0 428,000
Bus Shelters Construction 3463 1,233,300 830,529 37,700 86,700 0 25,900 0 13,000 0 163,300
10,199,100 3,489,419 218,500 502,600 0 3,625,800 0 88,800 0 4,435,700
TOTAL WORKS OPERATIONS 14,889,600 8,079,947 463,500 1,036,100 0 4,171,000 670,000 262,800 31,000 6,634,400
WEMBLEY GOLF COURSE OPERATIONS
Operating Expenditure
Course Fairways 455,854 264,281 251,000 175,000 363,000 1,509,135
Range Fairway 44,621 24,940 25,000 15,000 10,000 119,560
0 0 500,474 289,221 0 276,000 190,000 373,000 0 1,628,695
Non Captal Works
0 0 0 0 0 148,500 0 0 0 148,500
Capital Expenditure
0 0 0 0 0 72,000 0 0 0 72,000
TOTAL GOLF COURSE OPERATIONS 0 0 500,474 289,221 0 496,500 190,000 373,000 0 1,849,195
Salary Utilities Plant
Page 6.14
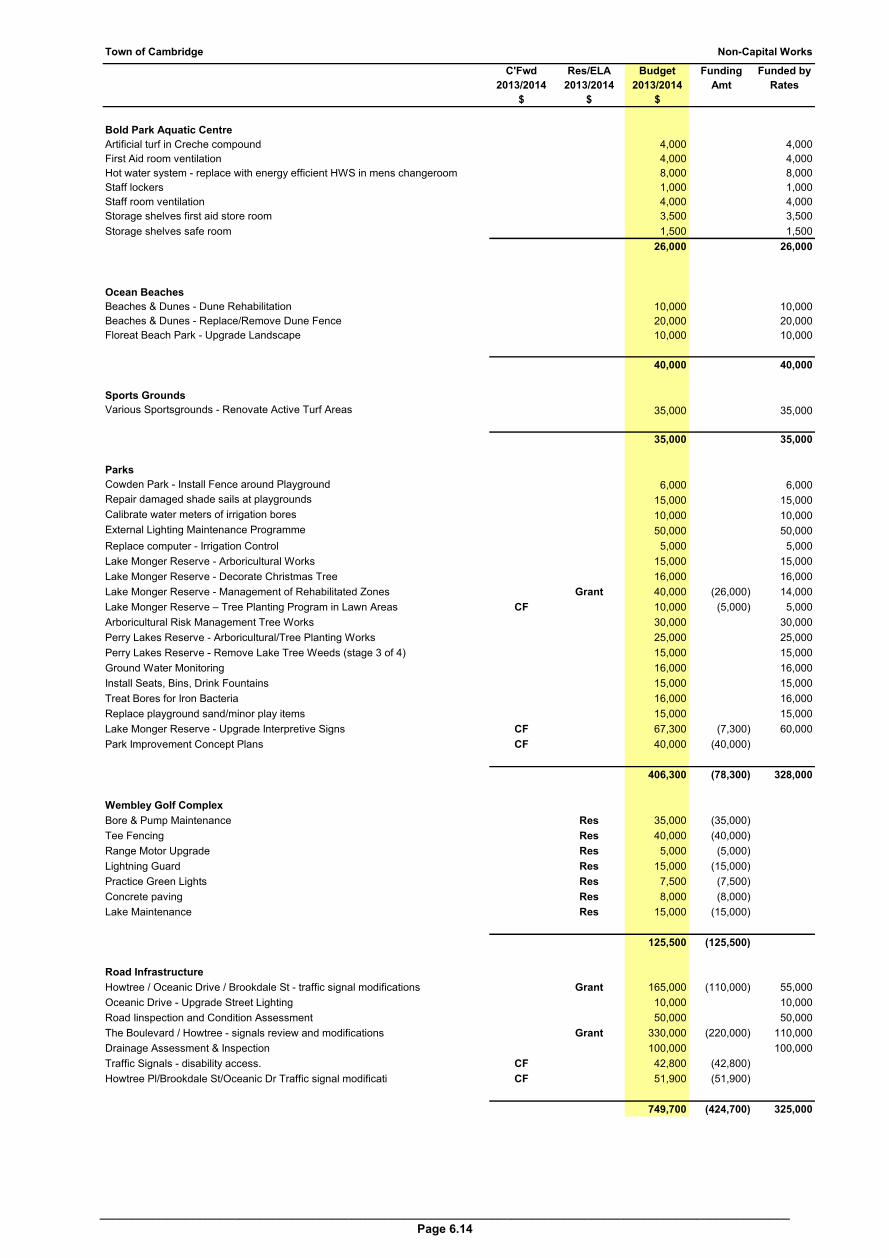
Town of Cambridge Non-Capital Works
C'Fwd Res/ELA Budget Funding Funded by
2013/2014 2013/2014 2013/2014 Amt Rates
$ $ $
Bold Park Aquatic Centre
Artificial turf in Creche compound 4,000 4,000
First Aid room ventilation 4,000 4,000
Hot water system - replace with energy efficient HWS in mens changeroom 8,000 8,000
Staff lockers 1,000 1,000
Staff room ventilation 4,000 4,000
Storage shelves first aid store room 3,500 3,500
Storage shelves safe room 1,500 1,500
0 26,000 0 26,000
Ocean Beaches
Beaches & Dunes - Dune Rehabilitation 10,000 10,000
Beaches & Dunes - Replace/Remove Dune Fence 20,000 20,000
Floreat Beach Park - Upgrade Landscape 10,000 10,000
0 40,000 0 40,000
Sports Grounds
Various Sportsgrounds - Renovate Active Turf Areas 35,000 35,000
0 35,000 0 35,000
Parks
Cowden Park - Install Fence around Playground 6,000 6,000
Repair damaged shade sails at playgrounds 15,000 15,000
Calibrate water meters of irrigation bores 10,000 10,000
External Lighting Maintenance Programme 50,000 50,000
Replace computer - Irrigation Control 5,000 5,000
Lake Monger Reserve - Arboricultural Works 15,000 15,000
Lake Monger Reserve - Decorate Christmas Tree 16,000 16,000
Lake Monger Reserve - Management of Rehabilitated Zones Grant 40,000 (26,000) 14,000
Lake Monger Reserve – Tree Planting Program in Lawn Areas CF 10,000 (5,000) 5,000
Arboricultural Risk Management Tree Works 30,000 30,000
Perry Lakes Reserve - Arboricultural/Tree Planting Works 25,000 25,000
Perry Lakes Reserve - Remove Lake Tree Weeds (stage 3 of 4) 15,000 15,000
Ground Water Monitoring 16,000 16,000
Install Seats, Bins, Drink Fountains 15,000 15,000
Treat Bores for Iron Bacteria 16,000 16,000
Replace playground sand/minor play items 15,000 15,000
Lake Monger Reserve - Upgrade Interpretive Signs CF 67,300 (7,300) 60,000
Park Improvement Concept Plans CF 40,000 (40,000)
0 406,300 (78,300) 328,000
Wembley Golf Complex
Bore & Pump Maintenance Res 35,000 (35,000) 0
Tee Fencing Res 40,000 (40,000) 0
Range Motor Upgrade Res 5,000 (5,000) 0
Lightning Guard Res 15,000 (15,000) 0
Practice Green Lights Res 7,500 (7,500) 0
Concrete paving Res 8,000 (8,000) 0
Lake Maintenance Res 15,000 (15,000) 0
0 125,500 (125,500) 0
Road Infrastructure
Howtree / Oceanic Drive / Brookdale St - traffic signal modifications Grant 165,000 (110,000) 55,000
Oceanic Drive - Upgrade Street Lighting 10,000 10,000
Road Iinspection and Condition Assessment 50,000 50,000
The Boulevard / Howtree - signals review and modifications Grant 330,000 (220,000) 110,000
Drainage Assessment & Inspection 100,000 100,000
Traffic Signals - disability access. CF 42,800 (42,800)
Howtree Pl/Brookdale St/Oceanic Dr Traffic signal modificati CF 51,900 (51,900)
0 749,700 (424,700) 325,000
________________________________________________________________________________________________________
Page 6.14
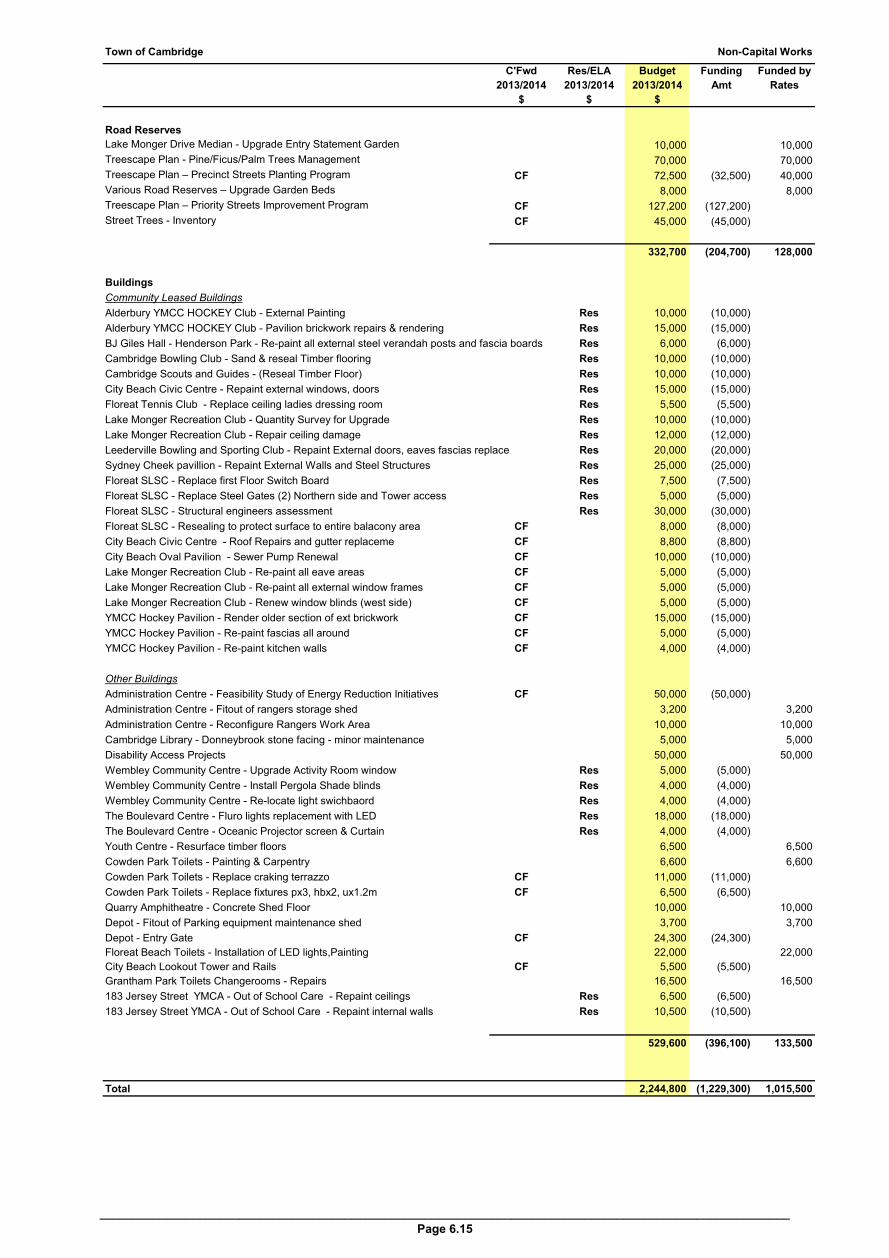
Town of Cambridge Non-Capital Works
C'Fwd Res/ELA Budget Funding Funded by
2013/2014 2013/2014 2013/2014 Amt Rates
$ $ $
Road Reserves
Lake Monger Drive Median - Upgrade Entry Statement Garden 10,000 10,000
Treescape Plan - Pine/Ficus/Palm Trees Management 70,000 70,000
Treescape Plan – Precinct Streets Planting Program CF 72,500 (32,500) 40,000
Various Road Reserves – Upgrade Garden Beds 8,000 8,000
Treescape Plan – Priority Streets Improvement Program CF 127,200 (127,200)
Street Trees - Inventory CF 45,000 (45,000)
0 332,700 (204,700) 128,000
Buildings
Community Leased Buildings
Alderbury YMCC HOCKEY Club - External Painting Res 10,000 (10,000)
Alderbury YMCC HOCKEY Club - Pavilion brickwork repairs & rendering Res 15,000 (15,000)
BJ Giles Hall - Henderson Park - Re-paint all external steel verandah posts and fascia boards Res 6,000 (6,000)
Cambridge Bowling Club - Sand & reseal Timber flooring Res 10,000 (10,000)
Cambridge Scouts and Guides - (Reseal Timber Floor) Res 10,000 (10,000)
City Beach Civic Centre - Repaint external windows, doors Res 15,000 (15,000)
Floreat Tennis Club - Replace ceiling ladies dressing room Res 5,500 (5,500)
Lake Monger Recreation Club - Quantity Survey for Upgrade Res 10,000 (10,000)
Lake Monger Recreation Club - Repair ceiling damage Res 12,000 (12,000)
Leederville Bowling and Sporting Club - Repaint External doors, eaves fascias replace Res 20,000 (20,000)
Sydney Cheek pavillion - Repaint External Walls and Steel Structures Res 25,000 (25,000)
Floreat SLSC - Replace first Floor Switch Board Res 7,500 (7,500)
Floreat SLSC - Replace Steel Gates (2) Northern side and Tower access Res 5,000 (5,000)
Floreat SLSC - Structural engineers assessment Res 30,000 (30,000)
Floreat SLSC - Resealing to protect surface to entire balacony area CF 8,000 (8,000)
City Beach Civic Centre - Roof Repairs and gutter replaceme CF 8,800 (8,800)
City Beach Oval Pavilion - Sewer Pump Renewal CF 10,000 (10,000)
Lake Monger Recreation Club - Re-paint all eave areas CF 5,000 (5,000)
Lake Monger Recreation Club - Re-paint all external window frames CF 5,000 (5,000)
Lake Monger Recreation Club - Renew window blinds (west side) CF 5,000 (5,000)
YMCC Hockey Pavilion - Render older section of ext brickwork CF 15,000 (15,000)
YMCC Hockey Pavilion - Re-paint fascias all around CF 5,000 (5,000)
YMCC Hockey Pavilion - Re-paint kitchen walls CF 4,000 (4,000)
Other Buildings
Administration Centre - Feasibility Study of Energy Reduction Initiatives CF 50,000 (50,000)
Administration Centre - Fitout of rangers storage shed 3,200 3,200
Administration Centre - Reconfigure Rangers Work Area 10,000 10,000
Cambridge Library - Donneybrook stone facing - minor maintenance 5,000 5,000
Disability Access Projects 50,000 50,000
Wembley Community Centre - Upgrade Activity Room window Res 5,000 (5,000)
Wembley Community Centre - Install Pergola Shade blinds Res 4,000 (4,000)
Wembley Community Centre - Re-locate light swichbaord Res 4,000 (4,000)
The Boulevard Centre - Fluro lights replacement with LED Res 18,000 (18,000)
The Boulevard Centre - Oceanic Projector screen & Curtain Res 4,000 (4,000)
Youth Centre - Resurface timber floors 6,500 6,500
Cowden Park Toilets - Painting & Carpentry 6,600 6,600
Cowden Park Toilets - Replace craking terrazzo CF 11,000 (11,000)
Cowden Park Toilets - Replace fixtures px3, hbx2, ux1.2m CF 6,500 (6,500)
Quarry Amphitheatre - Concrete Shed Floor 10,000 10,000
Depot - Fitout of Parking equipment maintenance shed 3,700 3,700
Depot - Entry Gate CF 24,300 (24,300)
Floreat Beach Toilets - Installation of LED lights,Painting 22,000 22,000
City Beach Lookout Tower and Rails CF 5,500 (5,500)
Grantham Park Toilets Changerooms - Repairs 16,500 16,500
183 Jersey Street YMCA - Out of School Care - Repaint ceilings Res 6,500 (6,500)
183 Jersey Street YMCA - Out of School Care - Repaint internal walls Res 10,500 (10,500)
0 529,600 (396,100) 133,500
Total 0 2,244,800 (1,229,300) 1,015,500
________________________________________________________________________________________________________
Page 6.15

Town of Cambridge Programs
Actual Budget Actual C'Fwd Res/ELA Budget Funding Funded by
2011/2012 2012/2013 30 June 2013 2013/2014 2013/2014 2013/2014 Amt Rates
$ $ $ $ $ $
Governance Management
Regional Collaboration 1,250 25,000 0 15,000 25,000 25,000
Corporate Style Guide 5,006 4,000 3,133 0 2,000 2,000
Mediation Services - Citizens Advice 500 500 500 0 500 500
Underground Power strategy 0 15,000 23,298 0 0 0
Disaster and Appeal Donations 3,000 0 0 0 0 0
9,756 44,500 26,931 15,000 0 27,500 0 27,500
Human Resources
Employee Assistance Program 5,385 5,500 5,250 5,500 5,500
Employee Health Program 4,680 5,000 1,860 5,000 5,000
Employee Recognition Scheme 3,870 6,000 3,600 4,000 4,000
13,935 16,500 10,710 0 0 14,500 0 14,500
Ranger Services - Other
Emergency Management 0 500 484 1,200 1,200
0 500 0 1,200 0 1,200
Community Safety
Crime Deterrent Programs(Graffiti Removal/Beat Initiatives) 71,938 70,000 57,437 75,000 75,000
Youth & Child Safety 11,764 14,000 12,458 14,000 14,000
Community Safety Other 16,190 25,800 23,142 10,000 10,000
99,892 109,800 93,037 0 0 99,000 0 99,000
Welfare Services
Disability Services 5,300 39,000 25,369 24,000 24,000
5,300 39,000 25,369 0 0 24,000 0 24,000
Youth Services
Cultural and Recreation 2,450 2,000 67 1,000 1,000
School Vacation 1,231 1,500 2,591 1,000 1,000
Youth Leadership and Skills 48 1,000 500 500
Special Events and Celebrations 1,394 1,500 293 1,000 1,000
Urban Art Project 1,648 2,000 1,775 2,000 2,000
Festival "Xposure" 2,735 (500) 2,711 Grant 6,000 (6,000) 0
Youth Advisory Council 169 1,000 196 500 500
Youth Strategy/Needs Assessment 15,000 15,000
Skate Park Project 5,964 28,000 23,630 4,500 4,500
15,639 36,500 31,264 0 0 31,500 (6,000) 25,500
Waste Management
E-Waste Collection 0 0 0 32,000 32,000
Exchange from 240L to 120 general bins 36,211 22,000 19,452 0
Replace St Be Tidy Bins 4,300 7,500 1,082 8,000 8,000
Waste Education Program 130,839 150,000 140,127 150,000 150,000
WMRC Contribution for HHW 5,000 6,000 2,727 0
School Education Program 12,500 0 11,000 11,000
MRC Legal Fee 9,337 0 0 0
Bin Data Base Review (general & recycle) 24,000 0 0 0
Exchange Program Administration 0 0 0 81,000 81,000
209,687 198,000 163,389 0 0 282,000 0 282,000
Planning
Holyrood St Commemorative Works 42,300 7,200 16,735 10,000 10,000
Leederville Link Contribution 0 60,000 0 60,000 60,000
42,300 67,200 16,735 0 0 70,000 0 70,000
Sustainability Management
Sustainability Programs 27,796 34,500 37,842 0 35,000 35,000
Travel Smart Initiatives 33,769 86,000 59,433 27,000 27,000 27,000
WESROC Sustainability Project 30,441 40,500 35,219 4,500 52,500 52,500
Biodiversity (see also below for other works) 10,541 39,700 33,845 6,000 76,000 76,000
Biodiversity - Action Plan Rehab Works (Parks Prgm) 19,433 30,000 22,565 7,500 7,500 7,500
Water Conservation & Efficiency 3,750 9,200 8,425 0 7,000 7,000
Carbon Neutral Cambridge 4,395 0 0 0 0
130,126 239,900 197,330 45,000 0 205,000 0 205,000
________________________________________________________________________________________________________________
Page 6.16
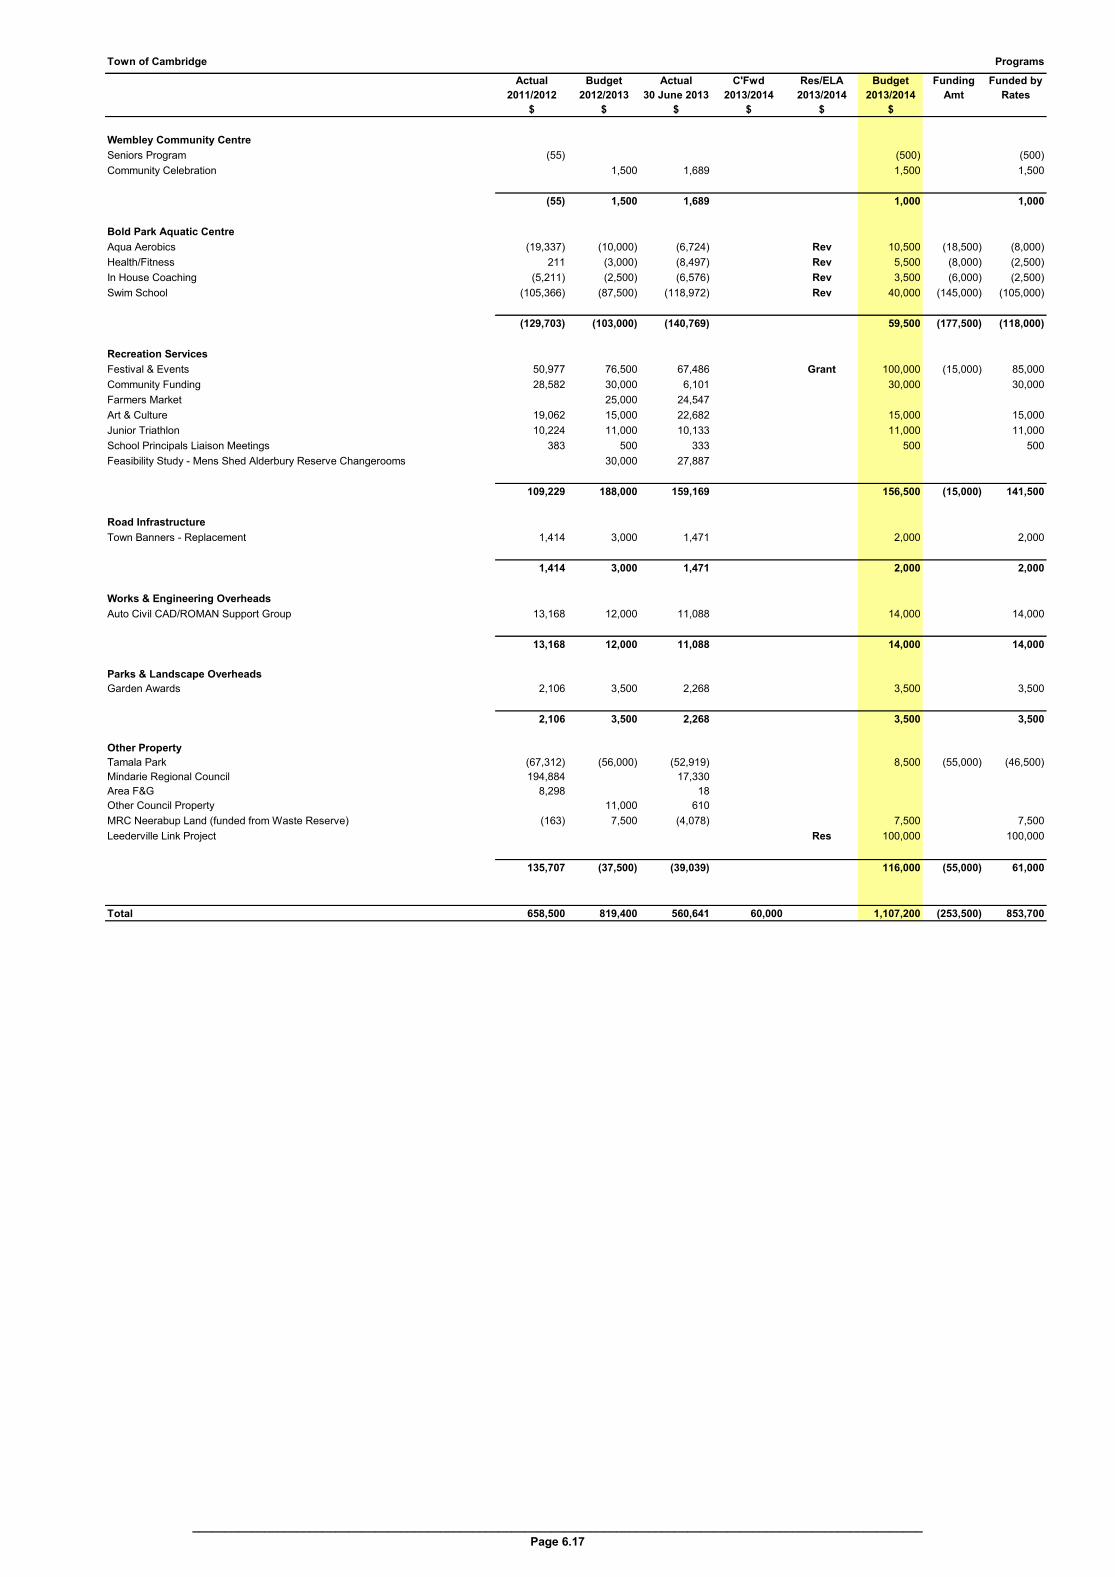
Town of Cambridge Programs
Actual Budget Actual C'Fwd Res/ELA Budget Funding Funded by
2011/2012 2012/2013 30 June 2013 2013/2014 2013/2014 2013/2014 Amt Rates
$ $ $ $ $ $
Wembley Community Centre
Seniors Program (55) 0 0 (500) (500)
Community Celebration 0 1,500 1,689 1,500 1,500
(55) 1,500 1,689 0 0 1,000 0 1,000
Bold Park Aquatic Centre
Aqua Aerobics (19,337) (10,000) (6,724) Rev 10,500 (18,500) (8,000)
Health/Fitness 211 (3,000) (8,497) Rev 5,500 (8,000) (2,500)
In House Coaching (5,211) (2,500) (6,576) Rev 3,500 (6,000) (2,500)
Swim School (105,366) (87,500) (118,972) Rev 40,000 (145,000) (105,000)
(129,703) (103,000) (140,769) 0 0 59,500 (177,500) (118,000)
Recreation Services
Festival & Events 50,977 76,500 67,486 0 Grant 100,000 (15,000) 85,000
Community Funding 28,582 30,000 6,101 0 30,000 30,000
Farmers Market 0 25,000 24,547 0 0
Art & Culture 19,062 15,000 22,682 0 15,000 15,000
Junior Triathlon 10,224 11,000 10,133 0 11,000 11,000
School Principals Liaison Meetings 383 500 333 0 500 500
Feasibility Study - Mens Shed Alderbury Reserve Changerooms 0 30,000 27,887 0 0
109,229 188,000 159,169 0 0 156,500 (15,000) 141,500
Road Infrastructure
Town Banners - Replacement 1,414 3,000 1,471 2,000 2,000
1,414 3,000 1,471 0 0 2,000 0 2,000
Works & Engineering Overheads
Auto Civil CAD/ROMAN Support Group 13,168 12,000 11,088 14,000 14,000
13,168 12,000 11,088 0 0 14,000 0 14,000
Parks & Landscape Overheads
Garden Awards 2,106 3,500 2,268 3,500 3,500
2,106 3,500 2,268 0 0 3,500 0 3,500
Other Property
Tamala Park (67,312) (56,000) (52,919) 8,500 (55,000) (46,500)
Mindarie Regional Council 194,884 0 17,330 0
Area F&G 8,298 0 18 0
Other Council Property 0 11,000 610 0
MRC Neerabup Land (funded from Waste Reserve) (163) 7,500 (4,078) 7,500 7,500
Leederville Link Project 0 0 0 Res 100,000 100,000
135,707 (37,500) (39,039) 0 0 116,000 (55,000) 61,000
Total 658,500 819,400 560,641 60,000 0 1,107,200 (253,500) 853,700
________________________________________________________________________________________________________________
Page 6.17
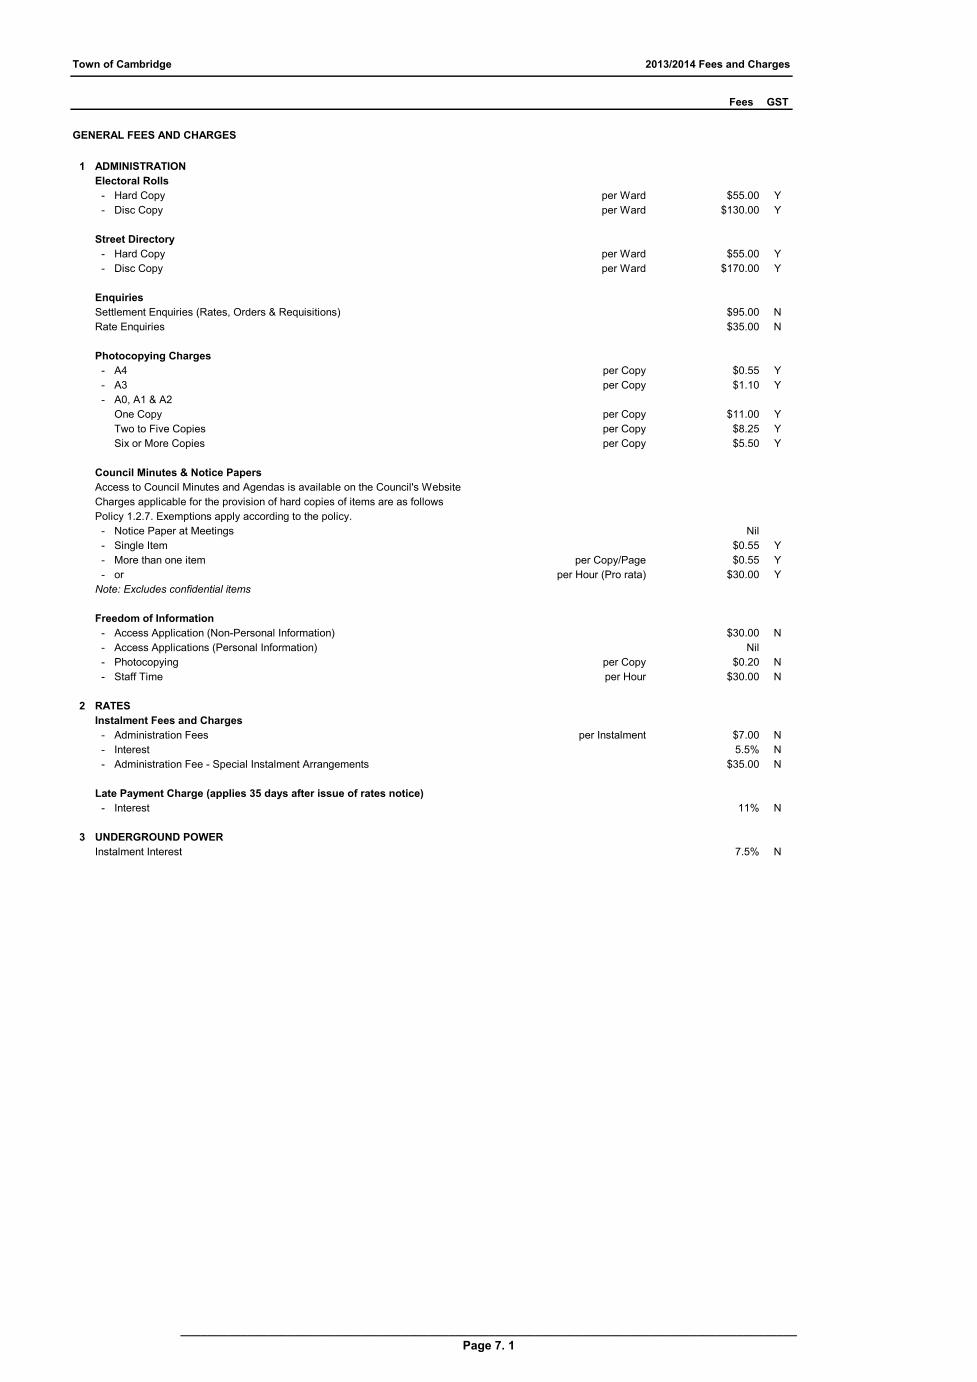
Town of Cambridge 2013/2014 Fees and Charges
Fees GST
GENERAL FEES AND CHARGES
1 ADMINISTRATION
Electoral Rolls
- Hard Copy per Ward $55.00 Y
- Disc Copy per Ward $130.00 Y
Street Directory
- Hard Copy per Ward $55.00 Y
- Disc Copy per Ward $170.00 Y
Enquiries
Settlement Enquiries (Rates, Orders & Requisitions) $95.00 N
Rate Enquiries $35.00 N
Photocopying Charges
- A4 per Copy $0.55 Y
- A3 per Copy $1.10 Y
- A0, A1 & A2
One Copy per Copy $11.00 Y
Two to Five Copies per Copy $8.25 Y
Six or More Copies per Copy $5.50 Y
Council Minutes & Notice Papers
Access to Council Minutes and Agendas is available on the Council's Website
Charges applicable for the provision of hard copies of items are as follows
Policy 1.2.7. Exemptions apply according to the policy.
- Notice Paper at Meetings Nil
- Single Item $0.55 Y
- More than one item per Copy/Page $0.55 Y
- or per Hour (Pro rata) $30.00 Y
Note: Excludes confidential items
Freedom of Information
- Access Application (Non-Personal Information) $30.00 N
- Access Applications (Personal Information) Nil
- Photocopying per Copy $0.20 N
- Staff Time per Hour $30.00 N
2 RATES
Instalment Fees and Charges
- Administration Fees per Instalment $7.00 N
- Interest 5.5% N
- Administration Fee - Special Instalment Arrangements $35.00 N
Late Payment Charge (applies 35 days after issue of rates notice)
- Interest 11% N
3 UNDERGROUND POWER
Instalment Interest 7.5% N
____________________________________________________________________________________________
Page 7. 1
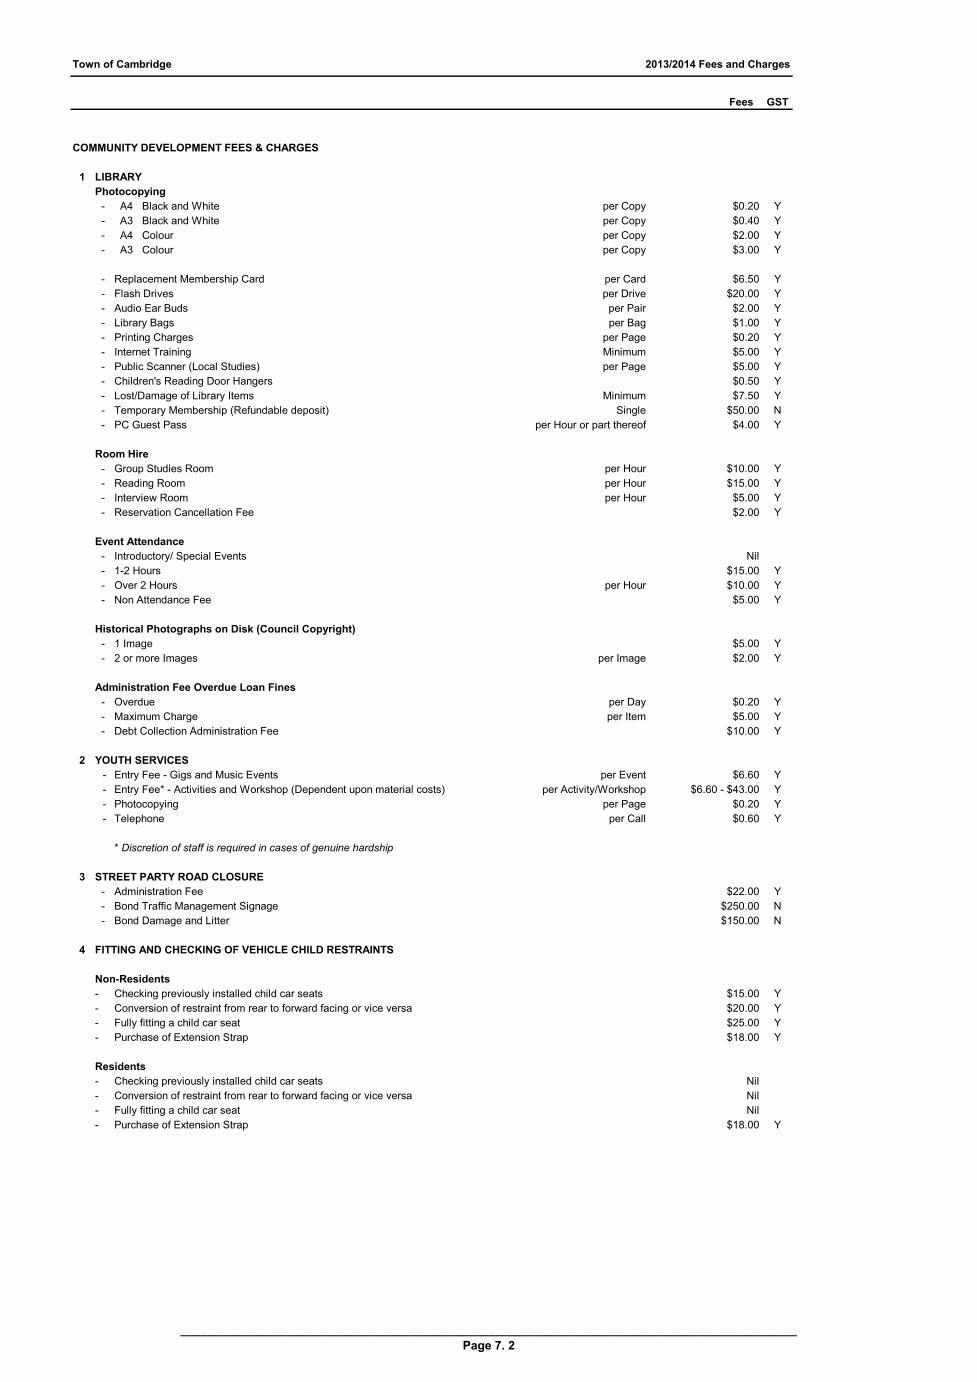
Town of Cambridge 2013/2014 Fees and Charges
Fees GST
COMMUNITY DEVELOPMENT FEES & CHARGES
1 LIBRARY
Photocopying
- A4 Black and White per Copy $0.20 Y
- A3 Black and White per Copy $0.40 Y
- A4 Colour per Copy $2.00 Y
- A3 Colour per Copy $3.00 Y
- Replacement Membership Card per Card $6.50 Y
- Flash Drives per Drive $20.00 Y
- Audio Ear Buds per Pair $2.00 Y
- Library Bags per Bag $1.00 Y
- Printing Charges per Page $0.20 Y
- Internet Training Minimum $5.00 Y
- Public Scanner (Local Studies) per Page $5.00 Y
- Children's Reading Door Hangers $0.50 Y
- Lost/Damage of Library Items Minimum $7.50 Y
- Temporary Membership (Refundable deposit) Single $50.00 N
- PC Guest Pass per Hour or part thereof $4.00 Y
Room Hire
- Group Studies Room per Hour $10.00 Y
- Reading Room per Hour $15.00 Y
- Interview Room per Hour $5.00 Y
- Reservation Cancellation Fee $2.00 Y
Event Attendance
- Introductory/ Special Events Nil
- 1-2 Hours $15.00 Y
- Over 2 Hours per Hour $10.00 Y
- Non Attendance Fee $5.00 Y
Historical Photographs on Disk (Council Copyright)
- 1 Image $5.00 Y
- 2 or more Images per Image $2.00 Y
Administration Fee Overdue Loan Fines
- Overdue per Day $0.20 Y
- Maximum Charge per Item $5.00 Y
- Debt Collection Administration Fee $10.00 Y
2 YOUTH SERVICES
- Entry Fee - Gigs and Music Events per Event $6.60 Y
- Entry Fee* - Activities and Workshop (Dependent upon material costs) per Activity/Workshop $6.60 - $43.00 Y
- Photocopying per Page $0.20 Y
- Telephone per Call $0.60 Y
* Discretion of staff is required in cases of genuine hardship
3 STREET PARTY ROAD CLOSURE
- Administration Fee $22.00 Y
- Bond Traffic Management Signage $250.00 N
- Bond Damage and Litter $150.00 N
4 FITTING AND CHECKING OF VEHICLE CHILD RESTRAINTS
Non-Residents
- Checking previously installed child car seats $15.00 Y
- Conversion of restraint from rear to forward facing or vice versa $20.00 Y
- Fully fitting a child car seat $25.00 Y
- Purchase of Extension Strap $18.00 Y
Residents
- Checking previously installed child car seats Nil
- Conversion of restraint from rear to forward facing or vice versa Nil
- Fully fitting a child car seat Nil
- Purchase of Extension Strap $18.00 Y
____________________________________________________________________________________________
Page 7. 2

Town of Cambridge 2013/2014 Fees and Charges
Fees GST
COMMUNITY DEVELOPMENT FEES & CHARGES Cont'd….
5 CAMBRIDGE SENIOR SERVICES (HACC)
Senior Services
- Centre-Based Program - Activities $8.00 N
- Centre-Based Program - Meal and Refreshments $8.50 N
- Home Based Programs - Personal Care, Shopping per Service $8.00 N
- Allied Health - Podiatry (Centre) per Session $30.00 Y
- Allied Health - Podiatry (Domiciliary) per Session $30.00 Y
- Home Maintenance per Hour $8.00 Y
- Home Based Programs - Home Respite, Domestic Assistance per Hour $8.00 Y
- Outings (within parameters of the Day program) Full cost recovery Y
- Visiting group per Person $6.00 Y
- Extended Excursions (overnight trips, 4 nights 5 days) up to $300.00 Y
- Transport up to 10 kms (one way trip) per Person $5.00 Y
- Transport up to11-30 kms (one way trip) per Person $8.00 Y
- Transport - Centre Based Program (one way trip) per Person $2.50 Y
Fee Limit
- Level One - Full Pensioner or equivalent pension eligibility income per Week $64.00 Y
- Level Two - Part Pensioner or equivalent pension eligibility income per Week $154.00 Y
(Fee Limit - Applicable to clients with multipe needs (with the exception of meals, transport, podiatry, allied health and home maintenance)
Note: Funding for Respite Services is conditional upon Council not
denying access to clients on the grounds of financial hardship.
____________________________________________________________________________________________
Page 7. 3
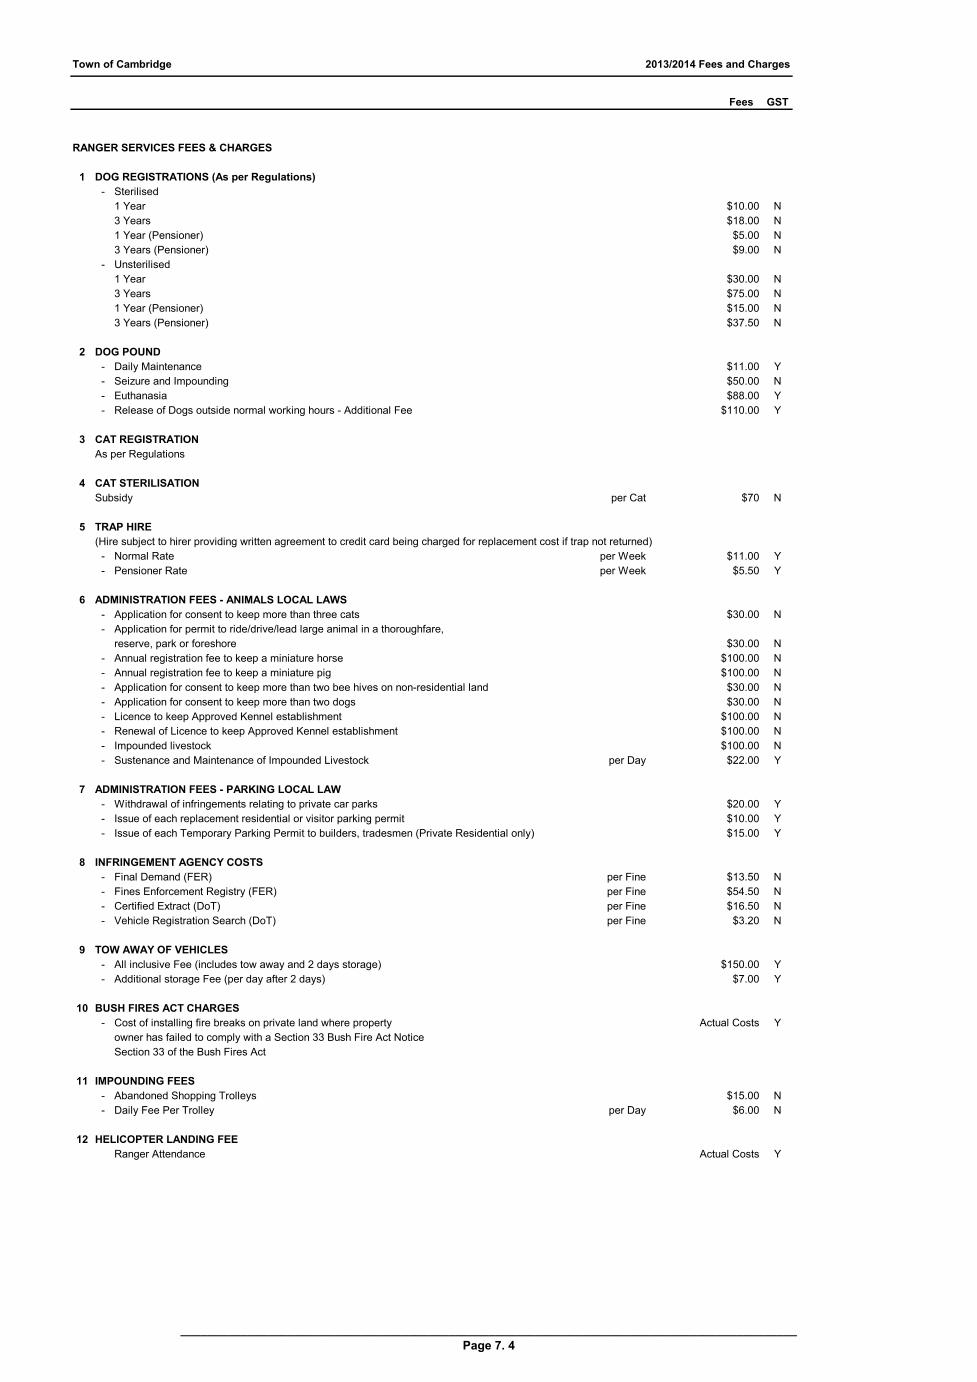
Town of Cambridge 2013/2014 Fees and Charges
Fees GST
RANGER SERVICES FEES & CHARGES
1 DOG REGISTRATIONS (As per Regulations)
- Sterilised
1 Year $10.00 N
3 Years $18.00 N
1 Year (Pensioner) $5.00 N
3 Years (Pensioner) $9.00 N
- Unsterilised
1 Year $30.00 N
3 Years $75.00 N
1 Year (Pensioner) $15.00 N
3 Years (Pensioner) $37.50 N
2 DOG POUND
- Daily Maintenance $11.00 Y
- Seizure and Impounding $50.00 N
- Euthanasia $88.00 Y
- Release of Dogs outside normal working hours - Additional Fee $110.00 Y
3 CAT REGISTRATION
As per Regulations
4 CAT STERILISATION
Subsidy per Cat $70 N
5 TRAP HIRE
(Hire subject to hirer providing written agreement to credit card being charged for replacement cost if trap not returned)
- Normal Rate per Week $11.00 Y
- Pensioner Rate per Week $5.50 Y
6 ADMINISTRATION FEES - ANIMALS LOCAL LAWS
- Application for consent to keep more than three cats $30.00 N
- Application for permit to ride/drive/lead large animal in a thoroughfare,
reserve, park or foreshore $30.00 N
- Annual registration fee to keep a miniature horse $100.00 N
- Annual registration fee to keep a miniature pig $100.00 N
- Application for consent to keep more than two bee hives on non-residential land $30.00 N
- Application for consent to keep more than two dogs $30.00 N
- Licence to keep Approved Kennel establishment $100.00 N
- Renewal of Licence to keep Approved Kennel establishment $100.00 N
- Impounded livestock $100.00 N
- Sustenance and Maintenance of Impounded Livestock per Day $22.00 Y
7 ADMINISTRATION FEES - PARKING LOCAL LAW
- Withdrawal of infringements relating to private car parks $20.00 Y
- Issue of each replacement residential or visitor parking permit $10.00 Y
- Issue of each Temporary Parking Permit to builders, tradesmen (Private Residential only) $15.00 Y
8 INFRINGEMENT AGENCY COSTS
- Final Demand (FER) per Fine $13.50 N
- Fines Enforcement Registry (FER) per Fine $54.50 N
- Certified Extract (DoT) per Fine $16.50 N
- Vehicle Registration Search (DoT) per Fine $3.20 N
9 TOW AWAY OF VEHICLES
- All inclusive Fee (includes tow away and 2 days storage) $150.00 Y
- Additional storage Fee (per day after 2 days) $7.00 Y
10 BUSH FIRES ACT CHARGES
- Cost of installing fire breaks on private land where property Actual Costs Y
owner has failed to comply with a Section 33 Bush Fire Act Notice
Section 33 of the Bush Fires Act
11 IMPOUNDING FEES
- Abandoned Shopping Trolleys $15.00 N
- Daily Fee Per Trolley per Day $6.00 N
12 HELICOPTER LANDING FEE
Ranger Attendance Actual Costs Y
____________________________________________________________________________________________
Page 7. 4
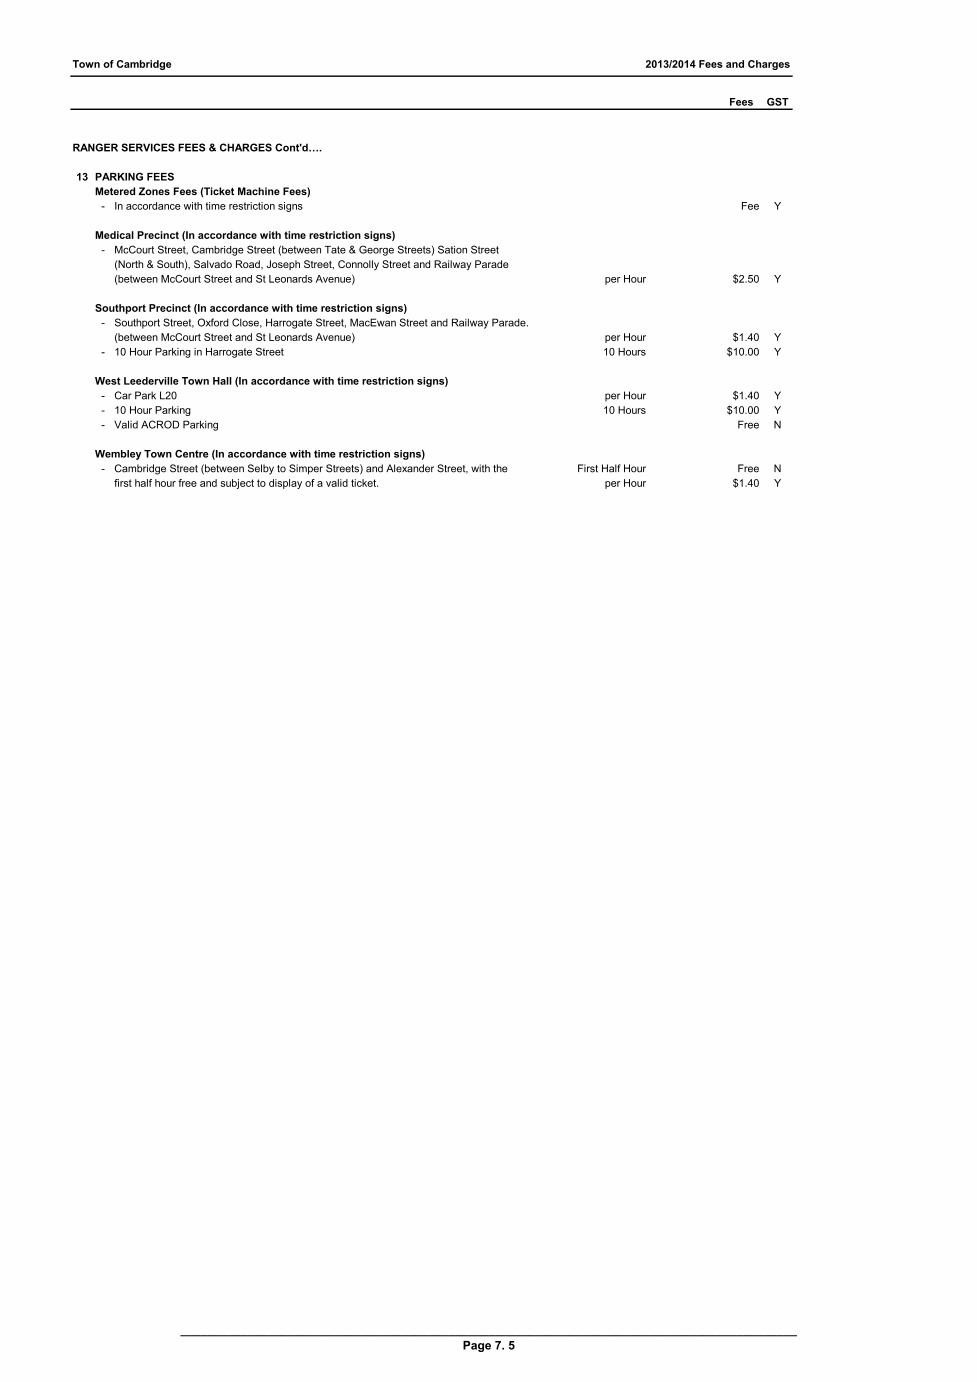
Town of Cambridge 2013/2014 Fees and Charges
Fees GST
RANGER SERVICES FEES & CHARGES Cont'd….
13 PARKING FEES
Metered Zones Fees (Ticket Machine Fees)
- In accordance with time restriction signs Fee Y
Medical Precinct (In accordance with time restriction signs)
- McCourt Street, Cambridge Street (between Tate & George Streets) Sation Street
(North & South), Salvado Road, Joseph Street, Connolly Street and Railway Parade
(between McCourt Street and St Leonards Avenue) per Hour $2.50 Y
Southport Precinct (In accordance with time restriction signs)
- Southport Street, Oxford Close, Harrogate Street, MacEwan Street and Railway Parade.
(between McCourt Street and St Leonards Avenue) per Hour $1.40 Y
- 10 Hour Parking in Harrogate Street 10 Hours $10.00 Y
West Leederville Town Hall (In accordance with time restriction signs)
- Car Park L20 per Hour $1.40 Y
- 10 Hour Parking 10 Hours $10.00 Y
- Valid ACROD Parking Free N
Wembley Town Centre (In accordance with time restriction signs)
- Cambridge Street (between Selby to Simper Streets) and Alexander Street, with the First Half Hour Free N
first half hour free and subject to display of a valid ticket. per Hour $1.40 Y
____________________________________________________________________________________________
Page 7. 5
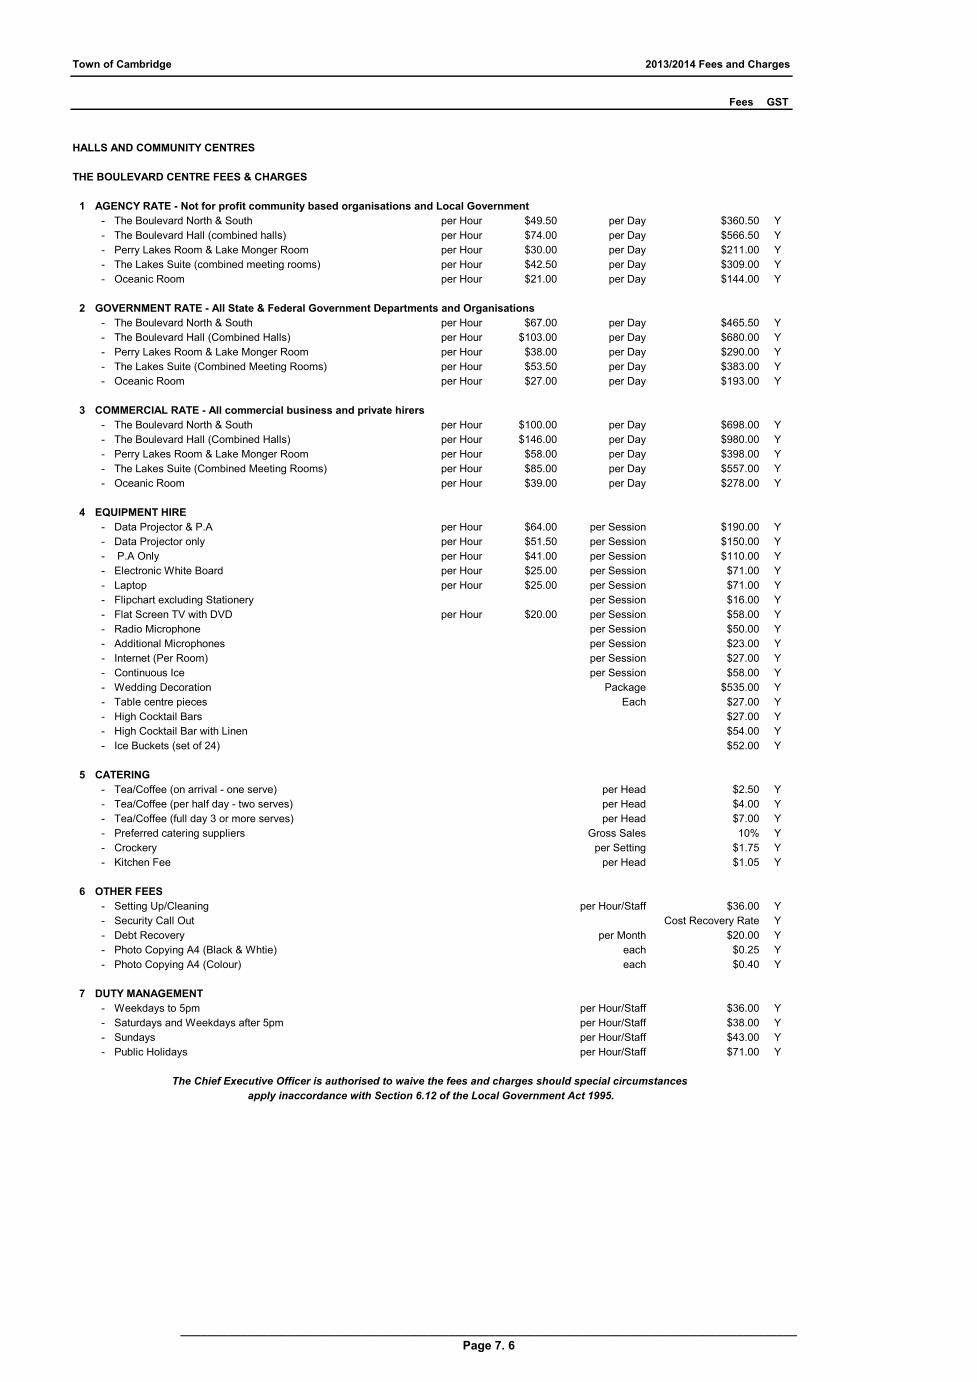
Town of Cambridge 2013/2014 Fees and Charges
Fees GST
HALLS AND COMMUNITY CENTRES
THE BOULEVARD CENTRE FEES & CHARGES
1 AGENCY RATE - Not for profit community based organisations and Local Government
- The Boulevard North & South per Hour $49.50 per Day $360.50 Y
- The Boulevard Hall (combined halls) per Hour $74.00 per Day $566.50 Y
- Perry Lakes Room & Lake Monger Room per Hour $30.00 per Day $211.00 Y
- The Lakes Suite (combined meeting rooms) per Hour $42.50 per Day $309.00 Y
- Oceanic Room per Hour $21.00 per Day $144.00 Y
2 GOVERNMENT RATE - All State & Federal Government Departments and Organisations
- The Boulevard North & South per Hour $67.00 per Day $465.50 Y
- The Boulevard Hall (Combined Halls) per Hour $103.00 per Day $680.00 Y
- Perry Lakes Room & Lake Monger Room per Hour $38.00 per Day $290.00 Y
- The Lakes Suite (Combined Meeting Rooms) per Hour $53.50 per Day $383.00 Y
- Oceanic Room per Hour $27.00 per Day $193.00 Y
3 COMMERCIAL RATE - All commercial business and private hirers
- The Boulevard North & South per Hour $100.00 per Day $698.00 Y
- The Boulevard Hall (Combined Halls) per Hour $146.00 per Day $980.00 Y
- Perry Lakes Room & Lake Monger Room per Hour $58.00 per Day $398.00 Y
- The Lakes Suite (Combined Meeting Rooms) per Hour $85.00 per Day $557.00 Y
- Oceanic Room per Hour $39.00 per Day $278.00 Y
4 EQUIPMENT HIRE
- Data Projector & P.A per Hour $64.00 per Session $190.00 Y
- Data Projector only per Hour $51.50 per Session $150.00 Y
- P.A Only per Hour $41.00 per Session $110.00 Y
- Electronic White Board per Hour $25.00 per Session $71.00 Y
- Laptop per Hour $25.00 per Session $71.00 Y
- Flipchart excluding Stationery per Session $16.00 Y
- Flat Screen TV with DVD per Hour $20.00 per Session $58.00 Y
- Radio Microphone per Session $50.00 Y
- Additional Microphones per Session $23.00 Y
- Internet (Per Room) per Session $27.00 Y
- Continuous Ice per Session $58.00 Y
- Wedding Decoration Package $535.00 Y
- Table centre pieces Each $27.00 Y
- High Cocktail Bars $27.00 Y
- High Cocktail Bar with Linen $54.00 Y
- Ice Buckets (set of 24) $52.00 Y
5 CATERING
- Tea/Coffee (on arrival - one serve) per Head $2.50 Y
- Tea/Coffee (per half day - two serves) per Head $4.00 Y
- Tea/Coffee (full day 3 or more serves) per Head $7.00 Y
- Preferred catering suppliers Gross Sales 10% Y
- Crockery per Setting $1.75 Y
- Kitchen Fee per Head $1.05 Y
6 OTHER FEES
- Setting Up/Cleaning per Hour/Staff $36.00 Y
- Security Call Out Cost Recovery Rate Y
- Debt Recovery per Month $20.00 Y
- Photo Copying A4 (Black & Whtie) each $0.25 Y
- Photo Copying A4 (Colour) each $0.40 Y
7 DUTY MANAGEMENT
- Weekdays to 5pm per Hour/Staff $36.00 Y
- Saturdays and Weekdays after 5pm per Hour/Staff $38.00 Y
- Sundays per Hour/Staff $43.00 Y
- Public Holidays per Hour/Staff $71.00 Y
The Chief Executive Officer is authorised to waive the fees and charges should special circumstances
apply inaccordance with Section 6.12 of the Local Government Act 1995.
____________________________________________________________________________________________
Page 7. 6

Town of Cambridge 2013/2014 Fees and Charges
Fees GST
HALLS AND COMMUNITY CENTRES Cont'd….
WEMBLEY COMMUNITY CENTRE FEES & CHARGES
1 AGENCY RATE - Not for profit community based organisations and Local Government
- Main Hall per Hour $31.00 per Day $216.00 Y
- Dining Room per Hour $29.00 per Day $202.00 Y
- Activity Room per Hour $26.00 per Day $180.00 Y
- Craft Room per Hour $25.00 per Day $173.00 Y
- Board Room per Hour $21.50 per Day $151.50 Y
- Playgroup per Hour $25.00 per Day $173.00 Y
2 GOVERNMENT RATES - All State & Federal Government Departments and Organisations
- Main Hall per Hour $54.50 per Day $382.50 Y
- Dining Room per Hour $51.50 per Day $358.50 Y
- Activity Room per Hour $34.50 per Day $241.00 Y
- Craft Room per Hour $28.00 per Day $196.00 Y
- Board Room per Hour $23.00 per Day $160.00 Y
- Playgroup per Hour $34.50 per Day $238.00 Y
3 COMMERCIAL RATES - All Commercial business and private hirers
- Main Hall per Hour $78.00 per Day $549.00 Y
- Dining Room per Hour $74.00 per Day $515.00 Y
- Activity Room per Hour $43.00 per Day $302.50 Y
- Craft Room per Hour $31.00 per Day $218.50 Y
- Board Room per Hour $24.00 per Day $168.00 Y
- Playgroup per Hour $43.00 per Day $302.50 Y
4 MINOR PROGRAMS
- Seniors Programs (Cards, indoor bowls, mah-jong and concerts) per Session $3.10 Y
5 EQUIPMENT HIRE
- TV and Video per Session $19.50 Y
- Multi-media Projector per Session $129.00 Y
- P.A Main Hall per Session $41.00 Y
- Storage Fee per sqm per Month per Sqm $4.75 Y
6 OTHER INCOME
- Photocopying per Copy $0.30 Y
- Re-imbursement phone and electricity Equal to Bill Y
- Debt Recovery (per Month) per Month $15.50 Y
The Chief Executive Officer is authorised to waive the fees and charges should special circumstances
apply inaccordance with Section 6.12 of the Local Government Act 1995.
____________________________________________________________________________________________
Page 7. 7
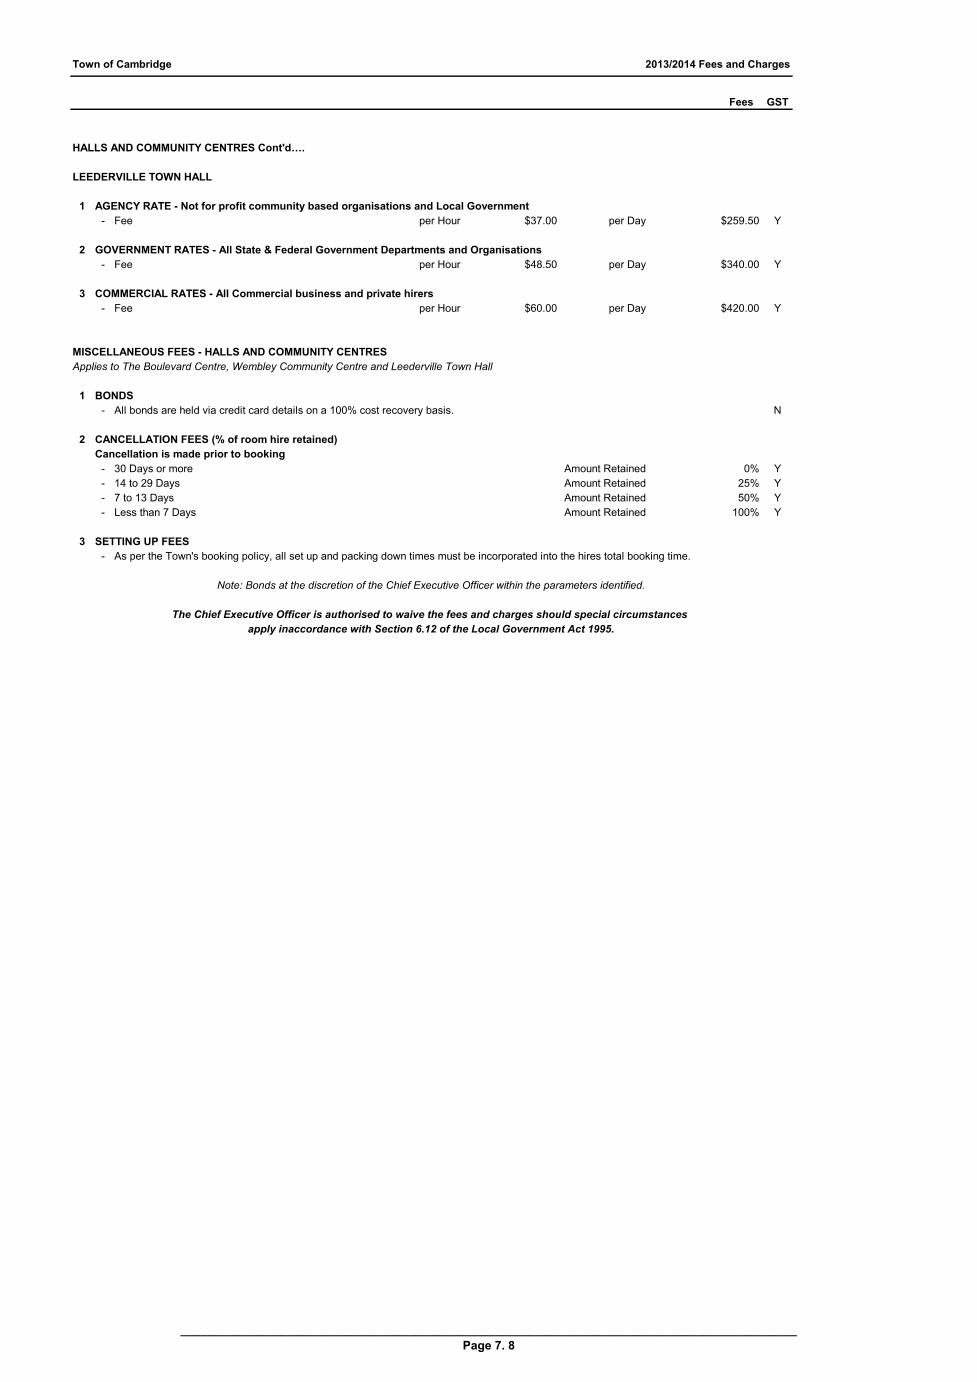
Town of Cambridge 2013/2014 Fees and Charges
Fees GST
HALLS AND COMMUNITY CENTRES Cont'd….
LEEDERVILLE TOWN HALL
1 AGENCY RATE - Not for profit community based organisations and Local Government
- Fee per Hour $37.00 per Day $259.50 Y
2 GOVERNMENT RATES - All State & Federal Government Departments and Organisations
- Fee per Hour $48.50 per Day $340.00 Y
3 COMMERCIAL RATES - All Commercial business and private hirers
- Fee per Hour $60.00 per Day $420.00 Y
MISCELLANEOUS FEES - HALLS AND COMMUNITY CENTRES
Applies to The Boulevard Centre, Wembley Community Centre and Leederville Town Hall
1 BONDS
- All bonds are held via credit card details on a 100% cost recovery basis. N
2 CANCELLATION FEES (% of room hire retained)
Cancellation is made prior to booking
- 30 Days or more Amount Retained 0% Y
- 14 to 29 Days Amount Retained 25% Y
- 7 to 13 Days Amount Retained 50% Y
- Less than 7 Days Amount Retained 100% Y
3 SETTING UP FEES
- As per the Town's booking policy, all set up and packing down times must be incorporated into the hires total booking time.
The Chief Executive Officer is authorised to waive the fees and charges should special circumstances
apply inaccordance with Section 6.12 of the Local Government Act 1995.
Note: Bonds at the discretion of the Chief Executive Officer within the parameters identified.
____________________________________________________________________________________________
Page 7. 8
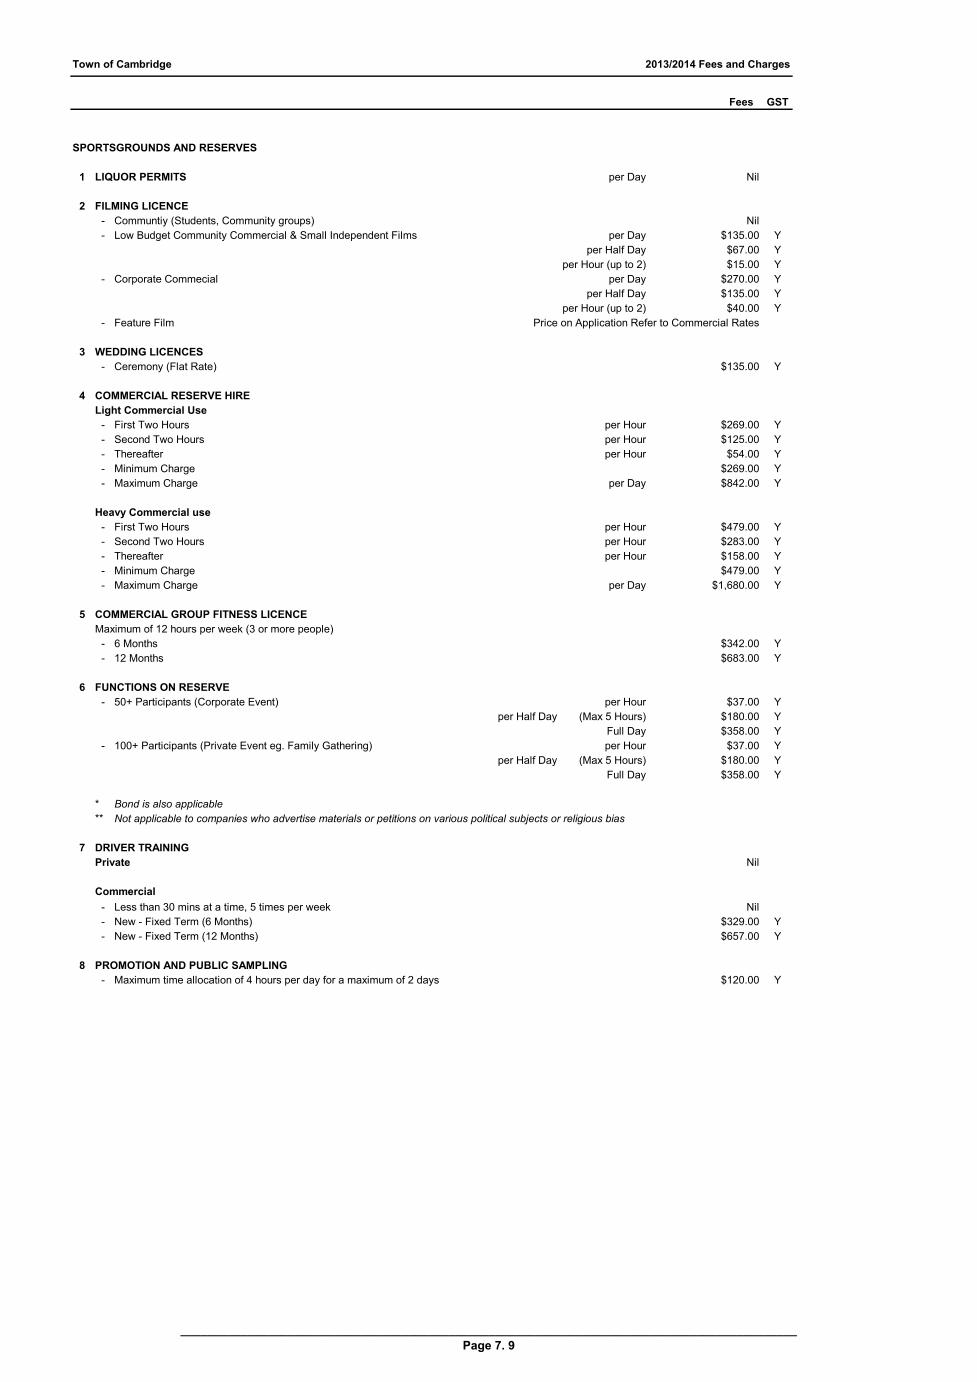
Town of Cambridge 2013/2014 Fees and Charges
Fees GST
SPORTSGROUNDS AND RESERVES
1 LIQUOR PERMITS per Day Nil
2 FILMING LICENCE
- Communtiy (Students, Community groups) Nil
- Low Budget Community Commercial & Small Independent Films per Day $135.00 Y
per Half Day $67.00 Y
per Hour (up to 2) $15.00 Y
- Corporate Commecial per Day $270.00 Y
per Half Day $135.00 Y
per Hour (up to 2) $40.00 Y
- Feature Film Price on Application Refer to Commercial Rates
3 WEDDING LICENCES
- Ceremony (Flat Rate) $135.00 Y
4 COMMERCIAL RESERVE HIRE
Light Commercial Use
- First Two Hours per Hour $269.00 Y
- Second Two Hours per Hour $125.00 Y
- Thereafter per Hour $54.00 Y
- Minimum Charge $269.00 Y
- Maximum Charge per Day $842.00 Y
Heavy Commercial use
- First Two Hours per Hour $479.00 Y
- Second Two Hours per Hour $283.00 Y
- Thereafter per Hour $158.00 Y
- Minimum Charge $479.00 Y
- Maximum Charge per Day $1,680.00 Y
5 COMMERCIAL GROUP FITNESS LICENCE
Maximum of 12 hours per week (3 or more people)
- 6 Months $342.00 Y
- 12 Months $683.00 Y
6 FUNCTIONS ON RESERVE
- 50+ Participants (Corporate Event) per Hour $37.00 Y
per Half Day (Max 5 Hours) $180.00 Y
Full Day $358.00 Y
- 100+ Participants (Private Event eg. Family Gathering) per Hour $37.00 Y
per Half Day (Max 5 Hours) $180.00 Y
Full Day $358.00 Y
* Bond is also applicable
**
7 DRIVER TRAINING
Private Nil
Commercial
- Less than 30 mins at a time, 5 times per week Nil
- New - Fixed Term (6 Months) $329.00 Y
- New - Fixed Term (12 Months) $657.00 Y
8 PROMOTION AND PUBLIC SAMPLING
- Maximum time allocation of 4 hours per day for a maximum of 2 days $120.00 Y
Not applicable to companies who advertise materials or petitions on various political subjects or religious bias
____________________________________________________________________________________________
Page 7. 9

Town of Cambridge 2013/2014 Fees and Charges
Fees GST
SPORTSGROUNDS AND RESERVES Cont'd….
10 CHARGES FOR RESERVES
Seasonal Hire Charges
- Training & Match Play per Senior Player per Season $59.00 Y
- Training & Match Play per Junior Player (under 18) per Season $15.00 Y
- Sub Juniors (8 years and under) Nil
- Town managed change room facilities per senior player per Season $32.00 Y
- Town managed change room facilities per junior player per Season $8.50 Y
Casual Hire
- Town Managed Facilities per Half Day $49.00 per Day $97.00 Y
- Reserve (< 150 people) per Half Day $67.00 per Day $135.00 Y
Hourly Rate (max 2 hours) $23.00 Y
- Reserve (up to 150-500 people) per Half Day $100.00 per Day $200.00 Y
Hourly Rate (max 2 hours) $35.00 Y
- Reserve (up to 500-1000 people) per Half Day $150.00 per Day $300.00 Y
Hourly Rate (max 2 hours) $52.00 Y
- Reserve (1000-1500 people) per Half Day $225.00 per Day $450.00 Y
Hourly Rate (max 2 hours) $78.00 Y
- Reserve (1500 > people)
11 CLEANING TOWN MANAGED FACILITIES AND TOILETS ASSOCIATED WITH RESERVE HIRE
- Charge for additional clean (Mon - Fri) Cost Recovery
- Charge for additional clean (Sat) Cost Recovery
- Charge for additional clean (Sun & Public Holidays) Cost Recovery
12 SPECIAL EVENTS
Special events at any of Council's venues will be at the discretion of Council and charged the approriate commercial rate. Y
13 RESERVE BOND
- For social purposes (weddings, parties etc). $200.00 N
Bonds for Special Events and events with over 500 people will be at the discretion of Council.
14 CITY BEACH TENNIS COURT (HARD COURTS)
- Court Hire per Hour $12.00 Y
- Use of Lights per Hour $3.30 Y
15 FLOREAT BEACH VOLLEYBALL COURTS
- Public Use Nil
- Court Hire per Hour $23.00 Y
16 CANCELLATION FEES
Cancellation is made prior to booking
- 30 days or more Amount Retained 0% Y
- 14 days to 29 days Amount Retained 25% Y
- 7 to 13 days Amount Retained 50% Y
- less than 7 days Amount Retained 100% Y
17 STORAGE AT ALDERBURY RESERVE per Month $70.00 Y
18 HOLYROOD PARK FACILITY
- Hire of facility per Hour $12.00 Y
per Half Day (5 hrs max) $47.00 Y
per Day $86.00 Y
(Definition: Town managed facilities exclude those leased directly to a Club or Association)
Fee at Discretion of Council
Town managed facilities exclude those leased directly to a club or association.
Juniors 50% off relevant charges
The Chief Executive Officer is authorised to waive the fees and charges should special circumstances
apply inaccordance with Section 6.12 of the Local Government Act 1995.
____________________________________________________________________________________________
Page 7. 10
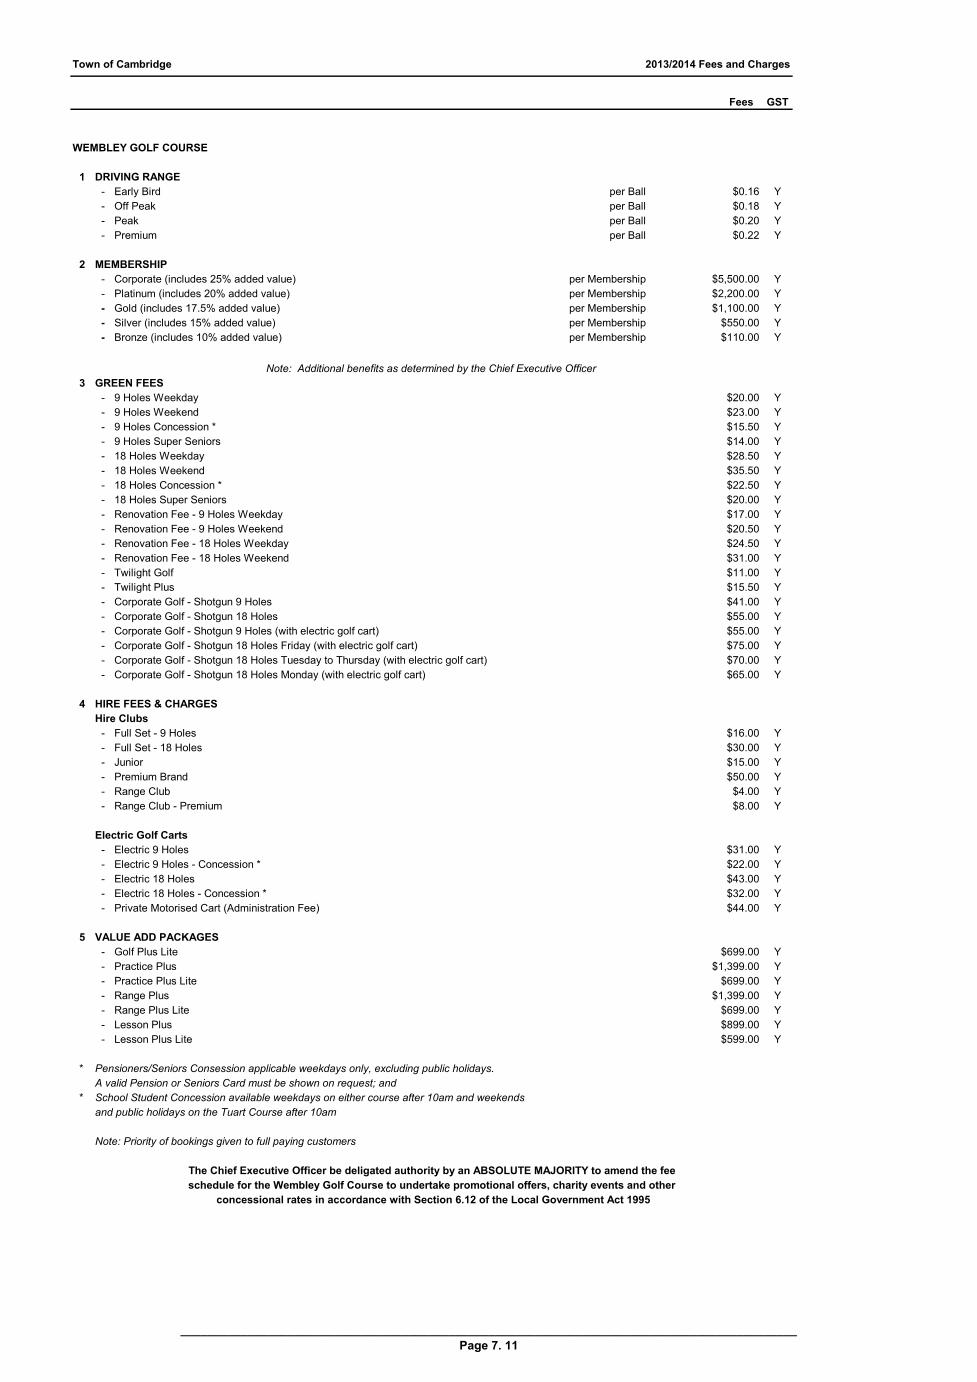
Town of Cambridge 2013/2014 Fees and Charges
Fees GST
WEMBLEY GOLF COURSE
1 DRIVING RANGE
- Early Bird per Ball $0.16 Y
- Off Peak per Ball $0.18 Y
- Peak per Ball $0.20 Y
- Premium per Ball $0.22 Y
2 MEMBERSHIP
- Corporate (includes 25% added value) per Membership $5,500.00 Y
- Platinum (includes 20% added value) per Membership $2,200.00 Y
- Gold (includes 17.5% added value) per Membership $1,100.00 Y
- Silver (includes 15% added value) per Membership $550.00 Y
- Bronze (includes 10% added value) per Membership $110.00 Y
3 GREEN FEES
- 9 Holes Weekday $20.00 Y
- 9 Holes Weekend $23.00 Y
- 9 Holes Concession * $15.50 Y
- 9 Holes Super Seniors $14.00 Y
- 18 Holes Weekday $28.50 Y
- 18 Holes Weekend $35.50 Y
- 18 Holes Concession * $22.50 Y
- 18 Holes Super Seniors $20.00 Y
- Renovation Fee - 9 Holes Weekday $17.00 Y
- Renovation Fee - 9 Holes Weekend $20.50 Y
- Renovation Fee - 18 Holes Weekday $24.50 Y
- Renovation Fee - 18 Holes Weekend $31.00 Y
- Twilight Golf $11.00 Y
- Twilight Plus $15.50 Y
- Corporate Golf - Shotgun 9 Holes $41.00 Y
- Corporate Golf - Shotgun 18 Holes $55.00 Y
- Corporate Golf - Shotgun 9 Holes (with electric golf cart) $55.00 Y
- Corporate Golf - Shotgun 18 Holes Friday (with electric golf cart) $75.00 Y
- Corporate Golf - Shotgun 18 Holes Tuesday to Thursday (with electric golf cart) $70.00 Y
- Corporate Golf - Shotgun 18 Holes Monday (with electric golf cart) $65.00 Y
4 HIRE FEES & CHARGES
Hire Clubs
- Full Set - 9 Holes $16.00 Y
- Full Set - 18 Holes $30.00 Y
- Junior $15.00 Y
- Premium Brand $50.00 Y
- Range Club $4.00 Y
- Range Club - Premium $8.00 Y
Electric Golf Carts
- Electric 9 Holes $31.00 Y
- Electric 9 Holes - Concession * $22.00 Y
- Electric 18 Holes $43.00 Y
- Electric 18 Holes - Concession * $32.00 Y
- Private Motorised Cart (Administration Fee) $44.00 Y
5 VALUE ADD PACKAGES
- Golf Plus Lite $699.00 Y
- Practice Plus $1,399.00 Y
- Practice Plus Lite $699.00 Y
- Range Plus $1,399.00 Y
- Range Plus Lite $699.00 Y
- Lesson Plus $899.00 Y
- Lesson Plus Lite $599.00 Y
* Pensioners/Seniors Consession applicable weekdays only, excluding public holidays.
A valid Pension or Seniors Card must be shown on request; and
* School Student Concession available weekdays on either course after 10am and weekends
and public holidays on the Tuart Course after 10am
Note: Priority of bookings given to full paying customers
Note: Additional benefits as determined by the Chief Executive Officer
The Chief Executive Officer be deligated authority by an ABSOLUTE MAJORITY to amend the fee
schedule for the Wembley Golf Course to undertake promotional offers, charity events and other
concessional rates in accordance with Section 6.12 of the Local Government Act 1995
____________________________________________________________________________________________
Page 7. 11
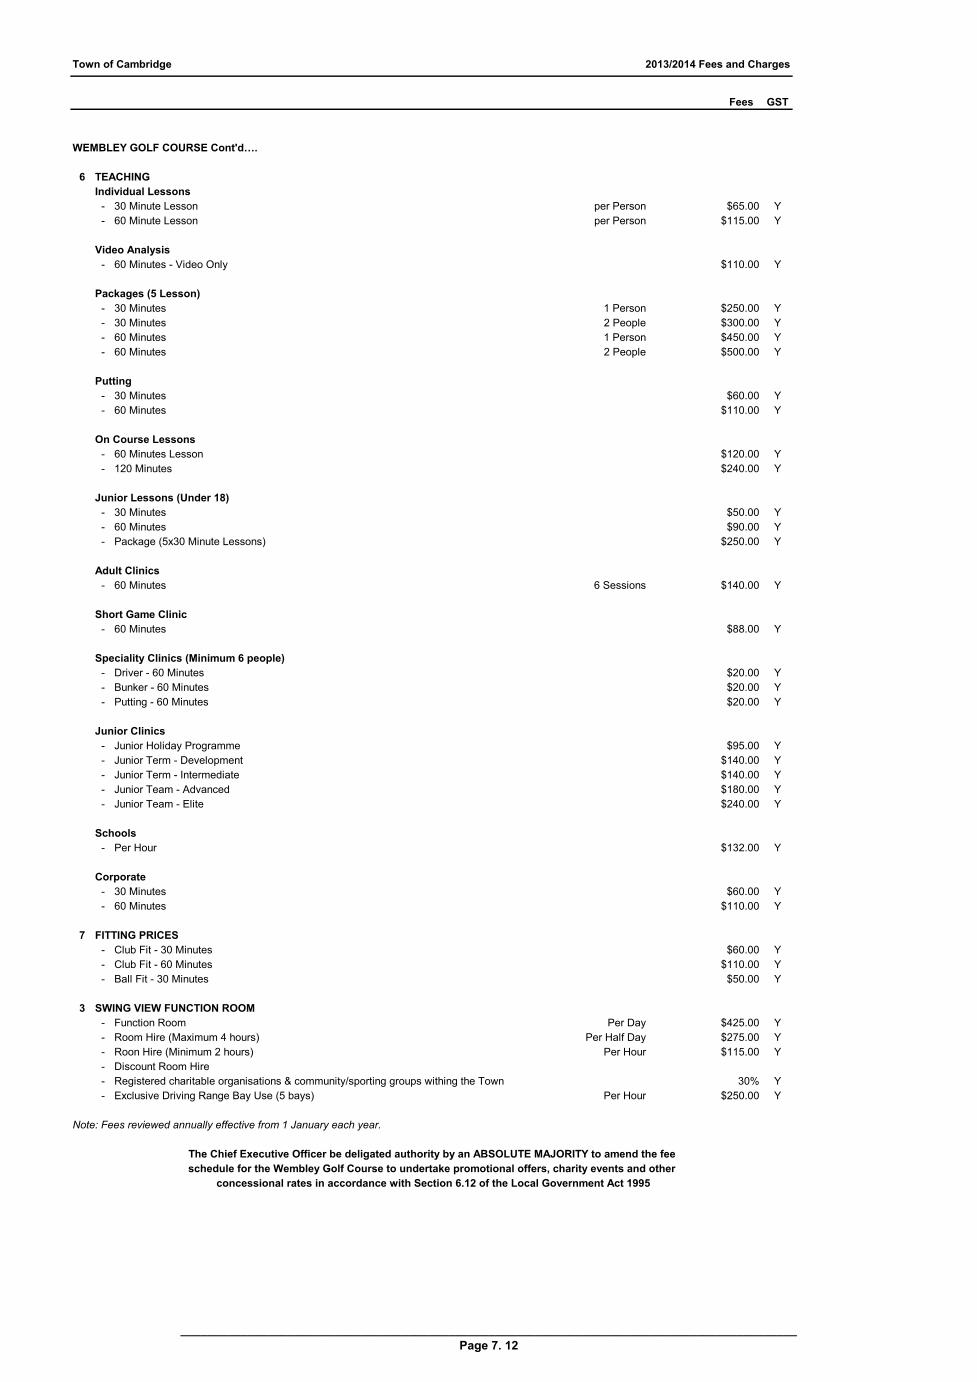
Town of Cambridge 2013/2014 Fees and Charges
Fees GST
WEMBLEY GOLF COURSE Cont'd….
6 TEACHING
Individual Lessons
- 30 Minute Lesson per Person $65.00 Y
- 60 Minute Lesson per Person $115.00 Y
Video Analysis
- 60 Minutes - Video Only $110.00 Y
Packages (5 Lesson)
- 30 Minutes 1 Person $250.00 Y
- 30 Minutes 2 People $300.00 Y
- 60 Minutes 1 Person $450.00 Y
- 60 Minutes 2 People $500.00 Y
Putting
- 30 Minutes $60.00 Y
- 60 Minutes $110.00 Y
On Course Lessons
- 60 Minutes Lesson $120.00 Y
- 120 Minutes $240.00 Y
Junior Lessons (Under 18)
- 30 Minutes $50.00 Y
- 60 Minutes $90.00 Y
- Package (5x30 Minute Lessons) $250.00 Y
Adult Clinics
- 60 Minutes 6 Sessions $140.00 Y
Short Game Clinic
- 60 Minutes $88.00 Y
Speciality Clinics (Minimum 6 people)
- Driver - 60 Minutes $20.00 Y
- Bunker - 60 Minutes $20.00 Y
- Putting - 60 Minutes $20.00 Y
Junior Clinics
- Junior Holiday Programme $95.00 Y
- Junior Term - Development $140.00 Y
- Junior Term - Intermediate $140.00 Y
- Junior Team - Advanced $180.00 Y
- Junior Team - Elite $240.00 Y
Schools
- Per Hour $132.00 Y
Corporate
- 30 Minutes $60.00 Y
- 60 Minutes $110.00 Y
7 FITTING PRICES
- Club Fit - 30 Minutes $60.00 Y
- Club Fit - 60 Minutes $110.00 Y
- Ball Fit - 30 Minutes $50.00 Y
3 SWING VIEW FUNCTION ROOM
- Function Room Per Day $425.00 Y
- Room Hire (Maximum 4 hours) Per Half Day $275.00 Y
- Roon Hire (Minimum 2 hours) Per Hour $115.00 Y
- Discount Room Hire
- Registered charitable organisations & community/sporting groups withing the Town 30% Y
- Exclusive Driving Range Bay Use (5 bays) Per Hour $250.00 Y
Note: Fees reviewed annually effective from 1 January each year.
concessional rates in accordance with Section 6.12 of the Local Government Act 1995
schedule for the Wembley Golf Course to undertake promotional offers, charity events and other
The Chief Executive Officer be deligated authority by an ABSOLUTE MAJORITY to amend the fee
____________________________________________________________________________________________
Page 7. 12
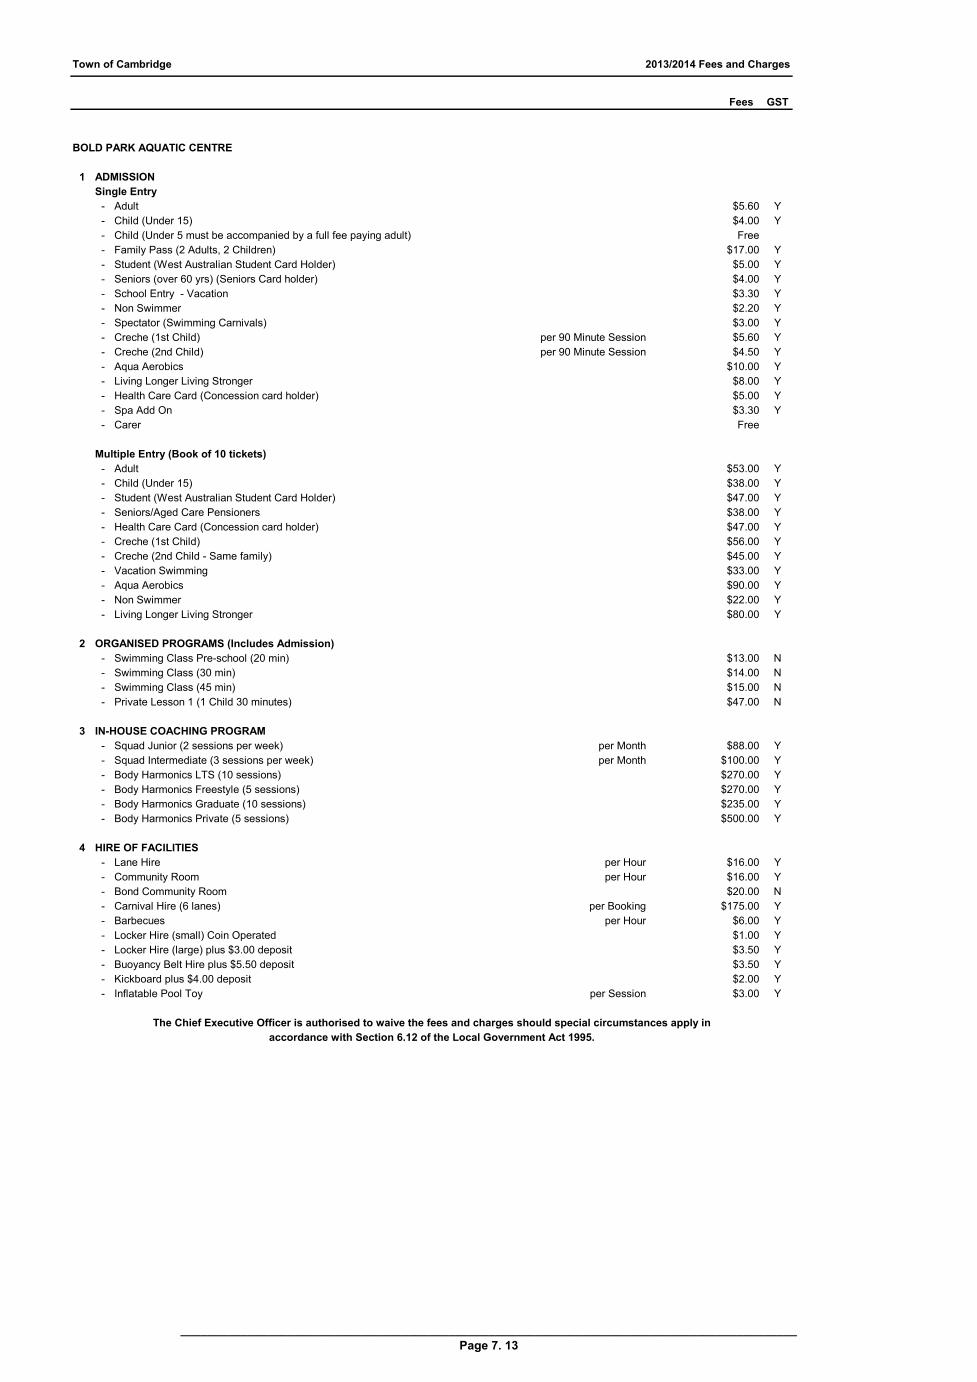
Town of Cambridge 2013/2014 Fees and Charges
Fees GST
BOLD PARK AQUATIC CENTRE
1 ADMISSION
Single Entry
- Adult $5.60 Y
- Child (Under 15) $4.00 Y
- Child (Under 5 must be accompanied by a full fee paying adult) Free
- Family Pass (2 Adults, 2 Children) $17.00 Y
- Student (West Australian Student Card Holder) $5.00 Y
- Seniors (over 60 yrs) (Seniors Card holder) $4.00 Y
- School Entry - Vacation $3.30 Y
- Non Swimmer $2.20 Y
- Spectator (Swimming Carnivals) $3.00 Y
- Creche (1st Child) per 90 Minute Session $5.60 Y
- Creche (2nd Child) per 90 Minute Session $4.50 Y
- Aqua Aerobics $10.00 Y
- Living Longer Living Stronger $8.00 Y
- Health Care Card (Concession card holder) $5.00 Y
- Spa Add On $3.30 Y
- Carer Free
Multiple Entry (Book of 10 tickets)
- Adult $53.00 Y
- Child (Under 15) $38.00 Y
- Student (West Australian Student Card Holder) $47.00 Y
- Seniors/Aged Care Pensioners $38.00 Y
- Health Care Card (Concession card holder) $47.00 Y
- Creche (1st Child) $56.00 Y
- Creche (2nd Child - Same family) $45.00 Y
- Vacation Swimming $33.00 Y
- Aqua Aerobics $90.00 Y
- Non Swimmer $22.00 Y
- Living Longer Living Stronger $80.00 Y
2 ORGANISED PROGRAMS (Includes Admission)
- Swimming Class Pre-school (20 min) $13.00 N
- Swimming Class (30 min) $14.00 N
- Swimming Class (45 min) $15.00 N
- Private Lesson 1 (1 Child 30 minutes) $47.00 N
3 IN-HOUSE COACHING PROGRAM
- Squad Junior (2 sessions per week) per Month $88.00 Y
- Squad Intermediate (3 sessions per week) per Month $100.00 Y
- Body Harmonics LTS (10 sessions) $270.00 Y
- Body Harmonics Freestyle (5 sessions) $270.00 Y
- Body Harmonics Graduate (10 sessions) $235.00 Y
- Body Harmonics Private (5 sessions) $500.00 Y
4 HIRE OF FACILITIES
- Lane Hire per Hour $16.00 Y
- Community Room per Hour $16.00 Y
- Bond Community Room $20.00 N
- Carnival Hire (6 lanes) per Booking $175.00 Y
- Barbecues per Hour $6.00 Y
- Locker Hire (small) Coin Operated $1.00 Y
- Locker Hire (large) plus $3.00 deposit $3.50 Y
- Buoyancy Belt Hire plus $5.50 deposit $3.50 Y
- Kickboard plus $4.00 deposit $2.00 Y
- Inflatable Pool Toy per Session $3.00 Y
The Chief Executive Officer is authorised to waive the fees and charges should special circumstances apply in
accordance with Section 6.12 of the Local Government Act 1995.
____________________________________________________________________________________________
Page 7. 13
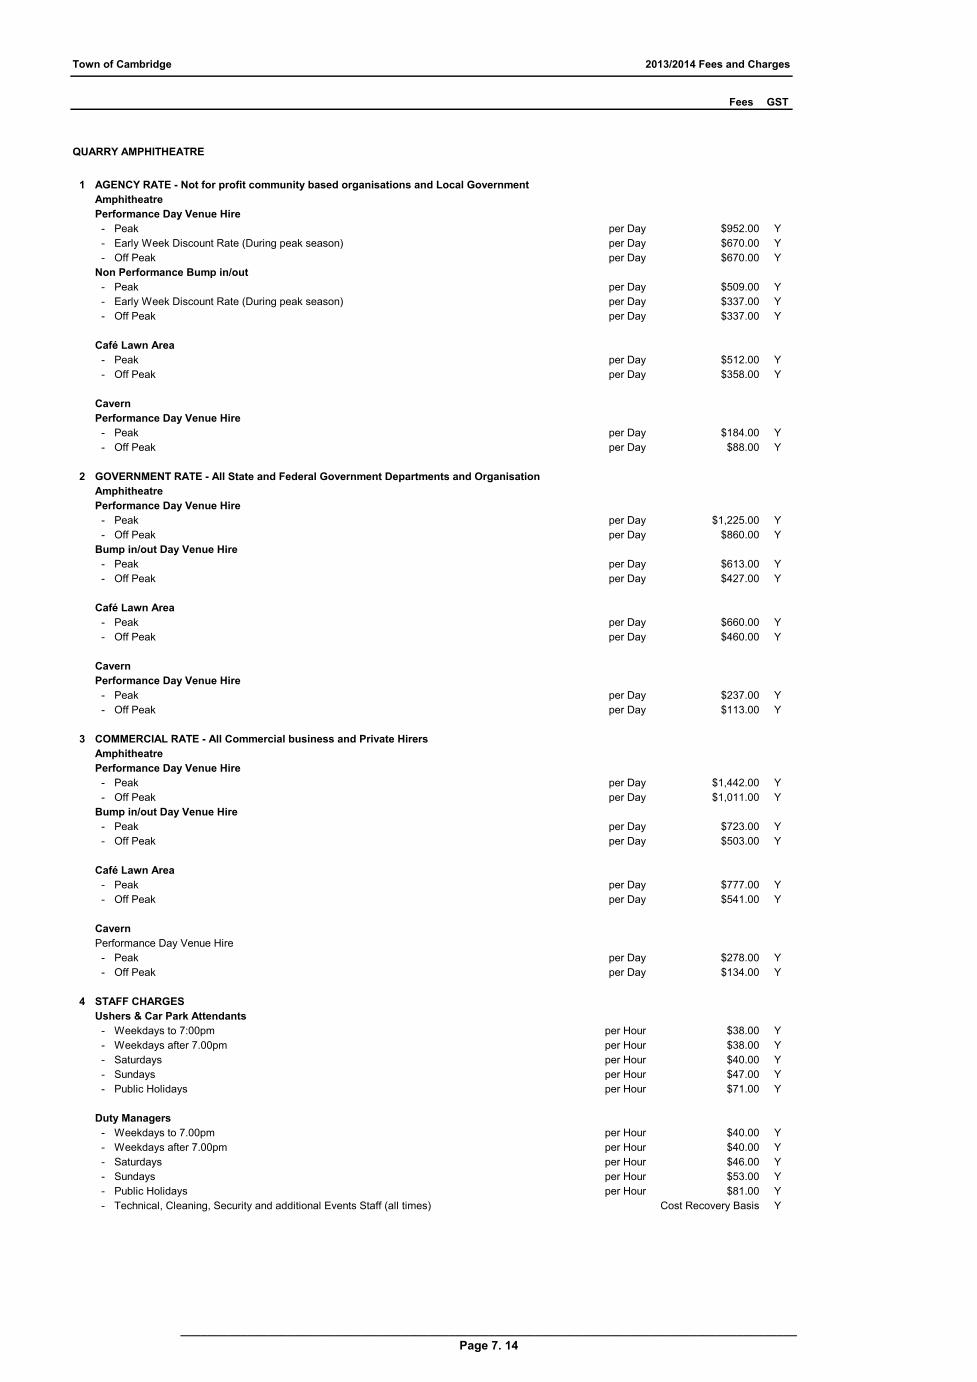
Town of Cambridge 2013/2014 Fees and Charges
Fees GST
QUARRY AMPHITHEATRE
1 AGENCY RATE - Not for profit community based organisations and Local Government
Amphitheatre
Performance Day Venue Hire
- Peak per Day $952.00 Y
- Early Week Discount Rate (During peak season) per Day $670.00 Y
- Off Peak per Day $670.00 Y
Non Performance Bump in/out
- Peak per Day $509.00 Y
- Early Week Discount Rate (During peak season) per Day $337.00 Y
- Off Peak per Day $337.00 Y
Café Lawn Area
- Peak per Day $512.00 Y
- Off Peak per Day $358.00 Y
Cavern
Performance Day Venue Hire
- Peak per Day $184.00 Y
- Off Peak per Day $88.00 Y
2 GOVERNMENT RATE - All State and Federal Government Departments and Organisation
Amphitheatre
Performance Day Venue Hire
- Peak per Day $1,225.00 Y
- Off Peak per Day $860.00 Y
Bump in/out Day Venue Hire
- Peak per Day $613.00 Y
- Off Peak per Day $427.00 Y
Café Lawn Area
- Peak per Day $660.00 Y
- Off Peak per Day $460.00 Y
Cavern
Performance Day Venue Hire
- Peak per Day $237.00 Y
- Off Peak per Day $113.00 Y
3 COMMERCIAL RATE - All Commercial business and Private Hirers
Amphitheatre
Performance Day Venue Hire
- Peak per Day $1,442.00 Y
- Off Peak per Day $1,011.00 Y
Bump in/out Day Venue Hire
- Peak per Day $723.00 Y
- Off Peak per Day $503.00 Y
Café Lawn Area
- Peak per Day $777.00 Y
- Off Peak per Day $541.00 Y
Cavern
Performance Day Venue Hire
- Peak per Day $278.00 Y
- Off Peak per Day $134.00 Y
4 STAFF CHARGES
Ushers & Car Park Attendants
- Weekdays to 7:00pm per Hour $38.00 Y
- Weekdays after 7.00pm per Hour $38.00 Y
- Saturdays per Hour $40.00 Y
- Sundays per Hour $47.00 Y
- Public Holidays per Hour $71.00 Y
Duty Managers
- Weekdays to 7.00pm per Hour $40.00 Y
- Weekdays after 7.00pm per Hour $40.00 Y
- Saturdays per Hour $46.00 Y
- Sundays per Hour $53.00 Y
- Public Holidays per Hour $81.00 Y
- Technical, Cleaning, Security and additional Events Staff (all times) Cost Recovery Basis Y
____________________________________________________________________________________________
Page 7. 14
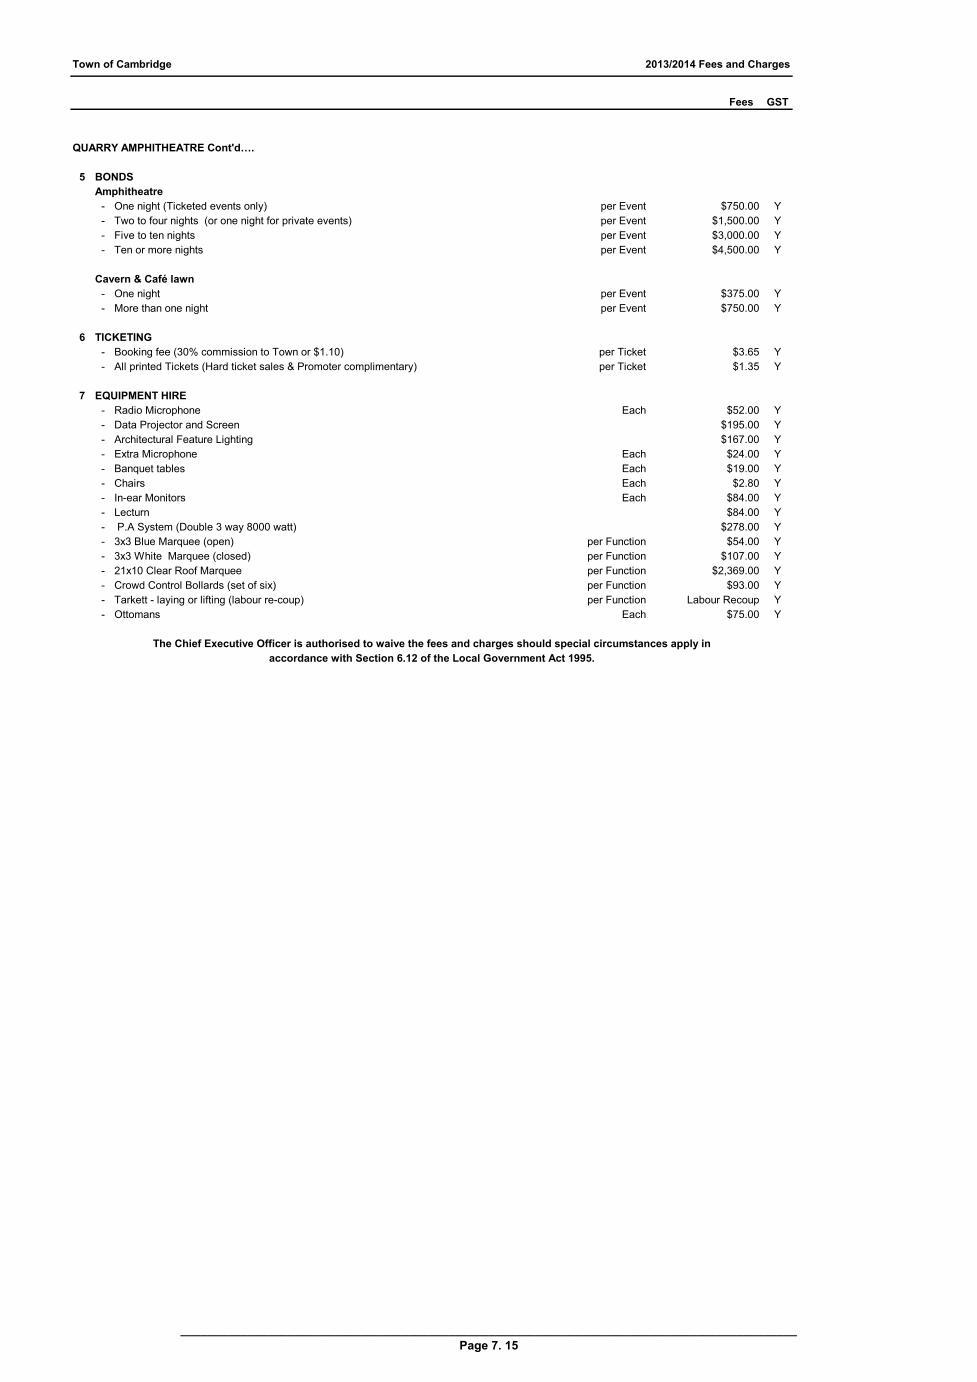
Town of Cambridge 2013/2014 Fees and Charges
Fees GST
QUARRY AMPHITHEATRE Cont'd….
5 BONDS
Amphitheatre
- One night (Ticketed events only) per Event $750.00 Y
- Two to four nights (or one night for private events) per Event $1,500.00 Y
- Five to ten nights per Event $3,000.00 Y
- Ten or more nights per Event $4,500.00 Y
Cavern & Café lawn
- One night per Event $375.00 Y
- More than one night per Event $750.00 Y
6 TICKETING
- Booking fee (30% commission to Town or $1.10) per Ticket $3.65 Y
- All printed Tickets (Hard ticket sales & Promoter complimentary) per Ticket $1.35 Y
7 EQUIPMENT HIRE
- Radio Microphone Each $52.00 Y
- Data Projector and Screen $195.00 Y
- Architectural Feature Lighting $167.00 Y
- Extra Microphone Each $24.00 Y
- Banquet tables Each $19.00 Y
- Chairs Each $2.80 Y
- In-ear Monitors Each $84.00 Y
- Lecturn $84.00 Y
- P.A System (Double 3 way 8000 watt) $278.00 Y
- 3x3 Blue Marquee (open) per Function $54.00 Y
- 3x3 White Marquee (closed) per Function $107.00 Y
- 21x10 Clear Roof Marquee per Function $2,369.00 Y
- Crowd Control Bollards (set of six) per Function $93.00 Y
- Tarkett - laying or lifting (labour re-coup) per Function Labour Recoup Y
- Ottomans Each $75.00 Y
accordance with Section 6.12 of the Local Government Act 1995.
The Chief Executive Officer is authorised to waive the fees and charges should special circumstances apply in
____________________________________________________________________________________________
Page 7. 15
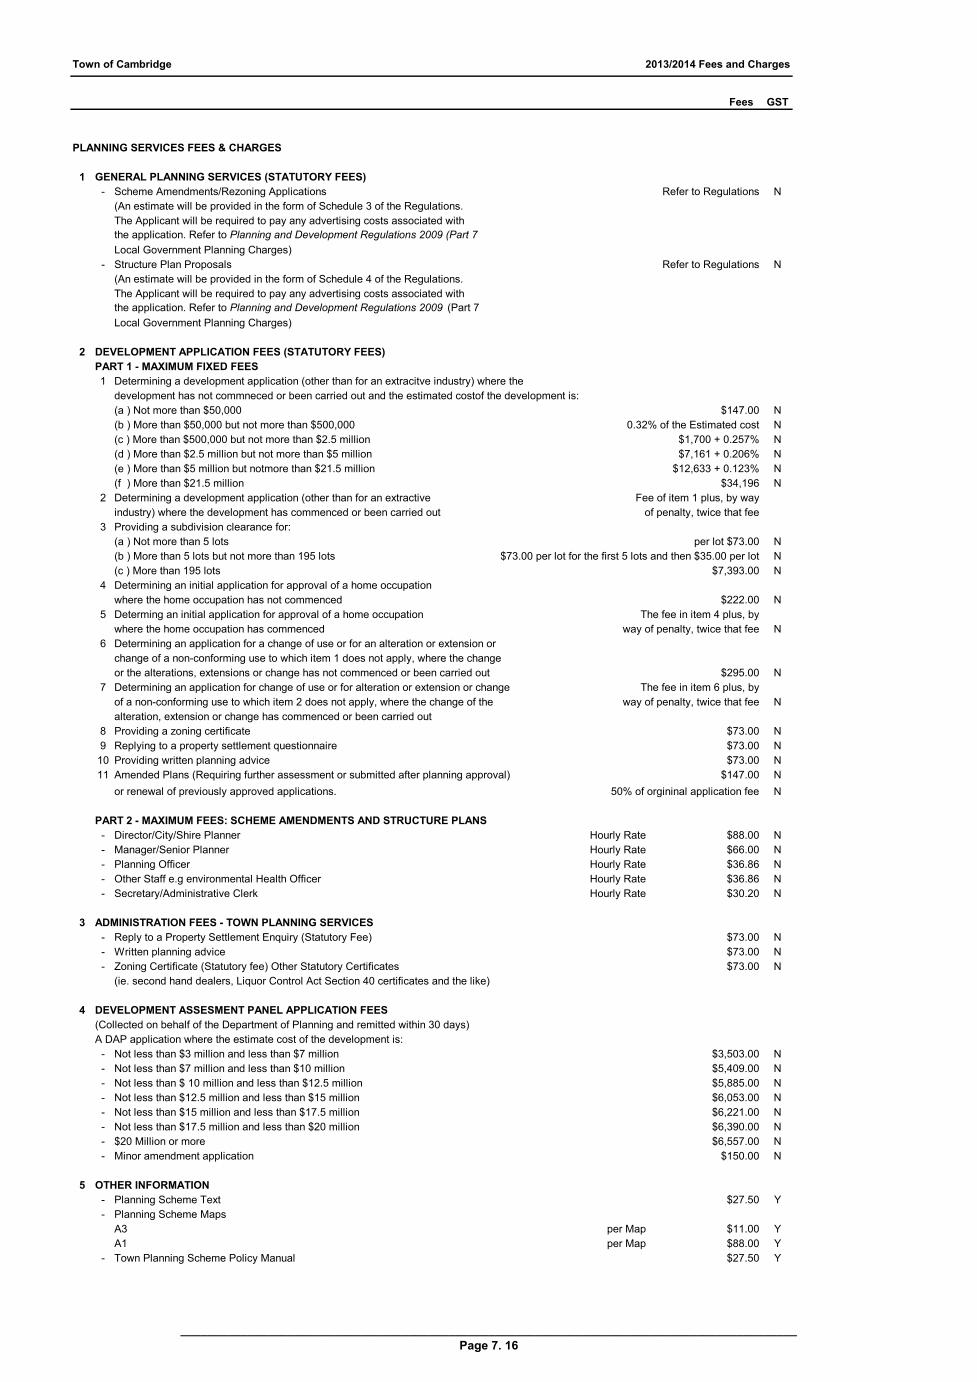
Town of Cambridge 2013/2014 Fees and Charges
Fees GST
PLANNING SERVICES FEES & CHARGES
1 GENERAL PLANNING SERVICES (STATUTORY FEES)
- Scheme Amendments/Rezoning Applications Refer to Regulations N
(An estimate will be provided in the form of Schedule 3 of the Regulations.
The Applicant will be required to pay any advertising costs associated with
the application. Refer to Planning and Development Regulations 2009 (Part 7
Local Government Planning Charges)
- Structure Plan Proposals Refer to Regulations N
(An estimate will be provided in the form of Schedule 4 of the Regulations.
The Applicant will be required to pay any advertising costs associated with
the application. Refer to Planning and Development Regulations 2009 (Part 7
Local Government Planning Charges)
2 DEVELOPMENT APPLICATION FEES (STATUTORY FEES)
PART 1 - MAXIMUM FIXED FEES
1 Determining a development application (other than for an extracitve industry) where the
development has not commneced or been carried out and the estimated costof the development is:
(a ) Not more than $50,000 $147.00 N
(b ) More than $50,000 but not more than $500,000 0.32% of the Estimated cost N
(c ) More than $500,000 but not more than $2.5 million $1,700 + 0.257% N
(d ) More than $2.5 million but not more than $5 million $7,161 + 0.206% N
(e ) More than $5 million but notmore than $21.5 million $12,633 + 0.123% N
(f ) More than $21.5 million $34,196 N
2 Determining a development application (other than for an extractive Fee of item 1 plus, by way
industry) where the development has commenced or been carried out of penalty, twice that fee
3 Providing a subdivision clearance for:
(a ) Not more than 5 lots per lot $73.00 N
(b ) More than 5 lots but not more than 195 lots $73.00 per lot for the first 5 lots and then $35.00 per lot N
(c ) More than 195 lots $7,393.00 N
4 Determining an initial application for approval of a home occupation
where the home occupation has not commenced $222.00 N
5 Determing an initial application for approval of a home occupation The fee in item 4 plus, by
where the home occupation has commenced way of penalty, twice that fee N
6 Determining an application for a change of use or for an alteration or extension or
change of a non-conforming use to which item 1 does not apply, where the change
or the alterations, extensions or change has not commenced or been carried out $295.00 N
7 Determining an application for change of use or for alteration or extension or change The fee in item 6 plus, by
of a non-conforming use to which item 2 does not apply, where the change of the way of penalty, twice that fee N
alteration, extension or change has commenced or been carried out
8 Providing a zoning certificate $73.00 N
9 Replying to a property settlement questionnaire $73.00 N
10 Providing written planning advice $73.00 N
11 Amended Plans (Requiring further assessment or submitted after planning approval) $147.00 N
or renewal of previously approved applications. N
PART 2 - MAXIMUM FEES: SCHEME AMENDMENTS AND STRUCTURE PLANS
- Director/City/Shire Planner Hourly Rate $88.00 N
- Manager/Senior Planner Hourly Rate $66.00 N
- Planning Officer Hourly Rate $36.86 N
- Other Staff e.g environmental Health Officer Hourly Rate $36.86 N
- Secretary/Administrative Clerk Hourly Rate $30.20 N
3 ADMINISTRATION FEES - TOWN PLANNING SERVICES
- Reply to a Property Settlement Enquiry (Statutory Fee) $73.00 N
- Written planning advice $73.00 N
- Zoning Certificate (Statutory fee) Other Statutory Certificates $73.00 N
(ie. second hand dealers, Liquor Control Act Section 40 certificates and the like)
4 DEVELOPMENT ASSESMENT PANEL APPLICATION FEES
(Collected on behalf of the Department of Planning and remitted within 30 days)
A DAP application where the estimate cost of the development is:
- Not less than $3 million and less than $7 million $3,503.00 N
- Not less than $7 million and less than $10 million $5,409.00 N
- Not less than $ 10 million and less than $12.5 million $5,885.00 N
- Not less than $12.5 million and less than $15 million $6,053.00 N
- Not less than $15 million and less than $17.5 million $6,221.00 N
- Not less than $17.5 million and less than $20 million $6,390.00 N
- $20 Million or more $6,557.00 N
- Minor amendment application $150.00 N
5 OTHER INFORMATION
- Planning Scheme Text $27.50 Y
- Planning Scheme Maps
A3 per Map $11.00 Y
A1 per Map $88.00 Y
- Town Planning Scheme Policy Manual $27.50 Y
50% of orgininal application fee
____________________________________________________________________________________________
Page 7. 16

Town of Cambridge 2013/2014 Fees and Charges
Fees GST
BUILDING SERVICE FEES & CHARGES
1 BUILDING APPLICATIONS (Statutory Fees)
Division 1 - Applications for building permits & demolition permits
Certified Application for a building permit (s.16(1) -
(Charges as specified in the Building Act 2011)
- For Building work for a Class 1 or Class 10 building or incidental structure 0.19% N
(0.19% of the estimated value of the building work as determined by the
relevant permit authority, but not less than $90) Minimum Fee $90.00 N
- For bulding work for a Class 2 to Class 9 building or incidental structure 0.09% N
(0.09% of the estimated value of the building work as determined by the
relevant permit authority, but not less than $90) Minimum Fee $90.00 N
- Uncertified application for a building permit (s.16 (1)) 0.32% N
(0.32% of the estimated value of the building work as determined by the relevant
permit authority, but not less than $90) Minimum Fee $90.00 N
Application for a demolition permit (s.16(1)) -
- For demolition work in respect of a Class 1 or Class 10 building or incidental structure $90.00 N
- For demolition work in respect of a Class 2 to Class 9 building per Storey $90.00 N
- Application to extend the time during which a building or demolition permit has effect (s.32(3)(f)) $90.00 N
Division 2 - Application for occupancy permits, building approval certificates
- Application for an occupancy permit for a completed building (s.46) $90.00 N
- Application for temporary occupancy permit for an incomplete building (s.47) $90.00 N
- Application for modification of an occupancy permit for additional use of a building
on a temporary basis (s.48) $90.00 N
- Application for a replacement occupancy permit for permanent change of the building's
use, classification (s.49) $90.00 N
- per Strata $10.00 N
Minimum Fee $100.00 N
- 0.18% N
Minimum Fee $90.00 N
Division 3 - Other Applications
- Application as defined in regulation 31 (for each building standard in respect of
which a declaration is sought) $2,000.00 N
- CTF Levyn (Collected on behalf of the fund and remitted monthly) 0.2% N
(Note: Collected on behalf of the Fund and only payable on amounts exceeding $20,000)
2 BUILDING SERVICE LEVIES
Building Services Levies (Previously known as Builders Registration Board Levy)
(Note: Collected on behalf of the Board)
- Building Permit (Over $45,000) 0.09% N
- Building Permit (Less than $45,000) $40.50 N
- Demolition Permit (Over $45,000) 0.09% N
- Demolition Permit (Less than $45,000) $40.50 N
- Occupancy Permit or Building Approval Certificate for approved building work
under ss47, 49, 50 or 52 of the Building Act (Over $45,000) $40.50 N
- Occupancy Permit or Building Approval Certificate for approved building work
under ss47, 49, 50 or 52 of the Building Act (Less than $45,000) $40.50 N
- Occupancy Permit or Building Approval Certificate for unauthorised building work
under s51 of the Building Act (Over $45,000) 0.18% N
- Occupancy Permit or Building Approval Certificate for unauthorised building work $91.00 N
under s51 of the Building Act (Less than $45,000)
- Occupancy Permit under s46 of the Building Act No Levy is Payable
- Modification of Occupancy Permit for additional use of building on temporary basis
under s48 of the Building Act No Levy is Payable
3 OTHER LICENCES/APPLICATIONS
- Private Swimming Pool Inspection Fee $52.25 Y
Application for an occupancy permit or building approval certificate for registration of a strata
scheme, plan of resubdivision (s50(1) and (2)
Application for an occupancy permit for a building in respect of which unauthorised work has
been done (s.51(2))
____________________________________________________________________________________________
Page 7. 17
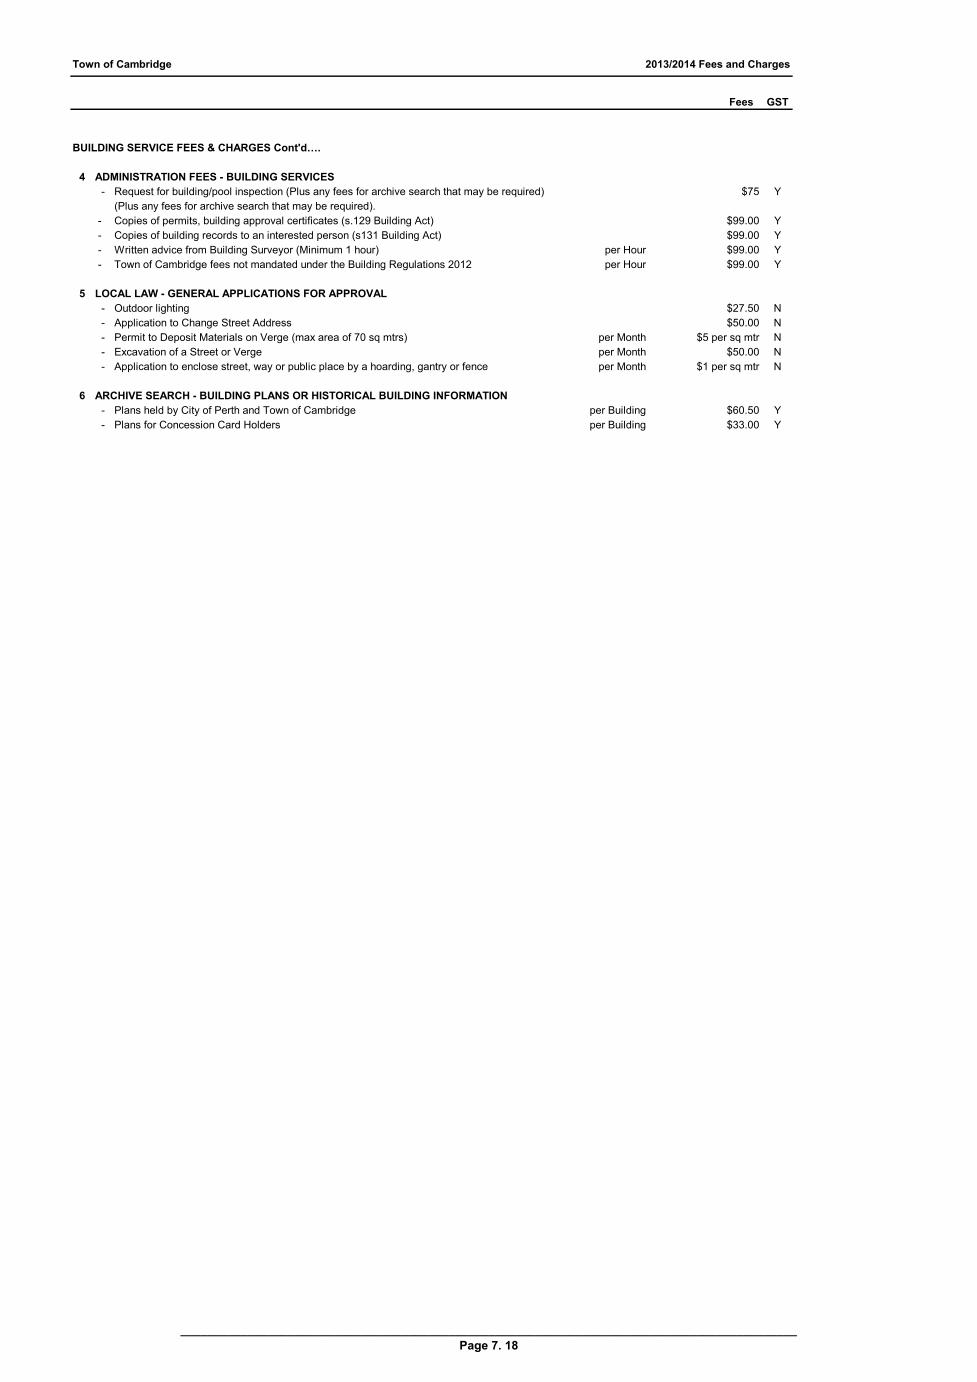
Town of Cambridge 2013/2014 Fees and Charges
Fees GST
BUILDING SERVICE FEES & CHARGES Cont'd….
4 ADMINISTRATION FEES - BUILDING SERVICES
- Request for building/pool inspection (Plus any fees for archive search that may be required) $75 Y
(Plus any fees for archive search that may be required).
- Copies of permits, building approval certificates (s.129 Building Act) $99.00 Y
- Copies of building records to an interested person (s131 Building Act) $99.00 Y
- Written advice from Building Surveyor (Minimum 1 hour) per Hour $99.00 Y
- Town of Cambridge fees not mandated under the Building Regulations 2012 per Hour $99.00 Y
5 LOCAL LAW - GENERAL APPLICATIONS FOR APPROVAL
- Outdoor lighting $27.50 N
- Application to Change Street Address $50.00 N
- Permit to Deposit Materials on Verge (max area of 70 sq mtrs) per Month $5 per sq mtr N
- Excavation of a Street or Verge per Month $50.00 N
- Application to enclose street, way or public place by a hoarding, gantry or fence per Month $1 per sq mtr N
6 ARCHIVE SEARCH - BUILDING PLANS OR HISTORICAL BUILDING INFORMATION
- Plans held by City of Perth and Town of Cambridge per Building $60.50 Y
- Plans for Concession Card Holders per Building $33.00 Y
____________________________________________________________________________________________
Page 7. 18
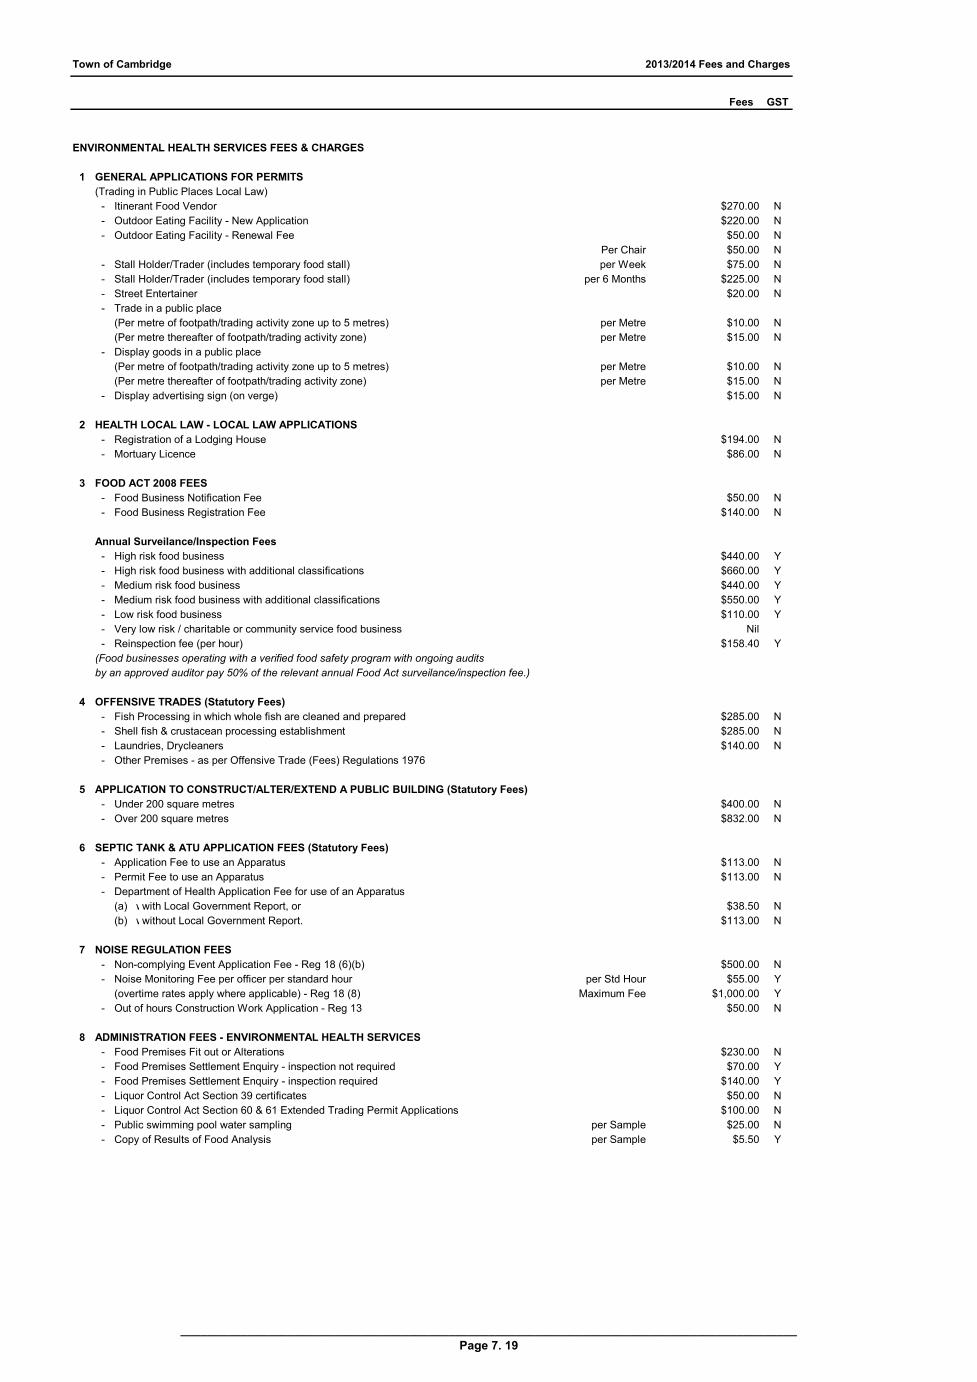
Town of Cambridge 2013/2014 Fees and Charges
Fees GST
ENVIRONMENTAL HEALTH SERVICES FEES & CHARGES
1 GENERAL APPLICATIONS FOR PERMITS
(Trading in Public Places Local Law)
- Itinerant Food Vendor $270.00 N
- Outdoor Eating Facility - New Application $220.00 N
- Outdoor Eating Facility - Renewal Fee $50.00 N
Per Chair $50.00 N
- Stall Holder/Trader (includes temporary food stall) per Week $75.00 N
- Stall Holder/Trader (includes temporary food stall) per 6 Months $225.00 N
- Street Entertainer $20.00 N
- Trade in a public place
(Per metre of footpath/trading activity zone up to 5 metres) per Metre $10.00 N
(Per metre thereafter of footpath/trading activity zone) per Metre $15.00 N
- Display goods in a public place
(Per metre of footpath/trading activity zone up to 5 metres) per Metre $10.00 N
(Per metre thereafter of footpath/trading activity zone) per Metre $15.00 N
- Display advertising sign (on verge) $15.00 N
2 HEALTH LOCAL LAW - LOCAL LAW APPLICATIONS
- Registration of a Lodging House $194.00 N
- Mortuary Licence $86.00 N
3 FOOD ACT 2008 FEES
- Food Business Notification Fee $50.00 N
- Food Business Registration Fee $140.00 N
Annual Surveilance/Inspection Fees
- High risk food business $440.00 Y
- High risk food business with additional classifications $660.00 Y
- Medium risk food business $440.00 Y
- Medium risk food business with additional classifications $550.00 Y
- Low risk food business $110.00 Y
- Very low risk / charitable or community service food business Nil
- Reinspection fee (per hour) $158.40 Y
(Food businesses operating with a verified food safety program with ongoing audits
by an approved auditor pay 50% of the relevant annual Food Act surveilance/inspection fee.)
4 OFFENSIVE TRADES (Statutory Fees)
- Fish Processing in which whole fish are cleaned and prepared $285.00 N
- Shell fish & crustacean processing establishment $285.00 N
- Laundries, Drycleaners $140.00 N
- Other Premises - as per Offensive Trade (Fees) Regulations 1976
5 APPLICATION TO CONSTRUCT/ALTER/EXTEND A PUBLIC BUILDING (Statutory Fees)
- Under 200 square metres $400.00 N
- Over 200 square metres $832.00 N
6 SEPTIC TANK & ATU APPLICATION FEES (Statutory Fees)
- Application Fee to use an Apparatus $113.00 N
- Permit Fee to use an Apparatus $113.00 N
- Department of Health Application Fee for use of an Apparatus
(a) with local government reportwith Local Government Report, or $38.50 N
(b) without local government reportwithout Local Government Report. $113.00 N
7 NOISE REGULATION FEES
- Non-complying Event Application Fee - Reg 18 (6)(b) $500.00 N
- Noise Monitoring Fee per officer per standard hour per Std Hour $55.00 Y
(overtime rates apply where applicable) - Reg 18 (8) Maximum Fee $1,000.00 Y
- Out of hours Construction Work Application - Reg 13 $50.00 N
8 ADMINISTRATION FEES - ENVIRONMENTAL HEALTH SERVICES
- Food Premises Fit out or Alterations $230.00 N
- Food Premises Settlement Enquiry - inspection not required $70.00 Y
- Food Premises Settlement Enquiry - inspection required $140.00 Y
- Liquor Control Act Section 39 certificates $50.00 N
- Liquor Control Act Section 60 & 61 Extended Trading Permit Applications $100.00 N
- Public swimming pool water sampling per Sample $25.00 N
- Copy of Results of Food Analysis per Sample $5.50 Y
____________________________________________________________________________________________
Page 7. 19
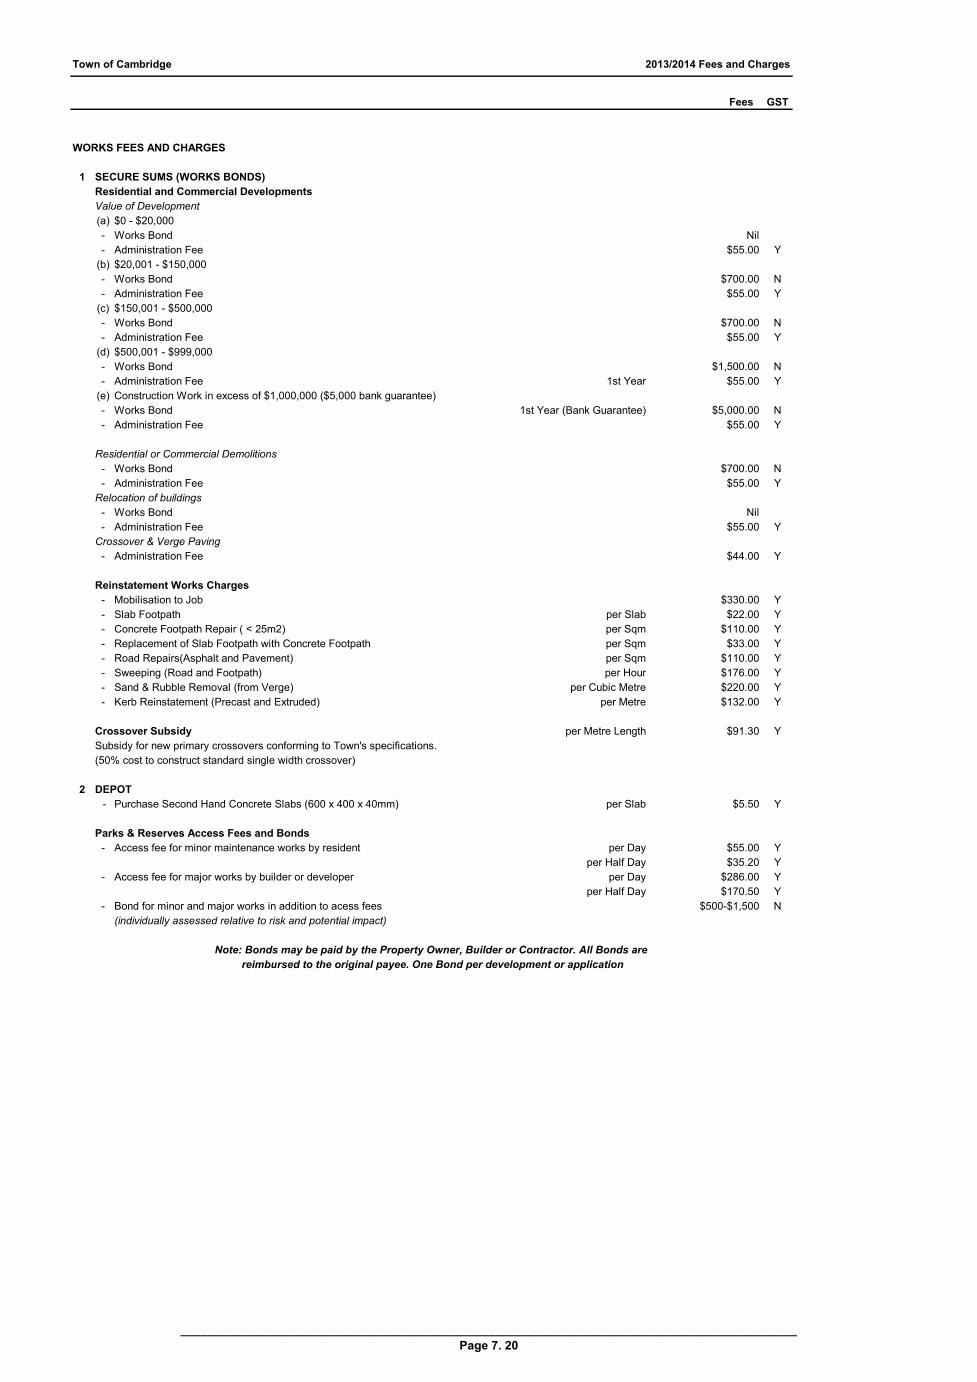
Town of Cambridge 2013/2014 Fees and Charges
Fees GST
WORKS FEES AND CHARGES
1 SECURE SUMS (WORKS BONDS)
Residential and Commercial Developments
Value of Development
(a) $0 - $20,000
- Works Bond Nil
- Administration Fee $55.00 Y
(b) $20,001 - $150,000
- Works Bond $700.00 N
- Administration Fee $55.00 Y
(c) $150,001 - $500,000
- Works Bond $700.00 N
- Administration Fee $55.00 Y
(d) $500,001 - $999,000
- Works Bond $1,500.00 N
- Administration Fee 1st Year $55.00 Y
(e) Construction Work in excess of $1,000,000 ($5,000 bank guarantee)
- Works Bond 1st Year (Bank Guarantee) $5,000.00 N
- Administration Fee $55.00 Y
Residential or Commercial Demolitions
- Works Bond $700.00 N
- Administration Fee $55.00 Y
Relocation of buildings
- Works Bond Nil
- Administration Fee $55.00 Y
Crossover & Verge Paving
- Administration Fee $44.00 Y
Reinstatement Works Charges
- Mobilisation to Job $330.00 Y
- Slab Footpath per Slab $22.00 Y
- Concrete Footpath Repair ( < 25m2) per Sqm $110.00 Y
- Replacement of Slab Footpath with Concrete Footpath per Sqm $33.00 Y
- Road Repairs(Asphalt and Pavement) per Sqm $110.00 Y
- Sweeping (Road and Footpath) per Hour $176.00 Y
- Sand & Rubble Removal (from Verge) per Cubic Metre $220.00 Y
- Kerb Reinstatement (Precast and Extruded) per Metre $132.00 Y
Crossover Subsidy per Metre Length $91.30 Y
Subsidy for new primary crossovers conforming to Town's specifications.
(50% cost to construct standard single width crossover)
2 DEPOT
- Purchase Second Hand Concrete Slabs (600 x 400 x 40mm) per Slab $5.50 Y
Parks & Reserves Access Fees and Bonds
- Access fee for minor maintenance works by resident per Day $55.00 Y
per Half Day $35.20 Y
- Access fee for major works by builder or developer per Day $286.00 Y
per Half Day $170.50 Y
- Bond for minor and major works in addition to acess fees $500-$1,500 N
(individually assessed relative to risk and potential impact)
Note: Bonds may be paid by the Property Owner, Builder or Contractor. All Bonds are
reimbursed to the original payee. One Bond per development or application
____________________________________________________________________________________________
Page 7. 20
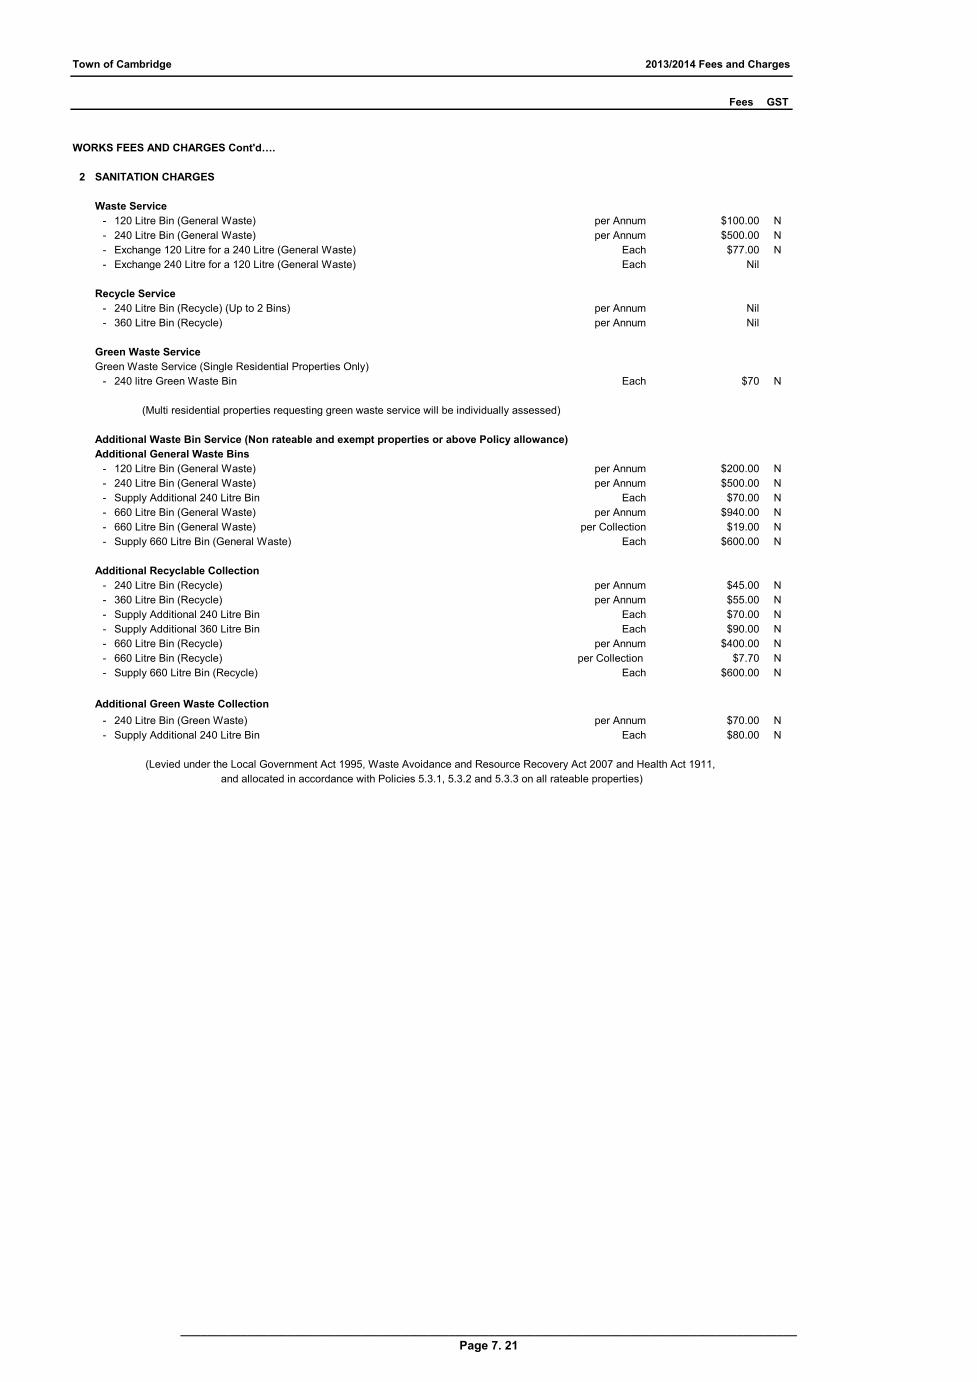
Town of Cambridge 2013/2014 Fees and Charges
Fees GST
WORKS FEES AND CHARGES Cont'd….
2 SANITATION CHARGES
Waste Service
- 120 Litre Bin (General Waste) per Annum $100.00 N
- 240 Litre Bin (General Waste) per Annum $500.00 N
- Exchange 120 Litre for a 240 Litre (General Waste) Each $77.00 N
- Exchange 240 Litre for a 120 Litre (General Waste) Each Nil
Recycle Service
- 240 Litre Bin (Recycle) (Up to 2 Bins) per Annum Nil
- 360 Litre Bin (Recycle) per Annum Nil
Green Waste Service
Green Waste Service (Single Residential Properties Only)
- 240 litre Green Waste Bin Each $70 N
(Multi residential properties requesting green waste service will be individually assessed)
Additional Waste Bin Service (Non rateable and exempt properties or above Policy allowance)
Additional General Waste Bins
- 120 Litre Bin (General Waste) per Annum $200.00 N
- 240 Litre Bin (General Waste) per Annum $500.00 N
- Supply Additional 240 Litre Bin Each $70.00 N
- 660 Litre Bin (General Waste) per Annum $940.00 N
- 660 Litre Bin (General Waste) per Collection $19.00 N
- Supply 660 Litre Bin (General Waste) Each $600.00 N
Additional Recyclable Collection
- 240 Litre Bin (Recycle) per Annum $45.00 N
- 360 Litre Bin (Recycle) per Annum $55.00 N
- Supply Additional 240 Litre Bin Each $70.00 N
- Supply Additional 360 Litre Bin Each $90.00 N
- 660 Litre Bin (Recycle) per Annum $400.00 N
- 660 Litre Bin (Recycle) per Collection $7.70 N
- Supply 660 Litre Bin (Recycle) Each $600.00 N
Additional Green Waste Collection
- 240 Litre Bin (Green Waste) per Annum $70.00 N
- Supply Additional 240 Litre Bin Each $80.00 N
and allocated in accordance with Policies 5.3.1, 5.3.2 and 5.3.3 on all rateable properties)
(Levied under the Local Government Act 1995, Waste Avoidance and Resource Recovery Act 2007 and Health Act 1911,
____________________________________________________________________________________________
Page 7. 21