0dwhuldo (6, iru&khp&rpp 7klv - rsc.org · step of the fitting procedure, the peak...
TRANSCRIPT

Electronic Supplementary information (ESI)
Enabling Multi-electron Reaction of ɛ-VOPO4 to Reach Theoretical Capacity for Lithium-ion Batteries
Carrie Siu,a Ieuan D. Seymour,b Sylvia Britto,b Jatinkumar Rana,a Hanlei Zhang,a Jun Feng,a Fredrick O. Omenya,a Hui Zhou,a Natasha A. Chernova,a Guangwen Zhou,a Clare P. Grey,b
Louis F. J. Piper,a M. Stanley Whittinghama
a NorthEast Center for Chemical Energy Storage (NECCES) at Binghamton University in Binghamton, NY, 13902, USA bDepartment of Chemistry at University of Cambridge, Cambridge, UK Experimental Methods: Synthesis:
ɛ-VOPO4 was synthesized by calcining the monoclinic H2VOPO4 precursor, as reported by Song et al. [11] 1.75g VCl3 (Sigma-Aldrich, 97%), and 0.88g P2O5 (Sigma-Aldrich, ≥98%) were dissolved in 30mL 190 proof ethanol (Pharmco-AAPER). The solution was placed in a 4748 Type 125 mL PTFE-lined reactor (Parr Instrument Co.) and the reaction was set to 180 °C for 72 hours. The hydrothermal product was collected by centrifugation and heated at 550 °C in flowing oxygen for 3 hours.
Chemical lithiation of ε-VOPO4 was performed in a glovebox under helium atmosphere at ambient temperature. To prepare e-Li2VOPO4, 0.243g (1.5mmol) e-VOPO4 powders was dispersed into 10mL hexane in a 50mL jar, equipped with a stir bar. Then, 2.1mL (3.3mmol, 1.6 M in hexane) n-butyllithium was added to the jar at ambient temperature. It should be noted that there is a 10% excess of n-butyllithium (3.3 mmol comparing to stoichiometric 3mmol) added to the reaction. The dispersion was then stirred after the jar was capped and sealed with a paraffin film in the glovebox. After 48 hours stirring, the solid was washed three times with hexane and collected after drying. The samples were then stored in the helium filled glovebox. Materials Characterization:
For XRD measurements, a Bruker D8 Advanced X-ray diffractometer equipped with Cu Kα source, λ = 1.54178 Å. The intensities were recorded within the 2θ range from 10° to 80° with 2θ steps of 0.02° from powder samples. The unit cell parameters were obtained by Rietveld refinement with the TOPAS program.
Scanning electron microscopy (SEM) measurements were performed with a Zeis Supra-55 VP field emission scanning electron, using both the secondary electron and InLens modes to determine the morphology and particle size, at an acceleration voltage of 10 kV.
Transmission electron microscopy (TEM) imaging was performed using the FEI Titan 80-300 microscope with a field emission gun (FEG) and an image aberration corrector, operated at an acceleration voltage of 300 kV. The pristine material was dispersed on a copper grid coated with a lacey carbon film for high-resolution transmission electron microscopy (HRTEM) observation.
Electronic Supplementary Material (ESI) for ChemComm.This journal is © The Royal Society of Chemistry 2018

7Li and spectra were acquired at a magic angle (MAS) spinning frequency of 50 or 60 kHz, using a Bruker 1.3 mm HX probe. The spectra were acquired on 4.7 T (200 MHz) Bruker Avance III widebore magnet at a larmor frequency of 77.775 MHz. A rotor synchronized, spin-echo pulse sequence was used for 7Li, with a π/2 pulse length of 1.02 µs at a power of 43.5 W, set on an external reference of Li2CO3 (referenced to 1.1 ppm). A recycle delay of 1 s was used to acquire the 7Li NMR spectra, unless otherwise stated. X-ray absorption spectroscopy (XAS) measurements were carried out at the beamline 9-BM of Advanced Photon Source. The data was recorded in transmission mode at the V K-edge of electrochemically discharged/charged samples of ε-VOPO4. The absolute energy calibration of the monochromator was carried out using the first peak in the derivative spectrum of the pure V foil. Electrochemistry:
The electrodes were prepared by mixing the active material, ε-VOPO4, with graphene nanoplatelets (surface area 750m2/g, XG Sciences) as a carbon additive and polyvinylidene fluoride (PVDF, Aldrich) binder in a weight ratio of 75:15:10. The slurry was created by adding 1-methyl-2-pyrrolidinone (NMP, Aldrich) which was then laminated onto an aluminum foil 144 current collector and vacuum-dried overnight before use. The dried electrodes, of area 1.2 cm2, contained 8-10 mg of active material and were assembled in 2325-type coin cells in a He-filled glovebox with a pure lithium chip (thickness 0.38 mm, Aldrich) as the counter and reference electrode. The electrolyte used was lithium hexafluorophosphate (1 M LiPF6) dissolved in ethylene carbonate (EC) and dimethyl carbonate (DMC) in 1:1 volume ratio with Celgard 2400 (Hoechst Celanese) as the separator. The electrochemical properties were investigated using the Bio-Logic VMP multichannel potentiostat. The cells were cycled galvanostatically in the high voltage region (3.0 − 4.5 V), low voltage region (1.6 − 3.0 V) and the whole voltage (1.6 − 4.5 V) window at C/50, where 1 C = 2 Li or 305 mAh/g. Cells were also cycled at C/20 over the whole voltage range.
Figure 1. SEM of ε-VOPO4 after heating H2VOPO4 that are hydrothermally synthesized in (a) 95% ethanol and (b) 100% ethanol.

Figure 2. (a) Galvanostatic charge-discharge curves of ɛ-VOPO4 from 1.6 to 4.5 V and (b) cycle performance at C/20, 1C = 2Li
Figure 2a and b show that even at a faster rate, ε-VOPO4 can still deliver a discharge capacity of ~305 mAh/g for up to 40 cycles at C/20. The long high voltage plateau extending past 100 mAh/g is preserved and each of the characteristic steps in the low voltage region are clearly sustained with no signs of diminishing for up to 30 cycles. In Figure 2a, the drop from the high voltage region to the low voltage region evolved to a slope-like curve, which helps make up for the shorter high voltage plateau in the beginning but might indicate a little hysteresis. In subsequent cycles, the high voltage plateau slightly increases. The capacity of the 1st high voltage discharge plateau was ~125 mAh/g and by the 35th cycle, it increased to ~150 mAh/g which is equivalent to 1 Li. The low voltage region seems to show the opposite trend. As the high voltage plateau starts to increase in capacity, the low voltage steps start to decrease as well to maintain the overall discharge capacity at ~305 mAh/g.
Figure 3. CV curve profile of ɛ-VOPO4 at a scan rate of 0.02mV/s
Cyclic voltammetry (CV) curves was measured in the voltage window of 1.6 V to 4.5 V to understand the redox process of ε-VOPO4 is shown in Figure 3. There are four reduction peaks at certain voltages that correspond to four oxidation peaks at similar voltages. Each peak represents the reversible reaction between ε-VOPO4 and ε-Li2VOPO4 that correspond to the

voltage plateaus found upon galvanostatic charge and discharge cycling. Starting from the OCV point at 3.9 V, there is a single oxidation peak at 3.7 V that indicates electrochemical lithiation from ε- VOPO4 to ε-LiVOPO4. As the scan rate test moves to the low voltage region, there are three additional oxidation peaks. Each of the peaks signify the transition from ε-LiVOPO4 to ε-Li2VOPO4 with intermediate stages in between. ε-LiVOPO4 becomes ε-Li1.5VOPO4 at 2.5 V, then it converts to ε-Li1.75VOPO4 at 2.25 V and finally becomes ε-Li2VOPO4 at 2.0 V. Reduction peaks appear as the voltage continues to sweep from the low to high voltage domain, indicating that the V5+ oxidation state of ε-VOPO4 was recovered from V3+ of ε-Li2VOPO4. From ε-Li2VOPO4, it becomes ε-Li1.75VOPO4 at 2.1 V, then ε-Li1.5VOPO4 at 2.25 V and ε-LiVOPO4 at 2.5 V. No further reaction takes place until 4.25 V where ε-LiVOPO4 further reduces to become ε-VOPO4.
Figure 4. XRD pattern with Rietveld refinement of ε-Li2VOPO4 from chemical lithiation of ε-VOPO4
Pure ɛ-Li2VOPO4 was synthesized from the chemically lithiation of ɛ-VOPO4. The observed pattern matched very well to the calculated pattern with no impurities or other vanadyl phosphate phases, resulting in a Rwp value of 10.05%. The cell parameters of the ε-Li2VOPO4 are a = 7.1880 Å, b = 7.1044 Å, c = 7.7760 Å, and α = 89.852°, β = 89.798° and g = 116.371° very close to the literature values of a = 7.1989 Å, b = 7.1012 Å, c = 7.7771 Å, and α = 89.824°, β = 89.812° and g = 116.319°, as reported by Bianchini et al.1
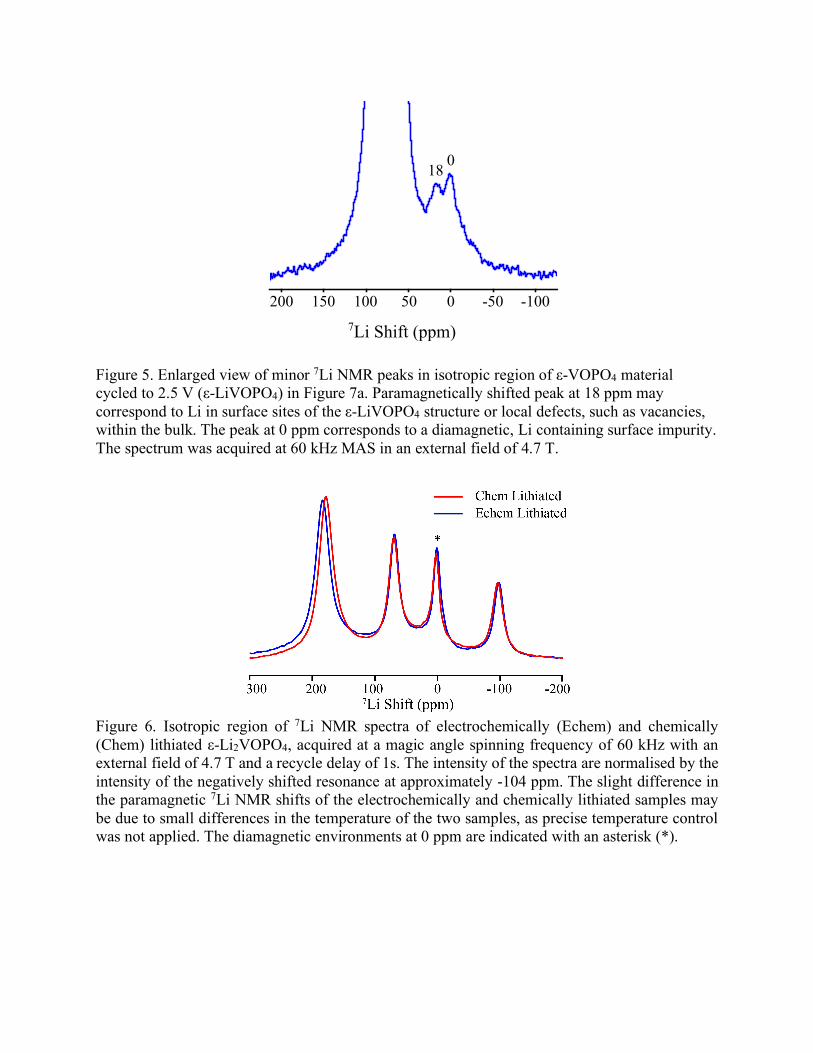
Figure 5. Enlarged view of minor 7Li NMR peaks in isotropic region of ε-VOPO4 material cycled to 2.5 V (ε-LiVOPO4) in Figure 7a. Paramagnetically shifted peak at 18 ppm may correspond to Li in surface sites of the ε-LiVOPO4 structure or local defects, such as vacancies, within the bulk. The peak at 0 ppm corresponds to a diamagnetic, Li containing surface impurity. The spectrum was acquired at 60 kHz MAS in an external field of 4.7 T.
Figure 6. Isotropic region of 7Li NMR spectra of electrochemically (Echem) and chemically (Chem) lithiated ε-Li2VOPO4, acquired at a magic angle spinning frequency of 60 kHz with an external field of 4.7 T and a recycle delay of 1s. The intensity of the spectra are normalised by the intensity of the negatively shifted resonance at approximately -104 ppm. The slight difference in the paramagnetic 7Li NMR shifts of the electrochemically and chemically lithiated samples may be due to small differences in the temperature of the two samples, as precise temperature control was not applied. The diamagnetic environments at 0 ppm are indicated with an asterisk (*).
2007Li Shift (ppm)
150 100 50 0 -50 -100
018
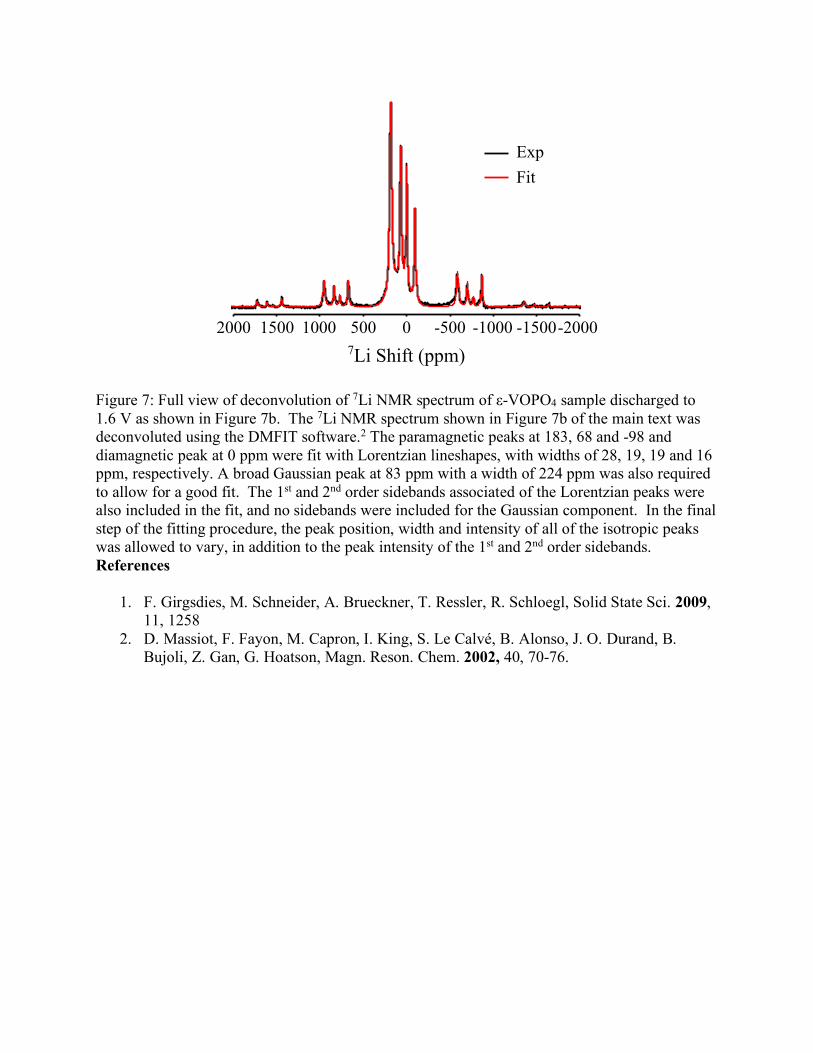
Figure 7: Full view of deconvolution of 7Li NMR spectrum of ε-VOPO4 sample discharged to 1.6 V as shown in Figure 7b. The 7Li NMR spectrum shown in Figure 7b of the main text was deconvoluted using the DMFIT software.2 The paramagnetic peaks at 183, 68 and -98 and diamagnetic peak at 0 ppm were fit with Lorentzian lineshapes, with widths of 28, 19, 19 and 16 ppm, respectively. A broad Gaussian peak at 83 ppm with a width of 224 ppm was also required to allow for a good fit. The 1st and 2nd order sidebands associated of the Lorentzian peaks were also included in the fit, and no sidebands were included for the Gaussian component. In the final step of the fitting procedure, the peak position, width and intensity of all of the isotropic peaks was allowed to vary, in addition to the peak intensity of the 1st and 2nd order sidebands. References
1. F. Girgsdies, M. Schneider, A. Brueckner, T. Ressler, R. Schloegl, Solid State Sci. 2009, 11, 1258
2. D. Massiot, F. Fayon, M. Capron, I. King, S. Le Calvé, B. Alonso, J. O. Durand, B. Bujoli, Z. Gan, G. Hoatson, Magn. Reson. Chem. 2002, 40, 70-76.
2000 1500 1000 500 0 -500 -1000 -1500-20007Li Shift (ppm)
ExpFit