09509 campbell foss hybrid project final report rm … final reports/campbell...appendix b – abs...
TRANSCRIPT

FOSSMARITIMECOMPANY
CAMPBELLFOSSHYBRIDRETROFITFINALREPORT
Rick McKenna

i
TableofContents
EXECUTIVE SUMMARY .................................................................................................................................. 1
1. Design .................................................................................................................................................... 3
Hybrid Design ............................................................................................................................................ 3
Tugboat Modifications .............................................................................................................................. 3
Design Challenges ..................................................................................................................................... 4
2. Construction .......................................................................................................................................... 5
Removals ................................................................................................................................................... 5
Installations ............................................................................................................................................... 5
Construction Challenges ........................................................................................................................... 6
3. Testing and Commissioning .................................................................................................................. 8
Clutch Issue #2 .......................................................................................................................................... 8
4. Post Delivery ....................................................................................................................................... 10
Clutch Issue #3 ........................................................................................................................................ 10
Battery Fire.............................................................................................................................................. 10
5. Emissions Testing ................................................................................................................................ 12
6. Results and Summary .......................................................................................................................... 13
Quantitative Results ................................................................................................................................ 13
Summary ................................................................................................................................................. 16
AppendicesAppendix A – Functional Design Specification Appendix B – ABS Bollard Pull Test Report Appendix C – Customer Acceptance Test Reports Appendix D – U.C Riverside Final Emissions Report Appendix E – Campbell Foss Fire Investigation Report

1
EXECUTIVESUMMARY
Background
In June 2010, the California Air Resources Board awarded the Port of Long Beach a $1,000,000
grant from the Air Quality Improvement Program (AQIP) through Assembly Bill 118 (AB 118) to
demonstrate the feasibility to modify an existing harbor tugboat with a hybrid propulsion
system that would bring about significant reductions in the criteria pollutant emissions Oxides of
Nitrogen (NOx), Particulate Matter (PM) and Carbon Monoxide and Dioxide (CO and CO2), and
considerable improvements in fuel economy. Subsequently the Port of Long Beach contracted
with Foss Maritime Company to retrofit an existing conventionally‐powered ship assist tug to a
hybrid propulsion system. The project officially kicked off in November 2010, and was originally
scheduled to be completed by June 30, 2012. However, due to unforeseen events during the
project’s implementation, Foss and the Port of Long Beach requested and received an extension
for project completion of one year to May 30, 2013.
Project Summary
The candidate tugboat for this project was the Campbell Foss, a conventional sister tug of the
first new build hybrid tugboat, the Carolyn Dorothy, which assists ocean‐going vessels in the San
Pedro Bay. Foss teamed with Aspin, Kemp and Associates (AKA) to develop the hybrid retrofit
design, based on a simplified version of the design that Foss and AKA developed for the Carolyn
Dorothy in 2007. The Foss/AKA team selected batteries from Corvus Energy, a Canadian
company developing the latest generation of lithium‐polymer batteries for the maritime
industry. The Campbell Foss was retrofitted with motor generators, batteries, and control
systems at Foss shipyard in Rainier, Oregon from August to December 2011. Upon completion
of the modifications, the Campbell Foss was vigorously tested, commissioned and re‐entered
service at Long Beach in late January 2012. Within the first month of operation, the Campbell
Foss suffered a clutch failure which required a redesign and retrofit of the clutch actuation
system. The tugboat continued to work in non‐hybrid mode until the new clutch actuation
system was installed. Final emissions testing was performed in July 2012, and the tugboat
continued to work as a hybrid until August 20, 2012, when a fire occurred in the battery
compartment. Although no one was injured, the Campbell Foss was out of service for
approximately three months for an extensive forensic investigation and repair. The tugboat has
been repaired and is currently operating in San Pedro harbor in hybrid mode, but with the
battery system disabled. Foss is planning to reinstall batteries with the required system
modifications once they have been fully designed and vetted.

2
Project Results
Emissions reductions: 31% NOx, 30% CO/CO2, 29% PM
Fuel savings: 25‐30% reduction in fuel consumption
Schedule: The project took approximately 3 months longer than planned to complete, due
to a combination of delay in starting (due to ship‐assist work needs), shipyard
resource sharing, and issues with the clutches and their actuation systems.
Cost: Final cost of the project $2,307,437 – project estimate was $2,391,240, so the
project came in under budget by approximately $80,000.
Operation: The Campbell Foss met all operational goals. It had better bollard pull than
prior to retrofit, cruise speed on one generator was greater than six knots, and
the crew reported the hybrid system works seamlessly and well. Aside from the
issues with the clutch actuation and the battery compartment fire, Foss
Operations was very pleased with the final product.

3
1. DesignDesign for this project was broken into two portions, “Hybrid Design” and “Tugboat
Modification” which are discussed in greater detail below. In general, AKA was responsible for
the Hybrid Design, with input from and review by Foss. The Tugboat Modification design was
done by Foss based on physical requirements of the hybrid components and ancillary
equipment.
HybridDesignThis task covered the detailed design of the hybrid electrical systems and controls, the
fabrication of the electrical control panels and switchboard, and the sizing and purchase of the
hybrid electrical equipment. The Foss contract with AKA included the following:
Finalizing hybrid equipment sizing and requirements.
Finalizing installation drawings, electrical one‐line diagrams, Functional Design Specifications, purchase specifications and other design deliverables to Foss per their quotation.
Purchase of the following equipment: o 500 kW Motor/Generators (M/G’s) o Variable Frequency Drives (VFD’s) o Active Front End drives (AFE’s) o DC/DC converters
Fabricating, testing and delivery of the hybrid switchboard, controllers and Programmable Logic Controller (PLC) cabinets.
The final hybrid design Functional Design Specification is included with this report as Appendix A and provides a detailed description of the hybrid system operation.
TugboatModificationsThis task covered the design of the modifications required to the tugboat’s structural,
mechanical and electrical systems to accommodate the hybrid propulsion system. It also
covered the purchase of the new generator set, shaft drivelines and appurtenances required by
the hybrid propulsion system.
Foss, with support from vendors and subcontractors, performed the following modifications:
Design of the new machinery space layout
Design of modifications to the structure to accommodate the new and relocated equipment
Design of the battery support structure, battery compartment and battery ventilation system, including fire suppression system
Design of a new propulsion shaft drive line to allow for the installation of the M/G’s in the driveline

4
Specification, purchase and delivery of the following equipment: o 350 kW diesel generator set o Main engine clutches o Propulsion shaft drive‐line components (shafts, universal joints, couplings, etc.) o Grid coolers for hybrid electronics and new generator set o Electrical cabling for hybrid system connection o Hydraulic Power Units (HPU’s) for propulsion drive‐line clutches o Batteries – Lithium Polymer from Corvus Energy
Foss had originally planned to use Absorbed Glass Mat (AGM) lead acid batteries for this project,
similar to those used on the Carolyn Dorothy. However, during detailed design, Foss chose to
go with new Lithium Polymer batteries designed and packaged by Corvus Energy. These
batteries were state‐of‐the‐art units with internal sensing, cooling and alarming functions, had 2
‐ 4 times the expected life, were smaller for the same amount of power, and could be cycled
significantly more than the equivalent AGMs. Unfortunately, as discussed later in this report,
the control system for these batteries was the source of a fire in the battery compartment after
the Campbell Foss had been placed back into service as a hybrid.
DesignChallengesAs this was the second hybrid tug built by Foss and AKA, the design process went smoothly and
without many challenges. The system installed on the Campbell Foss was significantly less
complicated and had fewer components than the first system installed the Carolyn Dorothy,
which helped to reduce the design challenges associated with implementing the hybrid system.
Still, there were significant challenges associated with this retrofit, especially since Foss was
modifying an existing tugboat rather than building a new, hybrid‐specific tugboat, as was done
on the Carolyn Dorothy. The biggest challenge with this project was to fit all the required
equipment into the already crowded engine room of an existing Dolphin‐class tugboat. From a
constructability perspective, designing all the hybrid equipment such that it would fit through
the planned access opening was a challenge for AKA.
The Foss/AKA team implemented “lessons‐learned” from the Carolyn Dorothy project in the
design of this project, such as using water‐cooled energy transfer equipment (Active Front Ends,
Variable Frequency Drives, etc.) to reduce component size and susceptibility to overheating;
reduced scope of battery power; and consolidation/elimination of equipment where
practicable. Foss also learned lessons from this Campbell Foss hybrid retrofit, which will be
implemented on future hybrid installations to help refine, simplify and improve the efficiency
and ruggedness of the hybrid system. The “lessons‐learned” on this project include using an
established hydraulic clutch system, simplifying the hybrid equipment cooling system, improving
battery control and alarm software, and designing and installing battery compartment
ventilation and explosion suppression systems. All of these “lessons‐learned” are discussed in
more detail in other areas of this report.

5
2. Construction
Construction on the Campbell Foss was performed at the Foss shipyard in Rainier, Oregon, the
same shipyard that originally built the Campbell Foss in 2005. Due to ship assist work load in
Long Beach, the tugboat departed approximately two weeks later than originally scheduled.
Once arriving at the Rainier yard, the start of the retrofit project was again delayed to allow the
Campbell Foss to perform ship assist work on the Columbia River.
Actual work began at the end of July 2011. The delay in starting the project allowed another
vessel to occupy the large marine railway for an extended period of time, which ended up
causing delays in getting the Campbell Foss out of the water for the work required to her
underwater hull. This in turn caused a delay of approximately one month in completing the
modifications.
RemovalsThe first month of the yard period was devoted mainly to removals required to gain access into
the tugboat and make space for the new hybrid equipment. Foss, with support from vendors
and subcontractors, performed the following tasks:
Removed top of port stack and engine exhaust for access to machinery spaces
Removed deck plates and deck plate supports as needed
Cleaned and gas‐freed machinery spaces and oil tanks
Removed port generator set
Removed miscellaneous equipment (water pressure set, water heater, air tanks, bilge and fire pumps, etc.)
Disassembled ship’s service main switchboard; retained for reuse
Removed and retained auxiliary switchboard
InstallationsThe next three months of the yard period were devoted mainly to installing the new hybrid
components and systems, and to restoring the existing systems and equipment to fit the new
configuration. Foss, with support from vendors and subcontractors, performed the following
tasks required for installations:
Made structural modifications, including: o Modified foundations to support new M/G installation o Fabricated and installed structure for new 350 kW genset o Created structural foundation for new hybrid switchboard o Fabricated battery compartment and support rack, and their structural
foundations o Hull penetrations for new grid coolers
Installed new equipment, including: o Hybrid switchboard (from AKA)
6
o M/G’s o Batteries o Shaft lines (clutches, shafts, couplings, etc.) o 350 kW generator set and its exhaust system o Clutch Hydraulic Power Units (HPUs) o Grid coolers on outside of hull
Ran new and modified existing electrical and communications cabling to connect hybrid components and integrate into existing electrical system
Made all electrical connections, including battery jumpers
Reinstalled previously removed equipment (such as potable water tank, bilge pumps and air compressors)into their new locations
Re‐ran piping disturbed by modifications; installed piping to new equipment as needed
Reinstalled stack and engine exhaust
Cleaned and painted all interior and exterior areas disturbed by retrofit work
Performed initial equipment operational testing
Performed initial electrical connectivity testing
ConstructionChallengesIn addition to the schedule challenges noted above, there were also typical construction
challenges associated with a shipyard project of this scope, such as coordinating work, rigging
large objects through small openings and tight quarters, and installing intricate piping and
electrical systems in a small engine room. Over and above these typical issues, Foss
encountered several challenges that required considerable work to overcome:
Clutch Actuation (Clutch Issue #1)—Based on assurances from the clutch manufacturer,
Foss decided to install air‐actuated clutches between the main engines and the M/G
sets. This was a design change from the hydraulic clutches on the Carolyn Dorothy, and
was thought to be a simpler, cleaner, reduced maintenance solution. Unfortunately,
during initial testing of the M/G sets in November 2011, both clutches failed due to
excessive heat in the air seal units. Investigation showed the issue was that the tight
clearance required to seal the air in the clutch did not allow for the thermal expansion
of the shaft, causing the stationary seal material to contact the rotating shaft. The
clutch manufacturer, Logan, agreed that the clutch actuation needed to switch back to
hydraulic, where the clearances could be enlarged and a fluid medium would always
flow between the seal and the shaft. Foss had to ship the damaged clutch assemblies
back to Logan’s shop in Cleveland, Ohio, where they were reworked for hydraulic
installation. Logan worked with a hydraulics vendor in the Portland, Oregon, area to
develop the required hydraulic actuation package (pump, reservoir, piping and control
valves). This was installed along with the rebuilt clutches in mid‐December and
appeared to work correctly. This entire process caused an additional 3 week delay to
the project.
7
Shaftline Components—The misalignment and torsional couplings on the shaft lines
between the main engines and the motor generators were supplied by Centa
Corporation, an industry leader in these components. The challenge for Centa was to
provide flexibility to allow for the movement and vibration of the main engine (which is
mounted on springs), and to not bind the M/G set (which is bolted directly to the steel
foundation) while still transmitting 2500 HP. The Centa design was a proven one – it is
the same system used on the Carolyn Dorothy. However, the Centa components were
delivered late, were in some cases incorrectly assembled (requiring Foss to
disassemble/reassemble), and in some cases included wrong components. The bolted
“Centa‐link” connections came with bolts that were too short, causing one of them to
strip out the threads in the mating Centa‐supplied torsional coupling. Foss was able to
work through these issues and the final installation worked as planned, but it cost
considerable time and work to remedy.
Switchboard Cooling System—As part of the design improvements implemented on this
project, AKA changed their AC/DC conversion equipment from air cooled to water
cooled. This reduced the size of the equipment considerably, and made the equipment
much less susceptible to overheating in the engine room. The challenge to using water
cooling is that it requires an additional cooling water system be installed. As we didn’t
have a full 3‐D CAD model of the tugboat when the design was started, this system was
not fully designed and required significant work to fit all the valves, manifolds, heat
exchangers, pumps and tubing into the very confined area below the switchboard. The
end result of having a reliable water‐cooled system, however, far outweighed the
difficulties in getting the cooling water system installed.
8
3. TestingandCommissioning
After completion of the hybrid system modifications, the Campbell Foss drove up river to
Portland, Oregon to perform a Bollard Pull test. In this test, the tugboat is attached to a strong
point on the shore (a bollard) by a 300’ high‐strength synthetic rope, and pulls as hard as it can
in both directions (forward and astern). This test took place on December 21, 2011, and the
results were surprising in that the Campbell Foss pulled harder in every hybrid mode than it did
in non‐hybrid mode. Foss/AKA theorized that this increase in pull is due to the electrical power
flow to/from the M/Gs acting to even out the loading on the shafts, allowing them to provide
more consistent, linear torque to the propellers. In a non‐hybrid boat, during bollard pull, each
shaft momentarily provides a little more thrust than the other as the boat is constantly weaving
slightly under the extreme load – on the hybrid, the M/Gs dampened this weaving by causing
both shafts to provide a similar, consistent torque. The Bollard Pull test results were as follows:
Non‐Hybrid Mode: ~62 short tons (124,000 lbs)
Hybrid Mode w/o Batteries: ~63 short tons (126,000 lbs)
Hybrid Model w/ Batteries: ~65 short tons (130,000 lbs)
A copy of the ABS Bollard Pull Report is included as Attachment B to this report.
After this test, the tugboat returned to the Rainier shipyard for final outfit and preparation to
depart to Long Beach for final hybrid system testing and commissioning. The tugboat departed
Rainier on December 31, 2011. However, on Sunday, January 1, 2012, the Campbell Foss
reported that the starboard clutch had overheated, and the tugboat proceeded to Eureka,
California for repairs.
ClutchIssue#2In Eureka, Foss and Logan Clutch engineers worked with the tugboat’s chief engineer to
disassemble the shaft line and remove the starboard clutch. They initially expected that the seal
overheated again, as seen during construction. What they found was that the roller bearings in
the clutch unit had bound and overheated. This was eventually traced to the bearing being
clamped into place too tightly during initial installation, which caused the bearing to bind and
overheat after extended periods of operation. Logan reassembled the clutch with new bearings
and disassembled and inspected the port clutch as well, ensuring all bearings were pre‐
tensioned correctly. The tugboat was in Eureka for 8 days while repairs were made and the
system tested.
At this point, Foss decided to take the tugboat to San Francisco for final hybrid system testing
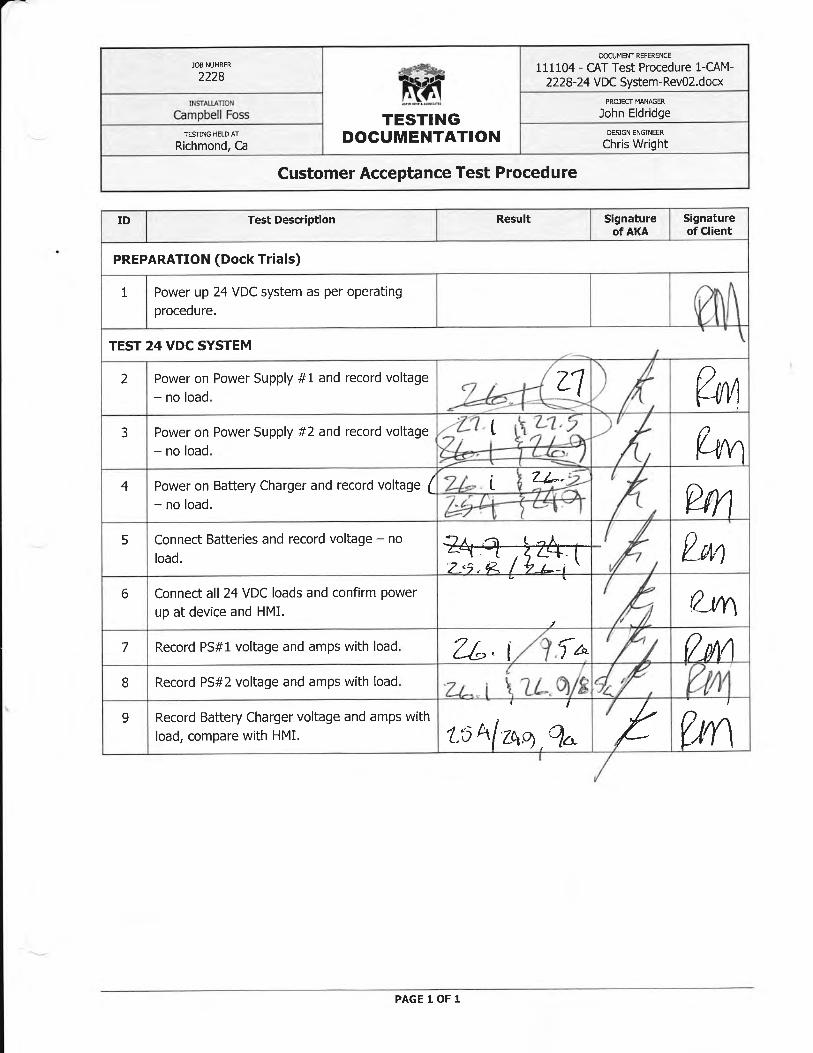
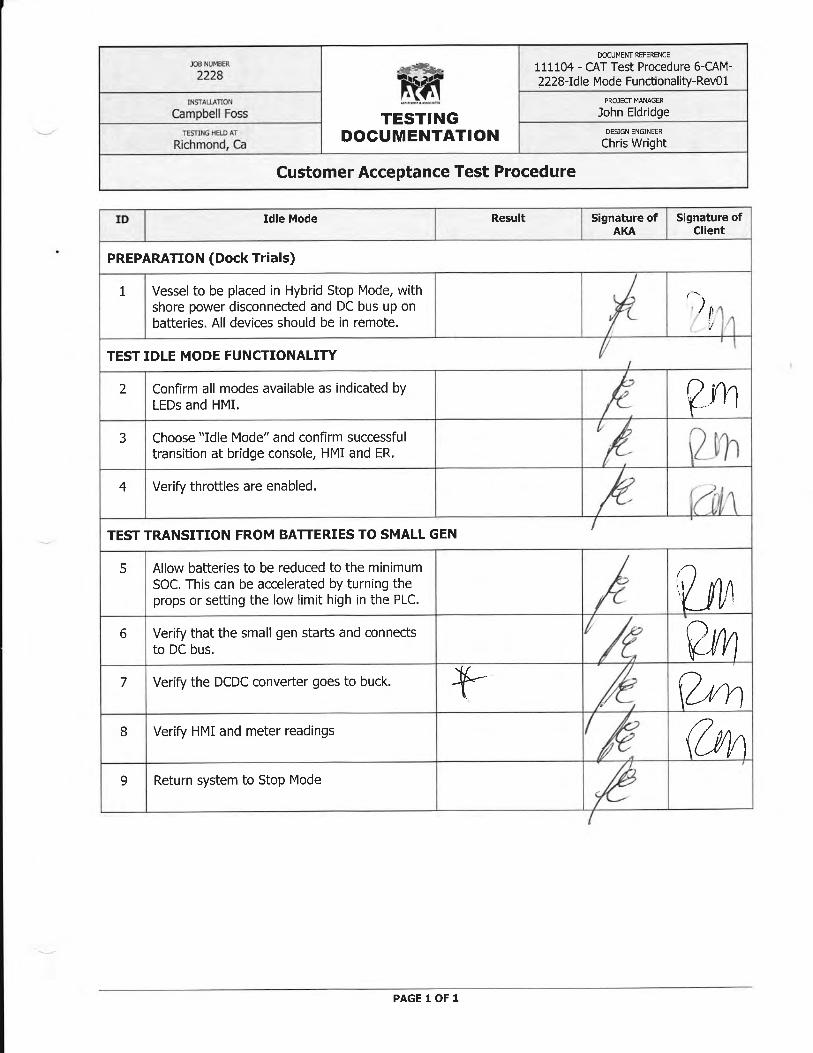
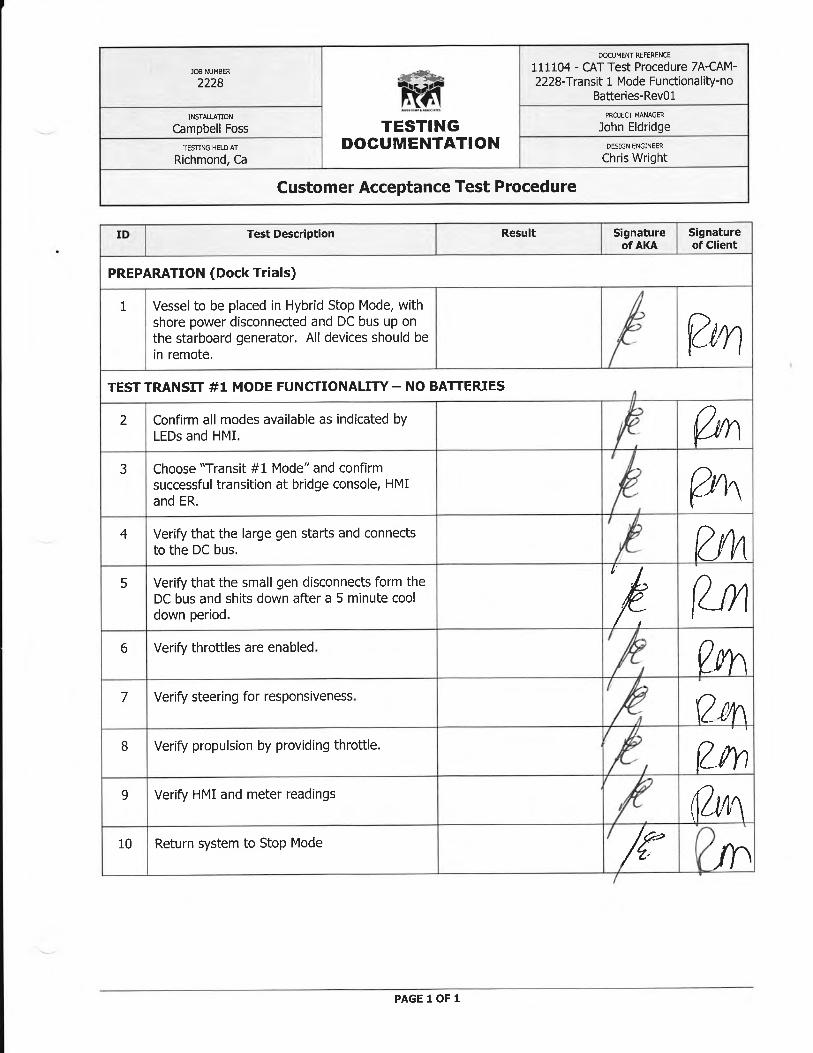
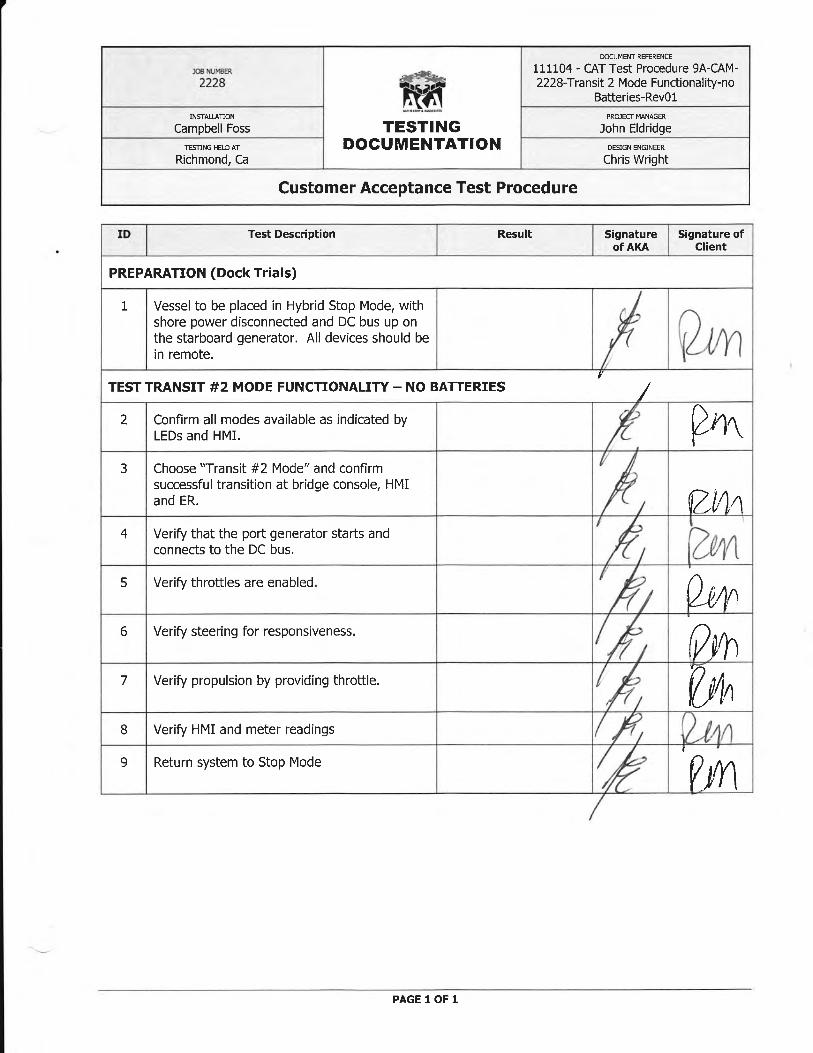
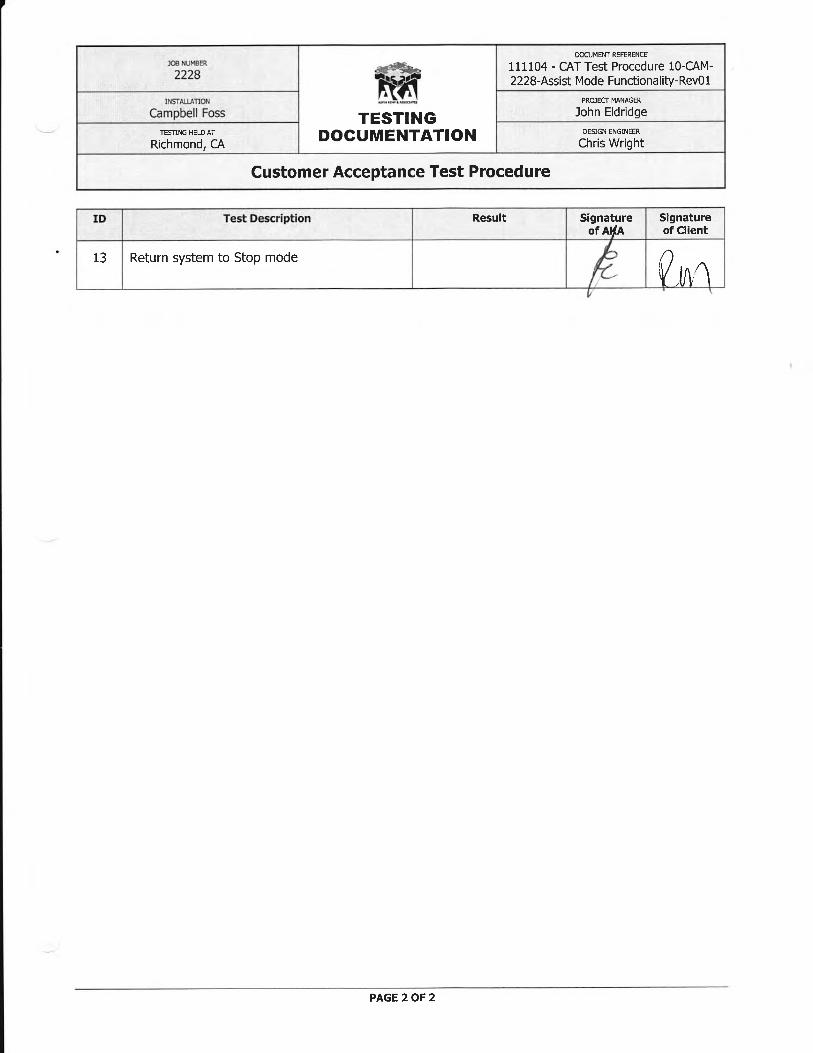
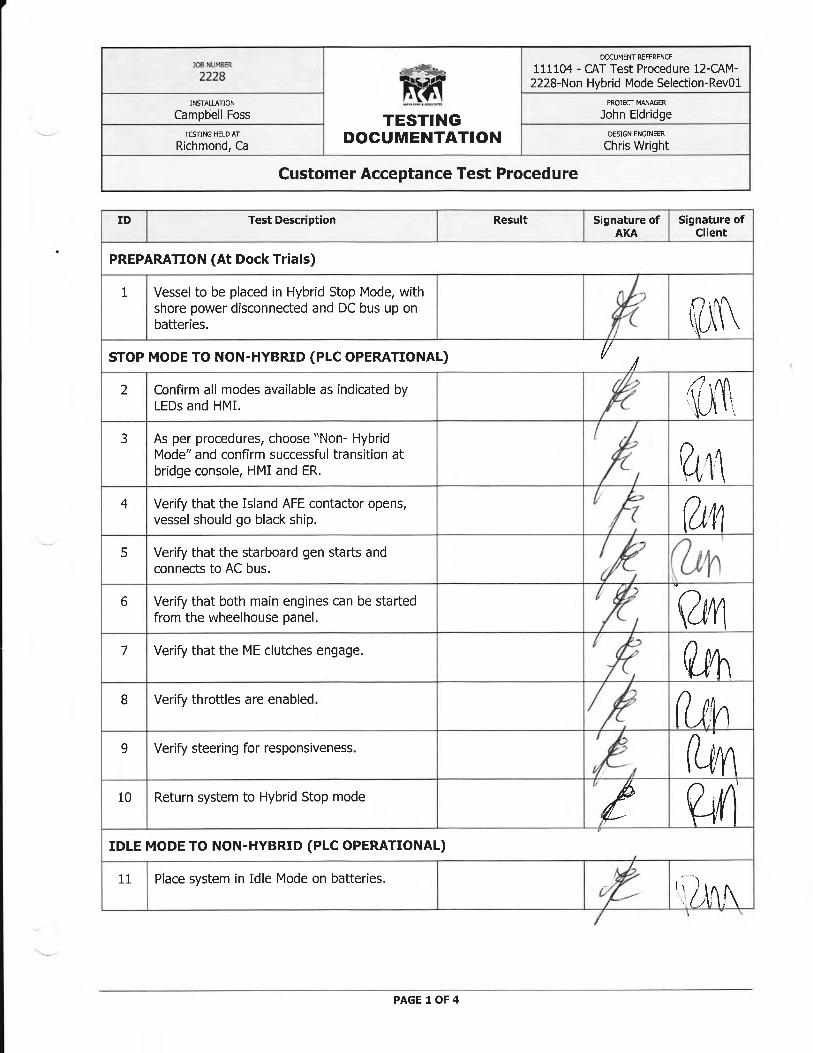
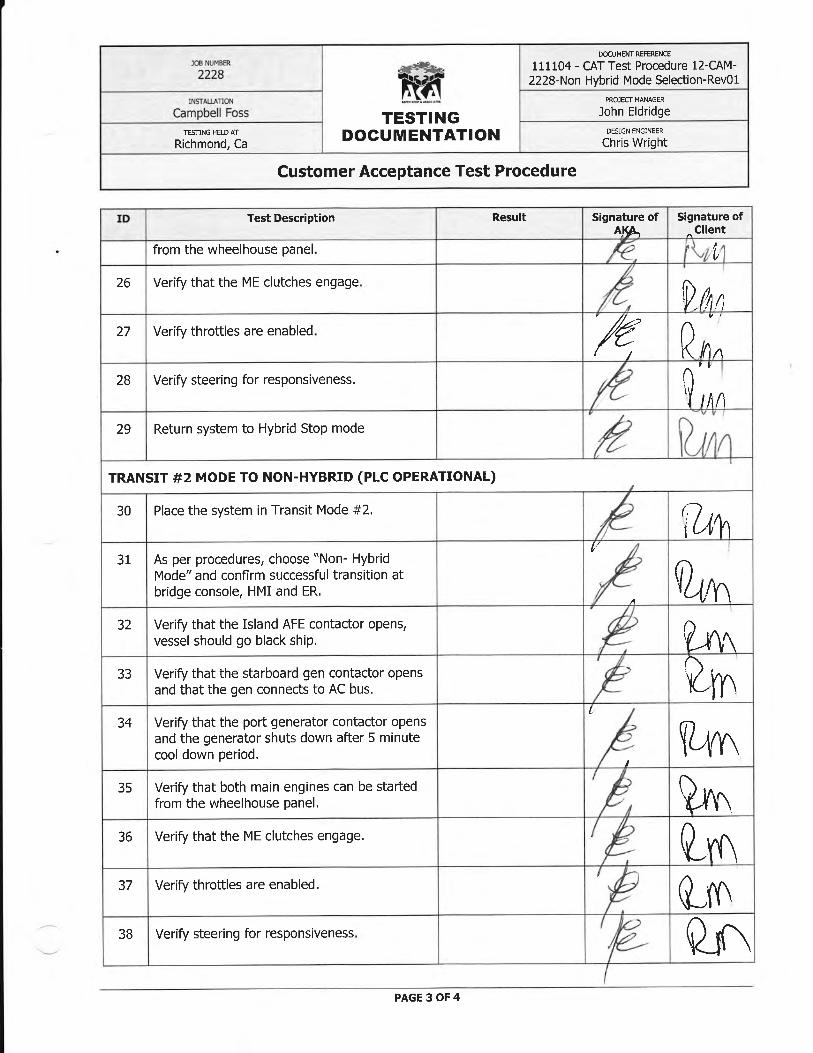
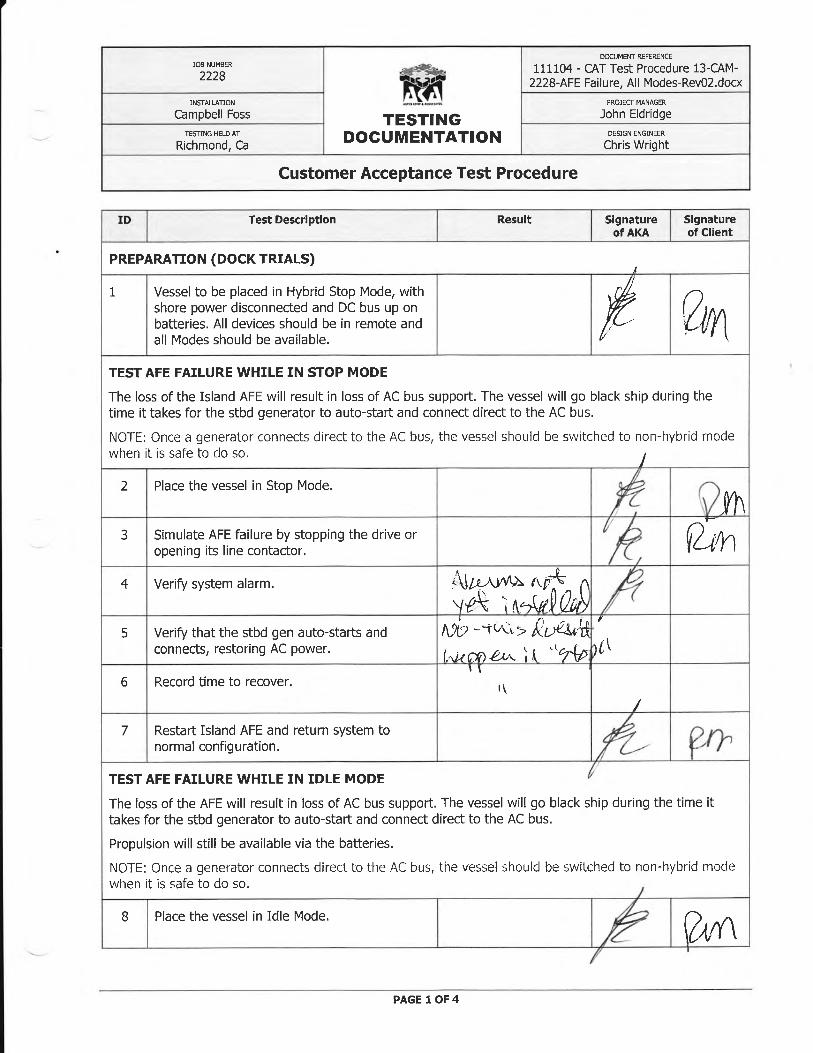
and commissioning. From January 11 through January 20, 2012, Foss and AKA performed a full
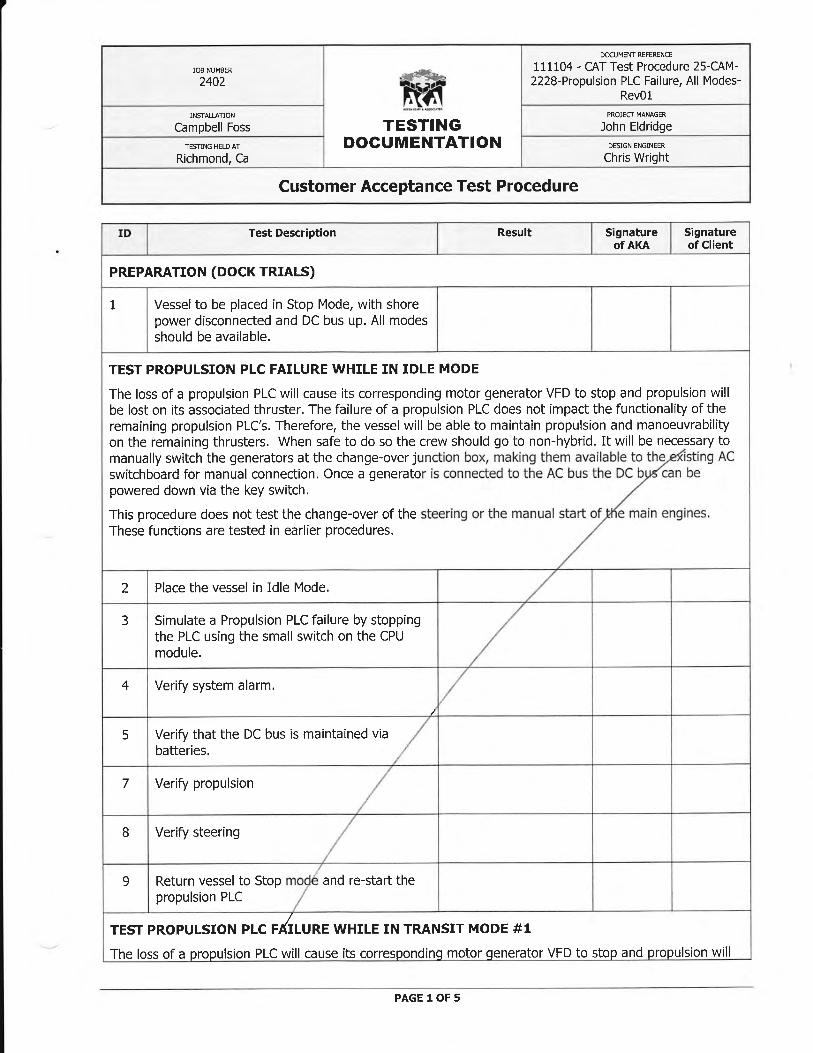
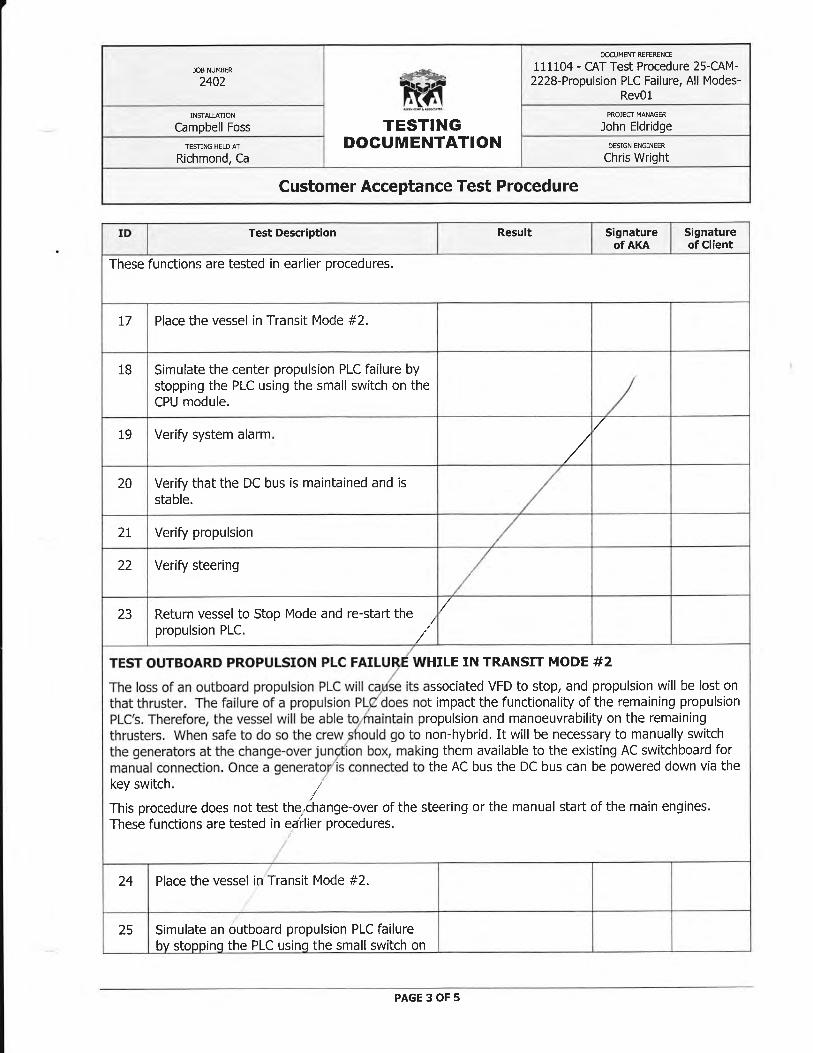
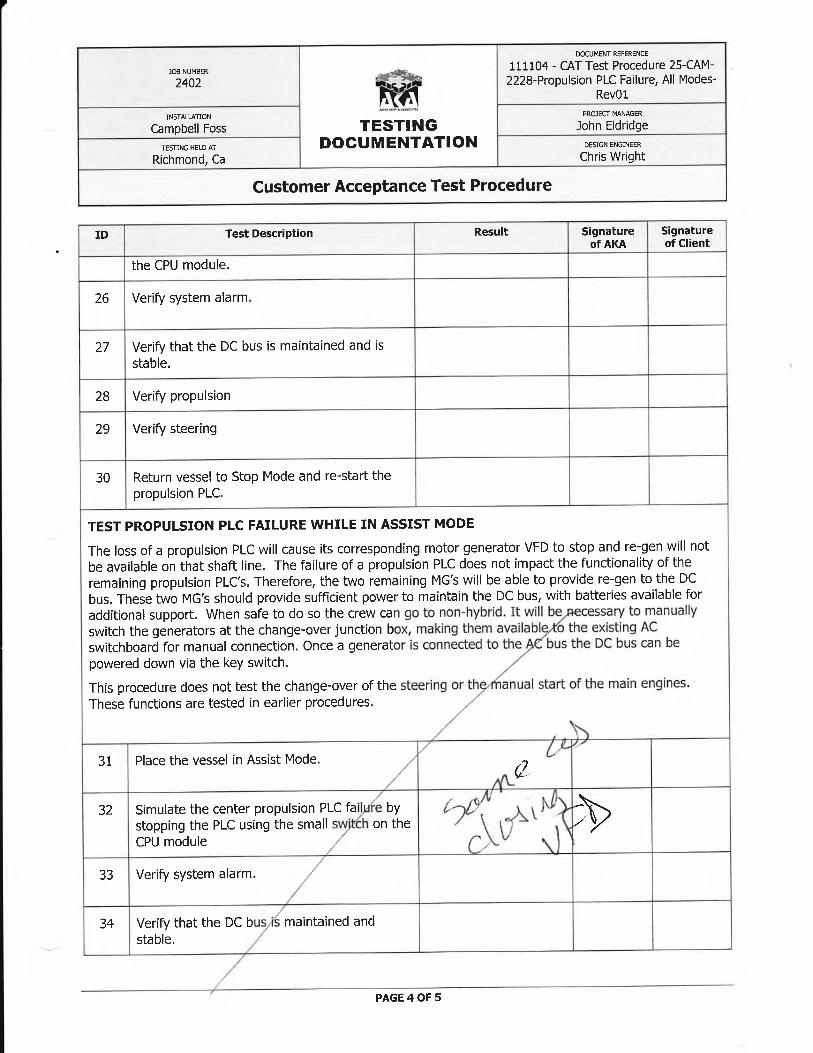
set of operational, endurance, and failure mode tests. In general, these tests went smoothly.

9
The test procedures are included as Appendix C to this report. During this testing, the clutches
were cycled often, and engaged and disengaged as required, but their operation was
inconsistent. Times for engagement and disengagement varied and sometimes the clutches
needed multiple attempts to engage. This continued to be a concern for the crew and Foss
engineering; therefore arrangements were made for ongoing hydraulic system improvement.

10
4. PostDelivery
The Campbell Foss performed her first ship assist job in San Francisco bay on January 21, 2012.
She continued to work in the San Francisco bay for approximately one week due to ship‐assist
work needs, and then headed to Long Beach, California and re‐entered ship assist service in the
end of January.
The tugboat began a full workload of ship assist work as the second hybrid tug in the San Pedro
harbor. Initial indication from the crew was that the system worked very well, and they were
happy to work on the Campbell Foss and enjoyed having her run as a hybrid. Unfortunately,
after being in full service for only two weeks, the port clutch failed.
ClutchIssue#3Logan Clutch again dispatched their field engineers to investigate the cause of the failure. They
found the clutch had failed due to excessive heat caused by the clutch plates not fully
disengaging for approximately 1 minute after the signal to disengage. This is equivalent to
“riding the clutch” on a manual transmission car. The reason the clutch did not disengage was
due to the design of the hydraulic actuation system. Logan replaced the damaged clutch,
checked the other clutch, and the tugboat went back into service in Non‐Hybrid mode (in Non‐
Hybrid mode, the clutches are always fully engaged, so the disengagement problem was not an
issue). Logan researched a solution to the actuation system problem – they needed a system
that would bleed off the hydraulic pressure from the clutch immediately upon getting the “open
clutch” signal. The installed system had a large number of valves and hoses, all of which kept
residual pressure on the clutch while the hydraulic fluid drained away. Logan hired a hydraulics
expert to review the situation and develop a solution. The final solution involved a much
simpler system that uses aircraft‐quality hydraulic components to drop pressure off the clutch
almost instantaneously. The system was shop tested at the Logan facility, and then installed
and tested onboard the Campbell Foss on May 14 ‐ 16, 2012. The system has operated without
further incident since the implementation of this final clutch solution, and Foss believes the
system now to be rugged and reliable.
After some additional updating of the hybrid system software and testing, the tugboat returned
to full hybrid service in the end of May. The tugboat worked through mid‐August without
incident, and the crew confirmed that the hybrid system worked well. University of California‐
Riverside performed their final 1000 hour emissions testing in June, and the final emissions
report is attached as Appendix D.
BatteryFireOn August 20, 2012, while pushing on a ship at a dock, the crew of the tugboat heard a loud
bang along with a shudder through the hull. Black smoke started coming from the engine room
vents and alarms sounded. The crew immediately activated the fire suppression system, which

11
closed the fire dampers, shut off the vent fans and released fire suppression gas into the engine
room. The battery compartment had its own fire suppression system which activated
automatically via a heat sensor.
Foss, in conjunction with AKA and the battery manufacturer Corvus, performed an exhaustive
incident investigation. The report of this investigation is included as Appendix E. The findings of
this investigation indicated that a single battery (1 of 10) exploded due to overheating caused by
consistent overcharging. The battery control system supplied by Corvus monitors the health
and status of each battery, and has multiple levels of safety features and alarms to prevent
overcharging. The system has a function that monitors each element for “over voltage” and
“over temperature”, and is designed to open the charging switches (and stop charging) if it
detects any of these signals. However, during detailed design and commissioning, AKA and
Corvus inadvertently disabled this function while troubleshooting a fix to electrical signal
interferences between the battery control system and other electrical systems, including the
AKA energy management system. Additionally, the batteries had been providing “nuisance”
alarms for non‐essential items for several months; however, Corvus had indicated these were
not critical and could be ignored. This led the crew to assume the recurring alarms were of the
same nature as the previously investigated alarms, which created an atmosphere of
complacency. When other, more critical alarms indicated that one of the batteries was
damaged, they were also ignored, as there was no obvious indication what the alarm was for
(checking the cause of the alarm requires accessing the battery controller with a laptop
computer).
On the mechanical side, the battery compartment held tight during the explosion and ensuing
fire, and the fire suppression system self‐activated and closed the ventilation dampers as
designed. However, the ventilation system downstream of the battery compartment was made
from plastic as it was seen as a non‐critical system since it was separated from the battery
compartment by the fire damper. However, the fire damper did not close immediately during
the initial explosion and blast of hot gasses, so this blast entered the plastic ducting, causing it to
melt and setting on fire adjacent material in the engine room.
After approximately 3 months of investigation and repair, Foss has completed repairs to the
Campbell Foss and it is back up in service in Long Beach harbor. However, it is currently not
using batteries and will continue to operate without batteries until the recommendations and
additional fail‐safe measures noted in the investigation report can be fully designed and
implemented. Foss hopes to implement these measures and return batteries to service in the
hybrid system this summer.
12
5. EmissionsTesting
Foss teamed with University of California – Riverside (UC‐R) to perform the emissions testing on
the Campbell Foss. UC‐R performed the emissions testing on the Carolyn Dorothy and
implemented a similar approach to the Campbell Foss. The testing consisted of four phases:
1. Pre‐modification testing – Pre‐modification testing was performed in Long Beach,
California, in June 2011, prior to the tugboat’s departure to the shipyard for
hybridization. UC‐R installed instrumentation on the exhaust stacks of the old port
genset (the one that would be replaced as part of the retrofit) and the port main engine.
UC‐R then brought in a load bank to connect to the genset and let the engine run at full
power while they recorded the exhaust emissions . Next UC‐R ran the tugboat at full
power against a bulwark and took emissions readings from the port main engine (this
test was done as a verification of the engine emissions, since the main engines were 6
years old).
2. 0‐Hour Testing – After the tugboat had returned to service as a hybrid tugboat, and the
new 350 kW genset had run for a minimum of 300 hours for break‐in, UC‐R again
brought a load‐bank and ran the new generator at full power, measuring the exhaust
emissions. This testing took one full day to complete. The morning was used for
equipment testing set up and the testing was completed in the afternoon.
3. 30‐day Monitoring—After the 0‐hour testing was complete, UC‐R installed monitoring
equipment on the tugboat and in the hybrid system to monitor how long the tugboat
ran in each discrete mode of operation.
4. 1000‐Hour Testing – Once the new genset had accumulated 1000 operating hours, UC‐R
performed the same test as the 0‐hour test, to confirm that there had been no change
in the emissions as the genset got more use.
The purpose of the emissions testing was to determine the level of emissions reductions after
retrofit. The pre‐modification testing was completed to establish a baseline. The 0‐Hour Testing
established the baseline of the new genset after the required “de‐greening” period. The 30‐day
test was performed to establish the percentage of time in each operating mode. The 1,000 hour
test is a durability test to determine if there had been any significant changes in the emissions
profiles of the engines since the baseline testing. For more details on the testing, please refer to
Appendix D.
The final emissions report from UC‐R is attached as Appendix D.

13
6. ResultsandSummary
QuantitativeResultsofEmissionReductionsfromtheHybridizationoftheCampbellFoss
(CarolynDorothyresultsshownforcomparison)
Emissions Reductions: NOx CO/CO2 Particulate Matter
Campbell Foss 31% 30% 29%
Carolyn Dorothy 51% 27% 73%
Fuel Consumption:
Campbell Foss 25% Reduction
Carolyn Dorothy 25% Reduction
Performance: Campbell Foss Carolyn Dorothy
Bollard Pull – no batteries 63 Tons 62 Tons
Bollard Pull – w/batteries 65 Tons 64.5 Tons
Speed on 1 Genset 6 knots 6.5 knots
Speed on 2 Gensets 8 knots 8.5 knots
Financial: Total cost of project was $2,307,437
$83,803 under budget
Comparison of Emissions Results
Comparing the overall emissions results of this study with the earlier ARB study “Evaluating
Emission benefits of a Hybrid Tugboat” from October 2010 shows some similarities and some
significant differences. These differences can be explained and are brought about by:

14
1) The changes in the activity revealed from data logging. For example, the time in the
Assist mode was increased from 22% to 33%. This was mainly due to the fact that
the Campbell Foss was spending more time in moving barges because of the new
travel restrictions due to the Helm Bridge project.
2) The change in emissions due to engines from different manufacturers. In the repower study, the same main propulsion engine was used so there are no differences in emissions from the main engine. However, the first study, Evaluating Emission Benefits of a Hybrid Tugboat (2010) was of a conventional tugboat with a Caterpillar 3512 engine and a hybrid with a Cummins QSK50‐M engine. While both engines complied with the overall weighted emission factors for US EPA Tier 2, the individual model emissions differed significantly.
3) Table 3‐9 shows the emissions differences in grams per hour at different loads. About 30% of the difference is due to the size of the engine as the Caterpillar was rated at 1902 kW and the Cummins was rated at 1342 kW. Still, as the tugboats showed similar histograms, it is clear that the Cummins on the hybrid was a much cleaner engine at the lower operating modes in which the tug mainly operates; thus resulting in the 72% PM benefit in that study and 28% in this study. For this project, the conventional and retrofitted hybrid tugboat had the same main engine so benefits from engine manufacturer cannot be realized.
Table 6‐1: Difference in NOx and PM2.5 Emission Rates across Load Points
CAT 3512C Cummins QSK50-M CAT 3512C Cummins QSK50-M
7% 2439 1035 6.3 9.525% 4867 2674 94 9.850% 7781 5374 195 5075% 9450 7921 97 58
100% 14124 10215 173 54
PM2.5 (g/hr)NOx (g/hr)Engine Load
Considering specific cases, the NOx emission reduction of the earlier study was 51% and for this
study was 31%. This difference can be partially explained by the change in modal activity in the
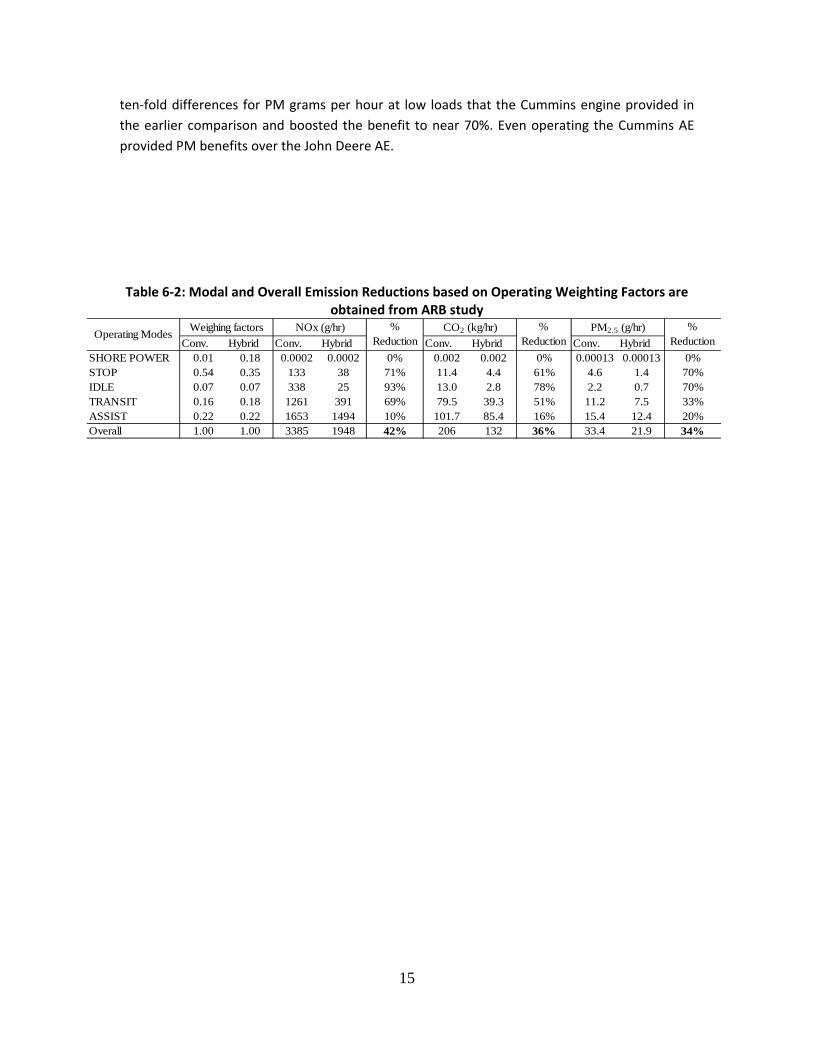
histograms and overall weighting factor for the two cases. Table 6‐2 uses the activity factors
from the earlier study and the NOx reduction of this study would be boosted from the 31%
reported in Section 3.4 to 42%, a value closer to the earlier study. The remainder of the
difference is due to benefits of the cleaner Cummins engine at low loads as described above.
Similarly for the PM some of the differences are due to the higher time in the Assist mode. As
Table 3‐10 indicates, the PM benefits would increase from 28% to 34%. However, it is the near
15
ten‐fold differences for PM grams per hour at low loads that the Cummins engine provided in
the earlier comparison and boosted the benefit to near 70%. Even operating the Cummins AE
provided PM benefits over the John Deere AE.
Table 6‐2: Modal and Overall Emission Reductions based on Operating Weighting Factors are
obtained from ARB study
Conv. Hybrid Conv. Hybrid Conv. Hybrid Conv. HybridSHORE POWER 0.01 0.18 0.0002 0.0002 0% 0.002 0.002 0% 0.00013 0.00013 0%STOP 0.54 0.35 133 38 71% 11.4 4.4 61% 4.6 1.4 70%IDLE 0.07 0.07 338 25 93% 13.0 2.8 78% 2.2 0.7 70%TRANSIT 0.16 0.18 1261 391 69% 79.5 39.3 51% 11.2 7.5 33%ASSIST 0.22 0.22 1653 1494 10% 101.7 85.4 16% 15.4 12.4 20%Overall 1.00 1.00 3385 1948 42% 206 132 36% 33.4 21.9 34%
PM2.5 (g/hr)% Reduction
% Reduction
% Reduction
NOx (g/hr) CO2 (kg/hr)Operating Modes
Weighing factors

16
SummarySetting aside the major issue of the battery fire, Foss was able to successfully modify an existing
harbor tugboat with a hybrid propulsion system that would bring about significant reductions in
fuel consumption and emissions. The hybrid system on the Campbell Foss is less complicated
than its predecessor, the Carolyn Dorothy, and has received great reviews from those who
operate and maintain the tugboat.
The major mechanical issues Foss had with the implementation of this modification all dealt
with the clutches. While they are critical to the success of the tugboat, they had minimal impact
on the hybrid system itself and have effectively been resolved.
The battery fire provides a reminder that the implementation of new technology carries risk.
Fortunately no one was hurt, and damage to the tugboat was minimized due to the quick
actions of the crew and the installed safety systems. However, all future installations of this
technology, especially when utilizing batteries, need to have significant risk assessment and
controls implemented.
Looking forward, Foss continues to embrace and promote hybrid technology on tugboats. In the
summer of 2013, Foss is planning to reinstall batteries on the Campbell Foss once all system
improvements have been designed, tested and vetted. Foss is also currently scheduled to
retrofit another Foss Dolphin‐class tugboat, the Alta June, to a hybrid propulsion system starting
in January of 2014.

APPENDIX A
HYBRID
FUNCTIONAL
DESIGN
SPECIFICATION

Campbell Foss
Hybrid Marine Power System FUNCTIONAL SPECIFICATION (HIGH LEVEL)
VERSION
1 17 JAN 2011
Document Reference: 110117-SPEC-CMBLFOSS-2228B(HighLevel).doc

HYBRID MARINE POWER SYSTEM CAMPBELL FOSS
- version 2110117-SPEC-CMBLFOSS-2228B(HighLevel) PAGE 2 of 10 © Copyright 2010 Aspin Kemp & Associates
I N T E G R A T E D D O C U M E N T A T I O N S Y S T E M
DOCUMENTATION SYSTEM CONTROL
R E V I S I O N C O N T R O L L O G
Version
Description
Date
1
First Issue
January 17, 2011
2
Second Issue
March 23, 2011
CAMPBELL FOSS HYBRID MARINE POWER SYSTEM
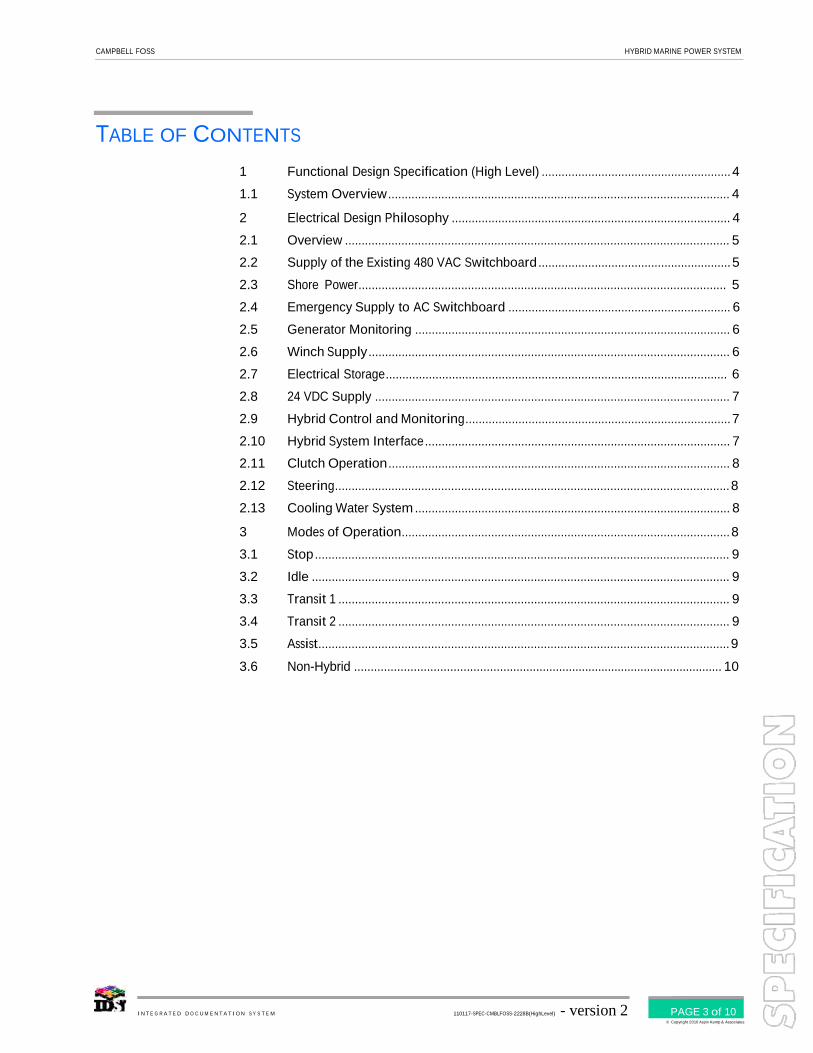
TABLE OF CONTENTS
1 Functional Design Specification (High Level) ......................................................... 4
1.1 System Overview ....................................................................................................... 4
2 Electrical Design Philosophy .................................................................................... 4
2.1 Overview .................................................................................................................... 5
2.2 Supply of the Existing 480 VAC Switchboard .......................................................... 5
2.3 Shore Power............................................................................................................... 5
2.4 Emergency Supply to AC Switchboard ................................................................... 6
2.5 Generator Monitoring ............................................................................................... 6
2.6 Winch Supply ............................................................................................................. 6
2.7 Electrical Storage....................................................................................................... 6
2.8 24 VDC Supply ........................................................................................................... 7
2.9 Hybrid Control and Monitoring................................................................................ 7
2.10 Hybrid System Interface ............................................................................................ 7
2.11 Clutch Operation ....................................................................................................... 8
2.12 Steering....................................................................................................................... 8
2.13 Cooling Water System ............................................................................................... 8
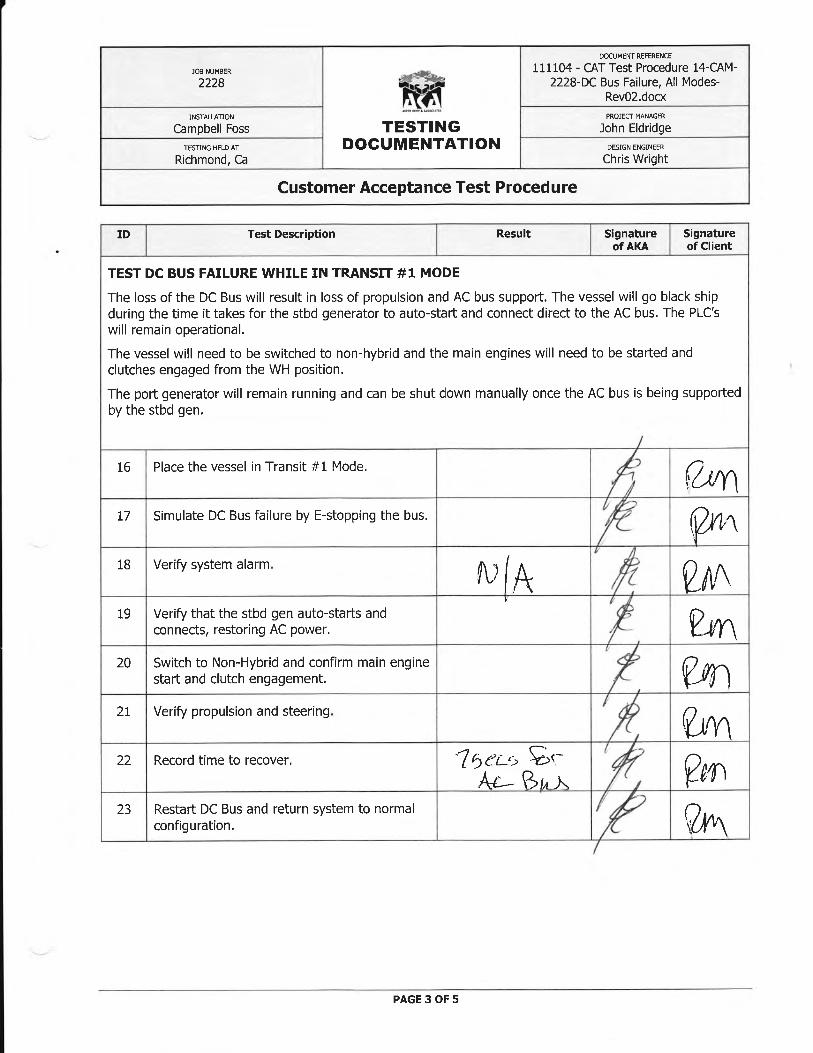
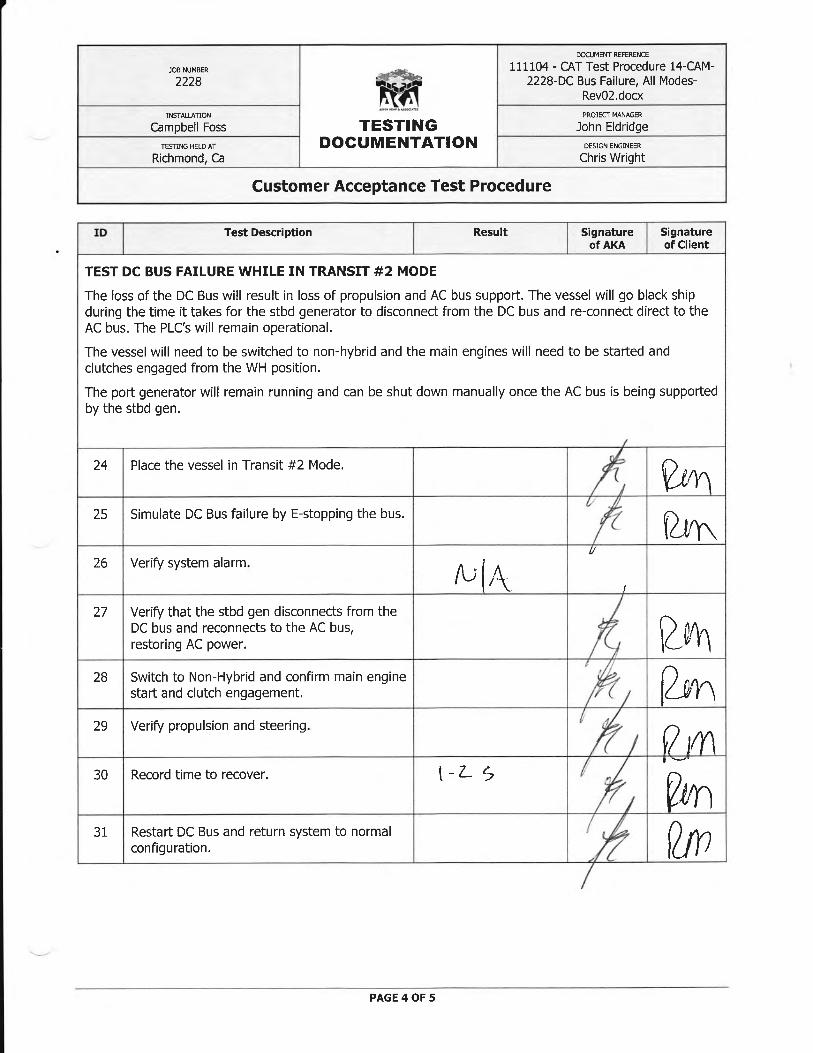
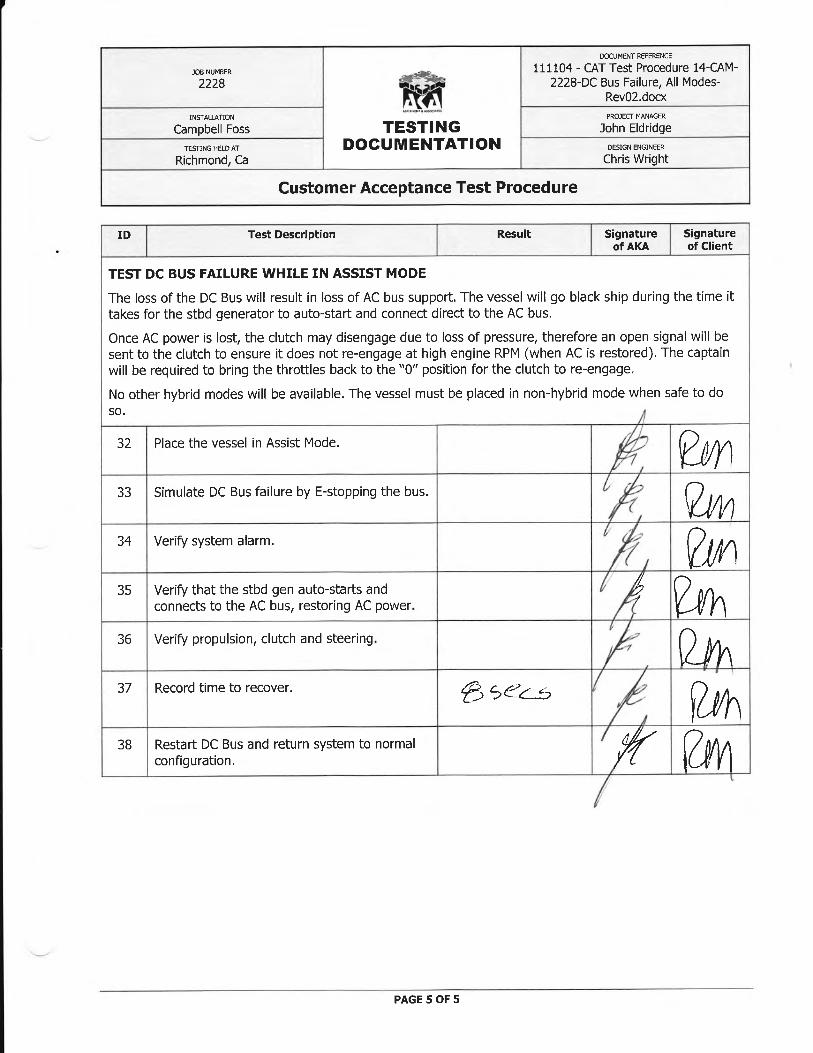
3 Modes of Operation................................................................................................... 8
3.1 Stop ............................................................................................................................. 9
3.2 Idle .............................................................................................................................. 9
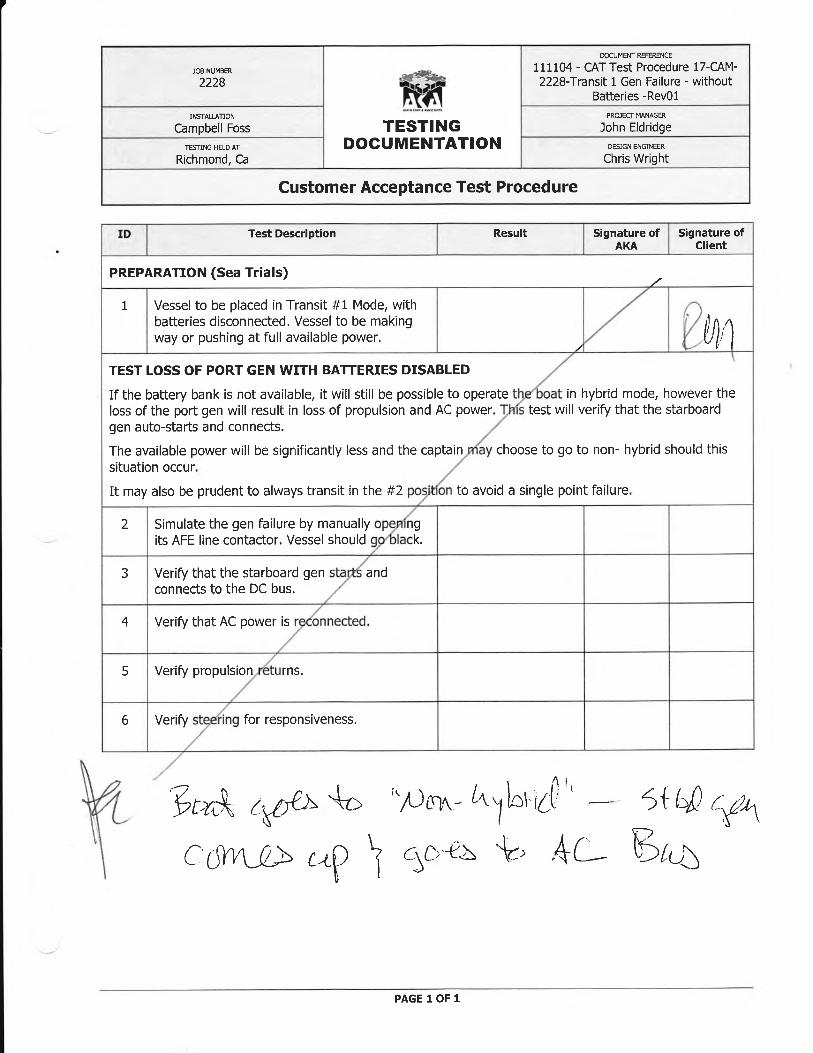
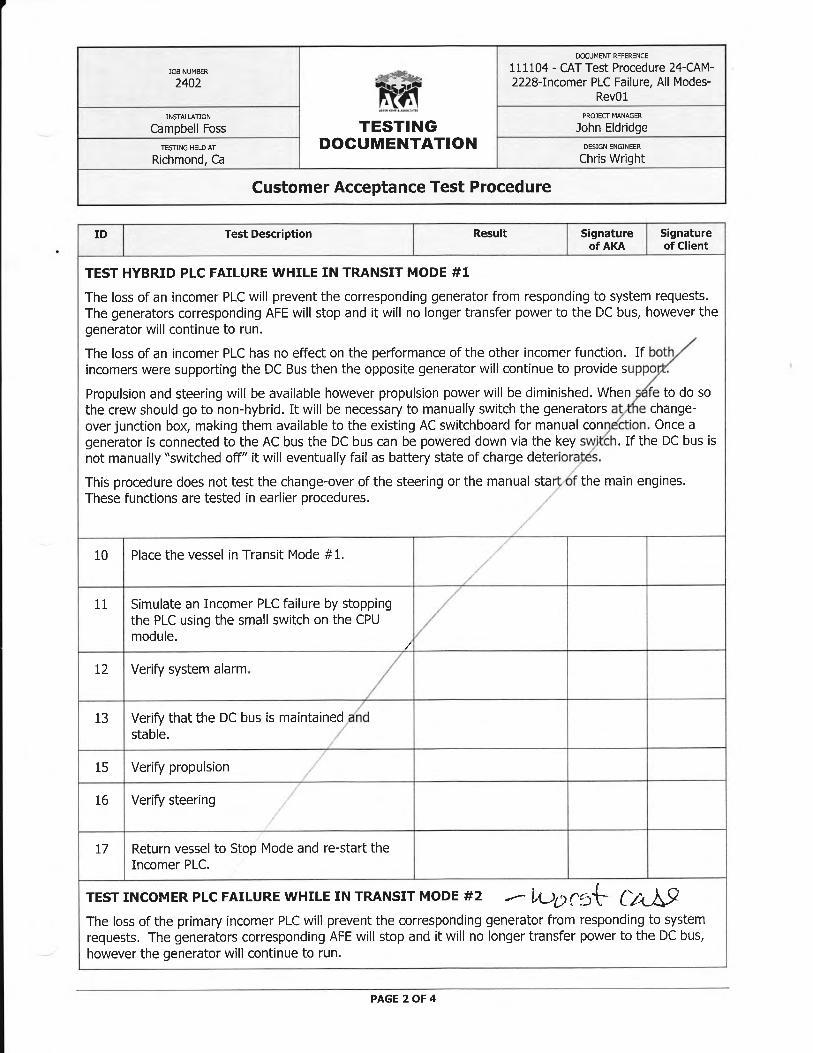
3.3 Transit 1 ...................................................................................................................... 9
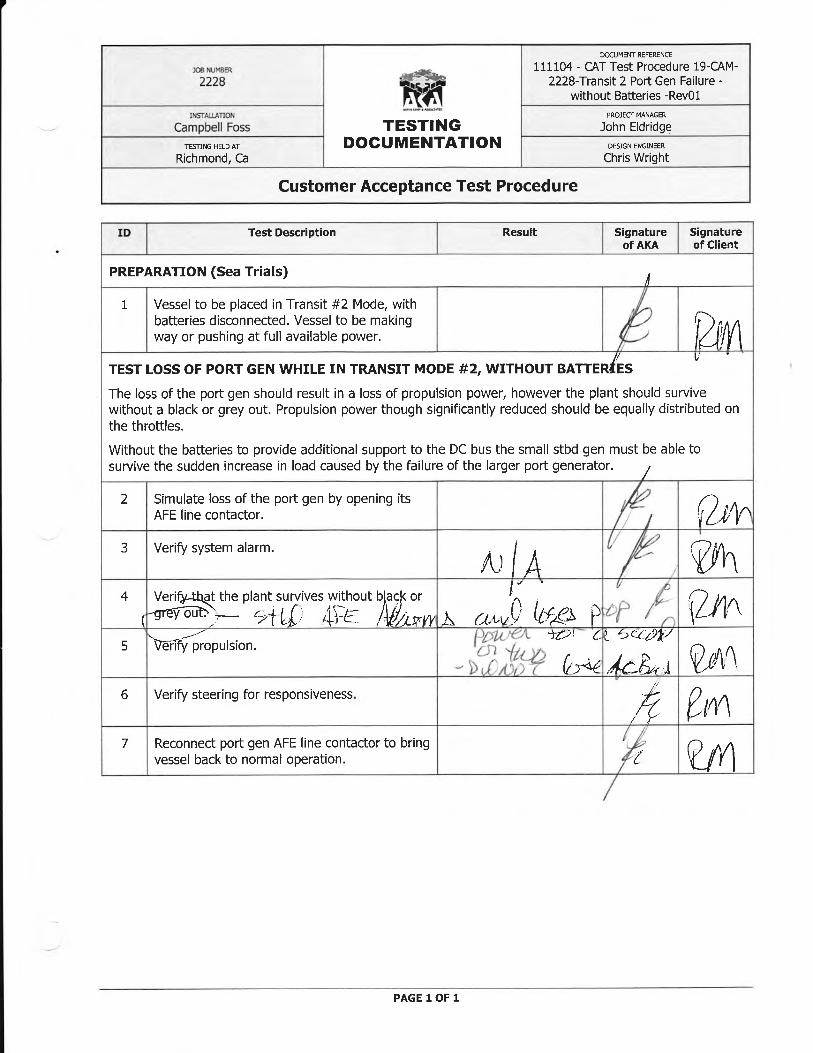
3.4 Transit 2 ...................................................................................................................... 9
3.5 Assist............................................................................................................................ 9
3.6 Non-Hybrid ................................................................................................................ 10
I N T E G R A T E D D O C U M E N T A T I O N S Y S T E M 110117-SPEC-CMBLFOSS-2228B(HighLevel) - version 2 PAGE 3 of 10 © Copyright 2010 Aspin Kemp & Associates

HYBRID MARINE POWER SYSTEM CAMPBELL FOSS
- version 2110117-SPEC-CMBLFOSS-2228B(HighLevel) PAGE 4 of 10 © Copyright 2010 Aspin Kemp & Associates
I N T E G R A T E D D O C U M E N T A T I O N S Y S T E M
1 FUNCTIONAL DESIGN SPECIFICATION (HIGH LEVEL)
This preliminary high level FDS and electrical one-line is intended to provide Foss Maritime the opportunity to comment on the high level aspects of the design. Approval will allow AKA to continue with the detailed electrical and control design which will culminate in the necessary schematics and drawings to begin manufacture of the hybrid system components and development of the system control logic.
1.1 SYSTEM OVERVIEW
The Campbell Foss Hybrid will maintain her Caterpillar 3512D main diesel engines rated at 2540 HP @ 1800 RPM, shafted to Rolls Royce UL 205 Azimuthing Stern Drives (ASDs) through new Foss supplied Logan air clutches. TECO-Westinghouse Propulsion Motor/Generators (M/Gs) rated for 670 HP (500 KW) will be fitted between the main diesels and the ASD’s. The M/Gs will function either as motors to provide propulsive power to the ASD’s, or as generators providing electrical power back to the system.
The M/G’s will be controlled by water cooled Vacon Variable Frequency Drives (VFD’s). Steering and lubrication for the RR ASD’s is provided by shaft driven (belt drive) Hydraulic Power Units (HPU’s).
Additionally, the Campbell Foss will have two diesel generator sets (auxiliary generators) one existing John Deere rated at 168 HP (125 Kw) and one new Detroit Diesel rated at 470 HP (350 Kw) to supply electrical power for propulsion, hotel services for the boat, and to charge the batteries as required. One or both auxiliary generators can provide propulsive power. The number of generators in operation will be determined by the operator based on the mode chosen. Energy for low power requirements and for ‘riding-through’ transient demands is provided by the storage battery.
To ensure additional redundancy the vessel can be operated in a strictly non- hybrid mode of operation, bypassing all hybrid components and control.
2 ELECTRICAL DESIGN PHILOSOPHY
The hybrid system will at a minimum, provide the same or better level of reliability/redundancy as a conventional Dolphin in regards to electrical supply. The system via the driveline configuration will provide additional redundancies in regards to get home propulsion, as compared to a conventional dolphin.

CAMPBELL FOSS HYBRID MARINE POWER SYSTEM
2.1 OVERVIEW
・ Refer to: One-line Drawing - CAM -010-P4190100K Model (1)
The hybrid electrical system will be centered on a common ~800V DC bus. The DC bus is the preferred bus for all major electrical loads. This bus is supported by two water cooled Vacon Active Front End (AFE) converters each fed by its respective 125 KW and 350 KW auxiliary generators. Either or both of these generators can be engaged to support the DC bus. This arrangement eliminates the need for synchronization of the generators. Through Vacon Variable Frequency Drives (VFDs) the DC bus will provide a 480 VAC, 3-phase supply to the propulsion motor/generators. These drives also allow the MG’s to provide energy back to the bus when they are being driven by the main engines. Even at idle the main engines via the MG’s will provide significant power to supply the hotel load of the vessel. This energy flow will be controlled through the VFD’s according to the requirements of the energy management system (EMS). Finally, the Lithium battery bank will be connected to the ~800V DC bus using DCDC converters capable of operating bi-directionally. It is possible to charge the battery arrays from the DC bus or, alternatively, discharge them to the DC bus as required.
The DC bus will be fitted with a bi-directional 140 KW water cooled AFE to supply the existing 480 VAC distribution.
The existing shore power connection via the bi-directional AFE will allow the DC bus to be powered from shore side resources. This will allow the batteries to be charged from the grid and/or alternative energy sources.
2.2 SUPPLY OF THE EXISTING 480 VAC SWITCHBOARD
The main supply to the existing 480 distribution will be via a water cooled 140 KW AFE located within the main DC switchboard. This AFE is sized to provide the hotel load of the vessel including the winch. The AFE acts as an electronic generator. In addition to the AFE, either of the auxiliary generators can connect directly to the AC bus – See “Emergency Supply to AC Switchboard”
2.3 SHORE POWER
The shore power connection will remain on the existing 480 VAC bus. The hotel AFE is bi-directional which allows the DC bus to be supported via shore power allowing the batteries to be charged.
To ensure shore power is not connected to a live bus, both phase rotation protection and dead bus protection will be provided. During connection the vessel will momentarily go “black ship” as now occurs on a conventional Dolphin.
I N T E G R A T E D D O C U M E N T A T I O N S Y S T E M 110117-SPEC-CMBLFOSS-2228B(HighLevel) - version 2 PAGE 5 of 10 © Copyright 2010 Aspin Kemp & Associates

HYBRID MARINE POWER SYSTEM CAMPBELL FOSS
2.4 EMERGENCY SUPPLY TO AC SWITCHBOARD
In the event that the hotel load AFE or DC bus should fail the 125 KW gen will automatically start (if not already running) and connect to the AC bus, a momentary black ship condition would occur. NOTE: In comparison to a conventional Dolphin, a generator failure would also cause a black ship condition, with the difference being that the second generator would need to be started manually and then connected, taking more time than our proposed design.
NOTE: Either the 125 KW or 350 KW gen will be capable of being manually connected to the AC bus when the vessel is in non-hybrid mode.
2.5 GENERATOR MONITORING
In normal operation (Hybrid Mode) the generator monitoring will always be available on the new DC switchboard section (SB02). In the instance where either generator connects directly to the AC bus (as in non-hybrid mode) the monitoring will revert to the existing AC switchboard (SB01).
2.6 WINCH SUPPLY
As requested by Foss Maritime the winch will remain on the AC bus.
2.7 ELECTRICAL STORAGE
For this design we are anticipating the use of the Corvus Lithium Polymer 48 VDC batteries. We have allowed for a hotel load of 25 KW and duration of 2 hours (50 KW/hrs of energy storage). Corvus has indicated a single string of 10 batteries will provide these needs. The Corvus quote provides additional detail.
This string will be connected to the DC bus through a single DCDC convertor. The battery management and monitoring system will fall within the scope of Corvus Energy. Our Energy Management System will be designed to communicate with the Corvus system to ensure appropriate limits of charge and discharge are respected. For clarification, the AKA EMS will dictate when the batteries charge or discharge based on system power requirements and mode of operation.
PAGE 6 of 10 110117-SPEC-CMBLFOSS-2228B(HighLevel) - version 2 I N T E G R A T E D D O C U M E N T A T I O N S Y S T E M
© Copyright 2010 Aspin Kemp & Associates
CAMPBELL FOSS HYBRID MARINE POWER SYSTEM
2.8 24 VDC SUPPLY
A stand-alone 24 VDC redundant power supply for the supplied hybrid system will be provided. This system will be comprised of two 24 vdc power supplies and a battery charger each fed from the existing 120 vessel service bus. A set of AGM batteries will provide an uninterrupted power supply to the system. The power supplies and battery charger will be located in the base of the control section of the hybrid switchboard. In addition, 2 – 225 watt Solar panels will be connected to the AGM batteries for additional charging. The vessel’s existing 24 VDC supply and distribution will remain independent of this system.
2.9 HYBRID CONTROL AND MONITORING
System Control and Energy Management will be developed using Siemens Step 7 software. The Siemens PLC will be located in the control section of the SWBD and be supplied with a 24 VDC UPS (as described earlier). A function block diagram of the PLC logic will be included in the final documentation set.
2.10 HYBRID SYSTEM INTERFACE
The system will include 2 touch screen HMI’s, one fitted within its own cabinet for placement in the Engine Room and the other in the wheelhouse. A hybrid control panel will also be located in the wheelhouse. The HMI’s will only display hybrid related information. The existing alarm and monitoring system for the vessel will remain independent of the hybrid system.
The hybrid control panel will provide the operator with the ability to choose “hybrid” or “non - hybrid” modes of operation. In hybrid, a selector switch will provide the operator the ability to choose between; Stop, Idle, Transit 1, Transit 2 and Assist. The panel will also include an alarm acknowledgement button, a hybrid system in command indicator light, a lamp test button, and a dimmer switch. The panel will also include main engine start buttons that will also be hard wired to close the clutches.
An additional stainless steel wheelhouse panel will be provided that holds E- stops for each motor/generator as well as the hybrid alarm.
Existing Wheelhouse Emergency Stop controls for the engines and generators will be retained.
Hybrid system alarms, both visual and audible will be indicated on the HMI’s. The hybrid control panel will have visual indication and audible alarms will be installed in the Engine Room, Galley and Wheelhouse. Alarms can be acknowledged at the HMI’s and hybrid control panel. Clearing of the alarms will only be from the E/R Location.
I N T E G R A T E D D O C U M E N T A T I O N S Y S T E M 110117-SPEC-CMBLFOSS-2228B(HighLevel) - version 2 PAGE 7 of 10 © Copyright 2010 Aspin Kemp & Associates

HYBRID MARINE POWER SYSTEM CAMPBELL FOSS
2.11 CLUTCH OPERATION
The Campbell Foss hybrid tug will use Logan air clutches between the diesel and the motor/generator. AKA will provide a 24 VDC supply to the clutch solenoids to control the open/close function based on mode. AKA will also provide clutch control panels that will provide the option for remote (hybrid control) or local control of the clutch. Additionally, the clutches will be able to be closed from the bridge position when the vessel is in “non-hybrid” mode.
2.12 STEERING
The Campbell Foss hybrid tug will use the same RR 205 azimuthing stern drives (ASD’s) as a conventional Dolphin. The hydraulics for clutch and steering are powered as a conventional Dolphin, via the propulsion shaft through a belt driven pump. As the shaft RPM will operate below the main engine idle speed an electrically driven hydraulic pump will be fitted within the hydraulic circuit. This unit fitted with a pressure switch will automatically start if pressure drops below a preset value ensuring pressure for lubrication, clutch engagement and steering is always available. When pressure exceeds a preset maximum, this auxiliary hydraulic pump will automatically shut down. The supply and installation of these units will be within the scope of Foss Maritime. These electric pumps will be supplied via AKA supplied VFDs from the DC bus.
2.13 COOLING WATER SYSTEM
The cooling water manifolds, pressure and temperature sensors and flow meters will be located within the base of the DC switchboard. Two cooling water circuits will be required, one supplying the port side converters and one for the starboard side convertors and hotel AFE. A cross over connection between circuits will be required, with each circuit sized to handle the cooling requirements of both sides. The supplied DC switchboard will have an inlet and outlet connection for each cooling circuit.
AKA will supply the drive side circulating pumps and heat exchangers. Foss will be responsible for supplying and plumbing all cooling water piping as well as the supply and design of the seawater side of the cooling circuit.
3 MODES OF OPERATION
As with the Carolyn Dorothy, the system will be designed with “hybrid” and “non-hybrid” modes of operation.
In “hybrid” the operator will be provided the following modes of operation. These modes can only be selected when the throttles are in their idle position.
PAGE 8 of 10 110117-SPEC-CMBLFOSS-2228B(HighLevel) - version 2 I N T E G R A T E D D O C U M E N T A T I O N S Y S T E M
© Copyright 2010 Aspin Kemp & Associates

CAMPBELL FOSS HYBRID MARINE POWER SYSTEM
3.1 STOP
For use when the vessel is secured. The throttles are disabled. Power is supplied via the batteries, with the 125 KW gen starting automatically when batteries reach a preset minimum SOC. If shore power is available the DC bus can be shut down for maintenance. Electrical distribution is via the existing 480 AC bus.
3.2 IDLE
For use when the vessel is stopped at sea. The throttles are enabled. Power is supplied via the batteries, with the 125 KW generator starting automatically and connecting to the DC bus when batteries reach a preset minimum SOC. Minor station keeping can be performed.
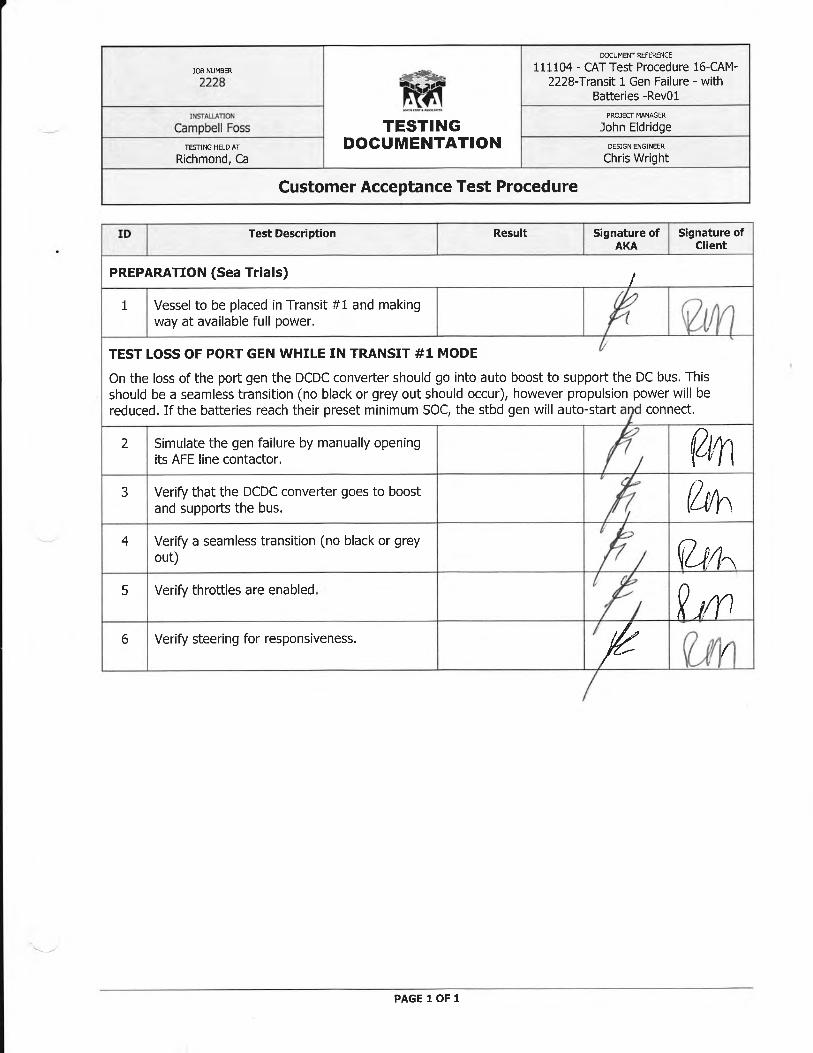
3.3 TRANSIT 1
Transit 1 Mode is for transit speeds of 6 kts or less. Selecting Transit 1 will automatically start the 350 KW generator and connect it to the DC bus. The Logan clutches will open (if closed) and all other running engines will shut down after a preset cool down period.
The batteries will be connected to the DC bus via the DCDC converter. The batteries will be charged if SOC is below a set limit and can be used to support the DC bus if required.
3.4 TRANSIT 2
Transit 2 Mode is for transit speeds up to approximately 7.5 kts or less. Selecting Transit #2 will automatically start the 350 KW generator (if not already running) and the 125 KW generator and connect them both to the DC bus. The Logan clutches will open (if closed) and the main engines will shut down (if running) after a preset cool down period.
The batteries will be connected to the DC bus via the DCDC converter. The batteries will be charged if SOC is below a set limit and can be used to support the DC bus if required.
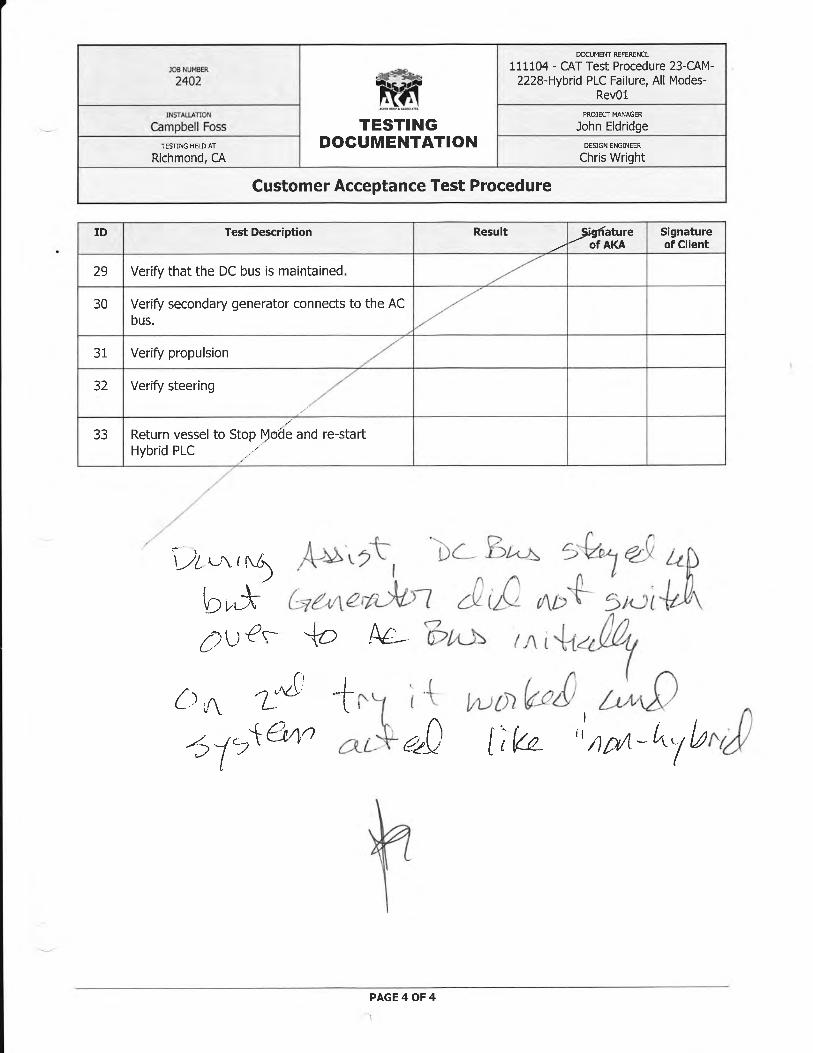
3.5 ASSIST
Selecting Assist mode will cause both main engines to start and the Logan clutches to close. The MG VFD’s will begin supporting the DC bus and the generators (if running) will be disconnected from the DC bus by first opening their contactors. The 350 KW gen (if running) will shut down after a preset cool down period. The 125 KW gen will remain running (or if not running will be
I N T E G R A T E D D O C U M E N T A T I O N S Y S T E M 110117-SPEC-CMBLFOSS-2228B(HighLevel) - version 2 PAGE 9 of 10 © Copyright 2010 Aspin Kemp & Associates
HYBRID MARINE POWER SYSTEM CAMPBELL FOSS
automatically started) and be available to connect to the AC bus via a dead bus relay should power from the DC bus be lost.
AKA will provide the option for this functionality to be removed (via the HMI) if future confidence in the system precludes the need to have the 125 gen running during Assist Mode. It should be noted however that the EMS will always start and connect the 125 KW generator to the AC bus during any mode of operation where the DC bus feed to the existing AC SWBD is lost.
The batteries will be connected to the DC bus via the DCDC converter. The batteries will be charged if SOC is below a set limit and can be used to support the DC bus if required.
3.6 NON - HYBRID
Selecting the “non-hybrid” position is undertaken if the DC bus needs to be shut down or the EMS is not functioning.
In the “non-hybrid” position both main engines will need to be started manually (if not already running) and the engine clutches will need to be closed manually. (Investigation is ongoing as to the ability for the clutches to fail in the closed position if 24 vdc is lost). These operations can be achieved either locally at the engine and clutch control panels or using the hard-wired emergency controls from the wheelhouse hybrid panel. Either generator can be started (if not already running) and manually connected to the ac bus (if not already connected).Generator monitoring will revert to the SB01 location. Interlocks between the “Generator Junction Boxes” will prevent both generators from ever being connected to the AC bus.
PAGE 10 of 10 110117-SPEC-CMBLFOSS-2228B(HighLevel) - version 2 I N T E G R A T E D D O C U M E N T A T I O N S Y S T E M
© Copyright 2010 Aspin Kemp & Associates

Page 0 of 7
APPENDIX B
ABS BOLLARD PULL TEST
REPORT

Page 1 of 7
RISK CONSULTING DIVISION ABSG CONSULTING INC.
16855 NORTHCHASE DRIVE HOUSTON, TEXAS 77060-6008
OFFICE: (281) 673 2769 FAX: (281) 673-2960
BOLLARD PULL TEST DATA FORM (SECTION A)
Project ID No.: 2730383 Report No.: WA-9597 Office: Gig Harbor, Washington
Bollard Pull Test Location and Personnel Data Survey Date 21 December 2011
Location Port of Portland, Oregon
Vessel Name “CAMPBELL FOSS”
Marine Surveyor S. P. Smith, ABS Consulting/Marine Service representatives
Others In Attendance Joel Altus, Foss Maritime
Mark J. Suryan, P.E., Dynamark Engineering, Inc.
Mr. Rick McKenna, Foss Maritime
Mr. Tim Stewart, Foss Maritime
General Comments Due to the vessel being placed into service in the Port of LA/LB the criteria for the ports of San Francisco, Los Angeles/Long Beach, CA were adhered to for all of the ahead and astern pulls. Their criteria are in excess of the criteria shown in this report format. The ultimate bollard pulls, ahead and astern shown in tons in the sections below were determined from the recorded data captured over a period of time in excess of 15 minutes as witnessed throughout by the undersigned representative of ABS Consulting. Testing was performed on 21 December 2011. The vessel was tested in four (4) separate propulsion modes both ahead and astern as per: 1st Mode Conventional main engine power with diesel generators providing hotel service load. 2nd Mode DC power bus regulation without batteries; main engines providing propulsion and hotel load via motor/generators. 3rd Mode DC power bus regulation with batteries; main engines providing propulsion power, hotel load via motor/generators. 4th Mode Super Assist, with batteries and motor-generator sets contributing to shaft power.
RISK CONSULTING DIVSION / MARINE SERVICES

Page 2 of 7
The test bollard at the Swan Island Shipyard, Portland, OR precluded positioning of the load cell on the pier end of the hawser being very difficult to manipulate and monitor for the ahead and astern pulls therefore the dynamometer was positioned on the vessel for all of the ahead and astern pulls. The load cell was monitored throughout both the astern and ahead pulls from the vessel and remained unobstructed and horizontal throughout both pulls.
Load Cell Data Load Cell Manufacturer's Name Washington Chain Service
Load Cell Model/Type 250 Ton/500,000 Pound, S/N WC 101
Load Cell Last Calibration Date 8 December 2011
Recording Device (Computer) Yes
Recording Device Manufacturer/Model/Type
Agilent, Model 34970A Data Acquisition System w/ Graphtec GL220, calibrated on 8 December 2011.
Load Cell Operator's Name and Company
Mr. Mark J. Suryan, P.E., Dynamark Engineering, Inc.
Comments: The operator was at the monitoring location in the vessels mess throughout the astern and ahead pulls observing both the loadcell readout and computer input. Copies of the bollard pull printouts remain on file. The +15 minute data are consistent with the visual readings noted during the test periods.
Ahead 1st Mode Bollard Pull Test Data
Clock Time Minute Number Average Indicated Steady Bollard Pull
Start: 1130 0 Slack Tide Slack tide
1 124,160
2 125,200
3 125,200
4 124,270
End of Fifth Minute: 5 124,450
Average Steady Bollard Pull Rating Ahead 124,656 62.33 Short Tons
Ahead 2nd Mode Bollard Pull Test Data
Clock Time Minute Number Average Indicated Steady Bollard Pull
Start: 1210 0 Slack Tide Slack tide
1 126,860
2 127,290
3 127,250

Page 3 of 7
4 126,570
End of Fifth Minute: 5 126,750
Average Steady Bollard Pull Rating Ahead 126,944 63.47 Short Tons
Ahead 3rd Mode Bollard Pull Test Data
Clock Time Minute Number Average Indicated Steady Bollard Pull
Start: 1250 0 Slack Tide Slack tide
1 129,360
2 130,220
3 131,150
4 130,270
End of Fifth Minute: 5 130,300
Average Steady Bollard Pull Rating Ahead 651,300 65.13 Short Tons
Ahead 4th Mode Bollard Pull Test Data
Clock Time Minute Number Average Indicated Steady Bollard Pull
Start: 1310 0 Slack Tide Slack tide
1 129,860
2 130,600
3 131,250
4 129,570
End of Fifth Minute: 5 130,750
Average Steady Bollard Pull Rating Ahead 130,406 65.20 Short Tons
Astern 1st Mode Bollard Pull Test Data
Clock Time Minute Number Average Indicated Steady Bollard Pull
Start: 1415 0 Slack Tide Slack tide
1 135,790
2 134,790
3 135,850
4 135,570
End of Fifth Minute: 5 136,750

Page 4 of 7
Average Steady Bollard Pull Rating Astern 135,750 67.88 Short Tons
Astern 2nd Mode Bollard Pull Test Data
Clock Time Minute Number Average Indicated Steady Bollard Pull
Start: 1415 0 Slack Tide Slack tide
1 136,750
2 137,500
3 137,350
4 136,550
End of Fifth Minute: 5 137,700
Average Steady Bollard Pull Rating Astern 137,170 68.59 Short Tons
Astern 3rd Mode Bollard Pull Test Data
Clock Time Minute Number Average Indicated Steady Bollard Pull
Start: 1500 0 Slack Tide Slack tide
1 136,900
2 137,780
3 137,950
4 136,970
End of Fifth Minute: 5 137,950
Average Steady Bollard Pull Rating Astern 137,510 68.76 Short Tons
Astern 4th Mode Bollard Pull Test Data
Clock Time Minute Number Average Indicated Steady Bollard Pull
Start: 1555 0 Slack Tide Slack tide
1 137,890
2 138,650
3 137,550
4 138,510
End of Fifth Minute: 5 138,750
Average Steady Bollard Pull Rating Astern 138,270 69.14 Short Tons

Page 5 of 7
REMARKS
The load cell used for the test had been calibrated within the preceding 12 months by a certified testing laboratory. The last certificate was available for review and a copy is retained on file.
The load cell provided a continuous readout.
A device for recording the bollard pull graphically, as a function of the time, was connected to the load cell.
2-Way voice communication was maintained between dock and tug during the course of this test.
During the test there was one Surveyor located in the vessel's mess, pilothouse and engine room observing vessel operations.
Surveyor With Load Cell: Load Cell Operator:
for
Print Name: Stan Smith Print Name: Mark J. Suryan_______________
Company: ABS Consulting / Marine Services Company: Dynamark Engineering Inc. _____
BOLLARD PULL TEST DATA FORM
(SECTION B)
Project ID No.: Report No.: WA-9697 Office: Gig Harbor, Washington
Bollard Pull Test Location and Personnel Data Survey Date 21 December 2011
Test Location Port of Portland, OR
Vessel Name “CAMPBELL FOSS”
Marine Surveyor S. P. Smith
Vessel Particulars Registered Name “CAMPBELL FOSS” (Hybrid)
Official Number 1177724
Port of Registry/Flag Long Beach/USA
Year Built / At 2005/Rainier, Oregon
Classification Society N/A
Load Line Assigned No

Page 6 of 7
Registered Tonnages Gross: 160 Net: 109
Length Overall 78.0’
Registered Dimensions Length 73.4’ Breadth 34.0’ Depth 19.5’
Main Propulsion As appropriate, include the following: Number of Engines Engine Manufacturer Engine Model Numbers Continuous HP Rating @ Specific RPM Number of Gearboxes/Reduction Gears Gearbox Manufacturer Gearbox Model Numbers Forward/Astern Reduction Ratios Number of Propeller Shafts Number of Engines per Shaft
Two (2) Caterpillar 3512D Marine Diesel engines each driving through a Rolls-Royce / Ulstein Aquamaster Azimuth Thruster Z Drive.
One (1) MTU Series 60 Marine Diesel engine driving one (1) 350 KW generator and one (1) John Deere Marine Diesel engine driving (1) 125 kW generator that are selectively operated during mode 4 “Super Assist”, powering two (2) TECO-Westinghouse electric drive motors, one (1) each shaft.
Propulsion Arrangement Conventional Tractor Tractor Plus Hybrid
Propulsion System Manufacturer Rolls-Royce Z-Drive/Hybrid
Propeller(s) used for Test Diameter 94” Pitch 82.8” No. of Blades 4
Comments Pertaining To Vessel / Vessel Personnel The M/V CAMPBELL FOSS although built as a conventional ship-handling tug during 2005, was converted during 2011 into a Diesel-Electric Hybrid tug. Its power is derived from either direct diesel, diesel-electric with power supplied by the generators, or solely by battery banks. The vessel’s crew and support staff were cooperative and very professional throughout the bollard pulls.
Bollard Pull Test Situation Water Depth @ Test Site 43’
Water Current @ Test Site (Kts.) Slack tide, light flood tide, current < 1Kt.
Wind Direction / Speed (MPH) Northeast < 5 knots.
Approximate Air Temperature 40 Degrees F.
Vessel's Drafts Forward: 16.50’ Aft: 16.50’
Towing Hawser Synthetic, Double Braid, 8” Spectra
Hawser Length (Vessel to Bollard) 425’
Bollard Pull Test - Vessel Operations Data Main Engine Data Port Engine: Center Engine: Starboard Engine:
Max Cont RPM - Rated/During Test 1800/1826 1800/1819
Rated Continuous BHP @ RPM 1,800 1,800
Overspeed RPM Settings 110% 110%

Page 7 of 7
Max. Lube Oil Pressure/Temperature
/ / /
Max. Cooling Water Temperature In: /Out: In: /Out: In: /Out:
Manifold Air Temperature
Reduction Gear Ratio
Reported Propeller Material
Reported No. of Propeller Blades 4 4
Reported Propeller Diameter / Pitch 94”/82.8” / 94”/82.8”
Comments Pertaining To Vessel Systems / Machinery During Test
Vessel just completed Sea Trials following conversion to Hybrid technology. All normal systems, pumps and auxiliaries were in operation throughout all bollard pulls.
REMARKS
The test was carried out with the vessel’s trim and/or displacement corresponding to applicable Load Line requirements and/or Letter of Stability.
Auxiliary equipment (i.e., pumps, generators, etc), which are driven from the main engines or propeller shafts during normal operation of the vessel, were connected during the test.
The Z-Drive units fitted on the vessel during the test are the same as those reportedly used when the vessel is in normal operation.
Water depth under the keel was twice the vessel's depth at midship.
Water current did not exceed 1.0 Knot and was not conducted both upstream and downstream.
Wind speed did not exceed 10 Miles per hour.
Towline length was at least twice the length of the vessel from stern/bow to fixed bollard.
2-Way voice communication was maintained during the course of this test.
Surveyor Observing Vessel Operation.
Print Name: Stan Smith
Company: ABS Consulting / Marine Services

APPENDIX C
HYBRID
CUSTOMER
ACCEPTANCE
TEST
PROCEDURES


APPENDIX D
U.C. RIVERSIDE
FINAL
EMISSIONS
REPORT

Evaluation of Hybrid Retrofit System for a Tugboat
Prepared for:
Ms. Susan Hayman
Foss Maritime Company
Authors:
Mr. M. Yusuf Khan Mr. Nicholas Gysel
Ms. Poornima C. Dixit Dr. J. Wayne Miller
Mr. William A. Welch Dr. David R Cocker
University of California, Riverside College of Engineering-Center for Environmental Research and Technology
Riverside, CA 92521

1
Disclaimer
This report was prepared as the result of work sponsored by the Air Resources Board (ARB) and carried out with Foss Maritime Company. As such the report does not necessarily represent the views of ARB and Foss Maritime Company. Further the collective participants, its employees, contractors and subcontractors make no warrant, express or implied, and assume no legal liability for the information in this report; nor does any party represent that the uses of this information will not infringe upon privately owned rights. This report has neither been approved nor disapproved by the collective group of participants nor have they passed upon the accuracy or adequacy of the information in this report.

2
Acknowledgements Authors would like to thank Air Resources Board’s Air Quality improvement Program for their financial support without which this project would not have been possible. The authors acknowledge the support from Foss crew members during emissions testing. A special thanks to US Environmental Protection Agency (USEPA), Office of Transportation and Air Quality, in the preparation of the test plan for this project. Authors also acknowledge Air Resources Board’s Stationary Source Division for their 2010 study “Evaluating Emission Benefits of the Hybrid Tugboat” which was the base of this project. The authors acknowledge John Elderidge and Ed McCain from Aspin Kemp & Associates and Foss Maritime Company, respectively. The authors also thanks to Kathalena Cocker, Jesus Sahagun and Kurt Bumiller from UC Riverside for test preparation and analysis of filter sample media.

3
Table of Contents
1 Introduction ........................................................................................................................... 10
2 Test Protocol and Test Plan ................................................................................................... 12
2.1 Overview ....................................................................................................................... 12
2.2 Approach ....................................................................................................................... 12
2.3 Test Tugboat .................................................................................................................. 14
2.4 Test Schedule................................................................................................................. 17
2.5 Determining Tugboat Activity....................................................................................... 18
2.5.1 Tug Operating Modes ............................................................................................ 18
2.5.2 Establishing Weighting Factors for Tugboat Operating Modes ............................ 24
2.5.3 Developing Engine Histograms ............................................................................. 24
2.6 Emissions Testing Procedure ........................................................................................ 27
2.6.1 Test Engines .......................................................................................................... 27
2.6.2 Fuels ...................................................................................................................... 28
2.6.3 Test Cycle and Operating Conditions .................................................................... 28
2.6.4 Sampling Ports ....................................................................................................... 30
2.6.5 Measuring Gases and PM2.5 emissions .................................................................. 31
2.6.6 Calculating Exhaust Flow Rates ............................................................................. 31
2.6.7 Calculation of Engine Load ................................................................................... 32
2.6.8 Calculation of Emissions in g/hr ........................................................................... 33
2.6.9 Calculation of Emission Factors in g/kW-hr ......................................................... 33
3 Results and Discussions ........................................................................................................ 34
3.1 Emissions Testing Phase I ............................................................................................. 34
3.2 Emissions Testing Phase II & III .................................................................................. 39
3.3 Activity .......................................................................................................................... 40
3.3.1 Weighting Factors for Tug Operating Modes ........................................................ 40
3.3.2 Engine Histogram for Conventional Campbell Foss ............................................. 43
3.3.3 Engine Histograms for Hybrid Campbell Foss ...................................................... 44
3.4 Total In-use Emissions .................................................................................................. 46
3.5 Comparison of Results with Earlier Study .................................................................... 49
4 Summary ............................................................................................................................... 52
4
5 References ............................................................................................................................. 54
6 Appendix A - Measuring Gaseous & Particulate Emissions ................................................. 56
6.1 Scope ............................................................................................................................. 56
6.2 Sampling System for Measuring Gaseous and Particulate Emissions ........................... 56
6.3 Dilution Air System ....................................................................................................... 57
6.4 Calculating the Dilution Ratio ....................................................................................... 60
6.5 Dilution System Integrity Check ................................................................................... 60
6.6 Measuring the Gaseous Emissions: CO, CO2, HC, NOx, O2, SO2 ................................. 60
6.7 Measuring Gaseous Emissions: ISO & IMO Criteria.................................................... 60
6.8 Measuring Gaseous Emissions: UCR Design ............................................................... 61
6.9 Measuring the Particulate Matter (PM) Emissions ........................................................ 63
6.10 Added Comments about UCR’s Measurement of PM .................................................. 65
6.11 Measuring Real-Time Particulate Matter (PM) Emissions-DustTrak ........................... 65
6.12 Quality Control/Quality Assurance (QC/QA) ............................................................... 66
7 Appendix B - Test Cycles and Fuels for Different Engine Applications .............................. 67
7.1 Introduction ................................................................................................................... 68
7.1.1 Intermediate speed ................................................................................................. 68
7.2 Engine Torque Curves and Test Cycles ........................................................................ 69
7.3 Modes and Weighting Factors for Test Cycles ............................................................. 70
8 Appendix C - Tug Boat Specifications .................................................................................. 71
9 Appendix D- Heim Bridge Diversion .................................................................................... 75

5
List of Figures
Figure 2-1: Diesel Electric Drive Train on the Hybrid Campbell Foss ......................................... 17 Figure 2-2: Schematic of Data-logging system on a Hybrid Tugboat ........................................... 23 Figure 2-3: ECM load versus CO2 emissions for the main engine (CAT 3512 C) ........................ 25 Figure 2-4: ECM load versus CO2 emissions for the auxiliary engine (JD 6081) ......................... 25 Figure 2-5: ECM load versus CO2 emissions for the auxiliary engine (MTU/Detroit) ................. 26 Figure 2-6: Engine Histogram Obtained from the ECM of the Main Engine on the Campbell Foss ....................................................................................................................................................... 29 Figure 2-7 Sampling port for Auxiliary engine on conventional Campbell Foss tug boat ......... 300 Figure 2-8 Sampling port for Main engine on conventional Campbell Foss tug boat .................. 31 Figure 3-1: Modal Emission Factors for Auxiliary Engine on Conventional Campbell Foss Tug JD 6081.......................................................................................................................................... 37 Figure 3-2: Modal Emission Factors for Main Engine on Conventional Campbell Foss Tug CAT 3512 C ........................................................................................................................................... 37 Figure 3-3: PM2.5 Mass Balance for A) Auxiliary Engine JD 6081 and B) Main Engine CAT 3512C ............................................................................................................................................ 38 Figure 3-4: Overall Weighing Factors for Hybrid Tugboat Operating Modes .............................. 41 Figure 3-5: Comparison of Overall Weighting Factors for Hybrid Carolyn Dorothy and Campbell Foss ............................................................................................................................................... 42 Figure 3-6: Main Engine Histogram during Transit Mode for Conventional Campbell Foss ...... 43 Figure 3-7: Main Engine Histogram during Assist Mode for Conventional Campbell Foss ........ 44 Figure 3-8: AEs histogram during Stop mode for Hybrid Campbell Foss .................................... 44 Figure 3-9: AEs histogram during Idle mode for Hybrid Campbell Foss ..................................... 45 Figure 3-10: AEs histogram during Transit mode for Hybrid ....................................................... 46 Figure 3-11: MEs histogram during Assist mode for Hybrid Campbell Foss ............................... 46 Figure 6-1 Field Processing Unit for Purifying Dilution Air in Carrying Case ............................ 58 Figure 6-2 Setup Showing Gas Analyzer with Computer for Continuous Data Logging ............. 62 Figure 6-3 Picture of TSI DustTrak ............................................................................................... 65 Figure 7-1: Torque as a Function of Engine Speed ....................................................................... 69 Figure 7-2: Examples of Power Scales .......................................................................................... 69
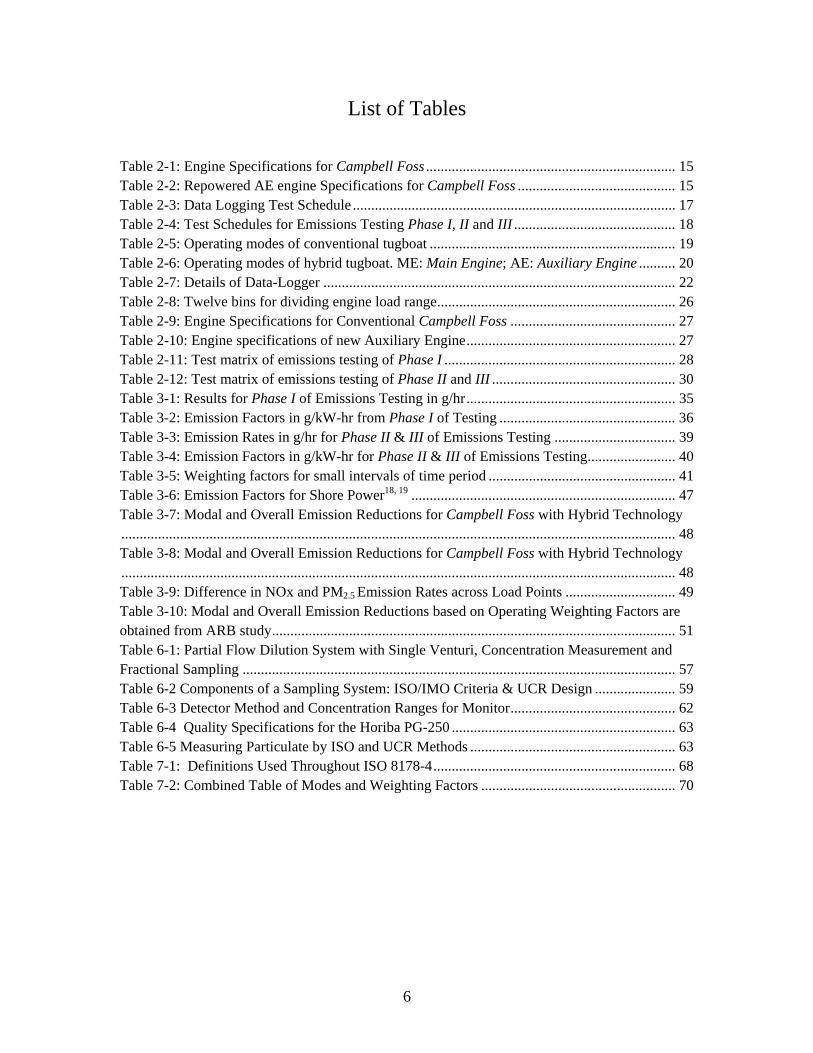
6
List of Tables
Table 2-1: Engine Specifications for Campbell Foss .................................................................... 15 Table 2-2: Repowered AE engine Specifications for Campbell Foss ........................................... 15 Table 2-3: Data Logging Test Schedule ........................................................................................ 17 Table 2-4: Test Schedules for Emissions Testing Phase I, II and III ............................................ 18 Table 2-5: Operating modes of conventional tugboat ................................................................... 19 Table 2-6: Operating modes of hybrid tugboat. ME: Main Engine; AE: Auxiliary Engine .......... 20 Table 2-7: Details of Data-Logger ................................................................................................ 22 Table 2-8: Twelve bins for dividing engine load range ................................................................. 26 Table 2-9: Engine Specifications for Conventional Campbell Foss ............................................. 27 Table 2-10: Engine specifications of new Auxiliary Engine ......................................................... 27 Table 2-11: Test matrix of emissions testing of Phase I ............................................................... 28 Table 2-12: Test matrix of emissions testing of Phase II and III .................................................. 30 Table 3-1: Results for Phase I of Emissions Testing in g/hr ......................................................... 35 Table 3-2: Emission Factors in g/kW-hr from Phase I of Testing ................................................ 36 Table 3-3: Emission Rates in g/hr for Phase II & III of Emissions Testing ................................. 39 Table 3-4: Emission Factors in g/kW-hr for Phase II & III of Emissions Testing ........................ 40 Table 3-5: Weighting factors for small intervals of time period ................................................... 41 Table 3-6: Emission Factors for Shore Power18, 19 ........................................................................ 47 Table 3-7: Modal and Overall Emission Reductions for Campbell Foss with Hybrid Technology ....................................................................................................................................................... 48 Table 3-8: Modal and Overall Emission Reductions for Campbell Foss with Hybrid Technology ....................................................................................................................................................... 48 Table 3-9: Difference in NOx and PM2.5 Emission Rates across Load Points .............................. 49 Table 3-10: Modal and Overall Emission Reductions based on Operating Weighting Factors are obtained from ARB study .............................................................................................................. 51 Table 6-1: Partial Flow Dilution System with Single Venturi, Concentration Measurement and Fractional Sampling ...................................................................................................................... 57 Table 6-2 Components of a Sampling System: ISO/IMO Criteria & UCR Design ...................... 59 Table 6-3 Detector Method and Concentration Ranges for Monitor ............................................. 62 Table 6-4 Quality Specifications for the Horiba PG-250 ............................................................. 63 Table 6-5 Measuring Particulate by ISO and UCR Methods ........................................................ 63 Table 7-1: Definitions Used Throughout ISO 8178-4 .................................................................. 68 Table 7-2: Combined Table of Modes and Weighting Factors ..................................................... 70

7
Executive Summary
Background: Hybrid technology is becoming a prevalent solution to reduce emissions. Emissions from harbor craft account for significant proportion of criteria pollutants and greenhouse gases from port activities, and this report is about the application of hybrid technology to a harbor tugboat. In an earlier project, significant emission reductions up to 73% for PM2.5, 51% for NOx and 27% for CO2 were observed when a conventional and newly built hybrid tugboat were compared. The goal of this study was to evaluate the criteria emissions reduction and fuel economy benefits by retrofitting an existing tug, the Campbell Foss with hybrid technology.
Methods: This demonstration project was conducted in three phases. In the first phase emissions were measured for the main engines (ME) and auxiliary engines (AE) of the Campbell Foss prior to the retrofit to a hybrid. The next phase involves the development of the activity of the hybrid Campbell Foss and emissions testing of the new repower AE engine according to ISO 8178 D2 and in-use testing based on activity data. A data-logging system, capable of simultaneously monitoring and reporting the status of the power sources was installed for a period of over one month. Four gigabytes of data were analyzed to determine the weighting factors, i.e., the fraction of time spent by the tug in the six discrete operating modes Shore Power, Stop, Idle, Transit 1, Transit 2 and Assist. Further engine histograms for all four engines on the tug at these operating modes were established. The third and final phase of the work involved the retesting of the new repowered engine at 1000 hours of operation to ensure durability of emissions profile and combining the activity and emissions data to calculate the overall in-use emissions from the tug prior and after retrofit.
Results: The first phase of the study was conducted to ensure that the main (ME) and auxiliary engines (AE) on the conventional tug are representative of engines in their category and emissions are within certification limits (Table ES-1). Emission results confirmed that NOx, CO and PM2.5 emissions levels are below standards. ISO 8178 protocols were used to evaluate emissions and are presented in section 3.1.
The second phase of the study was to confirm that emissions from the new AE were within certification limits (Table ES-2) and to establish weighting factors for the operating modes of the hybrid Campbell Foss in total. The weighting factors were found to be 0.13 for Shore Power, 0.38 for Stop, 0.02 for Idle, 0.14 for Transit (includes Transit 1& Transit 2) and 0.33 for Assist (includes barge move). The weighting factors were assumed to be same for conventional Campbell Foss as above. Detailed engine histograms are presented in the section 3.3.
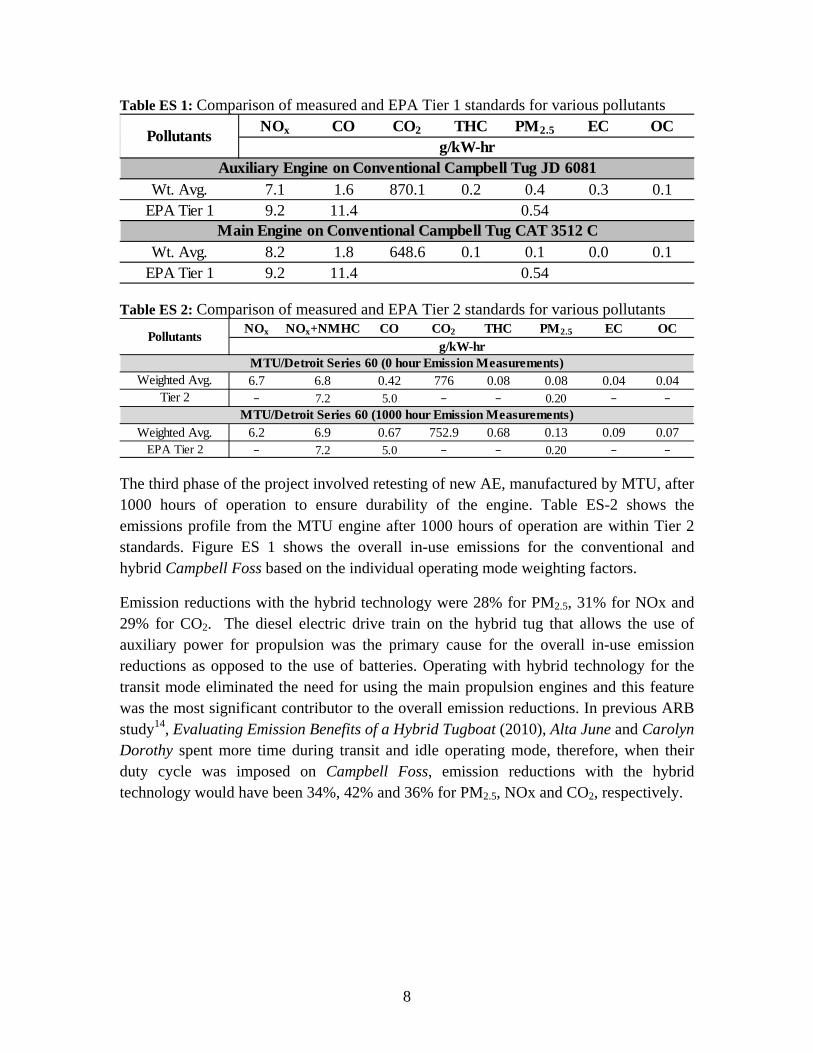
8
Table ES 1: Comparison of measured and EPA Tier 1 standards for various pollutants
Table ES 2: Comparison of measured and EPA Tier 2 standards for various pollutants
The third phase of the project involved retesting of new AE, manufactured by MTU, after 1000 hours of operation to ensure durability of the engine. Table ES-2 shows the emissions profile from the MTU engine after 1000 hours of operation are within Tier 2 standards. Figure ES 1 shows the overall in-use emissions for the conventional and hybrid Campbell Foss based on the individual operating mode weighting factors.
Emission reductions with the hybrid technology were 28% for PM2.5, 31% for NOx and 29% for CO2. The diesel electric drive train on the hybrid tug that allows the use of auxiliary power for propulsion was the primary cause for the overall in-use emission reductions as opposed to the use of batteries. Operating with hybrid technology for the transit mode eliminated the need for using the main propulsion engines and this feature was the most significant contributor to the overall emission reductions. In previous ARB study14, Evaluating Emission Benefits of a Hybrid Tugboat (2010), Alta June and Carolyn Dorothy spent more time during transit and idle operating mode, therefore, when their duty cycle was imposed on Campbell Foss, emission reductions with the hybrid technology would have been 34%, 42% and 36% for PM2.5, NOx and CO2, respectively.
NOx CO CO2 THC PM2.5 EC OC
7.1 1.6 870.1 0.2 0.4 0.3 0.19.2 11.4 0.54
8.2 1.8 648.6 0.1 0.1 0.0 0.19.2 11.4 0.54
Main Engine on Conventional Campbell Tug CAT 3512 CWt. Avg.
EPA Tier 1
g/kW-hrPollutants
Wt. Avg.EPA Tier 1
Auxiliary Engine on Conventional Campbell Tug JD 6081
NOx NOx+NMHC CO CO2 THC PM2.5 EC OC
6.7 6.8 0.42 776 0.08 0.08 0.04 0.04− 7.2 5.0 − − 0.20 − −
6.2 6.9 0.67 752.9 0.68 0.13 0.09 0.07− 7.2 5.0 − − 0.20 − −
MTU/Detroit Series 60 (0 hour Emission Measurements)Weighted Avg.
Tier 2
Weighted Avg.EPA Tier 2
MTU/Detroit Series 60 (1000 hour Emission Measurements)
Pollutantsg/kW-hr

9
Figure ES 1: Overall in-use emissions based on the individual Tug Operating Modes Weighting Factors
CT HT CT HT CT HT
NOx/100 (g/hr)CO2/10^4
(g/hr)PM2.5 (g/hr)
ASSIST 24.8 22.4 15.3 12.8 23.2 18.6TRANSIT 11.3 3.1 7.1 3.1 10.0 6.0IDLE 0.8 0.1 0.3 0.1 0.5 0.2STOP 0.9 0.4 0.8 0.5 3.3 1.5
0.05.0
10.015.020.025.030.035.040.0
Tot
al E
mis
sion
s (g
/hr)
STOP IDLE TRANSIT ASSIST
10
1 Introduction The last decade has seen an increasing interest in reducing the emissions from marine sources. Several studies1-6 have shown that emissions from ports significantly affect the air quality and present a substantial health hazard to the communities near to the ports. The sources in the ports include ships, harbor-craft, cargo-handling equipment, trucks and locomotives. Ships are the largest contributors to the total port emissions. Emissions from harbor-craft, though smaller, still form a significant part of the total port emissions7, 8. Harbor crafts include ferries, excursion boats, tugboats, towboats, crew and supply vessels, work boats, fishing boats, barges and dredge vessels.
Corbett’s study9 on waterborne commerce vessels in the United States revealed that in several states ~65% of the marine nitrogen oxides comes from vessels operating in inland waterways. Since harbor craft (e.g., barges and tow-boats) are the most common commercial vessels operating in inland waterways10, hybridization of tugboats could have significant effects on the air quality of inland areas as well.
Harbor-craft are typically powered by marine compression ignition engines which are regulated by United States Environmental Protection Agency’s (U.S. EPA) code of federal regulation title 40 parts 85-9411. Emission studies12, 13 on these vessels have predominately focused on older engines operating on high sulfur fuels. Only a few studies have evaluated emissions from harbor craft operating on ultra-low sulfur diesel (ULSD) fuel.
Future regulations on diesel engines are geared towards simultaneous reduction of toxic air contaminants, criteria pollutants and green-house gas emissions to address the issues of air quality and global warming. One prevalent solution to achieve this goal is called hybrid technology. In hybrid technology, two or more distinct power sources are used to provide the mechanical energy for vessel operation. A common application of this technology today is passenger cars.
This technology is not new to the marine world. Diesel electric submarines have been prevalent for over sixty years. The propeller (usually single) on these submarines is driven by an electric motor which derives energy from diesel generators or batteries. The diesel generators were also used to charge batteries.
Based on the encouraging results from a previous project that created a new-build hybrid tug boat, the Foss Maritime Company (Foss) and their Canadian partners, Aspin Kemp & Associates (AKA) have retrofitted a tug by the addition of motor generator sets, an energy management system, batteries and other design enhancements. It has 10 Lithium Polymer batteries providing a total of 65 kW-hr of energy in a single bank. The batteries are typically charged by the AEs but have the capability to be charged from shore power. All four engines (two main and two auxiliary) and the batteries are coupled and

11
controlled by an energy management system. Therefore, the energy from the batteries and the auxiliary engines can also be used for propulsion in the hybrid tugboat.

12
2 Test Protocol and Test Plan Test plan is similar to that reported in the ARB report14, Evaluating Emission Benefits of a Hybrid Tugboat (2010), and developed in conjunction with US EPA, Office of Transportation and Air Quality.
2.1 Overview The primary objective of this project was to determine emission benefits of using a hybrid retrofit system on an existing tugboat. For this purpose, a “Dolphin class” tugboat from Foss’ fleet was retrofitted with the hybrid systems in addition to repowering one of the auxiliary engines to a larger auxiliary engine to provide sufficient power for propulsion while transiting.
Listed below is a brief description of the procedure adopted to determine the in-use emission benefits of the hybrid retrofitted tugboat.
a) Engine, GPS and battery data were logged for 37 days. This data was analyzed to determine the activity and engine histograms for each operating mode of a hybrid tugboat.
b) Activity of conventional tugboat (before repowering engine and addition of batteries to Campbell Foss) was assumed to be the same as the activity of hybrid tugboat. However, engine histograms for each operating mode of a conventional tugboat were obtained from the ARB study.
c) Emission measurements were made from one main and one auxiliary engine before the tugboat was retrofitted and hybridized. After retrofitting the tugboat, emissions were measured from the new auxiliary engine at 0 hr operation and after 1000 hr operation to ensure durability of new AE over time. These engines were analyzed to determine the gaseous (CO, CO2, NOx and THC) and particulate matter (PM2.5) emissions for each engine across that engine’s entire operating range.
d) Activity and engine histogram data coupled with the emissions data were used to determine the total in-use emissions in g/hr for the tugboat before and after the hybrid retrofit.
e) These total in-use emissions were then used to calculate the reduction of the gaseous and particulate matter species with the hybrid retrofit system.
A detailed description of the approach, test schedule, measurement and analyses techniques used to determine the emission reduction potential of the hybrid retrofit system are provided below.
2.2 Approach The emission benefits of a hybrid tug can be calculated as follows

13
% ---------- Equation 2-1
where,
total in-use emissions for conventional tugboat in g/hr
total in-use emissions for hybrid tugboat in g/hr
The total in-use emissions of any gaseous or particulate matter species, is determined using the following equation:
∑ ∑ ---------- Equation 2-2
where,
total in-use emissions in g/hr
total number of operating modes (Section 2.5.1)
the total number of power sources on the tug (Section 2.3)
weighting factor for operating mode (See Equation 2-3)
total in-use emissions in g/hr from the power source for the operating
mode (See Equation 2-4)
The weighing factors for each operating mode are calculated as follows:
---------- Equation 2-3
where,
weighting factor for the operating mode
time spent by the tug in the operating mode
total sample time for the tug

14
As mentioned earlier, tugboats typically have four engines, two for propulsion and two auxiliary generators. To determine the total in-use emissions from each of these engines/power sources the following equation can be used:
∑ ----------Equation 2-4
where,
total in-use emissions in g/hr from the power source/engine for the
operating mode
total number of operating modes for the power source (marine diesel engine). there are twelve operating modes for the engine based on the percentage of maximum engine load: off, 0 to <10%, 10% to <20%, 20% to <30%, and so on until 90% to <100% and 100%.
fraction of time spent by the power source/engine at its operating mode
during the tug boat operating mode. This value can be obtained from the engine histograms
emissions in g/hr for the power source/engine at its operating mode
While developing engine histograms for the hybrid tugboat it is important to ensure that the state of charge of the battery at the start and end time of each sample period chosen for the calculation of the engine histogram are the same. This would eliminate any biases in emissions resulting from operation of the auxiliary generators for charging the batteries. The protocol was adopted after reviewing the hybrid testing protocol adopted by the Society of Automotive Engineers15 (SAE) and California Air Resources Board 16(CARB) for testing hybrid electric vehicles.
2.3 Test Tugboat The primary objective of this project was to determine emission benefits of using a hybrid retrofit system on a tugboat. For this purpose, one of the tugboats (Campbell Foss) belonging to Foss’ fleet operating in the Ports of Los Angeles and Long Beach was retrofitted with hybrid components in addition to the repowering one of the auxiliary engines. Originally, Campbell Foss was equipped with EPA Tier 1 marine main and auxiliary diesel engines. During the hybrid retrofit process, one of the auxiliary engines was replaced by an EPA Tier 2 marine auxiliary engine. Details of power sources on the Campbell Foss tugboat are described below.

15
The conventional Campbell Foss was powered by two 1902 kW CAT 3512C main engines and two 125 kW John Deere (JD) 6081 auxiliary engines (Table 2-1). This tugboat has two Azimuthing stern drives (ASD) for propulsion units. Each main engine was connected through a mechanical drive shaft to each ASD. Table 2-1: Engine Specifications for Campbell Foss
Main Engine (ME) Auxiliary Engine (AE)
Manufacturer /Model CAT 3512 John Deere 6081
Manufacture Year 2005 2005
Certification Standard Tier 1 Tier 0
Technology 4-Stroke Diesel 4-Stroke Diesel
Max. Power Rating 1902 kW 125 kW
Rated Speed 1800 rpm 1800 rpm
# of Cylinders 8 8
Displacement 58.6 liters 8.1 liters
The retrofit hybrid Campbell Foss is powered by the original MEs and one of the two original AEs. The other AE was repowered with a new Tier 2 engine (Table 2-2). It also has 10 Lithium Polymer batteries providing a total of 65 kW-hr of energy in a single bank. The batteries are typically charged by the AEs but can be charged from shore power.
Table 2-2: Repowered AE engine Specifications for Campbell Foss
Auxiliary Engine (AE)
Manufacturer /Model MTU/Detroit Diesel Series 60
Manufacture Year 2011
Technology 4-Stroke Diesel
Certification Standard Tier 2
Max. Power Rating 350 kW
Rated Speed 1800 rpm
# of Cylinders 6
Displacement 14 liter In the case of the conventional Campbell Foss the main engines were linked mechanically to the propellers through a drive shaft. Therefore both main engines had to be operated for moving and maneuvering the boat. The auxiliary engines were only used for hoteling, lighting, air conditioning and operating the winch motor. However, in case

16
of the hybrid retrofit Campbell Foss, there is a motor-generator unit mounted in the shaft line between each engine and ASD. An additional clutch was also fitted between the main engine and motor-generator. With the clutch open, the motor-generator uses electrical power from the batteries and auxiliary engines to drive the shaft for propelling the boat. With the clutch engaged, the motor-generator is able to produce from the shaft using the main engines or freewheeling propeller (regenerative power). This power is used for charging the batteries, driving the winch and other hoteling activities of the tug. This means that AE’s are not required to be running when the main engines are providing propulsion. The batteries on the Campbell Foss are predominately charged using the power from the auxiliary engines drawn through the DC bus. In the previous ARB14 study, auxiliary engines in the hybrid tugboat were of higher power rating than conventional tugboat so that they can be used for charging batteries and propelling the tugboat. Therefore, in Campbell Foss, one of the JD 6081’s was replaced by an engine with a higher power rating. The hybrid Campbell Foss is equipped with an energy management system that manages the power sources and the drive train. A schematic of the diesel electric drive train is shown in Figure 2-1. The captain on the hybrid tug uses a switch in the wheelhouse to communicate the desired operating mode of the tug to the energy management system. The signal from this wheelhouse switch helps the energy management system in making decisions regarding the number of power sources required to operate the tug. Further details of this wheelhouse switch are provided is Section 2.5.2.

17
Figure 2-1: Diesel Electric Drive Train on the Hybrid Campbell Foss
2.4 Test Schedule The testing program was conducted over the period of 13 months which included data logging for 37 days to determine the activity of the hybrid tugboat and emissions measurement from main and auxiliary engines.
According to the test plan, activity of the tugboat was to be logged for at least continuous 30 days. However, due to technical issues with the hybrid tugboat and data logger, data was obtained intermittently for nine to nineteen days period. Thus, activity data was logged for more than 30 days to ensure that the logged activity is representative of tugboat operation. Table 2-3 shows the schedule for data logging on the hybrid tugboat. Details of the data logging procedure and analysis to determine the tugboat activity are provided in section 2.5.
Table 2-3: Data Logging Test Schedule
Emissions testing of main and auxiliary engines were performed in three phases. A brief description of these phases is provided below. Test schedules for Phase I, II and III are
Tugboat Start Date Stop Date5/25/2012 6/6/20126/9/2012 6/17/2012
6/21/2012 7/9/2012
Hybrid Campbell
Auxiliary Engines
Main Engine
Main Engine
Motor Generator
Propeller
Propeller
Battery Array
DC Bus
Wheelhouse switch position
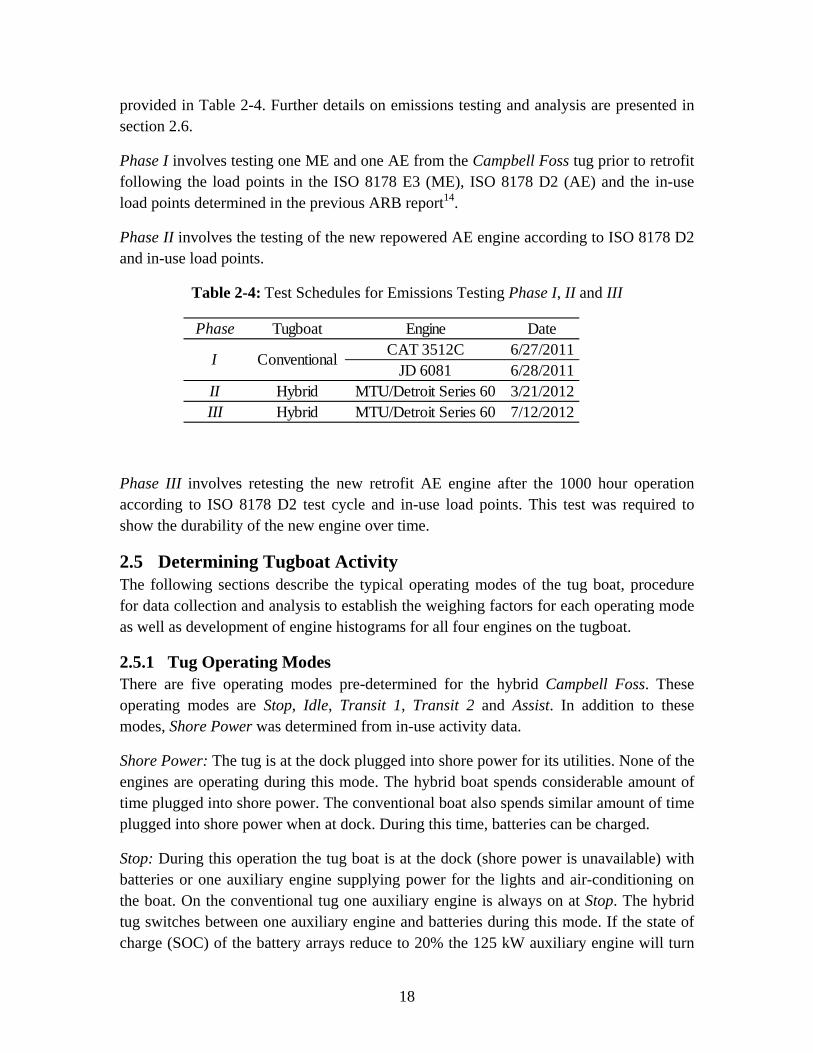
18
provided in Table 2-4. Further details on emissions testing and analysis are presented in section 2.6.
Phase I involves testing one ME and one AE from the Campbell Foss tug prior to retrofit following the load points in the ISO 8178 E3 (ME), ISO 8178 D2 (AE) and the in-use load points determined in the previous ARB report14.
Phase II involves the testing of the new repowered AE engine according to ISO 8178 D2 and in-use load points.
Table 2-4: Test Schedules for Emissions Testing Phase I, II and III
Phase III involves retesting the new retrofit AE engine after the 1000 hour operation according to ISO 8178 D2 test cycle and in-use load points. This test was required to show the durability of the new engine over time.
2.5 Determining Tugboat Activity The following sections describe the typical operating modes of the tug boat, procedure for data collection and analysis to establish the weighing factors for each operating mode as well as development of engine histograms for all four engines on the tugboat.
2.5.1 Tug Operating Modes There are five operating modes pre-determined for the hybrid Campbell Foss. These operating modes are Stop, Idle, Transit 1, Transit 2 and Assist. In addition to these modes, Shore Power was determined from in-use activity data.
Shore Power: The tug is at the dock plugged into shore power for its utilities. None of the engines are operating during this mode. The hybrid boat spends considerable amount of time plugged into shore power. The conventional boat also spends similar amount of time plugged into shore power when at dock. During this time, batteries can be charged.
Stop: During this operation the tug boat is at the dock (shore power is unavailable) with batteries or one auxiliary engine supplying power for the lights and air-conditioning on the boat. On the conventional tug one auxiliary engine is always on at Stop. The hybrid tug switches between one auxiliary engine and batteries during this mode. If the state of charge (SOC) of the battery arrays reduce to 20% the 125 kW auxiliary engine will turn
Phase Tugboat Engine DateCAT 3512C 6/27/2011
JD 6081 6/28/2011II Hybrid MTU/Detroit Series 60 3/21/2012III Hybrid MTU/Detroit Series 60 7/12/2012
ConventionalI

19
on to charge the batteries and provide hoteling power for the tug. As soon as the batteries are charged to a SOC of 95% the engine turns off and the batteries discharge providing hoteling power.
Idle: In this mode the tug is idling at sea waiting for a vessel to arrive or a call from the dispatch office to start or transit to a job. The conventional tug operates two main propulsion engines and one auxiliary generator during Idle. As in the case of Stop the hybrid tug switches between the batteries and one auxiliary engine.
Transit 1: The mode refers to the movement of the tug between jobs and to and from different docks. The conventional tug boat operates two main engines and one auxiliary engine during transit. The hybrid boat operates its 350 kW auxiliary engine for transit at <6.0 knots within the port. The auxiliary engine also provides power for battery charging and hotel loads.
Transit 2: This mode is available to provide transit speeds up to approximately 7.5 knots. In this mode the 350 kW and 125 kW auxiliary engines provide power for propulsion, battery charging and hotel load. Main engines are rarely operated during Transit 2 in the hybrid tugboat.
Assist: Tug boats typically perform two kinds of jobs in the ports – a) assisting ships from berth to sea and vice-versa b) moving barges from one location to another. In this study, both jobs are considered under Assist as both main engines are operating irrespective of job nature. The conventional tug operates two main engines and one auxiliary engine during this mode. The hybrid boat operates both main engines. A 350 kW auxiliary engine rarely operates during Assist.
Tables 2-5 and 2-6 show the operating details for the conventional and hybrid tug boats during each mode.
Table 2-5: Operating modes of conventional tugboat
Shore Power Off Off Off OffStop Off Off On OffIdle On On On OffTransit 1 On On On OffTransit 2 On On On OffAssist On On On Off
AE#1 JD 6081
AE#2 JD 6081
Operational Modes
ME#1 CAT 3512C
ME#2 CAT 3512C

20
Table 2-6: Operating modes of hybrid tugboat. ME: Main Engine; AE: Auxiliary Engine
To determine the activity of the hybrid tug, GPS, and engine and battery data had to be logged continuously for a period of over one month. For this purpose, a Labview program was developed that was capable of interfacing with the four engine electronic control modules (ECMs), a GPS and batteries to retrieve the required information continuously on a second by second basis and write it into a comma separated value (CSV) file. Each line in the CSV file generated by the code represents one second. The program automatically creates a new file after 65500 seconds thereby ensuring that the CSV file is not too large for Microsoft Excel to handle. This Labview program was installed and operated on the data-logger which is a computer with Windows XP operating system. The Labview program was incapable of logging ECM signals from two different Society of Automotive Engineers (SAE) protocols (J1939 and J1708). Therefore, MTU/Detroit diesel engine which was compatible with J1708 protocol was recorded separately on the laptop with the same Labview program. Table 2-7 lists all the parameters that were logged from the tugboat along with the devices used for interfacing between the power sources and the data-logger.
Schematic of the data-logger set up on the hybrid tugboat is provided in Figures 2-2. The data-logger and the laptop were placed on the workbench in the engine room of tug boat. Data from the ECMs on the two main propulsion engines and the two auxiliary engines were obtained using four Dearborn Protocol Adapters that convert the J1939 and 1807 signals to serial/RS-232 signals. Power for the Dearborn adapters was obtained from the batteries used for engine startup.
A Garmin GPS that provides data on location, speed and course of the tug at any second during the sample time was placed at the top of the mast on the tug boat to ensure that it receives a clear signal. Serial cables were run from GPS to the data-logger.
The hybrid tug has a switch in the wheelhouse that is used by the captain for operating the boat. This wheelhouse switch communicates with an energy management system to determine how many power sources will be required for that operation. The wheelhouse
Shore Power Off Off Off Off OffStop Off Off Off On (as needed) OnIdle Off Off Off On (as needed) OnTransit 1 Off Off On Off Off (Charging)Transit 2 Off Off On On Off (Charging)Assist On On Off Off On (as needed)
BatteryOperational
ModesME#1
CAT 3512CME#2
CAT 3512CAE#1
DETROITAE#2
JD 6081

21
switch has five positions which indicate the mode of operation of the tug. These are listed below:
1 - Stop Tug switches between the batteries and one auxiliary engine.
2 - Idle Tug switches between the batteries and one auxiliary engine.
3 - Transit 1 Tug uses one auxiliary engine (JD 6081 – 125kW).
4 – Transit 2 Tug uses both auxiliary engines.
5 - Assist Tug uses both main and the batteries (if needed) for a job.
AKA provided us with five digital signals, indicating the operating mode of the hybrid tugboat. They also provided us with three analog signals that give information on the operation of the battery array
1 - State of Charge of Battery Array
2 - Voltage of Battery Array
3 - Current for Battery Array
The wireless network on the boat was not strong enough for file transfer. Therefore the port engineer uploaded the CSV files on a weekly basis to a file transfer protocol (FTP) site.
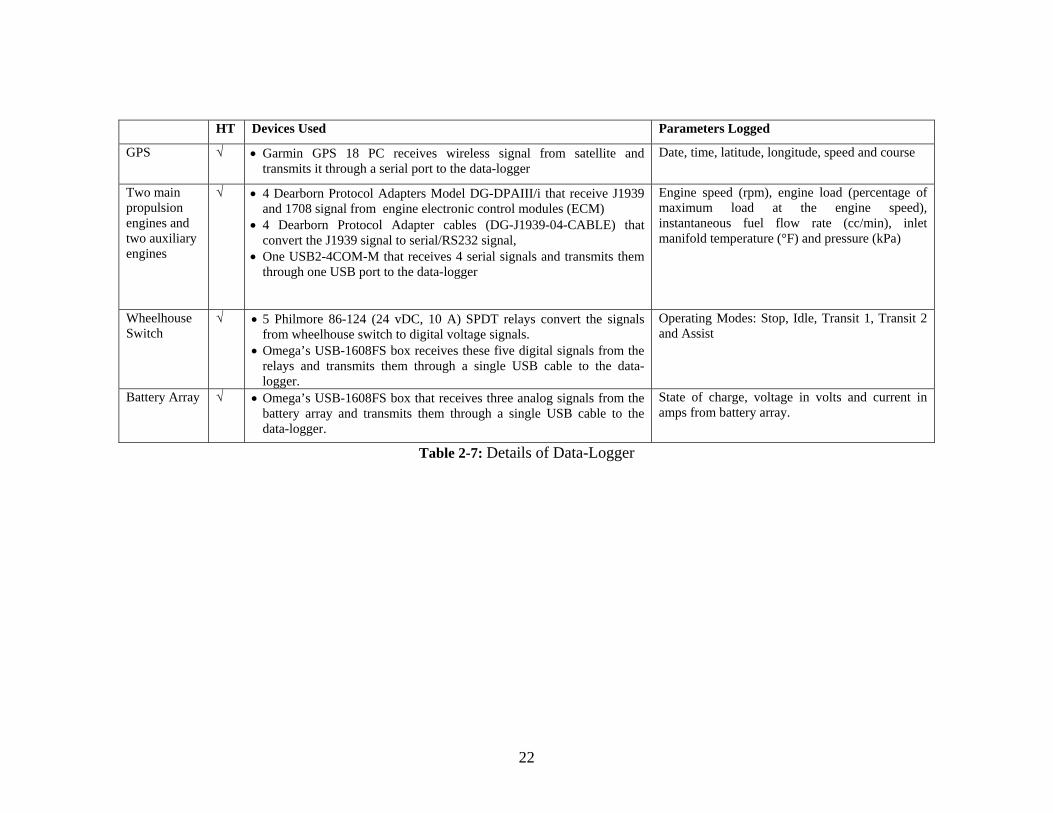
22
HT Devices Used Parameters Logged
GPS √ Garmin GPS 18 PC receives wireless signal from satellite and transmits it through a serial port to the data-logger
Date, time, latitude, longitude, speed and course
Two main propulsion engines and two auxiliary engines
√ 4 Dearborn Protocol Adapters Model DG-DPAIII/i that receive J1939 and 1708 signal from engine electronic control modules (ECM)
4 Dearborn Protocol Adapter cables (DG-J1939-04-CABLE) that convert the J1939 signal to serial/RS232 signal,
One USB2-4COM-M that receives 4 serial signals and transmits them through one USB port to the data-logger
Engine speed (rpm), engine load (percentage of maximum load at the engine speed), instantaneous fuel flow rate (cc/min), inlet manifold temperature (°F) and pressure (kPa)
Wheelhouse Switch
√ 5 Philmore 86-124 (24 vDC, 10 A) SPDT relays convert the signals from wheelhouse switch to digital voltage signals.
Omega’s USB-1608FS box receives these five digital signals from the relays and transmits them through a single USB cable to the data-logger.
Operating Modes: Stop, Idle, Transit 1, Transit 2 and Assist
Battery Array √ Omega’s USB-1608FS box that receives three analog signals from the battery array and transmits them through a single USB cable to the data-logger.
State of charge, voltage in volts and current in amps from battery array.
Table 2-7: Details of Data-Logger
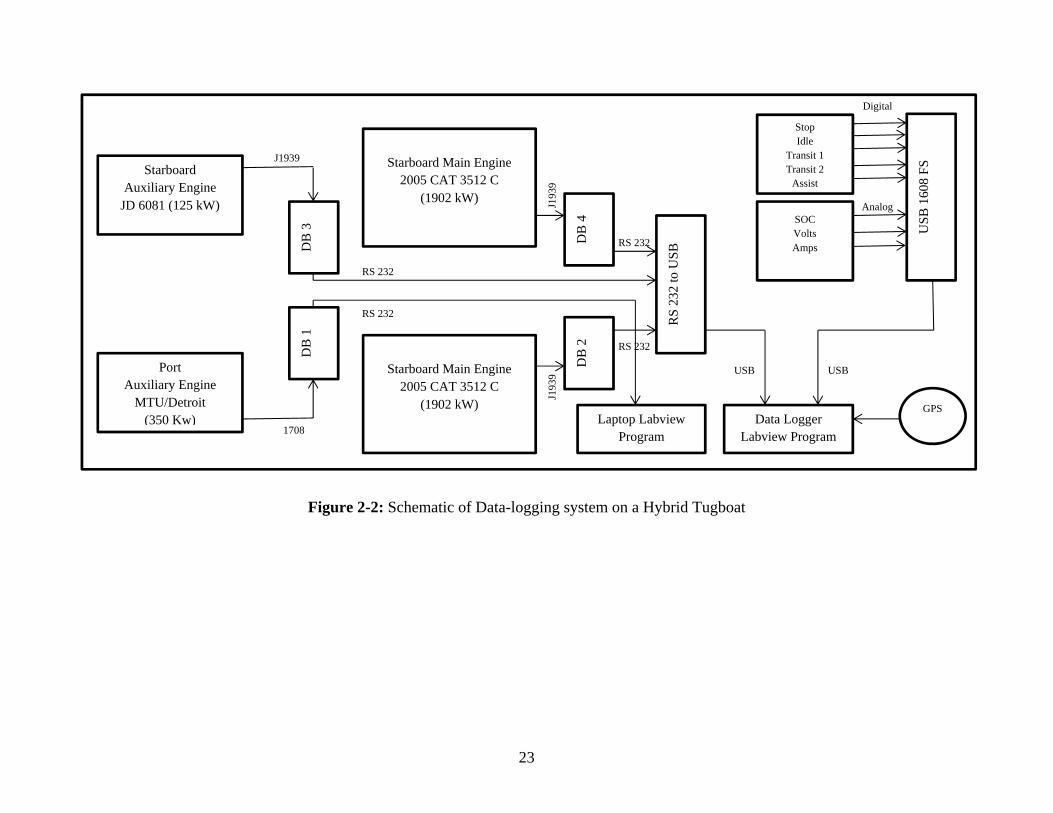
23
Figure 2-2: Schematic of Data-logging system on a Hybrid Tugboat
Starboard Auxiliary Engine
JD 6081 (125 kW)
Port Auxiliary Engine
MTU/Detroit (350 Kw)
Starboard Main Engine 2005 CAT 3512 C
(1902 kW)
Starboard Main Engine 2005 CAT 3512 C
(1902 kW)
DB
3
DB
1
DB
2
DB
4
RS
232
to U
SB
Stop Idle
Transit 1 Transit 2
Assist
SOC Volts Amps
US
B 1
608
FS
Data Logger Labview Program
Laptop Labview Program
GPS
J1939
J193
9 J1
939
1708
RS 232
RS 232
RS 232
RS 232
USB USB
Digital
Analog

24
2.5.2 Establishing Weighting Factors for Tugboat Operating Modes The weighting factor for each operating mode was calculated as the ratio of the time spent by the tug in that mode to the total sample time (Equation 2-3). The CVS files obtained from data logger have five columns which represent five (Stop, Idle, Transit 1, Transit 2, Assist) operating modes of the tugboat. Depending upon the mode that tugboat is in; digital signals from Energy Management System will feed a value “1” to the data logger and “0” for rest of the operating modes. For example, when tugboat is in Assist mode, Assist column in the CVS file will be represented by “1” and rest of modes will be represented by “0”. Therefore, in each CVS file, sum of individual operating modes represents the time spent by tug in those operating modes. Hence, weighting factor for each operating mode was obtained as the ratio of the time spent by the tug in that mode to the total sample time. Please note that the weighting factors for the conventional tugboat (prior to retrofit) are assumed to be same as hybrid tugboat.
2.5.3 Developing Engine Histograms Engine histograms are basically graphs showing the amount of time the engine spends at different loads. In this project, engine histograms have to be developed for all four engines for each tug operating mode. During the data logging procedure, the engine speed in rpm and engine load as a percentage of the maximum load at that speed were retrieved from the engines’ ECMs and written into the CSV files. For the auxiliary engines which are constant speed diesel generators, the percent load from the ECM has to be multiplied by the maximum rated load of the engine in kW to get the load on the engine. The main propulsion engines are variable speed engines. Therefore, at any given speed the maximum attainable load in kW was obtained from the engines’ lug curve and multiplied by the percent load retrieved from the ECM to determine the load on the engine. The Lug Curve for the main engine was obtained from the ARB14 study, Evaluating Emission Benefits of a Hybrid Tug Boat (2010).
The ratio of the carbon-dioxide emissions to the load on the engine is an indication of its thermal efficiency. This efficiency tends to be relatively constant across the entire range of engine operation. Therefore, we would expect a straight line relationship between the engine load and the CO2 emissions in kg/hr. Any significant deviation from the straight line relationship will indicate an error in the load readings provided by the ECM. Figure 2-3 to 2-5 shows plots of ECM load versus the measured CO2 emissions in kg/hr for the main engine and auxiliary engines tested for emissions.

25
Figure 2-3: ECM load versus CO2 emissions for the main engine (CAT 3512 C)
Figure 2-4: ECM load versus CO2 emissions for the auxiliary engine (JD 6081)

26
Figure 2-5: ECM load versus CO2 emissions for the auxiliary engine (MTU/Detroit)
Within each CVS file, five more spreadsheets were added to represent five operating modes of the tugboat. Based on the digital value of “1” obtained from energy management system to indicate the engaged operating mode, data in CVS file was filtered and added to the respective operating mode spreadsheet. Within each operating mode spreadsheets, engine loads were split into twelve bins for all four engines as shown in Table 2-8.
Table 2-8: Twelve bins for dividing engine load range
Bin Load Range no. of data points in each BinBin 0 0% Bin 0Bin 1 <10% Bin 1 - Bin 0Bin 2 10% to <20% Bin 2 - Bin 1Bin 3 20% to <30% Bin 3- Bin 2Bin 4 30% to <40% Bin 4- Bin 3Bin 5 40% to <50% Bin 5- Bin 4Bin 6 50% to <60% Bin 6- Bin 5Bin 7 60% to <70% Bin 7- Bin 6Bin 8 70% to <80% Bin 8- Bin7Bin 9 80% to <90% Bin 9- Bin 8Bin 10 90% to <100% Bin 10- Bin 9Bin 11 <101% Bin 11- Bin 10

27
Using this data the fraction of time spent by the engine in any bin for a particular operating mode was calculated. This was then plotted in the form of engine histograms. The engine histograms developed from the CSV files are used to calculate the total emissions from a tug. Therefore it is important to ensure that the state of charge of the battery at the start and end time of each sample period chosen for the calculation of the engine histogram are the same. This would eliminate any biases in emissions resulting from the use of the auxiliary engine for charging the batteries. This protocol was adopted based on the guidelines in the SAE15 and ARB16 testing protocols for hybrid electric vehicles.
2.6 Emissions Testing Procedure
2.6.1 Test Engines Conventional Campbell Foss was powered by two main propulsion engines and two auxiliary engines/generators. The main engines (ME) CAT 3512 Tier 1 marine diesel engines while the auxiliary engines (AE) John Deere 6081 diesel engines (Table 2-9). The MEs were used for propulsion and the AEs were used for hoteling, lighting, air conditioning and to operate the winch motor.
Table 2-9: Engine Specifications for Conventional Campbell Foss Main Engine (ME) Auxiliary Engine (AE)
Manufacturer /Model CAT 3512 John Deere 6081
Manufacture Year 2005 2005
Certification Standard Tier 1 Tier 0
Technology 4-Stroke Diesel 4-Stroke Diesel
Max. Power Rating 1902 kW 125 kW
Rated Speed 1800 rpm 1800 rpm
# of Cylinders 8 8
Displacement 58.6 liters 8.1 liters
The retrofit hybrid Campbell Foss is powered by the original MEs and one of the two original AEs. The other AE was repowered with a new Tier 2 engine (Table 2-10).
Table 2-10: Engine specifications of new Auxiliary Engine Auxiliary Engine (AE)
Manufacturer /Model MTU/Detroit Diesel Series 60
Manufacture Year 2011
Technology 4-Stroke Diesel

28
Certification Standard Tier 2
Max. Power Rating 350 kW
Rated Speed 1800 rpm
# of Cylinders 6
Displacement 14 liter
2.6.2 Fuels The project used commercial On-Road #2 diesel fuel meeting specification requirements of the California Air Resources Board and the ASTM 975. Typically, the sulfur content in the fuel is < 10ppmw.
2.6.3 Test Cycle and Operating Conditions Phase I: The primary goal of this phase of the testing program was to establish if the test engines meet their certification standards when in-use. Gaseous and PM2.5 emission measurements on these engines were made based on the ISO 8178-1 protocol (Appendix A). Briefly, a partial dilution system with a venturi was used for PM2.5 sampling (Appendix A). Carbon dioxide, nitrogen oxides and carbon monoxide were measured in both the raw and the dilute exhaust. The ratio of the concentration of carbon dioxide in the raw to the in the dilute was used to determine the dilution ratio for PM2.5 sampling.
The main propulsion engines were tested following the steady state load points in the ISO 8178-4 E3 cycle. It has been found in the previous study that main engine spent significant amount of time at loads below 25%. Also, engine histogram (Figure 2-6) obtained from ECM clearly indicated that the main engine was operated under 25% load for approximately 80% of its time. Therefore, an additional measurement was made at the 15% and 10% of engine load. The auxiliary engines were operated at the steady state load points in the ISO 8178-4 D2 cycle and at 15% engine load. Details of the test cycles are provided in Appendix B.
Table 2-11: Test matrix of emissions testing of Phase I
RT: Real Time Monitoring and Recording of Gaseous Emissions; ISO: Filter Samples taken in accordance with ISO 8178-4 E3/D2 cycles
DATE6/27/20116/28/2011
Campbell Conventional
Tug Boat EngineCAT 3512 C
JD 6081
Engine LoadsRT & ISO: 100%, 75%, 50%, 25%, 15%, 10%RT & ISO: 100%, 75%, 50%, 25%, 15%, 10%
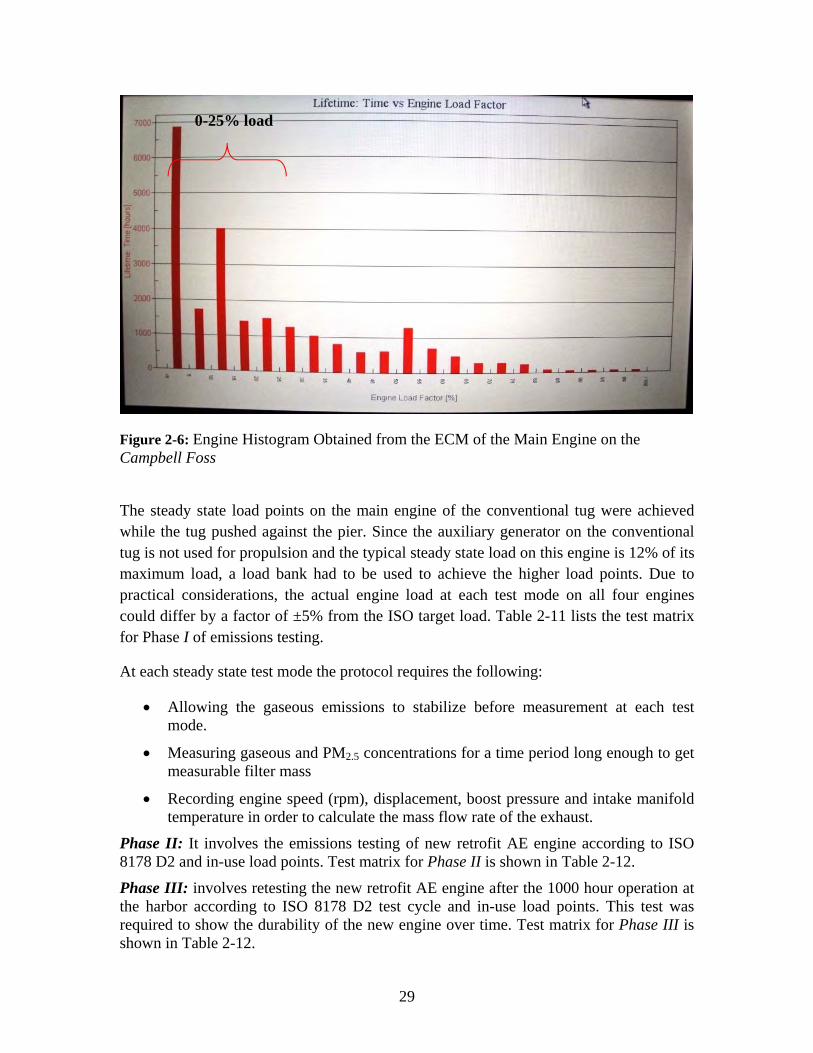
29
Figure 2-6: Engine Histogram Obtained from the ECM of the Main Engine on the Campbell Foss
The steady state load points on the main engine of the conventional tug were achieved while the tug pushed against the pier. Since the auxiliary generator on the conventional tug is not used for propulsion and the typical steady state load on this engine is 12% of its maximum load, a load bank had to be used to achieve the higher load points. Due to practical considerations, the actual engine load at each test mode on all four engines could differ by a factor of ±5% from the ISO target load. Table 2-11 lists the test matrix for Phase I of emissions testing.
At each steady state test mode the protocol requires the following:
Allowing the gaseous emissions to stabilize before measurement at each test mode.
Measuring gaseous and PM2.5 concentrations for a time period long enough to get measurable filter mass
Recording engine speed (rpm), displacement, boost pressure and intake manifold temperature in order to calculate the mass flow rate of the exhaust.
Phase II: It involves the emissions testing of new retrofit AE engine according to ISO 8178 D2 and in-use load points. Test matrix for Phase II is shown in Table 2-12.
Phase III: involves retesting the new retrofit AE engine after the 1000 hour operation at the harbor according to ISO 8178 D2 test cycle and in-use load points. This test was required to show the durability of the new engine over time. Test matrix for Phase III is shown in Table 2-12.
0-25% load

30
Table 2-12: Test matrix of emissions testing of Phase II and III
RT: Real Time Monitoring and Recording of Gaseous Emissions; ISO: Filter Samples taken in accordance with ISO 8178-4 E3/D2 cycles
2.6.4 Sampling Ports Only one sample port was available in the stack of each engine. A T- joint was installed at the end of the sample probe to provide raw gas sample for gaseous measurements and dilution for PM2.5 sampling. Sample ports on both main and auxiliary engines were located before the muffler. For the main propulsion engines, the sample port was located just a few inches above the exhaust manifold while on the auxiliary engines it is several feet away from the manifold. The sampling probes used for emissions testing were 3/8th inch stainless steel tubing. These probes were inserted five inches into the main engine stacks (stack diameter: fourteen inches) and two in into the auxiliary engine stack (stack diameter: six inches). These distances were sufficiently away from any effects found near the stack walls. Figure 2-7 and Figure 2-8 show pictures of installed setup for sampling gaseous and particulate emissions from auxiliary and main engines of the conventional Campbell Foss tug.
Figure 2-7 Sampling port for Auxiliary engine on conventional Campbell Foss tug boat
Phase Tugboat Engine DateII MTU/Detroit 3/21/2012III MTU/Detroit 7/12/2012
Hybrid Campbell
RT &ISO: 100%, 75%, 50%, 25%, 15%, 10%, 5%RT &ISO: 100%, 75%, 50%, 25%, 15%, 10%, 5%
Engine Loads
Clean Compressed Air
Dilution Tunnel
Raw Sample Line
Heated Line for THC Measurement
T-Joint at the End of the Sample

31
Figure 2-8 Sampling port for Main engine on conventional Campbell Foss tug boat
2.6.5 Measuring Gases and PM2.5 emissions The concentrations of carbon dioxide (CO2), nitrogen oxides (NOx) and carbon monoxide (CO) were measured both in the raw exhaust and the dilution tunnel with a Horiba PG-250 portable multi-gas analyzer. During Phase I particulate matter (PM2.5) was sampled from the dilution tunnel on Teflo® and Tissuquartz filters. These filters were analyzed to determine the total and speciated PM2.5 mass emissions.
2.6.6 CalculatingExhaustFlowRatesIntake Air Method: An accurate calculation of the exhaust gas flow rate is essential for calculating emission factors. This method calculates the exhaust gas flow as equal to the flow of intake air. This method is widely used for calculating exhaust flow rates in diesel engines and assumes the engine is an air pump, so the flow of air into the engine will be equal to the exhaust flow out of the engine. The flow rate of intake air is determined from the cylinder volume, recorded engine speed, and the temperature and boost pressure. The method works best for four stroke engines or for two stroke engines where there the scavenger air flow is much smaller than the combustion air. All four test engines in this program were four stroke marine diesel engines.
Carbon Balance Method: The calculated emission factor is strongly dependent on the mass flow of the exhaust. Two methods for calculating the exhaust gas mass flow and/or
Dilution Tunnel
Teflo® and Quartz Filter
Raw Sample Line
32
the combustion air consumption are described in ISO 8178-1 Appendix A1. Both methods are based on the measured exhaust gas concentrations and fuel consumption rate. The two ISO methods are described below.
Method 1, Carbon Balance, calculates the exhaust mass flow based on the measurement of fuel consumption and the exhaust gas concentrations with regard to the fuel characteristics (carbon balance method). The method is only valid for fuels without oxygen and nitrogen content, based on procedures used for US EPA and United Nation Economic Commission for Europe (UNECE) calculations.
Method 2, Universal, Carbon/Oxygen-balance, is used for the calculation of the exhaust mass flow. This method is applicable for fuels containing H, C, S, O and N in known proportions and does not apply here since the fuel contains mainly carbon and hydrogen and rest of the elements were insignificant.
The carbon balance methods may be used to calculate exhaust flow rate when the fuel consumption is measured and the concentrations of the exhaust components are known. In these methods, flow rate is determined by balancing carbon content in the fuel to the measured carbon dioxide in the exhaust. This method can only be used when the fuel consumption data are available.
For both main and auxiliary engine on the tug, fuel consumption rate was recorded from ECM. Fuel consumption rate was used in calculating exhaust flow rate by carbon balance method. Intake manifold temperature and boost pressure readings were obtained from the main engine ECM. These were used for the exhaust flow calculation based on the intake air method. Boost pressure was not retrievable from the auxiliary engine; therefore calculation based on the intake air method was not performed.
2.6.7 Calculation of Engine Load The actual load on the engine at each test modes is required to calculate the modal and overall emission factors in g/kW-hr. The engine ECM provides engine speed and the percentage of the maximum engine load at that speed. For the main propulsion engines, this data was used along with the lug curve provided by the manufacturer for that engine family to determine the actual load in kW for each test mode. For the constant speed auxiliary engines the % of maximum engine load obtained from the engine ECM was multiplied by the engine’s rated prime power to get the load on the engine in kW.
1 International Standards Organization, IS0 8178-1, Reciprocating internal combustion engines - Exhaust emission measurement -Part 1: Test-bed measurement of gaseous particulate exhaust emissions, First edition 1996-08-l5

33
2.6.8 Calculation of Emissions in g/hr Mass emissions of CO2, NOx and CO in g/hr were determined using the calculated exhaust flows and the measured concentrations in the exhaust. For PM2.5 mass emissions the concentration in the dilute exhaust was calculated as a ratio of the measured filter weight to the total sample flow through the filter. This was then converted to a concentration in the raw exhaust by multiplying with the dilution ratio. The raw PM2.5 concentration was used along with the exhaust flow to determine the mass emissions in g/hr.
2.6.9 Calculation of Emission Factors in g/kW-hr The emission factor at each mode is calculated as the ratio of the calculated mass flow (g/hr) in the exhaust to the reported engine load (kW).
An overall single emission factor representing the engine is determined by weighting the modal data according to the ISO 8178 E3 or ISO 8178 D2 cycle requirements and summing them. The equation used for the overall emission factor is as follows:
∑
∑
where:
Overall weighted average emission factor in g/kW-hr Total number of modes in the ISO duty cycle Calculated mass flow in g/hr for the operating mode
weighing factor for the operating mode Engine load in kW for the operating mode

34
3 Results and Discussions
3.1 Emissions Testing Phase I The primary gaseous emissions measured during this test program include carbon dioxide (CO2), nitrogen oxides (NOx), and carbon monoxide (CO). Each of these gaseous species was measured using the ISO standard instrumentation (Appendix A, Section 4.6). In addition to gaseous emissions, the PM2.5 mass emissions and the speciated PM2.5
emissions as elemental carbon (EC) and organic carbon (OC) were measured. As described earlier, the PM mass in the raw exhaust was sampled using a partial dilution method and collected on filter media. A detailed list of the modal gaseous and PM2.5
emissions in g/hr and g/kW-hr, for the two test engines are provided in Tables 3-1 and 3-2 respectively. In the previous study, activity data developed for the tug boat reflected that the tug spends significant amount of time while operating between 10-20% engine loads. Therefore, emissions at 15% load for auxiliary engine, and 10% and 15% for main engine were tested in addition to load specified in ISO 8178 for engine certification.
Duplicate measurements were made at steady state test mode. Each gaseous measurement was a three to seven minute average of one hertz data obtained from the instrument. The standard deviation of three to seven minute averages was <2% for CO2. This indicates that the load on the engine while testing that mode was steady, thereby validating the measurement at each of those test modes. In the case of PM2.5, each measurement refers to a filter sample. The range across these duplicate measurements is shown as error bars in the Figures 3-1 and 3-2.
Modal emissions data represented in Table 3-2 are helpful in developing emission inventories of tugboats. High emission factors are observed at loads 25% or below for both engines. This is consistent with our observations and the fact that brake-specific fuel consumption increases significantly at these load points.
Table 3-2 also lists the overall weighted average emission factors for both of the test engines. The overall weighted factors from both engines were also compared with EPA Tier 1 standards. The overall weighted average for auxiliary engine (JD 6081) is well below EPA Tier 1 standards for NOx and PM2.5. Moreover, EFCO is comparatively very low which is typical of diesel engines. In case of Main engine (CAT 3512 C); overall weighted emission factors are also below EPA Tier 1 limit. EFPM2.5 is significantly lower than standard which is similar to previous study. The speciated PM2.5 data suggests that for both engines, organic fraction of total PM dominates at lower loads (≤ 25%) and elemental carbon at loads above 25%. Overall, Phase I study concludes that the both engines are well maintained; their emissions are within certification limits and are representative of engines in their category.

35
Table 3-1: Results for Phase I of Emissions Testing in g/hr
NOx CO CO2 THC PM2.5 EC OCTarget Actual
10% 9% 242 42 20920 9.2 8.6 0.8 4.615% 15% 278 39 24463 13 8.6 1.3 5.225% 24% 366 44 30950 7.7 17 6.4 5.750% 50% 372 88 55781 12 23 19 5.775% 74% 519 137 71380 16 37 22 11
100% 100% 753 296 94530 20 45 28 11
10% 8% 2299 166 121606 63 10 1.6 5.015% 11% 2922 195 155143 63 6.7 3.2 5.725% 24% 4860 1252 300463 116 32 18 1150% 50% 8638 2574 615489 155 101 56 2875% 76% 11728 2571 922501 207 190 76 66
100% 100% 14078 2481 1257418 224 207 81 81
g/hrAuxiliary Engine on Conventional Campbell Tug JD 6081
Main Engine on Conventional Campbell Tug CAT 3512 C
Load

36
Table 3-2: Emission Factors in g/kW-hr from Phase I of Testing
NOx CO CO2 THC PM2.5 EC OCTarget Actual
10% 9% 21.5 3.75 1860 0.82 0.76 0.07 0.4115% 15% 14.8 2.09 1305 0.69 0.46 0.07 0.2825% 24% 12.2 1.46 1032 0.26 0.55 0.21 0.1950% 50% 5.9 1.41 892 0.20 0.37 0.31 0.0975% 74% 5.6 1.49 772 0.17 0.40 0.24 0.12
100% 100% 6.0 2.37 756 0.16 0.36 0.22 0.097.1 1.59 870 0.20 0.42 0.25 0.139.2 11.4 0.54
10% 8% 14.3 1.03 755 0.39 0.06 0.01 0.0315% 11% 13.6 0.91 722 0.29 0.03 0.01 0.0325% 24% 10.9 2.8 671 0.26 0.07 0.04 0.0250% 50% 9.1 2.7 647 0.16 0.11 0.06 0.0375% 76% 8.1 1.8 639 0.14 0.13 0.05 0.05
100% 100% 7.4 1.3 663 0.12 0.11 0.04 0.048.2 1.80 649 0.14 0.12 0.05 0.059.2 11.4 0.54
Weighted Avg.EPA Tier 1
g/kW-hrAuxiliary Engine on Conventional Campbell Tug JD 6081
Wt. Avg.EPA Tier 1
Main Engine on Conventional Campbell Tug CAT 3512 C
Load

37
Figure 3-1: Modal Emission Factors for Auxiliary Engine on Conventional Campbell Foss Tug JD 6081
Figure 3-2: Modal Emission Factors for Main Engine on Conventional Campbell Foss Tug CAT 3512 C

38
Diesel particulate matter primarily consists of elemental and organic carbon. Figure 3-3 shows a plot of the PM2.5 emissions in g/hr obtained from two separate methods – gravimetric measurements of PM2.5 collected on Teflo® filters and total carbon analysis of PM2.5 collected on parallel Tissuquartz filters by a thermal/optical carbon analyzer (±20% measurement uncertainty). Here, the total mass is represented as the sum of elemental carbon (EC) and organic mass (OM). The organic mass is equal to the organic carbon (OC) multiplied by a factor of 1.2 to account for hydrogen and oxygen attached to the carbon in the total PM. Overall, good agreement is observed between two different PM measurement methods.
Figure 3-3: PM2.5 Mass Balance for A) Auxiliary Engine JD 6081 and B) Main Engine CAT 3512C
y = 0.94xR² = 0.92
0
10
20
30
40
50
60
0 10 20 30 40 50 60
EC
+O
M (
g/h
r)
PM mass (g/hr)
Auxiliary EngineA
y = 0.83xR² = 0.98
0
50
100
150
200
250
0 50 100 150 200 250
EC
+O
M (
g/h
r)
PM mass (g/hr)
Main EngineB

39
3.2 Emissions Testing Phase II & III Second and third phase of the emissions testing involved emission measurement from the new AE on the hybrid Campbell Foss at 0 hour and 1000 hours of operation, respectively. In both phases, emissions were measured at load points illustrated in ISO 8178 D2 test cycle and at 15% and 5% engine load where engine spends significant amount of time. Similar to Phase I, duplicate measurements were made at each load point. Table 3-3 and 3-4 shows gaseous and particulate emissions in g/hr and g/kW-hr, respectively.
Table 3-3: Emission Rates in g/hr for Phase II & III of Emissions Testing
The primary objective of emission measurements from MTU engine was to ensure that the emissions are within the Tier 2 standards and the tested engine is the representative of engines in their class.
Table 3-4 also lists the overall weighted average emission factors for MTU engine from both phases of testing. It also shows the EPA Tier 2 standard for that each test engine family. The overall weighted averages for MTU AE at 0 & 1000 hours are below EPA Tier 2 standards for NOx and PM2.5. Moreover, EFCO is comparatively very low which is typical of diesel engines. The percentage difference between EFNOx and EFCO2 measured at 0 hour and 1000 hours emissions testing are 7.8% and 3.0%, respectively which reflects good durability of the engine and robust emission measurements. Note that the emissions measured at 1000 hours are used in calculating in-use emissions from MTU engine.
NOx CO CO2 THC PM2.5 EC OCTarget Actual
100 93 2507 116 259240 20.5 24.5 15.4 51.975 73 1879 73 194126 13.1 12.6 6.6 3.950 51 1075 63 129138 11.1 15.4 9.6 3.125 25 506 63 77094 11.8 10.9 6.0 3.915 15 305 71 48804 12.8 7.7 3.0 3.510 10 174 60 29843 11.7 6.0 1.6 3.75 5 144 73 26111 15.4 6.2 0.7 4.4
100 99 2155 293 258404 166 40.2 24.6 36.175 75 1813 129 192278 127 32.6 16.0 20.850 50 1001 111 127348 100 19.4 20.2 10.025 25 466 76 72713 102 14.3 12.9 4.815 15 272 85 43997 118 8.9 4.8 2.010 10 169 71 28879 117 6.5 2.5 1.65 5 131 142 26394 13 3.2 0.9 1.6
g/hrMTU/Detroit Series 60 (0 hour Emission Measurements)
MTU/Detroit Series 60 (1000 hour Emission Measurements)
Load (%)

40
Table 3‐4: Emission Factors in g/kW‐hr for Phase II & III of Emissions Testing
The rates in g/hr as a function of engine load for gaseous and particulate emissions coupled to the engine histograms (section 3.3) are used to calculate total emissions from each engine at the different tugboat operating modes.
3.3 Activity
3.3.1 Weighting Factors for Tug Operating Modes Figure 3-4 shows the overall weighting factors for the hybrid tugboat. Total sample times used for the determined these weighing factors were 37 days for the hybrid tugboat. The figure shows that the dolphin class tug spends about 51% of its total operating time at Stop (includes Shore Power), ~2% in Idle ~14% in Transit (Transit 1 and Transit 2), and ~33% in Assist (includes barge moves). Note that the overall weighting factors for the conventional Campbell Foss are assumed to be same as hybrid Campbell Foss.
Overall, 37 days of activity data was collected in three intervals of time period. Table 3-5 represents weighting factors for these three intervals. Clearly, no significant variation in operating modes was observed between three intervals.
NOx NOx+NHMC CO CO2 THC PM2.5 EC OCTarget Actual
100 93 7.7 7.7 0.35 793 0.06 0.07 0.05 0.1675 73 7.4 7.4 0.29 762 0.05 0.05 0.03 0.0250 51 6.1 6.1 0.35 729 0.06 0.09 0.05 0.0225 25 5.8 5.9 0.72 886 0.14 0.13 0.07 0.0415 15 5.8 6.0 1.34 927 0.24 0.15 0.06 0.0710 10 5.0 5.3 1.72 861 0.34 0.17 0.05 0.115 5 8.2 9.1 4.18 1492 0.88 0.35 0.04 0.25
6.7 6.8 0.42 776 0.08 0.08 0.04 0.04− 7.2 5.0 − − 0.20 − −
100 99 6.2 6.7 0.84 745 0.48 0.12 0.07 0.1075 75 6.9 7.4 0.49 734 0.48 0.12 0.06 0.0850 50 5.8 6.3 0.64 732 0.58 0.11 0.12 0.0625 25 5.4 6.5 0.87 836 1.17 0.16 0.15 0.0515 15 5.3 7.5 1.55 846 2.27 0.13 0.09 0.0410 10 5.0 8.4 2.08 849 3.45 0.19 0.07 0.055 5 8.7 9.4 8.47 1553 0.75 0.19 0.06 0.09
6.2 6.9 0.67 753 0.68 0.13 0.09 0.07− 7.2 5.0 − − 0.20 − −
Weighted Avg.Tier 2
g/kW-hrMTU/Detroit Series 60 (0 hour Emission Measurements)
MTU/Detroit Series 60 (1000 hour Emission Measurements)
Weighted Avg.Tier 2
Load (%)

41
Figure 3-4: Overall Weighing Factors for Hybrid Tugboat Operating Modes
Table 3-5: Weighting factors for small intervals of time period
Tugboat operations in the port of Los Angeles and Long Beach consist primarily of docking and undocking ocean going vessels such as containerships and bulkers providing tanker escorts and moving bunkering barges in the harbor. The barge movements provide bunker fuel to ocean going vessels while they are berthed at various facilities in the Long Beach and Los Angeles ports.
The bunker barges are loaded at the Vopak fueling facility at Berth 187 in Los Angeles and Foss tugs are berthed at Pier D Berth 49. In between Long Beach Berth 49 and Los Angeles Berth 187 there is the Schuyler Heim drawbridge over the Cerritos Channel. Until January 2012 the horizontal clearance under this bridge was 142 feet which meant the tugs moving barges could move freely under this drawbridge. However, there is currently a Caltrans project underway to replace the aging Schuyler Heim drawbridge for seismic upgrades. In January 2012, two trestles were constructed adjacent to the existing bridge, which resulted in a horizontal restriction of 75 feet between the trestles. The Foss bunker barges are 290 feet in length, 62 feet in breadth with a molded depth of 18.5 feet. The tugs which are secured alongside the barge are 34 to 40 feet in breadth with an additional three feet of fenders between the tug and barge. This tug barge combination
Stop Idle Transit 1 Transit 2 Assist50.6% 2.1% 14.8% 0.7% 31.7%48.7% 3.7% 15.1% 1.2% 31.3%52.2% 0.6% 11.7% 1.0% 34.5%
05/25/12-06/06/1206/09/12-06/17/1206/21/12-09/07/12
Time Period

42
cannot physically navigate through this newly restricted channel. This construction project is expected to continue for five years at which point the trestles will be removed and the horizontal clearance will return to pre-construction clearance.
Figure 3-5: Comparison of Overall Weighting Factors for Hybrid Carolyn Dorothy and Campbell Foss
The practical result of this restricted waterway is that to service customers located at the majority of the terminals in the Port of Long Beach, Foss tugs with barges must now travel all the way through the Port of Los Angeles and enter the Port of Long Beach from the Outer Harbor instead of staying within the Inner Harbor of the Port of Long Beach (Appendix D). Between February and mid-November 2012, Foss tugs with barges have diverted over 1,800 miles due to this bridge construction project.
The ARB14 study conducted in 2010, developed a duty cycle analysis for the Foss tugs Carolyn Dorothy (CD) and Alta June (AJ), sister vessels to the Campbell Foss. All three vessels operate from Long Beach Berth 49 and typically do the same mix of work in the ports of Los Angeles and Long Beach. The 2010 report showed both the Carolyn Dorothy and Alta June spent 22% of their time in “Assist” mode doing either ship assist or barge moves. The 2012 study of the Campbell Foss which was conducted between May and July of 2012 (after the channel restriction) showed this vessel spent 33% of its time in the “Assist” mode (Figure 3-5). One explanation for this variance is that this channel restriction and attendant navigational deviation means the Campbell Foss spent more time in the Assist mode because of the more time spent in moving barges for greater distance.

43
3.3.2 Engine Histogram for Conventional Campbell Foss Alta June and Campbell Foss belongs to the same class of tugboats. Prior to the hybrid retrofit for Campbell Foss, both tugboats had same MEs and AEs. Therefore, engine histograms obtained for Alta June in the ARB study are assumed to be same for the conventional Campbell Foss.
The conventional Campbell Foss had only one of the two auxiliary engines working for all tug operating modes, except Shore Power. This auxiliary engine always operated at 10-12% of its maximum load. Therefore an engine histogram of the auxiliary engine would show a 100% bar at the 10-12% load with no bars at all other load points. The main engines on the conventional tugboat are off when the tugboat is at Stop or plugged into Shore Power. During the Idle mode these engines are idling with an engine load of about 5-7% of the maximum rated power. Figure 3-6 and 3-7 shows engine histograms for both main engines on the conventional Campbell Foss for Transit and Assist operating modes.
Figure 3-6: Main Engine Histogram during Transit Mode for Conventional Campbell Foss

44
Figure 3-7: Main Engine Histogram during Assist Mode for Conventional Campbell Foss
3.3.3 Engine Histograms for Hybrid Campbell Foss Engine histograms for hybrid Campbell Foss was obtained from the activity logged for 37 days during this study.
Stop Mode: In this mode, both main engines are off similar to conventional Campbell Foss. Energy required for hoteling purposes are either extracted from the JD AE or batteries. The MTU AE is rarely operated during Stop mode as shown in Figure 3-8. For the case of the conventional Campbell Foss, only one AE was always operated at 10-12% engine load. Therefore, some emissions benefits are expected on using hybrid tugboat during Stop mode.
Figure 3-8: AEs histogram during Stop mode for Hybrid Campbell Foss
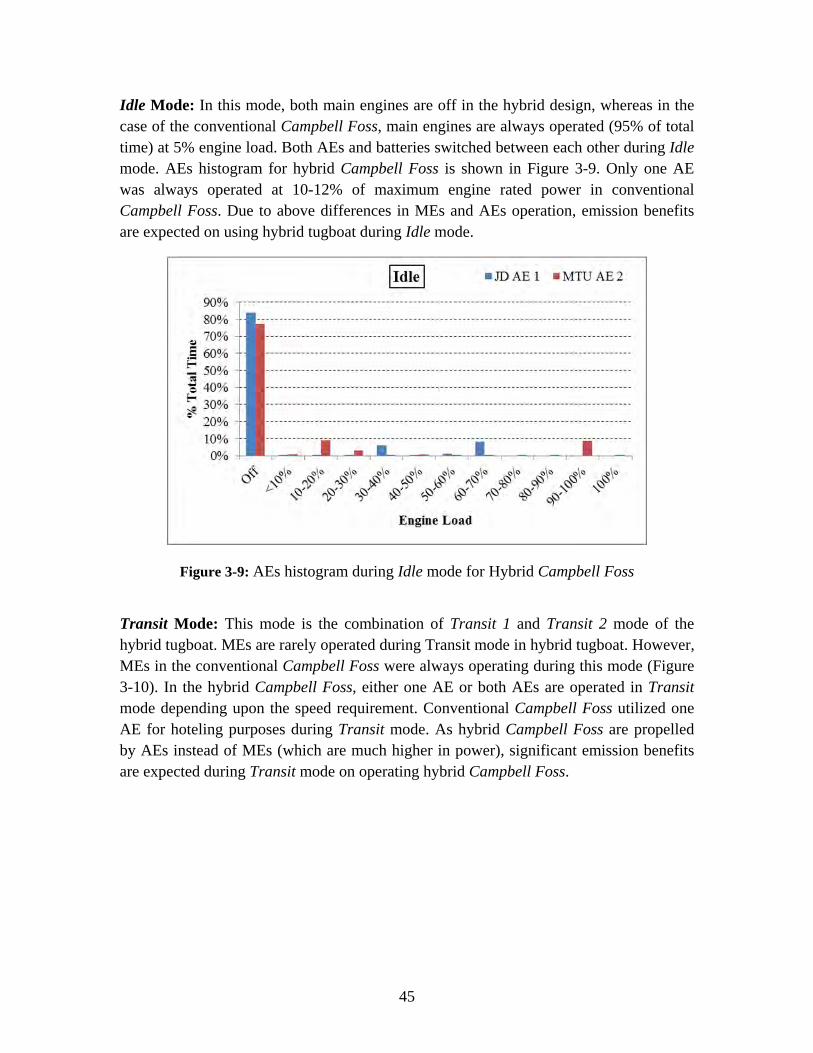
45
Idle Mode: In this mode, both main engines are off in the hybrid design, whereas in the case of the conventional Campbell Foss, main engines are always operated (95% of total time) at 5% engine load. Both AEs and batteries switched between each other during Idle mode. AEs histogram for hybrid Campbell Foss is shown in Figure 3-9. Only one AE was always operated at 10-12% of maximum engine rated power in conventional Campbell Foss. Due to above differences in MEs and AEs operation, emission benefits are expected on using hybrid tugboat during Idle mode.
Figure 3-9: AEs histogram during Idle mode for Hybrid Campbell Foss
Transit Mode: This mode is the combination of Transit 1 and Transit 2 mode of the hybrid tugboat. MEs are rarely operated during Transit mode in hybrid tugboat. However, MEs in the conventional Campbell Foss were always operating during this mode (Figure 3-10). In the hybrid Campbell Foss, either one AE or both AEs are operated in Transit mode depending upon the speed requirement. Conventional Campbell Foss utilized one AE for hoteling purposes during Transit mode. As hybrid Campbell Foss are propelled by AEs instead of MEs (which are much higher in power), significant emission benefits are expected during Transit mode on operating hybrid Campbell Foss.

46
Figure 3-10: AEs histogram during Transit mode for Hybrid
Assist Mode: Both MEs are in operation for conventional and hybrid Campbell Foss during Assist mode. MEs histogram during Assist mode is shown in Figure 3-11. AEs in the hybrid Campbell Foss are rarely operated whereas one AE was always in operation for conventional Campbell Foss during Assist mode.
Figure 3-11: MEs histogram during Assist mode for Hybrid Campbell Foss
3.4 Total In-use Emissions The total in-use emission form each tug configuration was calculated using the equations stated in Section 2.2. Emissions from each tug at a particular operating mode were
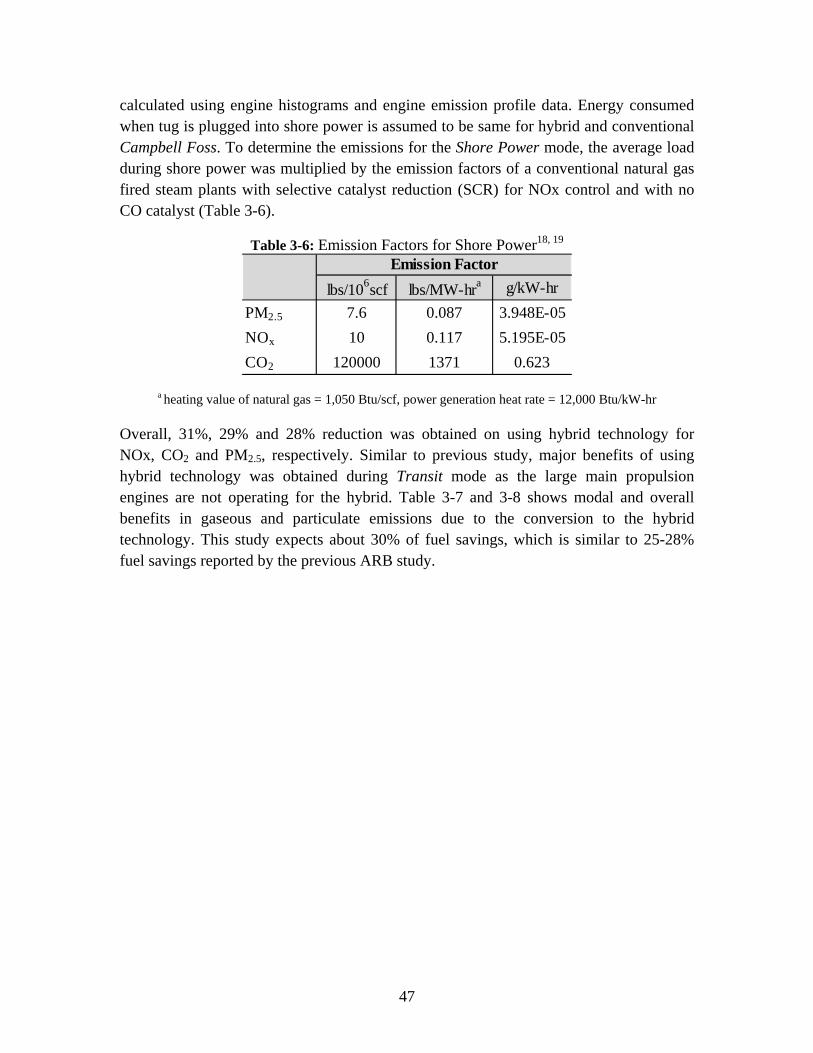
47
calculated using engine histograms and engine emission profile data. Energy consumed when tug is plugged into shore power is assumed to be same for hybrid and conventional Campbell Foss. To determine the emissions for the Shore Power mode, the average load during shore power was multiplied by the emission factors of a conventional natural gas fired steam plants with selective catalyst reduction (SCR) for NOx control and with no CO catalyst (Table 3-6).
Table 3-6: Emission Factors for Shore Power18, 19
a heating value of natural gas = 1,050 Btu/scf, power generation heat rate = 12,000 Btu/kW-hr
Overall, 31%, 29% and 28% reduction was obtained on using hybrid technology for NOx, CO2 and PM2.5, respectively. Similar to previous study, major benefits of using hybrid technology was obtained during Transit mode as the large main propulsion engines are not operating for the hybrid. Table 3-7 and 3-8 shows modal and overall benefits in gaseous and particulate emissions due to the conversion to the hybrid technology. This study expects about 30% of fuel savings, which is similar to 25-28% fuel savings reported by the previous ARB study.
lbs/106scf lbs/MW-hra g/kW-hr
PM2.5 7.6 0.087 3.948E-05
NOx 10 0.117 5.195E-05
CO2 120000 1371 0.623
Emission Factor
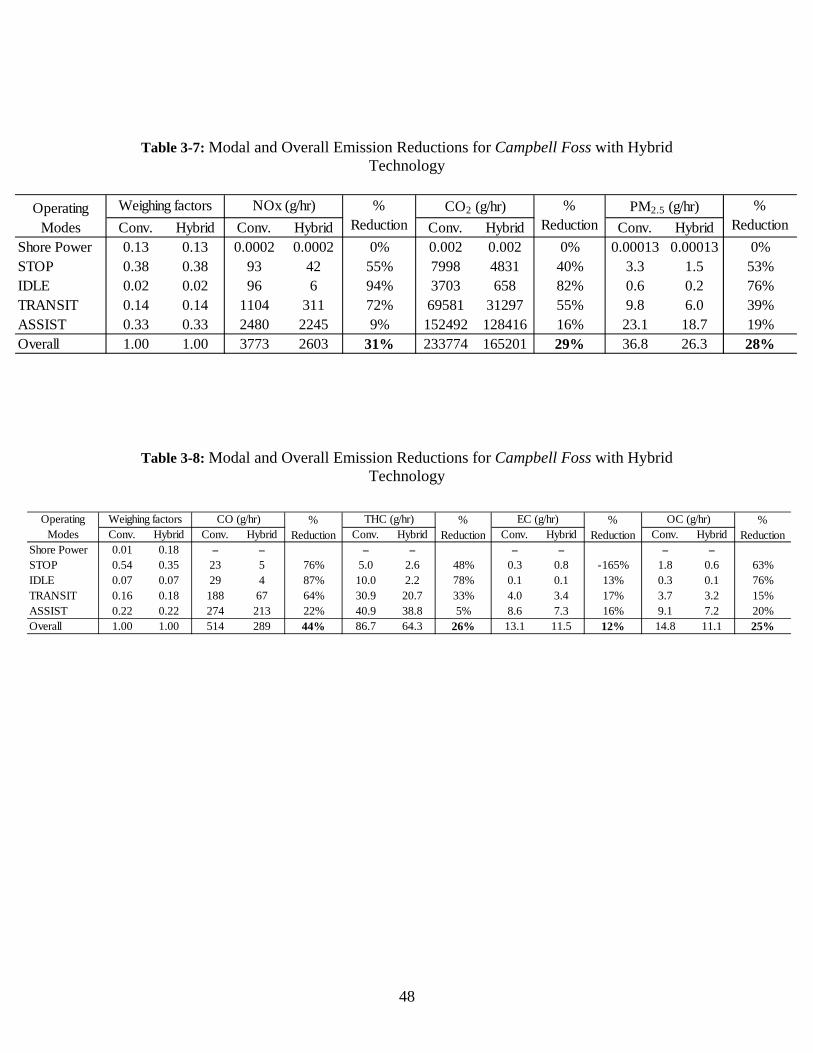
48
Table 3-7: Modal and Overall Emission Reductions for Campbell Foss with Hybrid Technology
Table 3-8: Modal and Overall Emission Reductions for Campbell Foss with Hybrid Technology
Conv. Hybrid Conv. Hybrid Conv. Hybrid Conv. HybridShore Power 0.13 0.13 0.0002 0.0002 0% 0.002 0.002 0% 0.00013 0.00013 0%STOP 0.38 0.38 93 42 55% 7998 4831 40% 3.3 1.5 53%IDLE 0.02 0.02 96 6 94% 3703 658 82% 0.6 0.2 76%TRANSIT 0.14 0.14 1104 311 72% 69581 31297 55% 9.8 6.0 39%ASSIST 0.33 0.33 2480 2245 9% 152492 128416 16% 23.1 18.7 19%Overall 1.00 1.00 3773 2603 31% 233774 165201 29% 36.8 26.3 28%
% Reduction
PM2.5 (g/hr) % Reduction
Operating Modes
Weighing factors NOx (g/hr) % Reduction
CO2 (g/hr)
Conv. Hybrid Conv. Hybrid Conv. Hybrid Conv. Hybrid Conv. HybridShore Power 0.01 0.18 – – – – – – – –STOP 0.54 0.35 23 5 76% 5.0 2.6 48% 0.3 0.8 -165% 1.8 0.6 63%IDLE 0.07 0.07 29 4 87% 10.0 2.2 78% 0.1 0.1 13% 0.3 0.1 76%TRANSIT 0.16 0.18 188 67 64% 30.9 20.7 33% 4.0 3.4 17% 3.7 3.2 15%ASSIST 0.22 0.22 274 213 22% 40.9 38.8 5% 8.6 7.3 16% 9.1 7.2 20%Overall 1.00 1.00 514 289 44% 86.7 64.3 26% 13.1 11.5 12% 14.8 11.1 25%
OC (g/hr) % Reduction
EC (g/hr) % Reduction
% Reduction
CO (g/hr) THC (g/hr)Operating Modes
Weighing factors % Reduction

49
3.5 Comparison of Results with Earlier Study Comparing the overall results of this study with the earlier study shows some similarities and some significant differences. These differences can be explained and are brought about by:
1) The changes in the activity revealed from data logging. For example now with the bridge diversion, the time in the Assist mode was increased from 22 %to 33%.
2) The change in emissions due to engines from different manufacturers. In the repower study, the same main propulsion engine was used so there are no differences in emissions from the main engine. However, the first study, Evaluating Emission Benefits of a Hybrid Tugboat (2010) was of a conventional tugboat with a Caterpillar 3512 engine and a hybrid with a Cummins QSK50-M engine. While both engines complied with the overall weighted emission factors for US EPA Tier 2, the individual modal emissions differed significantly.
3) Table 3-9 shows the emissions differences in grams per hour at different loads. About 30% of the difference is due to the size of the engine as the CAT was rated at 1902kW and the Cummins was rated at 1342kW. Still as the tugboats showed similar histograms, it is clear that the Cummins on the hybrid was a much cleaner engine at the lower operating modes when the tug mainly operates; thus resulting in the 72% PM benefit in that study and 28% in this study. For this project, the conventional and retrofitted hybrid tugboat had the same main engine so benefits from engine manufacturer cannot be realized.
Table 3-9: Difference in NOx and PM2.5 Emission Rates across Load Points
Considering specific cases, the NOx emission reduction of the earlier study was 51% and for this study was 31%. This difference can be partially explained by the change in modal activity in the histograms and overall weighting factor for the two cases. Table 3-10 uses the activity factors from the earlier study and the NOx reduction of this study would be boosted from the 31% reported in Section 3.4 to 42%, a value closer to the earlier study.
CAT 3512C Cummins QSK50-M CAT 3512C Cummins QSK50-M
7% 2439 1035 6.3 9.525% 4867 2674 94 9.850% 7781 5374 195 5075% 9450 7921 97 58
100% 14124 10215 173 54
PM2.5 (g/hr)NOx (g/hr)Engine Load

50
The remainder of the difference is due to benefits of the cleaner Cummins engine at low loads as described above.
Similarly for the PM some of the differences are due to the higher time in the Assist mode. As Table 3-10 indicates, the PM benefits would increase from 28% to 34%. However, it is the near ten-fold differences for PM grams per hour at low loads that the Cummins engine provided in the earlier comparison and boosted the benefit to near 70%. Even operating the Cummins AE provided PM benefits over the JD AE.

51
Table 3-10: Modal and Overall Emission Reductions based on Operating Weighting
Factors are obtained from ARB study
Conv. Hybrid Conv. Hybrid Conv. Hybrid Conv. HybridSHORE POWER 0.01 0.18 0.0002 0.0002 0% 0.002 0.002 0% 0.00013 0.00013 0%STOP 0.54 0.35 133 38 71% 11.4 4.4 61% 4.6 1.4 70%IDLE 0.07 0.07 338 25 93% 13.0 2.8 78% 2.2 0.7 70%TRANSIT 0.16 0.18 1261 391 69% 79.5 39.3 51% 11.2 7.5 33%ASSIST 0.22 0.22 1653 1494 10% 101.7 85.4 16% 15.4 12.4 20%Overall 1.00 1.00 3385 1948 42% 206 132 36% 33.4 21.9 34%
PM2.5 (g/hr)% Reduction
% Reduction
% Reduction
NOx (g/hr) CO2 (kg/hr)Operating Modes
Weighing factors

52
4 Summary The primary goal of this project was to determine the emission benefits of a hybrid retrofit system on an existing tugboat. For this purpose, a conventional tugboat of “Dolphin” class was chosen and repowered with a new auxiliary engine and the hybrid components.
Emissions measurements were made from the main and auxiliary engines of the conventional Campbell Foss tug prior to retrofit. These engines were tested according to ISO 8178 E3/D2 test cycle to ensure that their emissions are within certification limits and US EPA Tier 1 standards. Additional measurements were made at low loads where the tugboat has been reported to spend most of the time during its operation and data are not available. This phase of the study concluded that the engines tested are well maintained and representative of engines in their emission class. Overall weighted emission factors for NOx, CO, and PM2.5 are within standards values. Emissions of CO2 from both engines are typical of diesel engine of their category and are in agreement with manufacturer expectations.
The second phase of this project was to develop the activity of the hybrid Campbell Foss and emissions testing of the new repowered AE engine according to ISO 8178 D2 and in-use test cycle based on activity data. A data-logging system, capable of simultaneously monitoring and reporting the status of the power sources was installed for a period of over one month. Four gigabytes of data were analyzed to determine the weighting factors, i.e., the fraction of time spent by the tug in the six discrete operating modes shore power, stop, idle, transit 1, transit 2 and assist. Further engine histograms for all four engines on the tug at these operating modes were established.
The final analysis combined engine histogram and emission profile data to determine in-use emissions at each tug operating mode for both conventional and the hybrid Campbell Foss. These figures were coupled with the weighting factors for the operating modes to get the overall in-use emissions in g/hr for each tug. Significant emission benefits were observed for the hybrid technology.
The major findings of this project include:
The average weighting factors for the operating modes of the hybrid tugboat were 0.53 for Stop, 0.02 for Idle, 0.14 for Transit and 0.33 for Assist. As previously shown, these values differ significantly from the values ISO 8178 E-3 Cycle.
A significant difference in the Assist weighting factor was found in comparison to previous study. This was mainly due to the fact that the Campbell Foss is
53
spending more time in moving barges because of the new travel restrictions at the Port of Long Beach.
Overall in-use emission reductions with the hybrid technology were found to be 28% for PM2.5, 31% for NOx and 29% for CO2.
Based on duty cycle obtained from the ARB study, Evaluating Emission Benefits of a Hybrid Tugboat (2010) overall in-use emission benefits with the hybrid technology on the Campbell Foss would increase to 34% for PM2.5, 42% for NOx and 36% for CO2.
Emissions factors for the CAT 3512C MEs were within the Tier 1 standards. Similarly, for both AEs; JD 6081 and MTU/Detroit Series 60, emissions were within the Tier 1 and 2 standards, respectively.
The diesel electric drive train on the hybrid tug that allows the use of auxiliary power for propulsion was the primary cause for the overall in-use emission reductions as opposed to the energy storage device (batteries).
Like before, the transit operating mode was the most significant contributor to the overall emission reductions. In this mode the hybrid tug was powered by one or two auxiliary engines and batteries while the conventional tug used one auxiliary and two main engines.

54
5 References 1. Corbett, J. J.; Winebrake, J. J.; Green, E. H.; Kasibhatla, P.; Eyring, V.; Lauer, A.,
Mortality from ship emissions: A global assessment. Environmental Science & Technology 2007, 41, (24), 8512-8518.
2. Deniz, C.; Durmusoglu, Y., Estimating shipping emissions in the region of the Sea of Marmara, Turkey. Science of the Total Environment 2008, 390, (1), 255-261.
3. Lucialli, P.; Ugolini, P.; Pollini, E., Harbour of Ravenna: The contribution of harbour traffic to air quality. Atmospheric Environment 2007, 41, (30), 6421-6431.
4. Saxe, H.; Larsen, T., Air pollution from ships in three Danish ports. Atmospheric Environment 2004, 38, (24), 4057-4067.
5. Schrooten, L.; De Vlleger, I.; Panis, L. I.; Styns, K.; Torfs, R., Inventory and forecasting of maritime emissions in the Belgian sea territory, an activity-based emission model. Atmospheric Environment 2008, 42, (4), 667-676.
6. Vutukuru, S.; Dabdub, D., Modeling the effects of ship emissions on coastal air quality: A case study of southern California. Atmospheric Environment 2008, 42, (16), 3751-3764.
7. Starcrest Consulting LLC, Port of Long Beach Air Emissions Inventory - 2005. 2007, Prepared for the Port of Long Beach.
8. Starcrest Consulting LLC, Port of Los Angeles Inventory of Air Emissions. 2009, Prepared for the Port of Los Angeles.
9. Corbett, J. J.; Fischbeck, P. S., Emissions from Waterborne Commerce Vessels in United States Continental and Inland Waterways. Environmental Science & Technology 2000, 34, (15), 3254-3260.
10. Corbett, J. J.; Robinson, A. L., Measurements of NOx Emissions and In-Service Duty Cycle from a Towboat Operating on the Inland River System. Environmental Science & Technology 2001, 35, (7), 1343-1349.
11. U.S. Environmental Protection Agency, Final Rule: Control of Emissions of Air Pollution from Locomotives and Marine Compression-Ignition Engines Less Than 30 Liters per Cylinder. 2008, 40 CFR, Parts 85-94.

55
12. Cooper, D. A., Exhaust emissions from high speed passenger ferries. Atmospheric Environment 2001, 35, (24), 4189-4200.
13. Cooper, D. A.; Peterson, K.; Simpson, D., Hydrocarbon, PAH and PCB emissions from ferries: A case study in the Skagerak-Kattegatt-Öresund region. Atmospheric Environment 1996, 30, (14), 2463-2473.
14. Jayaram, V., Khan, M.Y., Miller, J.W., Welch, W.A., Johnson, K., Cocker, D.R. Evaluating Emission Benefits of a Hybrid Tug Boat. California Air Resources Board 2010.
15. Society of Automotive Engineers, Recommended Practices for Measuring Exhaust Emissions and Fuel Economy of Hybrid Electric Vehicles. 1999, SAE J1711.
16. California Air Resources Board, California Exhaust Emission Standards and Test
Procedures for 2009 and Subsequent Model Zero-Emission Vehicles, and Hybrid Electric Vehicles, In the Passenger Car, Light-Duty Truck and Medium-Duty Vehicle Classes. 2009.
17. International Organization for Standardization, ISO 8178-1 Reciprocating internal
combustion engines - Exhaust emission measurement - Part 1: Test-bed measurement of gaseous and particulate exhaust emissions. 1996, First Edition 1996-08-15.
18. Environ International Corporation, Cold Ironing Cost Effectiveness Study. 2004,
Prepared for Port of Long Beach. 19. U.S. Environmental Protection Agency, AP-42 Compilation of Air Pollutant
Emission Factors. 2004, Fifth Edition Vol I.

56
6 Appendix A - Measuring Gaseous & Particulate Emissions
6.1 Scope ISO 8178-12 and ISO 8178-23 specify the measurement and evaluation methods for gaseous and particulate exhaust emissions when combined with combinations of engine load and speed provided in IS0 8178- Part 4: Test cycles for different engine applications. The emission results represent the mass rate of emissions per unit of work accomplished. Specific emission factors are based on brake power measured at the crankshaft, the engine being equipped only with the standard auxiliaries necessary for its operation. Per ISO, auxiliary losses are <5 % of the maximum observed power.
IMO ship pollution rules and measurement methods are contained in the “International Convention on the Prevention of Pollution from Ships”, known as MARPOL 73/784, and sets limits on NOx and SOx emissions from ship exhausts. The intent of this protocol was to conform as closely as practical to both the ISO and IMO standards.
6.2 Sampling System for Measuring Gaseous and Particulate Emissions
A properly designed sampling system is essential to accurate collection of a representative sample from the exhaust and subsequent analysis. ISO points out that particulate must be collected in either a full flow or partial flow dilution system and UCR chose the partial flow dilution system with single venturi as shown Figure 6-1.
A partial flow dilution system was selected based on cost and the impossibility of a full flow dilution for “medium and large” engine testing on the test bed and at site. The flow in the dilution system eliminates water condensation in the dilution and sampling systems and maintains the temperature of the diluted exhaust gas at <52°C before the filters. ISO cautions the advantages of partial flow dilution systems can be lost to potential problems such as: losing particulates in the transfer tube, failing to take a representative sample from the engine exhaust and inaccurately determining the dilution ratio.
An overview of UCR’s partial dilution system shows that raw exhaust gas is transferred from the exhaust pipe (EP) through a sampling probe (SP) and the transfer tube (TT) to a dilution tunnel (DT) due to the negative pressure created by the venturi (VN) in DT. The
2 International Standards Organization, IS0 8178-1, Reciprocating internal combustion engines - Exhaust emission measurement -Part 1: Test-bed measurement of gaseous particulate exhaust emissions, First edition 1996-08-l5 3 International Standards Organization, IS0 8178‐2, Reciprocating internal combustion engines ‐ Exhaust
emission measurement ‐Part 2: Measurement of gaseous and particulate exhaust emissions at site, First
edition 1996‐08‐l5
4 International Maritime Organization, Annex VI of MARPOL 73/78 “Regulations for the Prevention of Air Pollution from Ships and NOx Technical Code”.

57
gas flow rate through TT depends on the momentum exchange at the venturi zone and is therefore affected by the absolute temperature of the gas at the exit of TT. Consequently, the exhaust split for a given tunnel flow rate is not constant, and the dilution ratio at low load is slightly lower than at high load. More detail on the key components is provided in Table 6‐2.
Table 6-1: Partial Flow Dilution System with Single Venturi, Concentration Measurement and Fractional Sampling
6.3 Dilution Air System A partial flow dilution system requires dilution air and UCR uses compressed air in the field as it is readily available. ISO recommends the dilution air be at 25 ±5°C, filtered and charcoal scrubbed to eliminate background hydrocarbons. The dilution air may be dehumidified. To ensure the compressed air is of a high quality UCR processes any supplied air through a field processing unit that reduces the pressure to about 30psig as that level allows a dilution ratio of about 5/1 in the geometry of our system. The next stages, in sequence, include: a liquid knock-out vessel, desiccant to remove moisture with silica gel containing an indicator, hydrocarbon removal with activated charcoal and a HEPA filter for the fine aerosols that might be present in the supply air. The silica gel and activated carbon are changed for each field campaign. Figure 6-1 shows the field processing unit in its transport case. In the field the case is used as a framework for supporting the unit

58
Figure 6-1 Field Processing Unit for Purifying Dilution Air in Carrying Case

59
Table 6-2 Components of a Sampling System: ISO/IMO Criteria & UCR Design
Section Selected ISO and IMO Criteria UCR Design
Exhaust Pipe (EP)
In the sampling section, the gas velocity is > 10 m/s, except at idle, and bends are minimized to reduce inertial deposition of PM. Sample position is 6 pipe diameters of straight pipe upstream and 3 pipe diameters downstream of the probe.
UCR follows the ISO recommendation, as closely as practical.
Sampling Probe (SP)
The minimum inside diameter is 4 mm and the probe is an open tube facing upstream on the exhaust pipe centerline. No IMO code.
UCR uses a stainless steel tube with diameter of 8mm placed near the center line.
Transfer Tube (TT)
As short as possible and < 5 m in length; Equal to/greater than probe diameter & < 25
mm diameter; TTs insulated. For TTs > 1m, heat wall
temperature to a minimum of 250°C or set for < 5% thermophoretic losses of PM.
UCR no longer uses a transfer tube.
Dilution Tunnel (DT)
shall be of a sufficient length to cause complete mixing of the exhaust and dilution air under turbulent flow conditions;
shall be at least 75 mm inside diameter (ID) for the fractional sampling type, constructed of stainless steel with a thickness of > 1.5 mm.
UCR uses fractional sampling; stainless steel tunnel has an ID of 50mm and thickness of 1.5mm.
Venturi (VN)
The pressure drop across the venturi in the DT creates suction at the exit of the transfer tube TT and gas flow rate through TT is basically proportional to the flow rate of the dilution air and pressure drop.
Venturi proprietary design provided by MAN B&W; provides turbulent mixing.
Exhaust Gas
Analyzers (EGA)
One or several analyzers may be used to determine the concentrations. Calibration and accuracy for the analyzers are like those for measuring the gaseous emissions.
UCR uses a 5-gas analyzer meeting IMO/ISO specs

60
6.4 Calculating the Dilution Ratio According to ISO 8178, “it is essential that the dilution ratio be determined very accurately” for a partial flow dilution system such as what UCR uses. The dilution ratio is simply calculated from measured gas concentrations of CO2 and/or NOx in the raw exhaust gas, the diluted exhaust gas and the dilution air. UCR has found it useful to independently determine the dilution ration from both CO2 and NOx and compare the values to ensure that they are within ±10%. UCR’s experience indicates the independently determined dilution ratios are usually within 5%. At systematic deviations within this range, the measured dilution ratio can be corrected, using the calculated dilution ratio. According to ISO, dilution air is set to obtain a maximum filter face temperature of <52°C and the dilution ratio shall be > 4.
6.5 Dilution System Integrity Check ISO describes the necessity of measuring all flows accurately with traceable methods and provides a path and metric to quantifying the leakage in the analyzer circuits. UCR has adopted the leakage test and its metrics as a check for the dilution system. According to ISO the maximum allowable leakage rate on the vacuum side shall be 0.5 % of the in-use flow rate for the portion of the system being checked. Such a low leakage rate allows confidence in the integrity of the partial flow system and its dilution tunnel. Experience has taught UCR that the flow rate selected should be the lowest rate in the system under test.
6.6 Measuring the Gaseous Emissions: CO, CO2, HC, NOx, O2, SO2 Measurement of the concentration of the main gaseous constituents is one of the key activities in measuring emission factors. This section covers the ISO/IMO protocols and that used by UCR. For SO2, ISO recommends and UCR concurs that the concentration of SO2 is calculated based on the fact that 95+% of the fuel sulfur is converted to SO2.
6.7 Measuring Gaseous Emissions: ISO & IMO Criteria ISO specifies that either one or two sampling probes located in close proximity in the raw gas can be used and the sample split for different analyzers. However, in no case can condensation of exhaust components, including water and sulfuric acid, occur at any point of the analytical system. ISO specifies the analytical instruments for determining the gaseous concentration in either raw or diluted exhaust gases.
Heated flame ionization detector (HFID) for the measurement of hydrocarbons; Non-dispersive infrared analyzer (NDIR) for the measurement of carbon
monoxide and carbon dioxide; Heated chemiluminescent detector (HCLD) or equivalent for measurement of
nitrogen oxides; Paramagnetic detector (PMD) or equivalent for measurement of oxygen.

61
ISO states the range of the analyzers shall accurately cover the anticipated concentration of the gases and recorded values between 15% and 100% of full scale. A calibration curve with five points is specified. However, with modern electronic recording devices, like a computer, ISO allows the range to be expanded with additional calibrations. ISO details instructions for establishing a calibration curve below 15%. In general, calibration curves must be < ±2 % of each calibration point and by < ±1 % of full scale zero.
ISO outlines their verification method. Each operating range is checked prior to analysis by using a zero gas and a span gas whose nominal value is more than 80 % of full scale of the measuring range. If, for the two points considered, the value found does not differ by more than ±4 % of full scale from the declared reference value, the adjustment parameters may be modified. If >4%, a new calibration curve is needed.
ISO & IMO specify the operation of the HCLD. The efficiency of the converter used for the conversion of NO2 into NO is tested prior to each calibration of the NOx analyzer. The efficiency of the converter shall be > 90 %, and >95 % is strongly recommended.
ISO requires measurement of the effects from exhaust gases on the measured values of CO, CO2, NOx, and 02. Interference can either be positive or negative. Positive interference occurs in NDIR and PMD instruments where the interfering gas gives rise to the same effect as the gas being measured, but to a lesser degree. Negative interference occurs in NDIR instruments due to the interfering gas broadening the absorption band of the measured gas, and in HCLD instruments due to the interfering gas quenching the radiation. Interference checks are recommended prior to an analyzer’s initial use and after major service intervals.
6.8 Measuring Gaseous Emissions: UCR Design The concentrations of CO, CO2, NOx and O2 in the raw exhaust and in the dilution tunnel are measured with a Horiba PG-250 portable multi-gas analyzer. The PG-250 simultaneously measures five separate gas components with methods recommended by the ISO/IMO and USEPA. The signal output of the instrument is connected to a laptop computer through an RS-232C interface to continuously record measured values. Major features include a built-in sample conditioning system with sample pump, filters, and a thermoelectric cooler. The performance of the PG-250 was tested and verified under the U.S. EPA ETV program.

62
Figure 6-2: Setup Showing Gas Analyzer with Computer for Continuous Data Logging
Details of the gases and the ranges for the Horiba instrument are shown in Table 6-3. Note that the Horiba instrument measured sulfur oxides (SO2); however, the UCR follows the protocol in ISO and calculates the SO2 level from the sulfur content of the fuel as the direct measurement for SO2 is less precise than calculation.
Table 6-3 Detector Method and Concentration Ranges for Monitor
Component Detector Ranges
Nitrogen Oxides
(NOx)
Heated Chemiluminescence
Detector (HCLD)
0-25, 50, 100, 250, 500, 1000,
& 2500 ppmv
Carbon Monoxide
(CO)
Non dispersive Infrared
Absorption (NDIR)
0-200, 500, 1000, 2000, &
5000 ppmv
Carbon Dioxide
(CO2)
Non dispersive Infrared
Absorption (NDIR) 0-5, 10, & 20 vol%
Sulfur Dioxide
(SO2)
Non dispersive Infrared
Absorption (NDIR)
0-200, 500, 1000, & 3000
ppmv
Oxygen Zirconium oxide sensor 0-5, 10, & 25 vol%

63
For quality control, UCR carries out analyzer checks with calibration gases both before and after each test to check for drift. Because the instrument measures the concentration of five gases, the calibration gases are a blend of several gases (super-blend) made to within 1% specifications. Experience has shown that the drift is within manufacturer specifications of ±1% full scale per day shown in Table 6-4. The PG-250 meets the analyzer specifications in ISO 8178-1 Section 7.4 for repeatability, accuracy, noise, span drift, zero drift and gas drying.
Table 6-4 Quality Specifications for the Horiba PG-250
Repeatability ±0.5% F.S. (NOx: </= 100ppm range CO: </= 1,000ppm range)
±1.0% F. S.
Linearity ±2.0% F.S.
Drift ±1.0% F. S./day (SO2: ±2.0% F.S./day)
6.9 Measuring the Particulate Matter (PM) Emissions ISO 8178-1 defines particulates as any material collected on a specified filter medium after diluting exhaust gases with clean, filtered air at a temperature of </= 52ºC, as measured at a point immediately upstream of the primary filter. The particulate consists of primarily carbon, condensed hydrocarbons and sulfates, and associated water. Measuring particulates requires a dilution system and UCR selected a partial flow dilution system. The dilution system design completely eliminates water condensation in the dilution/sampling systems and maintains the temperature of the diluted exhaust gas at < 52°C immediately upstream of the filter holders. IMO does not offer a protocol for measuring PM. A comparison of the ISO and UCR practices for sampling PM is shown in Table 6-5.
Table 6-5 Measuring Particulate by ISO and UCR Methods ISO UCR
Dilution tunnel Either full or partial flow
Partial flow
Tunnel & sampling Electrically conductive Same

64
system
Pretreatment None Cyclone, removes >2.5µm
Filter material Fluorocarbon based Teflon (TFE)
Filter size, mm 47 (37mm stain diameter)
Same
Number of filters in series Two One
Number of filters in parallel
Only single filter Two; 1 TFE & 1 Quartz
Number of filters per mode
Single or multiple Multiple
Filter face temp. °C < 52 Same
Filter face velocity, cm/sec
35 to 80. ~33
Pressure drop, kPa For test <25 Same
Filter loading, µg >500 500-1,000 + water w/sulfate
Weighing chamber 22±3°C & RH= 45%± 8 Same
Analytical balance, LDL µg
10 0.5
Flow measurement Traceable method Same
Flow calibration, months < 3months Every campaign
Sulfur content: According to ISO, particulates measured using IS0 8178 are “conclusively proven” to be effective for fuel sulfur levels up to 0.8%. UCR is often faced with measuring PM for fuels with sulfur content exceeding 0.8% and has extended this method to those fuels as no other method is prescribed for fuels with a higher sulfur content.

65
6.10 Added Comments about UCR’s Measurement of PM In the field UCR uses a raw particulate sampling probe fitted close to and upstream of the raw gaseous sample probe and directs the PM sample to the dilution tunnel. There are two gases stream leaving the dilution tunnel; the major flow vented outside the tunnel and the minor flow directed to a cyclone separator, sized to remove particles >2.5um. The line leaving the cyclone separator is split into two lines; each line has a 47 Gelman filter holder. One holder collects PM on a Teflon filter and the other collects PM on a quartz filter. UCR simultaneously collects PM on Teflon and quartz filters at each operating mode and analyzes them according to standard procedures.
Briefly, total PM was collected on Pall Gelman (Ann Arbor, MI) 47 mm Teflo filters and weighed using a Cahn (Madison, WI) C-35 microbalance. Before and after collection, the filters were conditioned for 24 hours in an environmentally controlled room (RH = 40%, T= 25 C) and weighed daily until two consecutive weight measurements were within 3 µg or 2%. It is important to note that the simultaneous collection of PM on quartz and Teflon filters provides a comparative check of PM mass measured by two independent methods and serves as an important Quality Check for measuring PM mass.
6.11 Measuring Real-Time Particulate Matter (PM) Emissions-DustTrak
In addition to the filter-based PM mass measurements, UCR takes continuous readings with a Nephelometer (TSI DustTrak 8520) so as to capture both the steady-state and transient data. The DustTrak is a portable, battery-operated laser photometer that gives real-time digital readout with the added benefits of a built-in data logger. The DustTrak/nephelometers is fairly simple to use and has excellent sensitivity to untreated diesel exhaust. It measures light scattered by aerosol introduced into a sample chamber and displays the measured mass density as units of mg/m3. As scattering per unit mass is a strong function of particle size and refractive index of the particle size distributions and as refractive indices in diesel exhaust strongly depend on the particular engine and operating condition, some scientists question the accuracy of PM mass measurements. However, UCR always references the DustTrak results to filter based measurements and this approach has shown that mass scattering efficiencies for both on-road diesel exhaust and ambient fine particles have values around 3m2/g. For these projects, a TSI DustTrak 8520 nephelometer measuring 90 degree light scattering at 780nm (near-infrared) is used.
Figure 6-3 Picture of TSI DustTrak

66
6.12 Quality Control/Quality Assurance (QC/QA) Each of the laboratory methods for PM mass and chemical analysis has a standard operating procedure including the frequency of running the standards and the repeatability that is expected with a standard run. Additionally the data for the standards are plotted to ensure that the values fall within the upper and lower control limits for the method and that there is no obvious trends or bias in the results for the reference materials. As an additional quality check, results from independent methods are compared and values from this work are compared with previously published values, like the manufacturer data base.
For the ISO cycles, run the engine at rated speed and the highest power possible to warm the engine and stabilize emissions for about 30 minutes.
Determine a plot or map of the peak power at each engine RPM, starting with rated speed. If UCR suspects the 100% load point at rated speed is unattainable, then we select the highest possible load on the engine as Mode 1.
Emissions are measured while the engine operates according to the requirements of ISO-8178-E3 or ISO-8178-D2 cycles. For a diesel engine the highest power mode is run first and then each mode was run in sequence The minimum time for samples is 5 minutes and if necessary, the time was extended to collect sufficient particulate sample mass or to achieve stabilization with large engines.
The gaseous exhaust emission concentration values are measured and recorded for the last 3 min of the mode.
Engine speed, displacement, boost pressure, and intake manifold temperature are measured in order to calculate the gaseous flow rate.
Emissions factors are calculated in terms of grams per kilowatt hour for each of the operating modes and fuels tested, allowing for emissions comparisons of each blend relative to the baseline fuel.

67
7 Appendix B - Test Cycles and Fuels for Different Engine Applications
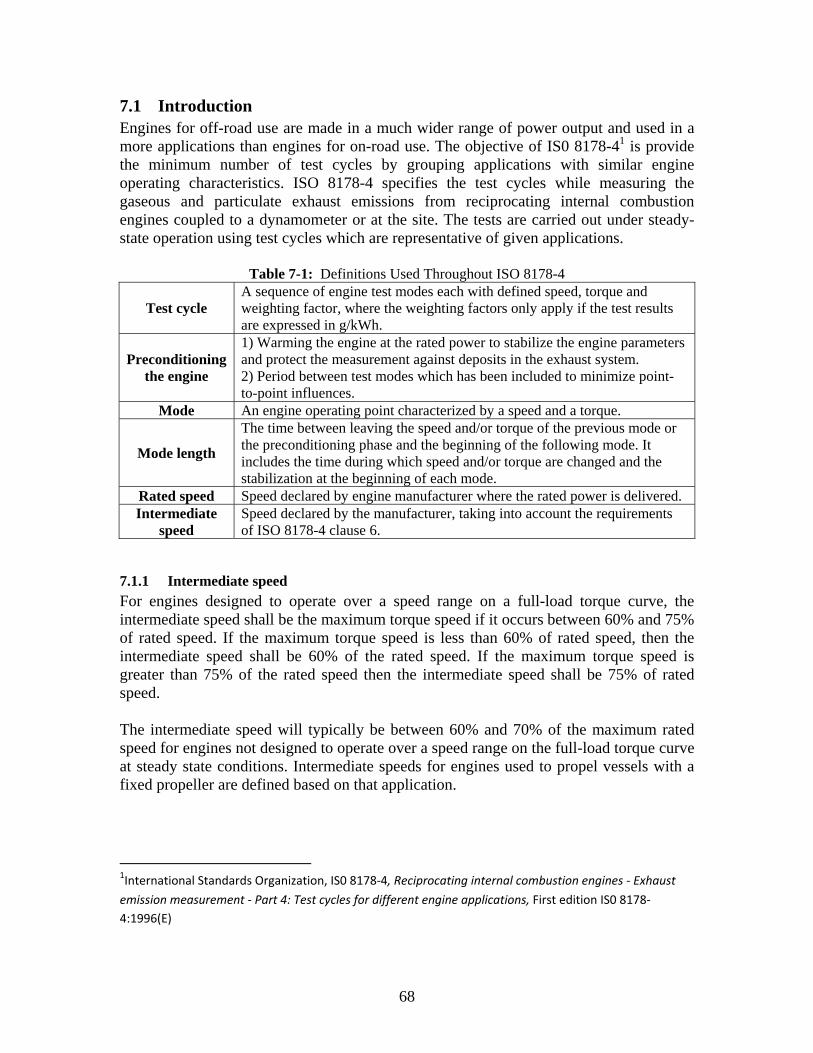
68
7.1 Introduction Engines for off-road use are made in a much wider range of power output and used in a more applications than engines for on-road use. The objective of IS0 8178-41 is provide the minimum number of test cycles by grouping applications with similar engine operating characteristics. ISO 8178-4 specifies the test cycles while measuring the gaseous and particulate exhaust emissions from reciprocating internal combustion engines coupled to a dynamometer or at the site. The tests are carried out under steady-state operation using test cycles which are representative of given applications.
Table 7-1: Definitions Used Throughout ISO 8178-4
Test cycle A sequence of engine test modes each with defined speed, torque and weighting factor, where the weighting factors only apply if the test results are expressed in g/kWh.
Preconditioning the engine
1) Warming the engine at the rated power to stabilize the engine parameters and protect the measurement against deposits in the exhaust system. 2) Period between test modes which has been included to minimize point-to-point influences.
Mode An engine operating point characterized by a speed and a torque.
Mode length
The time between leaving the speed and/or torque of the previous mode or the preconditioning phase and the beginning of the following mode. It includes the time during which speed and/or torque are changed and the stabilization at the beginning of each mode.
Rated speed Speed declared by engine manufacturer where the rated power is delivered. Intermediate
speed Speed declared by the manufacturer, taking into account the requirements of ISO 8178-4 clause 6.
7.1.1 Intermediate speed
For engines designed to operate over a speed range on a full-load torque curve, the intermediate speed shall be the maximum torque speed if it occurs between 60% and 75% of rated speed. If the maximum torque speed is less than 60% of rated speed, then the intermediate speed shall be 60% of the rated speed. If the maximum torque speed is greater than 75% of the rated speed then the intermediate speed shall be 75% of rated speed. The intermediate speed will typically be between 60% and 70% of the maximum rated speed for engines not designed to operate over a speed range on the full-load torque curve at steady state conditions. Intermediate speeds for engines used to propel vessels with a fixed propeller are defined based on that application.
1International Standards Organization, IS0 8178‐4, Reciprocating internal combustion engines ‐ Exhaust
emission measurement ‐ Part 4: Test cycles for different engine applications, First edition IS0 8178‐
4:1996(E)

69
Figure 7-1: Torque as a Function of Engine Speed
7.2 Engine Torque Curves and Test Cycles The percentage of torque figures given in the test cycles and Figure B-1 represent the ratio of the required torque to the maximum possible torque at the test speed. For marine test cycle E3, the power figures are percentage values of the maximum rated power at the rated speed as this cycle is based on a theoretical propeller characteristic curve for vessels driven by heavy duty engines. For marine test cycle E4 the torque figures are percentage values of the torque at rated power based on the theoretical propeller characteristic curve representing typical pleasure craft spark ignited engine operation. For marine cycle E5 the power figures are percentage values of the maximum rated power at the rated speed based on a theoretical propeller curve for vessels of less than 24 m in length driven by diesel engines. Figure B-2 shows the two representative curves.
Figure 7-2: Examples of Power Scales

70
7.3 Modes and Weighting Factors for Test Cycles Most test cycles were derived from the 13-mode steady state test cycle (UN-ECE R49). Apart from the test modes of cycles E3, E4 and E5, which are calculated from propeller curves, the test modes of the other cycles can be combined into a universal cycle (B) with emissions values calculated using the appropriate weighting factors. Each test shall be performed in the given sequence with a minimum test mode length of 5 minutes or enough to collect sufficient particulate sample mass. The mode length shall be recorded and reported and the gaseous exhaust emission concentration values shall be measured and recorded for the last 3 min of the mode. The completion of particulate sampling ends with the completion of the gaseous emission measurement and shall not commence before engine stabilization, as defined by the manufacturer.
Table 7-2: Combined Table of Modes and Weighting Factors

71
8 Appendix C - Tug Boat Specifications

72

73

74

75
9 Appendix D- Heim Bridge Diversion

76

APPENDIX E
CAMPBELL FOSS FIRE
INCIDENT
INVESTIGATION
REPORT

Foss Maritime Incident Investigation Report CAMPBELL FOSS FIRE
Date of Incident: 8/20/2012
Date of Report: 10/1/2012
Title: Campbell Foss Engine Room Fire
Date of Incident: 8/20/2012 Responsible Managers: Ed McCain, Jerry Allen Investigation Team: Tim Stewart (Foss), Paul Jamer (AKA), John Eldridge (AKA), Capt. Ron Burchett (Corvus
Energy), Geoff Crocker, P. Eng (Corvus Energy), Chi‐Kiu Tsang (Corvus Energy), LCDR James Surber (USCG) Vessel involved: CAMPBELL FOSS Employees Involved: Capt. Joe Rock, Eng. Josh Selga, A/B Vince Pereira, A/B Nathan Ikerd
SUMMARY OF INCIDENT:
On August 20th, 2012, the Campbell Foss was conducting a ship assist of the Cosco Malaysia from LB Gate to LB Berth 245 with a crew of four: one captain, one engineer and two able bodied seamen (ABs). The Campbell was in the assist mode with both main diesel engines (MDEs) providing propulsion and motor generators (MGs) supporting the A/C Buss via the Hotel Active Front End (AFD). The Campbell was directed to run with the ship on the port quarter, and was later shifted to starboard quarter with a line, as the Cosco vessel was turning at the entrance to southeast basin. The approach to the berth was uneventful with the pilot working the tug in push/pull maneuvers, with orders up to working the tug both pulling and pushing up to half power. The Campbell was pushing one third on starboard quarter of ship as the Cosco vessel was alongside berth. At that time, the crew heard a loud bang along with a shudder through the hull, engine RPM appeared normal and heavy black smoke was immediately sighted coming from engine room vents on the aft side to pilothouse. Alarms were heard coming from panel. The engineer had just departed the wheelhouse prior to

Incident Investigation Report (continued)
the loud bang and observed black smoke coming from vents. The engineer then sounded the alarm. The captain notified the pilot on VHF of a fire and received response to do what was needed. The Tug Alta June was working the starboard bow of the Cosco vessel and communicated that they would make emergency notifications. Heavy black smoke continued to come out of the Campbell’s aft vents. The engineer was directed to pull emergency stops for ventilation to the battery compartment. The crew had mustered on the tug’s starboard side aft. The ABs broke out the fire hose from aft station to cool the deck. The captain started the fire pump from the pilothouse and secured e‐stops for both mains and generators. The captain returned to overlook the aft deck from pilothouse deck. The captain directed the engineer to crack the ASD compartment hatch and investigate. Smoke was observed from compartment and the hatch was re‐dogged. The Captain directed the engineer to pull the release cables to the fixed fire suppression systems to battery compartment and engine room. Smoke was around the main entrance to the vessel where releases were located. The FM‐200 Fixed Fire Fighting System was deployed and the smoke began to clear. The Alta June came along the Campbell’s starboard side and put up a line on the starboard aft bitt and held her off the counter of the Cosco ship until the Campbell could retrieve the headline. The fireboat Challenger and two rescue boats responded at around this time. The crew continued to cool the Campbell’s decks using the Alta June’s fire main and two sections of hose. Fire personnel from Challenger came aboard the Campbell. The Campbell’s captain directed them not to enter the engine room compartment or to un‐dog the engine room doors. The Alta June made up with two lines and the shifted the Campbell to LB Pier 35.
During the event, the Campbell’s alarm and monitoring system identified numerous faults and alarms associated with the battery system and other electrical systems as shown in the timeline (Attachment 1).
Upon arrival at LB 35, the vessel was met by Tim Stewart (Foss Maritime) and Eric Ryan (AKA). The fire department continued to prepare the engine space for entry by opening the Z‐Drive compartment hatch and fogging the space. Four (4) fire department personnel entered the space and continued fogging the Z‐Drive compartment. The Fire Department exited the space with the decision to enter the Engine Room from the main deck access. When it was determined that it was safe to enter the main engine room, fire department personnel obtained information on equipment lay‐out from Foss personnel and opened the door to the space. They water fogged as they advanced and though the space was warm (approximately 140 deg F) there was no evidence of flames. The fire was confirmed extinguished.
Upon entry, it was found that there was significant residual heat in the space; and it became apparent that the damage was largely localized to the battery compartment and surrounding area. The battery compartment was still intact, but there was evidence of high heat in the aft port engine room space. The PVC ventilation piping from the battery compartment was melted and appeared to be the exit path of the hot gases from the battery compartment.
Once the temperature had dropped in the space and sufficient ventilation had been provided, the air was tested and confirmed as safe to enter without breathing apparatus. At this point, Tim Stewart and Eric Ryan accompanied the firemen into the space and proceeded directly to the battery compartment area. It was noticed that the left hand battery compartment door, though intact, was slightly ajar. It was also noted that the battery compartment structure had not been breached or damaged. The temperature of the door was tested and deemed safe to touch.
The doors to the battery compartment were removed, and a preliminary inspection was conducted. There was a layer of soot over all surfaces inside the compartment, and there was an obvious breach of Battery Module #9 which was located at the bottom center of the pack. All other modules appeared to be intact and the cabling associated with the battery modules, although charred, was substantially intact.
Campbell Foss Investigation Rev 1 Page 2 of 20 Foss Form 102, rev 1.2

Incident Investigation Report (continued)
At this point, the heat in the battery compartment was intense enough to require withdrawal of Foss and AKA personnel until further ventilation and cooling permitted safe entry.
Once the Engine Room was safe for entry an initial survey was conducted. The initial survey revealed the following damage concentrated in the Port Aft Engine Room:
Battery Compartment
Battery Modules.
Battery Cables, (charred but substantially intact)
Battery Pack Controller and Communication Cabling.
Melted Lighting Fixtures.
Battery Compartment Ventilation System.
Key pads and fan louvers on the exterior of AKA hybrid switchboard (facing the source of the fire).
External cable runs (through engine room space) associated with hybrid system as well as other vessel systems. (The extent of damage will not be known until the vessel’s systems have been completely tested.)
The outboard Air Cleaner Housing and Turbo of the Port Main Diesel Engine. The Port and Aft sides of the AKA Hybrid Switchboard were exposed to significant heat, damaging the
external surfaces and components.
Inspection of the remaining areas of the engine room and ASD space indicated it had sustained light to moderate smoke and heat damage. Equipment, components and wiring in direct line of sight of the battery compartment received more damage than areas protected by obstructions. Upon completion of the inspection, the vessel was secured and access to the vessel was restricted to approved personnel participating in the investigation.
At 1200 on August 21st, the vessel was towed to Pier 49 and secured for further investigation.
INCIDENT TIMELINE: Attachment 1
TECHNICAL BACKGROUND:
Hybrid systems for tugboats provide a significant benefit to the environment, reducing every category of air emissions. The systems also provide for a reduction in the operating cost of the vessel through fuel savings and reduced maintenance expense. Lithium Polymer batteries provide the above benefits with the advantage over lead‐acid batteries of having a lower internal resistance. This allows for higher energy capacity and lower heat generation in the batteries during use. The reduced weight and maintenance of the battery system are additional benefits to the operation of the tugboat.
The low internal resistance is due to the conductivity and chemistry of the materials inside the cell. The smallest working unit in a battery is the electrochemical cell, consisting of a cathode and an anode separated and connected by an electrolyte. The electrolyte conducts ions but is an insulator to electrons. In a charged state, the anode contains a high concentration of intercalated lithium while the cathode is depleted of lithium. The lithium inside the cell is not in a metallic form; it is in ionic form, dissolved in a salt. During the discharge, a lithium ion leaves the anode and migrates through the electrolyte to the cathode while its associated electron is collected by the current collector and used to power electric devices.
The electrodes in lithium‐ion cells are always solid materials. One can distinguish between cell types according to their electrolytes, which may be liquid, gel, or solid‐state components. The electrolytes in gel and solid‐
Campbell Foss Investigation Rev 1 Page 3 of 20 Foss Form 102, rev 1.2
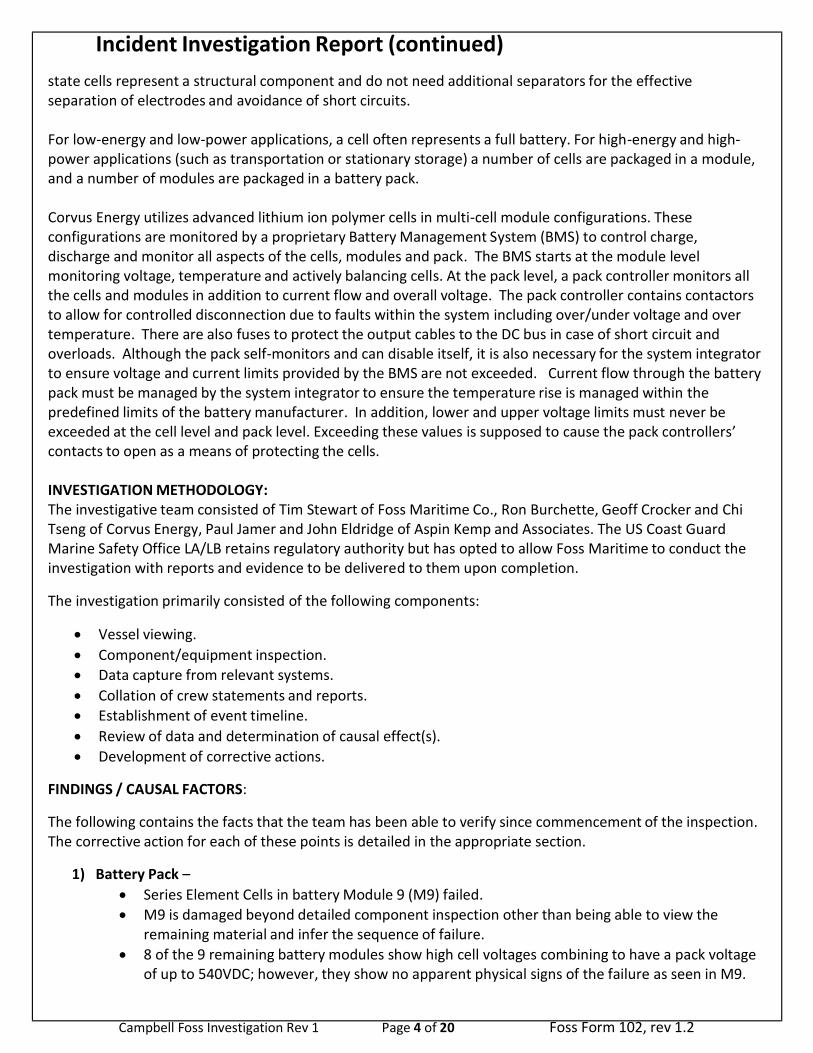
Incident Investigation Report (continued)
state cells represent a structural component and do not need additional separators for the effective separation of electrodes and avoidance of short circuits.
For low‐energy and low‐power applications, a cell often represents a full battery. For high‐energy and high‐ power applications (such as transportation or stationary storage) a number of cells are packaged in a module, and a number of modules are packaged in a battery pack.
Corvus Energy utilizes advanced lithium ion polymer cells in multi‐cell module configurations. These configurations are monitored by a proprietary Battery Management System (BMS) to control charge, discharge and monitor all aspects of the cells, modules and pack. The BMS starts at the module level monitoring voltage, temperature and actively balancing cells. At the pack level, a pack controller monitors all the cells and modules in addition to current flow and overall voltage. The pack controller contains contactors to allow for controlled disconnection due to faults within the system including over/under voltage and over temperature. There are also fuses to protect the output cables to the DC bus in case of short circuit and overloads. Although the pack self‐monitors and can disable itself, it is also necessary for the system integrator to ensure voltage and current limits provided by the BMS are not exceeded. Current flow through the battery pack must be managed by the system integrator to ensure the temperature rise is managed within the predefined limits of the battery manufacturer. In addition, lower and upper voltage limits must never be exceeded at the cell level and pack level. Exceeding these values is supposed to cause the pack controllers’ contacts to open as a means of protecting the cells.
INVESTIGATION METHODOLOGY: The investigative team consisted of Tim Stewart of Foss Maritime Co., Ron Burchette, Geoff Crocker and Chi Tseng of Corvus Energy, Paul Jamer and John Eldridge of Aspin Kemp and Associates. The US Coast Guard Marine Safety Office LA/LB retains regulatory authority but has opted to allow Foss Maritime to conduct the investigation with reports and evidence to be delivered to them upon completion.
The investigation primarily consisted of the following components:
Vessel viewing.
Component/equipment inspection.
Data capture from relevant systems.
Collation of crew statements and reports.
Establishment of event timeline.
Review of data and determination of causal effect(s).
Development of corrective actions.
FINDINGS / CAUSAL FACTORS:
The following contains the facts that the team has been able to verify since commencement of the inspection. The corrective action for each of these points is detailed in the appropriate section.
1) Battery Pack –
Series Element Cells in battery Module 9 (M9) failed.
M9 is damaged beyond detailed component inspection other than being able to view the remaining material and infer the sequence of failure.
8 of the 9 remaining battery modules show high cell voltages combining to have a pack voltage of up to 540VDC; however, they show no apparent physical signs of the failure as seen in M9.
Campbell Foss Investigation Rev 1 Page 4 of 20 Foss Form 102, rev 1.2

Incident Investigation Report (continued)
The contactors in the pack controller are in an open state. they did not fail closed) Had the contactors been found closed after removal of control power a mechanical failure of the contactor would have been indicated.
The Pack Controller Current Sensing Board had not been operational since commissioning due to the interference caused by electrical noise on the vessel. The electrical noise prohibited the sensor from providing an accurate measurement. The sensing board was disabled by forcing the output of the current sensor to zero. Pack balancing requires a current measurement of 0 +/‐ 1.5 amps to enable balancing of the cells which is necessary to optimize pack capacity.
AKA installed a current sensing circuit connected directly to the hybrid control system to provide information required for integration of the battery pack.
Testing performed on a similar battery system identified a software error in the pack controller. This error prevented the pack controller from opening contactors on a battery fault. The Campbell Foss pack controller has an equivalent software installation which would exhibit an identical failure. This information is detailed in a Corvus Energy Memo dated September 13, 2012. (Attachment 2)
2) Battery Compartment – The battery compartment remained intact and the aluminum compartment
doors are not damaged to the point of deformation. The internal surfaces are covered in soot, but external paint appears to be undamaged.
3) Ventilation ‐ The ducting on the battery compartment ventilation system was destroyed by the event.
When exposed to burning gases, the ducting melted; and, as it deformed, the connections to the fan and elbows were compromised. This resulted in hot gases from the battery compartment being vented to the engine room space. There is indication that this occurred in a progressive way. Initially, the joint between the piping and the elbow (which directed it vertically) parted. This allowed the hot gases to be directed forward and starboard. The next joint to fail was at the discharge from the fan, which directed the gases to starboard at the portside of the Hybrid switchboard. Finally, with the loss of the vent piping between the battery compartment and the fan, hot gases were directed athwartships across the aft side of the Hybrid switchboard toward the starboard side of the engine room. At some point during the event, the hot flammable gases ignited in the engine room further igniting combustibles in their path.
4) Control System – The hybrid control system and the battery pack controller work together to control
the flow of energy to and from the batteries. The hybrid control system relied on a state of charge (SOC) indication from the pack controller as a means of determining whether the batteries were able to be charged or discharged. The designed lower limit is 20% and the designed upper limit is 90%. Above the upper limit, the system reduces to a trickle charge. At 92%, charging is terminated and the energy flow is away from the batteries. (The intent of these set points is to not expose the battery to extremes of voltage.) The present methodology for the pack controller to calculate state of charge is based on an indication of the lowest series element voltage. This means that other series elements will be at a higher voltage during charging. The design intent of the Corvus battery BMS was not to use the SOC in accordance with memo “DOC1000001 Memo Pack Charging” communicated to AKA on June 3, 2011 (Attachment 3), this information was not relayed to Foss Maritime. This memo details the use of a “charge parameters message” that defines the maximum voltage and current during charging. The voltage limit was not included as part of the hybrid control system; however, current limits below the values recommended by the battery manufacturer were in place. The use of “SOC” to control the battery charging and discharging remained in place until the fire incident.
Campbell Foss Investigation Rev 1 Page 5 of 20 Foss Form 102, rev 1.2

Incident Investigation Report (continued)
5) Alarm and Monitoring System –The alarm and monitoring system had been reporting numerous alarms
associated with the battery system over a considerable period of time (3 months). As time progressed, many of these alarms were silenced, but not acknowledged. The result is, as additional faults were identified by the system, they did not result in audible or visual indication to the operators. Prior to the
fire, there had not been any faults indicated since August 16th, although the battery system was likely sending continual alarm information. Additionally, the alarm and monitoring system level of resolution, with respect to battery system fault reporting, does not provide sufficient detail to allow operators to determine the exact cause of the alarm condition. In essence, a “summary alarm” will be annunciated for many of the battery alarms, masking the specific information being broadcast from the pack controller. This along with information provided by Corvus Energy in emails dated May 31, 2012 and June 11, 2012, lead Foss to conclude the alarms were nuisance in nature and posed no additional risk for continued operation. In this particular case, alarms were being broadcast that appeared to be of the same nature as the previous alarms when in fact the actual information from the battery may have changed.
6) Engine Room Overhead Insulation – During the fire, the deck in the wheelhouse was hot to the point
of softening the glue under the carpet. During the vessel inspection, it was noted that the overhead of the access trunk was not insulated, permitting the transfer of heat from the engine room overhead to the wheelhouse deck.
7) Findings As a Result of Response Actions
a. The Captain intended to initiate an emergency shut‐down of all machinery. However, this is a
two stage process where the protective guards are lifted, then a toggle switch must be moved to the upper position. In this case, the second action was not accomplished; and, as a result, the shut‐down did not occur.
b. The Crew attempted to gain access to the Z‐Drive compartment for investigation. As a result of the aft door of the engine room being opened, the Z‐Drive compartment was full of smoke. The door to the Z‐Drive compartment should always be closed at sea for the following reasons:
i. The FM200 system is not sized for the engine room space and the Z‐Drive compartment combined.
ii. Local activation of the FM200 system can only be done from the Z‐Drive compartment. c. The battery compartment was fitted with a manually operated FM200 fire suppression system.
The Captain gave the order to activate this system following the Chief Engineer’s report of fire. The system could not be manually activated due to an internally fused pull cable. Inspection of the FM‐200 bottle confirms a discharge of the bottle by automatic actuation of the heat sensitive fusible plug. The electrical contacts are now open confirming proper operation with a resultant damper closure.
ANALYSIS:
One or more Series Elements in Battery Module Nine (9) ruptured due to continuous or numerous overcharging events. The cell pouch burst due to gas generation inside the cell as a result of cell overheating beyond 100°C. The gasses expelled from the cell pouch are flammable. It is unknown if the gasses ignited inside the module or if the pressure build‐up inside the sealed module caused the lid latches to fail. Once the lid seal and retention were compromised, the gasses generated would have vented through the open lid and filled the battery compartment. Current can still be drawn from the cells at that point, including the failing
Campbell Foss Investigation Rev 1 Page 6 of 20 Foss Form 102, rev 1.2

Incident Investigation Report (continued)
cell. As the cell releases gas, the electrolyte of the cell depletes, exposing the anodes and cathodes inside the cell. This reduces the cell’s capacity to deliver energy efficiently and heat is increasingly generated, raising the temperature of the cell and in particular the cell electrodes and tabs. Ignition of the flammable gasses is likely due to extremely high temperatures in the cell electrodes and tabs. Series Elements 4 and 7 show signs of being the first cells to fail based on the amount of damage to the module enclosure adjacent to those cells. Once the heat transferred from the first failed cells, the remaining cells reached a critical point causing these cells to fail in a similar manner, contributing to the overall combustion. Combustion would have continued until the supply of electrolyte in the cells had depleted. Combustion heat transferred to the remaining modules but did not cause them to fail; however, the thermal mass of the modules is such that the battery compartment retained heat for an extended period, as shown by the temperature monitoring results obtained.
There is substantial data to indicate these overcharging cycles were being alarmed over a 3 month period but were considered a nuisance. Emails were received from Corvus Engineering on May 31, 2012 and June 11, 2012 (Attachements 4 & 5) in response to specific questions from Foss Maritime Port Engineer Romen Cross concerning new alarms on Module #9 that were brief in duration (seconds). Foss noted that voltages and temperatures were in‐line with the other modules from hybrid system data. Corvus Energy had asked for additional information with regards to the alarm period and any definable patterns. Corvus had also stated in the email that unless temperature differentials between modules exceeded 15°F to 20°F there should be no additional risk for continued operation. Foss was not able to establish a pattern and alarm periods were essentially the same as discussed in the May 31, 2012 email, therefore additional information was not conveyed to Corvus Energy.
The over temperature was not monitored directly, and the temperature rise was therefore not observed. As a final line of defense, the pack controller should have opened the contactors. Based on testing performed on a pack controller in a similar installation, a software programming error prevented the contactors from opening during a battery fault. Since the Campbell Foss has an equivalent software installation, the pack controller would not have opened the contactors in the event of an overcharge. Due to the Hybrid Control System using “State of Charge” as provided by the battery pack controller to determine when charging was to terminate, multiple overcharge events were realized on the Campbell Foss. The use of “State of Charge” is not in accordance with Corvus BMS design further requiring the pack controller to open contactors to prevent these overcharging events. Further testing also revealed that the pack controller is not designed to latch the contactors in the open position. As a fault condition clears, the contactors will close and continue charging. This type of cycling is often observed where voltage set points are utilized to initiate a corrective action. If voltages are on the threshold of the set point, the system will cycle as the load or charge current varies.
Over time, other modules alarms were raised; and the frequency of alarms increased. Based on the previously discussed emails, these additional alarms were assumed to be a nuisance in nature and therefore this information was not relayed to Corvus Energy. Corvus had communicated their desire to complete battery system upgrades on or about the last week of July, however these upgrades were considered non‐critical to the operation of the battery system. Once the combustion process initiated, pressure inside the module increased to the point of lifting the lid with an approximate force of 3000 lbs. This is most likely the sound heard by the crew at the onset of the event. Inspection of the Battery Compartment indicates that the initial combustion was quick and intense; however, combustion was not sustained due to the discharge of the FM‐200 in the compartment, as the result of the activation of the fusible plug. The discharge of the FM 200 system also initiates a damper closure. Hot gases from the initial combustion were propelled thru the PVC Vent Duct to the Port Aft Engine Room until the PVC
Campbell Foss Investigation Rev 1 Page 7 of 20 Foss Form 102, rev 1.2

Incident Investigation Report (continued)
Campbell Foss Investigation Rev 1 Page 8 of 20 Foss Form 102, rev 1.2
Ducting failed due to extreme heat. Once the PVC Ducting failed, the hot gases escaped into the engine room most likely igniting in the presence of oxygen and further igniting combustibles in the area. The Engine Room FM‐200 Fixed Fire System was deployed and was effective in extinguishing the fire, preventing a total loss of the Engine Room. PROBABLE CAUSE:
The Battery Monitoring System (BMS) monitors individual series elements for over voltage. Additionally, temperature sensors are embedded in each module to monitor temperature. In the event of over voltage or over temperature, the pack controller was designed to open its contactors to protect the battery pack from additional charge / discharge. In this case the pack controller software error prevented this last line of protection from activating. Since these designed protective devices were not functional, the method by which State of Charge is used by the Hybrid System will in fact create overcharge cycles in numerous Series Elements. Since the Pack Controller reports State of Charge based on the single lowest Series Element Voltage other Series Elements will continue to charge until the lowest Series Element has achieved a 90% State of Charge. Cell balancing during charging / discharging may have impacted the ability of the BMS to effectively bring the cells into balance. The problem was further exacerbated by critical alarms / faults being reported as module summary alarms / faults within the alarm and monitoring system. This prevented the crew from fully understanding the nature of the alarms and faults. There was also no programmed absolute maximum setting on the control system of 500VDC as specified in the Corvus Energy memo dated March 2011. This combination led to a series of overcharge cycles and the assumption that the alarms being annunciated were of the same type as previously encountered by Corvus Engineering in May/June, as per the noted emails. Once the combustion event started the failure of the PVC vent ducting allowed the hot gases to escape the battery compartment and engulf the Port Aft Engine Room in flame. The failure of the significant safety systems built into the Corvus Energy Pack Controller along with the contributing factors noted, created a chain of events culminating in the fire event of August 20.
HUMAN CAUSAL FACTORS:
Based on Corvus Energy email response of June 11, 2012 the alarms were viewed as a nuisance. The email stated that unless temperatures between modules were greater than 20F then the system was able to continue safe operation. As previously discussed in the alarm and monitoring section of the findings, the Alarm and Monitoring System masks the detailed information from the Battery Pack Controller. This led the crew to assume the new alarms were of the same nature as the previously investigated alarms creating an atmosphere of complacency with the crew.
The failure to understand the operation of the Alarm and Monitoring System, with regards to acknowledging alarms, prevented further alarms from being annunciated on the Human Machine Interface Panel. It is not believed that any new alarms would have been treated differently due to the nuisance issue previously discussed, but that cannot be confirmed in light of the event.
The access door between the engine room and Z‐Drive room was left open during operations. In this event, this posed no significant problem; however, had the fixed FM‐200 System not deployed from the remote pull stations, then the crew would not have been able to access the FM‐200 System for a local actuation.
MANAGEMENT SYSTEM CAUSAL FACTOR:

Incident Investigation Report (continued)
Campbell Foss Investigation Rev 1 Page 9 of 20 Foss Form 102, rev 1.2
This event clearly illustrates that Foss should have been an integral part of the design with regards to battery system control, alarm/monitoring, and troubleshooting. There is evidence to indicate that Corvus delivered a memo to AKA in 2011 stating a change in the charge algorithm was in order. The information was not sent to Foss. Neither Corvus or AKA tracked the information to ensure implementation. As a result, State of Charge continued to be utilized by the Hybrid System as the means to determine when to commence or cease charging.
The information received from Corvus Energy indicated the battery pack would pose no additional risk since battery temperature differentials were within the stated limits and the alarms were brief in duration. Based on these assurances of continued safe operation, a risk analysis was not performed. The unknown need for a risk benefit analysis led to continued operations where potential risk outweighed the benefit.
MECHANICAL CAUSAL FACTORS:
Evidence suggests that the initial fire was an intense and rapid event which self‐extinguished due to consumption of oxygen within the space and the discharge of the installed FM‐200 bottle thru the actuation of the heat sensitive fusible plug. The failure of the PVC ventilation ducting allowed the hot gases to escape the battery compartment and re‐ignite in the engine room due to the introduction of oxygen. The use of PVC in the battery system ventilation was based on the perception that the multiple layers of safety devices in the pack controller and battery modules would prevent a catastrophic failure of a battery module. Furthermore, the installation of dampers in the ventilation system would prevent a fire from reaching the PVC ducting. Clearly, the risk analysis was flawed by the failure to obtain or analyze technical data regarding the potential energy release with respect to intensity and speed.
The remote pull cable for the Battery Compartment FM‐200 System fused to its liner just outside the
battery compartment rendering it inoperable. Had the system not self‐actuated the system would have been entirely dysfunctional.
Recommended Corrective Actions:
# Corrective Action Assigned To
Due Date
1 Battery Pack
A. Perform self‐diagnostics based on the battery series elements expected response curve. The pack controller is to be configured to recognize any one cell that is responding outside the expected curve. The review of this curve will generate a “health status” of each element and identify a stressed cell well before failure. The pack controller will broadcast the “Healthy” status as a heartbeat control to the hybrid system; “Healthy” calculation to be performed during operation and heartbeat to be sent at 1 second intervals. Disconnect battery pack at fault level (in addition to hybrid system) and lock out restart until inspected by Corvus.
B. Change alarm system to only report critical warnings and no information warnings. Latch contactors open on critical alarms; these must be manually reset.

Incident Investigation Report (continued)
Campbell Foss Investigation Rev 1 Page 10 of 20 Foss Form 102, rev 1.2
C. Review all module and pack controller algorithms and parameters.
D. Commission battery system to ensure control and alarm functionality is in alignment with battery parameters and safety requirements. Specifically, but not limited to:
Charging algorithm
Upper and lower state‐of‐charge (SOC) limits
Voltage limits
Temperature limits
2 Battery Compartment – Although the Battery Compartment remained intact, the aft
door was ajar, indicating a need for a clip to retain the door to the bulkhead. During the
fire response it was noted that only 3000 GAL of fuel was aboard the vessel, creating
some significant concern as to the vapor in the adjacent fuel tank. The adjacent fuel
tank BHD should be insulated to an A‐60 fire rating.
3 Ventilation ‐ The PVC ducting on the battery compartment ventilation system
failed early in the event. The Battery Compartment Ventilation Ducting and Fan
will be constructed of steel material, and all ducting is to be welded fume tight.
The ventilation ducting is to be led to a safe location on the exterior of the
vessel. The ventilation shutdown will be designed to automatically close on an
over temperature event as well as deployment of the fixed fire system.
4 Control System A. Perform independent calculations of bank voltage based on information
provided by pack controller allowing a comparison between the Pack Controller and the Hybrid Control System. Use this as a comparative value for verification of the voltage being reported by the Pack Controller. This will insure that the critical parameter of voltage in the hybrid system will continue to operate the battery pack in a safe manner. Contactors shall be opened if the calculated delta exceeds a predetermined value. (Values to be determined by Foss, Corvus, AKA)
B. Control System will be programmed to look for a “healthy message” from the Corvus Energy Pack Controller. As indicated in section 1, this message is to be sent at 1 second intervals, contactors will be opened upon message failure.
C. Create an HMI Screen for display of Corvus provided trend data with regards to Series Element Health. This will allow a Series Element to be identified as it deviates from the expected performance curve. See Corrective action 1A.
D. Program an absolute upper limit of 500VDC to the DC/DC converter E. Implement the 2 second, 10 second, 30 second maximum current limits
for charging and discharging transmitted by the Corvus system.
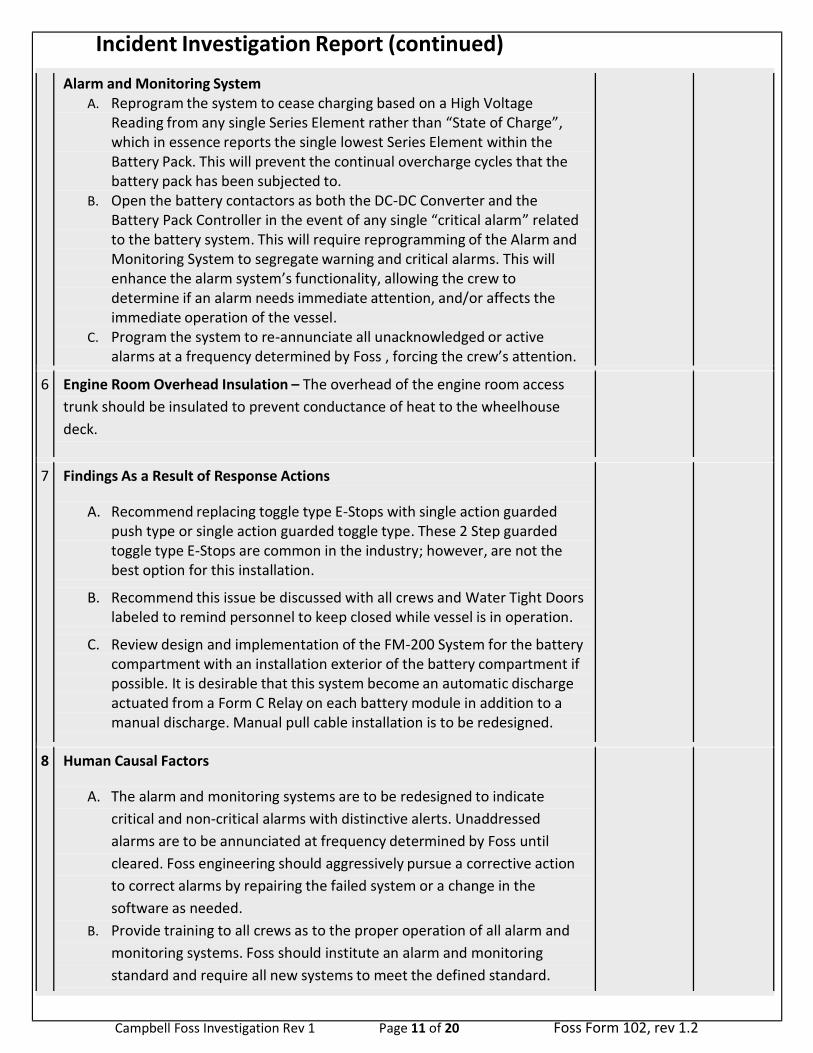
Incident Investigation Report (continued)
Campbell Foss Investigation Rev 1 Page 11 of 20 Foss Form 102, rev 1.2
Alarm and Monitoring System A. Reprogram the system to cease charging based on a High Voltage
Reading from any single Series Element rather than “State of Charge”, which in essence reports the single lowest Series Element within the Battery Pack. This will prevent the continual overcharge cycles that the battery pack has been subjected to.
B. Open the battery contactors as both the DC‐DC Converter and the Battery Pack Controller in the event of any single “critical alarm” related to the battery system. This will require reprogramming of the Alarm and Monitoring System to segregate warning and critical alarms. This will enhance the alarm system’s functionality, allowing the crew to determine if an alarm needs immediate attention, and/or affects the immediate operation of the vessel.
C. Program the system to re‐annunciate all unacknowledged or active alarms at a frequency determined by Foss , forcing the crew’s attention.
6 Engine Room Overhead Insulation – The overhead of the engine room access
trunk should be insulated to prevent conductance of heat to the wheelhouse
deck.
7 Findings As a Result of Response Actions
A. Recommend replacing toggle type E‐Stops with single action guarded push type or single action guarded toggle type. These 2 Step guarded toggle type E‐Stops are common in the industry; however, are not the best option for this installation.
B. Recommend this issue be discussed with all crews and Water Tight Doors labeled to remind personnel to keep closed while vessel is in operation.
C. Review design and implementation of the FM‐200 System for the battery compartment with an installation exterior of the battery compartment if possible. It is desirable that this system become an automatic discharge actuated from a Form C Relay on each battery module in addition to a manual discharge. Manual pull cable installation is to be redesigned.
8 Human Causal Factors
A. The alarm and monitoring systems are to be redesigned to indicate
critical and non‐critical alarms with distinctive alerts. Unaddressed
alarms are to be annunciated at frequency determined by Foss until
cleared. Foss engineering should aggressively pursue a corrective action
to correct alarms by repairing the failed system or a change in the
software as needed.
B. Provide training to all crews as to the proper operation of all alarm and
monitoring systems. Foss should institute an alarm and monitoring
standard and require all new systems to meet the defined standard.
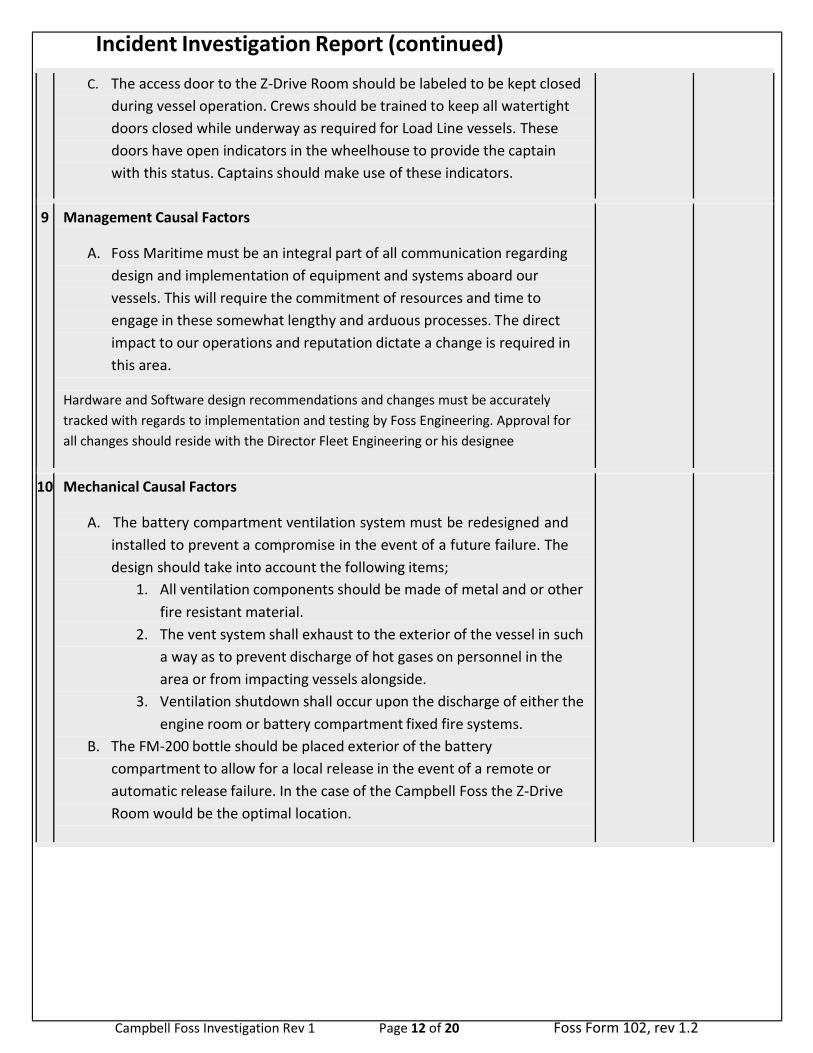
Incident Investigation Report (continued)
Campbell Foss Investigation Rev 1 Page 12 of 20 Foss Form 102, rev 1.2
C. The access door to the Z‐Drive Room should be labeled to be kept closed
during vessel operation. Crews should be trained to keep all watertight
doors closed while underway as required for Load Line vessels. These
doors have open indicators in the wheelhouse to provide the captain
with this status. Captains should make use of these indicators.
9 Management Causal Factors
A. Foss Maritime must be an integral part of all communication regarding
design and implementation of equipment and systems aboard our
vessels. This will require the commitment of resources and time to
engage in these somewhat lengthy and arduous processes. The direct
impact to our operations and reputation dictate a change is required in
this area.
Hardware and Software design recommendations and changes must be accurately
tracked with regards to implementation and testing by Foss Engineering. Approval for
all changes should reside with the Director Fleet Engineering or his designee
10 Mechanical Causal Factors
A. The battery compartment ventilation system must be redesigned and
installed to prevent a compromise in the event of a future failure. The
design should take into account the following items;
1. All ventilation components should be made of metal and or other
fire resistant material.
2. The vent system shall exhaust to the exterior of the vessel in such
a way as to prevent discharge of hot gases on personnel in the
area or from impacting vessels alongside.
3. Ventilation shutdown shall occur upon the discharge of either the
engine room or battery compartment fixed fire systems.
B. The FM‐200 bottle should be placed exterior of the battery
compartment to allow for a local release in the event of a remote or
automatic release failure. In the case of the Campbell Foss the Z‐Drive
Room would be the optimal location.

Incident Investigation Report (continued)
Campbell Foss Investigation Rev 1 Page 13 of 20 Foss Form 102, rev 1.2
Attachments:
1. Time Line
2. Corvus Energy Memo Dated September 13, 2012
3. Corvus Energy Memo “DOC1000001 Pack Charging” Dated March 2011
4. Email From Corvus Energy to Foss Maritime Engineering on May 31, 2012
5. Email From Corvus Energy to Foss Maritime Engineering June 11, 2012
T.S. Stewart, Manager Fleet Engineering Technical Foss Maritime Company

Incident Investigation Report (continued)
Campbell Foss Investigation Rev 1 Page 14 of 20 Foss Form 102, rev 1.2
PICTURES
FAILED BATTERY MODULE #9

Incident Investigation Report (continued)
BATTERY COMPARTMENT PVC DUCTING
Campbell Foss Investigation Rev 1 Page 15 of 20 Foss Form 102, rev 1.2

Incident Investigation Report (continued)
ACTIVE ALARM SCREEN (NOTE UNACKNOWLEDGED ALARMS FROM 8/16)
Campbell Foss Investigation Rev 1 Page 16 of 20 Foss Form 102, rev 1.2

Incident Investigation Report (continued)
BATTERY COMPARTMENT VENT FAN & FAILED DUCTING
Campbell Foss Investigation Rev 1 Page 17 of 20 Foss Form 102, rev 1.2
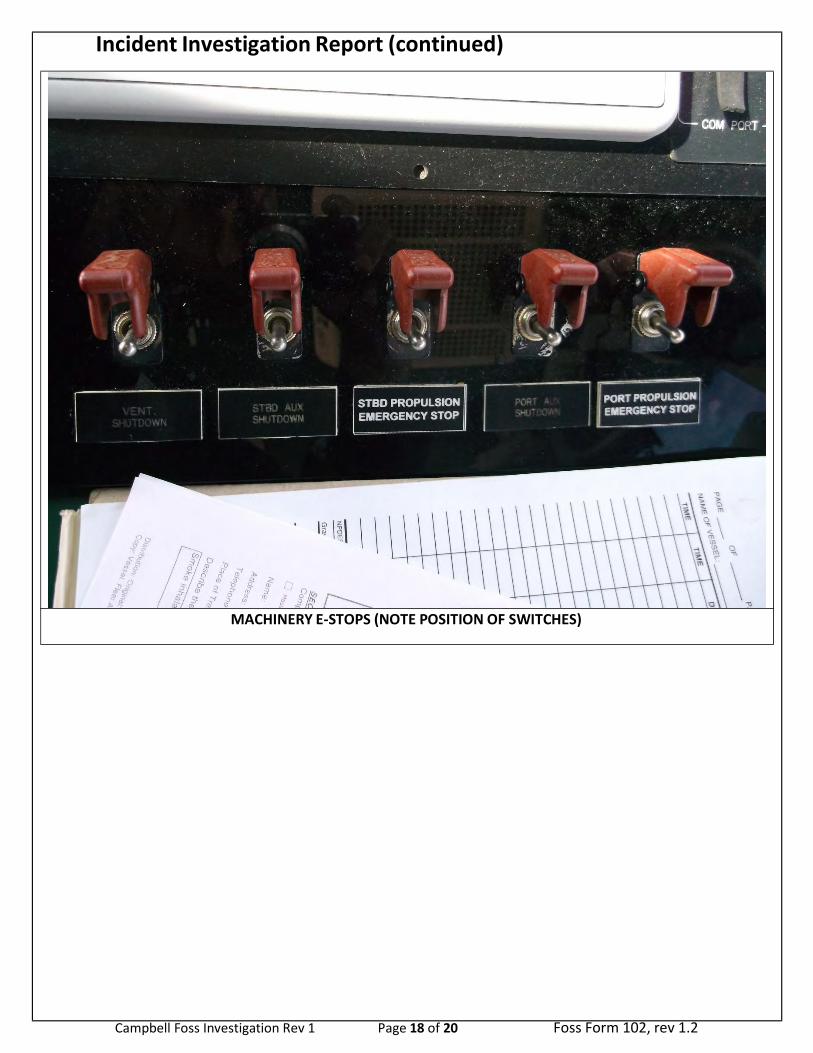
Incident Investigation Report (continued)
MACHINERY E‐STOPS (NOTE POSITION OF SWITCHES)
Campbell Foss Investigation Rev 1 Page 18 of 20 Foss Form 102, rev 1.2

Incident Investigation Report (continued)
OVERHEAD CABLING & INSULATION DAMAGE
Campbell Foss Investigation Rev 1 Page 19 of 20 Foss Form 102, rev 1.2

Incident Investigation Report (continued)
DAMAGED FUEL TRANSFER PUMP & METER
Campbell Foss Investigation Rev 1 Page 20 of 20 Foss Form 102, rev 1.2