070910 morgan final
TRANSCRIPT

Morgan Stanley 10Morgan Stanley 10 thth Annual Annual Latin America ConferenceLatin America Conference
London, September 11 & 12, 2007

2 2
Information and ProjectionThis notice may contain estimates for future events. These estimates merely reflect the expectations of the
Company’s management, and involve risks and uncertainties. The Company is not responsible for investment
operations or decisions taken based on information contained in this communication. These estimates are
subject to changes without prior notice.
This material has been prepared by TAM S.A. (“TAM“ or the “Company”) includes certain forward-looking
statements that are based principally on TAM’s current expectations and on projections of future events and
financial trends that currently affect or might affect TAM’s business, and are not guarantees of future
performance. They are based on management’s expectations that involve a number of business risks and
uncertainties, any of each could cause actual financial condition and results of operations to differ materially
from those set out in TAM’s forward-looking statements. TAM undertakes no obligation to publicly update or
revise any forwardlooking statements.
This material is published solely for informational purposes and is not to be construed as a solicitation or an
offer to buy or sell any securities or related financial instruments. Likewise it does not give and should not be
treated as giving investment advice. It has no regard to the specific investment objectives, financial situation or
particular needs of any recipient. No representation or warranty, either express or implied, is provided in relation
to the accuracy, completeness or reliability of the information contained herein. It should not be regarded by
recipients as a substitute for the exercise of their own judgment.

3 3
Low OperatingCosts
UndisputableBetter Service
CompetitivePrices
Sustainable Strategyto Maintain Market
Leadershipand Profi tabil i ty
TAM is a low cost company with better service at competitive prices

4 4
Previousperiod
Currentperiod
J FMAM J J A SOND J FMAM J J A SOND J FMAM J J A SOND J FMAM J J8085
9095
100
105110115
120125
130
Domestic Market - Variation
2004
Source: ANAC
Accum. market growth 2006
12%
The domestic market growth still strong in 2007, reaching 13% in the first 7 months of the year
Accum. market growth 2005
19%
Accum. market growth 2004
12%
Accum. market growth 2007
13%
200720062005

5 5
33,0%35,8%
47,8% 49,3%43,5%
2003 2004 2005 2006 Jan - Jul
TAM 50,6%
GOL 36,9%
BRA 4,1%
Varig 2,7%
Other 5,6%
We have been domestic market leaders since 2003, ending July with 49,3%
Domestic Market Share - July/07
Domestic Market Share (RPK’s)
Source: ANAC
TAM 49,6%
GOL 40,1%
BRA 2,7%
Varig 3,8%
Other 3,7%
Domestic Market Share – 2Q07

6 6
Previousperiod
Market
TAM
J F MAM J J ASOND J FMAM J J A SOND J F MAM J J A SOND J FMAM J J40
60
80
100
120
140
160
180
200
International Market - Variation(vs previous year)
Source: ANAC
The international market (among Brazilian carriers) is recuperating
Accum. market growth 20048%
Accum. market growth 20057%
Accum. market
decrease 2006 30%
Accum. market decrease 2007
24%
Acum TAM 200641%
Acum TAM 2007 75%
Acum TAM 200540%
Acum. TAM 200430%
2004 20072005 2006

7 7
12,00% 14,3%
37,3%
65,6%
18,8%
2003 2004 2005 2006 Jan - Jul
TAM 64,3%
GOL 15,6%
Varig 14,2%
Other 5,8%
International Market Share– July/07
International Market Share
Since July 2006, we are international market leaders among the Brazilian companies
Source: ANAC
TAM 70,8%
Varig10,7%
GOL 13,3%
Other5,2%
International Market Share – 2Q07

8 8
In the past 5 years, we have improved every operational metric…
No. take-offs (K)
Load Factor - LF Dom - LF IntMarket Share Dom
MS/CS Domestic
Aircraft Utilization (block hrs/day)
- Narrow bodies - Wide bodies
2003
76 147
61%58%71%33%
0.97
7.6
5.87.3
TAM S.A.2004
76151
66%64%71%36%
0.98
9.0
6.9 12.6
2005
81 210
71%70%73%44%
1.00
11.4
10.2 14.2
2006
92245
74%73%76%48%
1.02
12.7
12.4 15.1
No. operating aircraft
2002
102 219
55%53%61%35%
0.94
9.5
9.2 10.0
1H07
101130
71%71%70%49%
1.03
12.8
12.4 15.7

9 9
…resulting in an outstanding improvement in our financial metrics
Net revenues
EBITDAR
% EBITDAR EBIT
% EBIT
Net Income
% Net Income
2002
3,429
475
13.9%
(236)
-6.9%
(606)
-17.7%
2003
3,667
775
21.1%
(32)
-0.9%
174
4.7%
2004
4,520
1,038
23.0%
294
6.5%
342
7.6%
2005
5,649
1,140
20.2%
426
7.5%
187
3.3%
2006
7,345
1,817
24.7%
996
13.6%
556
7.6%
BR GAAP 1H07
3,322
593
15.6%
120
3.2%
31
0.8%

10 10
And a solid balance sheet improvement R$ million - BRGAAP 2007 2006 2005 2004
Cash 2.511 2.453 995 297
Short-Term Debt 445 363 216 204
Long-Term Debt 1.770 895 425 399
Total Debt 2.214 1.258 641 603
Shareholder's Equity 1.473 1.449 760 191
Capitalization 3.242 2.344 1.185 590
Aircraft and flight equipment leases 6.013 5.032 4.389 4.557
Total Debt Adjusted 8.227 6.290 5.030 5.160
Total Capitalization Adjusted 9.255 7.376 5.574 5.147
Debt / Capitalization 68% 54% 54% 102%
Adjusted Debt / Adjusted Capitalization
89% 85% 90% 100%
Adjusted Debt / EBITDAR 5,6x 3,5x 4,4x 5,0x
Adjusted Net Debt / EBITDAR 3,9x 2,1x 3,5x 4,7x

11 11
RASKCASK
2002 2003 2004 2005 2006 1Q07 2Q0715
20
25
RASK/CASK (R$ Cents)BR GAAP
EBITMargin
Spread
-7.1%
-1.1
-0.9%
-0.2
6.5%
1.4
7.5%
1.5
13.6%
2.8
4.8%
0.9
1.7%
0.3
However the competitive dynamic in the domestic market lead to a reduction of our spread in the 1H07

12 12
Structure of legal authorities involved in the industry
AIR FO R C EC O MMAN D
D EC EAAIR TRAFFIC/ SPACE
CONTROLCivil & Military Aircraft
N AVYC O MMAN D
ARMYC O MMAN D
C EN IP AAccident Investigation and Prevention Board
Air Traffic Control
A&I Investigation
National Civil Aviation Agency
M IN IS TR Y O F M IN IS TR Y O FD EFEN S ED EFEN S E
P R E S ID EN TP R ES ID EN T
C O N ACNational Civil
Aviation Council
DesignManufacturing
OperationsMaintenance
LicensingAirportsRegister
FacilitationSecurity
Air ServicesIntl. Air Navigation
ErgonomicsHuman Factors
IN FR AER O

13 13
CONAC announced guidelines for future implementation (1/2) Resolution no. 6, dated July 20, 2007, states that:
By ANAC
ANAC´s supervisory duties will be enhanced in order to assure unrestricted support to the victim´s family members
In 60 days, the take-off and landing rights at Congonhas will be reviewed, restricting them to point-to-point, direct flights
New international flights will be allocated outside the São Paulo terminal (Guarulhos and Congonhas)
No charter flights are allowed out of Congonhas
A permanent contingency plan for aircraft and crew must be established

14 14
CONAC announced guidelines for future implementation (2/2)
By ANAC and Air Force Command
Further restrict the use of Congonhas for General Aviation purposes
In 90 days, submit a study on possible locations for a new aiport site in São Paulo
By Infraero
In 90 days, submit a study for expansion and redesigning of airports in São Paulo
Seek clearance from the courts for spaces currently occupied by companiese under bankrupcy or reorganization
Promptly adopt redistribution of spaces to permit accomodation of a larger number of passengers at Guarulhos
15 15
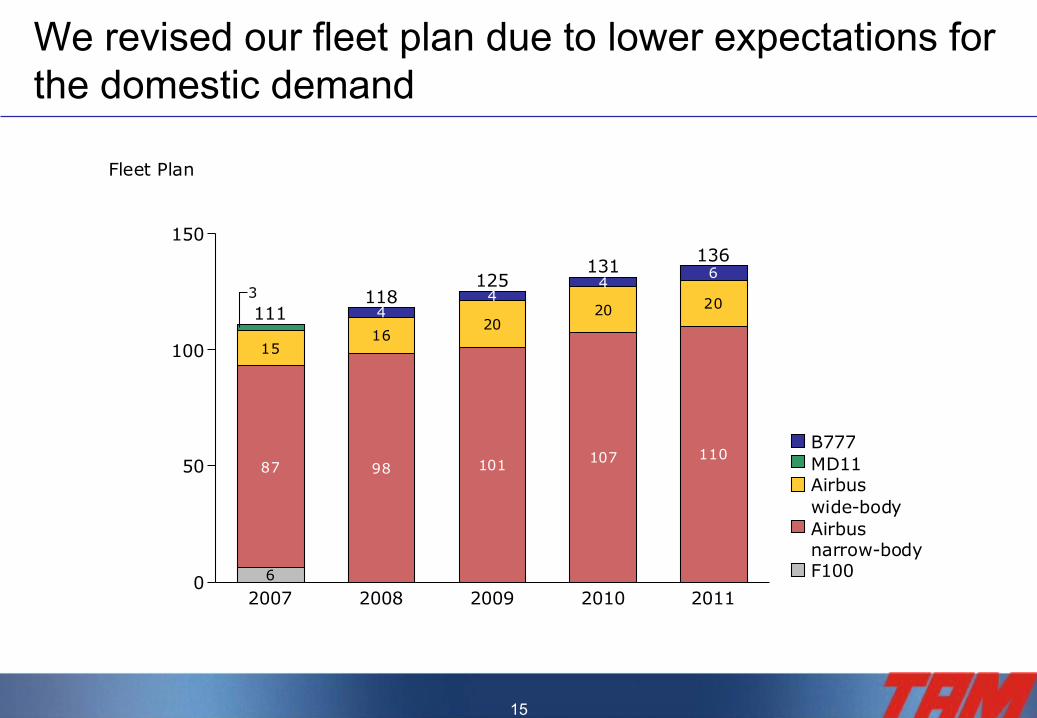
We revised our fleet plan due to lower expectations for the domestic demand
3
15
87
6
4
16
98
4
20
101
4
20
107
6
20
110
2007 2008 2009 2010 2011
111118
125131
136
0
50
100
150
Fleet Plan
F100
Airbusnarrow-body
Airbuswide-body
MD11B777

16 16
Average domestic market share above 50% Average domestic load factor at approximately 70% Aircraft utilization per day (block hour) higher than
13 hours Reduction of 7% in total CASK ex-fuel in BR GAAP
yoy Opportunity in the international market
Third frequency to ParisInauguration of two new international long haul
frequencies
Market demand growth from 10% to 15% (in RPK terms)
Guidance 2007
TAM
Market
However, our guidance for 2007, disclosed in December 2006, is still the same
12.6%*
1S07
• Since January• Milan (March),
Frankfurt and Madrid (December)
49.3%*
72.1%*12.8
9.2%
* Accumulated from January to July
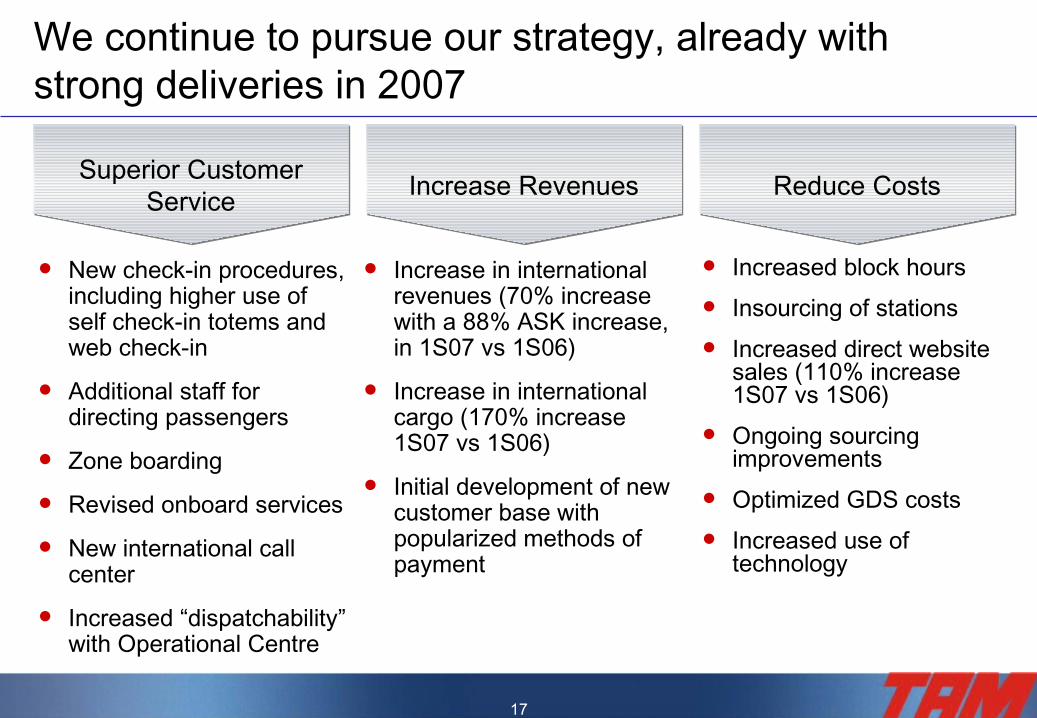
17 17
Increased block hours Insourcing of stations Increased direct website
sales (110% increase 1S07 vs 1S06)
Ongoing sourcing improvements
Optimized GDS costs Increased use of
technology
New check-in procedures, including higher use of self check-in totems and web check-in
Additional staff for directing passengers
Zone boarding
Revised onboard services
New international call center
Increased “dispatchability” with Operational Centre
Superior Customer Service
Increase Revenues Reduce Costs
We continue to pursue our strategy, already with strong deliveries in 2007
Increase in international revenues (70% increase with a 88% ASK increase, in 1S07 vs 1S06)
Increase in international cargo (170% increase 1S07 vs 1S06)
Initial development of new customer base with popularized methods of payment

18 18
We are well positioned to serve every part of the client spectrum (from leisure to business)
Launching new methods of payment Payment at lottery stores Billing slips Automatic debit Financing for passengers via direct consumer credit with the main retail banks
Providing specific products for the different segments

19 19