06.01 actual use of built-up areas / 06.02 inventory of green ... · web view06.01 actual use of...
TRANSCRIPT

06.01 Actual Use of Built-up Areas /06.02 Inventory of Green and Open Spaces 06.01.1 Actual Use /06.02.1 Actual Use and Vegetation Cover (Edition 2016)OverviewSocial, political and economic changes generate new tasks and functions for a city, many of which cannot be satisfied within the framework of existing urban structures. Even almost three decades after the reunion of the two parts of the formerly divided city, Berlin is still engaged in a prolonged process of economic and demographic restructuring. The expected developments outlined in the Berlin Land Use Plan 1994 at the beginning of the 1990s (cf. text, Edition 1995) had been only partially realized initially. A major growth impetus had been predicted for the metropolis of Berlin and its immediate surroundings through 2010. The real development, however, was the opposite. While, on the one hand, most of Berlin's immediate neighbouring communities grew rapidly from the mid-1990s, the population of Berlin, on the other hand, showed a slight decrease in population until the early 2000s, which only reached its 1991 level again in 2010. At the same time, there was also a loss of jobs. From the year 2005, Berlin initially saw a slight increase in population, which became consistent in the following years and has been developing dynamically since 2010. It currently comprises an annual population increase of 40,000 to 50,000 inhabitants (cf. also Population Prognosis 2015-2030, only in German).
New urban developments, require adapted strategic considerations for urban and landscape planning, for which a knowledge of current land use is an indispensable precondition. The impact of urban development and construction processes on the environment depends to a large extent on the type and intensity of the actual land use. For this reason, the effects on the environment, and also the nature and potentials of urban space, are closely linked to uses and structures.
The actual-use and urban-structure mapping procedures of the Environmental Atlas go back to concepts and strategies from the 1980s, and have since become increasingly important. In terms of spatial and substantive differentiation, these maps are important especially for city-wide higher-level analyses, models and programmes in the areas of the environment, urban development and landscape planning. A close integration of the content of the present actual-use maps exists with the maps on Urban Structure, 06.07 and 06.08 of the Environmental Atlas. The actual use shown in Maps 06.01, 06.02, 06.01.1 and 06.02.1 is to some extent further differentiated in those maps. Particularly for the use category “Housing”, which includes a broad spectrum of urban structures, a further differentiation is of particular interest, in order to be able to derive various urban and environmental indicators and parameters. Since not all data required for certain calculations or plans are available, or can be collected with reasonable effort locally, an approach has been adopted in recent decades that can be described as that of “urban-structure typology”. Under this process, indicator values are derived on the basis of random samples, data obtained from the literature, or expert assessment, and parameters are assigned to the mapping units. Since the utilization and urban structure have been mapped completely, these indicators can then be transferred to the entire city for many applications with a sufficient degree of accuracy.
Especially for the tasks of urban and landscape planning, an understanding of the actual land use is vital. Thus, an evaluation of the needs of the population for recreational opportunities near their homes requires information on the location of residential areas and of open spaces. Also, the close proximity of certain pollution sources to sensitive areas, such as commercial areas in the vicinity of housing or allotment gardens, can provide indications on existing conflicts (noise and air pollution, heavy-metal pollution of the soil), and strategies for solutions can be developed. Similarly, without
1

detailed knowledge of various urban structures, the development of planning concepts for adapting to climate change would not be possible.
Furthermore, the actual-use mapping data contained in the Urban and Environment Information System (ISU) is used in the everyday planning process, as a result of its use as a base of information for landscape care plans, environmental reports as part of the construction planning process, and for other environmental impact assessments and statements.
Maps 06.01 and 06.02 together constitute a mutually complementary comprehensive presentation of actual land use in Berlin, and should, in terms of their content, be considered a single map. For methodological reasons, these maps partly overlap. Therefore, beginning 2015 two further maps are being provided, in which the information that had hitherto been separated is combined, so that the actual use is comprehensively represented across all use types. The following text always refers to all maps, unless reference is expressly made to a particular one.
Statistical BaseThe data on use of built-up and non-built-up areas derive from a large number of sources which are described in a differentiated manner in the respective editions. The basis for the categorization and use assignment was provided by the land use maps in the 1985 Environmental Atlas for the former West Berlin, “Actual Use of Built-up Areas” (06.01.), and “Inventory of Green and Open Spaces” (06.02), as well as the editions published for all of Berlin in 1995, 2002, 2004, 2008 and 2011 (06.01 / 06.02).
For the update of the Edition 2016 (as of Dec. 31, 2015), changes in land use during the period 2011 through 2015 were ascertained, and updates of the geometries of the Block Map 1 : 5000 (ISU 5) were undertaken. Moreover, the data base for actual-use mapping was subjected to plausibility checks on the basis of various geo-data available in the State of Berlin and updated if necessary. The Environmental Atlas Maps 06.07 / 06.08 on Urban Structure were compiled simultaneously.
In all, the following databases were used to update and verify the actual-use mapping:
Block Map of the Urban and Environmental Information System (ISU/50) , as of December, 2015
Data from the Senate Department for Urban Development and the Environment:- Automated Property Register (ALK), as of January 2015- Biotope mapping, as of 2014- Digital ortho-photos, aerial photography flights 2010 through 2015- Area monitoring, as of September 2015- Forest management data, Berlin forests, as of October 2014- Cemetery inventory, as of December 2009- Building and vegetation heights, aerial photography data from August 2009 and
September 2010 (cf. Environmental Atlas 06.10)- Green space inventory, as of February 2016• Map of Berlin 1 : 5,000 (K5), survey departments of the boroughs, as of April 2015- Allotment gardens inventory, as of May 2015- Peatland areas from the project “Berlin’s Peatlands and Climate Change” of the Humboldt
University Berlin, Soil Science and Site Division, as of May 2015 (cf. Environmental Atlas 01.19)
- Social infrastructure sites – day care centres, Planning-area Related Information System for Monitoring and Analysis – PRISMA, as of June 2014
- Impervious soil coverage, as of May 2011 (cf. Environmental Atlas 01.02)- Urban structural density, Site Occupancy Index (SOI), as of December 2015 (cf.
Environmental Atlas 06.9.2) Data from external sources:
- Building completions of the years 2011 - 2014, Statistical Office for Berlin-Brandenburg, as of June 2015
- Soil-scientific mappings compiled in the years 2010 - 2015- Building count of the 2011 census, Statistical Office for Berlin-Brandenburg, as of March
2014- Legally registered inhabitants at the primary place of residence in Berlin, Statistical Office
for Berlin-Brandenburg, as of December 31, 2015- Statistical blocks, Statistical Office for Berlin-Brandenburg, as of December 31, 2015
2

- Digital field block register, agricultural reference plots, Ministry of Rural Development, Environment and Agriculture Brandenburg, as of February 2016
- HistoMap Berlin, State Archive Berlin and Beuth University of Applied Sciences Berlin, as of 2013
- Social infrastructure sites - hospitals, State Office for Health and Social Affairs (Landesamt für Gesundheit und Soziales, LaGeSo), as of June 2014.
MethodologyInformation about actual land use is managed and processed at the ISU (Informationssystem Stadt und Umwelt: Urban and Environmental Information System). This makes possible a graphic data processing of the factual data on basis of a uniform spatial reference system.
The spatial reference system is provided by the Block Map 1 : 5000 of the Urban and Environmental Information System (ISU5), which is in turn based on the Block Map of the Statistical Office of Berlin-Brandenburg (AfS). Each statistical block is as a rule delimited by streets. The numbering and the limitation of blocks is handled by the AfS.
In the ISU block map, the AfS blocks can be further subdivided. The block segments constitute the smallest reference area here, and are delimited within a statistical block according to differing land use. The block segments are not part of the statistical block system of the AfS, but are shown only in the block map of the ISU. Thus, a total of 25,352 blocks and block segments result.
13,253 of these areas correspond to the statistical units of the Office of Statistics, while 3,137, mainly large and vacant blocks from the Statistical Office of Berlin-Brandenburg (AfS) map, have been subdivided into 12,099 ISU block segments.
The uniform reference system makes possible a clear spatial identification of all factual data. By means of a common key, which contains, among other things, borough, block and block segment numbers, these data are assigned to the spatial reference system.
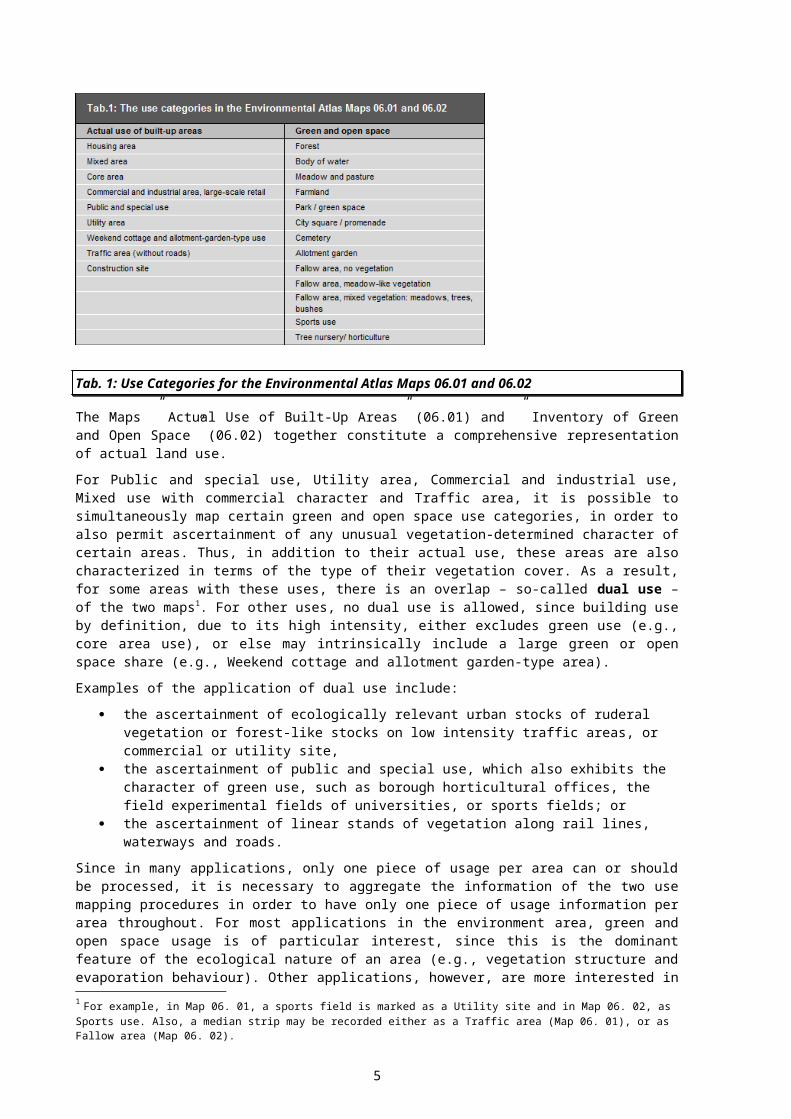
The Environmental Atlas Map “Actual Use of Built-Up Areas” (06.01) and “Inventory of Green and Open Space” (06.02), record the actual land use in Berlin on the basis of 22 different categories, which are described in greater detail in the following sections. The procedure for the determination of the various land use categories is detailed in the report which documents the mapping unit and the updating of the database 2015 (SenStadtUm 2016a, German only).
Tab. 1: Use Categories for the Environmental Atlas Maps 06.01 and 06.02
The Maps ” Actual Use of Built-Up Areas” (06.01) and ” Inventory of Green and Open Space” (06.02) together constitute a comprehensive representation of actual land use.
For Public and special use, Utility area, Commercial and industrial use, Mixed use with commercial character and Traffic area, it is possible to simultaneously map certain green and open space use categories, in order to also permit ascertainment of any unusual vegetation-determined character of
3

certain areas. Thus, in addition to their actual use, these areas are also characterized in terms of the type of their vegetation cover. As a result, for some areas with these uses, there is an overlap – so-called dual use – of the two maps1. For other uses, no dual use is allowed, since building use by definition, due to its high intensity, either excludes green use (e.g., core area use), or else may intrinsically include a large green or open space share (e.g., Weekend cottage and allotment garden-type area).
Examples of the application of dual use include:
the ascertainment of ecologically relevant urban stocks of ruderal vegetation or forest-like stocks on low intensity traffic areas, or commercial or utility site,
the ascertainment of public and special use, which also exhibits the character of green use, such as borough horticultural offices, the field experimental fields of universities, or sports fields; or
the ascertainment of linear stands of vegetation along rail lines, waterways and roads.
Since in many applications, only one piece of usage per area can or should be processed, it is necessary to aggregate the information of the two use mapping procedures in order to have only one piece of usage information per area throughout. For most applications in the environment area, green and open space usage is of particular interest, since this is the dominant feature of the ecological nature of an area (e.g., vegetation structure and evaporation behaviour). Other applications, however, are more interested in building use (e.g., when comparing the actual-use profiles for a proposed land use plan, or in assessing the impact of the effects of noise on people). Therefore, from 2015, the use has additionally been represented in the two maps “Actual Use” (06.01.1) and “Actual Use and Vegetation Cover” (06.02.01), in which both the uses of Map 06.01 and those of Map 06.02 are shown together. In Map 06.01.1, in case of dual use (currently 1,964 cases), the construction use is shown, i.e. the presentation exhibits construction priority. By contrast, in Map 06.02.1 the presentation exhibits green priority, i.e., in case of dual use, green and open space use is shown. Since when drawing a balance of the shares of the city’s territory occupied by the categories, each category can be taken into account only once, this procedure ensures that the area share can be calculated separately, depending on the goals of a particular assessment.
Updating the Geometry and Usage DataIn addition to the update of Block Map 1 : 5,000 (ISU5) of Berlin, the focus of the continuation of Edition 2016 was on the research and analysis of digital data collected by the sections of the Senate Department for Urban Development and the Environment and beyond that in other contexts, by means of which a more extensive, semi-automated update and review of the entire data set could be accomplished. In this context, the mapping units of both the actual-use and the urban-structure mapping processes were adjusted slightly in isolated cases. The rules on the admissibility of combinations of various land uses and types of areas were also slightly revised, and, based on these rules, plausibility checks were implemented for the entire data base.
Update of the Digital Map of Berlin 1 : 5000 (ISU5)The block boundary changes carried out between 2011 and 2015, including the current area key of the Berlin-Brandenburg Office of Statistics, have been adopted into the geometry of the ISU5. For all newly created blocks, and for the area monitoring areas of the Senate Department for Urban Development and the Environment (only in German), a use mapping procedure was carried out with the aid of aerial photography and other documents (see Statistical Base). In this process, a further subdivision of the block areas into homogeneous-use block segments was implemented where necessary, corresponding to the presentation in the land-use and area-type system of the Environmental Atlas.
There were also correction areas, where "random observations", e.g., during examinations of adjacent areas, local inspections, analyses of aerial photography or local knowledge on the part of persons involved, etc. had revealed that the land use had changed.
1 For example, in Map 06. 01, a sports field is marked as a Utility site and in Map 06. 02, as Sports use. Also, a median strip may be recorded either as a Traffic area (Map 06. 01), or as Fallow area (Map 06. 02).
4
Plausibility check and comparison with various spatial data basesPlausibility checks were performed using a database analysis, in which areas with unacceptable combinations of land uses and area types were identified and reviewed.
In addition, various spatial data bases were analyzed that have in recent years been compiled in the Senate Department for Urban Development and the Environment and other departments for a variety of specialized tasks. These data bases were either already available as ISU block data, or they could be merged and compared with the information of the ISU map, and thus provided indications of particular cases in which the use data needed to be examined.
In addition, all areas categorized in Edition 2011 as Fallow area, Traffic area, Allotment garden, Meadow and pasture/ farmland, Tree nursery / horticulture and Cemetery were subjected to a check, because they were subject to greater change dynamics with respect to structure and vegetation.
Scope of the update The updated ISU5 map consists of a total of 25,352 areas: 13,253 of which are main blocks and 12,099 block segments. A total of 18,128 areas with built-up use and 9,188 with green and open space use were mapped. Thus, 1,964 areas showed dual use.
Extensive checks were carried out. In this context, areas were also identified, which were covered in more than one of these checks, as well as areas adjacent to areas under review, which were therefore also checked. Thus, the complete update results in a total of 7,159 areas, which were checked for their use. 1,346 blocks were assigned a new key and 147 block segments were deleted. Of 5,666 checked blocks which retained their key, 1,945 blocks received a new use assignment and for 3,721 blocks the use was confirmed. This revision covered about 27,370 ha or 34.5 % of the total block area (without roadway areas).
Independent of the use check, 213 main blocks and 760 block segments were dissolved based on AfS information, and 376 main blocks and 970 block segments were newly defined. For 36 main blocks and 279 block segments of these, it was only the key, not the area, that was changed.
In 720 cases, more than 20 % of the block segment area was changed, due to boundaries that had been moved, e.g. to include a new building outside a block segment.
A detailed documentation, which contains not only the report on the current continuation of the real use and urban structure mapping, but also a representation of the conceptual basis, mapping instructions, and a comprehensive description of all mapping units, can be downloaded at the following link:
https://www.stadtentwicklung.berlin.de/umwelt/umweltatlas/download/Nutzungen_Stadtstruktur_2015.pdf (only in German)
Map DescriptionEach mapping unit for Actual Use of Built-Up Areas and for the Inventory of Green and Open Space is described separately below.
The Categories for the Map “Actual Use of Built-Up Areas” (06.01)Block areas are shown as Housing if they are primarily used for residential purposes. Certain residentially related service enterprises, utilities and local green spaces are also included. Residential areas include both the dense inner-city areas and the open housing estates at the periphery of the city.
The Mixed use area may be similar to primarily residential areas in appearance. However, the housing is more strongly interspersed with commercial and service enterprises (department stores, offices, etc.), cultural facilities and small businesses. In exceptional cases, housing may account for as much as two thirds of the area, but as a rule, commercial, service enterprises and other businesses predominate.
In some cases, Mixed use areas are characterized by a high share of retail enterprises, tradespeople, or small businesses, or extensively used commercial space and the associated sheds, workshops or
5

warehouse/ storage areas, while residential use is clearly secondary, and accounts for only one third or at most half of such an area. If such areas are underused, they may be interspersed with fallow areas.
The negative impact of commercial use on a neighbouring residential area usually ranges between minimal and moderate, but is in some cases high.
Areas with high use intensity and density are presented as Core use areas. They are found exclusively in the central areas of the inner city, and in the main borough centres. These are areas of particular importance for commercial, private and public services, and for cultural and scientific institutions. To some extent, higher-level public facilities, especially federal administrative offices, embassies, etc. in inner-city areas are assigned to this category.
Structurally, major differences are apparent between various parts of the city. The spectrum ranges from block structures of the Wilhelminian period to high-rise buildings built in recent decades. In general, these areas are characterized by high urban density and a high degree of imperviousness.
The characteristics of a Commercial and industrial, large-scale retail area include large industrial buildings, warehouses and storage/ parking areas. The housing share is subordinate, with around one third at a maximum. This category also includes railway freight yards and commercial areas on railway land, waterside lots of a clearly commercial character (shipyards, boatyards, etc.), as well as large-scale retail and other space-consuming commercial operations, including the parking facilities belonging to them. Disturbance due to noise and emissions can be rated from moderate to very high.
Sites of the Public use category include cultural, university and research, health care, administrative, security and law-enforcement facilities, religious institutions such as churches, child care centres and other youth recreational centres, schools and sports facilities. A few children's playgrounds and retirement homes are also included in this category.
Special use areas include such areas as the Olympic Stadium and the Messegelände trade fair complex, as well as large restaurants in recreational areas oriented toward group tours.
The category Utility area includes power, gas, water, district heating and facilities of the waste removal and sewage departments.
Public roadways are generally not included in the use mapping process. The Traffic areas as described here therefore include primarily railway lands, private roadways, as well as Tegel Airport. Moreover, traffic islands and median strips also count as Traffic areas, to the extent that they are marked on the block maps. “Green spaces associated with traffic areas” – i.e., along roads, rail lines and bodies of water – are also assigned to this category in the mapping process, albeit as dual use areas which are also counted as Green and open spaces.
Freight railway stations and commercial areas on railway land are, by contrast, not counted as traffic areas, but are rather assigned to the category “Commercial and industrial use, large-scale retail”.
Parking spaces including parking garages were only considered to be traffic areas if they occupy an entire block. Parking areas with ascertainment sizes exceeding one hectare, but which are located within a single block in combination with other uses (e.g. residential use), are not separated off by a block segment partition, but are rather assigned to the dominant use.
The Traffic area category also includes railway lines and operating facilities of the subway (U-Bahn), the urban railway (S-Bahn), the long distance railway and the tram system, and also parts of the underground/subway lines which are outside of the tunnels in open cuts.
The Central Bus Station (ZOB), and the bus and tram depots are also assigned to this category.
Weekend cottages are by definition not permanently inhabited, and are primarily used for recreation. This category also includes areas with allotment-garden-type use, which are not listed in the "Berlin Allotment Gardens" map developed by the Senate Department for Urban Development and the Environment as per the Federal Allotment Gardens Law.
Compared to a single-family home area with residential use, these blocks are generally characterized by a smaller structural volume and a smaller-scale subdivision of the lots. Compared with Allotment garden areas however, these areas are more densely built-up, and the lots are generally larger.
Areas classified as Construction sites are those with a typical construction site character, as a rule, with open ground. Once the foundations and first floors of the new building are recognizable, it will be classified according to its planned use.
6

Categories of the Map “Inventory of Green and Open Space” (06.02)The category Forest includes all wooded areas of the Berlin forests, as well as those wooded stands outside the Berlin forests which appear clearly in aerial photography as forest stands. Besides the wooded areas of the Berlin forests, this includes reforested former sewage farms and other fallows with forest-like vegetation.
Not included in this category are forest-like parks, such as the Großer Tiergarten or the Klein-Glienicke People's Park, which is part of the parkland inventory of Berlin. Such areas have been assigned to the use category Park / green space and to the area type Forest.
Body of water includes all natural bodies of water, e.g. rivers, lakes, ponds, and also canals, retaining and seepage basins of the Berlin Water Authority, provided they are recognizable as water surfaces (or as water engineering structures).
The category Meadow and pasture includes meadows, pastures and enclosures used for agricultural purposes, and also experimental areas used by the universities for similar purposes, and former sewage fields, regardless of how the products of these fields are used.
Farmland includes areas identified as being used for agricultural purposes. The difference from the category Meadow and pasture is that in this case, the land is periodically ploughed, sown, fertilized and harvested.
To determine the use of meadow and pasture and farmland, the database of the digital field block register was analyzed for the first time. The use categories Meadow and pasture and Farmland may alternate over the course of only a few years in the same area. For these two agricultural use categories, it is therefore particularly important that the mapping process reflect the current state of knowledge.
The category Tree nursery / horticulture includes both the acreage of private tree nurseries and garden centers, and of borough garden centers and city horticultural schools. These are areas with predominantly outdoor cultivation. Facilities with purely indoor operations are rather assigned to the category Commercial and industrial use.
Block areas with borough garden centres, horticultural schools, the work yards of the horticultural offices, and certain research facilities, such as the Institute for Crop Research of the Technical University Berlin and the corresponding teaching and experimental fields of the universities, are mapped as dual use together with Public use /special use. Due to their high demand for space, tree nurseries and horticultural facilities are largely located at the outskirts of the city.
In addition to those facilities listed in the Directory of Green Spaces compiled by the Senate Department for Urban Development and the Environment, the category Park / green space includes other green spaces, if they are similar in appearance to a publicly accessible park facility and are apparently subject to regular maintenance gardening. Thus, for example, well maintained green spaces associated with traffic areas along roads and motorways are assigned to this category, albeit as dual purpose areas with traffic use. Smaller, public-square-like green spaces and playgrounds are also mapped as a Park / green spaces, provided they are less than approx. one third impervious; otherwise they fall under the category of City square / promenade. Blocks of the use category Park / green space are also generally assigned to the area type Park / green space. Very extensive parks and recreational facilities characterized almost exclusively by extensively maintained or non-maintained wooded or meadow-like areas are in some cases assigned to the area types Forest or Fallow area (e.g., the Klein-Glienicke People's Park). Some special, not freely accessible facilities, such as the Botanical Gardens or Zoologischer Garten or Tierpark Friedrichsfelde, are mapped as a Park / green space, but with the dual purpose assignment as Public use / special use. Other public facilities, too, may be associated with green facilities. These parklands are then not delimited separately, even if their size exceeds the ascertainment limit of one ha. They may be mapped as dual purpose areas, in order to also connote their predominantly "green" character.
By contrast however, private outdoor facilities, playgrounds, etc. in residential areas are not mapped as a Park / green space, since they are part of the character of the residential use of those areas, and the open space structure of these blocks is further differentiated in the type assignment (see comments on the Environmental Atlas Maps 06.07/06.08).
City squares / promenades are the public spaces of urban living. City squares serve as places of sojourn for leisure and recreational purposes, as meeting areas, market places etc., and are often located in front of railway stations and other representative public buildings.
7

Promenades are spacious pathways that provide pedestrians and cyclists with space for movement away from road traffic. Promenade may also include some more highly impervious median strips, provided they are not used as parking lots. Squares and promenades generally have a higher degree of imperviousness than parks and green spaces.
A Cemetery includes both areas currently used for burial purposes and former cemeteries, provided they are still recognizable as such.
The data on the inventory of cemeteries in Berlin maintained by the Senate Department for Urban Development and the Environment is the basis for the scope of these areas. Honorary graves and monuments, on the other hand, are not assigned to the area type Cemetery, although they are recorded in the Berlin inventory of cemeteries; they are mapped as Public and special use, and assigned to the area type Culture.
However, cemeteries are not generally considered areas of Public and special use. Only when usually small-scale blocks are largely occupied by a church building, and the surrounding cemetery is only a subordinate feature will a dual use as Public and special use be assigned, in which case the block is then assigned to the area type Church. However, if a church or chapel is located on a large cemetery only in a subordinate function, no dual use is assigned.
Structurally, cemeteries differ from one another mainly in terms of their stock of trees. While older cemeteries and forest cemeteries are essentially characterized by their very old stocks of trees, many newer cemeteries are still largely without larger trees.
The basis for the assignment and delimitation of the category Allotment garden is the data base compiled by the Senate Department for Urban Development and the Environment of Berlin allotment gardens, which record the allotment gardens with appropriate use, as defined by the Federal Allotment Garden Law.
Other areas with similar use characteristics are classified as Weekend cottages and allotment-garden-type use.
A Fallow area is an area that is currently not in use and not maintained, on which variegated stands of vegetation can often develop.
A distinction is made between a Fallow free of vegetation on the one hand, which includes mostly excavations, soil or rubble dumps, or demolition areas, where no vegetation has yet taken root, due to the fact that their utilization has only recently been abandoned. In some cases, the site conditions ensure that no vegetation will enter the area for some time. These may be brownfields where little vegetation grows due to the very high degree of imperviousness, or else sand dunes and beaches, on which spontaneous growth of vegetation occurs only very slowly, due to a lack of nutrients, or due to regular disturbances.
Another category of fallows is Fallow with predominantly meadow-like vegetation. On open brownfield sites, a vegetation of ruderal perennials and grasses often establishes itself during the first few years. Especially on nutrient-poor sites, this vegetation can remain relatively constant over the course of several years. In general, however, unstable conditions prevail.
All brownfield sites which cannot be clearly assigned to one of the other fallow or forest categories are mapped as Fallow with mixed vegetation – meadows, trees, bushes. The development of vegetation on a fallow site depends on many conditions, such as the abiotic site conditions, the initial vegetation and anthropogenic influences, so that on long-fallow sites, various successional stages often alternate within a small area.
If, on the other hand, an area is covered almost entirely with trees, it will be assigned to the category Forest.
The category Sport facility includes both covered and uncovered sports facilities. All sports use areas are at the same time mapped as Public and special use.
Uncovered sports facilities are outdoor facilities used for sports, physical activity and leisure activities. These include not only sports fields, swimming pools and beaches, but also riding, golfing, archery and water sports areas. The latter are characterized by small dockyards, boat and club houses, parking lots etc., with a high proportion of green space. Clearly commercial water sports areas (dockyards, boat-building facilities, etc.) are assigned to the category Commercial and industrial use. Some fairly extensively used beaches (without changing rooms, kiosks, etc.) are assigned to fallow or forest categories.
8

The covered sports facilities include primarily those housed in halls, such as indoor pools and ice skating rinks, and also stadiums and multipurpose halls, in which non-sporting events such as concerts may also be held.
Use Distribution for BerlinThe following tables and figures show the shares of all use types in relation to the total area of Berlin. It should be noted that 1,964 areas have both a land use category of built-up areas (nos. 10 through 90) and of non-built-up areas (nos. 100 through 200).
With this approach, major potential green and open space areas can be displayed on other use areas. This applies particularly to Public and special use sites, Utility areas, Commercial and industrial areas and Traffic areas. These areas are shown on both maps, i.e. differently (cf. the explanations of dual use in the Methodology section).
Since for the evaluation of area shares, each area only once can be considered once, both cases– green priority and construction priority – have been calculated separately.
The calculations are based on the area size data of the ISU. The block areas were calculated with the help of the Geographic Information System (GIS) based on the block segment map ISU5.
Table 2 shows the absolute and percentage area shares of different uses of the total area of Berlin.
Tab. 2: Area shares of different uses of the total area of Berlin,area sizes based on block segment map ISU5, as of December 31, 2015
9

Fig. 1 a+b: Shares of the various use categories of the total area of Berlin,area sizes based on the ISU5 block segment map, analysis based on construction priority, as of December 31, 2015
10

Fig. 1: Shares of the various use categories of the inventory of green and open space, and of the total built-up area of Berlin Area sizes based on the ISU5 block segment map, analysis based on construction priority, as of December 31, 2015
11

In terms of the absolute area of all Berlin boroughs [in ha], the following overview emerges:
Tab. 3: Area shares of different uses of the total area of Berlin [in ha], area sizes based on the ISU5 block segment map (in case of construction priority), as of December 31, 2015
12

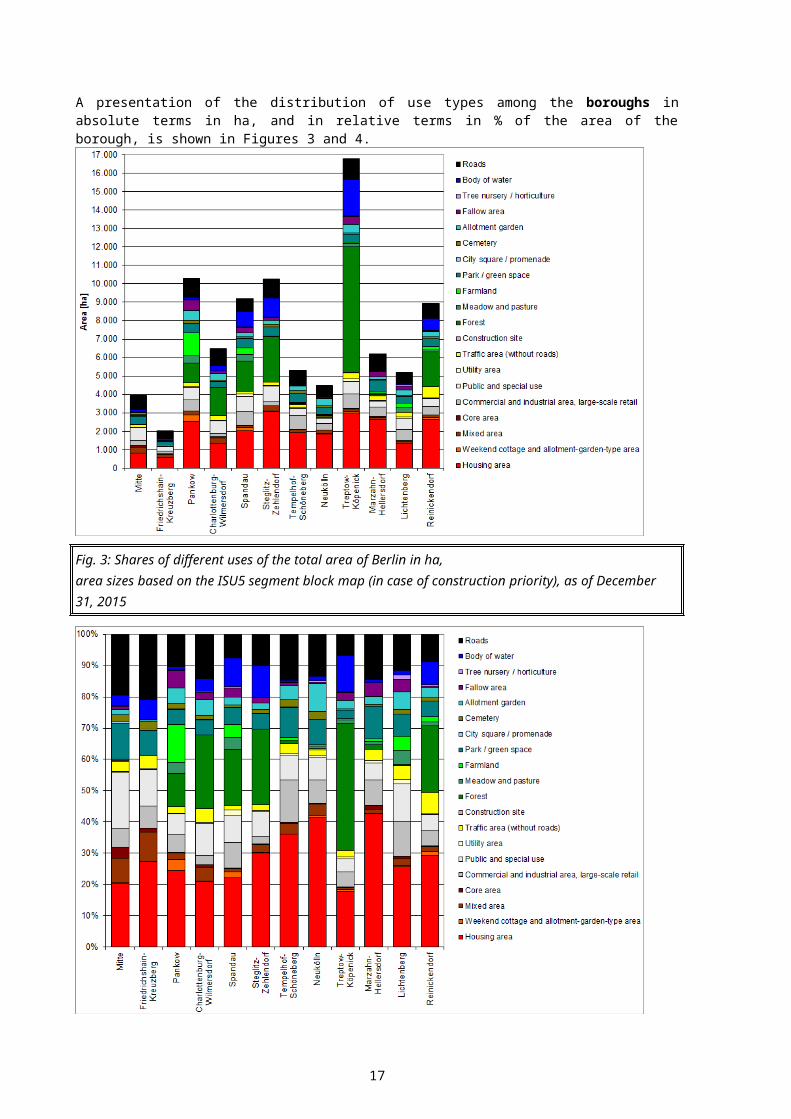
A presentation of the distribution of use types among the boroughs in absolute terms in ha, and in relative terms in % of the area of the borough, is shown in Figures 3 and 4.
Fig. 3: Shares of different uses of the total area of Berlin in ha,area sizes based on the ISU5 segment block map (in case of construction priority), as of December 31, 2015
13

Fig. 4: Shares of different uses of the total area of Berlin in %,area sizes based on the ISU5 segment block map (in case of construction priority)
Land use distribution changes in comparison to the previous editionA comparison with the figures of the Edition 2011 reveals several pointers in how use has changed in Berlin, which allows for more general trends in urban development to be deduced. Hence, growth of 359 ha in block areas with residential use demonstrates increased residential construction activity, which may be explained predominantly by the actual developments since 2010. It is important to note here that the additional subsequent densification within a block of the same use category is not shown at block or block segment level.
The clear decrease in fallow areas of approx. 1,000 ha (Use Type 171, 172, 173) is only partly due to these areas being used for construction purposes. Although some fallow areas are now used as “Detached single-family homes with yards”, “Row houses and duplexes with yards” and “Rental-flat buildings of the 1990s and later” and as commercial areas. The main reason for the decrease in fallow areas, however, is the changed use of Tempelhofer Freiheit and the park facilities at Gleisdreieck, which are now green spaces.
Furthermore, as a result of a more accurate method of determining fallow areas than that applied in Edition 2011, there seem to be changes in use. In a large number of these cases, a comparison with the current green space inventory led to an amendment of the use category to “Park / green space”. This is due to the following: several areas which had previously been identified as fallow areas, could now be recognized as green spaces due to their dedicated use, albeit not being recognizable as such phenomenologically (e.g. by analyzing aerial photography). This is reflected in the area for the use category “Park / green space”, which saw a significant increase by a total of 761 ha. In addition, many areas previously mapped as fallow areas, were now presented as “Meadow and pasture” or “Farmland” according to the current field block register, without necessarily any actual changes in use having taken place. In this regard, too, growth was recorded for “meadow and pasture” (plus 239 ha).
The growth of areas in the category “Weekend cottage and allotment-garden-type use” can be explained by rededication to large extents. Especially in the boroughs of the former East, various former allotments lost their status according to the Federal Allotment Garden Law due to rededication. The increase in “Weekend cottage and allotment-garden-type use” can hence be explained by the decrease in the use category “Allotment garden”. However, two thirds of the decrease in “Allotment gardens” is based on use changes in residential and commercial areas.
The significant decline in the “Traffic area” category is mainly effected by parking lots that were rededicated as residential and commercial areas. Likewise, large hospital areas formerly allocated to the “Public use and special use” category were changed to residential areas.
Overall, however, we cannot reliably determine the extent to which changes in the area shares of the respective uses are due to methodological factors and not due to actual use changes based on the figures. Hence, it is impossible to accurately quantify the proportion of green and open spaces that have been lost due to actual constructional use or change in use, which may have taken place in the period since 2011. The area monitoring (only in German) of the Senate Department for Urban Development and the Environment can provide more detailed findings here.
Description of Map “Actual Use of Built-Up Areas” (06.01)The Map “Actual Use of Built-up Areas” (06.01) shows the different use categories by their shares of the built-up area of Berlin and their distribution throughout the city area (as of December 31, 2015). Figure 5 elucidates the distribution of the use shares further.
More than the half of the built-up area of Berlin is used for housing. Commercial and industrial areas and Public and special uses account for 13 % and 16 %, respectively – still a relatively large share of the built-up area of Berlin. The Traffic areas are next, without the roadways not shown as traffic areas, with 6 %, and then the Mixed areas, with approx. 5 %. Very little space is taken up by the Core areas, Utility areas, Traffic areas, Weekend cottage and allotment garden-type use. The current map contains block areas mapped as Construction site, which only account for a small share of 75 ha, however.
14

In the distribution of the use categories of built-up areas within the urban area, characteristic structures can be recognized. Thus, purely residential or commercial areas exist in the outskirts areas much more frequently than within the City Rail Circle Line; the Mixed and Core area use categories are more heavily represented in the latter. Commercial areas are particularly concentrated along waterways, railroad lines and main roads, due to the more favourable transport conditions. One often finds Mixed areas and scattered Core areas in the old village centres in various parts of the city. Particularly characteristic is the concentration of the Core Areas in both the western city centre around Kurfürstendamm / Tauentzienstraße, and in the eastern city centre area of Alexanderplatz / Friedrichstraße. Public use areas are distributed throughout the entire urban area relatively evenly. Utilitiy areas occur mainly in the outskirts, frequently in the vicinity of commercial areas.
The described structures are also reflected in a comparison of the distribution of the land use categories within the boroughs (cf. Fig. 5).
Fig. 5: Shares of selected use types in the built-up areas of all Berlin boroughs, area sizes based on the ISU5 block segment map (in case of construction priority), as of December 31, 2015
Examples for the characteristic use distribution in the outskirts areas are the boroughs of Marzahn-Hellersdorf and Neukölln, with 63 % and 62 % residential use and 12 % and 13 % industrial use, respectively, while in the borough of Mitte, the borough’s central functions are reflected by its shares of only 32 % Housing areas, but more than 5 % Core area use and approx. 12 % Mixed area use, as well as a high share of Public use facilities (28 %).
This function is not shown so clearly for the western city centre around Kurfürstendamm/ Tauentzienstraße, with Core area shares of only 2 % or less, since that core area is distributed among the three boroughs of Charlottenburg-Wilmersdorf, Mitte and Schöneberg-Tempelhof.
Besides the borough of Mitte, the inner city boroughs of Friedrichshain-Kreuzberg and Charlottenburg-Wilmersdorf have relatively low shares of residential areas, with 42 % and 43 % respectively; correspondingly, the share of public use facilities is very high, with 18 % and 21 %, respectively. Friedrichshain-Kreuzberg and Mitte are the boroughs in which the largest shares of the original mix of uses are most clearly apparent. They are the boroughs with by far the largest Mixed use shares (12 % and 15 %).
15

With 63 % residential use Zehlendorf-Steglitz stands out as a residential borough with a low share of commercial use (5 %).
Description of Map “Inventory of Green and Open Spaces” (06.02)The Map “Inventory of Green and Open Spaces” (06.02), shows the different use categories and their shares of the non-built-up areas of Berlin, as well as their distribution throughout the city.
The largest share of the Inventory of Green and Open Spaces is located in the outskirts of the city, including particularly the large wooded areas of the Grunewald and Düppel forests in the southwest, the Spandau and Tegel forests in the northwest, and the large forest areas in the borough of Köpenick in the southeast of Berlin. Forests account for 38 % of all Green and open spaces. Bodies of water account for 13 % (cf. Fig. 6).
Areas used for agricultural purposes, which account for almost 9 % of the inventory of open space, are found particularly in the north-eastern area (Pankow and Weißensee). Other agricultural areas are located in the remaining outskirts. Allotment gardens, which account for some 8 % of the open space inventory, are found almost exclusively outside the City Rail Circle Line, in the outer boroughs. Often, they are located near canals, rivers and railroad lines. The currently unused fallow areas are distributed throughout the entire urban area, particularly along railroad lines and bodies of water. They account for some 10 % of the total open space. Tree nurseries and horticultural areas are found only in the outskirts, while areas of the categories Sport facility, Cemetery, and Park and green space are located throughout the entire urban area.
The area size of the open spaces increases as one moves from the inner city area toward the outskirts. Moreover, in the outer areas of the city, the various categories of open space are often located adjacent to one another, and thus form larger contiguous open systems, while the various open areas in the inner city usually occur in isolation, and are surrounded by built-up areas. In the inner-city boroughs, the inventory of open space is dominated by parks.
Fig. 6: Shares of selected use types of green and open spaces in the Berlin boroughs,area sizes based on the ISU5 block segment map (in case of green priority), as of December 31, 2015
16
Literature[1] SenStadt (Senate Department for Urban Development Berlin) (Ed.) 2003:
Strategie Berlin 2020 - Stadtentwicklungskonzept; Neuorientierung und Modifikation stadtentwicklungsplanerischer Handlungsansätze [Strategy Berlin 2020: Urban development concept; New orientation and modification of approaches for urban development activity], 2003
[2] SenStadtUm (Senate Department for Urban Development and the Environment Berlin) (Ed.) 2011:Flächenentwicklung in Berlin. 1991 – 2010 – 2030. [Area development in Berlin. 1991 – 2010 – 2030.]Internet:https://www.stadtentwicklung.berlin.de/planen/basisdaten_stadtentwicklung/flaechenmonitoring/download/Flaechenentwicklung_in_Berlin_2010.pdf [only in German](Accessed on 12 December 2016)
[3] SenStadtUm (Senate Department for Urban Development and the Environment Berlin) (Ed.) 2011a: Flächennutzung und Stadtstruktur – Dokumentation der Kartiereinheiten und Aktualisierung des Datenbestandes 2010 [Land use and urban structure – Documentation of the mapping units and update of the data base 2010, Internet:https://www.stadtentwicklung.berlin.de/umwelt/umweltatlas/download/Nutzungen_Stadtstruktur_2010.pdf [only in German](Accessed on 12 December 2016)
[4] SenStadtUm (Senate Department for Urban Development and Environmental Protection Berlin) (Ed.) 2015:Berlin Land Use Plan (FNP Berlin) published January 5th, 2015, FNP explanatory report, Berlin.Internet:https://www.stadtentwicklung.berlin.de/planen/fnp/pix/fnp/fnp_erlaeuterungsbericht.pdf [only in German](Accessed on 12 December 2016)
[5] SenStadtUm (Senate Department for Urban Development and the Environment Berlin) (Ed.) 2016 Bericht zur Bevölkerungsprognose für Berlin und die Bezirke 2015 – 2030, Berlin. [ Report on the population prognosis for Berlin and the boroughs 2015 – 2030, Berlin].Internet:https://www.stadtentwicklung.berlin.de/planen/bevoelkerungsprognose/download/2015-2030/Bericht_Bevprog2015-2030.pdf [only in German](Accessed on 12 December 2016)
[6] SenStadtUm (Senate Department for Urban Development and the Environment Berlin) (Ed.) 2016a: Flächennutzung und Stadtstruktur – Dokumentation der Kartiereinheiten und Aktualisierung des Datenbestandes 2015 [Land use and urban structure – Documentation of the mapping units and update of the data base 2015.Internet: https://www.stadtentwicklung.berlin.de/umwelt/umweltatlas/download/Nutzungen_Stadtstruktur_2015.pdf [only in German](Accessed on 02 February 2017)
Maps[7] SenStadtUm (Senate Department for Urban Development and the Environment Berlin)
(Ed.) 2011b:Berlin Environmental Atlas, revised and extended edition 2011, Map Urban Structure/ Urban Structure differentiated (06.07/08), Berlin.Internet:https://www.stadtentwicklung.berlin.de/umwelt/umweltatlas/eid607.htm(Accessed on 12 December 2016)
17

[8] SenStadtUm (Senate Department for Urban Development and the Environment Berlin) (Ed.) 2016b: Berlin Environmental Atlas, revised edition 2016, Urban Structure/ Urban Structure differentiated (06.07/08), Berlin.Internet:https://www.stadtentwicklung.berlin.de/umwelt/umweltatlas/eie607.htm(Accessed on 19 July 2018)
[9] SenStadtUm (Senate Department for Urban Development and the Environment Berlin) (Ed.) 2016c: Berlin Environmental Atlas, revised edition 2016, Map Actual Use (06.01.1), Berlin.Internet:https://www.stadtentwicklung.berlin.de/umwelt/umweltatlas/eie601.htm(Accessed on 20 July 2018)
[10] SenStadtUm (Senate Department for Urban Development and the Environment Berlin) (Ed.) 2016d: Berlin Environmental Atlas, revised edition 2016, Map Actual Use and Vegetation (06.02.1), Berlin.Internet:https://www.stadtentwicklung.berlin.de/umwelt/umweltatlas/eie601.htm (Accessed on 20 July 2018)
18