041511 2010 annual report.pdf
DESCRIPTION
nnvhkTRANSCRIPT

P W - 1 0 2
M A N I L A E L E C T R I C C O M P A N Y
L O P E Z B U I L D I N G , O R T I G A S A V E N U E ,
P A S I G C I T Y
1 2 - 3 1 1 7 - A 0 5 3 1
Dept. Requiring this Doc.
Total No. of Stockholders
Remarks = pls. use black ink for scanning purposes
S T A M P S
S.E.C Registration Number
Fiscal Year
File Number LCU
CashierDocument I.D.
Domestic Foreign
Total Amount of Borrowings
To be accomplished by SEC Personnel concerned
Secondary License Type, if Applicable
Amended Articles Number/Section
Annual Meeting
COVER SHEET
Contact Person Company Telephone Number
Month Day Month Day
(Company's Full Name)
(Business Address: No. Street City / Town / Province)
ATTY. ANTHONY V. ROSETE 1622-3186
FORM TYPE

TABLE OF CONTENTSTABLE OF CONTENTSTABLE OF CONTENTSTABLE OF CONTENTS
Page No.
PART 1 PART 1 PART 1 PART 1 –––– BUSINESS AND GENERAL INFORMATION BUSINESS AND GENERAL INFORMATION BUSINESS AND GENERAL INFORMATION BUSINESS AND GENERAL INFORMATION
Item 1. Business 5 Item 2. Properties 23 Item 3. Legal Proceedings 52 Item 4. Submission of Matters to a Vote of Security Holders 61
PART II PART II PART II PART II –––– OPERATIONAL AND FINANCIA OPERATIONAL AND FINANCIA OPERATIONAL AND FINANCIA OPERATIONAL AND FINANCIAL INFORMATIONL INFORMATIONL INFORMATIONL INFORMATION
Item 5. Market for Common Equity and Related Stockholders Matters 62 Item 6. Management’s Discussion and Analysis of Financial Condition and Results of Operation 64 Item 7. Financial Statements 122 Item 8. Changes in and Disagreements with Accountants on Accounting and Financial Disclosures 123
PART III PART III PART III PART III –––– CONTROL AND COMPENSATION INFORMATION CONTROL AND COMPENSATION INFORMATION CONTROL AND COMPENSATION INFORMATION CONTROL AND COMPENSATION INFORMATION
Item 9. Directors and Executive Officers 124 Item 10. Executive Compensation 135 Item 11. Security Ownership of Certain Record and Beneficial Owner and Management 137 Item 12. Certain Relationship and Related Transactions 141
PART IV PART IV PART IV PART IV –––– CORPORATE GOVERNANCE CORPORATE GOVERNANCE CORPORATE GOVERNANCE CORPORATE GOVERNANCE
Item 13. Corporate Governance 142
PART V PART V PART V PART V –––– EXHIBITS AND SCHEDULES EXHIBITS AND SCHEDULES EXHIBITS AND SCHEDULES EXHIBITS AND SCHEDULES
Item 14. Exhibits and Reports 154 SIGNATURES 160 INDEX TO FINANCIAL STATEMENTS AND SUPPLEMENTARY SCHEDULES 161

SECURITIES AND EXCHANGE COMMISSIONSECURITIES AND EXCHANGE COMMISSIONSECURITIES AND EXCHANGE COMMISSIONSECURITIES AND EXCHANGE COMMISSION
SEC FORM 17-A
ANNUAL ANNUAL ANNUAL ANNUAL REPREPREPREPORT ORT ORT ORT PURSUANT PURSUANT PURSUANT PURSUANT TO TO TO TO SECTIONSECTIONSECTIONSECTION 17 17 17 17
OFOFOFOF THE THE THE THE SECURITIES SECURITIES SECURITIES SECURITIES REGULATION REGULATION REGULATION REGULATION CODECODECODECODE
AND AND AND AND SECTION SECTION SECTION SECTION 141 141 141 141 OF OF OF OF THE THE THE THE
CORPORATION CORPORATION CORPORATION CORPORATION CODE CODE CODE CODE OF OF OF OF THE THE THE THE PHILIPPINESPHILIPPINESPHILIPPINESPHILIPPINES
1. For the fiscal year ended: December 31, 2010
2. SEC Identification Number: PW-102
3. BIR Tax Identification Number: 350-000-101-528
4. Name of Issuer as specified in its Charter: Manila Electric Company
5. Country of Incorporation: Philippines
6. (SEC use only) Industry Classification Code:
7. Address of principal office: Lopez Building, Ortigas Avenue, Pasig City
Postal Code: 0300
8. Telephone Numbers: 631-5567 Area Code: 0300
9. Former name or former address: Not applicable
10. Securities registered pursuant to Sections 8 and 12 of the SRC or Sections 4 and 8 of the RSA: (as of December 31, 2010)
Number of Shares of
Common Stock Outstanding
1,127,271,117
(As of December 31, 2010)
Amount of Debt Outstanding: P21.22 Billion (as of December 31, 2010)

11. Are any or all of these securities listed on the Philippine Stock Exchange:
YES [ x ] NO [ ]
If yes, state the name of such stock exchange and the classes of securities listed therein:
Philippine Stock Exchange
12. Check whether the issuer:
(a) has filed all reports required to be filed by Section 17 of the SRC and SRC Rule 17 thereunder or Section 11 of the RSA and RSA Rule 11(a)-1 thereunder, and Sections 26 and 141 of The Corporation Code of the Philippines during the preceding twelve (12) months (or for such shorter period that the registrant was required to file such reports);
YES [ x ] NO [ ]
(b) has been subject to such filing requirements for the past ninety (90) days:
YES [ x ] NO [ ]
13. State the aggregate market value of the voting stock held by non-affiliates of the registrant. The aggregate market value shall be computed by reference to the price at which the stock was sold, or the average bid and asked prices of such stock, as of a specified date within 60 days prior to the date of filing. If a determination as to whether a particular person or entity is an affiliate cannot be made without involving unreasonable effort and expense, the aggregate market value of the common stock held by non-affiliates may be calculated on the basis of assumptions reasonable under the circumstance, provided the assumptions are set forth in this Form.
The aggregate market value of voting stock held by non-affiliates of the registrant
as of March 31, 2011:
Shares:
1,127,271,117
Closing Prices: Aggregate:
P258.00 P290.836 Billion

PART I PART I PART I PART I –––– BUSINESS AND GENERAL INFORMATION BUSINESS AND GENERAL INFORMATION BUSINESS AND GENERAL INFORMATION BUSINESS AND GENERAL INFORMATION
Item 1. Business
(1) Business Development
The name of the issuer is Manila Electric Company, also known as Meralco, duly organized on May 7, 1919 under the laws of the Republic of the Philippines. Its core business is distribution of electricity within its franchise area.
Consistent with Meralco’s franchise obligations and applicable laws, subsidiary companies were created to meet the Company’s specific needs for support, service, or enhancement that can either add value, savings, or profitability to, or improve the efficiency of, the core business or mitigate the impact of competition.
The following are the subsidiaries of Meralco, all of them incorporated in the Philippines except for Lighthouse Overseas Insurance Company, Limited.
Meralco Industrial Engineering Services Corporation (MIESCOR) is a subsidiary of Meralco incorporated on December 5, 1973. Miescor, a holder of the highest contractor license Category AAA since 1982, is a contractor/specialist engaged in engineering, construction and maintenance activities related to power generation, transmission and distribution, as well as industrial plants, water resources and telecommunications.
Miescor remains to be Meralco’s reliable provider in electro-mechanical works, engineering, distribution and technical services. It also handles telecommunication projects for Meralco, e-MVI and Philippine Long Distance Telephone Company (PLDT). Among its clients outside Meralco include Bangko Sentral ng Pilipinas (BSP), First Gen Corp., Chevron Philippines, Inc., Maynilad Water Services, Inc., Department of Finance (DOF) and Quezon Power (Phils.) Ltd.
Miescor operations is supported by its subsidiaries: Miescor Builders Inc. (MBI), Landbees Corporation and the recently-established, Miescorrail, Inc. Through their support, Miescor is able to expand and provide more diversified services.
Meralco owns 99% of the company and the remaining 1% by Miescor Provident Fund. Corporate Information Solutions, Inc. (CIS, Inc.) was incorporated in 1974 to provide information technology services and integrated business solutions, focusing on the functional areas that are critical to customers’ business continuity, growth and profitability. In 1997, CIS engaged in the business of bills payment collection which activity was spun off as CIS Bayad Center, Inc. (Bayad Center) formally incorporated in 2006. CBCI is the country’s trailblazer and brand leader in the outsourced over-the-counter (OTC) payment collection industry. With the vision of becoming a global organization and the undisputed leader in transaction-based services, this wholly-owned

Meralco subsidiary is one of the few Philippine companies certified as an “Investor in People” (IiP) by the People Management Association of the Philippines and the UK-based IiP Quality Centre.
Since 1997, Bayad Center continues to be entrusted by top multinational and local organizations with its bills collection requirements. It now accepts payments for over 160 leading brands through its 1,400-strong strategically-located branches nationwide. To complement its bills payment business, Bayad Center now offers electronic wallet services (vehicle insurance), prepaid loading, and applications acceptance.
Moving forward to 2011, Bayad Center will continue to raise the bar in the industry and increase its revenue by forging more strategic corporate partnerships; expanding its branch network in the Philippines and overseas; and introducing innovative business lines. Rockwell Land Corporation (Rockwell Land) is 51%-owned by the Manila Electric Company (Meralco) and 49% by First Philippine Holdings Corporation. Rockwell Land is one of the premier real estate developers in the Philippines. Formed in 1995, Rockwell Land’s ground-breaking master plan transformed the land where Meralco’s former thermal plant was located into a high-end living environment, now referred to as Rockwell Center.
Rockwell Center, the flagship project of Rockwell Land, sits on a 15.5-hectare site in Makati City. It is strategically located between the three major commercial business districts of Makati City, Bonifacio Global City and Ortigas.
In recent years, Rockwell Land has built a strong brand and track record in property development with its most recent projects outside Rockwell Center, namely, The Grove, a 5.4-prime hectare property along E. Rodriguez Avenue (commonly known as C-5 Road) and the Rockwell Business Center within the Meralco Ortigas compound. Its retail and cinema operations provide a continuous revenue stream and growth. Meralco Energy, Inc. (MEI) was established in June 2000 to provide demand-side energy services to Meralco’s key accounts in order to complement its parent company. MEI aims to be the country’s premier energy management company by providing total innovative energy solutions. Included in its mission is to complement Meralco’s vision of uninterrupted energy supply while providing added value through promotion of energy efficiency, renewable energy and innovation.
Presently, it provides a wide array of services related to power factor improvement, facilities management, ice thermal energy system, efficient lighting and renewable energy. It was also able to explore opportunities from emerging technologies that further promote energy efficiency and added key priorities today that focus on energy audit, energy management, HVAC energy solutions, and electric vehicle.
MEI, a wholly-owned Meralco subsidiary, continues to develop superior solutions for various energy related concerns that will allow customers to focus on their core business. e-Meralco Ventures, Inc. (e-MVI) is a 100% owned subsidiary of Meralco. Established on June 22, 2000, it is tasked primarily to leverage Meralco’s Fiber Optic resources and transform them into a profitable new business. It operates a telecommunications infrastructure within the Meralco

franchise area, offering data transport and connectivity services to local and international carriers, internet service providers, data centers and other businesses. eMVI continuously invests for the build-up of a data communication superhighway within Greater Manila Area (GMA) to serve all possible connectivity requirements of different bandwidths and interfaces. It operates on a 1,500 km fiber optic network and has established fiber optic presence in Makati and Ortigas Central business districts by forming alliances with other telecommunications companies.
The services of eMVI include leased line connections, Metro Ethernet connections, disaster recovery transport services and packaged internet bandwidth.
Over the years, eMVI has grown to be the premium data transport provider to the biggest names in the market. It consistently delivers installation lead times that are beyond industry standards and is true to its commitment to operate a future-proof network. Its business has remained profitable and it aims to reach farther, driven to make its mark in the telecommunications industry.
Meralco Financial Services Corporation (Finserve) is a wholly-owned subsidiary of Meralco incorporated on March 19, 2002 to create shareholder value by enhancing the range of value-adding services provided by Meralco through a portfolio of innovative consumer and customer-based products and multi-services that cater to retail and corporate clients.
In servicing the corporate market, Finserve continues to operate its Integrated Direct Marketing (iDM) service which includes direct mail campaigns, targeted advertising and a publication, Current magazine. iDM services are frequently availed by insurance companies, banks, consumer goods companies and educational institutions wanting to reach out to their specific markets.
Also catering to corporate clients, Finserve provides loyalty/rewards program management to aid companies in their marketing and consumer retention programs such as the Meralco Liwanag Card program. Clark Electric Distribution Corporation (CEDC), was organized on February 19, 1997 as a joint venture of Clark Development Corporation (CDC) and Meralco Industrial Engineering Services Corporation (MIESCOR), to serve the requirements of the Clark Economic Zone. As a Freeport Enterprise, Clark Electric is entitled to incentives, including tax and duty-free importation, as may be provided by law, and duly registered with the Incentives Administration Authority of the Freeport Zone under the virtues of Republic Act 9400, “An Act Amending Republic Act 7227, and otherwise known as the Bases Conversion and Development Act of 1992.”
In June 2003, however with the signing of a memorandum of agreement between CEDC, CDC and MIESCOR – with the eventual replacement of CDC by the Angeles Electric Corporation (AEC) – Clark Electric took over and started the integration, distribution and supply of electricity within the Clark Economic Zone.
In 2008, MERALCO took over the shares of MIESCOR in Clark Electric, making the company a 65%-owned subsidiary of MERALCO and 35% owned by Angeles Electric.

Republic Surety and Insurance Company, Inc. (RSIC) is a professional non-life insurance company and a wholly- owned subsidiary of Meralco acquired in 2007 to align with the latter’s recognition of a disciplined approach in managing its risk exposures.
RSIC continues to renew an insurance program that provides coverage to Meralco’s transmission and distribution assets. It aims to be the most dynamic, pro-active risk management and underwriting company – not just for Meralco and its subsidiaries and affiliated companies in terms of synergistic opportunities, but for the insurance industry as a whole, with a commitment to implement risk management methods with the emphasis on risk analysis and mitigation, loss control management and general insurance management.
RSIC is licensed to write the full spectrum of non-life insurance business to include property (fire and allied perils, industrial all risks and commercial all risks) and engineering, casualty, marine and aviation, motor, surety and special packages.
RSIC’s objective is to become an acknowledged leader in the field of risk management and to ensure profitability and market share while adhering to the principles of good corporate governance and corporate social responsibility. It envisions itself to be a total risk solution provider and a major player in the local insurance industry in the near future. Lighthouse Overseas Insurance Company, Limited (LOIL) was incorporated in Bermuda on August 24, 2007. It is registered as a Class 1 insurer under The Bermuda Insurance Act 1978 and Related Regulations and received its license to operate in the territory in March 2008. As Meralco’s captive Reinsurer, LOIL serves as the vehicle to reinsure its parent company’s major catastrophic risk exposure. Together with RSIC, LOIL is part of Meralco’s business risk management model.
[2] [2] [2] [2] Business of Issuer
The principal business of Meralco is the distribution and sale of electric energy through its
distribution network facilities in its franchise area. Its market is categorized into four (4) sectors, with their respective contributions to sales as follows:
2010 2009 2008
RESIDENTIAL 31.54% 32.36% 31.87%
COMMERCIAL 39.11% 39.69% 39.21%
INDUSTRIAL 28.88% 27.43% 28.40%
STREETLIGHTS 0.47% 0.52% 0.52%
TOTAL 100.00% 100.00% 100.00%
Meralco buys power from different power suppliers in the following proportions (in terms of
kWh):

2010 2009 2008
NATIONAL POWER CORPORATION
20.20% 34.37% 44.21%
FIRST GAS POWER CORP. and FGP CORPORATION
34.50% 37.01% 38.00%
QUEZON POWER (PHILS.) LTD. 10.29% 9.01% 9.19%
WHOLESALE ELECTRICITY SPOT MARKET (WESM)
14.02% 12.75% 8.58%
AES CORPORATION (MASINLOC)
4.05% 3.78% 0.00%
THERMA LUZON, INC. (PAGBILAO)
6.04% 1.26% 0.00%
SOUTH PREMIER POWER CORPORATION (ILIJAN)
4.29% 0.00% 0.00%
AP RENEWABLES, INC. (MAKBAN)
2.27% 1.49% 0.00%
SAN MIGUEL ENERGY CORPORATION (SUAL)
1.91% 0.17% 0.00%
SEM-CALACA POWER CORPORATION (CALACA)
2.38% 0.14% 0.00%
PHILIPPINE POWER AND DEVELOPMENT COMPANY
0.01% 0.01% 0.02%
MONTALBAN METHANE POWER CORPORATION
0.04% 0.01% 0.00%
TOTAL 100.00% 100.00% 100.00%
The franchise area of Meralco over specified areas in Luzon is approximately 9,337 square kilometers, covering 31 cities and 80 municipalities. This includes Metro Manila in the National Capital Region, industrial estates and suburban and urban areas of the adjacent provinces.
Government Approval of Principal Products or Services
On June 9, 2003, then President Gloria Macapagal-Arroyo signed into law Republic Act (RA) No. 9209, otherwise known as the “Manila Electric Company Franchise” which took effect on June 28, 2003 and granted the Company a 25-year franchise to construct, operate, and maintain an electric distribution system in the cities and municipalities of Bulacan, Cavite, Metro Manila, and Rizal and certain cities, municipalities, and barangays in the provinces of Batangas, Laguna, Pampanga, and Quezon.
On October 20, 2008, the Energy Regulatory Commission (ERC) granted the Parent
Company a consolidated Certificate of Public Convenience and Necessity (CPCN) for the operation of electric service within its franchise coverage, effective until June 28, 2028, to coincide with the Parent Company’s congressional franchise.
Meralco is involved in the distribution and supply of electricity and is subject to the rate-
making regulations and regulatory policies of the ERC. The Parent Company’s billings to customers are itemized or “unbundled” into a number of bill components that reflect the various costs incurred in providing electric service.

The adjustment of each bill component is governed by mechanisms promulgated and
enforced by the ERC, mainly: (i) the “Rules Governing the Automatic Cost Adjustment and True-up Mechanisms and Corresponding Confirmation Process for Distribution Utilities”, which govern the recovery of pass-through costs, including over- or under-recoveries in the following bill components: Generation Charge, Transmission Charge, System Loss Charge, Lifeline rate subsidies, Local franchise & business taxes; and (ii) the “Rules for the Setting of Distribution Wheeling Rates (RDWR)”, as modified by ERC Resolution No. 20, Series of 2008, which govern the determination of the Company’s Distribution, Supply, and Metering Charges.
Effect of Existing and of Probable Governmental Regulations on the Business
Supreme Court (SC) Decision on Unbundling Rate Case
On May 30, 2003, the ERC issued an Order approving the Company’s unbundled tariffs that resulted in a total increase in distribution-related rates of P0.17 per kWh over May 2003 levels. Subsequently, on August 4, 2003, certain consumer and civil society groups filed with the Court of Appeals (CA) a “Petition for Review” of the ERC’s ruling. On July 22, 2004, the CA set aside the ERC’s ruling and remanded the case back to the ERC. According to the CA, the ERC should have asked the Commission on Audit (COA) to audit the books of the Company. The ERC and the Company filed separate motions asking the CA to reconsider its decision, but the CA denied both motions; thus, the ERC and the Company elevated the case to the Supreme Court of the Philippines (SC).
In an En Banc Decision promulgated on December 6, 2006, the SC set aside and reversed
the CA ruling, saying that a COA audit was not a prerequisite in the determination of a utility’s rates. However, while the SC affirmed the ERC’s authority in rate-fixing, the SC also recognized the potential social impact of the matter. Thus, the SC directed the ERC to request COA to undertake a complete audit of the books, records, and accounts of the Company. On January 15, 2007, in compliance with the SC’s directive, the ERC engaged the COA to conduct an audit of the Company.
The COA audit, which began in September 2008 was completed in August 2009. In an Order dated February 15, 2010, the ERC directed all intervenors in the case to
submit their respective comments on the COA’s Final Audit Report within fifteen days of receiving a copy.
The Company has already submitted its comment on the COA audit report. Similarly, the intervenors have filed their comments to the COA audit report and the Company has responded to the same. The Company is awaiting the action of the ERC on the COA Audit Report.
Transition to Performance-Based Regulation
The Rules for Setting Distribution Wheeling Rates (RDWR), formerly known as the Distribution Wheeling Rate Guidelines (DWRG), embodies a new rate-setting methodology known as Performance-Based Regulation, or PBR. Under the previous Return on Rate Base (RORB) methodology, utility tariffs were based on historical costs plus a reasonable rate of return. On the

other hand, the PBR scheme sets tariffs according to forecasts of capital and operating expenditures to meet a predetermined level of operational performance. The RDWR also penalizes or rewards a utility, depending on its technical and customer service performance. The Company, along with the Dagupan Electric Corporation (DECORP) and Cagayan Electric Power and Light Company (CEPALCO), is a pioneer of PBR in the Philippines.
On August 31, 2007, the ERC issued its Final Determination on Meralco's PBR application,
paving the way for the implementation of the performance incentive scheme and price control arrangements for the Second Regulatory Period (from July 1, 2008 to June 30, 2011). The approved Maximum Average Prices (MAP) were P1.167 per kWh, P1.260 per kWh, P1.361 per kWh, and P1.471 per kWh for the Regulatory Years (RY) 2008, 2009, 2010, and 2011, respectively.
On January 11 and April 1, 2008, the Company subsequently filed separate applications for its proposed translation of the MAP for RY 2008 and 2009, respectively, into different rate schedules for various customer segments. In October 2008, the ERC approved a MAP for the RY 2009 of only P1.2280 per kWh to avoid price shocks and mitigate the rate impact on end-users. The ERC also directed the Company to implement its approved Distribution, Supply, and Metering Charges.
However, the ERC, acting on a motion filed by a group of electricity consumers, deferred the implementation of the approved charges until such time that the ERC can resolve a Motion for Reconsideration (MR) to be filed by the group. The Company eventually received a copy of the consumer group’s MR, to which we filed an Opposition on November 19, 2008. Another intervenor, representing large business consumers, similarly filed an MR on the ERC’s ruling
On April 23, 2009, the ERC resolved the MRs filed by the various consumer groups. The ERC amended its earlier approved MAP for RY 2009 to P1.227 per kWh, which reflects a zero Corporate Income Tax (CIT) component. Further, the ERC also revised downward the previously approved rates for residential end-users, to mitigate the impact of the rate adjustment, and aligned the tariff design closer to ‘cost-to-serve’. Implementation of the approved rates began in May 2009.
On May 28, 2009, a number of consumer groups filed a Petition before the Court of
Appeals to question the ERC’s Decision and Order on the RY 2009 MAP and rate translation application. Eventually, in a Decision dated January 29, 2010, the Court of Appeals dismissed the consumer groups’ Petition, saying:
• While the petitioners question the Decision and Order, what they were actually assailing was the shift to PBR methodology and the factors considered in the determination of Meralco’s Annual Revenue Requirement (ARR), which had been settled in ERC’s Final Determination. The Final Determination had long become final and executory;
• An evaluation of the assumptions used in the approval of Meralco’s rate unbundling is no longer required in this case, since the unbundling used a methodology that had already been abandoned by the adoption of the PBR methodology;
• The ERC’s RY 2009 rate translation rulings were issued after the conduct of the necessary proceedings and were rendered on the basis of the ERC's independent evaluation of the

evidence presented. The rule is well-settled that findings of fact of administrative agencies and quasi-judicial bodies that have acquired expertise because their jurisdiction is confined to specific matters are generally accorded not only great respect but even finality;
• ERC need not wait for the COA audit report on Meralco’s rate unbundling before it could approve Meralco’s rate translation application under PBR. The ERC’s Final Determination is separate and distinct from the Unbundling Decision where a COA audit report was required; and,
• A rate rollback and refund simply on the ground that Meralco’s financial statements for 2003 to 2007 purportedly showed excessive profits cannot be allowed. The ERC had already reviewed the Parent Company’s rate of return and found the petitioners' contention without basis. Meanwhile, on August 7, 2009, the Company filed a petition for the verification of the MAP
for RY 2010 and its translation into tariffs by customer category. In accordance with the ERC’s “Guidelines for RY2010 Rate Reset for First Entrant DUs”, the constrained MAP for RY 2010 was computed to be P1.4917 per kWh.
In a Decision dated December 14, 2009, the ERC approved the Company’s application
and directed the Company to, among other things, adopt the MAP for RY2010 of P1.4917/kWh and implement its approved Distribution, Supply and Metering Charges for its various customer classes starting January 2010 billing.
However, on January 26, 2010, your Company filed a manifestation at the ERC that it will suspend its implementation of the recently-approved MAP for RY 2010. The manifestation is in view of a Motion for Reconsideration (MR) filed by an intervenor on the said decision.
On February 1, 2010, the ERC granted the manifestation, saying that the suspension of the RY 2010 MAP implementation will be until such time that the ERC has resolved the pending MR and addressed all other issues that the other intervenors may raise on the December 14, 2009 decision. While a hearing on the MR was held on February 5, 2010, no intervenors appeared during the hearing. During the hearing, the ERC granted Meralco and other parties to the case 15 days to file their comments on the MR filed by one of the intervenors, Engr. Robert Mallillin. ERC also granted all the intervenors 15 days to comment on the comparison of rates that will be submitted by Meralco. On March 10, 2010 the ERC resolved the pending MR and lifted the suspension of the RY 2010 MAP implementation. The ERC revised the rate schedules to better ensure that there will be no cross-subsidies, other than the lifeline subsidy, in Meralco’s rates, while maintaining a MAP of P1.4917 per kWh. The implementation of the RY 2010 MAP resumed in April 2010.
On April 5, 2010 Meralco filed a verification and translation application for RY 2011, proposing a MAP of P1.6464 per kWh. Hearings were concluded last May 31, 2010 and the ERC ruled on the petition on December 6, 2010. The ERC adopted Meralco’s RY 2011 MAP of P1.6464 per kWh, limited by the side constraints, and S-factor of P 0.0087 per kWh. Meralco implemented the approved rates starting January 2011.

Third Regulatory Period Reset Application. On June 18, 2010, Meralco filed its Application for the approval of the Annual Revenue Requirement (ARR) and Performance Incentive Scheme (PIS) for the Third Regulatory Period (July 1, 2011 to June 30, 2015). Jurisdictional and expository hearings on the case were held last July 14 - 15 and August 9 - 10, 2010, initial pre-trial conference on August 11, 2010, and evidentiary hearings on October 19 and 21, 2010.
The Reset Application incorporates distribution rate under-recoveries incurred by Meralco for RYs 2008 to 2010. In accordance with the ERC’s Rules for Setting Distribution Wheeling Rates (RDWR), as amended, these under-recoveries, estimated at approximately P18,000 million, will be collected over the duration of the Third Regulatory Period.
On January 11, 2011, the ERC released its “Draft Determination” on Meralco's Reset Application for public comments. Public consultations were held on February 7 and March 15, 2010. Thereafter, a “Final Determination” will be released, which will set forth the ERC’s approval on Meralco’s ARR, PIS, and MAPs for the Third Regulatory Period, and Meralco will file its Rate Translation Application, which rates are scheduled to be implemented starting the July 2011 billing. Under-recoveries in Pass-Through Costs
Generation Cost Under-recoveries. During the suspension by the ERC of the Automatic Generation Rate Adjustment (AGRA), the Company filed 10 separate applications for the full recovery of generation costs, including value-added tax (VAT), incurred for the supply months of August 2006 to May 2007, which resulted in under-recoveries of P12,679 million for generation charges and P1,295 million for system loss charges.
On January 18, 2008, the ERC allowed the Company to collect P8,829 million of generation charges through a P0.1662 per kWh charge to customers. The charge was implemented beginning February 2008 and continued until January 2010, by which time the amount was fully collected.
On September 3, 2008, an ERC Decision on the remaining P3,850 million of generation charge under-recoveries directed the Company to recover P1,149 million, plus P813 million carrying charges. However, a portion of the Company’s purchases from the Wholesale Electricity Spot Market (WESM) for the period December 2006 to May 2007, amounting P2,701 million of the total amount applied for, was disallowed. Further, the Company was ordered to file a separate application for recovery of P1,295 million of system loss adjustments after the ERC confirms the average transmission rate to be used in the calculation of the system loss rate.
Meralco filed a Motion for Partial Reconsideration on the disallowance of P2,701 million because it believed that these were just and reasonable pass-through costs recoverable from its consumers. On September 21, 2010, the ERC released an Order dated August 16, 2010 granting Meralco’s Motion for Partial Reconsideration. The Order authorized Meralco to collect from its customers the additional generation cost for the period August 2006 to May 2007 of P3,371 million, inclusive of carrying charges.

Meanwhile, during the supply month of February 2010, the cost of generation went up to P6.7704 per kWh and would have translated into a generation charge of P6.76 per kWh for the March 2010 bills to customers an increase of P1.83 per kWh from the preceding month’s level.
The higher generation cost was mainly due to the cost of power sourced from the WESM, which increased from P6.08 per kWh in the January 2010 supply month to P12.16 per kWh in February. Contributing to the tightness in generation supply was the de-rating of almost all hydroelectric power plants in Luzon due to the El Niño phenomenon. The scheduled maintenance shutdown of the Camago-Malampaya pipeline starting February 10, 2010 and some other power plant units also curtailed supply. During the pipeline’s outage, the natural gas plants had to run higher-priced condensate fuel to continue power production.
To mitigate the impact to consumers of the higher generation cost, Meralco petitioned to the ERC on March 9, 2010 that it be allowed deferred recovery of the fuel cost differential pertaining to the use of condensate by the First Gas plants, equivalent to P1,046 million. Under Meralco’s petition, the recovery of this fuel cost differential would be spread over six months starting April 2010, so that the increase in the generation charge would be tempered from P1.83 to P1.38 per kWh.
On March 10, 2010, the ERC issued an Order modifying Meralco’s proposal. In addition to approving the deferred recovery of the condensate cost differential, the ERC limited to the NPC average rate the pricing of WESM purchases beyond 10%. The ERC said that this WESM cost differential amounting to about P1,120 million would undergo further evaluation by the Commission. Thus, the ERC provisionally approved a March 2010 generation charge of P5.8417 per kWh. The hearings on this case have been terminated and Meralco has filed its formal offer of evidence. Meralco is awaiting the ERC’s final decision on the matter of recovery of WESM purchases beyond 10% of Meralco’s total energy requirement. Recovery of Transmission Cost Under-recoveries. In September 2007, Meralco filed an application to recover P5,554 million in transmission charge under-recoveries accumulated between June 2003 to July 2007, along with a corresponding carrying cost. The application was brought about by the implementation of the “Guidelines for the Adjustment of Transmission Rates by Distribution Utilities,” which did not address the current and accumulated over-or under-recoveries in the collection of the transmission charge.
From August 2007 to March 2008, your Company continued to incur additional under-recoveries of P1,868 million. However, beginning April 2008 up to April 2009, over-recoveries of P6,396 million were accumulated, for a net over-recovery of P4,528 million. To address this, on July 29, 2009, the Company filed a petition for the confirmation of transmission charges imposed on customers from August 2007 to April 2009. It also proposed to offset the over-recoveries against the under-recoveries covered in its September 26, 2007 petition, which would result in a net under-recovery of 1,026 million, exclusive of carrying costs.
On October 21, 2009, the ERC issued its decision on the Company’s application to recover P5,554 million of transmission cost under-recoveries covering the period June 2003 to July 2007. The approval is net of certain disallowances by the ERC, which the ERC said the Company failed
to fully substantiate. The Company subsequently filed a Motion for Partial Reconsideration on October 30, 2009, and presented evidences to provide additional explanation and substantiation of the amounts disallowed by the ERC.
Also, on October 21, 2009, the ERC released an Order on a separate application of the Company to offset transmission cost over-recoveries of P4,528 million covering the period August 2007 to April 2009 against the under-recoveries being claimed. The ERC provisionally approved the offsetting proposal and directed the Company to refund over-recoveries amounting to P4,917 million and carrying costs of P257 million. Meralco has filed a manifestation of its intention to implement the Order, without prejudice to the outcome of the October 30, 2009 Motion for Partial Reconsideration and the hearing on the merits for this offsetting. The Company implemented the Decision starting the November 2009 billing.
On December 29, 2009, Meralco received an Order dated December 14, 2009 granting with modification its Motion for Partial Reconsideration of the Decision dated October 12, 2009. In the Order, the ERC reconsidered its earlier Decision and confirmed the total under-recoveries of Meralco in the transmission charges for the period June 2003 to July 2007 in the revised amount of P5,418 million and carrying costs amounting to P1,507 million.
The Company implemented the foregoing Decisions starting November 2009. As at December 31, 2010, the Company is yet to recover P88 million of such under-recoveries and carrying charges. Recovery of Under-recoveries in the Implementation of the Inter-Class Subsidy Removal. Meralco filed a petition for authority on November 14, 2007 to recover P1,054 million of under-recoveries and a corresponding carrying charge, incurred in implementing the Inter-Class Cross Subsidy system.
On November 27, 2009, ERC released its Decision dated November 16, 2009. The Decision approved with modification Meralco’s application, and authorized Meralco to collect the total inter-class cross subsidy under-recovery covering the period June 2003 to October 2006 amounting to P1,048 million, equivalent to P0.0103/kWh. The Decision was implemented beginning the December 2009 billing. Recovery of Under-recoveries in the Implementation of the Lifeline Rates. Finally, on February 19, 2008 the company filed an application with the ERC for the collection of the under-recoveries incurred in the implementation of the lifeline subsidy rate amounting to P864 million, with a corresponding carrying cost.
On November 27, 2009, ERC released its Decision dated November 16, 2009. The Decision approved with modification Meralco’s application, and authorized Meralco recover the total lifeline subsidy under-recovery covering the period June 2003 to December 2007 amounting to P856 million, equivalent to P0.0068/kWh. The Decision was implemented starting the December 2009 billing.

Revision of System Loss Caps
On December 8, 2008, the ERC promulgated Resolution No. 17, Series of 2008, entitled “A Resolution Adopting a New System Loss Cap for Distribution Utilities,” where it resolved to lower the maximum rate of system loss (technical and non-technical) that a utility can pass on to its customers. In the Resolution, the new system loss cap for private utilities shall be the actual system loss but not to exceed 8.5%, starting January 2010, one percentage point lower than the then system loss cap of 9.5%.
The Resolution further stated that company use of electricity shall be treated as part of operation and maintenance expenses in the next reset for utilities under PBR and that the manner by which the utility will be rewarded for its efforts in system loss reduction shall be addressed in the Performance Incentive Scheme (PIS) under PBR.
In a letter dated August 11, 2009, Meralco wrote to the ERC to appeal for a deferment of the imposition of the 8.5% system loss cap in 2010. In the letter, Meralco said that the confluence of certain developments that are beyond the Company's control will make it difficult for Meralco to comply with the new cap in 2010. In particular, the abrupt and substantial decline in industrial energy sales brought about by the economic downturn has reduced Meralco's high voltage sales. This is being aggravated by the continued increase in residential sales, which has pushed up the share of low voltage energy sales to the total consumption in the Meralco area. Meralco had further proposed that, "if there has to be a reduction in the cap, we propose that it be set at no loess than 9.0 percent, consistent with Republic Act No. 7832, until such time that caps based on the technical considerations identified in Republic Act No. 9136 can be determined."
In a letter dated November 23, 2009, while agreeing with the adverse impact on system loss of the reduced share of high voltage sales, the ERC replied that "both the existing and the proposed new caps were set regardless of whether or not the franchise area is highly urbanized". The letter further said that there are "more than sufficient means and incentives" for DUs like Meralco to deter or curb electricity pilferage. As a result, the Commission denied Meralco's request for a deferment of the cap.
On December 8, 2009, the Company filed a Petition to Amend the said Resolution with an urgent prayer for the immediate suspension of the implementation of the new system loss cap of 8.5% starting January 2010. The proposed amendment is aimed at making the Resolution consistent with the provisions of Republic Act No.9136 and Republic Act No. 7832, by increasing the level of system loss cap to not less than 9%. On November 18, 2010, the first and only hearing on the Petition was conducted by the ERC. Thereafter, Meralco was directed to submit its Formal Offer of Evidence (FOE). The Petition is awaiting the resolution by the Commission. Power Supply Option Program
On May 23, 2008, Meralco, together with other industry players, filed a Petition with the ERC for the implementation of Interim Open Access (IOA) in the Luzon and Visayas grids, in accordance with a proposed “Terms of Reference of the Interim Implementation of Open Access”. The Terms of Reference had been adopted by various energy industry players and stakeholders during the 2008 Energy Summit. The Petition sought to allow the eligible customers with an

average peak demand of 1 MW and up to contract and purchase their electricity requirements from Eligible Generating Companies through Retail Electric Suppliers. Eligible Generation Companies are generation companies which meet the mandated generation market share caps of EPIRA. In a Decision dated November 10, 2008, the ERC renamed IOA as the Power Supply Option Program (PSOP) and approved the Petition subject to the following conditions:
• Distribution utilities shall act as the default supplier and be accountable for the accounting and settlement of imbalances.
• The PSOP shall initially be implemented within the Luzon Grid.
• The implementation of the PSOP shall commence from the transfer of the operation of the Calaca privatized NPC generation assets.
• The PSOP shall cease to be operational upon commencement of actual Open Access and Retail Competition. All contracts and related transactions shall automatically terminate once actual Open Access and Retail Commission is declared by the ERC.
• The PSOP shall be strictly implemented in accordance with program rules to be promulgated by the ERC.
Meanwhile, on January 23, 2009, Suez Energy, the winning bidder of the 600-megawatt
Calaca coal-fired power plant, backed out from the deal to purchase the asset. In light of this development, the ERC on March 12, 2009 directed the PSOP proponents to submit comments on whether the precondition of privatizing Calaca will be maintained. The proponents, including your company, indicated that they are inclined to maintain the said precondition.
On September 14, 2009, the ERC released an Order stating that it takes judicial notice of the prospective sale and transfer of Calaca which could actually increase the number of competing entities in the PSOP should the winning bidder be a new player. The Order also states that the PSOP shall commence 90 days after completion of either of the following conditions, whichever comes earlier:
a) The transfer of the operation of the Calaca Generation Assets to the private generation companies concerned or its equivalent in terms of capacity; or
b) The privatization of at least 70% of the total capacity of generating assets of NPC in Luzon and Visayas.
Eventually, on December 3, 2009, the Power Sector Assets and Liabilities Management
Corporation (PSALM) turned over the 600-MW Calaca Coal-Fired Power Plant to Sem-Calaca Power Corporation, after the conduct of a negotiated sale of the power plant. Thus, the target commencement date for PSOP shall be on March 4, 2010.
On January 25, 2010, ERC approved the “Rules for the Power Supply Option Program (PSOP)”. According to the approved Rules, participating suppliers will not be required to be direct WESM members. The ERC also removed the provisions on retail settlement from the approved PSOP Rules. However, on January 27 2010, the ERC directed the PSOP proponents to submit to ERC harmonized procedures for retail settlement by February 23, 2010.

On February 26, 2010, the Philippine Electricity Market Corporation filed a Manifestation with the ERC, taking the position that it could not exercise a role beyond that of market operator under the WESM Rules. PEMC, however, stated that it was willing to provide data to the distribution utility (DU) or Supplier to calculate the settlement amounts of PSOP customers.
Meanwhile, on the same date, Meralco filed a Manifestation with the ERC, taking the
position that the PEMC is best suited to take on the role of the Settlement Agent because it has the necessary infrastructure, systems, procedures and policies to fulfill the role. The ERC released an Order on March 8, 2010 directing other Petitioners to comment on the Manifestations. The matter is still pending with the ERC. PEZA-ERC Jurisdiction
Meralco and the Private Electric Power Operators Association (PEPOA) had been holding compromise talks with the Philippine Economic Zone Authority (PEZA) to resolve the injunction case filed by the distribution utilities at the Pasig Regional Trial Court (RTC) against PEZA’s registration and open access guidelines namely, the “Guidelines in the Registration of Electric Power Generation Facilities/Utilities/Entities Operating Inside the Ecozones” and the “Guidelines for the Supply of Electric Power in Ecozones.”
The foregoing Guidelines effectively give PEZA franchising and regulatory powers in ecozones. PEZA can potentially carve out ecozones from a DUs’ service coverage and allow entities other than the franchise DU to provide distribution service within ecozones. PEZA may also set the tariffs and operating parameters of such electric distribution service providers. The situation may be aggravated by PEZA declaring additional ecozones in a DUs’ franchise area.
After a series of negotiations between PEPOA, your Company, and PEZA, the parties agreed to settle their differences. Through a letter dated June 6, 2008 from PEZA Director General Lilia B. De Lima, PEZA proposed the following to address the concerns of the PEPOA and the Company:
1. In the case of power utilities or entities currently operating a power distribution system inside the ecozone, the PEZA Board shall approve the registration of such entities upon compliance of all registration requirements.
2. The franchised distribution utility operating immediately outside a newly proclaimed ecozone shall have the right of first refusal to operate a power distribution system subject to compliance with all registration requirements.
3. Until such time that PEZA has fixed the appropriate Electric Power Distribution Charge, the current distribution and other distribution related charges shall prevail.”
These proposals were accepted by Meralco through a letter dated June 30, 2008, with
clarification on item no. 3, which the Company proposed to be rephrased as follows:
“Until such time that PEZA and ERC have agreed on principles of asset recognition and boundaries for rate-setting and PEZA has fixed the appropriate distribution charge, the prevailing distribution and other distribution-related charges, as may be adjusted in accordance with ERC’s guideline, shall apply.”

In a response letter dated July 3, 2008, PEZA Director General Lilia De Lima accepted this counter-proposal. Subsequently, the Company and PEPOA filed their motions to withdraw as plaintiffs in the case. Pending resolution of both motions, the Philippine Independent Power Producers Association (PIPPA) filed a Motion for Intervention, which was granted by the Court on September 2, 2008. Currently, both motions to withdraw by the Company and PEPOA are awaiting decision by the Court.
Meantime, in support of the government’s objective of providing lower cost power to ecozone locators, the Company entered into a Memorandum of Agreement with the NPC on September 17, 2007 for the provision of special ecozone rates to high load factor PEZA-accredited industries. The ERC allowed the immediate implementation the program.
On March 6, 2009, Meralco submitted an Application for Registration to PEZA to apply as an Economic Zone Utilities Enterprise for the establishment, operation, and maintenance of distribution facilities at the Carmelray Industrial Park II (CIP II) Special Economic Zone. This was in preparation for the turn-over of electric distribution and supply services within CIP II from CIP Power to Meralco. The PEZA Board subsequently approved the application via its Resolution No. 09-161, subject to the Company’s signing of a Registration Agreement under certain terms and conditions.
On January 18, 2010, Meralco signed the Registration Agreement with PEZA as an Economic Zone Utilities Enterprise at CIP II in Calamba, Laguna. Shutdown of TransCo's Sucat-Araneta Transmission Line
The Sucat-Araneta-Balintawak 230kV Transmission Line Project was conceptualized in the early 1990s to improve the overall electric system reliability and efficiency in Metro Manila. The construction of the said transmission line started in 1994 and was finished and energized in July 2000. This line completes the 230kV line loop within Metro Manila and addresses the congesting electricity traffic in the metropolis due to ever growing demand for electricity. The project has two main parts: (1) the Araneta to Balintawak leg; and (2) the Sucat to Araneta leg. Prior to 2001, the authority and responsibility to operate and develop the nationwide grid belonged to NPC. Upon the effectivity of EPIRA in June 2001, this authority and responsibility were transferred to the National Transmission Corporation.
The distribution lines of the Company are “physically connected” to the transmission grid of TransCo. More importantly, the Company’s distribution facilities are configured to operate in synchronicity with the lines of TransCo. The subject Sucat-Araneta-Balintawak 230kV Transmission Line is one of the important lines of TransCo and is located in the heart of your Company’s franchise area. Thus, the unrestrained operation of the said line is very vital to Company’s ability to deliver continuous electricity to every household and business establishment within its franchise area.
On March 10, 2000, the residents of Tamarind Road, Dasmariñas Village, Makati filed a case with the Regional Trial court of Makati City (RTC-Makati) against the National power Corporation (NPC) to enjoin the latter from further preparing and installing high voltage cables to the steel pylons erected near the plaintiffs’ homes and from energizing and transmitting high

voltage electric current through said cables, citing alleged health risks and danger posed by the same. On March 13, RTC-Makati initially issued an order directing the parties to maintain the status quo, and three weeks later granted the preliminary injunction prayed for by the plaintiffs. However, the CA subsequently reversed the orders. On appeal, the SC, in its Order issued on March 23, 2006, reinstated the orders of the RTC-Makati restraining NPC.
When the aforesaid Order of the SC became final, the plaintiffs then moved for the execution of the orders rendered by RTC-Makati. Subsequently, a writ of execution was issued on October 13, 2008 by RTC-Makati. The Company, although initially not a party to the case, was constrained to file an Omnibus Motion (1) for Leave to Intervene and to admit Answer in Intervention, (2) to lift orders, and (3) to maintain status quo due to the significant impact of the de-energization of the Sucat-Araneta line to the public and the economy. In the said Omnibus Motion, your Company argued that the shutdown of the 230 kV line would result in widespread and rotating brownouts across its franchise area, including the major financial districts in Metro Manila. Likewise, as much as 505 MW capacity from power plants from the south would be prevented from running their full capacities, resulting in a much higher additional purchased power cost for the Company which, in turn, would translate to significant increase in the price of electricity charge to its consumers.
On November 28, 2008, the RTC-Makati issued an Order accepting the Company’s Omnibus Motion and holding in abeyance the writ of execution until after the trial court finally rules on the Company’s Omnibus Motion for intervention and other incidents.
On September 11, 2009, the RTC-Makati issued an Omnibus Order dated September 8, 2009, granting the motions for intervention filed by the Company and the National Grid Corporation of the Philippines (NGCP) and dissolved the Writ of Preliminary Injunction issued pursuant to the Orders of the trial court dated April 3, 2000 and October 13, 2008 upon the posting of a counter bond by defendant NPC in the amount of P10.0 million, intervenors Meralco and NGCP in the amount of P2.5 million each, subject to the condition that defendant NPC and intervenors will pay all damages which the plaintiffs may suffer by the dissolution of the Writ of Preliminary Injunction. Expanded Senior Citizens Act of 2010 (ESCA)
Republic Act No. 9994, otherwise known as the Expanded Senior Citizens Act of 2010 (ESCA), was signed into law on February 16, 2010. The ESCA amends certain provisions of Republic Act No. 9257, which mandates the grant of benefits to senior citizens and to institutions catering to senior citizens.
The ESCA grants senior citizens a minimum 5% discount on the monthly electric bill, for services that are registered in the name of the senior citizen and whose monthly consumption does not exceed 100 kWh. Moreover, the law gives a discount of at least 50% on the consumption of electricity by senior citizens centers and residential care/group homes.
The ESCA took effect on April 22, 2010 and its Implementing Rules and Regulations (IRR) were promulgated by the Department of Social Welfare and Development (DSWD) on June 18, 2010. The IRR provides that utility-regulatory agencies (such as the ERC) shall, within six months after the IRR takes effect, “formulate supplemental guidelines to cover recovery rate mechanisms

and/or sharing of burden, among other concerns of the distribution utilities,” in the implementation of the discounts provided under the law.
On January 5, 2011, the ERC released Resolution No. 23, Series of 2010 adopting the “Rules Implementing the Discounts to Qualified Senior Citizen End-Users and Subsidy from the Subsidizing End-Users on Electricity Consumption under Sections 4 and 5 of Republic Act No. 9994”. Meralco implemented the discount starting the February 2011 billing.
Costs and Effects of Compliance with Environmental Laws
Compliance with environmental laws is part of Meralco’s good governance and enhances its relationships with environmental pressure groups. Specific programs such as solid waste management, water conservation, air pollution control, and wastewater management have been implemented by the Company to ensure compliance with environmental laws and preservation of the natural resources covered by its franchise area. Meralco has incurred a total amount of P515,000.00 representing renewal and application of permits for new or expansion projects; P1,500,000.00 accounted for the maintenance of Sewage Treatment Plants (STPs) and P300,000 for waste collection and disposal.
Government Approval and Regulation
Meralco is subject to regulation by the Energy Regulatory Commission (ERC) and recognizes the rate-making policies of the ERC.
Human Resource Profile
Number of Employees Meralco has a total of 6,203 regular employees for the year ended 2010. This is one percent (1%) higher than 2009’s year-end count of 6,112. The increase in manpower is attributable to Management’s strategy to augment the core and frontline positions directly involved in the delivery of services to the growing customer base. The table below illustrates the comparative count based on employee classification according to the role they perform in the organization.
YEAREND COUNT CLASSIFICATION
DEFINITION 2009 2010
% INC/DEC
Leadship 1,238 1,212 -2.10%
1. Top Management Department / Group Heads 36 41 13.89%
2. Middle Management Division Heads 141 144 2.13%
3. Junior Management Team Leaders and Supervisors 1,061 1,027 -3.20%

Non-Leadship 4,874 4,991 2.40%
1. Professional / Technical
Consists of employees who carry out professional functions in engineering, medical, legal, accounting, HR and education, and other fields. Work requires consistent exercise of discretion and judgment.
1,256
1,307
4.06%
2. Office Operations Consists of personnel who provide direct support to processes/operation of the organization
1,089
1,096
0.64%
4. General Administrative
Consists of administrative / clerical personnel who provide support to the resource management function of the Office of the Head.
286
289
1.05%
4. Skilled / Trade Workers in this group are engaged in tasks, using and operating hand tools and motorized equipment to fabricate, construct, process, install or repair materials, equipment and structural parts utilizing special techniques, training and experience.
2,243
2,299
2.50%
Total 6,112 6,203 1.49%
Labor Unions
Meralco has two (2) Labor Unions, namely, Meralco Employees and Workers Association (MEWA) and First Line Association of Meralco Supervisory Employees (FLAMES). MEWA (with total number of members equal to 803 employees) is the authorized bargaining agent for regular pay grade (PG) I-VI employees; while FLAMES (with 2,054 members) represents the regular PG VII-XII employees.
Year 2010 is a remarkable year for the Labor Unions as this is the first time in the Company’s history that Collective Bargaining Agreements (CBAs) for both MEWA and FLAMES were formally signed simultaneously. The negotiations were concluded after 5 and 4 negotiation meetings for MEWA and FLAMES, respectively, which were both within record time and within budget.
Highlights of the CBAs for both MEWA and FLAMES include the payout of one-time lump sum; and the increase in Outside Medical and Surgical Treatment for all Rank & File and Supervisory employees.

Item 2. Properties
Attached are the following:
• Update of Leased Offices
• Update of Leased Substations
• Schedule of Property Plant and Equipment
• Summary of Land Account (location and description) The real properties enumerated in the Summary of Land Account are used as sites for the
Company’s transmission lines, substations, operating/service centers, and principal/district/branch offices.

LESSOR OFFICE LOCATION AREA PRINCIPAL VAT BASIC EWT NET OF TAX LEASE TERM
A Extension/Payment Offices
1 Judge Noe A. Amado Corporation San Mateo Payment Office No.503 Gen. Luna St., Malanday, San Mateo, Rizal 85.00 P 40,000.00 P 0.00 P 40,000.00 P 2,000.00 P 38,000.00 Dec. 1, 2009 to Nov. 30, 2010
P 40,000.00 P 0.00 P 40,000.00 P 2,000.00 P 38,000.00 Dec. 1, 2010 to Nov. 30, 2011
2 Mrs. Regina D. Dimaraan Trece Martirez Extension 162 Luciano St. Trece Martirez City, Cavite 207.80 P 60,591.94 P 0.00 P 60,591.94 P 3,029.60 P 57,562.34 Sept. 1, 2009 to Aug. 31, 2010
P 60,591.94 P 0.00 P 60,591.94 P 3,029.60 P 57,562.34 Sept. 1, 2010 to Aug. 31, 2011
3 L.S.E. Trading Corporation Bahayang Pag-Asa Payment Corner of Bahayang Pag-Asa Road & Molino Road, 86.40 P 30,144.22 P 3,617.31 P 33,761.53 P 1,507.21 P 32,254.32 Jan. 1, 2010 to Dec. 31, 2010
Ms. Evelyn E. Eusebio Bacoor, Cavite
4 TSP General Trading, Inc - GMA Extension Office Governor's Drive, Brgy. Bulihan, Silang, Cavite 510.00 79,860.00 P 9,583.20 P 89,443.20 P 3,993.00 P 85,450.20 Sept. 1, 2009 to Aug. 31, 2010
Mr. Tomas San Pedro 87,846.00 P 10,541.52 P 98,387.52 P 4,392.30 P 93,995.22 Sept. 1, 2010 to Aug. 31, 2011
5 Mr. Ernesto H. Belardo Silang Extension No. 132 J. Rizal St., Silang, Cavite 98.86 P 51,602.72 P 6,192.33 P 57,795.05 P2,580.14 P 55,214.91 Dec. 1, 2009 to Nov. 30, 2010
6 Manuela Corporation Metropolis Extension South Superhighway, Alabang, Muntinlupa City, 133.00 P 119,741.23 P 14,368.95 P 134,110.18 P 5,987.06 P 128,123.12 June 1, 2009 to May 31, 2010
P 119,741.23 P 14,368.95 P 134,110.18 P 5,987.06 P 128,123.12 June 1, 2010 to May 31, 2011
7 Mr. Jose M. Abalos Los Baños Payment Office National highway, Barangay Anos, Los Baños, Laguna 104.00 P 51,476.69 P 6,177.20 P 57,653.89 P 2,573.83 P 55,080.06 Nov. 1, 2009 to Oct. 31, 2010
P 54,050.52 P 6,486.06 P 60,536.58 P 2,702.53 P 57,834.06 Nov. 1, 2010 to Oct. 31, 2011
8 Ms. Mayla L. Reyes Mauban Extension 33 Quezon Extension, Mauban, Quezon 64.00 P 4,537.52 P 0.00 P 4,537.52 P 226.88 P 4,310.64 Sept. 1, 2009 to Aug. 31, 2010
P 5,000.00 P 0.00 P 5,000.00 P 250.00 P 4,750.00 Sept. 1, 2010 to Aug. 31, 2011
9 Epifanio & Cecilia Guillermo Marilao Extension Unit No. 7, Commercial Building, along McArthur Highway, 140.00 P 25,898.59 P 3,107.83 P 29,006.42 P 1,294.93 P27,711.49 Jan. 1, 2010 to Dec. 31, 2010
10 Mrs. Rebecca S. David San Miguel Extension 53 Tecson Street, Poblacion, San Miguel, Bulacan 109.00 P 29,464.29 P 3,535.71 P 33,000.00 P 1,473.21 P 31,526.79 Nov. 1, 2009 to Oct. 31, 2010
11 ACC Farmer's Development Corp. Hagunoy Extension Along Sto. Nino St., Hagonoy, Bulacan 83.00 P 37,202.78 P 4,464.33 P 41,667.11 P 1,860.14 P 39,806.97 Feb. 1, 2009 to Jan. 31, 2010
P 37,202.78 P 4,464.33 P 41,667.11 P 1,860.14 P 39,806.97 Feb. 1, 2010 to Jan. 31, 2011
P 39,062.92 P 4,687.55 P 43,750.47 P1,953.15 P 41,797.32 Feb. 1, 2011 to Jan. 31, 2012
12 Mr. Rodolfo Garcia Sapang Palay Extension Area I, Block 29, Lot 2, Sapang Palay, 93.18 P 15,192.68 P 1,823.12 P 17,015.80 P 759.63 P 16,256.17 Feb. 1, 2009 to Jan. 31, 2010
P 15,192.68 P 1,823.12 P 17,015.80 P 759.63 P 16,256.17 Feb. 1, 2010 to Jan. 31, 2011
A. UPDATED LIST OF EXTENSION/PAYMENT OFFICES AND SECTOR LEASED BY MERALCO
AS OF DECEMBER 2010
Page 1 of 2

LESSOR OFFICE LOCATION AREA PRINCIPAL VAT BASIC EWT NET OF TAX LEASE TERM
A. UPDATED LIST OF EXTENSION/PAYMENT OFFICES AND SECTOR LEASED BY MERALCO
AS OF DECEMBER 2010
13 Ms. Virginia A. Casas San Jose Del Monte Extension KM. 30, Tungkong Mangga, San Jose Del Monte, Bulacan 97.00 P 32,680.80 P 3,921.70 P 36,602.50 P 1,634.04 P 34,968.46 Sept. 1, 2009 to Aug. 31, 2010
P 35,948.85 P 4,313.86 P 40,262.71 P 1,797.44 P 38,465.27 Sept. 1, 2010 to Aug. 31, 2011
14 Dr. Angelo P. Aquino Camarin Extension 2194 Zapote St., Camarin D. Kalookan City 148.00 P 70,785.00 P 8,494.20 P 79,279.20 P 3,539.25 P 75,739.95 Jan. 1, 2010 to Dec. 31, 2010
Franglo
15 Asian Cathay Finance & Leasing Meralco Consumer Assistance Unit 506, Pacific Center Condominium, San Miguel Avenue, 101.90 P 26,970.00 P 3,236.40 P 30,206.40 P 1,348.50 P 28,857.90 Oct. 12, 2009 to Oct. 15, 2010
Corporation Office - Condo unit & parking space San Antonio, Pasig City
Integral Realty Corporation Meralco Consumer Assistance Pacific Center Condominium, San Miguel Avenue, 12.00 P 2,500.00 P 300.00 P 2,800.00 P 125.00 P 2,675.00 Oct. 2, 2009 to Sept. 30, 2010
Office - Additional parking space San Antonio, Pasig City P 2,500.00 P 300.00 P 2,800.00 P 125.00 P 2,675.00 Oct. 2, 2010 to Sept. 30, 2011
B Alabang Sector (add'l area reqt.)
1 Greenfield Development Corp. Alabang Service Center Hilssborough Subd., Bgy. Cupang, Alabang, Muntinlupa City 721.00 P 27,037.50 P 3,244.50 P 30,282.00 P 1,351.88 P 28,930.13 Dec. 4, 2009 to Dec. 3, 2010
P 30,282.00 P 3,633.84 P 33,915.84 P 1,514.10 P 32,401.74 Dec. 4, 2010 to Dec. 3, 2011
Prepared by: Approved by: Noted by:
B. F. Arandela C. U. Dacanay G. R. Montemayor
Realty Staff Team Leader, Realty Head, Tax Management & Realty Services
Page 2 of 2

No. Due Date PAYEE PARTICULAR LOCATION AREA PRINCIPAL VAT BASIC EWT NET OF TAX COVERAGE REMARKS
1 Jan. 01, 2010 Atty. Emigdio Tanjuatco Tanay Substation Site Along National Road, Bo. Suyoc, 695.50 P 12,600.00 P 1,512.00 P 14,112.00 P 630.00 P 13,482.00 Jan. 01, 2010 to Dec. 31, 2010 Yearly
Tanay, Rizal P 13,230.00 P 1,587.60 P 14,817.60 P 661.50 P 14,156.10 Jan. 01, 2011 to Dec. 31, 2011
P 13,891.50 P 1,666.98 P 15,558.48 P 694.58 P 14,863.90 Jan. 01, 2012 to Dec. 31, 2012
P 14,586.08 P 1,750.33 P 16,336.41 P 729.30 P 15,607.11 Jan. 01, 2013 to Dec. 31, 2013
2 Jan. 15, 2010 City Government of Batangas Batangas City Substation Site Bo. Bolbok, Batangas City 1,400.00 P 42,000.00 P 0.00 P 42,000.00 P 0.00 P 42,000.00 Nov. 1, 2009 to Oct. 31, 2010 Yearly
-
Under Negotiation.
Pending advise from
Legal Office of
Batangas City
3 Jan. 31, 2010 Madrigal Business Park Commercial Ayala-Alabang Alabang, Muntinlupa City 2,400.00 P 118,800.00 P 0.00 P 118,800.00 P 0.00 P 118,800.00 Jan. 01, 2010 to Dec. 31, 2010
Estate Association, Inc Substation Site
Association Dues P 106,920.00 P 0.00 P 106,920.00 P 0.00 P 106,920.00 (net of 10% discount) Yearly
Common Area (P5.64 per sq. m.) P 13,536.00 P 0.00 P 13,536.00 P 0.00 P 13,536.00
4 Feb. 10, 2010 DENR-National Capital Region Binondo Substation Site Dasmariñas, Binondo, Manila 177.00 P 550.50 Feb. 9, 2009 to Feb. 8, 2010 Yearly
revocable permit Feb. 9, 2010 to Feb. 8, 2011
Application No.
V-4870 (E.V. 1651)
5 Feb. 15, 2010 Makati Commercial Estate Legaspi Substation Site Legazpi Village, Makati City 2,447.00 P 12,235.00 P 0.00 P 12,235.00 P 0.00 P 12,235.00 Jan. 1, 2010 to Dec. 31, 2010
Association, Incorporated (MACEA)
Association Dues P 11,011.50 P 0.00 P 11,011.50 P 0.00 P 11,011.50 (net of 10% Discount if paid Yearly
within the period Jan 1 to Mar. 31.)
6 May 01, 2010 University of the Philippines System IRRI - UP Los Baños National Highway, Brgy. Maahas, 2,500.00 P 2,196,150.00 P 0.00 P 2,196,150.00 P 0.00 P 2,196,150.00 May 3, 2009 - May 2, 2010 Yearly
Substation Site Los Baños, Laguna P 2,415,765.00 P 0.00 P 2,415,765.00 P 0.00 P 2,415,765.00 May 2, 2010 - May 2, 2011
7 Jun. 15, 2010 Philippine National Railways Tutuban Substation Site No. 943 C.M. Recto Ave., Tutuban 2,475.00 P 230,625.00 P 0.00 P 230,625.00 P 0.00 P 230,625.00 Jun. 15, 2009 to Jun. 14, 2010
Station, Tondo Manila P 124,921.88 P 0.00 P 124,921.88 P 0.00 P 124,921.88 Jun. 15, 2010 to Dec. 31, 2010
Level Crossing, Malolos, Bulacan Malolos, Bulacan 192.00 P 129,479.59 P 0.00 P 129,479.59 P 0.00 P 129,479.59 Jan. 1, 2010 to Dec. 31 2010 For finalization of
Lease Contract
B. UPDATED LIST OF LEASED SUBSTATION SITES
AS OF DECEMBER 2010
For finalization of
Lease Contract
1 of 2

No. Due Date PAYEE PARTICULAR LOCATION AREA PRINCIPAL VAT BASIC EWT NET OF TAX COVERAGE REMARKS
B. UPDATED LIST OF LEASED SUBSTATION SITES
AS OF DECEMBER 2010
Tondo Substation Tondo, Manila 1,250.00 P 1,668,194.52 P 0.00 P 1,668,194.52 P 0.00 P 1,668,194.52 Aug. 01, 2009 to Jul. 31, 2010
P 764,589.16 P 0.00 P 764,589.16 P 0.00 P 764,589.16 Aug. 01, 2010 to Dec. 31,2010
8 Jul. 10, 2010 DENR-National Capital Region Binondo Substation Site Dasmariñas, Binondo, Manila 506.00 -
Yearly, Renewal of
lease under
negotiation
9 University of Philippines Diliman Substation Site Diliman, Quezon City 7,984.00 - Aug. 11, 1993 - Aug. 10, 2023
(Usufruct for 30 years)
10 Manila International Airport Authority NAIA 3 Substation Site Villamor Air Base, Pasay City 1,831.00 P 62,169.77 P 7,460.37 P 69,630.14 P 3,108.49 P 66,521.65 Feb. 1, 2009 to Jan. 31, 2010 Monthly
P 62,169.77 P 7,460.37 P 69,630.14 P 3,108.49 P 66,521.65 Feb. 1, 2010 to Jan. 31, 2011
11 VCGT Realty Corporation Manggahan Substation Site Manggahan, Pasig City 2,816.26 P 175,762.78 P 21,091.53 P 196,854.31 P 8,788.14 P 188,066.17 Jul. 01, 2009 to Jun. 30, 2010 Monthly
P 188,942.88 P 22,673.15 P 211,616.03 P 9,447.14 P 202,168.88 Jul. 01, 2010 to Jun. 30, 2011
P 203,108.67 P 24,373.04 P 227,481.71 P 10,155.43 P 217,326.28 Jul. 01, 2011 to Jun. 30, 2012
P 218,344.63 P 26,201.36 P 244,545.99 P 10,917.23 P 233,628.75 Jul. 01, 2012 to Jun. 30, 2013
P 234,707.10 P 28,164.85 P 262,871.95 P 11,735.36 P 251,136.60 Jul. 01, 2013 to Jun. 30, 2014
P 252,308.73 P 30,277.05 P 282,585.78 P 12,615.44 P 269,970.34 Jul. 01, 2014 to Jun. 30, 2015
P 271,234.00 P 32,548.08 P 303,782.08 P 13,561.70 P 290,220.38 Jul. 01, 2015 to Jun. 30, 2016
Prepared by: Approved by: Noted by:
B. F. Arandela C. U. Dacanay G. R. Montemayor
Realty Staff Team Leader, Realty Head, Tax Management & Realty Services
For finalization of
Lease Contract
2 of 2

No. PAYEE PARTICULAR LOCATION AREA RENTAL PRINCIPAL VAT BASIC EWT NET OF TAX COVERAGE REMARKS
1 Aquilana Pedraja BTL - R/W at Junction, Cainta, Rizal Junction, Cainta, Rizal P 6,600.00 P 6,600.00 P 0.00 P 6,600.00 P 0.00 P 6,600.00 Jan. 01, 2010 - Dec. 31, 2010 Yearly
Tax Exempt
2 Office of the Non-Fund Permit Fee of 115 KV P 8,500.00 P 8,500.00 P 0.00 P 8,500.00 P 0.00 P 8,500.00 Feb. 8, 2009 - Feb. 7, 2010 Yearly
HHSG, PA, Fort Bonifacio Transmission Line (Rockwell/Malibay) P 8,500.00 P 8,500.00 P 0.00 P 8,500.00 P 0.00 P 8,500.00 Feb. 8, 2010 - Feb. 7, 2011
3 Camilo D. Briones Mt. Banoy Repeater Station Site Brgy. Talumpok Silangan, Batangas City121.00 P 106,989.47 P 106,989.47 P 0.00 P 106,989.47 P 5,349.47 P 101,640.00 Sept. 1, 2009 - Aug. 31, 2010 Yearly
Net of 5% EWT P 106,989.47 P 0.00 P 106,989.47 P 5,349.47 P 101,640.00 Sept. 1, 2010 - Aug. 31, 2011
(P8,470.00/month)
4 Marbe De Torres Contreras, et. Al. Mt. Banahaw Repeater Station Site Samil, Lucban, Quezon 197.00 P 96,049.80 P 96,049.80 P 0.00 P 96,049.80 P 4,802.49 P 91,247.31 Sept. 1, 2009 - Aug. 31, 2010 Yearly
Non VAT Registered P 105,654.78 P 0.00 P 105,654.78 P 5,282.74 P 100,372.04 Sept. 1, 2010 - Aug. 31, 2011
5 Sps. Danilo G. Reyes and Sariaya Repeater Site Mamala, Sariaya, Quezon 500.00 P 216,000.00 P 216,000.00 P 0.00 P 216,000.00 P 10,800.00 P 205,200.00 Dec. 1, 2009 - Nov. 30, 2010 Yearly
Melinda P. Reyes Bo. Mamala - 2 Non VAT Registered P 234,000.00 P 0.00 P 228,000.00 P 11,700.00 P 216,300.00 Dec. 1, 2010 - Nov. 30, 2011
P 252,000.00 P 0.00 P 240,000.00 P 12,600.00 P 227,400.00 Dec. 1, 2011 - Nov. 30, 2012
P 270,000.00 P 0.00 P 252,000.00 P 13,500.00 P 238,500.00 Dec. 1, 2012 - Nov. 30, 2013
P 288,000.00 P 0.00 P 264,000.00 P 14,400.00 P 249,600.00 Dec. 1, 2013 - Nov. 30, 2014
P 306,000.00 P 0.00 P 276,000.00 P 15,300.00 P 260,700.00 Dec. 1, 2014 - Nov. 30, 2015
P 324,000.00 P 0.00 P 288,000.00 P 16,200.00 P 271,800.00 Dec. 1, 2015 - Nov. 30, 2016
P 342,000.00 P 0.00 P 300,000.00 P 17,100.00 P 282,900.00 Dec. 1, 2016 - Nov. 30, 2017
P 360,000.00 P 0.00 P 312,000.00 P 18,000.00 P 294,000.00 Dec. 1, 2017 - Nov. 30, 2018
6 Bayan Telecoms, Incorporated Mt. Landing Repeater Station Site Jala Jala, Rizal P 12,000.00 P 10,714.29 P 1,285.71 P 12,000.00 P 535.71 P 11,464.29 Sept. 1, 2009 to August 31, 2010 Monthly
Sept. 1, 2010 to August 31, 2011
7 Hospicio De San Jose 2 Steel Towers & 2 Steel Poles R/W Isla de Convalescencia, Manila 1,812.00 P 69,200.00 P 61,785.71 P 7,414.29 P 69,200.00 P 3,089.29 P 66,110.71 June 1, 2005 to June 30, 2023 Monthly
plus donation (VAT inclusive)
Fixed rate
Prepared by: Approved by: Noted by:
B. F. Arandela C. U. Dacanay G. R. Montemayor
Realty Staff Team Leader, Realty Head, Tax Management & Realty Services
C. UPDATED LIST OF LEASED REPEATER STATION SITES AND TOWER/TRANSMISSION LINES R/W
AS OF DECEMBER 2010


T.C.T. AREA IN
NO. SQ. MTR.
Botocan Transmission Lines (110 KV) Santol Street- E. Rodriguez Sr. Blvd. Route 46811 24,493
E. Rodriguez Sr. Blvd. - San Juan River Route 35913 42,919
San Juan River - Katipunan Ave. Route 46812 219,07635915 54,250
273,326
Katipunan Ave. - Marikina River Route 35915 36,40546813 11,074
47,479
Bgy. Sucat, Muntinlupa City S-79863 3,975Gardner Transmission Line Right of Way
Bgy. Camarin, Caloocan CityTransmission Right of Way 22310 2,713
Ibayo-Napindan, Taguig, Metro Manila OCT-691 215Ibayo-Napindan Transmission Right-of-Way
Sta. Mesa, Manila to Marikina City tract of land
Sta. Ana, Manila to Junction, Pasig City tract of land
Bgy. Botocan, Majayjay, Laguna T-92138 10,391Site I - Substation SiteBOTOCAN SUBSTATION
Bgy. Botocan, Majayjay, Laguna T-43563 18,909Site II - Trans. Right of Way O-1431 4,741Between Botocan & Balanas Liners 23,650
Bgy. Suyok (Kay Buto) Tanay, Rizal M-81342 337Tanay Transmission Line Right-of-Way
LOCATION/DESCRIPTION
MANILA ELECTRIC COMPANY
SUMMARY OF LAND AND LAND RIGHTS - UTILITY
AS OF DECEMBER 31, 2010
Page 1 of 16

T.C.T. AREA IN
NO. SQ. MTR.LOCATION/DESCRIPTION
Bgy. May-Iba, Antipolo City, Rizal 26774 1,170Antipolo Transmission Line Right-of-Way 399524 1,050
2,220
Kaayusan cor. Kaluwagan St. (PT-84312) 86541 591.20Karangalan Village, Santolan, Pasig city (PT-84313) 86542 1,133.20Botocan 115KV Line (Meralco Tower) 1,724.40
San Guillermo, Morong, Rizal no tct yet 573
Bgy. Dolores, Taytay, Rizal 699325 4,372
9th Ave., cor Sevilla St. cor D. Aquino St., (14962) 11001 1,300Caloocan CityGRACE PARK SUBSTATION
A. Flores St., Ermita, Manila 48429 1,639ERMITA SUBSTATION
J. Rizal Street, Bgy. Pamplona, Las Piñas City S-79858 2,082LAS PIÑAS SUBSTATION
Bgy. Ibayo, Las Piñas City 47102 740ZAPOTE SUBSTATION T-78492 711
T-47095 34243647/S-78299 467
T-105438 1952,455
Sta. Cecilla Road, Sitio Kubo-Kob, Bgy. Pamplona 40739 7,915Mapulang Lupa, Las Piñas CityPAMPLONA SUBSTATION
McKinley Road, Forbes Park, Makati City 64899 1,000FORBES PARK SUBSTATION
Vito Cruz cor Kakarong Street, Makati City S-51742 1,791MAKATI SUBSTATION
Kamagong St. cor Ayala Ave. Ext., Makati City S-77241 1,378KAMAGONG SUBSTATION
Page 2 of 16

T.C.T. AREA IN
NO. SQ. MTR.LOCATION/DESCRIPTION
Amorsolo St. cor Lumbang St., Kayamanan C S-79682 4,900Subdivision, Makati City S-51743 2,096MALIBAY SUBSTATION 6,996
L. Guinto St. cor Dagonoy St., Malate, Manila 22048 369.20MALATE SUBSTATION 22049 1,029.70
1,398.90
M. H. Del Pilar, L Roque, Bgy. Tugatog, T-94885 7,476Provincial Road, Malabon CityMALABON SUBSTATION
Bgy. Camarin, Caloocan City C-322885 8,962CAMARIN SUBSTATION C-322886 152
9,114
EDSA, Bgy. Wack-Wack, Mandaluyong City 12100 1,264MANDALUYONG SUBSTATION (Wack-Wack) 12097 769
2,033
EDSA SHOEMART-SHANGRI-LA, Mandaluyong City 9152 604SM - SHANGRILA SUBSTATION 11368 500
1,104
From Miriam College to Bgy Malanday, Marikina City N-39141 2,137Marikina (A.C. 34.5 Feederline) N-46245 958
N-38764 3,1976,292
East Drive, Santan St., Marikina Heights, N-30467 5,050Bgy. Parang, Marikina CityPARANG SUBSTATION
Kapitan Moy Street, Sta. Elena, Marikina City N-30471 894MELI SUBSTATION
Katipunan Ave., Loyola Heights, Quezon City 46813 3,463MARIKINA SUBSTATION
Madrigal Business Park, Phase 3, T-210119 2,400Bgy. Alabang, Muntinlupa CityAYALA-ALABANG SUBSTATION/BUSINESS CENTER
Page 3 of 16

T.C.T. AREA IN
NO. SQ. MTR.LOCATION/DESCRIPTION
Plaza Dilao, Paco, Manila (61536) 240564 1,034.40PACO SUBSTATION (137786) 240519 209.90
(180640) 240517 209.70(137785) 240920 209.80(137784) 240515 342.30(137783) 240921 422.60(180641) 240518 250.00
(196644) 240514 896.60
(69456) 240513 245.60
(152094) 240922 784.10
(152095) 240923 1,142.20
(152096) 240924 1,112.50
(152097) 240925 164.50
7,024.20
Isla de Provisor, D. Romualdez St., Paco, Manila 146850 10,891.30TEGEN SUBSTATION
Quirino Ave., Bgy. Tambo, Parañaque City S-79855 1,157PARAÑAQUE SUBSTATION
Sun Valley Subd., Bgy. La Huerta, Parañaque City S-79859 1,612.50SUN VALLEY SUBSTATION T-44095 583.00
2,195.50
Sta. Cecilia St., Bgy. San Dionisio, T-120937 6,898Parañaque CityB. F. PARAÑAQUE SUBSTATION
S. Antonio Avenue/ Pilapil Sts., Bgy. Kapasigan, 12098 1,450Pasig City -41550PASIG SUBSTATION
Elisco Road, Kalawaan Sur, Taguig, Metro Manila 308397 5,021(Inside National Steel Corp. Compound)TAGUIG SUBSTATION
Canley Road cor Orambo Drive, Bgy. Bagong PT-105095 198.50Ilog, Pasig City PT-105096 320.00HILLCREST SUBSTATION PT-105097 217.00
PT-105098 347.50PT-105094 227.00
1,310.00
Page 4 of 16

T.C.T. AREA IN
NO. SQ. MTR.LOCATION/DESCRIPTION
EDSA, San Roque near BLTB Terminal, Pasay City 4385 2,500PASAY SUBSTATION
P. Tuazon St., Gen. Romulo, Cubao, Quezon City 33825 1,970CUBAO SUBSTATION
Along Banawe Ave. cor Del Monte Avenue, RT-53270(30108) 792.20Quezon City RT-53270(30108) 600.00LA LOMA SUBSTATION 1,392.20
Quirino Hi-way, Novaliches, Quezon City 63451 7,677NOVALICHES SUBSTATION
P. dela Cruz St., Bgy. San Bartolome, N-136291 3,704Novaliches, Quezon CityKAYBIGA SUBSTATION
Scout Santiago Rallos St., Diliman, Quezon City 17720 797.20QUEZON CITY SUBSTATION 17721 784.70
1,581.90
A. H. Lacson St. (formerly Gov. Forbes St.) 28895 375Sampaloc, Manila 28215 1,000SAMPALOC SUBSTATION 1,375
N. Domingo St., San Juan, Metro Manila 42264 1,334SAN JUAN SUBSTATION
Santol Street, Bgy. San Isidro, Quezon City 46811 10,569.00STA. MESA SUBSTATION 107627 16.50
107628 82.80107629 100.70
(RT-8116) 107631 9.70110430 118.40111780 804.90115549 1,804.40
(RT-123538) 105119 1,063.0014,568.50
Pedro Gil (Herran) Jesuitas St., Sta. Ana, Manila 59501 1,068.48STA. ANA SUBSTATION
Cordillera Street, Bacood, Manila 81178 1,200PANDACAN SUBSTATION
Page 5 of 16

T.C.T. AREA IN
NO. SQ. MTR.LOCATION/DESCRIPTION
Abad Santos cor New Antipolo St., Tondo, Manila 81211 7,303NORTH PORT SUBSTATION
La Torre corner Narra Street, Tondo, Manila 59986 221.80PALOMAR SUBSTATION 59081 417.10
59927 351.0059783 175.50
1,165.40
Mc Arthur Highway, Bgy. Malinta, T-146230 140Valenzuela City 2,593MALINTA SUBSTATION 2,733
Bgy. Bagbaguin (Canumay), Valenzuela City V-53151 2,627.50BAGBAGUIN SUBSTATION V-53152 201.00
V-53154 269.00V-55380 417.00V-55376 267.00V-55428 50.00V-55366 217.00V-55379 534.00V-55437 65.00V-55439 1,285.50V-53079 637.00V-55440 20.50
6,590.50
Ortigas Avenue Extension 159233 10,905Bgy. Sto. Domingo, Cainta, RizalCAINTA SUBSTATION
Bgy. Dolores, Taytay, Rizal OCT-No.1172 2,347TAGUIG-DOLORES 115KV RIGHT-OF-WAY 663866
Philec Road, Bgy. Dolores, Taytay, Rizal 548416 28,714DOLORES SUBSTATION
Sukol Highway, Bgy. Iba, Antipolo City 216628 1,000TERESA II SUBSTATION 216629 1,000
216630 1,000216631 1,000
4,000
Sumulong Highway, Bgy. Mambugan, 234662 160Masinag, Antipolo City 234663 2,304MASINAG SUBSTATION 234664 1,802
234665 781234666 460
5,507
Page 6 of 16

T.C.T. AREA IN
NO. SQ. MTR.LOCATION/DESCRIPTION
Poblacion, Bgy. Hulo, Sta. Cruz, Angat, Bulacan T-35360 1,000ANGAT SUBSTATION T-353603 45
1,045
La Trinidad, Bgy. Bundukan, Bocaue, Bulacan 26771 4,769BOCAUE SUBSTATION
Doña Remedios Trinidad Highway, Bgy. Sto. TC-1084 819Cristo, Baliuag, Bulacan TC-1085 819BALIUAG SUBSTATION TC-1086 579
TC-1087 5792,796
McArthur Highway, Bgy. San Marcos, T-305631 2,000Calumpit, Bulacan (RT-538311)CALUMPIT SUBSTATION
New Duhat Overpass, Duhat, Bocaue, Bulacan T-184873 10,729DUHAT SUBSTATION T-205686 535
T-205687 600T-205688 1,492
13,356
Bo. Sta. Rosa, Marilao, Bulacan T-456244 6,903MARILAO SUBSTATION
Bgy. Pinagbakahan, Malolos-Plaridel Provincial Road, T-100347 11,496.00MALOLOS II SUBSTATION T-100058 1,608.50
T-100059 877.0013,981.50
Steel Asia Mfg. Corp., Bgy. Bahay Pare , T-28387 2,627Meycauayan, BulacanPROPOSED BAHAY PARE SUBSTATION
Bgy. Iba & Camalig, Meycauayan, Bulacan T-108371 1,000MEYCAUAYAN SUBSTATION T-108372 3,000
T-108373 1,0005,000
Cagayan Valley Road, Provincial Road, M-81168 4,332Bgy. Silangan, San Miguel, Bulacan
SAN MIGUEL SUBSTATION
Page 7 of 16

T.C.T. AREA IN
NO. SQ. MTR.LOCATION/DESCRIPTION
Bocaue Exit, Bocaue-Sta. Maria Provincial Road, T-161762 518Bgy. Turo, Bocaue, Bulacan T-161763 6,661STA. MARIA SUBSTATION 7,179
Bgy. Tikay & Santol, Malolos, Bulacan T-220641 4,407First Bulacan Industrial City (FBIC)TABANG SUBSTATION
De Leon St. cor De Guzman St., Bgy. Caridad, 20655 (RT-501) 628(Dalahican) Cavite City, CaviteCAVITE SUBSTATION
Gen. Aguinaldo Hway, Bgy. Anabu, T-368010 1,315Imus, Cavite T-368011 2,081IMUS SUBSTATION T-368012 2,081
5,477
Puerto Azul Road, Bgy. Tanauan, T-344605 11,101Tanza, Cavite T-344606 6,442TRECE MARTIREZ II SUBSTATION 17,543
National Highway, Bgy. Amaya, Tanza, Cavite T-275041 750TANZA SUBSTATION T-275042 924
T-274981 750T-274982 750
3,174
National Highway, Bgy. Biluso, Silang, Cavite P-3331 7,887SILANG SUBSTATION P-3331 343
8,230
Bgy. Habay, Bacoor, Cavite (T-37535) T-881133 2,223BACOOR SUBSTATION
Westgrove Heights , Silang, Cavite T-44244 3,600Donated by Ayala Land, Inc.
Bgy. Banay-Banay, Amadeo, Cavite TCT-13608 13,281AMADEO SUBSTATION TCT-13607 6,684
19,965
Page 8 of 16

T.C.T. AREA IN
NO. SQ. MTR.LOCATION/DESCRIPTION
Bgy. Del Remedios, San Pablo City, Laguna T-33214 1,598SAN PABLO II SUBSTATION T-33215 1,632
T-33216 1,8635,093
LIIP Compound, Biñan, Laguna (Mamplasan Exit) T-333984 6,160LIIP SUBSTATION
Carmelray Industrial Park I, Bgy. Canlubang, Calamba, Laguna T-679483 6,374CARMELRAY SUBSTATION T679484 5,331
11,705
Barangay Tulo, Calamba, Laguna T-752655 3,576CIP II SUBSTATION
National Road, Bgy. Masiit, Calauan, Laguna T-67708 7,313CALAUAN SUBSTATION
Laguna Technopark , Bgy. Biñang, Biñan, Laguna T-142570 10,883STA. ROSA II SUBSTATION
Bgy. Balibago, Sta. Rosa, Laguna T-30407 1,359BALIBAGO SUBSTATION T-30405 5,750
7,109
Provincial Road, Bgy. Pagsawitan, T-127943 7,072.50Sta. Cruz, LagunaSTA. CRUZ SUBSTATION
Bgy. Landayan, San Pedro, Laguna T-234187 5,000SAN PEDRO SUBSTATION
Bgy. Diezmo, Cabuyao, Laguna T-298373 4,700LISP SUBSTATION
Hacienda Sta. Elena, Bgy. Malitlit, T-195348 5,531
Sta. Rosa, Laguna
Bgy. Mayapa, Calamba, Laguna T-87985 8,993CANLUBANG SUBSTATION
Page 9 of 16

T.C.T. AREA IN
NO. SQ. MTR.LOCATION/DESCRIPTION
Bgy. Parian, Calamba, Laguna T-456442 5,007PROPOSED CPIP SUBSTATION (T-437696)
Bgy. Ibabang Dupay, Marktown Subdivision, T-10369 7,792Lucena CityLUCENA II SUBSTATION
Bustamante St., Candelaria, Quezon Province 340067 1,184CANDELARIA SUBSTATION
National Highway, Bgy. Mapagong, Pagbilao, T-255222 3,522Quezon ProvincePAGBILAO SUBSTATION
Along National Highway, Bgy. San Agustin, T-279136 1,624Tiaong, Quezon ProvinceTIAONG SUBSTATION
Bgy. Mationa, Tayabas, Quezon Province T-261719 11,000TAYABAS SUBSTATION
First Philippine Industrial Park, Sto. Tomas, Batangas T-107718 5,625FPIP SUBSTATION
Bgy. Bolbok, Batangas City T-26253 3,424BATANGAS CITY SUBSTATION T-26254 1,606
5,030
Samson Road/Araneta Ave., Calaanan, Caloocan City (29516) 6468 1,272CALOOCAN AUXILIARY
Manila South Road, Bgy. Pamplona, Las Piñas City 25858 1,487LAS PIÑAS BUSINESS CENTER T-76814 417
T-90034 951,999
Page 10 of 16

T.C.T. AREA IN
NO. SQ. MTR.LOCATION/DESCRIPTION
Bgy. Concepcion & Ibaba, Malabon City (8250) M-21600 187MALABON BUSINESS CENTER (8991) M-21598 20
(8249) M-21599 279(M-11426) M-21601 801(8076) M-21594 246(8077) M-21595 44(8078) M-21596 130(8079) M-21597 110
(M-12162) M-21833 554(M-8247) M-21834 67(M-8246) M-21835 96(M-8251) M-21836 72(M-8247) M-21863 77
2,683
Bayanbayanan Ave.cor Gen. Ordoñez Ave., SW N-30468 1,058.40Molave St., Marikina Heights, Concepcion, Marikina City N-30469 919.90MARIKINA BUSINESS CENTER 1,978.30
Kamagong St. cor. Ayala Ave. Ext., Bgy. San Antonio, 213612 955Makati CityMAKATI BUSINESS CENTER
J. L. Escoda and Agoncillo Sts. Malate, Manila 240167 562MALATE BUSINESS CENTER
Shaw Boulevard cor. Marina Yulo St. 11764 664Bgy. Bagong Silang, Mandaluyong City 11765 826MANDALUYONG BUSINESS CENTER 1,490
Lubiran St. cor. Magmapa St., Bacood, Sta. Mesa, Manila 217022 21,733.00MANILA SECTOR 217023 15,844.70
37,577.70
Ortigas Avenue, Pasig City (210867) 21201 2,960.00MERALCO CENTER 12101 119,821.68
PT-113804 40,548.00PT-113806 5,000.00
168,329.68
Elisco Road , Bgy. San Joaquin, Pasig City PT-106584 921CENTRAL TRANSMISSION & DISTRIBUTION PT-106585 4,624
PT-106586 7,056PT-106587 19,011
31,612
Page 11 of 16

T.C.T. AREA IN
NO. SQ. MTR.LOCATION/DESCRIPTION
Elisco Road , Bgy. San Joaquin, Pasig City PT-109996 6,919SUBSTATION & CONTROL PT-109997 4,428
11,347
Dr. S. Antonio/Pilapil Sts., Bgy. Kapasigan, Pasig City 41550(12098) 1,532PASIG BUSINESS CENTER
Quirino Avenue, Bgy. Tambo, Parañaque City 79856 728PARAÑAQUE AUXILIARY 79857 612
1,340
F. B. Harrison/Doro Sts., San Jose, Pasay City 1337-A 1,150PASAY AUXILIARY
Forest Hill Drive, Novaliches, Quezon City (348275) RT-89418 1,144NOVALICHES BUSINESS CENTER
Quezon Avenue, Bgy. Roxas, Quezon City RT-103379 1,297.10ROOSEVELT BUSINESS CENTER (300423)
EDSA Bgy. Sitio Kangkong, Balintwak, Quezon City N-168227 3,323BALINTAWAK SECTOR / BALINTAWAK SUBTATION N-168228 3,955
377986 42,62749,905
Capitol Estate II, Commonwealth Avenue 52599 1,200Batasan Hills, Quezon City TD-07167COMMONWEALTH BUSINESS CENTER
EDSA, Bgy. Katipunan, Quezon City 67021 1,500BALINTAWAK BUSINESS CENTER
EDSA, Kamuning, Quezon City (18304) RT-15335 1,500KAMUNING BUSINESS CENTER
España/Josefina Sts., Sampaloc, Manila 36895 792ESPAÑA BUSINESS CENTER
Blumentrit Street, San Juan, Metro Manila 12099 883SAN JUAN AUXILIARY
Page 12 of 16
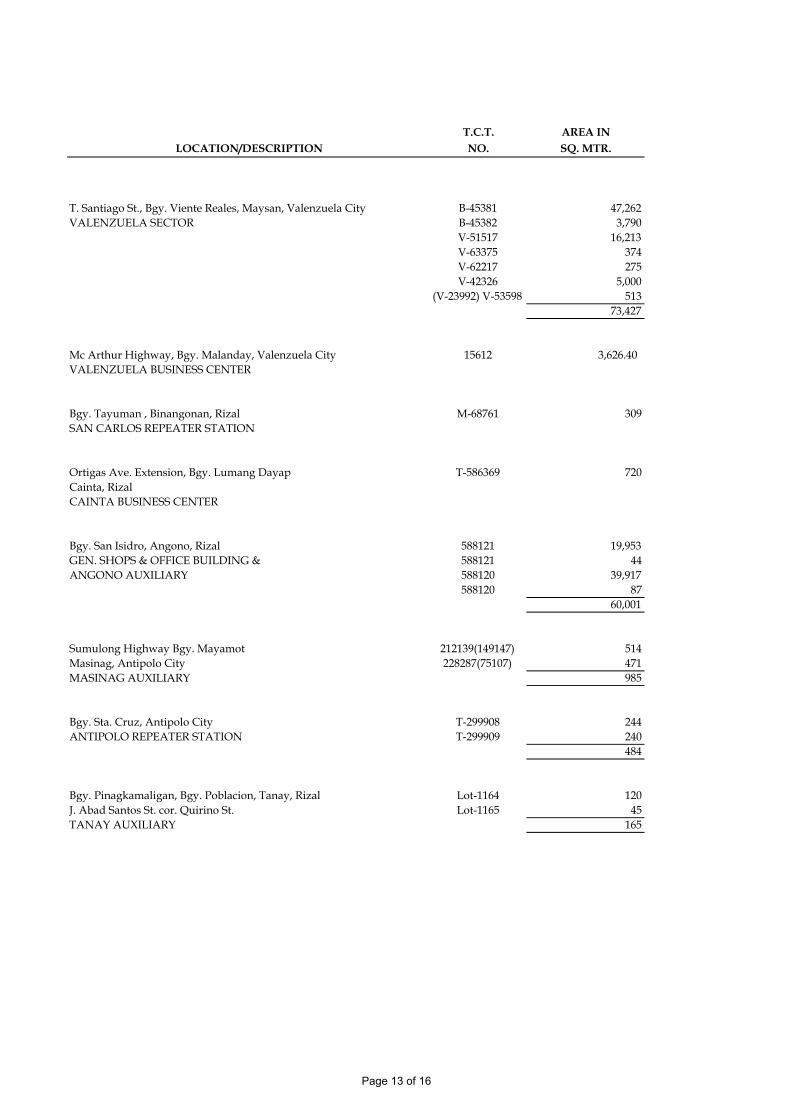
T.C.T. AREA IN
NO. SQ. MTR.LOCATION/DESCRIPTION
T. Santiago St., Bgy. Viente Reales, Maysan, Valenzuela City B-45381 47,262VALENZUELA SECTOR B-45382 3,790
V-51517 16,213V-63375 374V-62217 275V-42326 5,000
(V-23992) V-53598 51373,427
Mc Arthur Highway, Bgy. Malanday, Valenzuela City 15612 3,626.40VALENZUELA BUSINESS CENTER
Bgy. Tayuman , Binangonan, Rizal M-68761 309SAN CARLOS REPEATER STATION
Ortigas Ave. Extension, Bgy. Lumang Dayap T-586369 720Cainta, RizalCAINTA BUSINESS CENTER
Bgy. San Isidro, Angono, Rizal 588121 19,953GEN. SHOPS & OFFICE BUILDING & 588121 44ANGONO AUXILIARY 588120 39,917
588120 8760,001
Sumulong Highway Bgy. Mayamot 212139(149147) 514Masinag, Antipolo City 228287(75107) 471MASINAG AUXILIARY 985
Bgy. Sta. Cruz, Antipolo City T-299908 244ANTIPOLO REPEATER STATION T-299909 240
484
Bgy. Pinagkamaligan, Bgy. Poblacion, Tanay, Rizal Lot-1164 120J. Abad Santos St. cor. Quirino St. Lot-1165 45TANAY AUXILIARY 165
Page 13 of 16

T.C.T. AREA IN
NO. SQ. MTR.LOCATION/DESCRIPTION
Bgy. Agnaya, Plaridel, Bulacan TC-3001 3,662PLARIDEL SECTOR TC-3002 3,261
TC-3003 3,192TC-3004 3,133TC-3005 3,143TC-3006 2,599TC-3007 1,799TC-3008 2,692TC-3009 2,725TC-3010 2,739TC-3011 1,327TC-3012 1,323TC-3013 1,981TC-3014 2,112TC-3015 2,227
37,915
Bgy. Burol Primero, Balagtas, Bulacan 158-B 6,981BALAGTAS BUSINESS CENTER
Bgy. San Jose, Baliuag, Bulacan T-35505 130BALIUAG BUSINESS CENTER T-35506 1,668
1,798
Bgy. Bagbaguin, Sta. Maria, Bulacan T-288064 1,737STA. MARIA BUSINESS CENTER
Pariancillo St., Bgy. Sto. Niño, Malolos, Bulacan T-88606 62NEW MALOLOS BUSINESS CENTER T-88607 1,486
T-88608 60T-88609 388
1,996
Bgy. Minuyan (Bitungol), Norzagaray, Bulacan T-31444 P 399BITUNGOL REPEATER STATION
National Road, Tagaytay City, Cavite T-27818 6,000TAGAYTAY SERVICE CENTER & AUXILIARY
Alabang Hills Subd. Road, Bgy. Cupang, 64471 3,553Muntinlupa CityALABANG SERVICE CENTER
Page 14 of 16

T.C.T. AREA IN
NO. SQ. MTR.LOCATION/DESCRIPTION
Bgy. Tejero, Rosario, Cavite (T-462673) T-881134 2,373ROSARIO BUSINESS CENTER
Aguinaldo Highway, Bacoor, Cavite (T-37535) T-881133 1,995BACOOR BUSINESS CENTER
Aguinaldo Highway, Bgy. Abubot, Dasmariñas, Cavite T-205045 32,857DASMARIÑAS SECTOR T-224776 748
33,605
Poblacion, San Pedro, Laguna T-26725 363SAN PEDRO BUSINESS CENTER T-26724 854
1,217
Bgy. Dita, Sta. Rosa, Laguna T-50015 31,854STA. ROSA SECTOR T-50016 31,373
63,227
Bgy. Real, Calamba, Laguna T-86944 2,065CALAMBA BUSINESS CENTER
Poblacion, Sta. Cruz, Laguna T-144099 1,822STA. CRUZ AUXILIARY
Bgy. San Ignacio, San Pablo City, Laguna T-39355 30,681SAN PABLO SECTOR/BUSINESS CENTER T-42824 27,263
57,944
Mt. Imok, San Pablo City, Laguna O-560 1,000MERALCO RADIO STATION - SITE II
Quezon Ave., Bgy. Gulang-Gulang, Lucena City (T2202) 24971 1,000LUCENA BUSINESS CENTER
Page 15 of 16


T.C.T. AREA IN
NO. SQ. MTR.
Bgy. San Pedro, Makati City OCT-6937 8,609
Guadalupe-Tejeros-Olympia Carline
Pasig River - Lopez Jaena Street OCT-6938 13,278
Bgy. Sta. Rosa, Pasig City 193 817
(Napindan Hydraulic Project) 14,095
P. Naval St., Bgy. Malaya, Pililia, Rizal 3254 284
Bgy. Palico, Imus, Cavite T-205046 1,166
PALICO SUBSTATION
Quezon Ave., Bgy. Gulang-Gulang, Lucena City T-11750 (534) 396
LUCENA I SUBSTATION
Bgy. Bolbok, Batangas City T-26251 1,313
(PROPOSED BATANGAS SERVICE CENTER) T-26252 306
T-26253 28,146
T-26254 8,379
T-26255 7,920
T-26332 992
47,056
Bgy. Mulawin, Norzagaray, Bulacan T-65142 6,836
VACANT
Bgy. Cruz Na Daan & Maginao, San Rafael, Bulacan T-305633 62,087
SAN RAFAEL SERVICE CENTER T-305632 1,183
63,270
Bgy. Parugan (now San Jose), Antipolo City T-297560 43,575
VACANT
Bgy.Quisao, Pililia, Rizal (Road) 272855 10,800
LOCATION/DESCRIPTION
MANILA ELECTRIC COMPANY
SUMMARY OF LAND AND LAND RIGHTS - NON UTILITY
AS OF DECEMBER 31, 2010
Page 1 of 2


T.C.T. AREA IN
NO. SQ. MTR.
Guerilla St., Bgy. Sto. Niño, Marikina City N-30472 700
VACANT
St. Joseph St., Bgy. Barangka, Marikina City N-30470 300
BARANGKA CHORILLO PROPERTY
National Road, Bgy. Putatan, Muntinlupa City S-79861 1,560
(FORMERLY MUNTINLUPA SUBSTATION)
Near Dragon Cement, Bgy. Dulong Bayan M-1602 6,648
Teresa, Rizal (FORMERLY TERESA I SUBSTATION)
Bgy. Mayani - Concepcion, Baras, Rizal M-16069 113
BARAS PROPERTY (VACANT)
Gomez St., Kapalaran Subd., Bgy. San Juan, Taytay, Rizal 96326 1,030
(FORMERLY TAYTAY SUBSTATION)
Sukol Highway, Bgy. Iba, Antipolo City 223294 2,117
(UNUTILIZED PORTION OF TERESA 2 SUBSTATION)
Provincial Road, Mabini St., Bgy. Mojon, (15814) RT-29353 803
Malolos, Bulacan (15815) RT-29352 99
(FORMERLY MALOLOS I SUBSTATION) 902
Cagayan Valley Road, Provincial Road, M-81168 1,857Bgy. Silangan, San Miguel, Bulacan
(UNUTILIZED PORTION OF SAN MIGUEL SUBSTATION)
MANILA ELECTRIC COMPANY
SUMMARY OF INVESTMENT PROPERTY
AS OF DECEMBER 31, 2010
LOCATION/DESCRIPTION
LAND & LAND RIGHTS
Page 1 of 4

T.C.T. AREA IN
NO. SQ. MTR.LOCATION/DESCRIPTION
Gen. Luna St., Bgy. Flores, Malabon City R-51156 1,399
VACANT
Bgy. Ayuti, Lucban, Quezon Province O-9737 340
(FORMERLY LUCBAN SUBSTATION)
Aguinaldo Highway, Bgy. Santiago, T-23724 1,000
Gen. Trias, Cavite (VACANT)
(FORMERLY SANTIAGO SUBSTATION)
Bgy. Subic, Baliuag, Bulacan T-307181 377
(FORMERLY SUBIC SUBSTATION)
VACANT
J. L. Escoda and Agoncillo Sts. Malate, Manila 240167 190
(UNUTILIZED PORTION OF MALATE BUSINESS CENTER) 24264 496
24265 416
1,102
Bgy. Graceville, (Gaya-Gaya) San Jose Del Monte, Bulacan T-80847 65,343
VACANT T-80848 41,383
T-179053(M) 993
107,719
Circumferential cor. Gen. Luna St. T-259022 996
Bgy. San Roque, Antipolo, Rizal
VACANT
San Marcelino St., Ermita, Manila 94970 1,956
(FORMERLY SAN MARCELINO OFFICE)
Commonwealth Ave., Diliman, Quezon City T-124759 468
VACANT
Claro M. Recto, Sta. Cruz, Manila 164445 275.4
(FORMERLY TONDO BRANCH OFFICE)
Page 2 of 4

T.C.T. AREA IN
NO. SQ. MTR.LOCATION/DESCRIPTION
Sumulong Highway, Bgy. Mayamot, Antipolo City R-3396(260671) 68,918
VACANT
Bgy. Punta, Jala-Jala, Rizal M-51186 246,840
Bgy. Burol Primero, Balagtas, Bulacan 158-A 3,020
(UNUTILIZED PORTION OF BALAGTAS BUSINESS CENTER)
M. Paulino St., San Pablo City, Laguna T-2790 900
(FORMERLY OLD SAN PABLO BRANCH OFFICE)
Bgy. Bayang Luma, Imus, Cavite T-250508 179
(FORMERLY IMUS PAYMENT OFFICE) T-250507 646
825
P. Burgos Avenue, San Roque, Cavite City T-11341 284
(FORMERLY CAVITE CITY BRANCH OFFICE)
Bgy. Minuyan, San Jose Del Monte, Bulacan T-181904-09 1,440
VACANT T-182022-23 740
T-190257-72 5,032
T-194330-31 6,509
13,721
Bgy. Pala-Pala, Dasmariñas, Cavite 322307 45,100
(FORMERLY CAVITE DISTRICT STOCKYARD)
San Pascual, Batangas 27192 33
VACANT 27193 163
27194 422
27227 365
27189 740
27190 1,005
27191 156
2,884
Page 3 of 4


Item 3. Legal Proceedings
In accordance with the SRC-IRR, the following are the material legal proceedings to which Meralco or any of its subsidiaries is a party, or of which any of their property is a subject, including pending claims for damages against the registrant exceeding 10% of its current assets: 1. In the matter of the Joint Application for Approval of the Settlement
Agreement between Manila Electric Company (Meralco) and National Power Corporation (NPC), with Prayer for Provisional Authority, National Power Corporation and Manila Electric Company, Applicants ERC Case No. 2004-109
(Filed by NPC and Meralco on April 15, 2004)
This is a joint application filed by Meralco and the National Power Corporation (NPC) for the approval of their Settlement Agreement which resolved their dispute concerning their ten (10) year Contract for Supply of Electricity (CSE).
Under the Settlement Agreement, Meralco was compensated by NPC for the losses incurred by the former due to NPC’s act of serving directly-connected customers in violation of Meralco’s franchise rights, and for transmission line delays affecting Meralco’s Independent Power Producers (IPPs). On the other hand, Meralco shall pay NPC the net settlement amount of P14,320 million, representing NPC’s minimum charges corresponding to the fixed costs it incurred for the period 2002-2004. Variable costs, such as fuel and similar operating expenses that were not incurred by NPC, were not included in the minimum charge computation. The Settlement Agreement allows Meralco to pay NPC the net settlement amount from collections recovered from Meralco’s customers (“pass-through”), over a period of five (5) to six (6) years, starting on the first billing month immediately following the Energy Regulatory Commission’s (ERC) approval of the pass-through, and ending sixty (60) months after the last billing month.
After the case had been submitted for decision by the ERC, the Office of the Solicitor General (OSG) belatedly filed, on May 8, 2008, a motion to intervene and an opposition, basically questioning the validity of the Settlement Agreement.
Meralco filed a Manifestation and Motion to Suspend Proceedings dated June 3, 2008 with the ERC in order to allow Meralco to obtain ruling from the regular court on the issues raised by the OSG which are outside the jurisdiction of the ERC. The ERC granted the motion in an Order dated September 14, 2009.
MERALCO v. NPC, Power Sector Assets and Liabilities Management Corporation (PSALM), and the Republic of the Philippines, represented by the Office of the Solicitor General. S.C.A. Case No. 3392, RTC Pasig City, Branch 71 (Filed on November 23, 2009)

In connection with the Settlement Agreement between Meralco and NPC, Meralco filed a Petition seeking the declaration of the court that said Settlement Agreement, independent of the pass-through provision which is reserved for approval by the ERC, is valid and binding. PSALM and NPC have already filed their respective comments. The OSG filed a motion to dismiss or to stay the proceedings and moved for the deferral of the pre-trial conference and the referral of the case to arbitration. The RTC issued orders denying the OSG’s motions. The OSG questioned the RTC Orders before the Court of Appeals (CA) via a Petition for Certiorari. Currently, the proceedings at RTC are suspended in the light of the Preliminary Injunction issued by the CA.
Republic of the Philippines, represented by the Office of the Solicitor General v. Hon. Franco T. Falcon, in his capacity as the Presiding Judge of Branch 71 Regional Trial Court (RTC), National Capital Judicial Region, Pasig City, Manila Electric Company (Meralco) and National Power Corporation (NPC).
CA-GR SP No. 116863, Court of Appeals
On November 22, 2010, the OSG elevated the denial of its motions in S.C.A. Case No. 3392 to the CA through a Petition for Certiorari, Prohibition and Mandamus. In a Resolution dated December 1, 2010, the CA issued a 60-day Temporary Restraining Order (TRO) against RTC-Pasig, Meralco and NPC restraining the respondents from further proceeding with the case so as not to render the Petition filed by OSG moot and academic. Meralco has already filed its comment to the Petition. In a Resolution dated February 3, 2010, the CA issued a writ of preliminary injunction enjoining the RTC from conducting further proceedings, issuing orders and performing such other acts in S.C.A. Case No. 3392 which would render the instant controversy moot and academic, effective during the pendency of the instant Petition. The parties were further directed to submit their respective memoranda within a non-extendible period of 30 days from receipt of the Resolution. Meralco filed its Memorandum within the reglementary period granted by the CA. 2. In The Matter of the Application for the Approval of the Unbundled
Rates Pursuant to the Provision of Republic Act No. 9136, Manila Electric Company, Applicant.
ERC Case No. 2001-900 RC (Filed on October 30, 2001)
In connection with the decision of the Supreme Court in G.R. Nos. 166769 and 166818, where the ERC was directed to request the Commission of Audit (COA) to undertake a complete audit of the books, records and accounts of Meralco, the COA submitted its Report No. 2009-01 on the Rate Audit of the Unbundled Charges of Meralco for Calendar Years 2004 to 2007 to the ERC.
In an Order dated February 15, 2010, the ERC directed all intervenors to comment on the COA’s report. So far, only intervenors NASECORE and Mr. Lualhati have filed their comments. Meralco has filed its reply to the comments of Mr. Lualhati and NASECORE and is now awaiting the response and/or resolution of the ERC on the matter.

3. In The Matter of the Application to Confirm Transmission Cost Over- and Under-Recoveries and Offset the Net Transmission Cost Over-Recoveries with the Transmission Cost Under-Recoveries Applied for Under ERC Case No. 2007-147 RC, Including Carrying Cost, with Prayer for Provisional Authority, Manila Electric Company, Applicant.
ERC Case No. 2009-054 RC (Filed on July 29, 2009)
This is an application filed by Meralco to offset the amount of P5,554 million transmission cost under-recoveries applied for in ERC Case No. 2007-147 RC for the period June 2003 to July 2007 plus transmission cost under-recoveries of P1,868 million from August 2007 to March 2008, against the transmission cost over-recoveries of P6,396 million incurred from April 2008 to April 2009, for a net transmission cost under-recovery of P1,026 million. Meralco likewise prayed for corresponding carrying cost in the amount of P1,563,377,100.91, over a three-year period starting August 2009 or in the billing cycle immediately following the ERC’s approval, at the rate of P0.0303/kWh..
On October 12, 2009, the ERC released an Order provisionally approving the application,
with modifications, wherein the ERC directed the refund of P4,917 million net transmission cost over-recoveries from August 2007 to April 2009, plus carrying cost of P257 million, for a total amount of P5,174 million. During the hearings of the case on the merits, Meralco presented evidence that the net transmission cost over-recoveries should only be P4,528 million and the covered period should be from August 2007 to April 2009. The case is submitted for the final decision of the ERC.
4. In the Matter of the Application for the Approval and Recovery of
Generation Cost Under the Second Generation Rate Adjustment Mechanism (2nd GRAM), together with Carrying Charges, with Prayer for Provisional Authority, Manila Electric Company, Applicant. ERC Case No. 2010-135 RC, Energy Regulatory Commission (Filed on November 12, 2010) In the March 2003 Decision on Meralco’s rate unbundling application, the ERC directed
Meralco to discontinue implementing the Purchased Power Adjustment, or PPA clause, with respect to its tariffs, subsequent changes in Meralco’s generation charge was covered by the ERC’s GRAM rules.
Under the GRAM rules, Meralco made three filings related to its deferred generation cost beginning November 2004 as well as a final GRAM filing to account for all generation costs prior to November 2004.
The approval by the ERC of the second GRAM filing was questioned before the SC by a group of electricity consumers on the ground that Meralco and the ERC failed to comply with Section 4(e), Rule 3 of the Implementing Rules and Regulations (IRR) of the Electric Power Industry Reform Act (EPIRA), which required publication, notice and hearing of application prior to issuance of the second GRAM Order.

The GRAM rules, however, neither require the publication of the application prior to its filing with the ERC, nor the conduct of formal hearings thereon.
On February 2, 2006, the SC ruled that strict compliance with Section 4(e), Rule 3 of the EPIRA IRR is jurisdictional and applies to the GRAM. Accordingly, the ERC’s second GRAM Order was declared void and was set aside. The motions for reconsideration separately filed by the ERC and Meralco were denied by the SC in a Resolution dated August 16, 2006.
On November 12, 2010, Meralco filed an application with the ERC for the recovery of the total generation costs refunded under the second GRAM, plus any additional amount that it will still refund to its customers pursuant to the SC Resolution dated August 16, 2006, and the corresponding carrying charges.
5. In the Matter of the Application for Refund of Overcharge (sic)
Distribution Rates in the Residential Rates of Php39 Billion in 2004-2007. ERC Case No. 2008-092 CC (Filed by the Applicant on July 15, 2008)
This application was filed against Meralco by customer Genaro C. Lualhati, seeking the
refund to residential consumers a total of P39 Billion on the ground that Meralco allegedly overcharged its distribution costs (distribution, metering, supply and systems loss charges) for the period of 2004-2007. The parties have filed their respective Memoranda on October 24, 2008. On August 23, 2010, the ERC has issued a Decision dismissing the aforesaid case. Mr. Lualhati has filed a Motion for Reconsideration which is pending before the ERC. 6. Leonard S. De Vera (Equal Justice For All Movement), et al., vs.
MERALCO, NPC and ERC. Civil Case No. 08-484, RTC Makati, Branch 134 (Filed by the plaintiffs on June 25, 2008)
C.A. GR CV No. 95198, Court of Appeals
This is a class suit filed by a group of Meralco customers for accounting and refund of all
system loss charges, meter deposits, income taxes and other charges and assessments allegedly illegally collected and passed-on to customers.
Meralco filed a Motion to Dismiss, which motion was granted by the Court in an Order dated May 14, 2009. Plaintiffs’ Motion for Reconsideration was denied by the Court in an Order dated April 16, 2010.
The matter was elevated to the Court of Appeals and the plaintiffs-appellants have already
filed their Appellants’ Brief. Meralco is preparing to file its Appellee’s Brief within the period required under the rules.

7. In the matter of the Application to Implement MERALCO’s PBR rates for Regulatory Years 2008 and 2009, under the ERC’s Performance Based Regulation. ERC Case Nos. 2008-004-RC and 2008-018-RC (Filed on January 11 and April 1, 2008)
NASECORE, FOVA and FOLVA v. MERALCO. C.A. GR SP No. 108663, Court of Appeals (Filed by petitioners on May 28, 2009)
NASECORE, FOVA and FOLVA v. MERALCO. G.R. No. 191150, Supreme Court (Filed by petitioners on March 26, 2010) On January 11 and April 1, 2008, Meralco filed separate applications for the approval of its
proposed translation of the MAP for Regulatory Years (RY) 2008 and 2009, respectively, into different rate schedules for Meralco’s various customer segments. On October 17, 2008, the ERC released its consolidated Decision on the applications. To avoid price shocks and mitigate the rate impact on end-users, the ERC subjected the proposed rate to side constraints and approved a MAP for the regulatory year 2009 of only P1.2280 per kWh. The ERC’s Decision also directed Meralco to implement its approved Distribution, Supply and Metering Charges starting July 1, 2008.
The implementation was suspended, however, when the ERC, in an Order dated October 27, 2008, resolved to defer the implementation of the Decision until final resolution of NASECORE’s motion for reconsideration.
In April 2009, the ERC resolved the pending motion for reconsideration and approved the implementation of Meralco’s average distribution rate for Regulatory Year (RY) 2009 in the amount of P1.2227 per kWh effective the billing period starting May 2009.
On May 28, 2009, the National Association of Electricity Consumers for Reforms, Inc. (NASECORE) and other consumer groups filed a petition before the Court of Appeals questioning the ERC decision and order on Meralco’s rate translation applications. In a Decision dated January 29, 2010, the Court of Appeals denied the petition. NASECORE and the other consumer groups have elevated the matter to the Supreme Court via a Petition for Review. Meralco has filed its Comment to the Petition and the case is now awaiting final decision by the Supreme Court. 8. In the Matter of the Application for Approval of: a) MAP for
RY 2010; and b) Translation of the MAP for RY 2010 into a Distribution Rate Structure for its Various Customer Classes, with Prayer for Provisional Authority, Manila Electric Company (Meralco), Applicant. ERC Case No. 2009-057 RC (Filed on August 7, 2009)
NASECORE, FOVA and FOLVA v. ERC and MERALCO. G.R. No. 190795, Supreme Court (Petition dated December 14, 2009)

On August 7, 2009, Meralco filed an application for the verification of the MAP for
Regulatory Year 2010 and its translation into tariffs by customer category. In a Decision dated December 14, 2009, the ERC approved the application and directed Meralco to, among other things, adopt the MAP 2010 of P1.4917/kWh, and implement its approved Distribution, Supply and Metering Charges for its various customer classes starting January 2010 billing.
On January 11, 2010, Intervenor Mallillin filed a Motion for Reconsideration of the said decision. Considering the pendency of this Motion, Meralco voluntarily suspended the implementation of the decision. In an Order dated March 10, 2010, the ERC resolved the motion for reconsideration deeming it appropriate to approve a new rate schedule that will remove all rate distortions to better ensure that there will be no cross-subsidies, other than the lifeline subsidy, in Meralco’s rates. The order also lifted the suspension of the implementation of the Decision dated December 14, 2009.
Subsequently, despite the opportunity allowed for them to file their own motions for reconsideration and other appropriate pleadings before the ERC, NASECORE and the other consumer groups opted to file a Petition for Certiorari with the Supreme Court questioning the Decision rendered by the ERC, on the ground of alleged lack of due process. Meralco filed its Comment on the petition and the case is now awaiting further action from the Supreme Court. 9. In the Matter of the Application for Approval of: a) MAP for
RY 2011; and b) Translation of the MAP for RY 2011 into a Distribution Rate Structure for its Various Customer Classes, with Prayer for Provisional Authority, Manila Electric Company (Meralco), Applicant. ERC Case No. 2010-027 RC (Filed on April 5, 2010)
This is Meralco’s application for the verification of its MAP for RY 2011 and its translation
into tariffs by customer category. The Application prays for an unconstrained MAP for RY 2011 of P2.6493 per kwh. The constrained MAP for implementation was proposed to be P1.6464 per kwh. In a Decision dated December 6, 2010, the ERC approved Meralco’s application for the constrained MAP 2011 of P1.6464/kWh, limited by the Side Constraints and S Factor of P0.0087/kWh; and ordered Meralco to implement, starting the next billing cycle from receipt hereof, its approved Distribution, Supply and Metering Charges. The implementation of the MAP2011 rates started in the January 2011 billing month. 10. In the Matter of the Application for Approval of the Annual
Revenue Requirement and Performance Incentive Scheme for the Third Regulatory Period (2011 to 2015) in Accordance with the Provisions of the Rules for Setting Distribution Wheeling Rates (RDWR) as amended, Manila Electric Company (Meralco), Applicant. ERC Case No. 2010-069 RC (Filed on June 18, 2010)

On June 18, 2010, Meralco filed its application for the approval of its proposed Annual Revenue Requirement or ARR and Performance Incentive Scheme or PIS for the Third Regulatory Period (July 1, 2011- June 15, 2015). The hearings in this case have been terminated and ERC has released its Draft Determination which contains the ERC’s initial position on Meralco’s application. On February 7, 2011 and March 15, 2011, the ERC conducted public consultations on Meralco’s Draft Determination. Meralco has filed its comments to the Draft Determination and is awaiting further action by the ERC on this matter. 11. In the Matter of the Resolution Issued by the Board of
Directors of the Philippine Electricity Market Corporation (PEMC) Directing the Adjustment of Settlement Prices in the Wholesale Electricity Spot Market, PSALM v. PEMC and MERALCO G.R. No. 190119 Supreme Court (Petition dated November 25, 2009; Received by the Company on December 4, 2009)
This is a Petition filed by PSALM appealing the Decision dated August 28, 2009 in C.A. G.R. SP No. 106322 which affirmed the Order of the ERC setting the WESM settlement prices for the third and fourth billing periods at the ERC-approved NPC-TOU rates.
The Petition arose due to the Company’s request for the investigation of the significant increases in WESM prices during the third and fourth months of WESM operations to determine whether there was a breach of the WESM rules or an anti-competitive behavior has occurred.
Acting on said letters, PEMC conducted an investigation of the third and fourth billing periods and came up with the findings that PSALM “behaved anti-competitively and abused its market power.” As a consequence, PEMC, through a Resolution No. 2006-70 dated November 22, 2006, directed that the settlement amounts for the third and fourth WESM months be adjusted to the administered prices, which were below the NPC-TOU rates.
Upon receipt of PEMC’s Resolution, NPC elevated the issue to the ERC and asked the latter to reconsider the price adjustments. On August 14, 2007, the ERC issued its Decision declaring PEMC's Resolution to have been carried out beyond the scope of its authority. It also directed the adjustment of the WESM settlement prices for the third and fourth billing months to be the resulting settlement prices.
Considering the impact of the ERC Decision dated August 14, 2007 to the consumers, the Company filed a Motion for Reconsideration (MR) on September 17, 2007. In said Motion, the Company emphasized that the use of WESM settlement prices would result in additional imposition of 6.00 per kWh, which would translate to an increase in the generation charge of its customers of about 90 centavos and 2.05 per kWh, for the supply months of September 2006 and October 2006, respectively. Thus, the Company asked the ERC to exercise its authority to intervene for the greater interest of the industry and the consumers, and set the WESM settlement prices for the aforesaid period at NPC-TOU rates.

On January 30, 2008, the ERC issued a Decision granting the Company’s MR and set the WESM settlement prices for the third and fourth billing periods at the ERC-approved NPC-TOU rates.
The matter was elevated by PSALM to the Court of Appeals which dismissed the Petition. Hence, PSALM filed a Petition for Review for Certiorari before the Supreme Court. The Company has filed its Comment to the Petition and is now awaiting the decision of the Supreme Court.
12. In the Matter of the Petition for Approval of a Lower Generation Charge for Billing Month of March 2010 and for the Recovery of the Differential Generation Charge within a Six (6) Month Period, Including the Carrying Cost, with Prayer for Provisional Authority, Manila Electric Company (Meralco), Applicant. ERC Case No. 2010-017 RC (Filed on March 9, 2010)
The Petition was filed to mitigate the effects of the abrupt increase in generation cost. The
Company’s generation cost amounted to P15.9 Billion for the supply month of February 2010. This translates to a generation charge of P6.76/kWh to its customers for the March 2010 billing. This sharp and sudden increase in generation cost is mostly accounted for by the high prices in the WESM, brought about by the tight electricity supply, as several plants were either out due to preventive or emergency maintenance, or with de-rated capacity because of the “El Nino” phenomenon and higher temperature.
Meralco proposed that instead of reflecting the actual generation charge of P6.76/kWh in its March 2010 billing to its customers, a lower generation charge of P6.3154/kWh be implemented, with the differential to be spread over six months starting April 2010 through a P0.07 per kWh adjustment to the subsequent months’ generation charge until the sum of P1.046 billion is recovered. In its Order dated March 10, 2010, the ERC provisionally approved a lower generation charge of P5.8417 per kWh for the subject period. Meralco was also provisionally allowed to charge over a six month period starting April 2010 the generation charge at the rate of P0.07 per kWh, corresponding to the incremental costs of the condensate fuel used by the First Gas plants during the said period. The balance of the generation costs, which Meralco is seeking to recover in the same petition, is now undergoing evaluation by the ERC. All hearings have been completed with the case pending decision by the ERC. 13. In Re Petition for Dispute Resolution. Manila Electric
Company v. Philippine Electricity Market Corporation, National Transmission Corporation, National Power Corporation and Power Sector Assets and Liabilities Management ERC Case No. 2008-083 MC (Filed on September 9, 2008)

This is a Petition for Dispute Resolution against PEMC, TransCo, NPC and PSALM as a result of the congestion in the transmission system of TransCo arising from the outage of the San Jose-Tayabas 500kV Line 2 on June 22, 2008, followed by the outage of the 500kV 600 MVA Transformer Bank #2 of TransCo’s San Jose, Bulacan substation on July 11, 2008. The Petition seeks to, among others, direct NPC and PSALM to refund the transmission line loss components of the line rentals associated with NPC/PSALM bilateral transactions from the start of WESM operation on June 26, 2006.
In a Decision dated March 10, 2010, the ERC sustained Meralco's position and held that
there is double charging of the Transmission Line Cost on Meralco by NPC for Transition Supply Contract (TSC) quantities, since the start of the TSC in November 2006. PEMC and NPC filed separate Motions for Reconsideration. To date, the ERC is yet to resolve the pending motions. 14. In the Matter of the Petition for Dispute Resolution Manila
Electric Company (Meralco) v. National Power Corporation and Power Sector Assets and Liabilities Management ERC Case No. 2009-052 RC (Filed on June 2, 2009)
This is a Petition for Dispute Resolution against NPC and PSALM regarding NPC’s imposition of premium charges for the alleged excess energy it supplied to Meralco covering the billing periods May 2005 to June 2006. The premium charges amounted to P315 million during the May to June 2005 billing periods and P318 million during the November 2005, February 2006 and April to June 2006 billing periods. Meralco believes that there is no basis for the imposition of the premium charges because (i) there was no ERC-approved TSC between petitioner and NPC and, (ii) the premium charges imposed by NPC have not been approved by the ERC. The hearings on this case have been completed and Meralco is now awaiting the Decision of the ERC on the matter. 15. In the Matter of the Application for the Reclassification of the
Manila Electric Company’s Development of the Paco 230 KV-115 KV Delivery Point Substation Project. National Grid Corporation of the Philippines v. Manila Electric Company (Meralco) ERC Case No. 2010-056 MC (formerly ERC Case No. 2010-039 RC) (Application dated April 22, 2010)
Among the Capital Expenditure Projects approved by the ERC’s Final Determination of Meralco's Application (docketed as ERC Case No. 2006-045 RC) for its Annual Revenue Requirement and Performance Incentive Scheme for the 2nd Regulatory Period (2RP) is the "Development of the Paco 230kV-115kV Delivery Point Substation Project" with an approved project cost of P1,419,830,860.00. On April 30, 2010, NGCP filed an Application with the ERC to reclassify the Paco 230-115kV Delivery Point Substation Project from subtransmission to transmission. The next hearing is set on April 12. 2011 for Meralco's presentation of evidence.

Item 4. Submission of Matters to a Vote of Security Holders
No matter was submitted during the fourth quarter of the fiscal year covered by this report to a vote of security holders.

PART II PART II PART II PART II –––– OPERATIONAL AND FINANCIAL INFORMATION OPERATIONAL AND FINANCIAL INFORMATION OPERATIONAL AND FINANCIAL INFORMATION OPERATIONAL AND FINANCIAL INFORMATION
Item 5. Market for Common Equity and Related Stockholders Matters
(1) Market Information
The principal market where Meralco’s common equity is traded is the Philippine Stock Exchange. The quarterly high and low sales prices for fiscal years 2010 and 2009 follow:
MER
FROM TO HIGH LOW 01/01/09 03/31/09 126.00 58.00 04/01/09 06/30/09 154.00 87.50 07/01/09 09/30/09 295.00 143.00 10/01/09 12/31/09 228.00 166.00 01/01/10 03/31/10 208.00 152.00 04/01/10 06/30/10 193.00 163.00 07/01/10 09/30/10 225.00 171.00 10/01/10 12/31/10 234.80 175.00
As of March 18, 2011 the price for Meralco Stocks is P226.00. As of December 31, 2010 the public ownership percentage of the Company is 27.84%.
(2) Holders
The total number of stockholders as of March 18, 2011 is 50,550.
Top 20 Stockholders as of March 18, 2011
Rank Stockholder Name Number of Shares
Percent
1 Beacon Electric Asset Holdings, Inc. 392,502,961 34.82%
2 Government Service Insurance System 332,172,311 29.47%
3 PLDT Communications & Energy Ventures, Inc. 68,800,000 6.10%
4 PCD Nominee Corporation (Filipino) 67,386,773 5.98%
5 Social Security System 62,990,689 5.59%
6 PCD Nominee Corporation (Foreign) 59,036,096 5.24%
7 First Philippine Holdings Corporation 44,382,436 3.94%
8 First Philippine Union Fenosa, Inc. 30,093,270 2.67%
9 Board of Administrator - ESOP 14,313,674 1.27%
10 Development Bank of the Philippines 5,668,900 0.50%
11 Manuel M. Lopez &/or Ma. Teresa L. Lopez 1,449,293 0.13%

12 Josefina S. Lubrica 1,402,750 0.12%
13 Manuel M. Lopez 795,957 0.07%
14 Concepcions’ &/or Araneta 774,257 0.07%
15 Lucio W. Yan 403,208 0.04%
16 DBP Management Corporation 400,000 0.04%
17 Jesus P. Francisco 317,487 0.03%
18 Charlotte Cua Cheng 314,534 0.03%
19 Avesco Marketing Corporation 284,427 0.03%
20 B.P. Insurance Agency, Inc. 281,079 0.02%
(3) Dividends
Following are the cash dividends declared by the Company in favor of Meralco common shares for the two (2) most recent years ended December 31, 2009 and 2010:
YEAR RATE PER SHARE RECORD DATE PAYABLE DATE 2009 P1.00 06/09/2009 06/30/2009 P1.50 11/13/2009 12/11/2009 2010 P3.15 04/21/2010 05/11/2010 P2.50 08/23/2010 09/16/2010 P1.30 12/29/2010 01/17/2011
The Company’s loan agreements contain restrictions on payments of cash dividends to common stockholders subject to meeting certain financial measures, which the Company complied with.
(4) Recent Issuance of Securities Constituting an Exempt Transaction
On April 13, 2011, the Securities and Exchange Commission (SEC) approved the exemption from the requirement of registration of FIFTEEN MILLION (15,000,000) common shares, which were allocated to the amended Employees Stock Purchase Plan (ESPP) with the approval of the stockholders on May 25, 2010 and intended for offering to qualified participants under the Plan.
In its resolution, the SEC recognized the fact that the offering is limited in character and that prior registration of the securities is not necessary in the public interest or for the protection of the investors and, therefore, exempt from the registration requirement pursuant to Section 10.2 of the Securities Regulation Code.

Item 6. Management’s Discussion and Analysis of Financial ConditionItem 6. Management’s Discussion and Analysis of Financial ConditionItem 6. Management’s Discussion and Analysis of Financial ConditionItem 6. Management’s Discussion and Analysis of Financial Condition
and Results of Operationand Results of Operationand Results of Operationand Results of Operation
The following discussion and analysis of financial position and results of operations
of Manila Electric Company or MERALCO or “Parent Company”, and its subsidiaries,
collectively referred to as the “Company” of “MERALCO Group” should be read in
conjunction with the audited consolidated financial statements as at December 31, 2010.
The audited consolidated financial statements are prepared in accordance with the
Philippine Financial Reporting Standards or PFRS.
The audited financial statements are presented in Philippine peso, the Company’s
functional and presentation currency as defined under PFRS. All values are rounded to the
nearest million peso, except when otherwise indicated. The exchange rate used to translate
U.S. dollars to Philippine peso in this report and in the accompanying audited financial
statements is US$1.00 to P=43.84, the closing rate on December 30, 2010 (the last trading
day in year 2010) quoted through the Philippine Dealing System.

Financial Highlights and Key Performance Indicators
As at December 31
% Change (Amounts in millions, except financial ratios, earnings per share, and operational data) 2010 2009 2008 2010 v 2009 2009 v 2008
Condensed Statements of Financial Position
Total assets P=178,968 P=172,129 P=169,885 4.0 1.3
Current assets 55,757
44,685
48,735
24.8
(8.3)
Cash and cash equivalents 24,370
17,068
5,402
42.8
216.0
Equity attributable to equity holders of the parent 58,969
57,369
52,607
2.8
9.1
Total debt 21,221
21,816
26,187
(2.7)
(16.7)
Current liabilities 44,405
42,123
45,837
5.4
(8.1)
Financial Ratios
Debt to equity 0.36
0.38
0.50
-
-
Current ratio 1.26
1.06
1.06
-
-
Operational Data
Number of customers (in thousands)
Residential 4,412
4,277
4,143
3.2
3.2
Commercial 421
410
414
2.7
(1.0)
Industrial 10
10
10
-
-
Streetlights 4
4
4
-
-
For the years ended December 31
% Change
2010 2009 2008 2010 v 2009 2009 v 2008
Condensed Statements of Income
Revenues P=245,461 P=184,550 P=191,775 33.0
(3.8)
Costs and expenses 231,024
175,571
186,575
31.6
(5.9)
Income before income tax 14,437
8,979
5,200
60.8
72.7
Net income 10,117
6,356
3,133
59.2
102.9
Net income attributable to equity holders of the parent 9,685 6,005 2,800 61.3 114.5
Earnings per share
Basic 8.59
5.42
2.54
58.5
113.4
Diluted 8.59
5.42
2.53
58.5
114.2
Financial Ratios
Profit margin 4%
3%
2%
-
-
Return on equity 17%
11%
5%
-
-
Asset turnover 1.40
1.08
1.10
-
-
Condensed Statements of Cash Flows
Cash generated from operating activities P=20,358 P=29,270 P=14,337 (30.4)
104.2
Cash used in investing activities (6,292)
(8,770)
(5,119)
(28.3)
71.3
Capital expenditures 9,053
8,890
9,175
1.8
(3.1)
Cash used in financing activities (6,764)
(8,834)
(8,692)
(23.4)
1.6
Operational Data
Electricity sales volume (in GWh) 30,247
27,516
27,049
9.9
1.7

System loss (in percentage)1
MERALCO 7.94%
8.61%
9.28%
(7.8)
(7.2)
CEDC 3.81%
3.86%
4.76%
(1.3)
(18.9)
OVERVIEW
MERALCO is the Philippines’ largest electric power distribution company, with franchise service
area covering 9,337 square kilometers. It provides power to 4.8 million customers in 31 cities and 80
municipalities, which include the whole of Metro Manila, the provinces of Rizal, Cavite and Bulacan, and
parts of Pampanga, Batangas, Laguna and Quezon. Business establishments in the franchise area account
for almost 46% of the country’s Gross Domestic Product or GDP.
Through Clark Electric Distribution Corporation or CEDC, a 65%-subsidiary, it holds the power
distribution franchise for Clark Special Economic Zone in Clark, Pampanga. CEDC franchise area covers
32 square kilometres and 1,611 customers.
The Company is organized into three major operating segments, namely, power distribution, real
estate and contract services and others. In 2010, MERALCO PowerGen Corporation or MPG (formerly
Asian Center for Energy Management), a wholly owned subsidiary, was reorganized as the Company’s
vehicle for potential entry into power generation. As at December 31, 2010, MPG has just begun
development of the proposed power generation plants.
BUSINESS SEGMENTS
Power Real Estate Contracts, Services and Others Distribution • MERALCO
• Rockwell Land Corporation or Rockwell Land
• MERALCO Industrial Engineering Services Corporation or MIESCOR, and subsidiaries
• CEDC • MERALCO Financial Services Corporation or Finserve
Generation • MPG
• Lighthouse Overseas Insurance Ltd. or LOIL
• Republic Surety and Insurance Company, Inc. or RSIC
• Corporate Information Solutions, Inc. or CIS and subsidiaries
• e-MERALCO Ventures, Inc. or e-MVI
• MERALCO Energy, Inc. or MEI
1 Based on 12-month moving average

RESULTS OF OPERATIONS
The table summarizes the consolidated results of operations and the contribution of each business
segment to the Company’s revenues, costs and expenses, and net income for the years ended December
31, 2010, 2009 and 2008.
Power
Distribution Real Estate
Contracts, Services and Others
Inter-segment
transactions Consolidated
(Amounts in millions)
For the year ended
December 31, 2010
Revenues P=239,164 P=3,375 P=4,597 (P=1,675) P=245,461
Costs and expenses 225,905 2,785 3,193 (859) 231,024
Net income 9,443 444 958 (728) 10,117
Net income attributable to equity holders of the parent 9,405 228 780 (728) 9,685
For the year ended
December 31, 2009
Revenues 178,752 2,877 3,703 (782) 184,550
Costs and expenses 170,694 2,447 2,476 (46) 175,571
Net income 5,881 287 859 (671) 6,356
Net income attributable to equity holders of the parent 5,852 146 678 (671) 6,005
For the year ended
December 31, 2008
Revenues 187,063 2,213 3,056 (557) 191,775
Costs and expenses 182,358 1,896 1,655 666 186,575
Net income 3,181 180 995 (1,223) 3,133
Net income attributable to equity holders of the parent 3,145 92 786 (1,223) 2,800

2010 compared with 2009
On a Consolidated Basis
Revenues
The Company registered consolidated revenues for the year ended December 31, 2010 amounted
to P=245,461 million, 33% higher compared with the P=184,550 million for the same period last year. Sales
from all operating segments increased during the year with the highest registered by power distribution.
The robust sales were brought about by the increase in electric spending and the delayed implementation
of the rate adjustment approved by the Energy Regulatory Commission or ERC. The increase in electricity
spending is attributable to (i) increased number of customers across all customer classes, (ii) growth in
various industries as restocking activities resume after the global economic crisis, (iii) unusually warmer
temperature during the first half of the year and, (iv) election spendings. Sales from electricity amounted to
P=239,077 million, an increase of P=60,391 million, or 34%, from P=178,686 million for the year ended
December 31, 2009.
The following table shows the composition of the Company’s consolidated revenues for the years
ended December 31, 2010 and 2009 by business segment:
Change
2010 % 2009 % Amount %
(Amounts in millions)
Power distribution P=239,164 97 P=178,752 97 P=60,412 34
Real estate 3,375 1 2,877 1 498 17
Contracts and services 4,597 2 3,703 2 894 24
Inter-segment transactions (1,675) - (782) - (893) 114
Consolidated P=245,461 100 P=184,550 100 P=60,911 33
Costs and Expenses
Consolidated costs and expenses amounted to P=231,024 million for the year ended December 31,
2010, P=55,453 million higher than the P=175,571 million last year, primarily due to higher purchased power
costs, increased provision for doubtful accounts, accrual for compensation and employee benefits,
including adjustments for current year’s costs of the concluded Collective Bargaining Agreement, and
adjustments in regulatory expenses due to the ERC.

The following table shows the breakdown of the Company’s consolidated costs and expenses for
the years ended December 31, 2010 and 2009 by business segment:
Change
2010 % 2009 % Amount %
(Amounts in millions)
Power distribution P=225,905 98 P=170,694 97 P=55,211 32
Real estate 2,785 1 2,447 1 338 14
Contracts and services 3,193 1 2,476 2 717 29
Inter-segment transactions (859) - (46) - (813) 1,767
Consolidated P=231,024 100 P=175,571 100 P=55,453 32

Net Income
The 2010 consolidated full year results reflect higher recurring net income compared with 2009
mainly as a result of increased volume of energy sold. The unprecedented 10% growth in demand was the
result of unusually high temperatures, higher consumption brought about by election spending in the first
half of 2010 and of the upturn in business expansions within the franchise area throughout the year. In
addition, the combined effect of the 3% increase in the number of billed customers to 4.8 million albeit
delayed implementation of the distribution rate adjustment for the 3rd Regulatory Year (July 1, 2009 – June
30, 2010) of the 2nd Regulatory Period and the notably lower interest charge as a result of the refinancing
concluded in 2009 resulted in a record performance for the year.
The following table shows the breakdown of the Company’s consolidated net income for the years
ended December 31, 2010 and 2009 by business segment:
Change
2010 % 2009 % Amount %
(Amounts in millions)
Power distribution P=9,443 93 P=5,881 93 P=3,562 61
Real estate 444 4 287 5 157 55
Contracts and services 958 10 859 13 99 12
Inter-segment transactions (728) (7) (671) (11) (57) 9
Consolidated P=10,117 100 P=6,356 100 P=3,761 59
Net Income Attributable to Equity Holders of the Parent
Consolidated net income attributable to equity holders of the parent increased to P=9,685 million for
the year ended December 31, 2010 from P=6,005 million last year. Consolidated core income increased by
P=5,152 million to P=12,155 million in 2010 from P=7,003 million in 2009. Consolidated basic and diluted
earnings per share as at December 31, 2010 increased to P=8.59 from P=5.42 as at December 31, 2009, due
to the 61% increase in the consolidated net income attributable to equity holders of the parent. The
weighted average number of common shares is 1,127 and 1,108 million for the years ended December 31,
2010 and 2009, respectively.

On a Business Segment Basis
Power Distribution
Revenues
Revenues generated from power distribution amounted to P=239,164 million for the year ended
December 31, 2010, higher by 34% compared with P=178,752 million in 2009. The composition of revenues
from the power distribution for the years ended December 31, 2010 and 2009 is summarized in the
following:
Change
2010 % 2009 % Amount %
(Amounts in millions)
Electric revenues
Pass-through charges
Generation charge P=158,439 66 P=107,635 60 P=50,804 47
Transmission charge 25,429 11 23,250 13 2,179 9
System loss charge 11,567 5 16,108 9 (4,541) (28)
195,435 82 146,993 82 48,442 33
Wheeling charges
Distribution charge 29,518 12 21,276 12 8,242 39
Supply charge 8,705 4 6,560 4 2,145 33
Metering charge 5,506 2 3,923 2 1,583 40
43,729 18 31,759 18 11,970 38
Total P=239,164 100 P=178,752 100 P=60,412 34
Pass-Through Charges
For the year ended December 31, 2010, pass-through charges increased by P=48,442 million, or
33% to P=195,435 million compared with P=146,993 million in 2009, as a result of higher average generation
charge during the year, partially offset by the decrease in the average recoverable system loss charge to
P=11,567 million from P=16,108 million. System loss rate dropped by 70 basis points from 8.6% for the year
ended December 31, 2009 to 7.9% for the year ended December 31, 2010, 0.6 percentage points below
the ERC-imposed system loss cap of 8.5%.

Wheeling Charges
Wheeling charges, which consists of distribution, supply and metering charges amounted to
P=43,729 million, higher by 38% from P=31,759 million in 2009, mainly as a result of higher electric spending
and the delayed Performance-based Rate or PBR adjustment in April 2010. Energy sold went up to 30,247
GWh from 27,516 GWh in 2009, up by a record 10% year-on-year growth, surpassing by multiples the
average growth of 2% over the past five years. In addition, the number of customers served increased to
4.8 million, an additional of 146,122 from 4.7 million customers served in 2009.
The following table summarizes the customer count and the corresponding electric consumption
per customer class for the years ended December 31, 2010 and 2009:
No. of Customers Electricity Sales % Change
(in thousands) (in GWh) No. of Electricity
Customer Class 2010 2009 2010 2009 Customers Sales
Residential 4,412 4,277 9,540 8,904 3 7
Commercial 421 410 11,830 10,922 3 8
Industrial 10 10 8,734 7,548 - 16
Streetlights 4 4 143 142 - 1
Total 4,847 4,701 30,247 27,516 3 10
Sales to industrial customers increased by 16% to 8,734 GWh. The turnaround in industrial energy
sales from 2009 is attributable to increased consumption, particularly by manufacturers of semiconductors,
electronics, food and plastic products. Energy sold to commercial customers registered an increase of 8%
to 11,830 GWh in 2010. This growth was driven by the real estate, transport, telecommunications
companies and private services consisting of malls, call centers and Business Process Outsourcing or BPO
services. Sales to residential customers increased by 7% to 9,540 GWh.
In April 2010, MERALCO implemented the ERC-approved PBR adjustment of P=0.269 per kWh in
average distribution rate increasing from P=1.2227 per kWh to P=1.4917 per kWh. The unbundled
components of the distribution rates are as follows:
Rate per kWh
2010 2009 Increase
Distribution charge P=0.9991 P=0.8058 P=0.1933
Supply charge 0.3026 0.2560 0.0466
Metering charge 0.1900 0.1609 0.0291
Total P=1.4917 P=1.2227 P=0.2690

CEDC’s average distribution rate was at P=0.71 per kWh for the year ended December 31, 2010,
slightly higher than the rate in 2009.
Costs and Expenses
Costs and expenses of the power distribution segment increased by P=55,211 million, or 32%, to
P=225,905 million in 2010 compared with P=170,694 million in 2009.
Breakdown of costs and expenses is summarized in the following table:
Change
2010 % 2009 % Amount %
(Amounts in millions)
Purchased power P=200,916 89 P=150,928 88 P=49,988 33
Operations and maintenance 16,068 7 13,592 8 2,476 18
Depreciation and amortization 5,795 3 4,744 3 1,051 22
Taxes, fees and permits 817 - 329 - 488 148 Provision for probable losses from refund - net 4,118 2 2,172 1 1,946 90
Interest and other financial charges 536 - 3,798 2 (3,262) (86)
Interest and other financial income (1,987) (1) (4,132) (2) 2,145 (52) Equity in net earnings of associates and a joint venture (1,012) - (953) - (59) 6
Others 654 - 216 - 438 203
Total P=225,905 100 P=170,694 100 P=55,211 32
Purchased Power
For the year ended December 31, 2010, purchased power costs amounted to P=200,916 million, an
increase of 33% from P=150,928 million in 2009 brought about by the higher electricity consumption
particularly from the industrial customers and increased in average purchased power cost per kWh. The
volume of power purchased from the National Power Corporation or NPC, Wholesale Electricity Spot
Market or WESM and Independent Power Producers or IPPs increased to 32,925 GWh, 9% higher
compared with 30,173 GWh in 2009.
Generation and transmission charges account for 82% of the total electricity sales. The average
pass-through generation charge in 2010 amounted to P=5.43 per kWh. The average purchase price from
WESM was P=8.31 per kWh, almost three times the price in 2009 of P=2.78 per kWh. Charges by the WESM
peaked at P=12.16 per kWh in March 2010. Purchase power costs billed by NPC ranged from P=3.68 per
kWh to a high of P=6.60 per kWh in August 2010, for an average price of P=5.24 per kWh in 2010. NPC’s
peak price of P=6.60 per kWh included an unexpected P=1.20 per kWh increase in its automatic adjustments,

which was subsequently reduced by ERC. On the other hand, purchases under our long-term bilateral
contracts with IPPs ranged from P=3.75 to P=5.83 per kWh in 2010 or an average of P=4.55 per kWh. This
was largely due to the higher dispatch and lower fuel cost of the Sta. Rita and San Lorenzo natural gas
plants.
Operations and Maintenance
Operations and maintenance expense increased by P=2,476 million, or 18%, to P=16,068 million for
the year ended December 31, 2010 compared with P=13,592 million for the year ended December 31, 2009
brought about by the increases in salaries and wages and provision for doubtful accounts.
Depreciation and Amortization
Depreciation expense for the year ended December 31, 2010 amounted to P=5,795 million, 22%
higher compared with P=4,744 million for the year ended December 31, 2009. Increase in the depreciation
expense is attributed to the 35 electric projects completed during the year. The major capital projects during
the year included, among others, the commissioning of the NAIA-3 and Fort Bonifacio Global City Taguig
substations and the construction of the Kaybiga-Novaliches and the Tagaytay-West-Tagaytay 115kV Lines.
Taxes, Fees and Permits
Taxes, fees and permits increased by P=488 million, or 148%, to P=817 million for the year ended
December 31, 2010 compared with P=329 million in 2009 brought about by the increase in the ERC
regulation and supervision fees and permits to P=653 million in 2010 compared with P=214 million in 2009.
Provision for Probable Losses from Refund - Net
Provision for probable losses from refund- net amounted to P=4,118 million for the year ended
December 31, 2010 due to additional provisions for legal and regulatory claims during the year.
Interest and Other Financial Charges
Interest and other financial charges dropped by P=3,262 million to P=536 million from P=3,798 million
in 2009 as a result of the concluded refinancing of the Company’s debt with significantly lower rates,
decrease in the applicable interest rate on customers’ bill deposits as approved by the ERC to 0.75% from
the varying rates ranging from 1% to 10% and decrease in carrying charges on ERC-approved refunds. In
2010, the ERC has not approved any refund of over-recoveries.
Interest and Other Financial Income
Interest and other financial income amounted to P=1,987 million, P=2,145
million or 52% lower than the P=4,132 million earned in 2009. In 2009, the ERC approved MERALCO’s
application to recover under-recoveries in the transmission charges plus carrying costs, which were
recognized as part of the “interest and other financial income” account. In 2010, there was no similar
approval by the ERC.

Equity in Net Earnings of Associates and a Joint Venture
Equity in net earnings of associates and a joint venture amounted to P=1,012 million, 6% higher
compared with P=953 million in 2009 due to higher earnings posted by the subsidiaries particularly from
Rockwell Land.
Net Income Attributable to Equity Holders of the Parent
Net income from power distribution attributable to parent for the year ended December 31, 2010
amounted to P=9,405 million, P=3,553 million or 61% higher compared with the amount earned in 2009 as a
result of higher revenues generated in 2010.
Real Estate
The Company is involved in construction and development of several residential condominiums
namely, Number One Rockwell, The Grove and Edades Tower and Garden Villas through its subsidiary,
Rockwell Land.
Revenues
Revenues from real estate segment increased by P=498 million or 17% to P=3,375 million for the
year ended December 31, 2010 compared with P=2,877 million in 2009.
Change
2010 % 2009 % Amount %
(Amounts in millions)
Sales of condominium units P=3,375 100 P=2,877 100 P=498 17
Revenues from real estate are recognized using the percentage-of-completion method, where
revenues are recognized based on the proportion of work performed during the accounting period. For the
year ended December 31, 2010, Rockwell Land is constructing and developing three major residential
condominium projects. The following table shows the progress and contribution to revenue of Rockwell
Land’s projects.

2010 2009 Project % of
completion Revenues % of
completion Revenues
Amount % Amount %
(In millions) (In millions) New Developments
Number One Rockwell 87 P=2,702 80 53 P=2,746 96
The Grove 16 483 14 - 54 2
Edades Tower and Garden Villas - 138 4 - 6 -
3,323 98 2,806 98
Completed
The Manansala 100 1 - 100 13 -
Joya Lofts and Towers 100 51 2 100 58 2
52 2 71 2
Total P=3,375 100 P=2,877 100
Revenue recognized from the Number One Rockwell, The Grove and Edades Tower and Garden
Villas projects amounted to P=3,323 million or 98% of the total revenue from real estate for the year ended
December 31, 2010, increasing from P=2,806 million in 2009. The increase is largely accounted for by the
development of The Grove in 2010. The Manansala and Joya Lofts and Towers contributed P=52 million
and P=71 million in the year ended December 31, 2010 and 2009, respectively, representing sale of units.
Costs and Expenses
Costs and expenses of the real estate business segment increased to P=2,785 million in 2010, P=338
million, or 14%, higher compared with P=2,447 million in 2009 as shown below:
Change
2010 % 2009 % Amount %
(Amounts in millions)
Cost of real estate sold P=2,640 95 P=2,230 91 P=410 18
Operations and maintenance 330 12 191 8 139 73
Depreciation and amortization 167 6 150 6 17 11
Taxes, fees and permits 54 2 77 3 (23) (30)
Interest and other financial charges 155 6 117 5 38 32
Interest and other financial income (561) (20) (318) (13) (243) 76
Total P=2,785 100 P=2,447 100 P=338 14
Cost of Real Estate Sold
Cost of real estate sold amounted to P=2,640 million for the year ended December 31, 2010, P=410
million or 18% higher compared with P=2,230 million for the year ended December 31, 2009. The higher

cost of real estate sold is attributed to the progress in the constructions of The Grove and Edades Tower
and Garden Villas.
Operations and Maintenance
For the year ended December 31, 2010, operations and maintenance expense of the real estate
segment increased by P=139 million, or 73% to P=330 million compared with P=191 million in 2009. The
increase is largely due to higher provision for uncollectible accounts amounting to P=21 million in 2010
compared with P=0.3 million in 2009.
Depreciation and Amortization
Depreciation expense increased by P=17 million or 11% to P=167 million compared with P=150 million
in 2009 brought about by the depreciation charge of model units for The Grove and Edades Tower and
Garden Villas.
Taxes, Fees and Permits
Taxes, fees and permits decreased by P=23 million or 30% to P=54 million for the year ended
December 31, 2010 compared with P=77 million in 2009 due to lower building and construction permits
incurred in 2010 because Rockwell Land has no new condominium projects after Edades Tower and
Garden Villas, which started in the later part of 2009.
Interest and Other Financial Charges
Interest and other financial charges increased by P=38 million, or 32%, to P=155 million for the year
ended December 31, 2010 compared with P=117 million in 2009 brought about by the increase in interest
expense on loans to P=154 million from P=79 million for the year ended December 31, 2009.
Interest and Other Financial Income
Interest and other financial income increased to P=561 million or 76% higher compared with P=318
million in 2009 due to increase in amortization of unearned interest on trade receivables from P=293 million
to P=550 million based on collection of installment receivable.
Net Income Attributable to Equity Holders of the Parent
Net income attributable to equity holders of parent from real estate segment for the year ended
December 31, 2010 amounted to P=228 million, P=82 million higher or 56% compared with P=146 million in
2009. The higher net income was brought about by the progress in the construction of the residential
condominium projects.
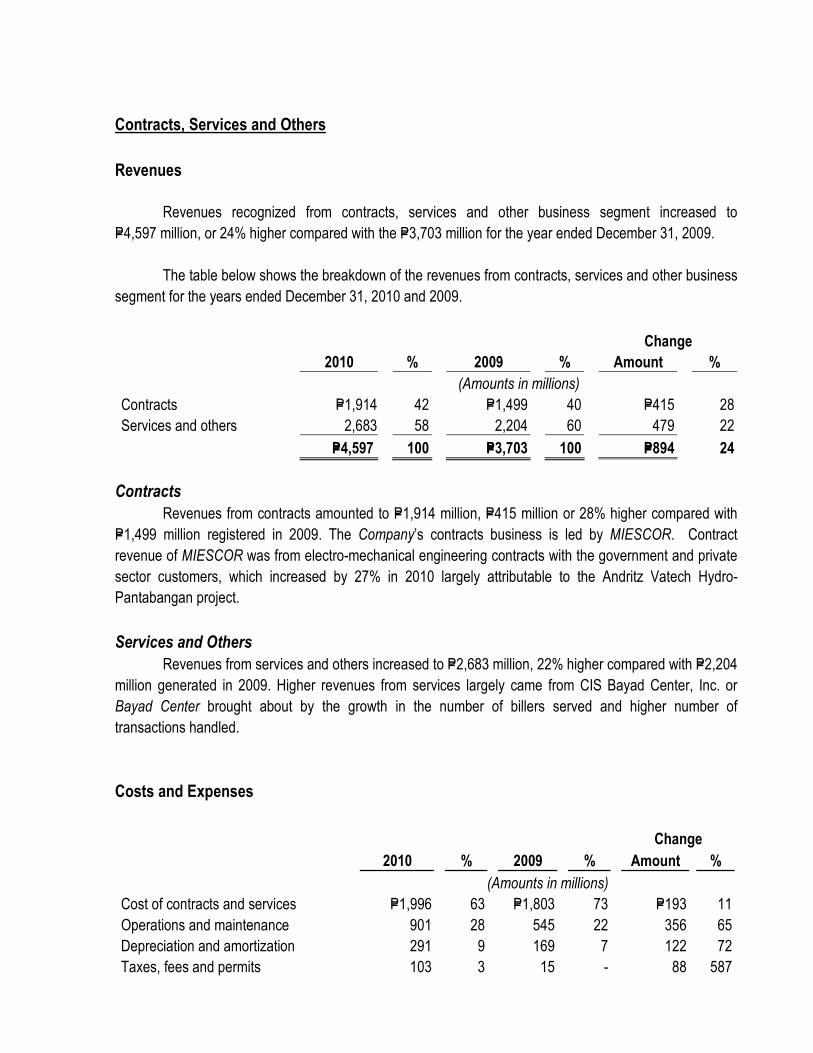
Contracts, Services and Others
Revenues
Revenues recognized from contracts, services and other business segment increased to
P=4,597 million, or 24% higher compared with the P=3,703 million for the year ended December 31, 2009.
The table below shows the breakdown of the revenues from contracts, services and other business
segment for the years ended December 31, 2010 and 2009.
Change
2010 % 2009 % Amount %
(Amounts in millions)
Contracts P=1,914 42 P=1,499 40 P=415 28
Services and others 2,683 58 2,204 60 479 22
P=4,597 100 P=3,703 100 P=894 24
Contracts
Revenues from contracts amounted to P=1,914 million, P=415 million or 28% higher compared with
P=1,499 million registered in 2009. The Company’s contracts business is led by MIESCOR. Contract
revenue of MIESCOR was from electro-mechanical engineering contracts with the government and private
sector customers, which increased by 27% in 2010 largely attributable to the Andritz Vatech Hydro-
Pantabangan project.
Services and Others
Revenues from services and others increased to P=2,683 million, 22% higher compared with P=2,204
million generated in 2009. Higher revenues from services largely came from CIS Bayad Center, Inc. or
Bayad Center brought about by the growth in the number of billers served and higher number of
transactions handled.
Costs and Expenses
Change
2010 % 2009 % Amount %
(Amounts in millions)
Cost of contracts and services P=1,996 63 P=1,803 73 P=193 11
Operations and maintenance 901 28 545 22 356 65
Depreciation and amortization 291 9 169 7 122 72
Taxes, fees and permits 103 3 15 - 88 587

Change
2010 % 2009 % Amount %
(Amounts in millions)
Interest and other financial charges 29 1 21 1 8 38
Interest and other financial income (127) (4) (77) (3) (50) 65
Total P=3,193 100 P=2,476 100 P=717 29
Cost of Contracts and Services
Cost of contracts and services amounted to P=1,996 million for the year ended
December 31, 2010, P=193 million or 11% higher compared with P=1,803 million for the year ended
December 31, 2009. The higher cost of contracts and services is attributed to the increase in the
maintenance contracts rendered by MIESCOR.
Operations and Maintenance
For the year ended December 31, 2010, operations and maintenance expense of the contracts,
services and other business segment increased by P=356 million or 65% to P=901 million compared with
P=545 million for the year ended December 31, 2009. The increase is due to higher labor costs, provision for
doubtful accounts and professional fees.
Depreciation and Amortization
Depreciation expense increased by P=122 million or 72% to P=291 million compared with P=169
million in 2009 brought about by the full-year recognition of depreciation expense of RBC towers amounting
to P=124 million in 2010 compared with P=49 million representing depreciation expense from July to
December 2009.
Taxes, Fees and Permits
Taxes, fees and permits amounted to P=103 million for the year ended December 31, 2010, an
increase of P=88 million from P=15 million in 2009. The increase pertains to the business permits and
licenses incurred for the operation of the RBC towers and Power Plant Mall for a total of P=76 million.
Interest and Other Financial Charges
Interest and other financial charges increased by P=8 million or 38% to P=29 million for the year
ended December 31, 2010 compared with P=21 million in 2009 due to the P=188 million notes obtained by
MIESCOR in 2010.
Interest and Other Financial Income
Interest and other financial income increased to P=127 million, or 65% higher compared with P=77
million in 2009. The increase came from RBC generating other income amounting to P=120 million

representing reimbursable charges from leases such as common use and service areas or CUSA and utility
charges (water, electricity, LPG and air conditioner).
Net Income Attributable to Equity Holders of the Parent
Net income from contracts, services and other business segment attributable to the shareholder of
the parent is P=780 million, 15% higher compared with P=678 million in 2009 due to higher revenues
generated particularly from MIESCOR.
2009 compared with 2008
On a Consolidated Basis
Revenues
For the year ended December 31, 2009, the Company registered consolidated revenues of
P=184,550 million, 4% lower compared with P=191,775 million in 2008. Revenues from sale of electricity was
lower by 4% while revenues from sales of real estate, contracts and services increased by 25%.
The following table shows the composition of the Company’s consolidated revenues for the years
ended December 31, 2009 and 2008 by business segment:
Change
2009 % 2008 % Amount %
(Amounts in millions)
Power distribution P=178,752 97 P=187,063 98 (P=8,311) (4)
Real estate 2,877 1 2,213 1 664 30
Contracts and services 3,703 2 3,056 1 647 21 Inter-segment transactions (782) - (557) - (225) 40
Consolidated P=184,550 100 P=191,775 100 (P=7,225) (4)
Consolidated revenues, in which electricity sales account 98%, decreased by 4% due to the P=0.69
per kWh decrease in average generation and transmission charges as well as adjustment on estimated
amount of electricity distributed but unbilled after scheduled meter readings of the various bill groups. The
impact of this reduction was partially offset by the modest increase in kWh consumption of 1.7% for the
year despite the effect of Typhoon Ondoy. The impact of Typhoon Ondoy is 66 GWh of foregone energy

sales as a result of submerged facilities, which include substations, distribution circuits and customer
connections. MERALCO also implemented its first distribution rate adjustment equivalent to P=0.257 per
kWh starting May 2009 under the PBR. The last rate adjustment of MERALCO was in January 2004.
Costs and Expenses
For the year ended December 31, 2009, costs and expenses amounted to P=175,571 million, 6% or
P=11,004 million lower compared with P=186,575 million in 2008 mainly due to lower purchased power cost in
2009.
The following table shows the breakdown of the Company’s consolidated costs and expenses for
the years ended December 31, 2009 and 2008 by business segment:
Change
2009 % 2008 % Amount %
(Amounts in millions)
Power distribution P=170,694 97 P=182,358 98 (P=11,664) (6)
Real estate 2,447 1 1,896 1 559 30
Contracts and services 2,476 2 1,655 1 813 49
Inter-segment transactions (46) - 666 - (712) (107)
Consolidated P=175,571 100 P=186,575 100 (P=11,004) (6)
Net Income
Consolidated net income for the year ended December 31, 2009 increased to P=6,356 million, 103%
higher compared with the net income in 2008. Despite the decrease in revenues during the year, the
Company managed its costs and expenses resulting in a net income higher than in 2008.
The following table shows the breakdown of the Company’s consolidated net income for the years
ended December 31, 2009 and 2008 by business segment:
Change
2009 % 2008 % Amount %
(Amounts in millions)
Power distribution P=5,881 93 P=3,181 102 P=2,700 85
Real estate 287 5 180 14 107 59
Contracts and services 859 13 995 23 (136) (14)
Inter-segment transactions (671) (11) (1,223) (39) 552 (45)
Consolidated P=6,356 100 P=3,133 100 P=3,223 103

Net Income Attributable to Equity Holders of the Parent
Consolidated net income attributable to equity holders of the parent increased to P=6,005 million for
the year ended December 31, 2009 from P=2,800 million last year. Consolidated core income increased by
P=4,398 million to P=7,003 million from P=2,605 million for the year ended December 31, 2008. Consolidated
basic and diluted earnings per share or EPS as at December 31, 2009 both amounted to P=5.42, 113% and
114% higher than the consolidated basic and diluted EPS as at December 31, 2008 of P=2.54 and P=2.53,
respectively.
On a Business Segment Basis
Power Distribution
Revenues
The power distribution segment registered revenues of P=178,752 million for the year ended
December 31, 2009, lower by P=8,311 million or 4% compared with P=187,063 in 2008. The following table
shows the composition of revenues from the power distribution segment for the years ended December 31,
2009 and 2008.
Change
2009 % 2008 % Amount %
(Amounts in millions)
Electric revenues
Pass-through charges
Generation charge P=107,635 60 P=119,143 64 (P=11,508) (10)
Transmission charge 23,250 13 25,512 14 (2,262) (9)
System loss charge 16,108 9 16,139 9 (31) -
146,993 82 160,794 86 (13,801) (9)
Wheeling charges
Distribution charge 21,276 12 17,593 9 3,683 21
Supply charge 6,560 4 5,753 3 807 14
Metering charge 3,923 2 2,923 2 1,000 34
31,759 18 26,269 14 5,490 21
Total P=178,752 100 P=187,063 100 (P=8,311) 4

Pass-Through Charges
Pass-through charges decreased by P=13,801 million, or 9%, to P=146,993 million for the year ended
December 31, 2009 as compared with P=160,794 million in 2009 due to a decrease in average generation
and transmission charges in 2009 to P=5.28 per kWh from P=5.97 per kWh in 2008. In addition, a net
adjustment of P=4,856 million against electricity revenues was recognized mainly for the estimated amount
of electricity distributed but unbilled after scheduled meter readings. The impact of this reduction was
partially offset by the increase in electricity sales of the additional kWh consumption for the year from
27,049 GWh in 2008 to of 27,516 GWh in 2009. The 2% growth in volume sales came mainly from the
residential and commercial customer segments, which accounted for 72% of the total electricity sales.
Wheeling Charges
Wheeling charges, which includes distribution, supply and metering charges amounted to P=31,759
million, higher by 21% from P=26,269 million in 2008, mainly due to increase in average distribution rate
from P=0.97 to P=1.15 per kWh. In May 2009, the ERC approved the Parent Company’s much delayed
implementation of rate adjustments under the PBR scheme. Energy sold in 2009 went up by 2% to 27,516
GWh from 27,049 GWh in 2008. In addition, number of customers served increased to 4.7 million, an
additional of 128,996 new customers from the 4.6 million customers served in 2008.
The following table summarizes the number of customers and the electricity consumption per
customer class for the years ended December 31, 2009 and 2008:
No. of Customers Electricity Sales % Change
(in thousands) (in GWh) No. of Electricity
Customer Class 2009 2008 2009 2008 Customers Sales
Residential 4,277 4,144 8,904 8,620 3 3
Commercial 410 414 10,922 10,606 (1) 3
Industrial 10 10 7,548 7,683 - (2)
Streetlights 4 4 142 140 - 1
Total 4,701 4,572 27,516 27,049 3 2
The residential and commercial sectors led growth during the year. While the industrial sector
showed negative growth, the volume sold was a significant improvement from that at the beginning of the
year. The growth in residential consumption was propelled by sustained remittances, lower inflation and
lower electricity prices. The commercial service sector showed robust performance with retail trade and
telecommunications accounting for 9% and 18% of the growth. The year also saw self-generating
customers returning to the grid to take advantage of the lower ecozone rates, which contributed 237 GWh
to the 2009 volume as well as the integration of Carmelray Industrial Park 2 or CIP2, to the MERALCO
distribution system. CIP2 contributed 47 GWh.
On the other hand, CEDC’s average distribution rate was P=0.70 per kWh in 2009 and 2008.

Costs and Expenses
Costs and expenses for the year ended December 31, 2009 decreased by P=11,664 million to
P=170,694 million compared with P=182,358 million in 2008.
Breakdown of costs and expenses for the years ended December 31, 2009 and 2008 is
summarized in the following table:
Change
2009 % 2008 % Amount %
(Amounts in millions)
Purchased power P=150,928 88 P=156,872 86 (P=5,944) (4)
Operations and maintenance 13,592 8 13,122 7 470 4
Depreciation and amortization 4,744 3 4,294 2 450 10
Taxes, fees and permits 329 - 284 - 45 16 Provision for probable losses from refund - net 2,172 1 6,935 4 (4,763) (69)
Interest and other financial charges 3,798 2 4,672 3 (874) (19)
Interest and other financial income (4,132) (2) (2,911) (2) (1,221) 42 Equity in net earnings of associates and a joint venture (953) (1) (910) - (43) 5
Others 216 - - - 216 100
Total P=170,694 100 P=182,358 100 (P=11,664) (6)
Purchased Power
Purchased power cost, which accounted for 88% of the total costs and expenses in 2009,
decreased by P=5,944 million. Total volume of power purchased for the year ended December 31, 2009
was 30,173 GWh at an average cost of P=5.01 per kWh compared with 29,886 GWh at an average cost of
P=5.27 per kWh in 2008.
Operations and Maintenance
Operations and maintenance expense increased from P=13,122 million for the year ended
December 31, 2008 to P=13,592 million for the year ended December 31, 2009 largely due to increase in
salaries and employees benefits. In 2009, the Parent Company fully amortized the cost related to the 13th
Employees’ Stock Purchase Plan or ESPP with the approval of the offering’s accelerated vesting.
Depreciation and Amortization
Depreciation expense for the year ended December 31, 2009 amounted to P=4,744 million, 10%
higher compared with P=4,294 million for the year ended December 31, 2008 brought about by the
completion of several electric projects in 2009.

Taxes, Fees and Permits
Taxes, fees and permits amounted to P=329 million for the year ended December 31, 2010, higher
compared with P=284 million for the year ended December 31, 2009. The increase is due to increase
regulatory fees and permits.
Provision for Probable Losses from Refund - Net
Provision for probable losses from refund - net amounted to P=2,172 million for the year ended
December 31, 2008, 69% lower compared with P=6,935 million in 2008. In 2009, net provision for probable
refund of P=1,179 million was reversed as a result of the approval by the ERC of MERALCO’s application to
collect transmission cost under-recoveries incurred between June 2003 and July 2007. Meanwhile, from
April 2008 through April 2009, MERALCO accumulated P=4,528 million net over-recoveries of transmission
costs for which a provision for probable refund was set-up. On October 12, 2009, the ERC authorized
MERALCO to collect P=5,348 million of transmission cost under-recoveries inclusive of carrying costs from
its customers, net of disallowances amounting to P=1,222 million.
Interest and Other Financial Charges
Interest and other financial charges decreased by P=874 million or 19% to P=3,798 million from
P=4,672 million in 2008 due to lower interest rates on notes payable and lower carrying charges on
approved over-recoveries. Carrying charges recognized for transmission over-recoveries amounted to
P=543 million in 2009 compared with P=934 million in 2008 for the Currency Exchange Rate Adjustment or
CERA, refund.
Interest and Other Financial Income
Interest and other financial income amounted to P=4,132 million, higher by P=1,221 million, or 42%,
compared with P=2,911 million for the year ended December 31, 2008. Interest and other financial income
represents interest income from bank placements, dividend income from available-for-sale investments and
investments accounted for at equity, and recognition of carrying charge related to the ERC-approved
collection of transmission cost under-recoveries. Total carrying charge on transmission under-recoveries
amounted to P=2,782 million in 2009 compared with P=813 million in 2008 for generation under-recoveries
approved by the ERC.
Equity in Net Earnings of Associates and a Joint Venture
Equity in net earnings of associates and a joint venture amounted to P=953 million, 5% higher
compared with P=910 million in 2008 due to higher earnings posted by the subsidiaries for the year ended
December 31, 2009.
Net Income Attributable to Equity Holders of the Parent
Net income attributable to equity holders of the parent for the year ended December 31, 2009 is
P=5,852 million, P=2,707 million or 86% higher compared with P=3,145 million in 2008. The higher net income
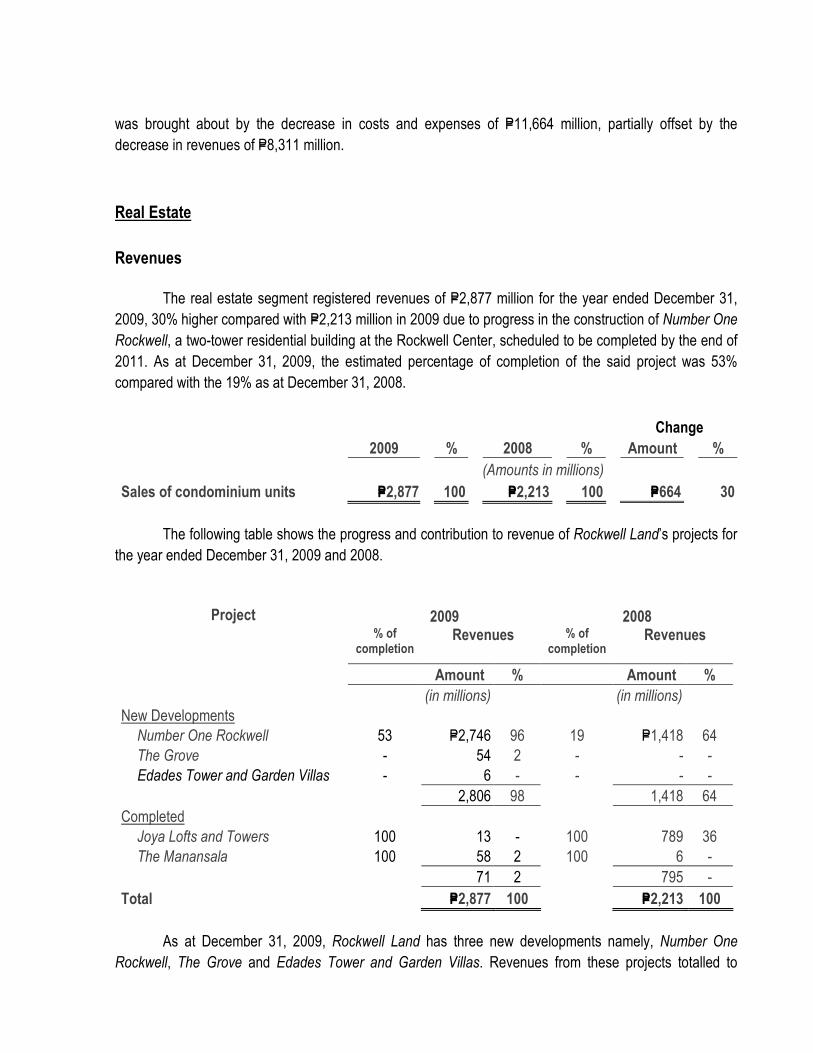
was brought about by the decrease in costs and expenses of P=11,664 million, partially offset by the
decrease in revenues of P=8,311 million.
Real Estate
Revenues
The real estate segment registered revenues of P=2,877 million for the year ended December 31,
2009, 30% higher compared with P=2,213 million in 2009 due to progress in the construction of Number One
Rockwell, a two-tower residential building at the Rockwell Center, scheduled to be completed by the end of
2011. As at December 31, 2009, the estimated percentage of completion of the said project was 53%
compared with the 19% as at December 31, 2008.
Change
2009 % 2008 % Amount %
(Amounts in millions)
Sales of condominium units P=2,877 100 P=2,213 100 P=664 30
The following table shows the progress and contribution to revenue of Rockwell Land’s projects for
the year ended December 31, 2009 and 2008.
2009 2008 Project % of
completion Revenues % of
completion Revenues
Amount % Amount %
(in millions) (in millions)
New Developments
Number One Rockwell 53 P=2,746 96 19 P=1,418 64
The Grove - 54 2 - - -
Edades Tower and Garden Villas - 6 - - - -
2,806 98 1,418 64
Completed
Joya Lofts and Towers 100 13 - 100 789 36
The Manansala 100 58 2 100 6 -
71 2 795 -
Total P=2,877 100 P=2,213 100
As at December 31, 2009, Rockwell Land has three new developments namely, Number One
Rockwell, The Grove and Edades Tower and Garden Villas. Revenues from these projects totalled to

P=2,806 million, accounting for 98% of the total revenues from real estate in 2009. Number One Rockwell
progressed to 53% as at December 31, 2009. The remaining 2% of P=2,877 million came from sales of
condominium units in The Manansala and Joya Lofts and Towers.
Costs and Expenses
The real estate business segment’s costs and expenses increased to P=2,447 million for the year
ended December 31, 2009, P=551 million or 29% higher compared with P=1,896 million for the year ended
December 31, 2008.
The following table shows the breakdown of the costs and expenses:
Change
2009 % 2008 % Amount %
(Amounts in millions)
Cost of real estate sold P=2,230 91 P=1,646 87 P=584 35
Operations and maintenance 191 8 500 26 (309) (62)
Depreciation and amortization 150 6 89 5 61 69
Taxes, fees and permits 77 3 63 3 14 22
Interest and other financial charges 117 5 53 3 64 121
Interest and other financial income (318) (13) (455) (24) 137 (30)
Total P=2,447 100 P=1,896 100 P=551 29
Cost of Real Estate Sold
Cost of real estate sold increased by 35% from P=1,646 million for the year ended December 31,
2008 to P=2,230 million for the year ended December 31, 2009, 95% of which pertains to percentage cost of
completion of Number One Rockwell. The accretion rate of the Number One Rockwell residential buildings
was 34% from December 31, 2008 to December 31, 2009.
Operations and Maintenance
Operations and maintenance expense of the real estate segment decreased by P=309 million or
62% to P=191 million compared with P=500 million in 2008 due to reductions in marketing and promotion
expense, professional fees, commissions and amortization of pre-selling costs.
Depreciation and Amortization
Depreciation expense increased to P=150 million, 69% higher compared with P=89 million in 2008.
The increase is attributed to the depreciation expense of model units of The Grove and depreciation of the
completed function room at The Grove.

Taxes, Fees and Permits
Taxes, fees and permits increased to P=77 million compared with P=63 million in 2008 due to
additional permits and licenses associated with the development and construction of The Grove and
Edades Tower and Garden Villas.
Interest and Other Financial Charges
Interest and other financial charges increased by P=64 million or 121% to P=117 million for the year
ended December 31, 2009 compared with P=53 million in 2008 brought about by the increase in interest
expense on loans to P=77 million from P=51 million for the year ended December 31, 2008.
Interest and Other Financial Income
Interest and other financial income decreased to P=318 million, 30% lower compared with P=455
million in 2008 due to decrease in amortization of unearned interest on trade receivables from P=450 million
to P=293 million based on collections of instalments receivable.
Net Income Attributable to Equity Holders of the Parent
Net income attributable to equity holders of parent from real estate segment for the year ended
December 31, 2009 is P=146 million, 59% or P=54 million higher compared with P=92 million in 2008 as a
result of the progress in the construction of Number One Rockwell.
Contracts, Services and Others
Revenues
Revenues recognized from contracts, services and other business segment increased to P=3,703
million, or 21% higher compared with the P=3,056 million for the year ended December 31, 2008.
The table below shows the breakdown of the revenues from contracts, services and other business
segment for the years ended December 31, 2009 and 2008.
Change
2009 % 2008 % Amount %
(Amounts in millions)
Contracts P=1,499 40 P=1,230 40 P=269 22
Services and others 2,204 60 1,826 60 378 21
P=3,703 100 P=3,056 100 P=647 21

Contracts
Revenues from contracts amounted to P=1,499 million, P=269 million or 22% higher compared with
P=1,230 million registered in 2008. The increase is attributed to the improvement in the revenues of
MIESCOR by 22% from P=1,229 million in 2008. MIESCOR won a contract with the Department of Finance
or DoF for the upgrade/rehabilitation of the latter’s electro-mechanical system, a major project in 2009.
Services and Others
Services and other business segment registered revenues for the year ended December 31, 2009
of P=2,204 million, P=378 million or 21% higher compared with P=1,826 million in 2008. The increase is
attributed to higher revenues generated by Rockwell Land from the Power Plant Mall due to increase in
commercial rental rate and foot traffic.
Costs and Expenses
Change
2009 % 2008 % Amount %
(Amounts in millions)
Cost of contracts and services P=1,803 73 P=1,456 88 P=347 24
Operations and maintenance 545 22 390 24 155 40
Depreciation and amortization 169 7 44 3 125 284
Taxes, fees and permits 15 - 42 3 (27) (64)
Interest and other financial charges 21 1 37 2 (16) (43)
Interest and other financial income (77) (3) (314) (20) 237 (75)
Total P=2,476 100 P=1,655 100 P=821 50
Cost of Contracts and Services
Cost of contracts and services amounted to P=1,803 million for the year ended December 31, 2009,
24% higher compared with P=1,456 million for the year ended December 31, 2008. The increase in the cost
of contracts of MIESCOR in 2009 to P=1,268 million from P=1,056 million in 2008 was brought about by the
costs related to the construction and maintenance contracts with Chevron’s Tiwi and MakBan Geothermal
Plants and the upgrade/rehabilitation of electro-mechanical system of the DoF.
Operations and Maintenance
For the year ended December 31, 2009, operations and maintenance expenses increased by P=155
million, or 40%, to P=545 million compared with P=390 million for the year ended December 31, 2008 mainly
due to costs related to the operation of RBC Towers in 2009 and the increase in employees’ compensation
and benefit costs.

Depreciation and Amortization
Depreciation expense increased by P=125 million, or 284%, to P=169 million compared with P=44
million in 2008. The increase pertained to the depreciation expense of the RBC Towers.
Taxes, Fees and Permits
Taxes, fees and permits amounted to P=15 million for the year ended December 31, 2009, a
decrease of P=27 million, or 64%, from P=42 million in 2008. The decrease is attributable to MIESCOR whose
taxes other than income tax dropped to P=4 million in 2009 from P=17 million in 2008. In 2008, a capital gains
tax was recognized related to sale of the 65% stake in CEDC by MIESCOR to the Parent Company.
Interest and Other Financial Charges
Interest and other financial charges decreased by P=16 million or 43% to P=21 million compared with
P=37 million in 2008. The decrease is consistent with the reduction in the balance of long-term loans of
MIESCOR to P=3 million in 2009 from P=9 million in 2008.
Interest and Other Financial Income
Interest and other financial income decreased to P=77 million, 75% lower compared with P=314
million in 2008 when MIESCOR realized a gain from sale of CEDC to the Parent Company.
Net Income Attributable to Equity Holders of the Parent
Net income attributable to equity holders of parent from contracts, services and other business
segment for the year ended December 31, 2008 amounted to P=678 million, P=108 million or 14% lower
compared with P=786 million in 2008. The decrease in net income attributable to the equity holders of the
parent is due to lower net income registered by MIESCOR from P=130 million in 2008 to P=101 million in
2009 as a result of higher costs of contracts and services. In addition, the Company incurred losses of P=54
million from RBC, which started business operation in the second semester of 2009 with an occupancy rate
of 19%.
Liquidity and Capital Resources
The following table shows the Company’s consolidated cash flows for the years ended December
31, 2010, 2009 and 2008 as well as the Company’s capitalization as at December 31, 2010, 2009 and
2008.

2010 2009 2008
(Amounts in millions)
Cash Flows
Net cash provided by operating activities P=20,358 P=29,270 P=14,337
Net cash used in investing activities (6,292) (8,770) (5,119)
Capital Expenditures 9,053 8,890 9,175
Net cash used in financing activities (6,764) (8,834) (8,692)
Net increase in cash and cash equivalents 7,302 11,666 526
Capitalization
Interest-bearing long-term financial liabilities
Current portion P=5,574 P=4,069 P=3,131
Noncurrent portion 15,498 17,234 13,228
Notes payable 149 513 9,828
Equity 63,196 61,146 56,159
As at December 31, 2010, the Company’s consolidated cash and cash equivalents totalled
P=24,370 million, P=7,302 million higher compared with the balance of P=17,068 million as at December 31,
2009. Sources of consolidated cash and cash equivalents in 2010 were cash flows from operating
activities of P=20,358 million, proceeds from long-term loans of P=10,528 million and interest and other
financial income received amounting to P=1,058 million. Cash dividends paid amounted to P=6,187 million,
settlement of debt principal and interest totalled P=13,536 million and, capital expenditures amounted to
P=9,053 million, of which P=8,990 million were paid.
Operating Activities
Consolidated net cash provided by operating activities for the year ended December 31, 2010
decreased to P=20,358 million, P=8,912 million lower compared with P=29,270 million in 2009. The decrease is
brought about by the decrease net cash generated from operations from P=33,067 million in 2009 to
P=25,311 million in 2010 due to increase in trade and other receivables. As at December 31, 2010, trade
and other receivables – net amounted to P=25,609 million, 19% higher compared with P=21,600 million as at
December 31, 2009. In 2010, ERC approved the Company’s application to recover under-recoveries in
generation and transmission charges and began billing the approved under-recoveries thereon.
For the year ended December 31, 2009, net cash provided by operating activities increased to
P=29,270 million from P=14,337 million in 2008. The improved operating results was partly attributable to the
much delayed implementation of the approved rate adjustment under the PBR beginning May 2009 and
improved collections.

Investing Activities
Consolidated net cash flows used in investing activities for the year ended December 31, 2010
totalled P=6,292 million. MERALCO completed 35 major and residual electric capital projects in 2010 to
serve new customers and to enhance the reliability and efficiency of its electric distribution system. Among
the projects completed were the construction of the 115kV sub-transmission lines in Amadeo, Tagaytay
and NAIA-3, and the commissioning of the substations at the Fort Bonifacio Global City or FBGC, Marilao
and Veinte Reales.
Net cash used in investing activities for the year ended December 31, 2009 was P=8,770 million
compared with P=5,119 million in 2008. Primary investing activity of the Company was the construction of
distribution facilities of MERALCO, which totalled P=7,914 million in 2009.
Financing Activities Consolidated net cash used in financing activities decreased to P=6,764 million compared with
P=8,834 million in 2009. In the last quarter of 2010, MERALCO prepaid the outstanding balance of its
P=6,000 million floating rate corporate notes amounting to P=4,680 million and the P=3,900 floating rate notes
from its P=5,500 million note facility agreement. Simultaneously, MERALCO obtained the P=5,000 million and
the 4,800 million fixed rate notes. Total dividends paid in 2010 totalled P=6,187 million, 219% more than the
dividends paid in 2009. MERALCO pays regular cash dividends equivalent to 50% of the core net income.
Net cash used in financing activities amounted to P=8,834 million for the year ended December 31,
2009 as against P=8,692 million for the year ended December 31, 2008. Aside from the refinancing activities
done in 2009 (see related discussion under Debt Financing), MERALCO also paid higher dividends in 2009
totalling P=2,820 million compared with P=1,960 million in 2008.
Debt Financing
Consolidated debt, including notes payable, decreased by P=595 million or 3% to P=21,221 million as
at December 31, 2010. The decrease is mainly due to payments of principal of
P=10,748 million, partially offset by additional drawings on note facility of P=10,528 million. The new loans
were used to support the capital expenditure requirements of MERALCO and to finance maturing debt
obligations. Debt maturities of the Company are spread through 2020.
In 2010, Standard & Poor’s re-rated and upgraded MERALCO to ‘B+’ with ‘stable’ outlook to reflect
the significant and sustained improvement in the Company’s financial risk profile arising from higher tariffs
and stronger electricity sales.
In 2009, MERALCO refinanced a total of P=10,160 million of maturing debts. Refinancing was
provided by consortia of local banks and financial institution in January 2009 (P=5,000 million) and another
local bank in December (P=5,500 million). In addition, the Company drew new loans totalling P=4,834 million,

P=1,183 million of which was drawn by Rockwell Land. Consolidated debt as at December 31, 2009
decreased by P=4,371 million to P=21,816 million compared with P=26,187 million in 2008.
In December 2010, MERALCO entered into a Note Facility Agreement for the issuance of P=23
million 5-year fixed rate notes with final maturity in December 2015 and P=4,977 million 5.5-year fixed rate
notes due in June 2016. The 5-year fixed rate notes are payable at maturity while the 5.5-year fixed rate
notes are payable in annual installments of 1% of the original principal amount for the years 2011 to 2015
and the remaining balance is payable in 2016.
In November 2010, MERALCO signed a Fixed Rate Note Facility Agreement for the issuance of
P=1,997 million 7-year fixed rate notes and P=2,803 million 10-year fixed rate notes. The notes were issued
on December 2, 2010. The 7-year fixed rate notes are payable in annual installments of 0.5% of the
original amount for the years 2011 to 2016 and the remaining balance is payable in 2017. The 10-year
fixed rate notes are payable in annual installments of 0.5% of the original amount for the years 2011 to
2019 and the remaining balance is payable in 2020.
On December 9, 2009, MERALCO signed a P=5,500 million Note Facility Agreement for the
issuance of fixed and floating rate notes. The P=1,600 million fixed rate notes mature in 2014 while the
P=3,900 million floating rate notes mature in 2015. The fixed rate notes are payable at maturity while the
floating rate notes are payable in annual installments of 3% of the original principal amount from 2010 to
2014 and the remaining balance payable in 2015. The floating rate notes were prepaid without penalty in
December 2010.
On October 2, 2009, MERALCO signed a P=3,000 million, 5-year bilateral term agreement with
Unionbank of the Philippines. The loan was fully drawn on October 5, 2009 and matures in October 2014.
Starting October 2010, the spread of this loan was reduced from 1.5% to 0.3%.
In January 2009, MERALCO entered into a Note Facility Agreement for the issuance of P=2,715
million fixed rate notes with final maturity in January 2014 and P=2,285 million floating rate due in January
2010. The floating rate notes were prepaid in October 2009. The fixed rate notes are payable in annual
installments of 1% of the original principal amount for the years 2010 to 2013 and the remaining balance is
payable in 2014.
As at December 31, 2009, the loans of Rockwell Land from various banks and financial institutions
consist of bridge facilities payable in 2011 and a term loan payable in December 2014.
For further details on long-term debt, see Note 21 – Interest-bearing Long-term Financial Liabilities
to the accompanying consolidated financial statements.

Equity Financing
Consistent with the provisions of PAS 32, “Financial Instruments: Disclosure and Presentation”, the
Company’s preferred shares were reclassified as debt while the dividends declared are recorded as
interest expense. Accumulated and unpaid dividends were accrued and classified as accrued interest
payable. Coupon rate on such preferred share is fixed at 10%. The preferred shares were issued for
service applications, which would require extension or new distribution facilities beyond a specific distance.
Beginning April 8, 2005, such requirement was discontinued. Instead, as provided in the “Implementing
Guidelines of the Magna Carta for Residential Electricity Consumers”, customers were required to advance
the costs of extension of lines and installation of additional facilities.
As at December 31, the Company’s capital stock consists of:
(Amounts in millions) 2010 2009
Common stock – P=10 par value
Authorized – 1,250,000,000 shares P=12,500 P=12,500
Issued and outstanding 11,273 11,273
Of the total authorized common shares of 1,250 million, 1,127 million shares are issued and
outstanding as at December 31, 2009. This included the 7.2 million fully vested and paid shares under the
13th ESPP offering and subscriptions under the 13thA and 14th ESPP offerings.
Consolidated cash dividends declared to shareholders in 2010, 2009 and 2008 amounted to
P=7,834 million, P=2,695 million and P=1,116 million, respectively.
The table below summarizes the cash dividends declared in 2010, 2009, and 2008:
Declaration Date Record Date Payment Date Dividend
Per Share Amount
(In millions)
March 22, 2010 April 21, 2010 May 11, 2010 P=3.15 P=3,551 July 26, 2010 August 23, 2010 September 16, 2010 2.50 2,818 December 13, 2010 December 29, 2010 January 17, 2011 1.30 1,465 P=7,834
October 29, 2009 November 13, 2009 December 11, 2009 P=1.50 P=1,617 May 26, 2009 June 9, 2009 June 30, 2009 1.00 1,078 P=2,695
August 26, 2008 September 25, 2008 October 21,2008 P=0.50 P=559 March 17, 2008 April 16, 2008 May 13, 2008 0.50 557 P=1,116

Discussion on Material Changes on the Company’s Audited Financial Position
The table below summarizes the consolidated balance sheet accounts with material changes as at
December 31, 2010 compared with as at December 31, 2009.
Account As at Dec. 31
Amount
(in millions)
Discussion
ASSETS
Noncurrent Assets
2010 101,009 2009 98,231
Utility plant and others - net
change 2,778
The 3% increase was mainly due to electric capital projects amounting to P=7,258 million completed in 2010 and equipment, mostly distribution facilities, totalling P=2,771 million. Depreciation expense charged for the year ended December 31, 2010 amounted to P=5,958 million.
2010 2,241
2009 3,627
Construction in progress
change (1,386)
The 38% decrease was brought about by the completion of major electric projects namely, Veinte Reales Substation, Marilao Substation, FBGC Substation, Kaybiga-Novaliches 115kV Line, and NAIA-3 115kV Line, in 2010.
2010 321
2009 1,203
Investments in associates and a joint venture
change (882)
The 73% decrease was due to the return of investment in First Private Power Corporation or FPPC. The Company owned 38% of the equity in FPPC. The return of capital followed the expiration of the 15-year build-operate-transfer or BOT agreement with the National Power Corporation or NPC in July 2010.
2010 1,222
2009 3,161
Deferred pass-through fuel costs
change (1,939)
The 61% decrease was due to consumption of banked gas with First Gas Power Corporation or FGCP and FGP Corp. in 2010.
2010
10,339
2009 13,184
Other noncurrent assets - net
change (2,845)
The 22% decrease was attributed to the reclassification of under-recoveries in generation and transmission charges to trade and other receivables as a result of ERC's approval for the Company to recover such amount through billings at a pre-approved amount per kWh until full recovery.
Current Assets
Cash and cash 2010 24,370 The 43% increase resulted from the improvement

Account As at Dec. 31
Amount
(in millions)
Discussion
2009 17,068
equivalents
change 7,302
in Days Sales Receivables from 29 days in 2009 to 24 days in 2010. Average daily collection is at P=970 million.
2010 25,609
2009 21,600
Trade and other receivables - net
change 4,009
The 19% increase was brought about by the robust sales from electricity due to higher electricity sales volume and implementation of the PBR adjustment in April 2010. In addition, the Company began billing the approved under-recoveries as discussed in the "Other noncurrent assets - net" account.
2010 1,708
2009 1,191
Land and development costs - at lower of cost or net realizable value change 517
The 43% increase reflects the ongoing progress in the constructions of Number One Rockwell, The Grove and Edades Tower and Garden Villas of Rockwell Land. Estimated costs to complete the three residential condominium projects as at December 31, 2010 totalled P=17,246 million.
2010 2,027
2009 2,969
Other current assets
change (942)
The 32% decrease was brought about by the application of creditable withholding tax against the income tax liabilities and remittances of withholding taxes to the Bureau of Internal Revenue or BIR.
EQUITY
2010 743
2009 569
Employee share-based payment plan
change 174
The 31% increase pertained to expense recognized consistent with the provisions of PFRS2, "Share-based Payments" related to the 13th, 13th A, and 14th Employee Stock Purchase Plan or ESPP awards.
2010 12
2009 684
Share in cumulative translation adjustment of a subsidiary and an associate
change (672)
The decrease resulted from the return of capital related to the Company's investment in FPPC.
2010 6,000
2009 4,198
Retained earnings - appropriated
change 1,802
In February 2010, the BOD approved the reversal of a prior year appropriation for under-recoveries of P=4,198 million as a result of the ERC's approval of MERALCO's recovery of certain recorded transmission, lifeline and interclass subsidies under-recoveries, net of over-recoveries. Also, in February 2010, the BOD approved the appropriation of P=6,000 million for

Account As at Dec. 31
Amount
(in millions)
Discussion
business expansion. The net increase to appropriated retained earnings was P=1,802 million or 43%.
2010 37,800
2009 37,750
Retained earnings - unappropriated
change 50
Unappropriated retained earnings as at December 31, 2010 is at almost the same level as 2009. For the year ended December 31, 2010, the Company recognized a consolidated net income attributable to equity holders of the parent of P=9,685 million, partially offset by the cash dividends declared of P=7,834 million.
2010 4,227
2009 3,777
Non-controlling interests
change 450
The 12% increase was due to higher net income recognized for the year ended December 31, 2010.
LIABILITIES
Noncurrent Liabilities
2010 15,498
2009 17,234
Interest-bearing long-term financial liabilities - net of current portion change (1,736)
The 10% decrease is attributable to the pre-termination in February 2011 of Rockwell Land's December 31, 2010 loan balance of P=1,580 million out of its P=2,000 million corporate notes. Accordingly, such loan was classified as a current liability in 2010.
2010 23,761
2009 25,063
Customers’ deposits - net of current portion
change (1,302)
The 5% decrease was largely due to the adjustment recognized for interest accrued on customers' deposits. As provided under "A Resolution Adopting Amendments to the Distribution Services and Open Access Rules" issued by the ERC on February 22, 2010, interest rate payable on customers' deposits beginning April 1, 2010 shall be based on the savings account rate paid by the Land Bank of the Philippines. Hence, interest rate was determined to be 0.75% per annum for 2010.
2010 741
2009 343
Deposits from pre-selling of condominium units
change 398
The 116% increase pertained to deposits received for Edades Tower and Garden Villas units sold on installment contracts. The number of units sold as at December 31, 2010 totalled 350 units, an increase of 237 units from 113 units

Account As at Dec. 31
Amount
(in millions)
Discussion
in 2009. 2010 3,322
2009 4,230
Deferred tax liabilities - net
change (908)
The 21% decrease was due to realization of taxable tax differences.
2010 9,547
2009 10,987
Long-term employee benefits
change (1,440)
The 13% decrease was mainly due to increased funding of pension liabilities. In 2010, total amount funded was P=3,895 million.
2010 12,875
2009 7,492
Provisions
change 5,383
The 72% increase was due to additional provisions for claims.
2010 3,271
2009 2,989
Advances for construction - net of current portion
change 282
The 9% increase was due to additional cash advances received from customers for construction of customers' non-standard and dedicated facilities.
2010 2,352
2009 522
Other noncurrent liabilities
change 1,830
The 350% increase is attributable to the accrual of system loss over-recoveries as at December 31, 2010 and increase in liabilities for long-term employees' health and medical benefits.
Current Liabilities
2010 149
2009 513
Notes payable
change (364)
The 71% decrease is due to payments amounting to P=552 million during the year.
2010 31,138
2009 28,261
Trade payables and accrued expenses
change 2,877
The 10% increase is attributable to the increase in liabilities to the Philippine Electricity Market Corporation for power purchased from the Wholesale Electricity Spot Market and various IPPs, deferred output VAT and accrual of dividends.
2010 413
2009 133
Income tax payable
change 280
The 211% increase was attributed to the additional income tax recognized during the year as a result of higher taxable income for the year ended December 31, 2010.
Customers’ refund - 2010 7,131 The 22% decrease pertains to refund of meter

Account As at Dec. 31
Amount
(in millions)
Discussion
2009 9,147
current portion
change (2,016)
deposits, including interest due thereon.
2010 5,574
2009 4,069
Interest-bearing long-term financial liabilities - current portion change 1,505
The 37% increase was due to pre-termination of the P=1,580 million corporate notes in February 2011, which was accordingly classified as a current liability as discussed in the "Interest-bearing long-term financial liabilities - net of current portion" account.
RISK FACTORS
The major factors affecting the Company’s financial position and results of operations are:
a. Regulated rates and cost recoveries b. Volume sales c. Electricity supply d. Philippine economic conditions e. Currency exchange rates f. Industry restructuring
Regulated Rates and Cost Recoveries
• The most significant determinants of MERALCO’s rate structure vis-à-vis operating results are
“allowable returns” and “permitted cost recoveries”. Rates billed by the Company are approved by the
Energy Regulatory Commission or ERC and are set to allow a reasonable rate of return on
investments. The Company’s rate structure also allows pass-through of certain purchased power
costs, system loss up to an annual cap enforced by the ERC, and taxes.
In accordance with the provisions of the Electric Power Industry Reform Act or EPIRA of 2001, the
ERC approved the Distribution Wheeling Rate Guidelines or DWRG, later renamed, Rules for Setting
Distribution Wheeling Rates or RDWR, which took effect on January 29, 2005. The Performance-
Based Regulation or PBR is embodied in the DWRG.
Under PBR, tariffs are set according to forecasts of performance and capital and operating
expenditures. The RDWR also employs a penalty/reward mechanism that adjust tariffs upwards and
downwards depending on the utility’s actual performance. The Company filed its first rate adjustment
application based on the new rate-making scheme on September 1, 2006. After a series of hearings
and regulatory evaluations, the new PBR-based tariff was to have been implemented by July 2007.

On August 31, 2007, the ERC issued its Final Determination, which set forth its evaluation of
MERALCO’s annual revenue requirement and approved the performance incentive scheme and price
control arrangements that will apply to MERALCO during the second Regulatory Period (from July 1,
2007 to June 30, 2011). The approved Maximum Average Prices or MAP were P=1.167 per kWh,
P=1.260 per kWh, P=1.361 per kWh, and P=1.471 per kWh for the Regulatory Years or RYs 2008, 2008,
2010 and 2011, respectively.
The ERC mandated the shift from Return on Rate Base or RORB to PBR for all investor-owned
distribution utilities or DUs. The shift would be done in batches, with all investor-owned DUs expected
to have shifted by 2011. MERALCO, along with Cagayan Electric Power and Light Company or
CEPALCO and Dagupan Electric Corporation or DECORP, are the first three DU entrants to PBR.
DECORP and CEPALCO began implementing PBR tariffs in October 2008, while MERALCO started
implementing PBR tariffs in May 2008.
Similarly, the rate-setting mechanism of Clark Electric Distribution Corporation or CEDC, a 65% owned
subsidiary, is likewise in compliance with ERC regulations. After the unbundling of its rates in
accordance with the ERC guidelines, CEDC shall also become an entrant to the PBR. CEDC filed its
PBR rate application on September 24, 2010 covering the regulatory period October 1, 2011 to
September 30, 2015. To date, CEDC is awaiting for the release of Draft Determination on its
application for public comments.
• The pass-through of allowable costs or costs that do not entail a revision of the rate base and/or rate of
return of the Company is governed by various adjustment mechanisms promulgated by the ERC.
In approving MERALCO’s unbundled rate in May 2003, the ERC prescribed a generation charge that
will be adjusted under the Generation Rate Adjustment Mechanism, or GRAM. This has since been
superseded by the Guidelines for the Automatic Adjustment of Generation Rates and System Loss
Rates by Distribution Utilities. The monthly automatic adjustment under the Automatic Generation Rate
Adjustment or AGRA mechanism provides timely price signals to consumers. While the GRAM only
provided for changes in the generation charge, the new mechanism also allows the monthly adjustment
of the system loss charge. The guidelines prescribe a semi-annual verification process.
Implementation of the guidelines started with the November 2004 billing cycle.
The ERC’s approval of MERALCO’s second filing under GRAM was questioned before the Supreme
Court or SC, for failure by MERALCO and the ERC to comply with Section 4 (e) Rule 3 of EPIRA’s
Implementing Rules and Regulations or IRR, which required publication, notice and hearing of an
application prior to issuance of an Order. On August 16, 2006, the SC ruled with finality that strict
compliance with the requirements under the IRR of the EPIRA is jurisdictional and applies to any
adjustment to the retail rate, including those for pass-through costs. The AGRA was then suspended
beginning September 2006 and MERALCO could adjust generation and other pass-through charges
only after the filing and approval by the ERC of an appropriate application.

On June 7, 2007, the Joint Congressional Power Commission approved amendments to Section 4 (e),
Rule 3 of the EPIRA’s IRR that exempt the adjustments of pass-through electric rate components from
the jurisdictional and hearing requirements of the IRR. The amendments were subsequently
promulgated by the Department of Energy on June 21, 2007. Thereafter, the ERC lifted the
suspension of the AGRA, which allowed MERALCO to resume the monthly updating of generation and
system loss charges beginning July 2007.
On August 12, 2009, the ERC issued its Resolution No. 16, series of 2009, adopting the “Rules
Governing the Automatic Cost Adjustment and True-up Mechanisms and Corresponding Confirmation
Process for Distribution Utilities”. These rules govern the recovery of pass-through costs, including
over- or under-recoveries in the following bill components: Generation Charge, Transmission Charge,
System Loss Charge, Lifeline rate subsidies, Local franchise and business taxes.
The rules will also synchronize the various confirmation processes for the foregoing charges, in which
the ERC will verify whether the DU incurred over- or under-recoveries in the implementation of the said
charges. Luzon DUs, such as MERALCO, were required to file not later than October 30, 2009 their
consolidated applications to resolve over- or under-recoveries accumulated from the start of their rate
unbundling until December 2008. Subsequent filings will be every three years thereafter.
On October 8, 2009, MERALCO filed a petition at the ERC seeking an amendment to the ERC’s
Resolution No. 16, Series of 2009. In particular, MERALCO proposed a modification to the formula
used in confirming the system loss charges of DUs, shifting the reckoning of the system loss cap from
a monthly to an annual reckoning to more fairly reflect the actual system loss performance of DUs.
On October 18, 2010, the ERC ruled on MERALCO’s Petition and agreed that there is a need to
address the mismatch between the billing period of the DUs and their suppliers in the confirmation of
the system loss. However, the Commission did not adopt MERALCO’s proposed modification to the
formula and instead prescribed a new formula. Resolution No. 21, Series of 2010 adopted the new
formula and correspondingly amended the one prescribed in Resolution No. 16, Series of 2009. The
Resolution also prescribed the period of filing for the DUs’ consolidated applications, which for Luzon
DUs will be by March 31, 2011.
• MERALCO’s recovery of costs through the system loss charge in its unbundled rates was limited to
9.5% of the total power purchased by MERALCO in accordance with Republic Act or RA No. 7832, or
the Anti-Electricity Pilferage Act. System loss is comprised of technical losses, or the electrical energy
lost in the process of distributing power to its customers, and non-technical losses, mainly due to
pilferage. Up to 2007, MERALCO’s system loss levels were in excess of the 9.5%-cap.
On August 6, 2008, the ERC released a draft Resolution that: (i) will reduce the system loss cap for
private DUs to 8% effective January 2008 and (ii) will change the treatment of company use, from a

component of the system loss charge to being part of operations and maintenance expenses. The
draft Resolution further stated that the treatment of company use of electricity as part of operations and
maintenance expenses shall commence on the next reset for utilities under the PBR and that the
manner by which the utility will be rewarded for its efforts in system loss reduction shall be addressed
in the Performance Incentive Scheme or PIS under the PBR. After receiving written comments and
conducting public consultations, the ERC eventually released on December 8, 2008 a Resolution
setting the recoverable rate of system loss for private DUs at 8.5% effective January 2010.
On December 8, 2009, MERALCO filed a Petition to amend the said Resolution with an urgent prayer
for the immediate suspension of the implementation of the new system loss cap of 8.5% starting
January 2010. The proposed amendment is aimed at making the Resolution consistent with the
provisions of RA No. 9136 and RA No. 7832, by increasing the level of system loss cap to not less than
9%. On November 18, 2010, the first and only hearing on the Petition was conducted by the ERC.
Thereafter, MERALCO was directed to submit its Formal Offer of Evidence. The Petition is awaiting the
resolution by the Commission.
For the year ended December 31, 2010, MERALCO’s system loss improved by 67 basis points from
the 8.61% registered in December 31, 2009 to 7.94%. CEDC’s system loss also improved by 5 basis
points from 3.86% for the year ended December 31, 2009 to 3.81% for the year ended December 31,
2010.
Volume Sales and Philippine Economic Conditions
The sale of electric energy is driven mainly by prevailing economic conditions and the number of
customers being served by the Company. The Company’s franchise area accounts for almost 46% of the
Philippines’ GDP, with 33% from Metro Manila.
In 2010, Philippine’s GDP posted at 7.3%, the highest performance in more than 20 years brought
about by strong foreign trade performance, global economic recovery and election-related spending. From
2006 to 2010, Philippine GDP grew at a compounded annual rate of approximately 6.2%, compared with
3.4% during the period from 2005 to 2009.
With the Philippine GDP growth of 7.3% in 2010, the Company’s energy sales volume grew by
10% from 27,516 GWh in 2009 to 30,247 GWh in 2010. All customer classes registered increases in their
electric spending with sales to industrial customers the highest at 16% brought about by increased
economic activities.
Billed customers grew steadily over the last five years, with 146,122 new customers representing
an increase of 3%, in 2010. As at December 31, 2010, total customer count was 4.8 million. Residential
customers, while consuming 32% of the total energy sold, account for 91% of the total 4.8 million

customers. Commercial customers totalling 0.4 million accounts for 39% of the total energy sold.
Approximately, 0.1 million industrial customers account for 29% of energy sold.
Electricity Supply
The Company does not operate its own generation capacity yet and purchases all of the power that
it distributes from the National Power Corporation or NPC and Independent Power Producers or IPPs. For
the year ended December 31, 2010, MERALCO purchased 40.6% of its requirements from NPC, 14.1%
from the Wholesale Electricity Spot Market or WESM, a venue where suppliers and buyers trade electricity
as a commodity, and the balance from its IPPs.
On November 22, 2006, the NPC and the Company signed a Transition Supply Contract or TSC,
which expires at the earlier of the end of five years from effectivity date or, introduction of the open access
within the 5-year period, at the end of one year from the introduction of open access. On July 20, 2007,
MERALCO and NPC signed an Addendum to its TSC increasing the annual contracted quantities. The
amended schedule of contracted energy is 7,156 GWh in 2007, 7,624 GWh in 2008, and 7,666 GWh for
each of 2008 to 2011.
In relation to a Petition filed by the Bureau of Trade Regulation and Consumer Protection of the
Department of Trade and Industry against the Company, the ERC directed MERALCO to negotiate and
contract with the NPC for an increase in the TSC contracted volume to match this with the updated demand
forecast, net of the quantities under its IPP contracts. To date, discussion between MERALCO and NPC
has not yet concluded.
With respect to CEDC, its supply contract with the NPC for the purchase of electricity was renewed
for the period March 26, 2008 to March 25, 2013, with minimum contract energy per annum as follows:
Year GWh per annum i
March 26, 2008 to March 25, 2008 250
March 26, 2008 to March 25, 2010 256
March 26, 2010 to March 25, 2011 263
March 26, 2011 to March 25, 2012 269
March 26, 2012 to March 25, 2013 276
Currency Exchange Rates
Changes in the value of the peso against other currencies, particularly the U.S. dollar, may affect
the Company’s operating results and financial condition in a number of respects. As at December 31,

2010, while substantially all the Company’s revenues are denominated in Philippine peso, less than 1% of
the principal amount of the Company’s indebtedness, most of the Company’s capital expenditures, a
substantial portion of the Company’s power purchased costs and interest expense and a small portion of
the Company’s operations and maintenance expenses are denominated in, or indexed to, the U.S. dollars,
and may increase significantly in peso terms as a result of any substantial depreciation of the peso. The
peso has appreciated vis-à-vis the U.S. dollar, from P=46.20:US$1.00 as at December 31, 2009 to
P=43.84:US$1.00 as at December 31, 2010.
On October 22, 2008, the ERC released an order directing MERALCO to refund over-recoveries in
the Currency Exchange Rate Adjustment or CERA mechanism incurred from June 2003 to December
2006. The Commission directed MERALCO to refund the CERA over-recoveries, along with carrying
charges estimated at P=833 million, over a period of 12 months, equivalent to P=0.1461 per kWh.
On December 4, 2008, MERALCO filed a Motion, which asked the ERC to defer the CERA refund
and to implement it no earlier than the February 2008 billing cycle. MERALCO’s motion for the deferral of
the CERA refund was granted by the ERC and MERALCO was authorized to implement a CERA refund
“equivalent to P=0.0400 per kWh starting the March 2008 billing cycle until such time that the full amount
shall have been refunded.
On April 25, 2008, the ERC released an Order reinstating its directive for MERALCO to refund the
CERA over-recovery at a rate of P=0.1461 per kWh. The acceleration of the CERA refund would cushion
the impact on the consumers of the implementation of MERALCO’s approved MAP for RY 2008, both of
which were implemented beginning May 2008. The refund of the CERA over-recoveries was completed in
April 2010.
Industry Restructuring
Under the EPIRA, the Philippine power industry continues to undergo fundamental restructuring.
These restructuring measures include:
• The deregulation of, and introduction of competition in, power generation and supply activities
and pricing;
• The privatization of the NPC’s power generating assets and IPP contracts;
• The unbundling of the relative costs of the various segments of the power supply chain and
reflecting these in the bills to customers;
• Freedom of consumers to choose electricity suppliers;
• Open and non-discriminatory access in the networks of distribution utilities, subject to the
fulfillment of certain conditions precedent;
• The implementation of the WESM; and
• Removal of inter-grid, intra-grid, and inter-class cross-subsidies.

ELECTRIC POWER INDUSTRY DEVELOPMENTS AND UPDATES
1. Implementation of Performance-Based Regulation or PBR
As DUs, MERALCO and CEDC are subject to the rate-making regulations and regulatory
policies of the ERC. Billings to customers of the Parent Company are itemized or “unbundled” into
a number of bill components that reflect the various units incurred in providing electric service. The
adjustment to each bill component is governed by mechanisms promulgated and enforced by the
ERC, mainly: [i] the “Rules Governing the Automatic Cost Adjustment and True-up Mechanisms
and Corresponding Confirmation Process for Distribution Utilities,” which govern the recovery of
pass-through costs, including over- or under-recoveries of the bill components, namely,
(a) generation charge, (b) transmission charge, (c) system loss charge, (d) lifeline rate subsidies,
(e) local franchise and (f) business taxes; and [ii] the “Rules for the Setting of Distribution Wheeling
Rates or RDWR,” as modified by ERC Resolution No. 20, Series of 2008, which govern the
determination of the Parent Company’s distribution, supply, and metering charges.
The rate-setting mechanism of CEDC is likewise in accordance with ERC regulations.
After the unbundling of its rates based on ERC guidelines, CEDC became an entrant to the PBR
under Group D. CEDC is currently undergoing regulatory reset.
The following is a discussion of matters related to rate-setting of the Parent Company:
Rate Applications
Performance-Based Regulation or PBR
MERALCO
The Parent Company was among the first entrants to the PBR, together with Dagupan
Electric Corporation and Cagayan Electric and Power Company.
Rate-setting under PBR is governed by the RDWR. Unlike the Return on Rate Base or
RORB, methodology, which was in place up to June 2007, where utility tariffs were determined
based on historical costs plus a reasonable rate of return, the PBR scheme sets tariffs based on
the DU’s asset base, and the required operating and capital expenditures. Once a regulatory
period to meet a level of operational performance determined or approved by the ERC. The PBR
also employs a mechanism that penalizes or rewards a DU depending on its network and service
performance.

Rate filings and setting are done on a regulatory period basis where one regulatory period
or RP consists of four regulatory years. A regulatory year or RY, begins on July 1 and ends on
June 30 of the following year. As at December 31, 2010, the Parent Company is operating in the
first half of the fourth RY of the second RP. The second RP is from July 1, 2007 to June 30, 2011.
Maximum Average Price or MAP 2008 and 2009
On January 11 and April 1, 2008, the Parent Company filed separate applications for the
approval of its proposed translation of the MAP for RY 2008 and RY 2009 into different rate
schedules for the Parent Company’s various customer segments. A portion of the distribution
charge under-recoveries as a result of the delay in the implementation of PBR was incorporated in
the proposed MAP of P=1.3607 per kWh for RY 2009.
In April 2009, the ERC approved the implementation of the Parent Company’s average
distribution rate for RY 2009 of P=1.2227 per kWh effective billing periods starting May 2009. This
rate is inclusive of P=0.1285 per kWh representing the recovery of under-recoveries for calendar
year 2007.
On May 28, 2009, certain electricity consumer groups filed a Petition with the Court of
Appeals, or CA, questioning the Decision and Order of the ERC on the Parent Company’s rate
translation application for RY 2009 which the ERC set at P=1.2227. In a decision dated January 27,
2010, the CA denied the Petition. Consequently, the consumer groups brought the case to the
Supreme Court or SC. The Parent Company already filed its Comment on the Petition before the
SC while the Petitioners filed their Reply thereto. As of the report date, the Parent Company is
awaiting further action of the SC on the petition.
As part of the PBR, the Parent Company implemented payouts to customers where the
Parent Company’s performance was beyond the guaranteed service levels or GSL established by
the ERC. See Note 26 – Trade Payables and Accrued Expenses.
MAP 2010
On August 7, 2009, the Parent Company filed a petition for the verification of the MAP for
RY 2010 and its translation into tariffs by customer category. In accordance with the ERC’s
Guidelines for RY 2010 Rate Reset for First Entrant Distribution Utilities, the constrained MAP for
RY 2010 was computed to be P=1.4917 per kWh.
On December 14, 2009, the ERC approved the Parent Company’s application for approval
of: a) MAP for the RY 2010; and b) translation of the MAP for RY 2010 into a distribution rate
structure for its various customer classes. A Motion for Reconsideration and Clarification was filed
by a consumer against the said ERC decision. On January 26, 2010, the Parent Company filed a

manifestation with the ERC voluntarily suspending the implementation of the ERC’s December 14,
2009 Decision, until such time the regulator resolves and addresses all other issues raised by the
intervenors may raise. On March 10, 2010, the ERC resolved the Motion for Reconsideration and
approved a new rate schedule that ensures that there will be no rate distortion or no cross-
subsidies, other than the lifeline subsidy, in the Parent Company’s rates. Consequently, the Parent
Company implemented the new rate schedule effective its April 2010 billing cycle.
Certain electricity consumer groups likewise filed a Petition for Certiorari with the SC
questioning the Decision rendered by the ERC. The Parent Company has filed its comment thereto
and has likewise commented on the new issues raised by petitioners in their reply. The Parent
Company is now awaiting further action by the SC on the Petition.
MAP 2011
On December 6, 2010, the ERC approved the Parent Company’s application for
constrained MAP for RY 2011 of P=1.6464 per kWh, limited by the side constraints and S Factor of
P=0.008 per kWh; and ordered the Parent Company to implement, starting the next billing cycle
from receipt thereof, its approved Distribution, Supply and Metering Charges. The 2011 MAP rates
were implemented starting the January 2011 billing cycle.
Third RP Reset Application
On June 18, 2010, the Parent Company filed its application for the approval of its proposed
Annual Revenue Requirement or ARR and Performance Incentive Scheme or PIS, for the third RP
(July 1, 2011- June 30, 2015). The case is docketed as ERC Case No. 2010-069-RC.
The hearings for the case have been completed and ERC has released its Draft
Determination, which contains its initial position on the Parent Company’s application. On February
7, 2011, the ERC conducted a public consultation on the Parent Company’s Draft Determination.
Comments submitted by the intervenors shall be reviewed by the ERC in connection with its Final
Determination.
Upon approval, the Parent Company’s ARR will then be translated into a distribution rate
structure to be implemented across the various customer classes of the Parent Company for the
third RP. The PIS, on the other hand will provide the performance measures and targets that will
apply to the Parent Company throughout the third RP.
SC Decision on Unbundling Rate Case
On May 30, 2003, the ERC issued an Order approving the Parent Company’s unbundled
tariffs that resulted in a total increase of P=0.17 per kWh over the May 2003 tariff levels. However,

on August 4, 2003, certain consumer and civil society groups filed a Petition for Review with the
Court of Appeals or CA, on the ERC’s ruling. On July 22, 2004, the CA set aside the ERC’s ruling
on the Parent Company’s rate unbundling and remanded the case back to the ERC. Further, the
CA opined that the ERC should have asked the Commission on Audit or COA, to audit the books of
the Parent Company. The ERC and the Parent Company subsequently filed separate motions
asking the CA to reconsider its decision. On January 24, 2005, as a result of the denial by the CA
of the motions, the ERC and the Parent Company elevated the case to the SC of the Philippines.
In an En Banc Decision promulgated on December 6, 2006, the SC set aside and reversed
the CA ruling saying that a COA audit was not a prerequisite in the determination of a utility’s rates.
However, while the SC affirmed the ERC’s authority in rate-fixing, the SC directed the ERC to
request the COA to undertake a complete audit of the books, records and accounts of the Parent
Company. On January 15, 2007, in compliance with the directive of the SC, the ERC requested
the COA to conduct an audit of the books, records and accounts of the Parent Company.
2. Application for Recoveries
The Parent Company filed with the ERC its applications for recoveries of advances for
pass-through costs. These advances consist mainly of unrecovered or differential generation and
transmission charges technically referred to as under-recoveries, which are recoverable from the
customers, as allowed by law.
Applications for the Recovery of Generation Costs and System Loss Charges
The Parent Company filed separate applications (ERC Case Nos. 2006-52RC, 2006-
062RC, 2006-076RC, 2007-001RC, 2007-038RC, 2007-078RC, 2007-101RC, 2007-120RC, 2007-
123RC and 2007-135RC) for the full recovery of generation costs, including value-added tax, or
VAT, incurred for the supply months of August 2006 to May 2007 or total under-recoveries of
P=12,679 million for generation charges and P=1,295 million for system loss, or SL charges.
The separate applications for the full recovery of generation charges have been approved
by the ERC in its decisions released on January 18, 2008, September 3, 2008 and August 16,
2010.
As at December 31, 2010 the remaining balance of P=2,607 million of such unrecovered
generation costs will be billed in 2011 at the rate of P=0.0314 per kWh until completed and is shown
as part of “Trade and other receivables - Unbilled” account. See Note 15 – Trade and Other
Receivables.
With respect to the P=1,295 million SL charge under-recoveries, the ERC ordered the
Parent Company to file a separate application for the recovery of SL adjustments after the ERC

confirms the transmission rate to be used in the calculation of the SL rate in accordance with the
SL rate formula of the AGRA Guidelines. As at February 28, 2011, the Parent Company has yet to
file the application for recovery of the P=1,295 million system loss charge under-recoveries with the
ERC.
Application for Recovery of Transmission Costs
Consistent with the rules on Transmission Rate Adjustment Mechanism, the Parent
Company filed an application to recover transmission costs advances, net of transmission over-
recoveries. The final Order from the ERC dated December 14, 2009 updated the net amount
recoverable of the Company to P=1,480 million, inclusive of carrying charges. As at December 31,
2010, the balance of P=88 million, which will be billed in 2011 is included in “Trade and other
receivables” account in the consolidated statement of financial position.
Applications for Recovery of Advances for Other Pass-Through Costs
Inter-Class Cross Subsidy and Lifeline Subsidy
The Parent Company filed separate application to recover inter-class cross subsidy on
November 14, 2007 and lifeline subsidy on February 19, 2008.
In December 2009, the Parent Company implemented the decisions of ERC on the
interclass and lifeline cross subsidies. As at December 31, 2010, the total amount of billed
interclass cross subsidy and lifeline subsidy amounted to P=334 million and P=220 million,
respectively. The unbilled balance of inter-class cross subsidy is P=715 million and is expected to
be recovered within the next 28 months. The balance of lifeline subsidy is P=636 million and will be
billed within the 38 months. The amount recoverable within twelve months is included in the “Other
current assets” while the long-term portion is included in the “Other noncurrent assets” account.
Rules Governing the Automatic Cost Adjustment and True-up Mechanisms and
Corresponding Confirmation Process for Distribution Utilities
On August 12, 2009, the ERC issued Resolution No. 16, Series of 2009, adopting the
“Rules Governing the Automatic Cost Adjustment and True-up Mechanisms and Corresponding
Confirmation Process for Distribution Utilities.” These rules govern the recovery of pass-through
costs, including over- or under-recoveries in the following bill components: generation charge,
transmission charge, system loss charge, lifeline rate subsidies, local franchise and business
taxes.
The rules synchronize the various confirmation and verification processes by the ERC for
the foregoing charges. In its Decision, the ERC required DUs in Luzon to which the Parent

Company belongs, to file their consolidated applications to resolve under- or over-recoveries
accumulated from the start of their rate unbundling until December 2008, not later than October 30,
2009. Subsequent filings will be every three years thereafter. However, under ERC Resolution
No. 23 (Series of 2009), dated October 12, 2009, such application was deferred. On October 18,
2010, the ERC promulgated ERC Resolution No. 21 (Series of 2010), amending certain formula
contained in ERC Resolution No. 16 (Series of 2009) and setting March 31, 2011 (covering
adjustments implemented until the billing month of December 2010) and March 31, 2014 (covering
adjustments from January 2011 to December 2013) as the new deadlines for DUs in Luzon to file
their respective applications. Subsequent filings shall likewise be every three years thereafter.
Petition to Implement a Lower Generation Charge for the February 2010 Supply
Month
The Parent Company’s generation cost abruptly increased to P=15.9 billion for the supply
month of February 2010. This translates to a generation charge of P=6.76 per kWh to its customers
for the March 2010 billing. The sharp increase in generation cost was mainly due to the high prices
in the WESM, brought about by the tight supply of electricity, as several plants were either out on
preventive or emergency maintenance, or with de-rated capacity because of the “El Nino”
phenomenon and unusually higher temperature. A Petition was filed by the Parent Company to
mitigate the effects of the abrupt increase in generation cost through a voluntary deferral of a
portion of generation costs, with the differential to be recovered over a period, which shall be
approved by the ERC. In an Order dated March 10, 2010, the ERC provisionally approved a lower
generation charge of P=5.8417 per kWh representing P=13.77 billion as generation cost for the
subject period. The Parent Company was also provisionally allowed to charge over a six month
period starting April 2010 the generation charge at the rate of P=0.07 per kWh, corresponding to the
incremental costs of the condensate fuel used by the First Gas plants during the said period. The
balance of the generation costs, which the Parent Company is seeking to recover in the same
petition, is now undergoing evaluation by the ERC. All hearings have been completed with the case
pending decision by the ERC.
3. Revised System Loss Caps
On September 29, 2004, the ERC issued the “Guidelines for the Application and Approval
of Cap on the Recoverable Rate of Distribution System Losses” requiring the submission of
segregated system loss caps for technical, non-technical and administrative losses and the Parent
Company estimates for the succeeding five years. Thereafter, a series of exchanges were made
between ERC and the different distribution utilities.
On December 8, 2008, the ERC promulgated Resolution No. 17, Series of 2008, entitled
“A Resolution Adopting a New System Loss Cap for Distribution Utilities,” where a lower maximum
rate of system loss (technical and non-technical) that a utility can pass on to its customers. The

new system loss cap shall be the lower of the actual but not to exceed 8.5% for private utilities,
effective January 2010 billing, which is one percentage point lower than the 2009 system loss cap
of 9.5%. The actual company use (administrative loss) shall be treated as part of the operations
and maintenance expenses in the next reset for utilities under PBR. The manner by which the
utility will be rewarded for their efforts in system loss reduction shall be addressed by the ERC in
the Performance Incentive Scheme or PIS under PBR.
On December 8, 2009, MERALCO filed a Petition to Amend the said Resolution with an
urgent prayer for the immediate suspension of the implementation of the new system loss cap of
8.5% starting January 2010. The proposed amendment is aimed at making the Resolution
consistent with the provisions of RA No. 9136 and RA No. 7832, by increasing the level of system
loss cap to not less than 9%.
Prior to the Petition, the ERC denied MERALCO’s appeal contained in a letter to the
Commission, seeking deferment of the imposition of the revised system loss cap citing the abrupt
and substantial decline in industrial energy sales brought about by the economic downturn, as well
as the continued increase in residential sales, which has pushed up the share of low voltage
energy sales to the total consumption.
As at December 31, 2010, the ERC has yet to act on the Petition.
4. Philippine Economic Zone Authority or PEZA Registration and Open Access Guidelines
On September 13, 2007, PEZA issued “Guidelines in the Registration of Electric Power
Generation Facilities/Utilities/Entities Operating Inside the Ecozones” and “Guidelines for the
Supply of Electric Power in Ecozones.” These Guidelines effectively give PEZA franchising and
regulatory powers in ecozones. The Guidelines are the subject of an injunction case filed by the
DUs at the RTC-Pasig.
Meantime, in support of the government’s objective of providing lower cost to ecozone
locators, the Company entered into a MOA with NPC on September 17, 2007 for the provision of
special ecozone rates to high load factor PEZA-accredited industries. The ERC allowed the
immediate implementation of the program, which is still ongoing.
5. Purchase of Subtransmission Assets or STAs
The Sucat-Araneta-Balintawak transmission line is a two-part transmission line, which
completed the 230kV-line loop within Metro Manila. The two main parts are the Araneta to
Balintawak leg and, the Sucat to Araneta leg, which cuts through Dasmariñas Village, Makati City.

Up to May 2001, NPC operated and developed the nationwide transmission grid.
Thereafter, with the effectivity of the EPIRA, the authority and responsibility were transferred to
TransCo. The distribution lines of MERALCO are connected to the transmission grid of TransCo.
Beginning January 15, 2009, NGCP operates the transmission grid of TransCo under a
Concession Agreement.
On March 10, 2000, the residents along Tamarind Road, Dasmariñas Village, Makati City
or plaintiffs, filed a case with the RTC-Makati against NPC enjoining the latter from further
preparing and installing high voltage cables to the steel pylons erected near the plaintiffs’ homes
and from energizing and transmitting high voltage electric current through said cables because of
the alleged health risks and danger posed by the same. The RTC-Makati initially issued on March
13, 2000 an Order directing the parties to maintain the status quo and then later granted the
preliminary injunction prayed for by the plaintiffs on April 3, 2000. The decision was confirmed by
the SC on March 23, 2006, which effectively reversed a decision of the CA to the contrary.
The RTC- Makati subsequently issued a writ of execution based on the order of the SC, as
moved by the plaintiffs. MERALCO, in its capacity as an intervenor, was constrained to file an
Omnibus Motion to maintain status quo because of the significant effect of a de-energization of the
Sucat-Araneta line to the public and economy. The shutdown of the 230 kV line will result in
widespread and rotating brownouts within MERALCO’s franchise area with certain power plants
unable to run at their full capacities.
On September 8, 2009, the RTC-Makati granted the motions for intervention filed by
intervenors MERALCO and NGCP and dissolved the Writ of Preliminary Injunction issued, upon
the posting of a counter bond by defendant NPC in the amount of P=10 million, intervenor
MERALCO in the amount of P=2 million, and intervenor NGCP in the amount of P=2 million, subject
to the condition that NPC and intervenors pay all damages, which the plaintiffs may incur as a
result of the Writ of Preliminary Injunction.
Thereafter, the plaintiffs questioned the RTC-Makati order before the CA. As at December
31, 2010, this remains pending for resolution in the CA.
6. Decision on the P=0.167 per kWh Refund
Following the SC’s final ruling that directed the Parent Company to refund affected
customers P=0.167 per kWh covering the billing period from February 1994 to April 30, 2003, the
ERC approved the release of the refund in four phases, starting June 2003 until December 2010.
In an Order dated February 7, 2011, the ERC approved MERALCO’s proposal for
extension of the SC refund process for five years up to December 31, 2015, in view of the
difficulties encountered by (i) the customers in meeting the necessary documentation requirements

for approval and payment of the refund and (ii) the Company in contacting or locating customers
entitled to the refund.
7. Expanded Senior Citizens Act of 2010 or ESCA
RA No. 9994, otherwise known as the Expanded Senior Citizens Act of 2010 or ESCA,
was signed into law last February 16, 2010. The ESCA amends certain provisions of RA No. 9257,
which mandates the grant of benefits to senior citizens and to institutions catering to senior
citizens.
The ESCA grants senior citizens a minimum five percent (5%) discount on the monthly
electric bill, for services that are registered in the name of the senior citizen and whose monthly
consumption does not exceed 100 kWh. Moreover, the law gives a discount of at least 50% on the
consumption of electricity by senior citizens centers and residential care/group homes.
The ESCA took effect on April 22, 2010 and its Implementing Rules and Regulations or
IRR were promulgated by the Department of Social Welfare and Development or DSWD last June
18, 2010. The IRR provides that utility-regulatory agencies (such as the ERC) shall, within six
months after the IRR takes effect, “formulate supplemental guidelines to cover recovery rate
mechanisms and/or sharing of burden, among other concerns of the distribution utilities,” in the
implementation of the discounts provided under the law.
On August 25, 2010, the ERC released for comments the “Draft Rules for the Calculation
of Senior Citizen Discounts and Subsidy on Electricity Consumption under Section 4 and 5 of RA
No. 9994”. Public consultations were held last September 22, 29, and October 6, 2010. The ERC
has yet to finalize and promulgate the said rules. After the conduct of consultations, the ERC
released the second draft on November 15, 2010 for comments.
On January 5, 2011, the ERC released Resolution No. 23, Series of 2010 adopting the
“Rules Implementing the Discounts to Qualified Senior Citizen End-Users and Subsidy from the
Subsidizing End-Users on Electricity Consumption under Sections 4 and 5 of RA No. 9994”. The
Resolution was published in Daily Tribune on January 6, 2011, and in Manila Times on January 7,
2011. It became effective on January 22, 2011.
OTHER QUANTITATIVE AND QUALITATIVE DISCLOSURES
(i) Any events that will trigger direct or contingent financial obligation that is material to the company, including any default or acceleration of an obligation.

a. Mediation with NPC
The NPC embarked into a Power Development Program or PDP, which consisted of
contracting generating capacities and the construction of its own as well as private sector
generating plants, to avoid a power supply crisis. To address the concerns of the creditors of NPC,
namely, Asian Development Bank and the World Bank, the then Department of Energy or DOE
required MERALCO to enter into a long-term supply contract with NPC.
On November 21, 1994, MERALCO entered into a 10-year CSE with NPC to commence
on January 1, 1995, the terms of the CSE and the rates charged to MERALCO of which approved
by the BOD of NPC and the then ERB, respectively.
Separately, the DOE further asked MERALCO’s support and commitment to provide a
market for half of the output of the Camago-Malampaya gas field, which was to generate significant
revenues for the Philippine Government.
MERALCO’s purchases from NPC exceeded the contract level in the first seven years of
the CSE. However, the 1997 Asian crisis resulted in a significant dip in energy sales.
While the events were beyond the control of MERALCO, NPC refused to honor the Parent
Company’s good faith notification. A dispute ensued and both parties agreed to go into mediation.
The mediation resulted in the signing of a Settlement Agreement conditioned on ERC’s
approval on July 15, 2003. The Settlement Agreement was approved by the respective BODs of
NPC and MERALCO. The net settlement amount of P=14,320 million was agreed upon by NPC and
MERALCO and manifested before the ERC through a Joint Compliance dated January 19, 2006.
Subsequently, the Office of the Solicitor General or OSG filed a “Motion for Leave to
Intervene with Motion to Admit Attached Opposition to the Joint Application and Settlement
Agreement between NPC and the Parent Company.” As a result, MERALCO separately sought
judicial clarifications with RTC-Pasig. Pre-trials are ongoing. However, the OSG refused to
participate in the pre-trial and opted to seek a Temporary Restraining Order or TRO from the CA.
In the event the Settlement Agreement is disapproved, MERALCO and NPC shall revert to
their respective positions before the mediation, which shall be resolved through arbitration. On the
other hand, a decision by the RTC-Pasig shall mean that the agreement is valid although
enforcement of the Settlement Agreement is dependent on the final approval by the ERC, which
shall be the basis for the recognition of any liability or receivable.

b. Real Property Tax Assessment
Six local governments units or LGUs assessed MERALCO for deficiency real property
taxes on certain assets of the Parent Company. The assets include any of electric poles, wires,
insulators, and transformers, collectively referred to as TWIP. Of these LGUs, one has secured a
favorable decision from the CA, whereby the appellate court directed the LGU concerned to
present an assessment of the foregoing properties and collect the pertinent tax in accordance with
the Local Government Code or LGC of 1991. Such Decision was further appealed to the SC
where it is now submitted for resolution. With respect to the cases of the five other LGUs, these
are pending with their respective administrative bodies or government offices.
Accordingly, MERALCO deemed it prudent to include in its third RP operating expenses,
payment of RPT on its TWIP commencing RY 2011. The Company, however, continues to pursue
its legal actions and avail of legal remedies with respect to the legality, validity and applicability of
the assessments, and in the event, payment is warranted or appropriate, to recover any resulting
real estate tax payments through separate application under Article 11 of the “Rules for Setting
Distribution Wheeling Rates for Privately Owned Distribution Utilities Operating under Performance
Based Regulation (First Entry Group: Third Regulatory Period).”
c. Local Franchise Tax
Certain municipalities have served assessment notices on MERALCO for local franchise
taxes. As provided in the LGC, only cities and provincial governments may impose taxes on
establishments doing business in their localities. On the basis of the foregoing, the management of
MERALCO and its legal counsel believe that it has strong legal grounds to contest such
assessments.
d. Deferred Purchased Power Adjustment or PPA
On October 19, 2009, the ERC released its findings on the Parent Company’s
implementation of the collection of certain pass-through cost under-recoveries, which it had
previously approved. According to the ERC, MERALCO over-recovered P=268 million of deferred
PPA, transmission line costs related to QPPL and deferred accounting adjustments, or DAA
incurred in 2004 and, directed MERALCO to refund said amount to customers, along with P=184
million in carrying charges, via a rate of P=0.0169 per kWh beginning the next billing cycle after
receipt of the ERC’s ruling until the amount is fully refunded. However, the ERC has yet to rule on
MERALCO’s under-recovered deferred PPA of P=106 million. As at December 31, 2010,
MERALCO has filed a Motion for Reconsideration, which is pending decision of the ERC.

e. COA Audit
The SC, in its Decision dated December 6, 2006 on the MERALCO Unbundling case, ruled
that a COA audit was not a prerequisite for the determination of a utility’s rates in connection with
MERALCO’s rate unbundling case. While affirming the ERC’s authority on rate-fixing, the SC
nevertheless directed the ERC to request the COA to conduct a complete audit of the books,
records and accounts of MERALCO. Thus, in compliance with the SC directive, on January 15,
2007, the ERC engaged the COA to conduct an audit using calendar years 2004 and 2007 as test
years.
The COA audit, which began in September 2008, was completed in August 2009.
On February 17, 2010, the Parent Company received a copy of the ERC Order related to
Case No. 2001-900 RC, entitled “In the Matter of the Application for the Approval of the Unbundled
Rates pursuant to the Provision of the Application for the Approval of the Unbundled Rates
pursuant to the Provision of RA No. 9136, MERALCO, Applicant,” which directed all intervenors in
the case to submit within 15 days from receipt of their respective comments on the COA’s “Report
No. 2009 01 Rate Audit Unbundled Charges.”
The Company has already submitted its comment on the COA audit report. Similarly, the
intervenors have filed their comments to the COA audit report and the Company has responded to
the same. With these developments, the Company is now awaiting the action of the ERC on the
COA Audit Report.
f. Other Claims
Related provisions for items estimable amounted to P=5,751 million, P=3,351 million, and
P=318 million in 2010, 2009 and 2008 respectively, gross of potential recoveries.
Management, after consultations with internal and external counsels with respect to other
contingencies, believes that the probable resolution of these issues will not materially affect the
Company’s financial position and results of operations.
(ii) All material off-balance sheet transactions, arrangements, obligations (including contingent obligations), and other relationships of the company with unconsolidated entities or other persons created during the reporting period.
Not Applicable.

(iii) Any material commitments for capital expenditures, the general purpose of such commitments, and the expected sources of funds for such expenditures should be described;
2011 Capital Expenditure Requirements (In millions)
Electric capital projects P=8,299
Non-electric projects and other capitalized items 2,603
Total Capital Expenditures P=10,902
As at December 31, 2010, the Company has met, and expects that it will continue to meet
its capital expenditure requirements primarily from cash flow from operations, and working capital.
The Company is required by the ERC to take necessary steps, including making
necessary capital expenditures, to build and maintain its network so as to meet minimum
performance and service requirements and in any event to make capital expenditures in each
quarter at least equal to the amount of depreciation taken in the prior years. Most expenditure on
transmission and substation projects, supervisory control and distribution automation, and
distribution line projects are non-discretionary. The remaining capital expenditure is discretionary,
which encompasses allocation projects, telecommunications projects and other non-electrical
capital expenditure. If the actual peak demand is lower than the forecasted demand, a portion of
the non-discretionary capital expenditure may become discretionary.
The Company has an approved capital expenditure budget of P=10,902 million for the year
ending December 31, 2011, of which about 76% represents planned expenditures for the electric
projects of the power distribution business. It has to prioritize its projects to only those deemed
urgent in the 2011 project line up. Funding of capital expenditures will be sourced substantially
from internally generated cash flow, and borrowings from local and foreign financial institutions.
MERALCO has to contend with improvements in its system through much needed capital
expenditure program and said program is of primordial importance since this ensures the level of
quality service expected by its customers.
The P=10,902 million approved capital expenditure budget is geared to support projects on
areas with large concentration of core customers, give priority to correction of normal deficiencies
in the system, stretch loading limits of company facilities and initiate practical and cost-effective
projects to correct system deficiencies.

(iv) Any known trends, events or uncertainties that have had or that are reasonably expected to have a material favorable or unfavorable impact on net sales or revenues or income from continuing operations should be described.
• Retail Competition
On February 18, 2011, the ERC pursuant to its mandate under Section 3, Rule 12 of the
EPIRA Implementing Rules and Regulations issued an Order setting public hearings for the
purpose of determining whether or not Open Access and Retail Competition may already be
declared. The DOE, NPC and PSALM were directed to appear at the hearings and present
evidence on the matter. MERALCO is an intervenor in said case. Hearings have been conducted
and the parties have been directed to submit a legal memorandum on this matter. Another hearing
has been set for April 6, 2011.
• Acquisition of Carmelray Industrial Park II or CIP2’s Distribution System and Concession Agreement
On April 11, 2009, pursuant to a MOA entered into between MERALCO and Carmelray-
JTCI Corporation or CJC, and duly approved by the PEZA, MERALCO took over the 13.8-kV
distribution line facilities and switching stations of the CIP2 in order to ensure adequate supply of
electricity to the park and its locators for a period of 19 years from effective date until June 28,
2028. CIP2 is located in Calamba, Laguna, which is within the franchise area of MERALCO. On
April 17, 2009, the board of PEZA approved the registration by MERALCO as a PEZA-registered
utilities enterprise subject to certain conditions.
As a PEZA-registered enterprise, MERALCO has the option to pay income tax at 5% of
gross income generated from locators in CIP2, in lieu of all national and local taxes, except real
property taxes. However, MERALCO opted to file its income tax return under the regular corporate
income tax calculation method.
(v) Any significant elements of income or loss that did not arise from the registrant’s continuing
operations;
None
(vi) Any seasonal aspects that had a material effect on the financial condition or results of operations. Seasonality of Operations and Growth Drivers
Approximately 97% of the Company’s operating revenues pertain to sale of electricity
distributed by MERALCO and CEDC.

The electricity sales of MERALCO and CEDC exhibit a degree of quarterly seasonality. The
kWh sales in the 1st Quarter is lower than the average of the year as this period is characterized by
cooler temperature and softer consumer demand following heightened consumer spending in the last
quarter of the year. The 2nd Quarter is marked by higher than average kWh sales. This is due to a
number of factors, including: increased consumption of households and commercial establishments due
the summer season; increased production of industries to replenish stocks and in preparation for the
opening of classes; and heightened construction activity to take advantage of the sunny weather.
Despite the onset of the rainy season which tapers cooling requirements of commercial establishments,
kWh sales typically peaks on the 3rd Quarter of the year. Manufacturing industries that cater to the
export market have their peak production schedule at this time as they rush to meet shipping deadlines
to foreign markets. Industries catering to the domestic market are also now starting production in
preparation for the Christmas season. Lastly, the 4th Quarter performance is about the average of the
year. Industrial production winds down while households and commercial establishments also cut
down on their cooling loads. Given this perspective on the seasonality of kWh sales, a higher proportion
of the MERALCO’s and CEDC’s revenues are earned on the second half of the year.
Aside from the quarterly seasonal pattern, kWh sales on a year-on-year basis adjust as a result
of a number of factors. Sales of electricity normally increase in periods of economic growth, low
inflation and electricity rates, and in periods of high temperatures over extended period of time, e.g. the
El Niño episodes.
The following table sets forth the Company’s quarterly sales in GWh.
Period 2010 2009 2008
First Quarter 6,996 6,124 6,214
Second Quarter 7,954 6,993 6,976
Third Quarter 7,710 7,275 6,983
Fourth Quarter 7,587 7,124 6,876
Total 30,247 27,516 27,049
The businesses of all other subsidiaries are not highly seasonal.

(vii) Discussion of the Company’s and its majority-owned subsidiaries top five (5) key performance indicators. It shall include a discussion of the manner by which the Company calculates or identifies the indicators presented on a comparable basis.
Listed hereunder are MERALCO’s five major subsidiaries namely CEDC, Rockwell Land,
MIESCOR, e-MVI and RSIC. The following table summarizes their key financial performance and
indicators as at and for the years ended December 31, 2010 and 2009, except for MIESCOR whose
reporting date ends on September 30.

Financial Highlights and Ratios2 of Top 5 Subsidiaries
As at and for the years ended December 31, 2010 and 2009
(Amounts in millions, except for CEDC Rockwell Land MIESCOR e-MVI RSIC
financial ratios) As at December 31
As at December 31 As at September 30 As at December 31
As at December 31
2010 2009
% change 2010 2009
% change 2010 2009
% change 2010 2009
% change 2010 2009
% change
Percentage of ownership 65% 65% 51% 51% 99% 99% 100% 100% 100% 100% Condensed Statements of Financial Position
Total assets P=807 P=697 16% P=13,080 P=12,008 9% P=1,628 P=1,143 42% P=695 P=562 24% P=1,057 P=915 16%
Current assets 351 248 42% 5,790 4,714 23% 1,397 939 49% 219 306 (28)% 737 682 8%
Cash and cash equivalents 182 114 60% 321 393 (18)% 592 453 31% 144 99 45% 207 175 18%
Equity attributable to equity holders of the parent 298 254 17% 4,206 3,782 11% 782 665 18% 584 493 18% 169 152 11%
Total debt3 - 10 (100)% 3,016 2,909 4% 149 3 4867% - - -% - - -%
Current liabilities 139 170 (18)% 4,007 1,744 130% 833 448 86% 109 59 85% 294 762 (61)% Financial Ratios
Debt-to-equity ratio - - 0.4 0.4 0.2 - - - - -
Current ratio 2.5 1.5 1.4 2.7 1.7 2.1 2 5.2 2.5 0.9 Years Ended Years Ended Fiscal Years Ended Years Ended Years Ended
December 31 December 31 September 30 December 31 December 31
2010 2009 %
change 2010 2009 %
change 2010 2009 %
change 2010 2009 %
change 2010 2009 %
change Condensed Statements of Income
Revenues P=1,435 P=1,200 20% P=4,378 P=3,776 16% P=1,914 P=1,499 28% P=325 P=328 (1)% P=103 P=51 102%
Costs and expenses 1,317 1,111 19% 3,280 2,851 15% 1,761 1,372 28% 175 144 22% 65 12 442%
Net income 110 83 33% 801 634 26% 109 101 8% 103 128 (20)% 27 31 (13)%
Income attributable to equity holders of the parent 72 54 33% 409 323 27% 108 100 8% 103 128 (20)% 27 31 (13)%
Financial Ratios
Profit margin 8% 7% 18% 17% 6% 7% 32% 39% 26% 61%
Return on equity 26% 24% 10% 9% 15% 16% 19% 29% 17% 23%
Asset turnover 1.9 1.7 0.3 0.3 1.4 1.4 0.5 0.6 0.1 0.1
2 The manner of computing the financial ratios for subsidiaries is the same with computing for the financial ratios of the Company as presented in Financial Highlights and Key Performance Indicators.
3 Total Debt is composed of notes payable and interest-bearing long-term financial liabilities, current and noncurrent portions.

Item 7. Financial Statements
Our consolidated financial Statements are filed as part of this annual report.

Item 8. Changes in and Disagreements with Accountants on Accounting
and Financial Disclosures
The accounting firm, SyCip Gorres Velayo & Co. (SGV) is Meralco’s independent public accountant since 1986. There was no event in the past where SGV and Meralco had any disagreement with regard to any matter relating to accounting principles or practices, financial statement disclosure or auditing scope or procedure.
In compliance with Rule 68 of the Securities Regulation Code on rotation of External Auditors, the audit of the financial statements of Meralco was handled and certified by the engagement partner, Mr. Gemilo J. San Pedro, effective calendar year 2008. Mr. San Pedro issued a statement stating the independence of SGV.
The terms of engagement, scope of services and fees of the external auditor were reviewed and approved by Meralco’s Audit and Risk Management Committee. The Audit and Risk Management Committee is composed of five members and chaired by independent director, retired former Supreme Court Justice Artemio V. Panganiban. The other committee members are independent director Pedro E. Roxas and directors Napoleon L. Nazareno, Eric O. Recto and Vicente L. Panlilio.
Representatives of SGV will be present during the annual meeting and will be given an opportunity to make a statement, if they desire to do so. They are also expected to respond to questions, if needed.
SGV is willing to stand for reelection as external auditor of Meralco for the ensuing year.

PART III PART III PART III PART III –––– CONTROL CONTROL CONTROL CONTROL AND COMPENSATION INFORMATIONAND COMPENSATION INFORMATIONAND COMPENSATION INFORMATIONAND COMPENSATION INFORMATION
Item 9. Directors and Executive Officers
(1) Identity of Directors, Executive Officers and Significant Employees
As of March 18, 2011 the names of the incumbent Directors and Executive Officers of Meralco and their respective ages, citizenship, current positions, periods of service and business experiences during the past five years are as follows: MANUEL M. LOPEZ, 67, Filipino Director (since April 14, 1986), Chairman (since July 1, 2001) Mr. Lopez was sworn in as the Philippine Ambassador to Japan in December 2010. Ambassador Lopez retains his position as the Chairman of the Board of Manila Electric Company where he served as its Chairman and CEO from July 2001 to May 2010. He is the Chairman and CEO of the Lopez Holdings Corporation. Concurrently, he is the Chairman of the Board of Bayan Telecommunications, Inc.; Indra Philippines, Inc.; Rockwell Land Corporation and Rockwell Leisure Club. He is the Chairman and President of Meralco Millennium Foundation Inc. and Meralco Management and Leadership Development Corporation; as well as vice chairman of First Philippine Holdings Corporation and a Director of ABS-CBN Corporation. He remains as the President of Eugenio Lopez Foundation, Inc. RAMON S. ANG, 57, Filipino Director and Vice Chairman (since February 1, 2009) Mr. Ang is the President and Chief Operating Officer of San Miguel Corporation. He is also the Chairman and Chief Executive Officer of Petron Corporation. He also holds, among others, the following positions: Chairman and CEO of San Miguel Brewery Inc., San Miguel Beverages, Inc., San Miguel Energy Corporation, San Miguel International Ltd. (Bermuda), San Miguel Holdings Limited (BVI), San Miguel Beverages Pte. Ltd. (Labuan, East Malaysia) Liberty Telecoms Holdings Inc., The Purefoods-Hormel Company, Inc., San Miguel Yamamura Packaging Corporation, San Miguel Properties, Inc., San Miguel Foods, Inc., San Miguel Coffeemix Co., Inc., Smits, Inc., San Miguel Mills, Inc., San Miguel Brewery Hong Kong Limited, Philippine Diamond Hotel & Resort, Inc., Anchor Insurance Brokerage Corporation, Magnolia, Inc., Mindanao Corrugated Fibreboard, Inc., San Miguel Rengo Packaging Corporation, San Miguel Yamamura Asia Corporation, SMC Yamamura Fuso Molds Corporation, San Miguel (Vietnam) Limited (Bermuda), San Miguel Glass (Guangdong) Ltd. (BVI), San Miguel Yamamura Phu Tho Packaging Co., Ltd. (Vietnam), Ginebra San Miguel International Ltd. (BVI), San Miguel Beer (Thailand) Limited, San Miguel Pure Foods Investment (BVI) Ltd., San Miguel Foods (L) Pte. Ltd. (Labuan, Malaysia), San Miguel Yamamura Packaging International Limited, San Miguel Yamamura Glass (Vietnam) Limited, San Miguel Yamamura Haiphong Glass Co. Ltd., Philippine Oriental Realty Development, Inc., Cyber Bay Corporation, Atea Tierra Corporation, Petron Marketing Corporation and Petron Free Port Corporation; Chairman of Petrogen Insurance Corporation, La Lucas Development Corporation, New Ventures Realty Corporation and Overseas Ventures Insurance Corporation Ltd. (Bermuda); Managing Director of Ginebra San Miguel, Inc., San Miguel Pure Foods Company, Inc., San Miguel

Insurance Co., Ltd. (Bermuda), San Miguel Packaging Research Center Sdn. Bhd. (Malaysia), San Miguel Plastic Films Sdn. Bhd. (Malaysia), San Miguel Packaging & Printing Sdn. Bhd. (Malaysia), and San Miguel Woven Products Sdn. Bhd. (Malaysia); and an Independent Director of Philweb Corporation.
MANUEL V. PANGILINAN, 64, Filipino Director (since May 26, 2009), President and CEO (since July 1, 2010) Mr. Pangilinan is presently the Chairman of Philippine Long Distance Telephone Company (PLDT) and Smart Communications, Inc., the country’s dominant telecom company and the largest mobile phone operator in the Philippines, respectively. He also serves as Chairman of PLDT Communications and Energy Ventures (formerly Piltel), Metro Pacific Investments Corporation, Landco Pacific Corporation, Medical Doctors, Inc., Colinas Verdes Corporation, which operates the Makati Medical Center and Cardinal Santos Medical Center, Davao Doctors, Inc., Riverside Medical Center incorporated in Bacolod City, Our Lady of Lourdes Hospital, Maynilad Water Services Corporation (Maynilad), Mediaquest, Inc., Associated Broadcasting Corporation (TV5), Philex Mining Corporation and Manila North Tollways Corporation. He also holds the following positions: Chairman of the Board of Trustees of San Beda College, Hong Kong Bayanihan Trust, Amateur Boxing Association of the Philippines, Philippine Disaster Recovery Foundation, Inc., and Philippine Business for Social Progress; President of Samahang Basketbol ng Pilipinas; Vice Chairman of Foundation for Crime Prevention; Trustee of Caritas Manila and Radio Veritas Global Broadcasting Systems, Inc. He was Chairman of the Board of Trustees of the Ateneo de Manila University and former member of the Board of Overseers of the Wharton School, University of Pennsylvania. OSCAR S. REYES, 64, Filipino Director and Chief Operating Officer (since July 26, 2010) Mr. Reyes has been a Director of the Philippine Long Distance Telephone Company (PLDT) since 2001. He is also Chairman of MRL Gold Phils. Inc., and Link Edge, Inc., and Board Member of Bank of the Philippine Islands, Manila Water Co., Ayala Land, Inc., Smart Communications, Inc. and Pepsi Cola Products Philippines, Inc. among others. He also served as Country Chairman of the Shell Companies in the Philippines and President of Pilipinas Shell Petroleum Corporation concurrently. He is also a Managing Director of Shell Philippines Exploration B.V. and a Member of the Board of Trustees of Pilipinas Shell Foundation, Inc. and El Nido Foundation, Inc. RAY C. ESPINOSA, 55, Filipino Director (since May 26, 2009) Atty. Espinosa is the President and Chief Executive Officer of Associated Broadcasting Corporation (TV5), Mediascape, Inc. (Cignal TV) and Mediaquest Holdings, Inc., (the investment arm of the PLDT Beneficial Trust Fund). He is also a Director of Philippine Long Distance Telephone Company (PLDT) and Head of PLDT Regulatory Affairs and Policy. He is also a Director of Lepanto Consolidated Mining Company and the Chairman of its Audit and Nominations Committee. He was a partner and member of the Executive Committee of the law firm SyCip Salazar Hernandez & Gatmaitan. He has been cited as one of the leading capital market lawyers and project finance lawyers by Asia Law Leading Lawyers and Euromoney Guide to the World’s Leading Project Finance Lawyers.

ESTELITO P. MENDOZA, 81, Filipino Director (since February 1, 2009) Atty. Mendoza is a practicing lawyer and heads the law firm Estelito P. Mendoza and Associates. He is also a Director of San Miguel Corporation, Petron Corporation, Philippine National Bank and Philippine Airlines, Inc., and Chairman of Prestige Travel, Inc. He was a former Undersecretary of Justice, Minister of Justice and Solicitor General of the Republic of the Philippines and Governor of the Province of Pampanga. He was Chairman of the Sixth (legal) Committee, 31st Session, UN General Assembly and Vice-Chairman of the Philippine Delegation to the UN Seabed Committee and to the Conference on the Law of the Sea. He holds degrees from the University of the Philippines and Harvard University. NAPOLEON L. NAZARENO, 61, Filipino Director (since May 26, 2009) Mr. Nazareno is the President and Chief Executive Officer of Philippine Long Distance Telephone Company (PLDT), Smart Communications, Inc., PLDT Communications and Energy Ventures and Connectivity Unlimited Resources Enterprise, Inc. He also serves as Chairman of the Board of Smart Broadband, Inc., Wolfpac Mobile, Inc., i-Contacts Corporation and Airborne Access, Inc. (subsidiaries of SMART). He is also a Director of PLDT Global Corporation and ePLDT, Inc. ARTEMIO V. PANGANIBAN, 74, Filipino Independent Director (since May 27, 2008) Justice Panganiban was the former Chief Justice of the Supreme Court of the Philippines. He was also Chairperson of the Presidential Electoral Tribunal (PET), Judicial and Bar Council and Philippine Judicial Academy. He is also an Independent Director of Petron Corporation, First Philippine Holdings Corporation, Metro Pacific Investments Corporation, Metro Pacific Tollways Corporation, Robinsons Land Corporation, GMA Network, Inc., GMA Holdings and Asian Terminals. He is Senior Adviser of Metropolitan Bank and Trust Company and a columnist for the Philippine Daily Inquirer. VICENTE L. PANLILIO, 65, Filipino Independent Director (since May 27, 2008) Mr. Panlilio has been a Director of San Fernando Electric Light & Power Co., Inc. since 2003. He is also a Director of the Philippine Stock Exchange (PSE) since 2009. ERIC O. RECTO, 47, Filipino Director (since June 28, 2010) Mr. Recto is President of Petron Corporation, Top Frontier Investment Holdings, Inc., Q-Tech Alliance Holdings, Inc. and ISM Communications Corporation. He is also a Director of San Miguel Corporation and Vice Chairman of the Board of Directors of Atok-Big Wedge Co., Inc., Alphaland Corporation and Philweb Corporation. He was also a former Director of Philex Petroleum Corporation, Metro Pacific Investment Corporation, PNOC Energy Development Corporation, Maynilad Water Services, Inc., Bulawan Mining Corp., PNB Holdings Corporation, PNB International Finance Ltd. and Philippine National Bank.

PEDRO E. ROXAS, 55, Filipino Director (since May 25, 2010) Mr. Roxas has been the Chairman and Director of Roxas Holdings, Inc. since January 1995. He is also Chairman and Director of Roxas and Co., Inc., Roxaco Land Corporation and Hawaiian Philippine Sugar Company. Mr. Roxas also holds the following positions: President of Philippine Sugar Millers Association; Chairman of Roxol Bioenergy Corporation, Fuego Land Corporation and Club Punta Fuego, Inc.; Director of Philippine Long Distance Telephone Company (PLDT), BDO Private Bank and Brightnote Assets Corporation; Trustee of Philippine Business for Social Progress; President of Roxas Foundation; and, Director and President of Fundacion Santiago. SIMEON KEN R. FERRER, 54, Filipino Corporate Secretary and Compliance Officer (since May 26, 2009) Atty. Ferrer is a Senior Partner at the SyCip Salazar Hernandez & Gatmaitan Law Firm. He is currently Chaiman of the firm’s Hiring Committee. He also holds the following positions: Vice Chairman of Philwater Holdings Company, Inc.; Director of Scan Ocean Service, Inc. and Terralex Property Holdings, Inc.; President and Chairman of the Board of Maxim Philippine Land Corporation; Director and Corporate Secretary of Habibi Cove Realty Corporation, Marbelene Realty Corporation, Maxim Philippine Assembly Corporation, Maxim Philippine Holding Corporation, Maxim Philippines Operating Corporation, Microdel Holdings, Inc., Park Lane Assets, Inc., Shanti Hospitality Holdings Philippines Corporation, Shanti Hospitality Real Estate Corporation, Smart Shirts (Phils.), Inc. and Taganito HPAL Nickel Corporation; Corporate Secretary of Bingkay Development Corporation, C & C Alpha Southeast Asia, Inc., Infinity Tower Condominium Corporation, Luzon Electronics Technology, Inc., OOCL Logistics Philippines, Inc., OOCL (Philippines), Inc., Rezalyss Realty Corporation, Shanti Hospitality Hotel Corporation, Sogod Development Corporation, Somerset Salcedo Makati, Inc. and Coral Bay Nickel Corporation; Assistant Corporate Secretary of Alegre Resort Corporation, Ceros Holdings, Inc., Pathfinder Group Philippines, Inc., Pinehill Properties, Inc. and Trellis Properties Corporation. RICARDO V. BUENCAMINO, 66, Filipino Executive Vice President (since July 2007) & Head, Networks Mr. Buencamino is the Director of Clark Electric Distribution Corporation (CEDC), General Electric Philippines Meter & Instrument Co. Inc. (GEPMICI), Meralco Energy, Inc. (MEI), CEPSI Philippines and AIESIAP. He was formerly a Director of Meralco Industrial Engineering Services Corporation (MIESCOR), Landbees Corporation, First Private Power Corporation, Corporate Information Solutions, Inc. (CIS, Inc.), MIESCOR (USA), Inc. and MIESCOR Builders, Inc. (MBI). ROBERTO R. ALMAZORA, 50, Filipino Senior Vice President (since March 1, 2009) Mr. Almazora is presently a Board Member of Indra Philippines, Inc. and Meralco Energy, Inc. (MEI). He previously served as Director of Meralco Industrial Engineering Services Corporation (MIESCOR), General Electric Philippines Meter and Instrument Co., Inc. (GEPMICI), MIESCOR Builders, Inc., Landbees Corporation, Clark Electric Distribution Corporation (CEDC), First Private Power Corporation, e-Meralco Ventures, Inc. (e-MVI) and Meralco Millennium Foundation, Inc. (MMFI).

ALFREDO S. PANLILIO, 47, Filipino Senior Vice President (since September 2010) & Head, Customer Retail Services and Corporate Communication Mr. Panlilio is a Director of PLDT Global Corporation, Telesat, Inc. (Phils.), Subic Telecoms (Phils.) and ACes Philippines Cellular Satellite Corporation. He is Chairman and Director of ATH Holdings, Inc. (Malaysia); President of MVP Sports Foundation; Vice Chairman of MMLDC Foundation, Inc. and Trustee of Meralco Millenium Foundation, Inc. RAMON B. SEGISMUNDO, 53, Filipino Senior Vice President (since February 1, 2010) & Head, Human Resources and Corporate Services Mr. Segismundo is the Governor of the Philippine Basketball Association. He also served as Executive Consultant, Leadership Development Services of the Asia Pacific Personnel Decisions International, Singapore. He was Vice President, Human Resources of the Asia Pacific Wyeth Pharmaceuticals, Pennsylvania USA. BETTY C. SIY-YAP, 49, Filipino Senior Vice President & Chief Finance Officer (since July 1, 2009) Ms. Siy-Yap is also a Director of Republic Surety and Insurance Co., Inc., Meralco Industrial Engineering Services Corporation (MIESCOR), Clark Electric Distribution Corporation (CEDC), General Electric Philippines Meter and Instrument Co., Inc. (GEPMICI), CIS Bayad Center, Inc., Miescorrail, Inc., Rockwell Land Corporation, Meralco Financial Services Corporation, e-Meralco Ventures, Inc. (e-MVI), Indra Philippines, Inc., and Meralco PowerGen Corporation. She was a Partner of SyCip Gorres Velayo & Co. from 1995 to 2009. RAFAEL L. ANDRADA, 50, Filipino First Vice President (since January 2005), Treasurer (since 1998) & Head, Investment Management Group and Treasury Mr. Andrada is a Director of Rockwell Land Corporation, Bauang Private Power Corporation, CIS Bayad Center, Inc., Rockwell Leisure Club, Inc., General Electric Philippines Meter and Instrument Co., Inc. (GEPMICI), Republic Surety & Insurance Co., Inc. (RSIC), and Meralco Industrial Engineering Services Corporation (MIESCOR). He also serves as Director and Treasurer of Clark Electric Distribution Corporation (CEDC); Treasurer of Meralco PowerGen Corporation and Treasurer-In-Trust of Calamba Aero Power Corporation. He was former Director of e-Meralco Ventures, Inc. (e-MVI) and Indra Philippines, Inc. (formerly Soluziona Philippines, Inc.); Trustee of Meralco Millennium Foundation, Inc. (MMFI) and Meralco Pension Fund. RUBEN B. BENOSA, 54, Filipino First Vice President (since January 2010) & Head, Corporate Logistics Office Mr. Benosa is currently the Director of e-Meralco Ventures, Inc. (e-MVI), Meralco Energy, Inc. (MEI) and Miescorrail, Inc. He has been a Director of Outsourced Telleserve Corporation (OTC) and Landbees Corporation. HELEN T. DE GUZMAN, 53, Filipino First Vice President (since January 2010) & Comptroller (since October 2008) Ms. De Guzman is presently a Director of Outsourced Telleserve Corporation (OTC) and MIESCOR Builders, Inc. (MBI). She is a Member and past Director & Chapter President of the

Institute of Internal Auditors-Philippines (IIAP) and the Philippine Institute of Certified Public Accountants (PICPA). IVANNA G. DELA PEÑA, 56, Filipino First Vice President (since January 2010) & Head, Regulatory Management Office Ms. Dela Peña is also a Director of Clark Electric Distribution Corporation (CEDC), e-Meralco Ventures Inc. (e-MVI) and Medical Ambassadors Philippines. ANGELITA S. ATANACIO, 52, Filipino Vice President (since June 2008) & Head, Organization Planning and Development Ms. Atanacio is a Director of Meralco Financial Services Corporation (FINSERVE) and Miescorrail, Inc. She served as Treasurer and Director of Meralco Savings and Loan Association. MARTHYN S. CUAN, 31, Filipino Vice President (since January 1, 2011) & Head, Corporate Information & Technology Mr. Cuan served as the Operations Head, Information Enterprise Services of Deutsche Bank Group-Manila Shared Service Center from 2007 to 2010. He was also Manager of the Information Technology Department of GlaxoSmithKline Philippines, Inc. from 2003 to 2007. RUTH B. DAVID, 54, Filipino Vice President (since January 2008) & Head, North Business Area Ms. David is a Director of e-Meralco Ventures, Inc. (e-MVI), a post held since August 2005. She was former Director of CIS Bayad Center, Inc. RUSTICO C. DE BORJA, JR. 56, Filipino Vice President (since July 2007) & Head, Sub-Transmission Services Mr. De Borja previously served as a Director of MIESCOR Builders, Inc. and Meralco Industrial Engineering Services Corporation (MIESCOR). He has been a Trustee of Meralco Management & Leadership Development Corporation (MMLDC), Inc. and was a Director of Meralco Employees Savings and Loan Association and Meralco Financial Services Corporation (FINSERVE). GERARDO F. DELA PAZ, 52, Filipino Vice President (since January 2010) & Deputy Head, Corporate Governance Mr. Dela Paz is a Trustee and the Treasurer of Meralco Management & Leadership Development Corporation (MMLDC) since 2006. He is also the Secretary and Treasurer of Living Way Churches and Ministries since 1990. MANOLO C. FERNANDO, 55, Filipino Vice President (since January 2010), Assistant Treasurer (since July 2001) & Head, Treasury Operations and Investment Planning & Monitoring Mr. Fernando is a Director of Mutual Fund Company of the Philippines, Inc., Meralco Financial Services Corporation (Finserve), Outsourced Telleserve Corporation, Landbees Corporation and an Agent and fund manager of Meralco Pension Fund. He was former Director of Republic Surety & Insurance Co., Inc. (RSIC).

VICTOR S. GENUINO, 39, Filipino Vice President (since January 10, 2011) & Head, Corporate Business Group Mr. Genuino was former District Director, Hong Kong & Singapore of PLDT (HK) Ltd. He also served as Director of Trade Marketing of Siemens Mobile, Siemens Singapore Pte. Ltd. NIXON G. HAO, 52, Filipino Vice President (since June 2008) & Head, Energy Management Mr. Hao is a Director of Philippine Electricity Market Corporation (PEMC) and Clark Electric Distribution Corporation (CEDC). He previously served as Director of e-Meralco Ventures, Inc. (e-MVI), Meralco Employees Savings and Loan Association and UPEEE Alumni, Inc. ERNESTO D. IGLESIA, 58, Filipino Vice President (since January 2010) & Head, Central Distribution Services Mr. Iglesia is presently a Trustee of Meralco Employees Savings and Loan Association and previously served as a Director of Landbees Corporation. He is a member of the Institute of Integrated Electrical Engineers and Meralco Association of Cadet Engineers since 1976. FORTUNATO C. LEYNES, 53, Filipino Vice President (since January 2006) & Head, Retail Electricity Supplier Set-up Office Mr. Leynes is a Director of Clark Electric Distribution Corporation (CEDC). He has been the Chairman of the Board of Electrical Engineering of the Professional Regulation Commission since October 2009. He was former Director of Meralco Financial Services Corporation (FINSERVE) and Meralco Management & Leadership Development Corporation (MMLDC), Inc. LEONARDO V. MABALE, 54, Filipino Vice President (since January 2008) & Head, Commercial Operations Mr. Mabale is an incumbent Director of Outsourced Telleserve Corporation (OTC). He also served as Director of CIS Bayad Center, Meralco Millennium Foundation, Inc. and Indra Philippines, Inc. (formerly Soluziona, Inc.). REDENTOR L. MARQUEZ, 53, Filipino Vice President (since January 2008) & Head, SME Business Group Mr. Marquez is also Director of Meralco Energy, Inc. (MEI) and Meralco Savings and Loan Association. He was Director of Meralco Industrial Engineering Services Corporation (MIESCOR) from 2005 to 2007. ANTHONY V. ROSETE, 54, Filipino Vice President (since March 1, 2009), Assistant Corporate Secretary (since July 2001), Information Disclosure Officer & Head, Legal Atty. Rosete is concurrently the Head of the Office of the Assistant Corporate Secretary. He is also the Assistant Corporate Secretary of Clark Electric Distribution Corporation (CEDC) and Corporate Secretary of Meralco PowerGen Corporation.. He has been a Director of Miescorrail, Inc. since August 2009 and served as the Corporate Secretary of e-Meralco Ventures, Inc. (e-MVI) from 2002 to 2008.

LIZA ROSE G. SERRANO-DIANGSON, 51, Filipino Vice President (since January 2010) & Head, Customer Process Ms. Serrano-Diangson is a Trustee of Meralco Millennium Foundation, Inc. (MMFI), a post held since 2005. She is also a Director of Outsourced Telleserve Corporation since 2008. JOSE ANTONIO T. VALDEZ, 46, Filipino Vice President (since January 24, 2011) & Head, Marketing and Customer Solutions Mr. Valdez served as the Head of Business Development and Marketing of PLDT Global Corporation from 2008 to 2011. He was former Vice President for Retail Marketing of PLDT from 2003 to 2008.
(2) Term of Office
The Directors are elected at the annual meeting of stockholders for a term of one year, until their successors are elected and qualified.
(3) Significant Employees The employees are the most valued asset of Meralco and contribute to the attainment of its goals.
(4) Family Relationships
There are no family relationships up to the fourth civil degree, either by consanguinity or affinity, among directors, executive officers, or nominees. (5) Involvement in Certain Legal Proceedings
The directors, executive officers and nominees to the Board of Meralco are involved in the following legal proceedings: 1. Mr. Manuel M. Lopez
(a) Intra-corporate controversy In an undated Cease and Desist Order (CDO) issued ex parte, without docket number,
without the official seal of the Securities & Exchange Commission (SEC), and solely signed by the late Commissioner Jesus Enriquez G. Martinez restrained, among others, the Company’s Assistant Corporate Secretary, Anthony V. Rosete, from recognizing, counting, tabulating or otherwise honoring proxies solicited from the public in favor of Manuel M. Lopez, Felipe B. Alfonso, Jesus P. Francisco, Christian S. Monsod, Elpidio L. Ibañez, Francis Giles B. Puno or any officer representing the Meralco Management. The CDO further directed Director Hubert Guevara of the Compliance Enforcement Department of the SEC together with two lawyers, to supervise the Company’s Annual Stockholders’ Meeting on May 27, 2008. A copy of the CDO was served at the

stockholders’ meeting itself, immediately after the Chairman & CEO, Manuel M. Lopez, declared a quorum. Commissioner Martinez purportedly acted for the SEC upon a complaint filed by the Government Service Insurance System (GSIS) on May 26, 2008.
The Management (through the individual respondents named in the CDO) questioned the CDO including the subsequent Show Cause Order dated May 27, 2008 issued by the SEC before the Court of Appeals in a petition docketed as CA-G.R. SP No. 103692, entitled “Anthony V. Rosete, et al. versus Securities and Exchange Commission, et al.”
In a Decision promulgated on July 23, 2008, the Court of Appeals (CA) dismissed the complaint filed by GSIS with the SEC for among others, lack of jurisdiction by the SEC over the subject matter of the controversy and for the GSIS’s act of forum shopping and splitting its causes of action.
This CA Decision was questioned before the Supreme Court (SC) in three separate cases,
docketed as (i) G. R. No. 183905 filed by GSIS; (ii) G. R. No. 183933 filed by SEC, through the Office of the Solicitor General (OSG); and (iii) G. R. No. 184275 also filed by the SEC, through the OSG. The three cases were consolidated by the SC in a resolution dated September 24, 2008.
On January 19, 2009, the Supreme Court issued a Resolution declaring G.R. No. 183933
as closed and terminated in view of the non-filing of a petition by the OSG representing GSIS. On July 23, 2009, a Manifestation was filed on behalf of Private Respondents (Rosete,
et.al.), that with the unanimous election of the 2009 Meralco Board during the 2009 Annual Stockholders' Meeting held on May 26, 2009, these cases have been rendered moot and academic since there is no longer any justifiable controversy involving the composition of the previous 2008 Meralco Board. The Supreme Court's Special Second Division duly noted this Manifestation in its Resolution dated August 26, 2009.
On September 2, 2009, the Supreme Court issued a resolution denying with finality the motion for partial reconsideration filed by the OSG on behalf of GSIS, including its motion to refer the case en banc, with a corresponding order for entry of judgment. However, GSIS through the GSIS Law Office still filed a second motion for partial reconsideration notwithstanding the explicit order of the Court that no further pleadings or motions shall be entertained in this case.
On February 24, 2010, the Supreme Court issued another resolution stating it “NOTES
WITHOUT ACTION GSIS’s: (1) omnibus motion for leave to file and for admission of the attached second motion for partial reconsideration, praying that this Court suspend the rules prohibiting a second motion for reconsideration and admit the attached second motion for partial reconsideration, and (2) aforesaid second motion for partial reconsideration dated November 16, 2009 of the Decision dated April 16, 2009.” This Resolution of the Supreme Court effectively puts to rest all issues relative to this particular case/s.
(b) Syndicated Estafa On August 22, 2008, the Department of Justice filed with the Regional Trial Court of Pasig
City a criminal complaint for syndicated estafa against directors and officers of the Company due to

alleged misappropriation of the meter and service deposits of customers, docketed as Criminal Case No. 138382, entitled “People of the Philippines vs. Manuel M. Lopez, Felipe B. Alfonso, Jesus P. Francisco, Arthur R. Defensor, Jr., Gregory L. Domingo, Octavio Victor R. Espiritu, Christian S. Monsod, Federico E. Puno, Washington Z. Sycip, Emilio A. Vicens, Cesar E. A. Virata, Daniel L. Tagaza, Rafael L. Andrada, Helen T. De Guzman, Antonio R. Valera, Manolo C. Fernando and Francisco L. Viray.”
In an Order dated October 6, 2008, the Regional Trial Court of Pasig City, Branch 71, dismissed the case “for failure to establish all the elements of Syndicated Estafa under Article 315, par. 1(b) of the Revised Penal Code, in relation to P.D. No. 1689.”
The Office of the Solicitor General (OSG) appealed the order of dismissal to the Court of
Appeals, docketed as CA-G.R. CR. No. 32065. On September 29, 2009, the Company’s directors and officers, through counsel, filed a
Motion to Dismiss Appeal on the ground that pure questions of law were raised by the OSG in the Appellant’s Brief. Notwithstanding the motion to dismiss, the directors and officers have filed their Ad Cautelam Appellee's Brief as directed by the Court. The OSG has likewise filed its comment on the motion to dismiss as directed by the Court. So far, no further resolution of the Court has been received. 2. Mr. Napoleon L. Nazareno
Mr. Napoleon L. Nazareno and other directors and officers of the former PDCP Bank (PDCP), and some officers of the Bangko Sentral Ng Pilipinas (BSP) and Development Bank of the Philippines (DPB) (hereinafter the “Respondents”) were charged in a complaint docketed as I.S. No. 2004-631 filed by Chung Hing Wong/Unisteel/Unisco Metals, Inc. (the “Complainants”) with the Department of Justice (DOJ), for alleged syndicated estafa, estafa thru falsification of documents, other deceits, malversation and robbery. In the complaint-affidavit, the Complainants alleged that the officers and directors of PDCP deceived the Complainants to secure a loan from PDCP through misrepresentation and with the sinister purpose of taking over the Complainants corporation. As stated in Mr. Nazareno’s counter-affidavit, the charges against him are manifestly unmeritorious since he has not personally met the Complainants, nor is he party to the questioned transactions and, as such, could not have deceived the Complainants in any manner. The complaint was referred to the Ombudsman (OMB) by the DOJ on October 30, 2007 considering that some of the Respondents are public officers and the offenses charged were committed in the performance of their official functions.
Meanwhile, on July 23, 2008, the Complainants filed with the DOJ a Motion for Reconsideration of a Resolution of the DOJ dated September 7, 2007 dismissing their complaint. It appears that prior to forwarding the case records to the OMB, the DOJ had prepared a Resolution recommending the dismissal of all the charges against the Respondents but did not release the said Resolution to the parties because it wanted the OMB to conduct a review of the DOJ Resolution in view of the fact that some of the Respondents are public officers.
In an Order dated July 30, 2008, the OMB confirmed that it was conducting a review of the said DOJ Resolution for the above stated reason and that its authority relative to the case

forwarded to it by the DOJ is limited to conducting a review of the DOJ Resolution and not to conduct another preliminary investigation of the case.
In the OMB’s Review and Recommendation dated November 28, 2008, the OMB approved the DOJ Resolution dated September 7, 2007 dismissing the complaint and referred the case back to the DOJ for appropriate action.
The Complainants filed separate Motions for Reconsideration before the DOJ and OMB on July 16, 2008 and December 1, 2009, respectively. On December 16, 2009, the DOJ issued a Resolution denying the Complainants’ Motion for Reconsideration for lack of merit. In response, the Complainants filed a Petition for Review with the Secretary of Justice on March 2, 2010. Mr. Nazareno and the other Respondents have filed their respective Comments to the petition, which remain pending to date with the Office of the Secretary of Justice.
With respect to the Complainants’ Motion for Reconsideration with the OMB, the latter issued an Order dated December 4, 2009 denying the same and affirming its Review and Recommendation of November 28, 2008. In response, the Complainants filed a Petition for Certiorari with the Court of Appeals (“CA”) on July 12, 2010. In a Resolution dated July 26, 2010, the CA dismissed the petition for lack of jurisdiction. The Complainants filed a Motion for Reconsideration on August 17, 2010. Acting on the said motion, the CA issued a Resolution dated September 1, 2010, requiring the Respondents to file their Comment to the motion. On September 28, 2010, the Respondents through counsel filed their Opposition to the Complainants’ Motion for Reconsideration. In a Resolution dated December 1, 2010, the CA noted the respective Comments and/or Opposition filed by the Respondents and considered the Complainants’ Motion for Reconsideration submitted for resolution.
Except as disclosed above, no member of the Board of Directors or any executive officer of Meralco is involved in any other criminal, bankruptcy or insolvency investigations or proceedings for the past five years and up to March 18, 2011, nor has been found by judgment or decree to have violated securities or commodities law and enjoined from engaging in any business, securities, commodities or banking activities.

Item 10. Executive Compensation
Compensation of Directors and Officers
The aggregate annual compensation for the last two fiscal years and projected compensation for the ensuing year of Meralco’s Chief Executive Officer and four most highly compensated officers, as a group, and all other key officers, other officers and directors, as a group, are as follows:
NAME
YEAR
SALARY1 (in Million)
BONUS2 (in Million)
OTHER
COMPENSATION3 (in Million)
1. Manuel V. Pangilinan President & CEO
2. Oscar S. Reyes Senior Executive Vice President
3. Ricardo V. Buencamino Executive Vice President
4. Betty C. Siy-Yap Senior Vice President
5. Rafael L. Andrada First Vice President
Chief Executive Officer and four most highly compensated key officers
Projected 2011 20104 2009
57 40 66
14 7 13
12 7 16
All other key officers, other officers and directors as a group (excluding the CEO and four most highly compensated key officers)
Projected 2011
2010 2009
109 107 70
24 17 12
28 30 15
1 Basic Monthly Salary 2 Includes Mid-Year Bonus, 13th Month Pay and Christmas Bonus 3 Includes performance-based pay dependent on the attainment of goals and targets 4 2010 was a transition year with the retirement of some Senior Executive Officers and the redefining of certain roles.
As provided in Meralco’s Amended By-Laws, directors, as such, shall not receive any stated salary for their services, but by resolution of the stockholders, a fixed sum and expenses for attendance, if any, may be allowed for attendance at each regular or special meeting of the Board of Directors; but nothing herein contained shall be construed to preclude any director from serving the Company in any other capacity and receiving compensation therefor. Meralco has no standard arrangement on the remuneration of its existing directors and officers aside from the compensation herein stated.
Pursuant to the terms of Meralco’s Employees Stock Purchase Plan (ESPP), as of March 18, 2011, the equity securities beneficially owned by executive officers covered by subscriptions to existing offerings of the ESPP, including stock dividends, are as follows:

Title of Class
Name of Executive Officer
Number of Shares Citizenship Percent of Class
Common Manuel M. Lopez 199,493 Filipino 0.02%
Common Ramon S. Ang 0 Filipino 0.00%
Common Manuel V. Pangilinan 0 Filipino 0.00%
Common Simeon Ken R. Ferrer 0 Filipino 0.00%
Common Oscar S. Reyes 0 Filipino 0.00%
Common Ricardo V. Buencamino 42,278 Filipino 0.00%
Common Roberto R. Almazora 36,408 Filipino 0.00%
Common Alfredo S. Panlilio 0 Filipino 0.00%
Common Ramon B. Segismundo 0 Filipino 0.00%
Common Betty C. Siy-Yap 0 Filipino 0.00%
Common Rafael L. Andrada 44,681 Filipino 0.00%
Common Ruben B. Benosa 22,261 Filipino 0.00%
Common Helen T. De Guzman 25,513 Filipino 0.00%
Common Ivanna G. Dela Peña 26,231 Filipino 0.00%
Common Angelita S. Atanacio 23,220 Filipino 0.00%
Common Marthyn S. Cuan 0 Filipino 0.00%
Common Ruth B. David 26,258 Filipino 0.00%
Common Rustico C. De Borja, Jr. 37,652 Filipino 0.00%
Common Gerardo F. Dela Paz 33,000 Filipino 0.00%
Common Manolo C. Fernando 33,839 Filipino 0.00%
Common Victor S. Genuino 0 Filipino 0.00%
Common Nixon G. Hao 19,472 Filipino 0.00%
Common Ernesto D. Iglesia 25,077 Filipino 0.00%
Common Fortunato C. Leynes 21,569 Filipino 0.00%
Common Leonardo V. Mabale 26,232 Filipino 0.00%
Common Redentor L. Marquez 22,116 Filipino 0.00%
Common Anthony V. Rosete 23,102 Filipino 0.00%
Common Liza Rose G. Serrano-Diangson 22,689 Filipino 0.00%
Common Jose Antonio T. Valdez 0 Filipino 0.00%
Subscriptions under the Plan are payable over a period of 5 years through payroll deduction.

Item 11. Security Ownership of Certain Record Owner and Management
[1] Security Ownership of Certain Record and Beneficial Owners
Based on Meralco’s stock and transfer book, the security ownership as of March 18, 2011 of certain record and beneficial owners of more than 5% of any class of its voting securities is as follows: Title of Class
Name, address of Record Owner and
Relationship with Issuer
Name of Beneficial Owner and Relationship with
Record Owner
Citizenship No. of Shares Held
Percent
Common Beacon Electric Asset Holdings, Inc. 10/F MGO Bldg., Legaspi corner Dela Rosa Streets, Legaspi Village, Makati City No relationship with Issuer
Same as the record owner
Filipino
392,502,961
34.82%
Common
Government Service Insurance System GSIS Bldg., Financial Center, Pasay City No relationship with Issuer
Same as the record owner
Filipino
332,172,311
29.47%
Common
PCD Nominee Corp. 37/F Tower One Enterprise Center, 6766 Ayala Avenue corner Paseo de Roxas, Makati City No relationship with Issuer
PCD Participants
Filipino & Foreign
126,422,869
11.21%
Common
PLDT Communications & Energy Ventures, Inc. Smart Tower, 6799 Ayala Avenue, Makati City No relationship with Issuer
Same as the record owner
Filipino
68,800,000
6.10%
Common
Social Security System 2/F SSS Bldg., Diliman, Quezon City No relationship with Issuer
Same as the record owner
Filipino
62,990,689
5.59%
Beacon Electric Asset Holdings, Inc. (Beacon Electric) is a special purpose company jointly owned by PLDT Communications & Energy Ventures, Inc. (PCEV) formerly Pilipino Telephone Corporation and Metro Pacific Investments Corporation (MPIC) whose sole purpose is to hold PCEV’s and MPIC’s shares in Manila Electric Company (Meralco). The Chairman, or in his

absence, the President of Beacon Electric, or any other representative designated by the President of Beacon Electric, is duly authorized as proxy to vote its Meralco shares as he may deem proper or beneficial to Beacon Electric.
The Government Service Insurance System (GSIS) is a pension fund mandated to provide
and administer the following social security benefits for all employees of the Philippine government: compulsory life insurance, optional life insurance, retirement benefits, disability benefits for work-related contingencies and death benefits. The authorized signatories of the GSIS who will represent the ultimate beneficial owners and vote on their behalf are not known to Meralco.
PCD Nominee Corporation is a wholly-owned subsidiary of the Philippine Depository and
Trust Corporation (PDTC). Originally, stock certificates were issued to investors every time they acquired shares of the Company. However, with the Philippine Central Depository’s (PCD) computerized Book Entry System that took effect in November 1997, investors of Meralco shares now have an option whether they will be issued certificates or not. Their shares may be lodged at the PCD and further trading will be scripless (computerized with no certificates) until they request for the issuance of certificates. The PCD Nominee Corporation holds the shares as the registered owner thereof in Meralco’s books on behalf of PCD Participants and their clients. The participants of PCD are the beneficial owners of such shares and may be nominated as proxy to vote the same. Stockholders with PCD-lodged shares have no record of their shareholdings with Meralco or its transfer agent, Securities Transfer Services, Inc. (STSI). Only certificated shares are recorded in Meralco’s books, which may be voted by the registered owners or their proxies.
PCEV was incorporated on July 18, 1968 and, until 1991, engaged solely in the business of providing fixed line telecommunications services in eight cities and municipalities in the Philippines. On June 30, 2009, PCEV stockholders approved the investment of corporate funds in the amount of up to P20.07 billion in shares of stock representing approximately 20% of the outstanding voting common stock of Meralco. The acquisition of a stake in Meralco is in line with PLDT’s strategic intent to maximize operational and business synergies that could yield new revenue streams and cost savings for both PLDT and its subsidiaries (PLDT Group) and Meralco. The Chairman, or in his absence, the President of PCEV, or any other representative designated by the President of PCEV, is duly authorized as proxy to vote its Meralco shares as he may deem proper or beneficial to PCEV.
The Social Security System (SSS) is a social insurance program for workers in the private
sector. It aims to promote a viable, universal and equitable social security protection scheme through world-class service. The authorized signatories of SSS who will represent the ultimate beneficial owners and vote on their behalf are not known to Meralco.
.
[2] Security Ownership of Management
As of March 18, 2011, the securities owned beneficially, directly or indirectly, by directors, nominees and executive officers of Meralco are as follows:

Title of Class
Name of Beneficial Owner
Amount and nature of Beneficial Ownership
Citizenship Percent of Class
Common Manuel M. Lopez 2,245,918 (Direct) Filipino 0.20%
Common Ramon S. Ang 1 (Direct) Filipino 0.00%
Common Manuel V. Pangilinan 25,000 (Direct) Filipino 0.00%
Common Oscar S. Reyes 268 (Direct) Filipino 0.00%
Common Ray C. Espinosa 1,000 (Direct) Filipino 0.00%
Common Estelito P. Mendoza 1 (Direct) Filipino 0.00%
Common Napoleon L. Nazareno 110,000 (Direct) Filipino 0.01%
Common Artemio V. Panganiban 1 (Direct) Filipino 0.00%
Common Vicente L. Panlilio 1,301 (Direct) Filipino 0.00%
Common Eric O. Recto 1 (Direct) Filipino 0.00%
Common Pedro E. Roxas 1,000 (Direct) Filipino 0.00%
Common Simeon Ken R. Ferrer 767 (Direct) Filipino 0.00%
Common Ricardo V. Buencamino 20,000 (Direct) Filipino 0.00%
Common Roberto R. Almazora 56,674 (Direct) Filipino 0.01%
Common Alfredo S. Panlilio 0 Filipino 0.00%
Common Ramon B. Segismundo 0 Filipino 0.00%
Common Betty C. Siy-Yap 0 Filipino 0.00%
Common Rafael L. Andrada 0 Filipino 0.00%
Common Ruben B. Benosa 11,731 (Direct) Filipino 0.00%
Common Helen T. De Guzman 7,180 (Direct) Filipino 0.00%
Common Ivanna G. Dela Peña 6,435 (Direct) Filipino 0.00%
Common Angelita S. Atanacio 0 Filipino 0.00%
Common Marthyn S. Cuan 0 Filipino 0.00%
Common Ruth B. David 21,515 (Direct) Filipino 0.00%
Common Rustico C. De Borja, Jr. 15,125 (Direct) Filipino 0.00%
Common Gerardo F. Dela Paz 887 (Direct) Filipino 0.00%
Common Manolo C. Fernando 635 (Direct) Filipino 0.00%
Common Victor S. Genuino 0 Filipino 0.00%
Common Nixon G. Hao 2,791 (Direct) Filipino 0.00%
Common Ernesto D. Iglesia 19,038 (Direct) Filipino 0.00%
Common Fortunato C. Leynes 20,410 (Direct) Filipino 0.00%
Common Leonardo V. Mabale 6,001 (Direct) Filipino 0.00%
Common Redentor L. Marquez 15,725 (Direct) Filipino 0.00%
Common Anthony V. Rosete 420 (Direct) Filipino 0.00%
Common Liza Rose Serrano-Diangson 18,294 (Direct) Filipino 0.00%
Common Jose Antonio T. Valdez 0 Filipino 0.00%
The aggregate number of shares owned on record by the Chief Executive Officer, Executive Officers, Directors and Nominees as of March 18, 2011 is 2,608,119 shares or 0.23% of Meralco’s total issued and outstanding shares.
(3) Voting Trust Holders
Meralco is not aware of any person holding more than 5% of common shares under a voting trust or similar agreement.

(4) Changes in Control
Based on the Company’s stock and transfer book, there is no change in the control of the Company since the beginning of the last fiscal year.

Item 12. Certain Relationship and Related Transactions
Except with respect to the Related Party Transactions as discussed in Note 27 to the
consolidated financial as at December 31, 2010 and 2009 and for each of the three years in the period ended December 31, 2010, there was no transaction during the last two (2) years involving Meralco in which any of its directors or executive officers, any nominee for election as director, or security holder owning 10% or more of Meralco’s total outstanding shares and members of their immediate family had a material interest.

PART IV PART IV PART IV PART IV –––– CORPORATE GOVERNANCECORPORATE GOVERNANCECORPORATE GOVERNANCECORPORATE GOVERNANCE
Item 13. Corporate Governance
CORPORATE GOVERNANCE REPORT
Corporate Governance is an integral component as Meralco pursues its business aspirations for customers and stakeholders. In 2010, the Company made corporate governance a major thrust and institutionalized the “Be Right” communication policy in the Meralco culture. Meralco’s corporate governance framework is anchored on the principles of fairness, accountability, integrity and transparency.
As a public utility, Meralco is subject to regulation, legislation and public scrutiny. All directors, officers and employees of the Company and its subsidiaries are therefore committed to observe all Company policies and relevant regulations and laws. The Company adheres to these imperatives, both in substance and form, as its commitment to stakeholders: shareholders, customers, government, employees, partners, suppliers, creditors, contractors and the community.
A Corporate Governance Office (CGO) was created on March 16, 2010 to manifest Meralco’s dedication to pursue excellence in corporate governance. Its mandate is to support the Board and Management in the formulation and implementation of CG plans, programs and initiatives, and in monitoring compliance to achieve the highest standard of competence and ethical culture among directors, officers and employees of the Company. I. GOVERNANCE COMPLIANCE AND PERFORMANCE
In 2010 Meralco fully complied with the disclosure and reportorial requirements of the Securities and Exchange Commission (SEC), including:
• Certification by the Compliance Officer of the Company’s compliance to the Revised Manual of Corporate Governance.
• Disclosure requirements on direct and indirect ownership of securities under the Securities Regulation Code (SRC), and the reporting of trading transactions of directors and concerned officers of the Company by the Compliance Officer not later than the following day after the required event or transaction. In 2010, there was no case of insider trading involving directors and Management of the Company.
• Other disclosure requirements including the certification of board attendance, reports involving financial statements, material information and events, and trainings attended by key officers and board members on corporate governance.

Every year, Meralco participates in the CG Scorecard Assessment conducted by the SEC together with the PSE and Institute of Corporate Directors (ICD). The CG Scorecard is administered to determine the level of CG practices of Publicly Listed Companies (PLCs) relative to global and regional standards. Meralco’s performance since its initial assessment in 2007 has shown significant improvement, surpassing the average performance of participating companies.
Meralco was awarded the “Best in Investor Relations” in the Philippines in the 1st Asian Excellence Recognition Awards 2011 of Corporate Governance Asia1. The award was based on the results of a regional survey conducted between August to December 2010 among investors in Asia. The award is given to companies exhibiting excellent performance in the areas of investor communications, business ethics, corporate social responsibility, environmental practices and financial performance.
The Company sends participants to CG Circle meetings, e.g., Good Governance Advocates and Practitioners of the Philippines (GGAPP) and ICD seminars and workshops as part of the corporate governance build-up in Meralco. The Company also cooperates with the regulatory agencies in the development of CG policies for Philippine companies by providing feedback on proposed policies by the PSE and SEC. II. OUR POLICIES
Meralco believes that well-defined policies should cascade governance principles to business operations and processes. These policies were based on best CG practices and adapted to the Meralco business environment:
a. Revised Manual of Corporate Governance (MCG) is the foundation of Meralco’s governance policies, which complies with the amended SEC Corporate Governance Code under SEC Memorandum Circular No. 6, series of 2009 dated June 22, 2009. The revised manual was approved April 12, 2010 and took effect May 1, 2010.
b. Revised “Standards of Business Conduct and Ethics” (Code of Ethics or COE) prescribes that ethical values and standards of behavior are observed by all directors, officers and employees of the Company as they perform their respective duties and responsibilities. The 2003 COE version was revised to include important provisions such as risk management and internal control, as well as to strengthen the commitment to compliance. A company-wide orientation was conducted for all employees for a thorough understanding of and personal commitment to the revised COE.
c. Conflict of Interest Policy sets requirements for all directors, officers and employees to observe the highest degree of transparency, selflessness and integrity in the performance of
1 Corporate Governance Asia is the region's most authoritative journal on Corporate Governance. Published quarterly, the Corporate Governance Asia
provides news and analysis on corporate governance issues, boardroom practices and shareholder activism. More than 2,000 people participated in the
survey conducted by CorpGov Asia from the Asian region.
Source: The 2009 Corporate Governance Scorecard for Publicly Listed
Companies – Special Report for Manila Electric Company

their duties, free from any form of conflict with personal interest. This took effect on August 23, 2004.
d. Policy on Disclosure of Relatives aims to ensure fairness, transparency and objectivity in decision-making and avoidance of situations that may give rise to conflict of interest. This was approved and implemented February 1, 2010.
e. Policy on Blackout Period/Restriction on Trading of Shares regulates trading of shares by Company executives, officers and employees with direct access to unpublished information relating to the Company’s financial and operating results, in the interest of CG and transparency. This policy took effect July 16, 2010.
f. Be Right Communication Policy promotes open lines of communication between Management and employees, enabling Management to relay directions and for employees to express their ideas and concerns to Management. It was approved on August 10, 2010.
g. Policy on Solicitation and Acceptance of Gifts regulates the acceptance of gifts offered and given by third parties to prevent all directors, officers and employees from putting themselves in situations that could affect the fair, objective and effective performance of their duties. It was approved on December 13, 2010.
These policies on corporate governance are available at the Corporate Governance Intranet Portal
of Meralco. Copies of the Corporate Governance Handbook, which compiles the above-mentioned policies, were distributed to all offices. III. BOARD OF DIRECTORS
The Board has the primary responsibility of championing the principles of corporate governance. The Board also oversees the risk management function and the adequacy of internal control mechanisms to ensure the reliability of financial reporting, efficiency and effectiveness in operations, protection of assets and compliance with applicable laws and regulations.
There are eleven (11) members of the Board with complementing expertise and experience necessary to act on the various issues and matters affecting the Company. Of these directors, two (2) are executive directors, two (2) are independent and seven (7) are non-executive directors. The board structure and practices provide clear division of responsibilities at the top of the corporation – between the Board exercising oversight function, and Management discharging its executive responsibilities. All the directors also fully comply with Energy Regulatory Commission (ERC) Resolution No. 1, Series of 2004, entitled “Program to Promote Good Corporate Governance in Distribution Utility” which requires attendance in seminars on corporate governance.
A. Board independence The elected independent directors for 2010 are retired Chief Justice Artemio V, Panganiban and Mr. Pedro E. Roxas. This is in accordance with the SRC requiring at least two (2) independent directors or 20% of the members of the Board, whichever is lesser. They were nominated and elected in compliance with Rule 38 of the Implementing Rules of the SRC, as amended. To further strengthen the Board’s independence, the Company separated the posts of the Chairman of the Board from the President and the Chief Executive Officer. Each position has distinct and separate duties and responsibilities in accordance with the Company’s amended By-Laws and Revised Manual of Corporate Governance. The Chairman of the Board is Mr. Manuel M. Lopez, while the President and Chief Executive Officer is Mr. Manuel V. Pangilinan.

B. Election of directors In accordance with the provisions of the Company’s By-Laws and Manual of Corporate Governance, the Corporation Code and the SRC, nominees to the Board go through a nomination and screening process. The final list of nominees is determined after pre-screening and evaluation of qualifications. The directors are elected by stockholders who are entitled to vote during the Annual General Meeting (AGM). They serve for a period of one year and until their successors are qualified and elected.
C. Board remuneration
The Company’s directors do not receive any compensation other than the Board-approved per diem for their attendance in board and board committee meetings. In 2010, each director was entitled to a director’s fee of PhP120, 000 for each BOD meeting attended. Each member or advisor of the Audit and Risk Management, Compensation, Finance, Governance and Nomination Committees was entitled to a fee of PhP20, 000 for each committee meeting attended. The fees were last adjusted in April 2010.
D. Board performance The Board holds regular monthly meetings and special board meetings, if so required, with agenda that includes updates by the Chairman and the board committees; reports on financial performance by the Chief Finance Officer; and operational performance by the President and Chief Executive Officer, the Senior Executive Vice President and Chief Operating Officer, among other major company issues.
The table shows the participation of the Board of Directors on the Annual General Meeting, Organization Meeting and its regular meetings.
Member Designation
Annual General
Meeting
May 25, 2010
Organizational
Meeting
May 25, 2010
Board
Meetings
Manuel M. Lopez Chairman Present Present 10/12
Ramon S. Ang Vice-Chairman and Director Present Present 12/12
Manuel V. Pangilinan Director Present Present 11/12
Ray C. Espinosa Director Present Present 12/12
Artemio V. Panganiban Director (Independent) Present Present 12/12
Vicente L. Panlilio0 Director Present - 11/12
Estelito P. Mendoza Director Present Present 7/12
Napoleon L. Nazareno Director Present Present 11/12
Eric O. Recto 1 Director - - 6/7
Oscar S. Reyes 2 Director - - 6/6
Pedro E. Roxas 3 Director (Independent) - Present 6/7
Elpi O. Cuna 4 Past Director Present Present 5/5
Jose P. de Jesus 5 Past Director Present Present 6/6
Elenita D. Go 4 Past Director Present Present 5/5
0 – Director until May 25, 2010 AGM & reappointed on June 28, 2010; 1 – Appointed, June 28, 2010; 2 – Appointed, July 1, 2010; 3 – Elected, May 25,
2010; 4 Resigned, June 30, 2010; 5 Resigned, June 28, 2010.
On February 28, 2011, the directors conducted its Annual Board Self-Assessment to evaluate their specific and overall performance for 2010. Board members assessed their individual and collective performance on board structures, processes and responsibilities.

The Board also conducted an evaluation of the 2010 performance of the President and Chief Executive Officer (CEO) in the January 14, 2011 board meeting. It was based on the attainment of key corporate goals for 2010, relative to his leadership, management, communication and working relationship with the Board. IV. BOARD COMMITTEES
The Company’s Board has five (5) standing committees: the Executive Committee; Nomination and Governance Committee; Audit and Risk Management Committee; Compensation and Benefits Committee; and Finance Committee. All committees have approved charters defining and specifying the scope of their responsibilities.
The functions, authority and responsibilities of each board committee, their accomplishments and board committee members’ attendance are as follows:
A. Executive Committee – composed of five (5) directors, one of whom is an independent director. This committee may act, by majority vote of all its members, on such specific matters within the competence of the Board, as may be delegated to it in the By-Laws or on a majority vote of the Board, subject to the limitations provided by the Corporation Code of the Philippines.
B. Nomination and Governance Committee – composed of four (4) directors with an independent
director as chairman. It is responsible for screening qualified nominees for election as directors; assessing the independence of directors; introducing improvements on board organization and procedures; setting-up of mechanisms for performance evaluation of the board and management; and providing programs for continuing education of the board.
In 2010, the committee accomplished the following: review and selection of the nominees for election as members of the Board; review of rules on nomination of candidates, validation of proxies, and appreciation of ballots; proposal of amendments to the Company’s By-Laws; review of revisions to the Manual of Corporate Governance and the Code of Ethics; review of CG policy approval procedures; approval and conduct of the board self-assessment; and approval of the Policy on Solicitation and Acceptance of Gifts.
C. Audit and Risk Management Committee – composed of five (5) directors with accounting and
finance backgrounds, two (2) of whom are independent, and another director who has audit experience. It assists the Board in its oversight responsibility in the financial reporting process, system of risk management and internal control, audit process, and monitoring compliance with applicable laws, rules and regulations. In 2010, the committee accomplished the: review of the company’s 2009 audited financial statements and 2010 quarterly financial statements; review of the financial performance of subsidiaries and affiliates; review and approval of the 2009 Audit and Risk Management committee report to the board; endorsement of the nomination of the external auditor for 2010; review and approval of the 2010 internal audit plan, budget and covenant; review of 2009 internal audit performance, approval of external quality assessment review for the internal audit activity; review and approval of external auditor’s 2010 financial statement audit plan and fees; and evaluation of the Company’s risk profile and management structure, systems and processes.
D. Compensation and Benefits Committee – composed of three (3) directors, one of whom is an
independent director. It assists the Board in the development of the Company’s overall

compensation and retirement policies and programs based on the Board-approved philosophy and budget. The committee’s major accomplishments for 2010 include the review and endorsement to the Board of the Company’s total compensation policy, philosophy and design, 2009 incentive program, 2009 performance evaluation, results, proposals for the 2010 performance management system and incentive plans, and the Company’s balanced scorecard results; 2009 performance evaluation of the Chairman and CEO, and President and COO; nomination and appointments to the pension fund board of trustees; and review of the Employee Stock Purchase Plan.
E. Finance Committee – composed of three (3) directors, one of whom is an independent
director, and with the Company’s Chief Finance Officer as ex-officio member. It reviews the financial operations of the Company and matters regarding acquisition of or investments in companies, businesses or projects. Among the accomplishments of the committee in 2010 include the approval of the 2011 corporate budget; review and approval of the medium-term financial plans; approval of cash dividend declaration for common and preferred shares; review of financial performance of subsidiaries and investment returns; review of quarterly cash projections and finance operations report; redemption on preferred shares; evaluation of debt refinancing; contribution to the pension fund; divestment of shareholdings in affiliate company; review of major purchases and contracts; and approval of bank accreditation and signing authorities.
F. Board Committee Meeting and Attendance
2010 Board Committee Meeting Attendance
Member Executive
(2 Meetings)
Nomination and
Governance
(6 Meetings)
Audit and Risk
Management
(9 Meetings)
Compensation
and Benefits
(3 Meetings)
Finance
(13 Meetings)
Manuel M. Lopez 1
Member - -
1
Past Member (Feb 1 – May 25
Attended all
meetings during the
period)
5
Member (May 25 – present
Attended 5 out of 8
meetings during the
period)
Ramon S. Ang 1
Vice Chair - - - -
Manuel V. Pangilinan 2
Chair - -
3
Chair -
Ray C. Espinosa -
4
Member (June 28-present
Attended all
meetings during the
period)
- - 13
Chair
Artemio V. Panganiban1
1
Member (Feb 1 – May 25 &
June 28-present
Attended all
meetings during the
period)
-
2
Chair (May 25-present
Attended all
meetings during the
period)
- -
Vicente L. Panlilio - -
7
Vice Chair
(Jun 28 - present)
Chair
(Feb 1 – May 25)
0
Past Member (Feb 1 – May 25 Only
1 meeting during the
period)
-
Estelito P. Mendoza - 4
Vice Chair - - -

Napoleon L. Nazareno
1
Past Member (May 25 – Jun 28
Attended all
meetings during the
period)
5
Member
8
Member
(Feb 1 – May 25 and
Jun 28 - present)
2
Member (May 25 – present
Attended all
meetings during the
period)
-
Eric O. Recto
1
Member (June 28-present
Attended all
meetings during the
period)
-
2
Member (Jun 28 – present
Attended all
meetings during the
period)
2
Vice Chair (Jun 28 – present
Attended all
meetings during the
period)
7
Member (Jun 28 – present
Attended all
meetings during the
period)
Pedro E. Roxas1 -
6
Chair
2
Member (Jun 28 – present
Attended all
meetings during the
period)
2
Member (May 25 – present
Attended all
meetings during the
period)
7
Member (May 25 – present
Attended 7 out of 8
meetings during the
period)
Elpi O. Cuna
1
Past Member, (May 25 – Jun 28
Attended all
meetings during the
period)
- -
1
Past Member (Feb 1 – May 25
Attended all
meetings during the
period)
5
Past Member (May 25 – Jun 28
Attended all
meetings during the
period)
Jose P. de Jesus - - - -
5
Past Member (Feb 1 – May 25
Attended all
meetings during the
period)
Elenita D. Go - -
6
Past Member (Feb 1 – Jun 28
Attended all
meetings during the
period)
-
4
Past Member (Feb 1 – Jun 28
Attended all
meetings during the
period)
Aurora T. Calderon2 - -
2
Past Member (Feb 1 – May 25
Attended 2 out of 7
meetings during the
period)
- -
Elpidio L. Ibanez2 - -
6
Past Member (Feb 1 – May 25
Attended 6 out of 7
meetings during the
period)
- -
Ferdinand K. Constantino2 - - - -
11
Member
Anabelle L. Chua2 - -
2
Member (May 25 – present
Attended all
meetings during the
period)
- 10
Member
1 -Independent Director
2 - Non-director member
V. MANAGEMENT
Management is primarily accountable to the Board. It is responsible for the Company’s successful implementation of the strategy and direction as approved by the Board.
Management is represented by a Management Committee (ManCom) composed of the corporate officers and executives formed and headed by the President and Chief Executive Officer, or in his absence, the Senior Executive Vice President and Chief Operating Officer. Weekly meetings are conducted by the
ManCom to ensure formulation and implementation of major policies and directions governing the Company and its subsidiaries. It reports to the Board during regular board meetings or during special meetings through the President and Chief Executive Officer and or the Senior Executive Vice President and Chief Operating Officer.
The annual performance of management is assessed through the achievement of the Company’s established Balanced Scorecard indicators.
To ensure continued success in managing company operations, Management attended a structured executive training and development, compensation and benefit plans, and succession planning. In addition, similar training programs were provided for senior management and the executive levels. VI. ENTERPRISE RISK MANAGEMENT
Since 2005 the Company has been conducting periodic strategy and self assessments to evaluate risks and their likely impact on its business performance.
In 2010 the Company adopted an expanded approach to manage various business risks to cover its subsidiaries and associate companies. Management embarked on a series of briefings and workshops aimed at building competencies, identifying threats, exploiting opportunities and managing risks among its core business units. Using the Meralco Enterprise Risk Management Framework contained in the Meralco Risk Management Policy Manual, an enterprise risk management capability development program for subsidiaries and associate companies was conducted with the assistance of an expert from the Asian Institute of Management.
An executive briefing on Corporate Governance for the board members, the Management, and key officers of subsidiaries and affiliates was conducted on December 15, 2010 by Mr. Marc Ronez of the Asian Risk Management Institute (ARiMI), which discussed the integration of Corporate Governance and Enterprise Risk Management to foster sustainable effective performance. VII. ACCOUNTABILITY AND AUDIT
A. Independent Public Accountants SyCip Gorres Velayo & Co. (SGV & Co.) was reappointed as the principal accountant and independent auditor of the Company, through the approval of the shareholders in the Annual General Meeting. The engagement partner assigned to the Company since 2008 is Mr. Gemilo J. San Pedro, who has extensive accounting and auditing experience. The appointment is in accordance with the SEC regulation that the audit partner principally handling the Company’s account is rotated every five (5) years or sooner. In addition to serving as external auditor, SGV & Co. was engaged to provide non-audit services that included information and communication technology (ICT) security risk assessment in 2010 and for agreed upon procedures for the stockholders’ meeting in 2009. The following consolidated fees (in Php million; exclusive of VAT) were incurred by the Company and its subsidiaries for SGV & Co.’s services:
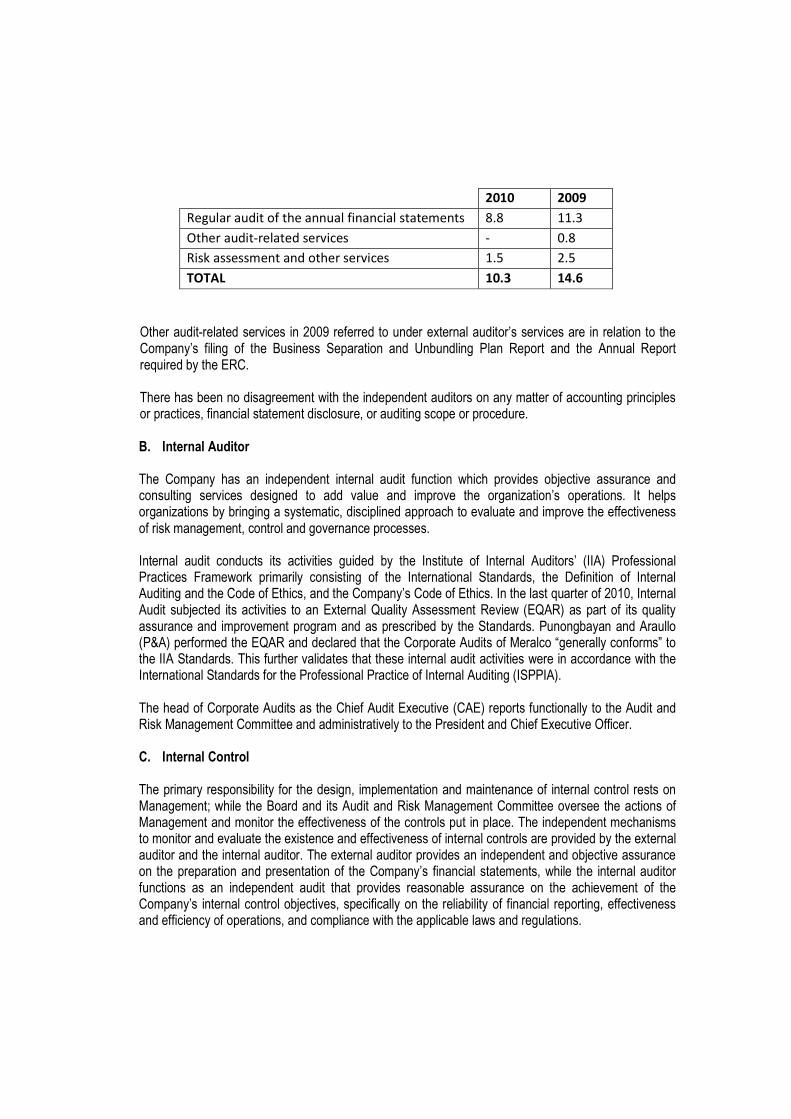
2010 2009
Regular audit of the annual financial statements 8.8 11.3
Other audit-related services - 0.8
Risk assessment and other services 1.5 2.5
TOTAL 10.3 14.6
Other audit-related services in 2009 referred to under external auditor’s services are in relation to the Company’s filing of the Business Separation and Unbundling Plan Report and the Annual Report required by the ERC. There has been no disagreement with the independent auditors on any matter of accounting principles or practices, financial statement disclosure, or auditing scope or procedure.
B. Internal Auditor The Company has an independent internal audit function which provides objective assurance and consulting services designed to add value and improve the organization’s operations. It helps organizations by bringing a systematic, disciplined approach to evaluate and improve the effectiveness of risk management, control and governance processes. Internal audit conducts its activities guided by the Institute of Internal Auditors’ (IIA) Professional Practices Framework primarily consisting of the International Standards, the Definition of Internal Auditing and the Code of Ethics, and the Company’s Code of Ethics. In the last quarter of 2010, Internal Audit subjected its activities to an External Quality Assessment Review (EQAR) as part of its quality assurance and improvement program and as prescribed by the Standards. Punongbayan and Araullo (P&A) performed the EQAR and declared that the Corporate Audits of Meralco “generally conforms” to the IIA Standards. This further validates that these internal audit activities were in accordance with the International Standards for the Professional Practice of Internal Auditing (ISPPIA). The head of Corporate Audits as the Chief Audit Executive (CAE) reports functionally to the Audit and Risk Management Committee and administratively to the President and Chief Executive Officer. C. Internal Control The primary responsibility for the design, implementation and maintenance of internal control rests on Management; while the Board and its Audit and Risk Management Committee oversee the actions of Management and monitor the effectiveness of the controls put in place. The independent mechanisms to monitor and evaluate the existence and effectiveness of internal controls are provided by the external auditor and the internal auditor. The external auditor provides an independent and objective assurance on the preparation and presentation of the Company’s financial statements, while the internal auditor functions as an independent audit that provides reasonable assurance on the achievement of the Company’s internal control objectives, specifically on the reliability of financial reporting, effectiveness and efficiency of operations, and compliance with the applicable laws and regulations.

VII. FINANCIAL REPORTING The Company’s consolidated financial statements were prepared in accordance with the Philippine Financial Reporting Standards (PFRS). PFRS includes statements named PFRS and Philippine Accounting Standards, including interpretations issued by the Philippine Financial Reporting Standards Council. The audited financial statements are reviewed by the Audit and Risk Management Committee to ensure that they fairly present, in all material aspects, the financial position of the Company and recommended for approval by the Board. In 2010, the review of the Company’s financial statements was conducted by the external auditor. The results of the review were discussed by the Audit and Risk Management Committee and presented to the Board; after which, the financial statements were filed with the SEC and released to the public. IX. DISCLOSURES ON OWNERSHIP STRUCTURE The Company ensures that it consistently complies with the required disclosure on shareholdings of its securities. It discloses the top 20 shareholders of its common shares annually. It also provides an annual disclosure of security ownership of certain record and beneficial owners who hold more than 5% of its equity shares. In compliance with the SEC requirements, a quarterly report of the Company’s top 100 shareholders is disclosed in its website. The top five shareholders as of December 31, 2010 as disclosed to the PSE and posted in the Company website on January 17, 2011 are:
Name No. of Shares Percentage
BEACON ELECTRIC ASSET HOLDINGS, INC. 392,502,961 34.8189%
GOVERNMENT SERVICE INSURANCE SYSTEM 332,172,311 29.4669%
PCD NOMINEE CORPORATION (FILIPINO) 74,974,453 6.6510%
PLDT COMMUNICATIONS & ENERGY VENTURES, INC. 68,800,000 6.1032%
SOCIAL SECURITY SYSTEM 62,990,689 5.5879%
Details of the ownership structure are stated in the Notes to Consolidated Financial Statement. The Company’s public ownership level as of December 31, 2010 as posted in the PSE website is at 22%. However, considering that the PCD Nominee Corporation shares are comprised of several independent stockholders, the equivalent public ownership level will be at 27.84%. As of this disclosure period, the Employee Stock Options Purchase Plan has an equivalent share of 1.29%. X. SHAREHOLDER RELATIONS The Company upholds the rights of its shareholders, as well as the general investing public, to obtain relevant information about the company in a timely and regular basis. The Company’s financial performance and prospects are regularly reported to the SEC and PSE. These reports are immediately made public upon submission to SEC through press releases and postings in the Company’s website. These include disclosures on related party transactions in compliance with Company policy. No disputes in connection with such related party transactions were reported in the past two years. Investors’ briefings are held quarterly, where representatives of the local and foreign institutional investors, securities, brokerage firms and investment bankers are invited. Analysts of foreign-based institutional investors and investment banks also participate in such sessions.
Press/media briefings are likewise held regularly to report on Meralco’s operating and financial results to the various representatives of media, particularly from the broadsheets and wire agencies. The briefings become venues for management to answer questions and clarify issues prior to the release of information to the public. Shareholders and investors are provided with adequate facility to communicate with the Company such as telephone, mail, electronic mail, and its website, www.meralco.com.ph. The Investor Relations Office supervises the investors’ briefings and attends to institutional investors’ needs; while a Stockholder Affairs Office attends to the inquiries and other concerns of shareholders including the distribution of Notice and Agenda of the AGM at least 30 days before the said meeting. For the 2010 AGM, notices were sent on March 30, 2010, 56 days before the AGM on May 25, 2010. The AGM serves as a venue for the shareholders to clarify company issues in the presence of the Board, the Chairman, the CEO, Management and external auditors. Shareholders are encouraged to personally attend the AGM and if unable to do so, are advised of their right to appoint a proxy on their behalf. Notarization of a proxy is not required but has to comply with the requirements of law, in particular, the Corporation Code and SRC, pertinent rules and regulations, By-Laws, and rules and polices adopted by the Board. The voting procedure in the AGM is as follows: (a) the matters in the agenda require the affirmative vote of qualified stockholders. Each common stockholder shall be entitled to one vote for each share; (b) in the election of directors, each qualified stockholder may accumulate and distribute his votes in accordance with the Corporation Code of the Philippines; (c) voting and counting of votes shall be by balloting, show of hands or viva voce. Auditors and inspectors appointed by the Board will be present to canvass and inspect ballots. During the May 25, 2010 AGM, the shareholders ratified the dividend policy approved by the Board of Directors, which called for payment of regular dividends equivalent to 50% of core earnings and may be supplemented by special dividends on a “look-back” basis. Such special dividend may be declared subject to the availing of unrestricted retained earnings and cash. Details of the cash dividend pay-outs are contained in the Notes to Consolidated Financial Statements. XI. EMPLOYEE RELATIONS The Company is committed to the development and welfare of its employees. All personnel and staff are properly informed, trained and empowered to perform well, in the spirit of malasakit and teamwork/collegiality. They are engaged and compensated based on qualification, merit and performance. Their professional growth and career advancement are ensured through the development and implementation of competency-based training, skills enrichment opportunities, and performance evaluation and job promotion plans and programs. Adequate provisions for medical and health support, essential benefits, rewards and recognition, and workplace safety are constantly provided for their protection, well-being and motivation. Uprightness and impartiality are observed in the resolution of conflicts. Management promotes openness and encourages employees to give suggestions and comments on corporate, administrative and operational improvements. XII. OBLIGATIONS TO OTHER STAKEHOLDERS Meralco seriously considers the impact of business decisions on the interests of its shareholders and other stakeholders. The Declaration of Corporate Principle of the Company’s Revised Manual of Corporate Governance specifically mentions: “The Company…uphold(s) an ethical culture that will protect and

promote the best interest of the Company for the common benefit of the Company’s stockholders and other stakeholders.” The Company also protects and maintains good relations with its suppliers and creditors based on mutual respect and benefit. The Company strives to foster long-term stability, direct and open relation, and continuous development with suppliers to attain quality, competitiveness, process efficiency and performance reliability; foster governance principles in all of its business dealings with them; and seek, encourage and prefer suppliers whose business practices respect human dignity and the environment. XIII. CORPORATE GOVERNANCE APPLICABILITY TO SUBSIDIARIES The contribution of Meralco’s subsidiaries has always been significant in boosting shareholders’ value. The Subsidiary Management Policy continues to be the standard set of rules for creating and managing subsidiaries based on the criteria and principles embodied in the Company’s Manual of Corporate Governance, Code of Ethics, and existing laws, rules and regulations. For 2010, the Company introduced policy changes to strengthen good governance practice of subsidiaries. Specifically, a transparent process for the nomination and selection of board members in subsidiaries was defined, ensuring that the criteria for board directorship are followed including qualifications, composition and conflict of interest situations. The Company also encourages its subsidiaries to adopt their own Manual of Corporate Governance and Code of Ethics. XIV. CORPORATE GOVERNANCE OUTLOOK FOR 2011 ONWARDS Meralco aims for excellence that goes beyond compliance. The Company commits to strengthening its culture of good governance and responsible management practices, while benchmarking with the international community and global companies. Meralco believes that the reward of good governance is not just recognition but the continuous improvement on company operations, breakthrough performance and sustainable growth that will serve the best interest of all our stakeholders.

PART V PART V PART V PART V –––– EXHIBITS AND SCHEDULES EXHIBITS AND SCHEDULES EXHIBITS AND SCHEDULES EXHIBITS AND SCHEDULES
Item 14. Exhibits and Reports
(a) Report on SEC Form 17-C and other Disclosure
January 08, 2010 • Report on Number of Shareholders as of December 31, 2009
January 08, 2010 • Total issued and outstanding Meralco shares as of December 31,
2009
January 15, 2010 • Top 100 Stockholders as of December 31, 2009
January 25, 2010 • Cash dividend declaration on preferred shares
January 26, 2010 • Filing of Manifestation and Motion in ERC Case No. 2009-057 RC
January 29, 2010 • Certificate of Compliance with Manual on Corporate Governance
February 01, 2010 • Updated list of committee members and officers
February 05, 2010 • Report on Number of Shareholders as of January 31, 2010
February 05, 2010 • Total issued and outstanding Meralco shares as of January 31, 2010
February 08, 2010 • Court of Appeals Decision re: CA-G.R. SP. No. 108663
February 09, 2010 • Letter reply to the PSE re: Clarification of news article: "ERC approves
Meralco petition to suspend power-rate hike"
February 17, 2010 • Letter reply to the PSE re: Clarification of news article: "Meralco
overcharged customers P7B - CoA"
February 19, 2010 • Invitation to Presentation and Teleconference on February 24, 2010
re: Year End 2009 Operating Results
February 22, 2010 • Annual Stockholders' Meeting on May 25, 2010, Record Date on
March 12, 2010; Press Release re: 2009 Results
February 22, 2010 • 2009 Year-End Results

February 24, 2010 • Materials on 2009 Year-End Operating and Financial Results for
Investors' Briefing and Teleconference
March 01, 2010 • Amended certification on compliance with Manual on Corporate
Governance
March 05, 2010 • Report on Number of Shareholders as of February 28, 2010
March 05, 2010 • Total issued and outstanding Meralco shares as of February 28, 2010
March 08, 2010 • Deadline for submission of nominees for members of Board of
Directors
March 11, 2010 • ERC Order re: ERC Case No. 2010-017
March 12, 2010 • Reply Letter to the PSE re: Clarification of news articles
March 22, 2010 • Results of Board of Directors' meeting: final list of candidates for
Board of directors and declaration of cash dividends
March 31, 2010 • Receipt of ERC Order on ERC Case No. 2009-057 RC
April 06, 2010 • Letter reply to the PSE re: Clarification of news article: "Meralco seeks
P0.1547/kWh rate hike"
April 12, 2010 • Report on Number of Shareholders as of March 31, 2010
April 14, 2010 • Revised Manual of Corporate Governance
April 15, 2010 • Top 100 Stockholders as of March 31, 2010
April 19, 2010 • Report on Lost Stock Certificate
April 21, 2010 • Definitive Information Statement for Annual Meeting of Stockholders
on May 25, 2010, Record Date on March 12, 2010
April 23, 2010 • 2009 Annual Report
April 23, 2010 • Amended Definitive Information Statement for Annual Meeting of
Stockholders on May 25, 2010, Record Date on March 12, 2010

April 26, 2010 • Board approval of allocation of shares for Employees Stock Purchase
Plan; Invitation to Presentation and Teleconference on April 29, 2010
re: 1st Quarter 2010 Operating Results
April 26, 2010 • Special Form for Financial Statements of Publicly-Held and
Investment Companies
April 29, 2010 • Press Release re: results of operations for quarter ended March 31,
2010
May 11, 2010 • Report on Number of Shareholders as of April 30, 2010
May 17, 2010 • Quarterly Report for period ended March 31, 2010
May 25, 2010 • Results of Annual Stockholders' Meeting and Organizational Meeting
of Board of Directors
May 26, 2010 • Reply Letter to the PSE re: Clarification of news article: "Power utility
expects P11B in net earnings
May 28, 2010 • Reply Letter to the PSE re: Clarification of news article: "Napocor
'double-charging' Meralco"
May 31, 2010 • Certifications on qualifications of independent directors and
attendance in Corporate Governance Seminar
June 07, 2010 • Report on Number of Shareholders as of May 31, 2010
June 18, 2010 • Filing of Annual Revenue Requirement, Maximum Average Price &
Performance Incentive Scheme for Performance Based Regulation
with ERC
June 24, 2010 • General Information Sheet for the year 2010
June 28, 2010 • Reply letter to the PSE re: Clarification of news article: "Oscar Reyes
to take COO post at Meralco"
June 28, 2010 • Results of Board of Directors' meeting: cash dividend declaration on

preferred shares, appointment/resignation/election of
directors/officers/committee members
July 01, 2010 • Appointment of officer
July 06, 2010 • Corporate Governance Seminars attended by director
July 07, 2010 • Report on Number of Shareholders as of June 30, 2010
July 09, 2010 • Amended General Information Sheet for the year 2010
July 15, 2010 • Top 100 Stockholders as of June 30, 2010
July 21, 2010 • Invitation to Presentation and Teleconference on July 26, 2010 re:
2nd Quarter 2010 Operating Results
July 26, 2010 • Election of director, cash dividend declaration and press release re:
financial and operating results for quarter ended June 30, 2010
July 27, 2010 • Letter reply to the PSE re: Clarification of news article: "Higher energy
sales help boost Meralco earnings in first half"
July 29, 2010 • Letter reply to the PSE re: Clarification of news article: "Meralco-
Marubeni mulls tieup with DMCI for $750-M project"
August 03, 2010 • Report on Number of Shareholders as of July 31, 2010
August 06, 2010 • Press Release: "Higher Cost of WESM Purchases Drives Increase in
Generation Charge"
August 18, 2010 • Quarterly Report for period ended June 30, 2010
September 06, 2010 • Report on Number of Shareholders as of August 31, 2010
September 06, 2010 • Board authorization to stock transfer agent to issue uncertificated
shares
September 08, 2010 • SEC approval of amendments to By-Laws
September 13, 2010 • Certificate of Attendance for Orientation Course on Corporate

Governance
September 14, 2010 • Receipt of ERC Decision on ERC Case No. 2008-092 CC
September 16, 2010 • Appointment of officer
September 21, 2010 • ERC Order on case re: Application for Authority to Recover
Adjustment in the Generation Charge and System Loss Charge,
Including the VAT
September 27, 2010 • Cash dividend declaration on preferred shares
October 07, 2010 • Report on Number of Shareholders as of September 30, 2010
October 14, 2010 • Top 100 Stockholders as of September 30, 2010
October 19, 2010 • Invitation to Presentation and Teleconference on October 22, 2010 re:
3rd Quarter 2010 Operating Results
October 22, 2010 • Press Release re: financial and operating results for nine months
ended September 30, 2010
October 26, 2010 • Reply Letter to the PSE re: Clarification of news article: "Meralco
allots $2B for power generation"
October 29, 2010 • Reply Letter to the PSE re: Clarification of news article: "Meralco
raising capex to P12B/yr"
November 02, 2010 • Reply Letter to the PSE re: Clarification of news article: "Meralco
works out bank debts"
November 08, 2010 • Report on Number of Shareholders as of October 31, 2010
November 15, 2010 • Quarterly Report for period ended September 30, 2010
November 18, 2010 • Copy of ratings report from Standard & Poor's
November 30, 2010 • Signing of Fixed Rate Notes Facility for issuance of 7- and 10-year
Notes

December 07, 2010 • Report on Number of Shareholders as of November 30, 2010
December 13, 2010 • Declaration of cash dividends; confirmation of appointment of officers
December 14, 2010 • Reply Letter to the PSE re: Clarification of news article: "Court stops
Meralco, Napocor P14-B deal"
December 20, 2010 • Signing of P5 billion Note Facility Agreement with FMIC
December 21, 2010 • Signing of P2.5 billion Term Loan Agreement with PNB
December 23, 2010 • Reply Letter to the PSE re: Clarification of news article: "Meralco
expects P12-B income this year"
December 29, 2010 • Reply Letter to the PSE re: Clarification of news article: "Meralco in
talks with generation companies for joint venture"


Page
Financial Statements
Statement of Management's Responsibility for Financial Statements 1
Report of Independent Auditors 2-3
Statement of Financial Position as at December 31, 2010 (With Comparative Figures as at December 3, 2009) 4-5
Statement of Income for the year ended December 31, 2010 (With Comparative Figures for the Years Ended 6
December 31, 2009 and 2008)
Statement of Comprehensive Income for the year ended December 31, 2010 (With Comparative Figures 7
for the Years Ended December 31, 2009 and 2008)
Statement of Changes in Stockholders' Equity as at December 31, 2010 (With Comparative Figures for the 8
Years Ended December 31, 2009 and 2008)
Statement of Cash Flows for the year ended December 31, 2010 (With Comparative Figures for the Years 9-10
Ended December 31, 2009 and 2008)
Notes to Consolidated Financial Statements 11-120
Supplementary Schedules
Report of Independent Auditors on Supplementary Schedules 121
A. Marketable Securities - (Current Marketable Equity Securities and Other
Short-term Cash Investments) 122
B. Amounts Receivable from Directors, Officers, Employees, Related Parties
and Principal Stockholders (Other than Affiliates) 123
C. Non-Current Marketable Equity Securities, Other Long-term Investments,
and Other Investments 124
D. Indebtedness to Unconsolidated Subsdiiaries and Affiliates *
E. Intangible Assets - Other Assets *
F. Long-term Debt *
G. Indebtedness to Affiliates and Related Parties (Long-term Loans from
Related Companies *
H. Guarantees of Securities of Other Issuers *
I. Capital Stock 125
J. Retained Earnings Available for Dividends 126
Annex A. Aging of Accounts Receivable 127
* These schedules have been omitted because they are either not required, not applicable or the
information required to be presented is included in the Company's consolidated financial statements
or notes to consolidated financial statements.
INDEX TO FINANCIAL STATEMENTS AND SUPPLEMENTARY SCHEDULES
MANILA ELECTRIC COMPANY
FORM 17-A


*SGVMC213786*
P W - 1 0 2 SEC Registration Number
M A N I L A E L E C T R I C C O M P A N Y A N D S U B S I
D I A R I E S
(Company’s Full Name)
L o p e z B u i l d i n g , O r t i g a s A v e n u e , P
a s i g C i t y
(Business Address: No. Street City/Town/Province)
Atty. Anthony V. Rosete 16220 (Contact Person) (Company Telephone Number)
1 2 3 1 A A C F S 0 5 1 1 Month Day (Form Type) Month Day
(Fiscal Year) (Annual Meeting)
(Secondary License Type, If Applicable)
Dept. Requiring this Doc. Amended Articles Number/Section Total Amount of Borrowings
P=19.4 billion P=– Total No. of Stockholders Domestic Foreign
To be accomplished by SEC Personnel concerned
File Number LCU
Document ID Cashier
S T A M P S Remarks: Please use BLACK ink for scanning purposes.
COVER SHEET

*SGVMC213786*
INDEPENDENT AUDITORS’ REPORT The Stockholders and the Board of Directors Manila Electric Company Lopez Building Ortigas Avenue, Pasig City We have audited the accompanying consolidated financial statements of Manila Electric Company and Subsidiaries, which comprise the consolidated statements of financial position as at December 31, 2010 and 2009, and the consolidated statements of income, statements of comprehensive income, statements of changes in equity and statements of cash flows for each of the three years in the period ended December 31, 2010, and a summary of significant accounting policies and other explanatory information.
Management’s Responsibility for the Consolidated Financial Statements
Management is responsible for the preparation and fair presentation of these consolidated financial statements in accordance with Philippine Financial Reporting Standards, and for such internal control as management determines is necessary to enable the preparation of consolidated financial statements that are free from material misstatement, whether due to fraud or error.
Auditors’ Responsibility
Our responsibility is to express an opinion on these consolidated financial statements based on our audits. We conducted our audits in accordance with Philippine Standards on Auditing. Those standards require that we comply with ethical requirements and plan and perform the audit to obtain reasonable assurance about whether the consolidated financial statements are free from material misstatement.
An audit involves performing procedures to obtain audit evidence about the amounts and disclosures in the consolidated financial statements. The procedures selected depend on the auditor’s judgment, including the assessment of the risks of material misstatement of the consolidated financial statements, whether due to fraud or error. In making those risk assessments, the auditor considers internal control relevant to the entity’s preparation and fair presentation of the consolidated financial statements in order to design audit procedures that are appropriate in the circumstances, but not for the purpose of expressing an opinion on the effectiveness of the entity’s internal control. An audit also includes evaluating the appropriateness of accounting principles used and reasonableness of accounting estimates made by management, as well as evaluating the overall presentation of the consolidated financial statements.
We believe that the audit evidence we have obtained is sufficient and appropriate to provide a basis for our audit opinion.
SyCip Gorres Velayo & Co. 6760 Ayala Avenue 1226 Makati City Philippines
Phone: (632) 891 0307 Fax: (632) 819 0872 www.sgv.com.ph BOA/PRC Reg. No. 0001 SEC Accreditat ion No. 0012-FR-2
A member firm of Ernst & Young Global Limited

*SGVMC213786*
- 2 -
Opinion
In our opinion, the consolidated financial statements present fairly, in all material respects, the financial position of Manila Electric Company and Subsidiaries as of December 31, 2010 and 2009, and their financial performance and their cash flows for each of the three years in the period ended December 31, 2010 in accordance with Philippine Financial Reporting Standards. SYCIP GORRES VELAYO & CO. Gemilo J. San Pedro Partner CPA Certificate No. 32614 SEC Accreditation No. 0094-AR-2 Tax Identification No. 102-096-610 BIR Accreditation No. 08-001998-34-2009, June 1, 2009, Valid until May 31, 2012 PTR No. 2641562, January 3, 2011, Makati City February 28, 2011

*SGVMC213786*
MANILA ELECTRIC COMPANY AND SUBSIDIARIES CONSOLIDATED STATEMENTS OF FINANCIAL POSITION December 31 Notes 2010 2009
(Amounts in Millions)
ASSETS
Noncurrent Assets Utility plant and others - net 8, 9, 11 and 19 P=101,009 P=98,231 Construction in progress 8, 9 and 11 2,241 3,627 Investments in associates and a joint venture 10 321 1,203 Investment properties - net 8, 9, 11, 19, 21 and 27 8,037 8,021 Deferred pass-through fuel costs 12 and 26 1,222 3,161 Deferred tax assets - net 3 and 32 42 17 Other noncurrent assets - net 13, 15, 18, 26, 30, 31 and 33 10,339 13,184 Total Noncurrent Assets 123,211 127,444
Current Assets Cash and cash equivalents 14 and 31 24,370 17,068 Trade and other receivables - net 2, 13, 15 ,21, 22, 27, 29 and 31 25,609 21,600 Inventories - at lower of cost or net realizable
value 16 2,043 1,857 Land and development costs - at lower of cost
or net realizable value 11 and 17 1,708 1,191 Other current assets 13 and 31 2,027 2,969 Total Current Assets 55,757 44,685
P=178,968 P=172,129
EQUITY AND LIABILITIES
Equity Attributable to Equity Holders of the Parent
Common stock 19 P=11,273 P=11,273 Subscriptions receivable (738) (960) Additional paid-in capital 4,111 4,112 Excess of acquisition cost over carrying value
of non-controlling interests (328) (328) Employee share-based payment plan 20 743 569 Unrealized fair value gains on available-for-
sale investments 13 96 71 Share in cumulative translation adjustment of
a subsidiary and an associate 10 12 684 Retained earnings: 5 and 19 Appropriated 6,000 4,198 Unappropriated 37,800 37,750 Equity Attributable to Equity Holders
of the Parent 58,969 57,369
Non-controlling Interests 4,227 3,777 Total Equity (Total Carried Forward) 63,196 61,146

*SGVMC213786*
- 2 -
December 31 Notes 2010 2009
(Amounts in Millions)
Total Equity (Total Brought Forward) P=63,196 P=61,146
Noncurrent Liabilities Interest-bearing long-term financial
liabilities - net of current portion 11, 15, 21, 29 and 31 15,498 17,234 Customers’ deposits - net of current portion 15, 22, 26, 29 and 31 23,761 25,063 Deposits from pre-selling of condominium
units 17 741 343 Deferred tax liabilities - net 3 and 32 3,322 4,230 Long-term employee benefits 30 9,547 10,987 Provisions 23 and 33 12,875 7,492 Advances for construction - net of current
portion 26 and 31 3,271 2,989 Other noncurrent liabilities 26 and 31 2,352 522 Total Noncurrent Liabilities 71,367 68,860
Current Liabilities Notes payable 25, 29 and 31 149 513 Trade payables and accrued expenses 2, 12, 21, 22, 26, 27 and 31 31,138 28,261 Income tax payable 413 133 Customers’ refund 2, 24 and 31 7,131 9,147 Current portions of interest-bearing long-term
financial liabilities 11, 15, 21, 29 and 31 5,574 4,069 Total Current Liabilities 44,405 42,123 Total Liabilities 115,772 110,983
P=178,968 P=172,129 See accompanying Notes to Consolidated Financial Statements.

*SGVMC213786*
MANILA ELECTRIC COMPANY AND SUBSIDIARIES CONSOLIDATED STATEMENTS OF INCOME Years Ended December 31 Notes 2010 2009 2008
(Amounts in Millions, Except Per Share Data)
REVENUES Sale of electricity 2, 5, 12, 26, 27, 28 and 34 P=239,077 P=178,686 P=186,999 Sale of real estate 5 3,375 2,877 2,213 Sale of contracts, services and others 5 and 11 3,009 2,987 2,563 245,461 184,550 191,775
EXPENSES (INCOME) Purchased power 27, 28 and 34 200,916 150,928 156,872 Operations and maintenance 15, 20, 27, 29 and 30 15,711 13,611 13,351 Depreciation and amortization 8, 11 and 13 6,219 5,064 4,426 Provision for probable charges and
expenses from claims 23 and 33 5,750 3,351 318 Cost of real estate sold 5 2,640 2,230 1,646 Interest and other financial income 29 and 31 (2,690) (4,246) (2,919) Cost of services 29 1,996 1,803 1,456 Provision (reversal of provision) for
probable losses from refund - net 23 and 33 (1,632) (1,179) 6,617 Interest and other financial charges 21, 22, 25 and 29 493 3,328 4,135 Equity in net earnings of associates and
a joint venture 10 (283) (245) (199) Accretion of present value impact on
customers’ refund 24 225 555 846 Foreign exchange losses (gains) - net 51 (266) (467) Taxes, fees and permits 974 421 493 Others 654 216 – 231,024 175,571 186,575
INCOME BEFORE INCOME TAX 14,437 8,979 5,200
PROVISION FOR (BENEFIT FROM) INCOME TAX 32
Current 5,233 3,218 5,122 Deferred (913) (595) (3,055) 4,320 2,623 2,067
NET INCOME P=10,117 P=6,356 P=3,133
Attributable To Equity holders of the parent 35 P=9,685 P=6,005 P=2,800 Non-controlling interests 432 351 333 P=10,117 P=6,356 P=3,133
Earnings Per Share Attributable to the Equity Holders of the Parent 35
Basic P=8.59 P=5.42 P=2.54 Diluted 8.59 5.42 2.53 See accompanying Notes to Consolidated Financial Statements.

*SGVMC213786*
MANILA ELECTRIC COMPANY AND SUBSIDIARIES CONSOLIDATED STATEMENTS OF COMPREHENSIVE INCOME Years Ended December 31 Notes 2010 2009 2008
(Amounts in Millions)
NET INCOME FOR THE YEAR P=10,117 P=6,356 P=3,133
OTHER COMPREHENSIVE INCOME Unrealized fair value gains (losses) on available-for-
sale investments 13 44 27 (23) Income tax effect (4) (3) 2 40 24 (21) Share in cumulative translation adjustment
of a subsidiary and an associate 10 (672) 682 –
OTHER COMPREHENSIVE INCOME (LOSS) FOR THE YEAR, NET OF TAX (632) 706 (21)
TOTAL COMPREHENSIVE INCOME FOR THE YEAR, NET OF TAX P=9,485 P=7,062 P=3,112
Attributable To Equity holders of the parent P=9,038 P=6,711 P=2,779 Non-controlling interests 447 351 333 P=9,485 P=7,062 P=3,112 See accompanying Notes to Consolidated Financial Statements.

*SGVMC213786*
MANILA ELECTRIC COMPANY AND SUBSIDIARIES CONSOLIDATED STATEMENTS OF CHANGES IN EQUITY
Equity Attributable to Equity Holders of the Parent
Common Stock
(Note 19) Subscriptions
Receivable
Additional Paid-in Capital
Excess of Acquisition
Cost Over Carrying Value of
Non- controlling
Interests
Employee Share-based
Payment Plan (Note 20)
Unrealized Fair Value
Gains on Available-
for-Sale Investments
(Note 13)
Share in Revaluation
Increment of an Associate
(Note 10)
Share in Cumulative Translation
Adjustment of a Subsidiary
and an Associate
(Note 10)
Appropriated Retained Earnings (Note 19)
Unappro- priated
Retained Earnings (Notes 5 and 19)
Equity Attributable
to Equity Holders of the Parent
Non- controlling
Interests Total
Equity
(Amounts in Millions)
At January 1, 2010 P=11,273 (P=960) P=4,112 (P=328) P=569 P=71 P=– P=684 P=4,198 P=37,750 P=57,369 P=3,777 P=61,146 Net income – – – – – – – – – 9,685 9,685 432 10,117 Other comprehensive income – – – – – 25 – (672) – – (647) 15 (632) Total comprehensive income – – – – – 25 – (672) – 9,685 9,038 447 9,485 Appropriations - net of reversal – – – – – – – – 1,802 (1,802) – – – Collection of subscriptions receivable – 222 (1) – – – – – – – 221 – 221 Share-based payments – – – – 174 – – – – – 174 – 174 Dividends – – – – – – – – – (7,833) (7,833) 3 (7,830) – 222 (1) – 174 – – – 1,802 (9,635) (7,438) 3 (7,435) At December 31, 2010 P=11,273 (P=738) P=4,111 (P=328) P=743 P=96 P=– P=12 P=6,000 P=37,800 P=58,969 P=4,227 P=63,196
At January 1, 2009 P=11,038 P=– P=2,932 (P=328) P=268 P=47 P=129 P=2 P=4,198 P=34,321 P=52,607 P=3,552 P=56,159 Net income – – – – – – – – – 6,005 6,005 351 6,356 Other comprehensive income – – – – – 24 – 682 – – 706 – 706 Total comprehensive income – – – – – 24 – 682 – 6,005 6,711 351 7,062 Share on depreciation of revaluation
increment of an associate transferred to unappropriated retained earnings – – – – – – (129) – – 129 – – –
Issuance of shares 235 (960) 1,481 – – – – – – – 756 – 756 Share-based payments – – (301) – 301 – – – – – – – – Dividends – – – – – – – – – (2,705) (2,705) (126) (2,831) 235 (960) 1,180 – 301 – (129) – – (2,576) (1,949) (126) (2,075) At December 31, 2009 P=11,273 (P=960) P=4,112 (P=328) P=569 P=71 P=– P=684 P=4,198 P=37,750 P=57,369 P=3,777 P=61,146
At January 1, 2008 P=11,033 P=– P=2,931 (P=328) P=152 P=68 P=298 P=2 P=200 P=37,324 P=51,680 P=3,341 P=55,021 Net income – – – – – – – – – 2,800 2,800 333 3,133 Other comprehensive income – – – – – (21) – – – – (21) – (21) Total comprehensive income – – – – – (21) – – – 2,800 2,779 333 3,112 Share on depreciation of revaluation
increment of an associate transferred to unappropriated retained earnings – – – – – – (169) – – 169 – – –
Issuance of shares 5 – 1 – – – – – – – 6 – 6 Share-based payments – – – – 116 – – – – – 116 – 116 Appropriations - net of reversal – – – – – – – – 3,998 (3,998) – – – Dividends – – – – – – – – – (1,974) (1,974) (122) (2,096) 5 – 1 – 116 – (169) – 3,998 (5,803) (1,852) (122) (1,974) At December 31, 2008 P=11,038 P=– P=2,932 (P=328) P=268 P=47 P=129 P=2 P=4,198 P=34,321 P=52,607 P=3,552 P=56,159 See accompanying Notes to Consolidated Financial Statements.

*SGVMC213786*
MANILA ELECTRIC COMPANY AND SUBSIDIARIES CONSOLIDATED STATEMENTS OF CASH FLOWS Years Ended December 31 Notes 2010 2009 2008
(Amounts in Millions) CASH FLOWS FROM OPERATING
ACTIVITIES Income before income tax P=14,437 P=8,979 P=5,200 Adjustments for: Depreciation and amortization 8, 11 and 13 6,219 5,064 4,426 Provision for probable charges and expenses
from claims 23 5,750 3,351 5,729 Interest and other financial income 29 (2,690) (4,246) (2,919) Interest and other financial charges 29 493 3,328 4,135 Provision (reversal of provision) for probable
losses from refund - net 23 (1,632) (1,179) 6,617 Loss on disposal of utility plant and others - net 1,033 – – Provision for doubtful accounts, net of recoveries 15 and 29 982 886 1,563 Cost of guaranteed service levels payout 388 216 – Loss from disposal of investment – 46 – Equity in net earnings of associates and
a joint venture 10 (283) (245) (199) Present value impact on customers’ refund 24 225 555 846 Employee share-based payments 20 174 301 116 Reversal of write-down of inventory to net
realizable value 16 (3) (41) (53) Gain on disposal of investment property (4) – – Donation of investment property 2 – – Foreign exchange loss (gain) 51 (266) (467) Operating income before working capital changes 25,142 16,749 24,994 Decrease (increase) in: Trade and other receivables (10) 15,601 (685) Inventories (130) (168) (57) Land and development costs (517) (531) 421 Deferred pass-through fuel costs 1,939 631 1,104 Other current assets 955 (1,854) (314) Increase (decrease) in: Trade payables and accrued expenses 41 8,798 (13,952) Customers’ refund (2,241) (2,889) (1,713) Customers’ deposits 1,298 2,913 4,468 Deposits from pre-selling of condominium units 398 307 2,375 Long-term employee benefits (1,424) (1,555) 653 Provisions (140) (4,935) (69) Net cash generated from operations 25,311 33,067 17,225 Income tax paid (4,953) (3,797) (2,888) Net cash flows generated from operating activities 20,358 29,270 14,337
(Forward)

*SGVMC213786*
- 2 -
Years Ended December 31 Notes 2010 2009 2008
(Amounts in Millions)
CASH FLOWS FROM INVESTING ACTIVITIES Additions to: Construction in progress 9 (P=5,769) (P=7,914) (P=8,351) Utility plant and others 8 (2,741) (187) (629) Intangibles 13 (300) (127) (147) Investment properties 11 (110) (662) (48) Interest and other financial income received 1,058 1,332 2,472 Proceeds from: Return of investment 752 – – Disposal of utility plant and others 82 – – Disposal of investment property 28 – – Settlement of deliverable currency forwards 5 – – Dividends received from associates 10 96 445 456 Dividends paid by subsidiaries attributable to
non-controlling interests (15) – – Decrease (increase) in: Other noncurrent assets 622 (1,657) 1,731 Other receivables – – (603) Net cash used in investing activities (6,292) (8,770) (5,119)
CASH FLOWS FROM FINANCING ACTIVITIES Proceeds from: Interest-bearing long-term financial liabilities, net
of issue costs 10,528 12,398 1,235 Notes payable 380 2,936 9,650 Collection of subscriptions receivable 222 445 5 Payments of: Interest-bearing long-term financial liabilities (10,748) (8,295) (1,751) Dividends (6,187) (2,820) (1,960) Interest and other financial charges (2,044) (1,524) (2,689) Notes payable (744) (12,251) (10,570) Stock transaction costs (1) – – Increase (decrease) in other noncurrent liabilities 1,830 277 (2,612) Net cash flows used in financing activities (6,764) (8,834) (8,692)
NET INCREASE IN CASH AND CASH EQUIVALENTS 7,302 11,666 526
CASH AND CASH EQUIVALENTS AT BEGINNING OF YEAR 17,068 5,402 4,876
CASH AND CASH EQUIVALENTS AT END OF YEAR 14 P=24,370 P=17,068 P=5,402
See accompanying Notes to Consolidated Financial Statements.

*SGVMC213786*
MANILA ELECTRIC COMPANY AND SUBSIDIARIES NOTES TO CONSOLIDATED FINANCIAL STATEMENTS 1. Corporate Information
Manila Electric Company or MERALCO or Parent Company, holds a congressional franchise under Republic Act or RA No. 9209 effective June 28, 2003. RA No. 9209 grants the Parent Company a 25-year franchise to construct, operate, and maintain an electric distribution system in the cities and municipalities of Bulacan, Cavite, Metro Manila, and Rizal and certain cities, municipalities, and barangays in the provinces of Batangas, Laguna, Pampanga, and Quezon. On October 20, 2008, the Energy Regulatory Commission or ERC, granted the Parent Company a consolidated Certificate of Public Convenience and Necessity for the operation of electric service within its franchise coverage, effective until June 28, 2028, to coincide with the Parent Company’s congressional franchise.
MERALCO is the largest distribution utility or DU, in the Philippines. The power segment, primarily power distribution, consists of operations of the Parent Company and its subsidiary, Clark Electric Distribution Corporation or CEDC. In 2010, the Parent Company organized a segment for potential entry into power generation with the new subsidiary commencing development of proposed power generation plants. Through its other operating segments, it develops and sells real estate properties and provides engineering, construction and consulting services, bill payments, collection services, energy systems management and information systems and technology services. MERALCO and its subsidiaries are collectively referred to as the Company or MERALCO Group.
MERALCO is owned by three major shareholder groups. Beacon Electric Asset Holdings, Inc. or Beacon Electric, and PLDT Communications and Energy Ventures, Inc. or PCEV, formerly Pilipino Telephone Company, together own 40.92% of the common shares. Beacon Electric is jointly owned by Metro Pacific Investments Corporation or Metro Pacific and PCEV, which are both domestic corporations, and are affiliates of First Pacific Company Limited, a Hong Kong-based investment and management company. In 2009, San Miguel Corporation or SMC entered into a Share Purchase Agreement or SPA with Government Service Insurance Corporation or GSIS and Social Security System or SSS to acquire a pre-agreed number of shares. The nominees of SMC represent and vote on the shares covered by the SPA. As at December 31, 2010, the collective ownership of GSIS and SSS based on the Stock and Transfer Books of MERALCO, inclusive of the shares covered by the SPA represents 35.05% of the outstanding shares of MERALCO. First Philippine Holdings Corporation and First Philippine Utilities Corp. (formerly First Philippine Union Fenosa, Inc.), own 6.61% of MERALCO.
The common shares of the Parent Company are listed and traded on the Philippine Stock Exchange, or PSE.
As at December 31, 2010, the Company has 7,193 employees, 6,203 of which are employees of the Parent Company.
The registered office address of the Parent Company is Lopez Building, Ortigas Avenue, Pasig City, Philippines.
The accompanying consolidated financial statements as at December 31, 2010 and 2009, and for each of the three years ended December 31, 2010, 2009 and 2008 were reviewed and recommended for approval by the Audit and Risk Management Committee on February 21, 2011.

- 2 -
*SGVMC213786*
The same consolidated financial statements were approved and authorized for issue by the Board of Directors or BOD, on February 28, 2011.

- 3 -
*SGVMC213786*
2. Rate Regulations
As DUs, MERALCO and CEDC are subject to the rate-making regulations and regulatory policies of the ERC. Billings to customers of the Parent Company are itemized or “unbundled” into a number of bill components that reflect the various units incurred in providing electric service. The adjustment to each bill component is governed by mechanisms promulgated and enforced by the ERC, mainly: [i] the “Rules Governing the Automatic Cost Adjustment and True-up Mechanisms and Corresponding Confirmation Process for Distribution Utilities,” which govern the recovery of pass-through costs, including over- or under-recoveries of the bill components, namely, (a) generation charge, (b) transmission charge, (c) system loss charge, (d) lifeline rate subsidies, (e) local franchise and (f) business taxes; and [ii] the “Rules for the Setting of Distribution Wheeling Rates or RDWR,” as modified by ERC Resolution No. 20, Series of 2008, which govern the determination of the Parent Company’s distribution, supply, and metering charges.
The rate-setting mechanism of CEDC is likewise in accordance with ERC regulations. After the unbundling of its rates based on ERC guidelines, CEDC became an entrant to the Performance-Based Regulation, or PBR under Group D. CEDC is currently undergoing regulatory reset.
The following is a discussion of matters related to rate-setting of the Parent Company:
Rate Applications
PBR
The Parent Company was among the first entrants to the PBR, together with Dagupan Electric Corporation and Cagayan Electric and Power Company.
Rate-setting under PBR is governed by the RDWR. Unlike the Return on Rate Base methodology, which was in place up to June 2007, where utility tariffs were determined based on historical costs plus a reasonable rate of return, the PBR scheme sets tariffs based on the DU’s asset base, and the required operating and capital expenditures once a regulatory period to meet a level of operational performance is determined or approved by the ERC. The PBR also employs a mechanism that penalizes or rewards a DU depending on its network and service performance.
Rate filings and setting are done on a regulatory period basis where one regulatory period or RP consists of four regulatory years. A regulatory year or RY, begins on July 1 and ends on June 30 of the following year. As at December 31, 2010, the Parent Company is operating in the first half of the fourth RY of the second RP. The second RP is from July 1, 2007 to June 30, 2011.
Maximum Average Price or MAP for RY 2008 and RY 2009
On January 11 and April 1, 2008, the Parent Company filed separate applications for the approval of its proposed translation of the MAP for RY 2008 and RY 2009 into different rate schedules for the Parent Company’s various customer segments. A portion of the distribution charge under-recoveries as a result of the delay in the implementation of PBR was incorporated in the proposed MAP of P=1.3607 per kWh for the RY 2009.
In April 2009, the ERC approved the implementation of the Parent Company’s average distribution rate for RY 2009 of P=1.2227 per kWh effective billing periods starting May 2009. This rate is inclusive of P=0.1285 per kWh representing the under-recoveries for calendar year 2007.

- 4 -
*SGVMC213786*
On May 28, 2009, certain electricity consumer groups filed a Petition with the Court of Appeals, or CA, questioning the Decision and Order of the ERC on the Parent Company’s rate translation application for RY 2009 which the ERC set at P=1.2227 per kWh. In a decision dated January 27, 2010, the CA denied the Petition. Consequently, the consumer groups brought the case to the Supreme Court or SC. The Parent Company already filed its Comment on the Petition before the SC while the Petitioners filed their Reply thereto. As at February 28, 2011, the Parent Company is awaiting further action of the SC on the petition.
As part of the PBR, the Parent Company implemented payouts to customers where the Parent Company’s performance was beyond the guaranteed service levels or GSL established by the ERC. See Note 26 – Trade Payables and Accrued Expenses.
MAP for RY 2010
On August 7, 2009, the Parent Company filed a petition for the verification of the MAP for RY 2010 and its translation into tariffs by customer category. In accordance with the ERC’s Guidelines for RY 2010 Rate Reset for First Entrant Distribution Utilities, the constrained MAP for RY 2010 was computed to be P=1.4917 per kWh.
On December 14, 2009, the ERC approved the Parent Company’s application for approval of: a) MAP for RY 2010; and b) translation of MAP for RY 2010 into a distribution rate structure for its various customer classes. A Motion for Reconsideration and Clarification was filed by a consumer against the said ERC decision. On January 26, 2010, the Parent Company filed a manifestation with the ERC voluntarily suspending the implementation of the ERC’s December 14, 2009 Decision, until such time the regulator resolves and addresses all other issues raised by the intervenors. On March 10, 2010, the ERC resolved the Motion for Reconsideration and approved a new rate schedule that ensures there will be no rate distortion or no cross-subsidies, other than the lifeline subsidy, in the Parent Company’s rates. Consequently, the Parent Company implemented the new rate schedule effective its April 2010 billing cycle.
Certain electricity consumer groups likewise filed a Petition for Certiorari with the SC questioning the Decision rendered by the ERC. The Parent Company has filed its comment thereto and has likewise commented on the new issues raised by petitioners in their reply. The Parent Company is now awaiting further action by the SC on the Petition.
MAP for RY 2011
On December 6, 2010, the ERC approved the Parent Company’s application for constrained MAP for RY 2011 of P=1.6464 per kWh, limited by the side constraints and S Factor of P=0.008 per kWh; and ordered the Parent Company to implement, starting the next billing cycle from receipt thereof, its approved distribution, supply and metering charges. The 2011 MAP rates were implemented starting the January 2011 billing cycle.
Third RP Reset Application
On June 18, 2010, the Parent Company filed its application for the approval of its proposed Annual Revenue Requirement or ARR and Performance Incentive Scheme or PIS, for the third RP (July 1, 2011–June 30, 2015). The case is docketed as ERC Case No. 2010-069-RC.

- 5 -
*SGVMC213786*
The hearings for the case have been completed and ERC has released its Draft Determination, which contains its initial position on the Parent Company’s application. On February 7, 2011, the ERC conducted a public consultation on the Parent Company’s Draft Determination. Comments submitted by the intervenors shall be reviewed by the ERC in connection with its Final Determination.
Upon approval, the Parent Company’s ARR will then be translated into a distribution rate structure to be implemented across the various customer classes of the Parent Company for the third RP. The PIS, on the other hand will provide the performance measures and targets that will apply to the Parent Company throughout the third RP.
SC Decision on Unbundling Rate Case
On May 30, 2003, the ERC issued an Order approving the Parent Company’s unbundled tariffs that resulted in a total increase of P=0.17 per kWh over the May 2003 tariff levels. However, on August 4, 2003, certain consumer and civil society groups filed a Petition for Review with the Court of Appeals or CA, on the ERC’s ruling. On July 22, 2004, the CA set aside the ERC’s ruling on the Parent Company’s rate unbundling and remanded the case back to the ERC. Further, the CA opined that the ERC should have asked the Commission on Audit or COA, to audit the books of the Parent Company. The ERC and the Parent Company subsequently filed separate motions asking the CA to reconsider its decision. On January 24, 2005, as a result of the denial by the CA of the motions, the ERC and the Parent Company elevated the case to the SC of the Philippines.
In an En Banc Decision promulgated on December 6, 2006, the SC set aside and reversed the CA ruling saying that a COA audit was not a prerequisite in the determination of a utility’s rates. However, while the SC affirmed the ERC’s authority in rate-fixing, the SC directed the ERC to request the COA to undertake a complete audit of the books, records and accounts of the Parent Company. On January 15, 2007, in compliance with the directive of the SC, the ERC requested the COA to conduct an audit of the books, records and accounts of the Parent Company.
The status of the COA audit is discussed in Note 33 – Contingencies.
Applications for Recoveries
The Parent Company filed with the ERC its applications for recoveries of advances for pass-through costs. These advances consist mainly of unrecovered or differential generation and transmission charges technically referred to as under-recoveries, which are recoverable from the customers, as allowed by law.
Applications for the Recovery of Generation Costs and System Loss Charges
The Parent Company filed separate applications (ERC Case Nos. 2006-52RC, 2006-062RC, 2006-076RC, 2007-001RC, 2007-038RC, 2007-078RC, 2007-101RC, 2007-120RC, 2007-123RC and 2007-135RC) for the full recovery of generation costs, including value-added tax, or VAT, incurred for the supply months of August 2006 to May 2007 or total under-recoveries of P=12,679 million for generation charges and P=1,295 million for system loss, or SL charges.
The separate applications for the full recovery of generation charges have been approved by the ERC in its decisions released on January 18, 2008, September 3, 2008 and August 16, 2010.

- 6 -
*SGVMC213786*
As at December 31, 2010 the remaining balance of P=2,607 million of such unrecovered generation costs will be billed in 2011 at the rate of P=0.0314 per kWh until completed and is shown as part of “Trade and other receivables - Unbilled” account. See Note 15 – Trade and Other Receivables.
With respect to the P=1,295 million SL charge under-recoveries, the ERC ordered the Parent Company to file a separate application for the recovery of SL adjustments after the ERC confirms the transmission rate to be used in the calculation of the SL rate in accordance with the SL rate formula of the Automatic Generation Rate Adjustments Guidelines. As at February 28, 2011, the Parent Company has yet to file the application for recovery of the P=1,295 million system loss charge under-recoveries with the ERC.
Application for Recovery of Transmission Costs
Consistent with the rules on Transmission Rate Adjustment Mechanism, the Parent Company filed an application to recover transmission costs advances, net of transmission over-recoveries. The final Order from ERC dated December 14, 2009 updated the net amount recoverable of the Parent Company to P=1,480 million, inclusive of carrying charges. As at December 31, 2010, the balance of P=88 million, which will be billed in 2011 is included in “Trade and other receivables” account in the consolidated statement of financial position.
Applications for Recovery of Advances for Other Pass-Through Costs
Inter-Class Cross Subsidy and Lifeline Subsidy
The Parent Company filed separate applications to recover inter-class cross subsidy (on November 14, 2007) and lifeline subsidy (on February 19, 2008).
In December 2009, the Parent Company implemented the decisions of ERC on the inter-class cross and lifeline subsidies. As at December 31, 2010, the total amount of billed inter-class cross subsidy and lifeline subsidy amounted to P=334 million and P=220 million, respectively. The unbilled balance of inter-class cross subsidy is P=715 million and is expected to be recovered within the next 28 months. The balance of lifeline subsidy is P=636 million and will be billed within the 38 months. The amount recoverable within twelve months is included in the “Trade and other receivables” while the long-term portion is included in the “Other noncurrent assets” account.
Rules Governing the Automatic Cost Adjustment and True-up Mechanisms and Corresponding Confirmation Process for Distribution Utilities
On August 12, 2009, the ERC issued Resolution No. 16, Series of 2009, adopting the “Rules Governing the Automatic Cost Adjustment and True-up Mechanisms and Corresponding Confirmation Process for Distribution Utilities.” These rules govern the recovery of pass-through costs, including over- or under-recoveries in the following bill components: generation charge, transmission charge, system loss charge, lifeline rate subsidies, local franchise and business taxes.
The rules synchronize the various confirmation and verification processes by the ERC for the foregoing charges. In its Decision, the ERC required DUs in Luzon to which the Parent Company belongs, to file their consolidated applications to resolve under- or over-recoveries accumulated from the start of their rate unbundling until December 2008, not later than October 30, 2009. Subsequent filings will be every three years thereafter. However, under ERC Resolution No. 23 Series of 2009, dated October 12, 2009, such application was deferred. On October 18, 2010, the ERC promulgated ERC Resolution No. 21 Series of 2010, amending certain formula contained in

- 7 -
*SGVMC213786*
ERC Resolution No. 16 Series of 2009 and setting March 31, 2011 (covering adjustments implemented until the billing month of December 2010) and March 31, 2014 (covering adjustments from January 2011 to December 2013) as the new deadlines for DUs in Luzon to file their respective applications. Subsequent filings shall likewise be every three years thereafter.
See Note 13 – Other Noncurrent Assets.
Petition to Implement a Lower Generation Charge for the February 2010 Supply Month
The Parent Company’s generation cost abruptly increased to P=15.9 billion for the supply month of February 2010. This translates to a generation charge of P=6.76 per kWh to its customers for the March 2010 billing. The sharp increase in generation cost was mainly due to the high prices in the Wholesale Electricity Spot Market or WESM, brought about by the tight supply of electricity, as several plants were either out on preventive or emergency maintenance, or with de-rated capacity because of the “El Nino” phenomenon and unusually higher temperature. A Petition was filed by the Parent Company to mitigate the effects of the abrupt increase in generation cost through a voluntary deferral of a portion of generation costs, with the differential to be recovered over a period, which shall be approved by the ERC. In an Order dated March 10, 2010, the ERC provisionally approved a lower generation charge of P=5.8417 per kWh representing P=13.8 billion generation cost for the subject period. The Parent Company was also provisionally allowed to charge over a six month period starting April 2010 the generation charge at the rate of P=0.07 per kWh, corresponding to the incremental costs of the condensate fuel used by the First Gas plants during the said period. The balance of the generation costs, which the Parent Company is seeking to recover in the same petition, is now undergoing evaluation by the ERC. All hearings have been completed with the case pending decision by the ERC.
Others
SC Decision on the P=0.167 per kWh Refund
Following the SC’s final ruling that directed the Parent Company to refund affected customers P=0.167 per kWh covering the billing period from February 1994 to April 30, 2003, the ERC approved the release of the refund in four phases. The refund is still ongoing. See Note 24 – Customers’ Refund.
3. Basis of Preparation and Statement of Compliance
The accompanying consolidated financial statements have been prepared on a historical cost basis, except for the Parent Company’s utility plant and others, and investment properties, which are carried at deemed cost and for derivative financial instruments and available-for-sale, or AFS financial assets. AFS financial assets are measured at fair value. Derivative financial instruments are shown as part of “Other current assets,” “Other noncurrent assets,” “Trade payables and accrued expenses” and “Other noncurrent liabilities” accounts in the consolidated statement of financial position. AFS financial assets are included as part of “Other noncurrent assets” account in the consolidated statement of financial position.
The accompanying consolidated financial statements are presented in Philippine peso, the Company’s functional and presentation currency, and all values are rounded to the nearest million peso (P=000,000), except when otherwise indicated.

- 8 -
*SGVMC213786*
Statement of Compliance
The consolidated financial statements of the Parent Company and subsidiaries have been prepared in compliance with Philippine Financial Reporting Standards or PFRS. PFRS includes statements named PFRS and Philippine Accounting Standards or PAS, including Interpretations issued by the Philippine Financial Reporting Standards Council or PFRSC.
Basis of Consolidation
The consolidated financial statements comprise the financial statements of MERALCO and its subsidiaries as at December 31 of each year, except for MIESCOR and its subsidiaries, whose financial reporting date ends at September 30. Adjustments and disclosures are made for the effects of significant transactions or events that occurred between the date of MIESCOR and its subsidiaries’ financial statements and the date of the consolidated financial statements.
The consolidated financial statements include the financial statements of the Parent Company and the following directly and indirectly-owned subsidiaries as at December 31, 2010 and 2009:
Subsidiaries Place of Incorporation Principal Business Activity
Percentage of Ownership
Direct Indirect Corporate Information Solutions, Inc.
or CIS Philippines e-Transactions 100 – CIS Bayad Center, Inc. Philippines Bills payment collection – 100 Outsourced Telleserve Corporation
or OTC Philippines Tellering services – 100 Meralco Energy, Inc. or MEI Philippines Energy systems management 100 – eMERALCO Ventures, Inc. or eMVI Philippines e-Business development 100 – Meralco PowerGen Corporation or
MPG (formerly Asian Center for Energy Management or ACEM)
Philippines
Building and operation of plants and related
facilities 100 – Meralco Financial Services
Corporation or Finserve Philippines Financial services provider 100 – Republic Surety and Insurance
Company Inc. or RSIC Philippines Insurance 100 – Lighthouse Overseas Insurance
Company, Limited or LOIL Bermuda Insurance 100 – MIESCOR Philippines Engineering, construction and consulting services 99 – MIESCOR Builders Inc. or MBI Philippines Electric transmission and distribution operation
and maintenance – 100 Landbees Corporation or Landbees Philippines General services, manpower/maintenance – 100 Miescorrail, Inc. or Miescorrail Philippines Engineering and construction of mass transit
system – 60 CEDC Philippines Power distribution 65 – Rockwell Land Corporation or
Rockwell Land Philippines Real estate 51 –
MPG was originally incorporated as ACEM. On August 19, 2010, the BOD and the stockholders of ACEM (now MPG) approved a resolution to reactivate ACEM which was previously resolved to cease operations in September 2005. On November 12, 2010, the SEC approved the following resolutions of ACEM: (i) resumption of operations; (ii) change in corporate name to “Meralco PowerGen Corporation”; (iii) change in principal place of business; and (iv) change in primary and secondary purposes of the business.

- 9 -
*SGVMC213786*
Subsidiaries are fully consolidated from the date of acquisition, being the date at which the MERALCO Group obtains control, and continue to be consolidated until the date that such control ceases.
The consolidated financial statements are prepared using uniform accounting policies for like transactions and other events with similar circumstances. All intra-group balances, income and expenses, unrealized gains and losses and dividends resulting from intra-group transactions are eliminated in full.
Non-controlling interests represent the portion of profit or loss and net assets in CEDC, Rockwell Land, and MIESCOR and its subsidiaries not held by the Parent Company and are presented separately in the consolidated statement of income, consolidated statement of comprehensive income and within equity in the consolidated statement of financial position, separately from equity attributable to equity holders of the parent.
Losses within a subsidiary are attributed to the non-controlling interest even if that results in a deficit.
A change in the ownership interest of a subsidiary, without a change of control, is accounted for as an equity transaction.
If the control over a subsidiary is lost, the Company: (a) derecognizes the assets (including goodwill) and liabilities of the subsidiary; (b) derecognizes the carrying amount of any non-controlling interest; (c) derecognizes the cumulative translation differences recorded in equity; (d) recognizes the fair value of the consideration received; (e) recognizes the fair value of any investment retained; (f) recognizes any surplus or deficit in profit or loss; and (g) reclassifies the Parent Company’s share of components previously recognized in the consolidated statement of comprehensive income to the consolidated statement of income.
4. Changes in Accounting Policies and Disclosures
The accounting policies adopted are consistent with those of the previous financial year except with respect to the adoption of the following amendments and improvements to existing PFRS and a new interpretation as at January 1, 2010:
Amendments to PFRS
Amendment to PFRS 2, Share-based Payment
The amendments clarify how an individual subsidiary in a group should account for share-based payment arrangements in its own financial statements. It further states that an entity that receives goods or services in a share-based payment arrangement must account for these goods or services no matter which entity in the group settles the transaction, and regardless of whether the transaction is equity-settled or cash-settled.
Improvements to PFRS 5, Noncurrent Assets Held-for-Sale and Discontinued Operations
When a subsidiary is held for sale, all of its assets and liabilities will be classified as held-for-sale under PFRS 5, even when the entity retains a non-controlling interest in the subsidiary after the sale.

- 10 -
*SGVMC213786*
Amendment to PAS 39, Financial Instruments: Recognition and Measurement – Eligible Hedged Items
The amendment to PAS 39 addresses the designation of a one-sided risk in a hedged item, and the designation of inflation as a hedged risk or portion in particular situations. The amendment clarifies that an entity is permitted to designate a portion of the fair value changes or cash flow variability of a financial instrument as a hedged item.
New Interpretation
Philippine Interpretation International Financial Reporting Interpretations Committee (IFRIC) 17, Distributions of Non-Cash Assets to Owners
This interpretation provides guidance on non-reciprocal distribution of assets by an entity to its owners acting in their capacity as owners, including distributions of non-cash assets and those giving the shareholders a choice of receiving non-cash assets or cash, provided that: (a) all owners of the same class of equity instruments are treated equally; and (b) the non-cash assets distributed are not ultimately controlled by the same party or parties both before and after the distribution, and as such, excluding transactions under common control.
Improvements to PFRS
The PFRSC approved in May 2009 the adoption of the Improvements to International Financial Reporting Standards or IFRS, issued in April 2009 by the International Accounting Standards Board or IASB. There are separate transitional provisions for the improvements in each standard, which are all effective beginning January 1, 2010.
PFRS 2, Share-based Payment
The amendment clarifies that the contribution of a business on formation of a joint venture and combinations under common control are not within the scope of PFRS 2 regardless of its exclusion from the Revised PFRS 3.
PFRS 5, Noncurrent Assets Held-for-Sale and Discontinued Operations
The amendment clarifies the disclosures required in respect of noncurrent assets or disposal groups classified as held for sale or discontinued operations. The disclosure requirements of other PFRS only apply if specifically required for such noncurrent assets or discontinued operations.
It also clarifies that the general requirements of PAS 1, Presentation of Financial Statements, still apply, particularly paragraphs 15 (to achieve fair presentation) and 125 (sources of estimation and uncertainty) of PAS 1.
PFRS 8, Operating Segments
The amendment clarifies that segment assets and liabilities need only be reported when those assets and liabilities are included in measures that are used by the chief operating decision maker.
PAS 1, Presentation of Financial Statements
The terms of a liability that could result, at anytime, in its settlement by the issuance of equity instruments at the option of the counterparty do not affect its classification.

- 11 -
*SGVMC213786*
PAS 7, Statement of Cash Flows
The amendment explicitly states that only expenditure that results in a recognized asset can be classified as a cash flow from investing activities.
PAS 17, Leases
The amendment removes the specific guidance on classifying land as lease so that only the general guidance remains.
PAS 36, Impairment of Assets
The amendment clarifies that the largest unit permitted for allocating goodwill acquired in a business combination is the operating segment, as defined in PFRS 8, before aggregation for reporting purposes.
PAS 38, Intangible Assets
The amendment clarifies that if an intangible asset acquired in a business combination is identifiable only with another intangible asset, the acquirer may recognize the group of intangible assets as a single asset, provided the individual assets have similar useful lives. It also clarifies that the valuation techniques presented for determining the fair value of intangible assets acquired in a business combination that are not traded in active markets are only examples and are not restrictive on the methods that can be used.
PAS 39, Financial Instruments: Recognition and Measurement
The amendment clarifies that a prepayment option is considered closely related to the host contract when the exercise price of a prepayment option reimburses the lender up to the approximate present value of lost interest for the remaining term of the host contract. The amendment also clarifies that the scope exemption for contracts between an acquirer and a vendor in a business combination to buy or sell an acquiree at a future date, applies only to binding forward contracts, and not derivative contracts where further actions by either party are still to be taken. It also clarifies that gains or losses on cash flow hedges of a forecast transaction that subsequently results in the recognition of a financial instrument or on cash flow hedges of recognized financial instruments should be reclassified in the period that the hedged forecast cash flows affect profit or loss.
Philippine Interpretation IFRIC 9, Reassessment of Embedded Derivatives
The improvement clarifies that it does not apply to possible reassessment, at the date of acquisition, to embedded derivatives in contracts acquired in a combination between entities or businesses under common control or the formation of a joint venture.
Philippine Interpretation IFRIC 16, Hedges of a Net Investment in a Foreign Operation
The improvement states that in a hedge of a net investment in a foreign operation, qualifying hedging instruments may be held by any entity or entities within the group, including the foreign operation itself, as long as the designation, documentation and effectiveness requirements of PAS 39 that relate to a net investment hedge, are satisfied.

- 12 -
*SGVMC213786*
The adoption of the foregoing amendments and improvements to existing PFRS and new interpretation did not have any effect on the Company’s financial position and performance.
New Accounting Standards and Interpretations to Existing Standards Effective Subsequent to December 31, 2010
The Company will adopt the following revised standards and interpretations enumerated below when these become effective. Except as otherwise indicated, the Company does not expect the adoption of these revised standards and amendments to PFRS to have a significant impact on the Company’s consolidated financial statements.
Effective 2011
Revised PAS 24, Related Party Disclosures
The standard has been revised to simplify the identification of related party relationships and re-balance the extent of disclosures of transactions between related parties based on the costs to preparers and the benefits to users in having this information available in the financial statements. Also, the revised standard provides a partial exemption from the disclosure requirements for government-related entities. This revision is applicable retrospectively and for annual periods beginning on or after January 1, 2011.
Amendment to PAS 32, Financial Instruments: Presentation - Classification of Rights Issues
The definition of a financial liability in the standard has been amended to classify rights issues (and certain options or warrants) as equity instruments if: (a) the rights are given pro rata to all of the existing owners of the same class of an entity’s non-derivative equity instruments, and (b) the instruments are used to acquire a fixed number of the entity’s own equity instruments for a fixed amount in any currency. This amendment is applicable retrospectively and for annual periods beginning on or after February 1, 2010.
Amendment to IFRIC 14, Prepayments of a Minimum Funding Requirement
The interpretation has been amended to permit an entity to treat the prepayment of a minimum funding requirement as an asset. The amendment should be applied to the beginning of the earliest period presented in the first financial statements in which the entity applied the original interpretation. This amendment is applicable retrospectively and for annual periods beginning on or after January 1, 2011.
Philippine Interpretation IFRIC 19, Extinguishing Financial Liabilities with Equity Instrument
The interpretation clarifies that equity instruments issued to a creditor to extinguish a financial liability are consideration paid. As a result, the financial liability is derecognized and the equity instruments issued are treated as consideration paid to extinguish that financial liability. The interpretation states that equity instruments issued in a debt for equity swap should be measured at the fair value of the equity instruments issued, if this can be determined reliably. If the fair value of the equity instruments issued is not reliably determinable, the equity instruments should be measured by reference to the fair value of the financial liability extinguished as of the date of extinguishment. Any difference between the carrying amount of the financial liability that is extinguished and the fair value of the equity instruments issued is recognized immediately in

- 13 -
*SGVMC213786*
profit or loss. This interpretation is applicable retrospectively and for annual periods beginning on or after July 1, 2010.
Improvements to PFRS
The PFRSC approved in its meeting in July 2010 the adoption of Improvements to IFRS issued by the IASB in May 2010. There are separate transitional provisions for the improvements in each standard, which are all effective beginning January 1, 2011.
PFRS 3, Business Combinations
The improvements include: (a) clarification that the amendments to PFRS 7, Financial Instruments: Disclosures, PAS 32, Financial Instruments: Presentation, and PAS 39,Financial Instruments: Recognition and Measurement, that eliminate the exemption for contingent consideration, do not apply to contingent consideration that arose from business combinations whose acquisition dates precede the application of PFRS 3 (as revised in 2008); (b) guidance that the choice of measuring non-controlling interest at fair value or at the proportionate share of the acquiree’s net assets applies only to instruments that represent present ownership interests and entitle their holders to a proportionate share of the net assets in the event of liquidation. All other components of non-controlling interest are measured at fair value unless another measurement basis is required by PFRS; and (c) clarification that the application guidance in PFRS 3 applies to all share-based payment transactions that are part of a business combination, including un-replaced and voluntarily replaced share-based payment awards.
PFRS 7, Financial Instruments
The amendment emphasizes the interaction between quantitative and qualitative disclosures about the nature and extent of risks associated with financial instruments.
PAS 1, Presentation of Financial Instruments
The amendment clarifies that an entity shall present an analysis of other comprehensive income for each component of equity, either in the statement of changes in equity or in the notes to the financial statements.
PAS 27, Consolidated and Separate Financial Statements
The improvement clarifies that the consequential amendments from PAS 27 made to PAS 21, The Effect of Changes in Foreign Exchange Rates, PAS 28, Investments in Associates, and PAS 31, Interests in Joint Ventures, apply prospectively for annual periods beginning on or after July 1, 2009, or earlier when PAS 27 is applied earlier.
PAS 34, Interim Financial Reporting
The amendment provides guidance how to apply disclosure principles in PAS 34 and additional disclosure requirements around (a) the circumstances likely to affect fair values of financial instruments and their classification; (b) transfers of financial instruments between different levels of the fair value hierarchy; (c) changes in classification of financial assets; and (d) changes in contingent liabilities and assets.

- 14 -
*SGVMC213786*
Philippine Interpretation IFRIC 13, Customer Loyalty Programmes
The amendment clarifies the meaning of fair value in the context of measuring award credits under customer loyalty programmes.
The improvements to PFRS 3 will be applied prospectively while those for PFRS 7, PAS 1, PAS 27 and PAS 34 will be applied retrospectively. IFRIC 13 is not applicable to the Company.
Effective 2012
Philippine Interpretation IFRIC 15, Agreements for Construction of Real Estate
This interpretation covers accounting for revenue and associated expenses by entities that undertake the construction of real estate directly or through subcontractors. This interpretation requires that revenue on construction of real estate be recognized only upon completion, except when such contract qualifies as a construction contract to be accounted for under PAS 11, Construction Contracts, or involves rendering of services in which case revenue is recognized based on stage of completion. Contracts involving provision of services with the construction materials and where the risks and reward of ownership are transferred to the buyer on a continuous basis will also be accounted for based on stage of completion. The Company will apply this interpretation in 2012. Adoption of this interpretation will result in a change in the Company’s revenue recognition on sale of condominium units and will result in decrease in retained earnings and non-controlling interests and increase in assets and liabilities.
Effective 2013
PFRS 9, Financial Instruments: Classification and Measurement (Phase I)
Phase I introduces new requirements for classifying and measuring financial assets. Other phases are currently being deliberated to expand PFRS 9 to include classifications and measurement of financial liabilities, derecognition of financial instruments, impairment, and hedge accounting. The objective is to replace PAS 39 in its entirety in the middle of 2011.
PFRS 9 (Phase I) is applicable to all financial assets within the scope of PAS 39. At initial recognition, all financial assets (including hybrid contracts with a financial asset host) are measured at fair value plus, in the case of a financial asset not classified as at fair value through profit or loss or FVPL, transaction costs.
Subsequent to initial recognition, financial assets that are debt instruments are measured at amortized cost or fair value on the basis of both: (a) the entity’s business model for managing the financial assets; and (b) the contractual cash flow characteristic of the financial asset. Debt instrument may be subsequently measured at amortized cost if: (a) the asset is held within a business model whose objective is to hold the assets to collect the contractual cash flows; and (b) the contractual terms of the financial asset give rise, on specified dates, to cash flows that are solely payments of principal and interest on the principal outstanding. All other debt instruments are subsequently measured at fair value.

- 15 -
*SGVMC213786*
All financial assets that are equity investments are measured at fair value either through other comprehensive income or profit or loss. This is an irrevocable choice on the part of the entity unless the equity investments are held for trading, in which case, they must be measured at FVPL.
This standard is applicable retrospectively and for annual periods beginning on or after January 1, 2013 with certain exceptions. Earlier application is permitted.
5. Summary of Significant Accounting Policies
The principal accounting policies adopted in preparing the consolidated financial statements of the Company are as follows:
Business Combinations and Goodwill
Business combinations are accounted for using the acquisition method. The consideration transferred in a business combination is measured at fair value. Acquisition-related costs in a business combination are expensed.
As at the acquisition date, the Company recognizes, separately from goodwill, the identifiable assets acquired, the liabilities assumed and any non-controlling interest in the acquiree. Identifiable assets acquired and liabilities assumed are measured at acquisition-date fair values. For each business combination, the Company has the option to measure the non-controlling interest in the acquiree at fair value or the non-controlling interest’s proportionate share of the acquiree’s identifiable net assets.
When a business is acquired, an assessment of the identifiable assets acquired and liabilities assumed for appropriate classification and designation in accordance with the contractual terms, economic and other pertinent conditions as at the acquisition date. This includes the separation of embedded derivatives in host contracts by the acquiree.
If the business combination is achieved in stages, the acquirer’s previously held equity interest in the acquiree is remeasured to fair value as at acquisition date.
Any contingent consideration to be transferred by the acquirer will be recognized at fair value at the acquisition date. Subsequent changes to the fair value of the contingent consideration, which is deemed to be an asset or liability will be recognized in accordance with PAS 39 either in profit or loss or other comprehensive income. If the contingent consideration is classified as equity, it shall not be remeasured until it is finally settled within equity.
Goodwill is initially measured at cost being the excess of the aggregate of the consideration transferred, any non-controlling interest in the acquiree and, in a business combination achieved in stages, the acquisition-date fair value of the Company’s previously held equity interest in the acquiree, over the fair value of net identifiable assets acquired. If the difference is negative, such difference is recognized as gain in the consolidated statement of income.
After initial recognition, goodwill is measured at cost less any accumulated impairment losses. For the purpose of impairment testing, goodwill acquired in a business combination is, from acquisition date, allocated to each of the cash generating units that are expected to benefit from the combination, irrespective of whether other assets or liabilities of the acquiree are assigned to those units.

- 16 -
*SGVMC213786*
Where goodwill forms part of a cash-generating unit and part of the operation within that unit is disposed of, the goodwill associated with the operation disposed of is included in the carrying amount of the operation when determining the gain or loss on disposal of the operation. Goodwill disposed of in such circumstance is measured based on relative values of the operation disposed of and the portion of the cash-generating unit retained.
Business combinations involving entities under common control are accounted for similar to pooling of interest method. The assets and liabilities of the combining entities are reflected at their carrying amounts reported in the consolidated financial statements of the controlling holding company. Any difference between the consideration paid and the share capital of the “acquired” entity is reflected within equity as additional paid-in capital. The consolidated statement of income reflects the results of the combining entities for the full year, irrespective of when the combination takes place. Comparatives are presented as if the entities had always been combined since the date the entities were under common control.
Prior to January 1, 2010, business combinations were accounted for using the purchase method. Transaction costs directly attributable to the acquisition formed part of the acquisition cost. Non-controlling interests were measured at the proportionate share of the acquiree’s identifiable net assets.
Utility Plant and Others
Utility plant and others, except land, are stated at cost, net of accumulated depreciation and amortization and any accumulated impairment loss, if any. Costs include the cost of replacing part of such utility plant and other properties when that cost is incurred, if the recognition criteria are met. All other repair and maintenance costs are recognized as incurred in the consolidated statement of income. The present value of the expected cost for the decommissioning of the asset after use is included in the cost of the respective asset if the recognition criteria for a provision are met.
Land is stated at cost less any impairment in value.
The Parent Company’s utility plant and others are stated at deemed cost. The revalued amount recorded as at January 1, 2004 was adopted as deemed cost as allowed by the transitional provisions of PFRS 1. The balance of revaluation increment was closed to retained earnings. See Note 19 – Equity for the related discussion.
Depreciation and amortization of utility plant and others of the Company is computed using the straight-line method (except for certain subtransmission and distribution assets, which use straight-line functional group method) over the following estimated useful lives:
Asset Type Estimated Useful Lives Subtransmission and distribution 10–50 years, depending on the life of
the significant parts Others: Buildings and improvements 15–40 years Communication equipment 10 years Office furniture, fixtures and other equipment 5 years Transportation equipment 5–10 years Others 5–20 years

- 17 -
*SGVMC213786*
An item of utility plant and others is derecognized upon disposal or when no future economic benefits are expected from its use or disposal. Any gain or loss arising as a result of the derecognition of the asset (calculated as the difference between the net disposal proceeds and the carrying amount of the asset) is included in the consolidated statement of income in the year the asset is derecognized.
The asset’s residual values, useful lives and methods of depreciation and amortization are reviewed, and adjusted prospectively if appropriate, at each financial year-end to ensure that the residual values, periods and methods of depreciation and amortization are consistent with the expected pattern of economic benefits from items of utility plant and others.
Construction in Progress
Construction in progress is stated at cost, which includes cost of construction, plant and equipment, capitalized borrowing costs and other direct costs. Construction in progress is not depreciated until such time that the relevant assets are substantially completed and available for their intended use.
Borrowing Costs
Borrowing costs are capitalized if they are directly attributable to the acquisition, construction or production of a qualifying asset. A qualifying asset is an asset that necessarily takes a substantial period of time to get ready for its intended use or sale. Capitalization of borrowing costs commences when the activities necessary to prepare the asset for its intended use or sale have been undertaken and expenditures and borrowing costs have been incurred. Borrowing costs are capitalized until the asset is substantially available for its intended use.
Borrowing costs includes interest charges and other costs incurred in connection with the borrowing of funds, as well as any exchange differences arising from any foreign currency denominated borrowings used to finance the projects, to the extent that they are regarded as an adjustment to interest costs.
All other borrowing costs are expensed as incurred.
Investment Properties
Investment properties, except land, are stated at cost net of accumulated depreciation and accumulated impairment loss, if any. The carrying amount includes transaction costs and costs of replacing part of an existing investment property at the time such costs are incurred if the recognition criteria are met and excludes the costs of day-to-day servicing of an investment property.
Investment properties include properties that are being constructed or developed for future use as investment property.
Land is carried at cost less any impairment in value.
The Parent Company’s investment properties are stated at deemed cost. See Note 19 – Equity for the related discussions.
Investment properties, except land, are being depreciated on a straight-line basis over the useful life of 5 to 35 years.

- 18 -
*SGVMC213786*
Investment properties are derecognized either when they have been disposed of or when the investment properties are permanently withdrawn from use and no future economic benefit is expected from its disposal. Any gain or loss on the derecognition of the investment properties are recognized in the consolidated statement of income in the year these are disposed or retired.
Transfers are made to investment property when and only when there is a change in use, evidenced by ending of owner-occupation or commencement of an operating lease to another party. If owner-occupied property becomes an investment property, the Company accounts for such property in accordance with the policy stated under utility plant and others up to the date of the change in use. Transfers are made from investment property when, and only when, there is a change in use, evidenced by commencement of owner-occupation or commencement of development with a view to sale. Transfers from investment property are recorded using the carrying amount of the investment property at the date of change in use.
Asset Retirement Obligations
Under the terms of certain Company’s lease contracts, the Company is required to dismantle the installations made in leased sites and restore such sites to their original condition at the end of the term of the lease contracts. The Company recognizes a liability measured at the present value of the estimated costs of these obligations and capitalizes such costs as part of the balance of the related item of utility plant and others and investment properties. The amount of asset retirement obligations is accreted and such accretion is recognized as interest expense.
Intangible Assets
Intangible assets acquired separately are initially measured at cost. Following initial recognition, intangible assets are carried at cost, net of accumulated amortization and accumulated impairment loss, if any. The useful lives of intangible assets are assessed at the individual asset level as having either finite or indefinite useful lives.
Intangible assets with finite lives are amortized over the useful economic lives of 5 years using the straight-line method of accounting and assessed for impairment whenever there is an indication that the intangible assets may be impaired. At a minimum, the amortization period and the amortization method for an intangible asset with a finite useful life are reviewed at least at each reporting date. Changes in the expected useful life or the expected consumption pattern of future economic benefit embodied in the asset are accounted for by changing the amortization period or method, as appropriate, and treated as change in accounting estimates. The amortization expense of intangible assets with finite lives is recognized in the consolidated statement of income.
Intangible assets with indefinite useful lives are not amortized, but are assessed for impairment annually either individually or at the cash generating unit level. The assessment of indefinite useful life is reviewed annually to determine whether such indefinite useful life continues to exist. If not, the change in the useful life assessment from indefinite to finite is made on a prospective basis.
Gains or losses arising from derecognition of an intangible asset are measured as the difference between the net disposal proceeds and the carrying amount of the asset, and are recognized in the consolidated statement of income.
Intangible assets generated within the business are not capitalized and expenditures are charged in profit or loss in the year in which these are incurred.

- 19 -
*SGVMC213786*
Investments in Associates
An associate is an entity over which the Company has significant influence and which is neither a subsidiary nor a joint venture. Investments in associates are accounted for using the equity method of accounting and are initially recognized at cost.
Under the equity method, an investment in an associate is carried in the consolidated statement of financial position at cost plus post-acquisition changes in the Company’s share of net assets of the associate, less any impairment in value. Any goodwill relating to an associate is included in the carrying amount of the investment and is not amortized nor individually tested for impairment. The consolidated statement of income reflects the Company’s share of the results of operations of the associates. Where there has been a change recognized directly in the equity of the associate, the Company recognizes its share in any changes and discloses this, when applicable, in the consolidated statements of comprehensive income and changes in equity. Unrealized gains and losses resulting from transactions between and among the Company and the associates are eliminated to the extent of the interest in those associates.
The share in profits and losses of associates is shown on the face of the consolidated statement of income. This is the profit or loss attributable to equity holders of the associate and is therefore profit or loss after tax and net of non-controlling interest in the subsidiaries of the associates.
The reporting dates of the associates and the Company are identical and the associates’ accounting policies conform with those used by the Company for like transactions and events in similar circumstances.
After application of the equity method, the Company determines whether it is necessary to recognize an impairment loss on the investments in associates. At the end of each reporting date, the Company determines whether there is any objective evidence that each of the investments in associates is impaired. If this is the case, the Company calculates the amount of impairment as the difference between the recoverable amount of the investment in associate and its carrying value and recognize the amount in the consolidated statement of income.
Upon loss of significant influence over the associate, the Company measures and recognizes any remaining investment at its fair value. Any difference between the carrying amount of the investment in associate upon loss of significant influence, and the aggregate of the fair value of the remaining investment and proceeds from disposal, is recognized in the consolidated statement of income.
Interest in a Joint Venture
The Company’s interest in Indra Philippines, Inc. or Indra Philippines, a jointly controlled entity, is accounted for using the equity method of accounting in the consolidated financial statements. The interest in a joint venture is carried at cost plus post-acquisition changes in the Company’s share of the net assets of the joint venture, less any impairment in value. The Company’s share of the results of operations of the joint venture is recognized in the consolidated statement of income.
A joint venture is a contractual arrangement whereby two or more parties undertake an economic activity that is subject to joint control. A jointly controlled entity is a joint venture that involves the establishment of a separate entity in which each venturer has an interest. The financial statements of the joint venture are prepared for the same reporting year as the Company, using consistent accounting policies.

- 20 -
*SGVMC213786*
Adjustments are made in the consolidated financial statements to eliminate the Company’s share of unrealized gains and losses on transactions between the Company and the jointly controlled entity. The joint venture is carried at equity method until the date on which the Company ceases to have joint control over the jointly controlled entity.
Upon loss of control and provided the jointly controlled entity does not become a subsidiary or associate, the Company measures and recognizes the remaining investment at fair value. Any difference between the carrying amount of the jointly controlled entity upon loss of joint control, and the aggregate of the fair value of the remaining investment and proceeds from disposal, is recognized in the consolidated statement of income. When the remaining investment constitutes significant influence, it is accounted for as investment in an associate.
Deferred Pass-through Fuel Costs
Deferred pass-through fuel costs are accounted as prepayments for gas purchases and are initially recorded based on the billings received. The account is reduced for fuel consumption above the required annual volume based on historical costs and is tested for impairment at each reporting date. Key factors in the impairment test of the deferred pass-through costs are the ability of the First Gas Power Corporation or FGPC and FGP Corp. or FGP’s power plants to burn the banked gas within the contractually-agreed period and the Parent Company’s ability to bill its customers for the power generated from the banked gas burnt on the basis of the amounts paid for such gas.
Impairment of Nonfinancial Assets
The Company assesses at each reporting date whether there is an indication that a nonfinancial asset, other than goodwill and intangible assets with indefinite useful life, may be impaired. If any such indication exists the Company makes an estimate of the asset’s recoverable amount. An asset’s recoverable amount is the higher of an individual asset’s or, if the individual asset does not generate cash inflows that are largely independent of those from other assets or groups of assets, a cash-generating unit’s fair value less costs to sell and its value in use. Where the carrying amount of an asset exceeds its recoverable amount, the asset is considered impaired and is written down to its recoverable amount. The fair value is the amount obtainable from the sale of the asset in an arm’s-length transaction. In determining fair value less costs to sell, an appropriate valuation model is used. These calculations are corroborated by valuation multipliers, quoted share prices for publicly traded securities or other available fair value indicators. In assessing value in use, the estimated future cash flows are discounted to their present value using a pre-tax discount rate that reflects current market assessments of the time value of money and the risks specific to the asset. Impairment losses are recognized in the consolidated statement of income.
An assessment is also made at each reporting date as to whether there is any indication that previously recognized impairment losses may no longer exist or may have decreased. If such indication exists, the Company estimates the individual asset’s or cash-generating unit’s recoverable amount. A previously recognized impairment loss is reversed only if there has been a change in the estimates used to determine the asset’s recoverable amount since the last impairment loss was recognized. If a reversal of impairment loss is to be recognized, the carrying amount of the asset is increased to its recoverable amount. The increased amount cannot exceed the carrying amount that would have been determined had no impairment loss been recognized for the asset in prior years. Such reversal is recognized in the consolidated statement of income. After such reversal, the depreciation and amortization expense is adjusted in future periods to allocate the asset’s revised carrying amount, less any residual value, on a systematic basis over its remaining useful life.

- 21 -
*SGVMC213786*
Intangible assets with indefinite useful lives are tested for impairment annually or more frequently if events or changes in circumstances indicate that the carrying value may be impaired, either individually or at the cash generating unit level, as appropriate. The amount of impairment is calculated as the difference between the recoverable amount of the intangible asset and its carrying amount. The impairment loss is recognized in the consolidated statement of income. Impairment losses relating to intangible assets may be reversed in future periods.
Goodwill is reviewed for impairment annually or more frequently if events or changes in circumstances indicate that the carrying value may be impaired. Impairment is determined for goodwill by assessing the recoverable amount of the cash-generating unit or group of cash-generating units, to which the goodwill relates. Where the recoverable amount of the cash-generating unit or group of cash-generating units, is less than the carrying amount of the cash-generating unit or group of cash-generating units, to which goodwill has been allocated, an impairment loss is recognized. Impairment losses relating to goodwill cannot be reversed in future periods.
If there is incomplete allocation of goodwill acquired in a business combination to cash-generating units or group of cash-generating units, an impairment testing of goodwill is only carried out when impairment indicators exist. Where impairment indicators exist, impairment testing of goodwill is performed at a level at which the acquirer can reliably test for impairment.
Inventories
Materials and supplies are stated at the lower of cost or net realizable value. Costs of acquiring materials and supplies including costs incurred in bringing each item to their present location and condition are accounted using the moving average cost method. Net realizable value is the estimated selling price in the ordinary course of business less the estimated cost to sell or the current replacement cost of the asset.
Condominium units for sale are stated at the lower of cost or net realizable value. Cost includes the cost of the land, expenditures for the construction of the condominium units and borrowing costs incurred during construction. Net realizable value is the estimated selling price in the ordinary course of business, less estimated costs of completion and the estimated costs necessary to make the sale.
Land and Development Costs
Real estate properties for development, subdivided or otherwise, are stated at the lower of cost or net realizable value. Expenditures for development are capitalized as part of the cost of the land. Borrowing costs are capitalized while development is in progress. Net realizable value is the estimated selling price in the ordinary course of business less estimated costs to complete and to sell.
Financial Assets
Initial Recognition
Financial assets are classified as at FVPL, loans and receivables, held-to-maturity or HTM investments, AFS financial assets, or as derivatives designated as hedging instruments in an effective hedge, as appropriate. The classification of financial assets is determined at initial recognition and, where allowed and appropriate, reevaluated at each reporting date.

- 22 -
*SGVMC213786*
Financial assets are recognized initially at fair value. Transaction costs are included in the initial measurement of all financial assets, except for financial instruments measured at FVPL.
Purchases or sales of financial assets that require delivery of assets within a timeframe established by regulation or convention in the market place (regular way purchase) are recognized on the trade date which is the date that the Company commits to purchase or sell the asset.
The Company’s financial assets include cash and cash equivalents, trade and other receivables (including SC GRAM refund), quoted and unquoted equity securities and embedded derivatives that are not accounted for as accounting hedges.
Subsequent Measurement
The subsequent measurement of financial assets depends on the classification as follows:
Financial Assets at FVPL
Financial assets at FVPL include financial assets held-for-trading and financial assets designated upon initial recognition as at FVPL. Financial assets are classified as held-for-trading if they are acquired for the purpose of selling in the near term. Derivative assets, including separated embedded derivatives are also classified as held-for-trading unless they are designated as effective hedging instruments. Financial assets at FVPL are carried in the consolidated statement of financial position at fair value with gains or losses on fair value changes recognized in the consolidated statement of income under “Interest and other financial income” or “Interest and other financial charges” account, respectively. Interest earned and dividends received from investment at FVPL are recognized in the consolidated statement of income under “Interest and other financial income” account.
Financial assets may be designated at initial recognition as at FVPL if any of the following criteria are met: (i) the designation eliminates or significantly reduces the inconsistent treatment that would otherwise arise from measuring the assets or recognizing gains or losses on them on a different basis; (ii) the financial assets are part of a group which are managed and their performance are evaluated on a fair value basis, in accordance with a documented risk management strategy; or (iii) the financial assets contain one or more embedded derivatives that would need to be recorded separately.
Derivatives embedded in host contracts are accounted for as separate derivatives when their risks and characteristics are not closely related to those of the host contracts and are not carried at fair value. These embedded derivatives are measured at fair value with gains and losses arising from changes in fair value recognized in the consolidated statement of income. Reassessment only occurs if there is a change in the terms of the contract that significantly modifies the cash flows that would otherwise be required.
Loans and Receivables
Loans and receivables are non-derivative financial assets with fixed or determinable payments that are not quoted in an active market. Such financial assets are carried at amortized cost using the effective interest method. This method uses an effective interest rate that discounts estimated future cash receipts through the expected life of the financial asset to the net carrying amount of the financial asset. Gains or losses are recognized in the consolidated statement of income when the loans and receivables are derecognized or impaired, as well as when these are amortized. Interest earned or incurred is recorded in “Interest and other financial income” or “Interest and

- 23 -
*SGVMC213786*
other financial charges” account, respectively, in the consolidated statement of income. Assets in this category are included in the current assets except for assets with maturities beyond 12 months from the reporting date, which are classified as noncurrent assets.
HTM Investments
Nonderivative financial assets with fixed or determinable payments and fixed maturities are classified as HTM when the Company has the positive intention and ability to hold these assets to maturity. After initial measurement, HTM investments are measured at amortized cost using the effective interest method. Gains or losses are recognized in the consolidated statement of income. Assets in this category are included in the current assets except for maturities beyond 12 months from the reporting date, which are classified as noncurrent assets. The Company has no HTM investments as at December 31, 2010 and 2009.
AFS Financial Assets
AFS financial assets are non-derivative financial assets that are designated as AFS or are not classified in any of the three foregoing categories. They are purchased and held indefinitely and may be sold in response to requirements or changes in market conditions. After initial measurement, AFS financial assets are measured at fair value with unrealized gains or losses recognized in other comprehensive income until the investment is derecognized, at which time the cumulative gain or loss recorded in other comprehensive income is recognized in the consolidated statement of income, or determined to be impaired, at which time the cumulative loss recorded in other comprehensive income is recognized in the consolidated statement of income. Interest earned on holding AFS debt securities are included under “Interest and other financial income” account in the consolidated statement of income. Dividends earned on holding AFS equity are recognized in the consolidated statement of income under “Interest and other financial income” account when the right of the payment has been established. These are included under noncurrent assets unless there is an intention to dispose of the investment within 12 months from the reporting date.
Financial Liabilities
Initial Recognition
Financial liabilities are classified as financial liabilities at FVPL, other financial liabilities, or as derivatives designated as hedging instruments in an effective hedge, as appropriate. The classification of the financial liability is determined at initial recognition.
Financial liabilities are recognized initially at fair value inclusive of directly attributable transaction costs, except for financial liabilities at FVPL.
The Company’s financial liabilities include notes payable, interest-bearing long-term financial liabilities, trade payables and accrued expenses (excluding output VAT, accrued taxes and leases), customers’ deposits, customers’ refund, other noncurrent liabilities and derivatives that are not accounted for as accounting hedges.

- 24 -
*SGVMC213786*
Subsequent Measurement
The subsequent measurement of financial liabilities depends on their classification as follows:
Financial Liabilities at FVPL
Financial liabilities at FVPL include financial liabilities held-for-trading and financial liabilities designated upon initial recognition as at FVPL. Financial liabilities are classified as held-for-trading if they are incurred for the purpose of repurchasing in the near term. Derivative liabilities, including separated embedded liabilities are also classified as held-for-trading unless they are designated as effective hedging instruments. Financial liabilities at FVPL are carried in the consolidated statement of financial position at fair value with gains or losses recognized in the consolidated statement of income under “Interest and other financial income” or “Interest and other financial charges” account, respectively. Interest incurred on financial liabilities at FVPL is recognized in the consolidated statement of income under “Interest and other financial charges” account.
Financial liabilities may be designated at initial recognition as at FVPL, if any of the following criteria are met: (i) the designation eliminates or significantly reduces the inconsistent treatment that would otherwise arise from measuring the liabilities or recognizing gains or losses on them on a different bases; (ii) the financial liabilities are part of a group which are managed and their performance are evaluated on a fair value basis, in accordance with a documented risk management strategy; or (iii) the financial liabilities contain one or more embedded derivatives that would need to be recorded separately. The Company does not have financial liabilities designated as at FVPL as at December 31, 2010 and 2009.
Other Financial Liabilities
After initial recognition, other financial liabilities are subsequently measured at amortized cost using the effective interest method.
Gains and losses are recognized in the consolidated statement of income when the liabilities are derecognized as when these are amortized. Amortized cost is calculated by taking into account any discount or premium on acquisition and fees or costs that are integral part of the effective interest rate. The effective interest amortization is included either under “Interest and other financial charges” or “Interest and other financial income” account in the consolidated statement of income.
Derivative Financial Instruments
Initial Recognition and Subsequent Measurement
The Parent Company has separated embedded foreign currency forwards and currency options while Rockwell Land has foreign currency contracts, which are derivative financial instruments used to hedge risks associated with foreign currency fluctuations.
Derivative instruments, including separated embedded derivatives, are initially recognized at fair value on the date at which a derivative transaction is entered into or separated, and are subsequently re-measured at fair value. Changes in fair value of derivative instruments, other than those accounted for as effective hedges, are recognized immediately in the consolidated statement of income. Changes in fair value of derivative instruments accounted as effective hedges are

- 25 -
*SGVMC213786*
recognized in other comprehensive income. Derivatives are carried as assets when the fair value is positive and as liabilities when the fair value is negative.
An embedded derivative is separated from the hybrid or combined contract if all the following conditions are met: (a) the economic characteristics and risks of the embedded derivative are not clearly and closely related to the economic characteristics and risks of the host contract; (b) a separate instrument with the same terms as the embedded derivative would meet the definition of a derivative; and (c) the hybrid instrument is not recognized as at FVPL.
Subsequent reassessment is prohibited unless there is a change in the terms of the contract that significantly modifies the cash flows that otherwise would be required under the contract. An entity determines whether a modification to cash flows is significant by considering the extent to which the expected future cash flows associated with the embedded derivative, the host contract or both have changed.
The fair values of freestanding currency forward transactions of Rockwell Land are calculated by reference to current forward exchange rates for contracts with similar maturity profiles.
See Note 31 – Financial Assets and Liabilities.
Offsetting of Financial Instruments
Financial assets and liabilities are offset and the net amount is reported in the consolidated statement of financial position if, and only if, there is currently enforceable legal right to offset the recognized amounts and there is an intention to settle on a net basis, or to realize the assets and settle the liabilities simultaneously.
Fair Value of Financial Instruments
The fair value of investments that are actively traded in organized financial markets is determined by reference to quoted market bid prices at the close of business at the transaction or reporting date. When current bid and asking prices are not available, the price of the most recent transaction provides evidence of the current fair value as long as there has not been a significant change in economic circumstances since the time of the transaction.
For investments where there is no active market, fair value is determined using valuation techniques. Such techniques include use of recent arm’s-length market transactions, reference to the current market value of another instrument which is substantially the same, discounted cash flow analysis and other pricing models.
Amortized Cost of Financial Instruments
Amortized cost is computed using the effective interest method less any allowance for impairment and principal repayment, plus or minus the cumulative amortization of premium or discount. The calculation takes into account any premium or discount on acquisition and includes transaction costs and fees that are an integral part of effective interest.
‘Day 1’ Profit or Loss
Where the transaction price in a non-active market is different from the fair value of other observable current market transactions in the same instrument or based on a valuation technique whose variables include only data from observable market, the Company recognizes the difference

- 26 -
*SGVMC213786*
between the transaction price and fair value (a ‘Day 1’ profit or loss) in the consolidated statement of income, unless it qualifies for recognition as some other type of asset or liability. In cases where data used are not observable, the difference between the transaction price and model value is only recognized in the consolidated statement of income when the inputs become observable or when the instrument is derecognized. For each transaction, the Company determines the appropriate method of recognizing the ‘Day 1’ profit or loss amount.
Impairment of Financial Assets
The Company assesses at each reporting date whether a financial asset or group of financial assets is impaired. A financial asset or a group of financial assets is deemed to be impaired if, and only if, there is objective evidence of impairment as a result of one or more events that has occurred after the initial recognition of the asset (an incurred “loss event”) and that loss event has an impact on the estimated future cash flows of the financial asset or the group of financial assets that can be reliably estimated. Evidence of impairment may include indications that the debtor or a group of debtors is experiencing significant financial difficulty, default or delinquency in interest or principal payments, the probability that they will enter bankruptcy or other financial reorganization and where observable data indicate that there is a measurable decrease in the estimated future cash flows, such as changes in arrears or economic conditions that correlate with defaults.
Financial Assets Carried at Amortized Cost
For financial assets carried at amortized cost, the Company first assesses whether objective evidence of impairment exists individually. If it is determined that no objective evidence of impairment exists for an individually assessed financial asset, whether significant or not, the asset is included in a group of financial assets with similar credit risk characteristics and that group of financial assets is collectively assessed for impairment based on historical loss experience. Assets that are individually assessed for impairment and for which an impairment loss is or continues to be recognized are not included in a collective assessment of impairment. The Parent Company and CEDC consider termination or disconnection of service and significant financial difficulties of debtors as objective evidence that a financial asset or group of financial assets is impaired. For Rockwell Land, consideration is given to breach of contract, such as default or delinquency in interest or principal payments as objective evidence that a financial asset or group of financial assets is impaired. For both specific and collective assessments, any deposits, collateral and credit enhancement are considered in determining the amount of impairment loss.
If there is objective evidence that an impairment loss has been incurred, the amount of the loss is measured as the difference between the asset’s carrying amount and the present value of estimated future cash flows (excluding future credit losses that have not been incurred) discounted at the financial asset’s original effective interest rate (i.e., the effective interest rate computed at initial recognition). If a loan is subject to variable interest rate, the discount rate for measuring any impairment loss is the current effective interest rate. The carrying amount of the asset is reduced either directly or through the use of an allowance account and the amount of the loss is recognized in the consolidated statement of income. Interest income continues to be accrued on the reduced carrying amount based on the original effective interest rate of the asset. The financial asset together with associated allowance are written off when there is no realistic prospect of future recovery and all collateral or deposits has been realized or has been transferred to the Company.
If, in a subsequent period, the amount of the estimated impairment loss increases or decreases because of an event occurring after the impairment was recognized, the previously recognized impairment loss is increased or reduced by adjusting the allowance account. If an asset written off

- 27 -
*SGVMC213786*
is recovered, the recovery is recognized in the consolidated statement of income. Any reversal of an impairment loss is recognized in the consolidated statement of income, to the extent that the carrying value of the asset does not exceed its amortized cost at the reversal date.
AFS Financial Assets
In the case of equity investments classified as AFS, objective evidence would include a significant or prolonged decline in the fair value of the investment below its cost. When a decline in the fair value of an AFS financial asset has been recognized in other comprehensive income and there is objective evidence that the asset is impaired, the cumulative loss that had been recognized in other comprehensive income is reclassified from equity to profit or loss even though the financial asset has not been derecognized. The amount of the cumulative loss that is reclassified from equity to profit or loss is the difference between the acquisition cost (net of any principal repayment and amortization) and current fair value, less any impairment loss on the financial asset previously recognized in profit or loss. Impairment losses recognized in profit or loss for an investment in an equity instrument are not reversed in the consolidated statement of income. Subsequent increases in fair value after impairment are recognized directly in other comprehensive income.
In the case of debt instruments classified as AFS, impairment is assessed based on the same criteria as financial assets carried at amortized cost. Future interest income is based on the reduced carrying amount and is accrued based on the rate of interest used to discount future cash flows for the purpose of measuring impairment loss. Such accrual is recorded as part of “Interest and other financial income” in the consolidated statement of income. If, in a subsequent period, the fair value of a debt instrument increases and the increase can be objectively related to an event occurring after the impairment loss was recognized in the consolidated statement of income, the impairment loss is reversed in the consolidated statement of income.
Assets Carried at Cost
If there is objective evidence that an impairment loss has been incurred on an unquoted equity instrument that is not carried at fair value because its fair value cannot be reliably measured, or on a derivative asset that is linked to and must be settled by delivery of such an unquoted equity instrument, the amount of the loss is measured as the difference between the asset’s carrying amount and the present value of estimated future cash flows discounted at the current market rate of return for a similar financial asset.
Derecognition of Financial Instruments
Financial Assets
A financial asset (or where applicable, a part of a financial asset or part of a group of similar financial assets) is derecognized when:
§ the right to receive cash flows from the asset has expired;
§ the Company has transferred its right to receive cash flows from the asset or has assumed an obligation to receive cash flows in full without material delay to a third party under a “pass-through” arrangement; and
§ either the Company (a) has transferred substantially all the risks and rewards of the asset, or (b) has neither transferred nor retained substantially all the risks and rewards of the asset, but has transferred control of the asset.
- 28 -
*SGVMC213786*
Where the Company has transferred its right to receive cash flows from an asset or has entered into a “pass-through” arrangement, and has neither transferred nor retained substantially all the risks and rewards of the asset nor transferred control of the asset, a new asset is recognized to the extent of the Company’s continuing involvement in the asset.
Continuing involvement that takes the form of a guarantee over the transferred asset is measured at the lower of original carrying amount of the asset and the maximum amount of consideration that the Company could be required to repay.
Financial Liabilities
A financial liability is derecognized when the obligation under the liability is discharged or cancelled or has expired.
Where an existing financial liability is replaced by another from the same lender on substantially different terms, or the terms of an existing liability are substantially modified, such an exchange or modification is treated as a derecognition of the original liability and the recognition of a new liability, and the difference in the carrying amount of a financial liability extinguished or transferred to another party and the consideration paid, including any non-cash assets transferred or liabilities assumed is recognized in the consolidated statement of income.
Redeemable Preferred Stock
The Company’s peso-denominated redeemable preferred stock exhibits characteristics of a liability and is thus recognized as such liability in the consolidated statement of financial position. The corresponding dividends on those shares are recognized as part of “Interest and other financial charges” account in the consolidated statement of income.
Provisions
Provisions are recognized when the Company has a present obligation, legal or constructive, as a result of a past event, and when it is probable that an outflow of resources embodying economic benefits will be required to settle the obligation and a reliable estimate can be made of the amount of the obligation. Where the Company expects a provision, or a portion, to be reimbursed, for example under an insurance contract, the reimbursement is recognized as a separate asset but only when the reimbursement is virtually certain. The expense relating to any provision is presented in the consolidated statement of income, net of any reimbursement. If the effect of the time value of money is material, provisions are discounted using a current pre-tax rate that reflects, where appropriate, the risks specific to the liabilities. Where discounting is used, the increase in the provision due to the passage of time is recognized as part of “Interest and other financial charges” account.
Pension and Other Post-Employment Benefits
MERALCO and substantially all of its subsidiaries have distinct, funded, noncontributory defined benefit retirement plans covering all permanent employees. MERALCO has a pension plan covering employees hired up to 2003, which provides for post-retirement benefits. Also, MIESCOR has a defined contribution retirement plan in addition to its noncontributory defined benefit plan.
- 29 -
*SGVMC213786*
The costs of providing benefits under the distinct defined benefit plans are determined using the projected unit credit actuarial valuation method. This method reflects services rendered by employees to the date of valuation and incorporates assumptions concerning employees’ projected salaries. Retirement costs include current service cost, interest costs, return on plan assets plus amortizations of past service cost, experience adjustments and changes in actuarial assumptions. Past service cost is recognized as an expense on a straight-line basis over the average period until the benefits become vested. If the benefits vest immediately following the introduction of, or changes to a pension plan, past service cost is recognized immediately. Actuarial gains and losses are recognized as income or expense when the net cumulative unrecognized actuarial gains and losses at the end of the previous reporting year exceeded 10% of the higher of the defined benefit obligation and the fair value of plan assets at that date. These gains or losses are recognized over the expected average remaining working lives of the employees participating in the plan.
The defined benefit liability (or asset) is the aggregate of the present value of the defined benefit obligation and any actuarial gains not yet recognized reduced by past service cost and actuarial losses not yet recognized and the fair value of plan assets out of which the obligations are to be settled directly. Plan assets are assets that are held by a long-term employee benefit fund. Fair value is based on market price information, and the published bid price in the case of quoted securities. The amount of any defined benefit asset recognized is restricted to the sum of any past service cost and actuarial gains or losses not yet recognized and the present value of any economic benefits available in the form of refunds from the plan or reductions in the future contributions to the plan.
MIESCOR records expenses based on its contribution to the defined contribution plan as the employee renders service to MIESCOR.
Share-based Payment Transactions
MERALCO has an employee share-based payment plan covering its employees, active and retired, to purchase fixed number of shares of stock at a stated price. The plan features include vesting requirements and payment terms.
The cost of equity-settled transactions with employees is measured by reference to the fair value on the date at which the options are granted. The fair value is determined using the Black-Scholes Option Pricing Model. In valuing equity-settled transactions, no account is taken of any performance conditions other than market conditions.
The cost of equity-settled transactions is recognized, together with a corresponding increase in equity, over the period in which the performance and/or service conditions are fulfilled, ending on the date at which the relevant employees become fully entitled to the award (‘the vesting date’). The cumulative expense recognized for equity-settled transactions at each reporting date until the vesting date reflects the extent to which the vesting period has expired and MERALCO’s best estimate of the number of equity instruments that will ultimately vest. The profit or loss charge or credit for a year represents the movement in cumulative expense recognized as at the beginning and end of the reporting year.
No expense is recognized for awards that do not ultimately vest.
When the terms of the equity-settled awards are modified and the modification increases the fair value of the equity instruments granted, as measured immediately before and after the modification, the entity shall include the incremental fair value granted in the measurement of the amount recognized for services received as consideration for the equity instrument granted. The

- 30 -
*SGVMC213786*
incremental fair value granted is the difference between the fair value of the modified equity instrument and that of the original equity instrument, both estimated as at the date of the modification. If the modification occurs during the vesting period, the incremental fair value granted is included in the measurement of the amount recognized for services received over the period from the modification date until the date when the modified equity instruments vest, in addition to the amount based on the grant due date fair value of the original equity instruments, which is recognized over the remainder of the original vesting period. If the modification occurs after vesting date, the incremental fair value granted is recognized immediately or over the vesting period if the employee is required to complete an additional period of service before becoming unconditionally entitled to those modified equity instruments.
The dilutive effect of outstanding awards is reflected as additional share dilution in the computation of earnings per share.
Long-term Incentive Plan
Liability arising from the long-term incentive plan is determined using the projected unit credit actuarial valuation method.
The liability relating to the long-term incentive plan comprises the present value of the defined benefit obligation at the end of the reporting date.
Revenue Recognition
Revenues are stated at amounts invoiced to customers, net of discounts, rebates, VAT and duty, where applicable. Revenue is recognized to the extent that it is probable that the economic benefits will flow to the Company, the revenue can be reliably measured. In addition, collectibility is reasonably assured and the delivery of the goods or rendering of the service has occurred. The Company assesses its revenue arrangements against specific criteria in order to determine if it is acting as principal or agent, The Company concluded that it is acting as principal in all of its revenue arrangements. The following specific recognition criteria must also be met before revenue is recognized:
Sale of Electricity
Revenues are recognized upon supply of power to the customers. The Uniform Filing Requirements or UFR, on the rate unbundling released by the ERC on October 30, 2001 specified the following bill components: (a) generation charge, (b) transmission charge, (c) system loss charge, (d) distribution charge, (e) supply charge, (f) metering charge, (g) Currency Exchange Rate Adjustment or CERA I and II and (h) inter-class and lifeline subsidies. Value added and local franchise taxes, the Power Act Reduction (for residential customers) and the universal charges are also separately presented in the customer’s billing statement. Value added and local franchise taxes and universal charges, which are billed and merely collected on behalf of the national and local governments, do not form part of the Company’s revenues.
Sale of Real Estate
Sale of real estate, which includes the sale of the land and condominium units, is generally accounted for using the full accrual method. The percentage-of-completion method is used to recognize income from sale of projects including condominium units where the Company has material obligations under the sales contract to complete the projects after the properties are sold.

- 31 -
*SGVMC213786*
Under this method, revenue is recognized as the related obligations are fulfilled, measured principally on the basis of the estimated completion of a physical proportion of the contract work.
The Company accounts for cash received as “Deposits from condominium units pre-sold” when the construction is not beyond a preliminary stage. Construction is not beyond a preliminary stage if engineering and design work, execution of construction contracts, site clearance and preparation, excavation, and completion of the building foundation are incomplete. Proceeds shall be accounted for as deposits until the criteria for revenue recognition under percentage-of-completion method are met. Collections received in excess of receivables recognized under the percentage-of-completion method are shown separately as part of “Trade payables and accrued expenses” account in the consolidated statement of financial position.
Cost of condominium units sold before completion of the project is determined based on actual costs and project estimates of building contractors and technical staff.
Sale of Services
Revenues from construction contracts are recognized and measured using the percentage-of-completion method of accounting for the physical portion of the contract work, determined based on the actual costs incurred in relation to the total estimated costs of the contract. Revenue from contracts to manage, supervise, or coordinate construction activity for others and contracts where materials and services are supplied by project owners are recognized only to the extent of the contracted fees.
Contract costs principally include subcontracted costs related to contract performance. Expected losses on contracts are recognized immediately when it is probable that the total contract costs will exceed total contract revenues. The amount of such loss is determined irrespective of whether or not work has commenced on the contract; the stage of completion of contract activity; or the amount of profits expected to arise on other contracts which are not treated as a single construction contract. Changes in contract performance, contract conditions and estimated profitability, including those arising from contract penalty provisions, and final contract settlements, which may result in revisions to estimated costs and gross margins are recognized in the year in which the changes are determined.
Service fees are recognized when the services are rendered.
Consulting fees are recognized when services are rendered.
Interest Income
Revenue is recognized as interest accrues, using the effective interest rate, which is the rate that discounts estimated future cash receipts through the expected life of the financial instrument.
Dividends
Revenue is recognized when the Company’s right to receive the payment is established.
Lease Income
Lease income is generated from investment properties, poles, condominium units held for lease and retail outlets as part of the Company’s mall operations. Lease contracts are with third parties and are accounted for on a straight-line basis over the lease terms.

- 32 -
*SGVMC213786*
Lease income is included under “Revenues – Sale of services and others” in the consolidated statement of income.
Leases
The determination of whether an arrangement is, or contains a lease is based on the substance of the arrangement at the inception date of whether the fulfillment of the arrangement is dependent on the use of a specific asset or the arrangement conveys a right to use the asset.
Company as Lessee
Operating lease payments are recognized as expense in the consolidated statement of income on a straight-line basis over the lease term.
Company as Lessor
Leases where the Company does not transfer substantially all the risk and benefits of ownership of the asset are classified as operating lease. Initial direct cost incurred in negotiating an operating lease are added to the carrying amount of the leased asset and recognized over the lease term on the same basis as rental income. Contingent rents are recognized as revenue in the period in which they are earned.
Foreign Currency-Denominated Transactions and Translations
The consolidated financial statements are presented in Philippine peso, which is also the Parent Company’s functional and presentation currency. The Philippine peso is the currency of the primary economic environment in which the Parent Company operates. This is also the currency that mainly influences the revenue from and cost of rendering services. Each entity in the Company determines it own functional currency and items included in the financial statements of each entity are measured using that functional currency.
The functional and presentation currency of the entities under the Company (except LOIL) is the Philippine peso.
The functional currency of LOIL is the United States or U.S. dollar.
Transactions in foreign currencies are initially recorded in the functional currency rate prevailing at the date of the transaction. Monetary assets and liabilities denominated in foreign currencies are re-translated at the functional closing rate of exchange prevailing at the end of the reporting date. All differences are recognized in the consolidated statement of income except for foreign exchange differences that relate to capitalizable borrowing costs on qualifying assets. Nonmonetary items that are measured in terms of historical cost in foreign currency are translated using the exchange rate as at the date of the initial transactions.
As at the reporting date, the monetary assets and liabilities of an associate, whose functional currency is other than Philippine peso, are translated into Philippine peso at the rate of exchange prevailing at the end of the reporting period, and income and expenses of an associate are translated monthly using the weighted average exchange rate for the month. The exchange differences arising on translation are recognized as a separate component of other comprehensive income as cumulative translation adjustments. On disposal of the associate, the amount of cumulative translation adjustments recognized in other comprehensive income is recognized in the consolidated statement of income.

- 33 -
*SGVMC213786*
Income Taxes
Current Income Tax
Current income tax assets and liabilities for the current and prior periods are measured at the amount expected to be recovered from or paid to the taxation authority. The tax rates and tax laws used to compute the amount are those that are enacted or substantively enacted as at the reporting date.
Deferred Income Tax
Deferred income tax is provided using the balance sheet liability method on all temporary differences at the reporting date between the income tax bases of assets and liabilities and their carrying amounts for financial reporting purposes.
Deferred income tax liabilities are recognized for all taxable temporary differences, except:
§ where the deferred income tax liability arises from the initial recognition of goodwill or of an asset or liability in a transaction that is not a business combination and, at the time of the transaction, affects neither the accounting profit nor taxable profit or loss; and
§ in respect of taxable temporary differences associated with investments in associates and joint ventures, where the timing of the reversal of the temporary differences can be controlled and it is probable that the temporary differences will not reverse in the foreseeable future.
Deferred income tax assets are recognized for all deductible temporary differences to the extent that it is probable that taxable profit will be available against which the deductible temporary differences can be utilized except:
§ when the deferred income tax asset relating to the deductible temporary difference arises from the initial recognition of an asset or liability in a transaction that is not a business combination and, at the time of the transaction, affects neither the accounting profit nor taxable profit or loss; and
§ in respect of deductible temporary differences associated with investments in subsidiaries, associates and joint ventures, deferred tax assets are recognized only to the extent that it is probable that the temporary differences will reverse in the foreseeable future and taxable profit will be available against which the temporary differences can be utilized.
The carrying amount of deferred income tax assets is reviewed at each reporting date and reduced to the extent that it is no longer probable that sufficient taxable profit will be available to allow all or part of the deferred income tax assets to be utilized. Unrecognized deferred tax assets are reassessed at each reporting date and are recognized to the extent these have become probable that future taxable profit will allow the deferred tax assets to be recovered.
Deferred income tax assets and liabilities are measured at the tax rate that are expected to apply in the year when the asset is realized or the liability is settled, based on tax rates (and tax laws) that have been enacted or substantively enacted as at the reporting date.
Deferred income tax assets and deferred income tax liabilities are offset, if a legally enforceable right exists to offset deferred income tax assets against deferred income tax liabilities and the deferred taxes relate to the same taxable entity and the same taxation authority.

- 34 -
*SGVMC213786*
Deferred income tax items are recognized in correlation to the underlying transaction either in other comprehensive income or directly in equity.
Earnings per Share
Basic earnings per share is calculated by dividing the net income for the year attributable to equity holders of the Parent Company by the weighted average number of common shares outstanding during the year.
Diluted earnings per share is calculated by dividing the net income for the year attributable to equity holders of the parent by the weighted average number of shares outstanding, adjusted for the effects of all dilutive potential common shares.
Contingencies
Contingent liabilities are not recognized in the consolidated financial statements. These are disclosed in the notes to consolidated financial statements unless the possibility of an outflow of resources embodying economic benefits is remote. Contingent assets are not recognized unless the realization of the assets is virtually certain. These are disclosed in the notes to consolidated financial statements when an inflow of economic benefits is probable.
Events After the Reporting Date
Post year-end events that provide additional information about the Company’s financial position at the reporting date (adjusting events) are reflected in the consolidated financial statements. Post reporting date events that are not adjusting events are disclosed in the notes to consolidated financial statements, when material.
Equity
Common stock is measured at par value for all shares issued. Incremental costs incurred directly attributable to the issuance of new shares are shown as a deduction from equity, net of any related tax benefit. Amount of proceeds and/or fair value of consideration received in excess of par value are/is recognized as additional paid-in capital.
Share-based payments represent the cumulative compensation expense recognized based on the Company’s share-based payment plan.
Change in the ownership interest of a subsidiary, without loss of control, is accounted for as an equity transaction and presented as “Excess of acquisition cost over carrying value of non-controlling interest acquired”.
Other comprehensive income comprises items of income and expense, including reclassification adjustments, that are not recognized in profit or loss as required or permitted by PFRS.
Non-controlling interests represent the equity interests in Rockwell Land, CEDC and MIESCOR and its subsidiaries, which are not held by the Parent Company.

- 35 -
*SGVMC213786*
6. Management’s Use of Judgments, Estimates and Assumptions
The preparation of the Company’s consolidated financial statements requires management to make judgments, estimates and assumptions that affect the reported amounts of revenues, expenses, assets and liabilities, and the disclosure of contingent assets and liabilities, at the end of the reporting period. However, uncertainty about these assumptions and estimates could result in outcomes that require a material adjustment to the carrying amount of the asset or liability affected in future periods.
Judgments
In the process of applying the Company’s accounting policies, management has made the following judgments, which have the most significant effect on the amounts recognized in the consolidated financial statements.
Determination of Functional Currency
The functional currencies of the entities under the MERALCO Group are the currencies of the primary economic environment in which each entity operates. It is the currency that mainly influences the revenue and cost of rendering services.
Based on the economic substance of the underlying circumstances, the functional and presentation currency of MERALCO and its subsidiaries, except LOIL, is the Philippine peso. The functional and presentation currency of LOIL is the U.S. dollar.
Operating Lease Commitments
As Lessor
As a lessor, the Company has several lease arrangements. Based on the terms and conditions of the arrangement, the Company has evaluated that the significant risks and rewards of ownership of such properties are retained by the Company. None of the lease agreement transfer ownership of the assets to the lessee at the end of the lease term and do not give the lessee a bargain purchase option over the assets. Consequently, the lease agreements are accounted for as operating leases.
As Lessee
As a lessee, the Company has commercial lease arrangement covering certain office spaces, payment offices, substation sites and towers, and transmission lines. The Company has determined, based on the evaluation of the terms and conditions of the arrangement, that it has not acquired any significant risks and rewards of ownership of such properties because the lease arrangements do not transfer to the Company the ownership over the assets at the end of the lease term and do not provide the Company with a bargain purchase option over the leased assets. Consequently, the lease agreements are accounted for as operating leases.
Arrangement that Contains a Lease
The Company’s purchased power agreements or PPAs and transmission line agreements or TLAs, with Independent Power Producers, or IPPs, qualify as leases on the basis that the Company and the IPPs have take or pay arrangements where payments for purchased power are made on the basis of the availability of the power plant and not on actual consumption. In determining the lease classification, it is judged that substantially all the risks and rewards incident to the ownership of the IPPs’ power plants are with the IPPs. Thus, the PPAs and TLAs are classified as

- 36 -
*SGVMC213786*
operating leases. Accordingly, capacity fees, fixed operating fees and transmission line fees that form part of purchased power expense, are accounted for similar to a lease.
Components of purchased power expense, which have been accounted for similar to a lease amounted to P=19,960 million, P=20,900 million and P=21,592 million in 2010, 2009 and 2008, respectively. This is recognized as “Purchased power” account in the consolidated statement of income.
See Note 28 – Revenues and Purchased Power.
Contingencies
The Company has possible claims from or obligation to other parties from past events and whose existence may only be confirmed by the occurrence or non-occurrence of one or more uncertain future events not wholly within the control of the Company. Management has determined that the present obligations with respect to contingent liabilities and claims with respect to contingent assets do not meet the recognition criteria, and therefore has not recorded any such amounts.
See Note 33 – Contingencies.
Estimates and Assumptions
The key assumptions concerning the future and other key sources of estimation uncertainty as at the reporting date that have a significant risk of causing a material adjustment to the carrying amounts of assets and liabilities within the next financial year are discussed in the following:
Estimating Useful Lives of Utility Plant and Others and Investment Properties
The Company estimates the useful lives of utility plant and others as well as investment properties based on the periods over which such assets are expected to be available for use. The estimate of the useful lives of the utility plant and others and investment properties is based on management’s collective assessment of industry practice, internal technical evaluation and experience with similar assets. The estimated useful lives of the utility plant and others as well as investment properties are reviewed at least at each financial year-end and are updated if expectations differ from previous estimates due to physical wear and tear, technical or commercial obsolescence and legal or other limitations on the use of such assets. It is possible, however, that future results of operations could be materially affected by changes in estimates brought about by changes in the factors mentioned in the foregoing. The amounts and timing of recorded expenses for any period would be affected by changes in these factors and circumstances. A reduction in the estimated useful lives of the Company’s utility plant and others and investment properties would increase recorded operating expenses and decrease noncurrent assets.
The total depreciation and amortization of utility plant and others amounted to P=5,958 million, P=4,882 million and P=4,305 million for the years ended December 31, 2010, 2009 and 2008, respectively. Total carrying values of utility plant and others, net of accumulated depreciation and amortization amounted to P=101,009 million and P=98,231 million as at December 31, 2010 and 2009, respectively.
Total depreciation for investment properties amounted to P=219 million, P=163 million, and P=121 million for the years ended December 31, 2010, 2009 and 2008, respectively. Total carrying value of investment properties, net of accumulated depreciation and amortization amounted to P=8,037 million and P=8,021 million as at December 31, 2010 and 2009, respectively.
See Note 8 – Utility Plant and Others and Note 11 – Investment Properties.

- 37 -
*SGVMC213786*
Impairment of Nonfinancial Assets
PFRS requires that an impairment review be performed when certain impairment indicators are present. These conditions include obsolescence, physical damage, significant changes in the manner by which an asset is used, worse than expected economic performance, drop in revenues or other external indicators, among others. In the case of goodwill, at a minimum, such asset is subject to an annual impairment test and more frequently whenever there is an indication that such asset may be impaired. This requires an estimation of the value in use of the cash-generating units to which the goodwill is allocated. Estimating the value in use requires preparation of an estimate of the expected future cash flows from the cash-generating unit and choosing a suitable discount rate in order to calculate the present value of those cash flows.
Determining the recoverable amount of utility plant and others, construction in progress, investment properties, investments in associates and a joint venture, deferred pass-through fuel costs, goodwill and other noncurrent assets, requires (i) the determination of future cash flows expected to be generated from the continued use as well as ultimate disposition of such assets and (ii) making estimates and assumptions that can materially affect the consolidated financial statements. Future events could cause management to conclude that utility plant and others, construction in progress, investment properties, investments in associates and a joint venture, deferred pass-through fuel costs and other noncurrent assets are impaired. Any resulting impairment loss could have a material adverse impact on the Company’s consolidated financial position and results of operations.
The preparation of estimated future cash flows involves significant estimations and assumptions. While management believes that the assumptions are appropriate and reasonable, significant changes in the assumptions may materially affect the assessment of recoverable values and may lead to future impairment charges under PFRS.
The carrying values of noncurrent assets subject to impairment review are as follows:
2010 2009 (Amounts in Millions)
Utility plant and others - net P=101,009 P=98,231 Construction in progress 2,241 3,627 Investment properties - net 8,037 8,021 Deferred pass-through fuel costs 1,222 3,161 Investments in associates and a joint venture 321 1,203 Pass through VAT - net 3,024 3,651 Deferred input VAT 1,006 816 Receivable from the Bureau of Internal Revenue, or BIR 577 577 Intangible assets 513 255 Goodwill 36 36
See Note 8 – Utility Plant and Others, Note 9 – Construction in Progress, Note 10 – Investments in Associates and a Joint Venture, Note 11 – Investment Properties, Note 12 – Deferred Pass-Through Fuel Costs and Note 13 – Other Noncurrent Assets.

- 38 -
*SGVMC213786*
Goodwill
The Company’s consolidated financial statements and results of operations reflect acquired businesses after the completion of the respective acquisition. The Company accounts for the acquisition of businesses using the acquisition method of accounting, which requires extensive use of accounting judgments and estimates to allocate the purchase price to the fair market values of the acquiree’s identifiable assets and liabilities and contingent liabilities, if any, at the acquisition date. Any excess in the purchase price over the estimated fair market values of the net assets acquired is recorded as goodwill in the Company’s consolidated statement of financial position. Thus, the number of items, which involve judgments made in estimating the fair market value to be assigned to the acquiree’s assets and liabilities can materially affect the Company’s results of operations.
Realizability of Deferred Tax Assets
The Company reviews the carrying amounts of deferred tax assets at the end of each reporting period and reduces these to the extent that it is no longer probable that sufficient taxable income will be available to allow all or part of the deferred income tax assets to be utilized. Assessment on the recognition of deferred income tax assets on deductible temporary differences is based on the level and timing of forecasted taxable income for the subsequent reporting periods. This forecast is based on past results and future expectations on revenues and expenses as well as future tax planning strategies. Management believes that sufficient taxable profit will be generated to allow all or part of the deferred tax assets to be utilized. The amounts of the deferred tax assets considered realizable could be adjusted in the future if estimates of taxable income are revised.
Based on the foregoing assessment, following are the relevant consolidated information with respect to deferred tax assets:
2010 2009 (Amounts in Millions)
Recognized deferred tax assets P=7,991 P=7,531 Unrecognized deferred tax assets 12 12
See Note 32 – Income and Franchise Taxes.
Determination of Fair Values of Financial Assets and Liabilities
Where fair value of financial assets and financial liabilities recorded in the consolidated statement of financial position cannot be derived from active markets, they are determined using valuation techniques including the discounted cash flows model. The inputs to these models are taken from observable markets where possible, but when this is not feasible, a degree of judgment is required in establishing fair values. The judgments include considerations of inputs such as liquidity risk, credit risk and volatility. Changes in assumptions about these factors could affect the reported fair value of financial instruments.
Total fair values of financial assets and liabilities as at December 31, 2010 amounted to P=54,630 million and P=81,075 million, respectively, while the total fair values of financial assets and liabilities as at December 31, 2009 amounted to P=45,673 million and P=82,304 million, respectively.
See Note 31 – Financial Assets and Liabilities.

- 39 -
*SGVMC213786*
Estimating Allowance for Doubtful Accounts
If there is objective evidence that an impairment loss has been incurred in the Company’s trade and other receivables, an estimate of the allowance for doubtful accounts related to trade and other receivables that are specifically identified as doubtful of collection is made. The amount of allowance is evaluated by management on the basis of factors that affect the collectibility of the accounts. In these cases, use of judgment based on the best available facts and circumstances, including but not limited to, the length of the Company’s relationship with the customer and the customer’s credit status based on third party credit reports and known market factors, to record specific reserves for customers against amounts due in order to reduce the Company’s receivables to amounts that the Company expect to collect is applied. These specific reserves are reevaluated and adjusted as additional information received affect the amounts estimated.
In addition to specific allowance against individually significant receivables, an assessment for collective impairment allowance against credit exposures of the customers, which were grouped based on common credit characteristic, although not specifically identified as requiring a specific allowance, have a greater risk of default than when the receivables were originally granted to customers is done. This collective allowance is based on historical loss experience using various factors, such as historical performance of the customers within the collective group, deterioration in the markets in which the customers operate, and identified structural weaknesses or deterioration in the cash flows of customers.
Total asset impairment provision for trade and other receivables recognized in the consolidated statement of income amounted to P=982 million, P=886 million and P=1,566 million for the years ended December 31, 2010, 2009 and 2008, respectively. Trade and other receivables, net of asset impairment, amounted to P=25,609 million and P=21,600 million as at December 31, 2010 and 2009, respectively.
See Note 15 – Trade and Other Receivables and Note 29 – Expenses and Income.
Estimating Net Realizable Value of Inventories and Materials and Supplies
Inventories consist of condominium units for sale and, materials and supplies used in the power distribution and services segments of the Company. The excess of cost over net realizable value relating to inventories consists of collective and specific provisions. The cost of inventories is written down whenever the net realizable value of inventories becomes lower than the cost due to damage, physical deterioration, obsolescence, change in price levels or other causes. The lower of cost or net realizable value of inventories is reviewed on a periodic basis. Inventory items identified to be obsolete and unusable are written-off and charged as expense in the consolidated statement of income.
The carrying values of inventories amounted to P=2,043 million and P=1,857 million as at December 31, 2010 and 2009, respectively.
See Note 16 –Inventories.
Estimation of Pension Benefit Costs and Other Retirement Benefits
The cost of defined benefit plans and present value of the pension obligation are actuarially determined. Actuarial valuation includes making various assumptions, which includes discount rates, expected rates of return on plan assets, rates of compensation increases and mortality rates. Actual results that differ from the Company’s assumptions are recognized as income or expense

- 40 -
*SGVMC213786*
when the net cumulative unrecognized actuarial gains and losses at the end of the previous reporting period exceed 10% of the higher of the defined benefit obligation and the fair value of plan assets at that date. Due to complexity of valuation, the underlying assumptions and its long-term nature, a defined benefit obligation is highly sensitive to changes in assumptions. While management believes that the assumptions are reasonable and appropriate, significant differences in the actual experience or significant changes in the assumptions may materially affect cost for pension and other retirement obligations. All assumptions are reviewed at each reporting date.
Total consolidated pension benefit costs amounted to P=1,767 million, P=1,887 million and P=1,889 million for the years ended December 31, 2010, 2009 and 2008, respectively. Unrecognized net actuarial losses as at December 31, 2010 amounted to P=1,521 million while net actuarial gains as at December 31, 2009 amounted to P=1,362 million. Except for Rockwell Land, pension liability as at December 31, 2010 and 2009 amounted to P=8,227 million and P=10,301 million, respectively. The net pension asset of Rockwell Land as at December 31, 2010 and 2009 amounted to P=50 million and P=66 million, respectively.
See Note 29 – Expenses and Income and Note 30 – Long-term Employee Benefits.
Share-based Payment Transactions
The Company’s Employee Stock Purchase Plan, or ESPP, grants qualified participants the right to purchase common shares of the Company at a grant price. The ESPP recognizes the services received from the eligible employees and an equivalent adjustment to the equity account over the vesting period. The Company measures the cost of equity-settled transactions with the participants by reference to the fair value of the equity instrument at the date when such right to purchase is granted. Estimating the fair value requires the determination of the most appropriate valuation model for a grant of equity instrument depending on the terms and conditions of the grant. This also requires determining the most appropriate inputs to the valuation model and making certain assumptions. The estimates and assumptions are described in Note 20 – Share-based Payment Plan and include, among other things, annual stock volatility, risk-free interest rate, dividends yield, and the remaining life of options. While management believes that the estimates and assumptions used are reasonable and appropriate, significant differences in the Company’s actual experience or significant changes in the estimates and assumptions may materially affect the stock compensation costs charged to operations.
The amounts recognized as stock compensation for the years ended December 31, 2010, 2009 and 2008, with a corresponding charge to the equity account are P=174 million, P=301 million and P=116 million, respectively. As at December 31, 2010 and 2009, the balances of employee share-based payment plan amount in the equity section of the consolidated statement of financial position amounted to P=743 million and P=569 million, respectively.
See Note 20 – Share-based Payment Plan and Note 29 – Expenses and Income.
Insurance Liabilities Arising from Insurance Contracts
RSIC makes estimates of the expected ultimate costs of claims reported and claims incurred but not yet reported at reporting date. It takes a significant period of time to establish with certainty the ultimate cost of claims.

- 41 -
*SGVMC213786*
The primary technique adopted by RSIC’s management in estimating the cost of claims incurred but not yet reported is using the past claims settlement trend to predict the future claims settlement trend. At each reporting date, prior year claims estimates are reassessed for adequacy and any changes are charged to provisions. Insurance contract liabilities are not discounted for the time value of money.
As at December 31, 2010 and 2009, gross carrying values of insurance liabilities arising from insurance contracts (included in “Other noncurrent liabilities” account) amounted to P=293 million and P=409 million, respectively.
Provision for Asset Retirement Obligations
Provision for asset retirement obligations are recognized in the period in which they are incurred if a reasonable estimate of fair value can be made. This requires an estimation of the cost to restore or dismantle on a per square meter basis, depending on the location, and is based on the best estimate of the expenditure required to settle the obligation at the future restoration/dismantlement date, discounted using a pre-tax rate that reflects the current market assessment of the time value of money and, where appropriate, the risk specific to the liability.
No asset retirement obligation was recognized since the amount is immaterial.
Revenue Recognition
The Company’s revenue recognition policies require the use of estimates and assumptions that may affect the reported amounts of the Company’s revenues and receivables.
Revenues from sale of electricity by the Parent Company and CEDC are billed based on different billing cycles with different cycle cut-off dates, while take-up of related power purchase cost in the accounts is based on calendar month. The recognition of unbilled revenues for billing cycles that have earlier than month-end cut-off dates requires the use of estimates.
The difference between the amount initially recognized and the actual settlement or actual billing is taken up in the subsequent period. Management believes that such use of estimates will not result in material adjustments in future periods.
Revenues from real estate transactions of Rockwell Land and construction contracts of MIESCOR are recognized based on the percentage of completion method. This is measured principally on the basis of the estimated completion of a physical proportion of the contract work as determined from the reports of the contractors and project consultants. There is no assurance that such use of estimates may not result in material adjustments in future periods.
7. Segment Information
Each operating segment of the Company engages in business activities from which revenues are earned and expenses are incurred (including revenue and expenses relating to transactions with other business segments within the Company). The operating results of each of the operating segments are regularly reviewed by the Company’s chief operating decision-maker to make decisions about how resources are to be allocated to the operating segments and to assess their performances, and for which discrete financial information is available.
- 42 -
*SGVMC213786*
For management purposes, the Company’s operating businesses are organized and managed separately according to the nature of services provided, with each segment representing a strategic business unit that offers different products and/or services, as follows:
• Power — The power segment is involved in the distribution and supply of electricity covering franchise areas in the Luzon islands representing 54% of the requirements of the country. This is primarily provided by MERALCO and CEDC, the latter covering the Clark Economic Zone.
• Real Estate — This segment, which is provided by Rockwell Land, is involved in luxury residential and commercial real estate development and leasing.
• Services and others — The services segment is involved principally in engineering, construction and consulting services, e-transaction services, insurance and power generation. These services are provided by MIESCOR, MBI, Landbees and Miescorrail (collectively known as “MIESCOR Group”), MEI, eMVI, RSIC, LOIL, Finserve, CIS, CIS Bayad Center and OTC (collectively known as “CIS Group”) and MPG.
The chief operating decision-maker or management monitors the operating results of each business unit separately for the purpose of making decisions about resource allocation and performance assessment. Performance is evaluated based on net income for the year, earnings before interest, taxes and depreciation and amortization, or EBITDA; EBITDA margin; and core net income. Net income for the year is measured consistent with consolidated net income in the consolidated financial statements.
EBITDA is measured as net income excluding depreciation and amortization, impairment of noncurrent assets, financing costs, carrying charges, interest and other financial income, equity in net earnings of associates and a joint venture, foreign exchange gains (losses) - net, gains (losses) on derivative financial instruments - net, provision for (benefit from) income tax and other non-recurring gains (losses) - net, if any.
Core net income for the year is measured as net income attributable to equity holders of the Parent Company adjusted for foreign exchange gains or losses, gains or losses on derivative financial instruments, asset impairment on noncurrent assets, one time approvals of carrying charges of ERC-approved under or over-recoveries, and other non-recurring gains or losses, net of tax effect of the foregoing adjustments.
Transfer prices between operating segments are set on an arm’s-length basis in a manner similar to transactions with third parties. Segment revenues, segment expenses and segment results include transfers among business segments. Those transfers are eliminated in the consolidation.
The Company mainly operates and generates substantially its revenues from the Philippines (i.e., one geographical location). Thus, geographical segment information is not presented. The Company has no revenues from transactions with a single external customer accounting for 10% or more of the Company’s revenues from external customers.

- 43 -
*SGVMC213786*
Power Real Estate Services Inter-segment Transactions Total Note 2010 2009 2008 2010 2009 2008 2010 2009 2008 2010 2009 2008 2010 2009 2008 (Amounts in Millions)
Revenues P=239,164 P=178,752 P=187,063 P=3,375 P=2,877 P=2,213 P=4,597 P=3,703 P=3,056 (P=1,675) (P=782) (P=557) P=245,461 P=184,550 P=191,775
Segment results 20,367 13,347 16,375 331 365 36 1,596 1,340 1,167 – – – 22,294 15,052 17,578 Depreciation and amortization (5,796) (4,745) (4,294) (167) (150) (88) (291) (169) (44) 35 – – (6,219) (5,064) (4,426) Provisions (4,118) (2,172) (6,935) – – – – – – – – – (4,118) (2,172) (6,935) Interest and other financial income 29 2,017 3,852 2,476 580 332 429 128 77 306 (35) (15) (292) 2,690 4,246 2,919 Equity in net earnings of associates
and a joint venture 10 1,012 953 910 – – – – – – (729) (708) (711) 283 245 199 Interest and other financial charges 29 (310) (3,243) (3,825) (155) (117) (53) (29) (21) (37) 1 53 (220) (493) (3,328) (4,135) Provision for income tax - net (3,729) (2,111) (1,526) (145) (143) (144) (446) (368) (397) – – – (4,320) (2,623) (2,067) Non-controlling interests – – – – – – – – – (432) (351) (333) (432) (351) (333) Net income attributable to equity
holders of the Parent P=9,443 P=5,881 P=3,181 P=444 P=287 P=180 P=958 P=859 P=995 P=9,685 P=6,005 P=2,800

- 44 -
*SGVMC213786*
The following table shows the reconciliation of the consolidated EBITDA to consolidated net income:
2010 2009 (Amounts in Millions)
Consolidated EBITDA P=18,452 P=13,169 Depreciation and amortization (6,219) (5,064) Interest and other financial expenses (493) (3,328) Equity in net earnings of associates and a joint venture 283 245 Present value impact on customers’ refund (225) (555) Foreign exchange gains - net (51) 266 Interest and other income 2,690 4,246 Consolidated income before income tax 14,437 8,979 Provision for income tax (4,320) (2,623) Consolidated net income for the year P=10,117 P=6,356
The following table shows the reconciliation of the consolidated core net income to the consolidated net income:
2010 2009 (Amounts in Millions)
Consolidated core net income for the year P=12,155 P=7,003 Add (deduct) non-core items, net of tax: Approved pass-through charges and related costs (3,903) (1,241) Reversal of interest on bill deposits 1,219 – Gain on return of an investment 248 – Foreign exchange gain (loss) - net (36) 186 Mark-to market gain 2 57 Net income for the year attributable to equity holders
of the Parent 9,685 6,005 Net income for the year attributable to non-controlling
interest 432 351 Consolidated net income for the year P=10,117 P=6,356

- 45 -
*SGVMC213786*
8. Utility Plant and Others
The movements of utility plant and others as at December 31, 2010 and 2009 are as follows:
2010
Notes Subtransmission and Distribution Land
Buildings and Improvements
Communication Equipment
Office Furniture, Fixtures and
Other Equipment
Transportation Equipment Others Total
(Amounts in Millions) Cost: Balance at beginning of year P=117,752 P=15,001 P=4,727 P=5,647 P=4,974 P=1,922 P=2,336 P=152,359 Transfers from construction in progress 9 6,594 – 239 398 – – 27 7,258 Additions 1,556 20 34 34 545 453 129 2,771 Disposals/retirements (4,747) – – (1) (1,182) (65) (1) (5,996) Transfer to investment properties 11 – (151) – – – – – (151) Reclassification and others 57 – (39) (185) (26) 15 177 (1) Balance at end of year 121,212 14,870 4,961 5,893 4,311 2,325 2,668 156,240 Less accumulated depreciation and amortization: Balance at beginning of year 42,244 – 1,802 3,882 3,758 1,105 1,337 54,128 Charge for the year 4,649 – 121 426 482 157 123 5,958 Disposals/retirements (3,645) – – (1) (1,182) (52) (1) (4,881) Reclassification and others 105 – (9) (212) 17 216 (91) 26 Balance at end of year 43,353 – 1,914 4,095 3,075 1,426 1,368 55,231 Net book value P=77,859 P=14,870 P=3,047 P=1,798 P=1,236 P=899 P=1,300 P=101,009
2009
Notes Subtransmission and Distribution Land
Buildings and Improvements
Communication Equipment
Office Furniture, Fixtures and
Other Equipment
Transportation Equipment Others Total
(Amounts in Millions) Cost: Balance at beginning of year P=112,102 P=15,622 P=4,511 P=5,334 P=4,669 P=1,956 P=2,119 P=146,313 Transfers from construction in progress 9 6,597 – 145 417 316 126 243 7,844 Additions 35 – 2 12 56 44 38 187 Disposals/retirements (1,766) – – (132) (53) (199) (24) (2,174) Transfer to investment properties 11 – (621) – – – – – (621) Transfer from investment properties 11 17 – 27 – – – – 44 Reclassification and others 767 – 42 16 (14) (5) (40) 766 Balance at end of year 117,752 15,001 4,727 5,647 4,974 1,922 2,336 152,359 Less accumulated depreciation and amortization: Balance at beginning of year 40,044 – 1,695 3,280 3,498 1,087 1,005 50,609 Charge for the year 3,746 – 112 457 347 42 178 4,882 Disposals/retirements (1,466) – – (132) (52) (99) (23) (1,772) Reclassification and others (80) – (5) 277 (35) 75 177 409 Balance at end of year 42,244 – 1,802 3,882 3,758 1,105 1,337 54,128 Net book value P=75,508 P=15,001 P=2,925 P=1,765 P=1,216 P=817 P=999 P=98,231

- 46 -
*SGVMC213786*
A significant portion of the Company’s utility plant and others are purchased from foreign suppliers. Such transactions are concluded in currencies other than the Philippine peso, principally the U.S. dollar. The Company records the liabilities in Philippine peso using the exchange rate at the date of the transaction. The outstanding amount of foreign currency-denominated liabilities is restated at each reporting date. See Note 26 – Trade Payables and Accrued Expenses and Note 31 – Financial Assets and Liabilities.
9. Construction in Progress
The movements of construction in progress are as follows:
Notes 2010 2009
(Amounts in Millions)
Balance at beginning of year P=3,627 P=5,002 Net additions 5,872 7,914 Transfers to utility plant and others 8 (7,258) (7,844) Transfer to investment properties 11 – (1,445) Balance at end of year P=2,241 P=3,627
The construction in progress pertains to electric capital projects, or ECPs and non-electric capital projects, or NEPs. ECPs are capital projects involving construction of new facilities and the upgrade and major rehabilitation of existing electrical facilities. In 2010, major ECPs under construction in progress consist of 115kV subtransmission lines (Zapote-Legaspi-Kamagong and Balintawak-Sta. Mesa) and one 34.5kV distribution line (Ternate-TMC2 Tie-line). NEPs relate to construction of non-network structures and/or major renovation of existing non-network facilities.
Total interest capitalized and included in the “Construction in progress” account amounted to P=119 million and P=98 million as of December 31, 2010 and 2009, respectively.
The average annual range of interest rates of interest used for capitalization in 2010 and 2009 ranged from 7.6% to 8.6% and 8.6% to 8.8%, respectively.
10. Investments in Associates and a Joint Venture
This account consists of:
Country of Percentage of Ownership
2010 2009 Incorporation Principal Activities Direct Indirect Direct Indirect Associates Bauang Private Power
Corporation or BPPC Philippines Power Generation 38 – – 40 General Electric Philippines
Meter and Instrument Company, Inc. or GEPMICI
Philippines
Sale of metering products
and services 35 – 35 – First Private Power
Corporation or FPPC Philippines Power Generation – – 40 –

- 47 -
*SGVMC213786*
Country of Percentage of Ownership
2010 2009 Incorporation Principal Activities Direct Indirect Direct Indirect Joint Venture Indra Philippines Philippines Management and
information technology, or IT, consultancy 50 – 50 –
The movements in the investments in associates and a joint venture account follow:
2010 2009 (Amounts in Millions)
Acquisition costs: Balance at beginning of year P=459 P=465 Return of capital (397) (6) Balance at end of year 62 459 Accumulated equity in net earnings: Balance at beginning of year 60 782 Equity in net earnings for the year 283 245 Dividends received (96) (445) Adjustments – (657) Depreciation on share in revaluation increment – 129 Return of capital – 6 Balance at end of year 247 60 Share in cumulative translation adjustment
of an associate: Balance at beginning of year 684 2 Movements (672) 682 Balance at end of year 12 684 P=321 P=1,203
Investment in FPPC
FPPC was organized in October 1992 to engage in the power generation business. In response to the Philippine Government’s then program to fast track stabilization of the power industry, FPPC incorporated BPPC and constructed the 195-MW Bauang generating plant, or Bauang plant, under a Build-Operate-Transfer, or BOT Agreement, sponsored by the NPC.
In accordance with the BOT Agreement signed in 1993, FPPC the 215 MW Bauang plant and operated the same under a 15-year Cooperation Period up to July 25, 2010.
On July 26, 2010, FPPC/BPPC turned-over the Bauang Plant to NPC without any compensation and free of any liens. Hence. FPPC/BPPC has been winding down operations.
Consistent with its limited administrative activities, the BODs of FPPC and BPPC approved the merger of the two entities with BPPC as the surviving entity. The merger resulted in a 2% dilution of the Parent Company’s interest in BPPC.

- 48 -
*SGVMC213786*
Investment in GEPMICI
GEPMICI was established in 1979, with the General Electric Company or GE Company of U.S.A., to serve the Philippine market for ANSI-type Watt-hour meters.
Investment in Indra Philippines
Indra Philippines is an IT service provider in the country and in the Asia Pacific region, with a wide range of services across various industries. Indra Philippines supports MERALCO’s information technology requirements in the area of system development, outsourcing of IS and IT operations and management consulting.
See Note 27 – Related Party Transactions for details of transactions.
The carrying values of investments in associates and a joint venture follow:
2010 2009 (Amounts in Millions)
Indra Philippines P=174 P=151 BPPC 89 – GEPMICI 58 63 FPPC – 989 P=321 P=1,203
The condensed financial information of BPPC (for 2010) FPPC (for 2009), GEPMICI and Indra Philippines follow:
2010 2009
BPPC GEPMICI Indra
Philippines BPPC GEPMICI Indra
Philippines
(Amounts in Millions)
Current assets P=251 P=205 P=554 P=2,686 P=199 P=472 Noncurrent assets – 22 128 2,242 13 134 Current liabilities (15) (61) (324) (193) (31) (284) Noncurrent liabilities – – (10) (2,264) – (20) Net assets P=236 P=166 P=348 P=2,471 P=181 P=302
2010 2009 2008
BPPC GEPMICI Indra
Philippines FPPC GEPMICI Indra
Philippines FPPC GEPMICI Indra
Philippines
(Amounts in Millions)
Revenues P=442 P=115 P=948 P=973 P=377 P=922 P=1,210 P=396 P=832 Costs and expenses (451) (100) (888) (436) (335) (834) (786) (359) (778) Net income (loss) (P=9) P=15 P=60 P=537 P=42 P=88 P=424 P=37 P=54

- 49 -
*SGVMC213786*
11. Investment Properties
The movements in investment properties are as follows:
2010
Note Land Buildings and
Improvements Total (Amounts in Millions) Cost: Balance at beginning of year P=3,155 P=6,018 P=9,173 Additions during the year – 110 110 Transfer from utility plant and others 8 151 – 151 Disposal of investment properties (26) – (26) Balance at end of year 3,280 6,128 9,408 Accumulated depreciation: Balance at beginning of year – 1,152 1,152 Charge for the year – 219 219 Balance at end of year – 1,371 1,371 Net book value P=3,280 P=4,757 P=8,037
2009
Note Land Buildings and Improvements Total
(Amounts in Millions) Cost: Balance at beginning of year P=2,551 P=3,943 P=6,494 Additions during the year – 662 662 Transfer from utility plant and others 8 621 – 621 Transfer to utility plant and others 8 (17) (27) (44) Transfer from construction in progress 9 – 1,445 1,445 Transfer to land and development costs – (5) (5) Balance at end of year 3,155 6,018 9,173 Accumulated depreciation: Balance at beginning of year – 989 989 Charge for the year – 163 163 Balance at end of year – 1,152 1,152 Net book value P=3,155 P=4,866 P=8,021
Investment properties are stated at cost. These consist of real properties held for capital appreciation, future or previous substation sites, and real properties, mainly the Rockwell Power Plant Mall at Rockwell Center, Makati City and BPO buildings at the MERALCO compound, which are being leased to related and third parties.
Charges for leases to related and third parties are made at market rates. Lease income (included as part of “Revenues - sale of contracts, services and others”) earned from investment properties amounted to P=633 million, P=566 million and P=542 million in 2010, 2009 and 2008, respectively. Direct operating expenses incurred for investment properties that generated income amounted to P=267 million, P=231 million and P=357 million in 2010, 2009 and 2008, respectively.
As at December 31, 2010 and 2009, unamortized borrowing costs capitalized as part of investments properties amounted to P=261 million and P=270 million, respectively.

- 50 -
*SGVMC213786*
The aggregate fair value of the Company’s investment properties are as follows:
2010 2009 (Amounts in Millions)
Rockwell Power Plant Mall P=5,947 P=5,159 BPO building 2,408 2,247 Land where Rockwell-Meralco BPO Venture and
“The Strip” are located 2,026 1,689 Other investment properties held for lease 2,073 1,797
As at December 31, 2010 and 2009, the Rockwell Power Plant Mall was partially used as collateral for Rockwell Land’s long-term interest bearing financial liabilities.
The fair values of investment properties as at December 31, 2010 were determined by independent professionally qualified appraisers, namely, Asian Appraisal Company, Inc. for the Parent Company and Vitale Valuation Services, Inc. for Rockwell Land. The fair values represent the amount at which the assets could be exchanged between a knowledgeable, willing buyer and a knowledgeable, willing seller in an arm’s-length transaction at the date of valuation.
12. Deferred Pass-through Fuel Costs
Deferred pass-through fuel costs represent amounts paid for the quantity and the cost of natural gas that was contracted for but not yet consumed by the Parent Company’s major IPPs, namely, FGPC and FGP collectively referred to as “First Gas.” See Notes 26 – Trade Payables and Accrued Expenses, Note 27 – Related Party Transactions and Note 33 – Contingencies. Any unconsumed gas is the result of lower dispatch of the First Gas plants vis-a-vis their stipulated capacity factors.
In 2005, First Gas billed the Parent Company for 44 million giga-joules in gross calorific value representing unconsumed gas for the years 2002 to 2004. The Parent Company’s obligations to pay for unconsumed gas were deferred until the resolution of the dispute between First Gas and the Gas Sellers (Shell Philippines Exploration B.V., Shell Philippines LLC, Texaco Philippines, Inc., and PNOC Exploration Corporation) under the Gas Sale and Purchase Agreements or GSPA. FGP and FGPC each have a distinct GSPA with the Gas Sellers for the supply of natural gas in connection with the operations of the power plants. The GSPAs with FGPC and FGC expire on August 25, 2025 and September 25, 2007, respectively.
Under the GSPAs, FGP and FGPC are each obligated to consume (or pay for, if not consumed) a minimum quantity of gas for each contract year (which runs from December 26 of a particular year up to December 25 of the immediately succeeding year), called the Take-or-Pay Quantity or TOPQ. Thus, if the TOPQ is not consumed within a particular contract year, FGP and FGPC will incur an “annual deficiency” for that contract year equivalent to the total volume of unused gas. FGP and FGPC are required to make payments to the Gas Sellers for such annual deficiency after the end of the contract year. After paying for annual deficiency, First Gas can, subject to the terms of the GSPA, “make-up” such annual deficiency by consuming the unused-but-paid-for gas (without further charge) within 10-contract years after the contract year for which the annual deficiency was incurred, in the order that it arose.

- 51 -
*SGVMC213786*
On December 29, 2006, the Gas Sellers issued the Annual Reconciliation Statements or ARS, of FGP and FGPC for contract year 2006. The Gas Sellers then claimed annual deficiency payments amounting to $3.9 million for FGP and $5.4 million for FGPC. Both FGP and FGPC disagreed that such Annual Deficiency payments are due and each claimed for among others, relief due to events of force majeure or EFM that affected the San Lorenzo and Santa Rita plants, respectively. FGP’s and FGPC’s position is that the power plants actually consumed more than their respective TOPQs and are entitled to make-up its outstanding balance of annual deficiency.
Pursuant to the terms of the GSPAs, the dispute on the foregoing matter was subjected to arbitration in Hong Kong, SAR under the International Chamber of Commerce or ICC Rules of Arbitration, whereby a Partial Final Award was rendered on August 11, 2009. The Tribunal determined that the transmission-related events claimed by FGP and FGPC constitute EFM under the GSPAs. The Tribunal was not persuaded, however, that the government-related events claimed by FGP and FGPC for contract year 2006 constitute EFM under the GSPAs based on the evidence presented. Any settlement to FGP and FGPC shall be billed MERALCO.
On June 9, 2010, FGP, FGPC, and the Gas Sellers executed a Settlement Agreement or SA to settle the GSPA dispute for Contract Year 2006. On July 29, 2010, MERALCO fully settled the amount of P=104 million ($2.2 million) billed by First Gen.
On September 15, 2010, FGP and FGPC received the Final Award by Consent rendered by the Tribunal on September 13, 2010, incorporating by reference the June 9, 2010 SA, including all exhibits thereto, and forming an inseparable part of the Final Award by Consent, as per FGP, FGPC, and the Gas Sellers, written request dated June 16, 2010 to the Tribunal and ICC.
The liability for unconsumed gas amounting to P=433 million as at December 31, 2009 was already reduced to zero as of December 31, 2010.
See Note 26 – Trade Payables and Accrued Expenses.

- 52 -
*SGVMC213786*
13. Other Noncurrent Assets
This account consists of:
Note 2010 2009 (Amounts in Millions)
Unbilled receivables - net of current portion 15 P=3,063 P=5,406 Pass-through VAT - net 3,024 3,651 Deferred input VAT 1,006 816 SC GRAM case refund 2 780 780 Receivable from BIR 33 577 577 Intangible assets 513 255 AFS investments 31 403 361 Advance payments to suppliers 253 135 Deferred reinsurance premium 214 165 Pension asset 30 50 66 Installment contracts receivable - net of current portion 15 39 54 Goodwill 36 36 Derivative assets - net of current portion
of P=11 million in 2009 18 and 31 – 172 Others - net 381 710 P=10,339 P=13,184
Unbilled Receivables
Unbilled receivables represent unbilled generation and other pass-through costs incurred by the Company. It includes unbilled charges covered by an approved recovery mechanism but is expected to be collected beyond one year. These also include other unbilled generation and pass-through charges of prior years, which are the subject of applications for recovery with the ERC.
Pass-through VAT
Pass-through VAT pertains to VAT on pass-through generation and transmission costs. Remittance of such deferred VAT is based on collection of billed receivables from the customers. The balance represents VAT on unpaid billed receivables, net of amount paid to the Independent Power Producers or IPPs under existing terms and conditions of the contract.
Deferred input VAT
The amount includes portion of input VAT incurred and paid in connection with purchase of capital assets in excess of P=1 million per month. As provided for in RA No. 9337 or “EVAT Law” said portion of input VAT shall be deferred and credited evenly over the estimated useful life of the related capital assets or 60 months, whichever is shorter, against the output VAT due.
SC GRAM Case Refund
The balance represents amount of refund made by the Parent Company to its customers as directed by the SC in response to the Petition of an electricity consumer group that the IRR for the collection by MERALCO of the rate adjustment under the second GRAM that was not published nor was subjected to a public hearing. On November 12, 2010, MERALCO filed an application to recover the amount previously refunded including any additional amount still to be refunded and corresponding carrying charges.
See Note 2 – Rate Regulations for the related discussions.

- 53 -
*SGVMC213786*
Intangible Assets
The movements of intangible assets are as follows:
2010 Software Franchise Total (Amounts in Millions)
Cost: Balance at beginning of year P=274 P=– P=274 Additions during the year 251 49 300 Balance at end of year 525 49 574 Less accumulated amortization: Balance at beginning of year 19 – 19 Amortization for the year 42 – 42 Balance at end of year 61 – 61 Net book value P=464 P=49 P=513
2009 Software Franchise Total (Amounts in Millions)
Cost: Balance at beginning of year P=147 P=– P=147 Additions during the year 127 – 127 Balance at end of year 274 – 274 Less accumulated amortization: Balance at beginning of year – – – Amortization for the year 19 – 19 Balance at end of year 19 – 19 Net book value P=255 P=– P=255
AFS Investments
AFS investments consist mainly of proprietary club shares, which are stated in their fair market values:
2010 2009 (Amounts in Millions)
Rockwell Leisure Club, Inc. P=267 P=242 Manila Golf and Country Club, Inc. 53 46 Wack-Wack Golf Club, Inc. 24 19 Others 59 54 P=403 P=361

- 54 -
*SGVMC213786*
14. Cash and Cash Equivalents
This account consists of:
2010 2009 (Amounts in Millions)
Cash on hand and in banks P=3,631 P=6,399 Cash equivalents 20,739 10,669 P=24,370 P=17,068
Cash in banks earns interest at prevailing bank deposit rates. Cash equivalents are temporary cash investments, which are made for varying periods up to three months depending on the Company’s immediate cash requirements, and earn interest at the prevailing short-term investment rates.
15. Trade and Other Receivables
This account consists of:
Notes 2010 2009
(Amounts in Millions)
Trade: Electricity: Billed P=17,776 P=15,362 Unbilled 2 and 13 5,011 5,537 Current portion of installment contracts
receivable 13 2,183 367 Service contracts and others 1,326 1,278 Nontrade 27 1,014 1,378 27,310 23,922 Less allowance for doubtful accounts 1,701 2,322 P=25,609 P=21,600
Billed receivables from sale of electricity of the Parent Company and CEDC consist of the following:
2010 2009 (Amounts in Millions)
Residential P=6,007 P=5,338 Commercial 8,058 6,988 Industrial 3,300 2,584 Flat streetlights 411 452 17,776 15,362 Less allowance for doubtful accounts 1,518 2,088 P=16,258 P=13,274

- 55 -
*SGVMC213786*
Movements of allowance for doubtful accounts for trade and other receivables are as follows:
2010
Balance at Beginning
of Year Provisions (see Note 29)
Recoveries (see Note 29) Write-offs
Balance at End
of Year (Amounts in Millions)
Billed trade receivables: Commercial P=1,007 P=509 (P=25) (P=633) P=858 Residential 529 412 (232) (348) 361 Industrial 259 100 (4) (298) 57 Flat streetlights 293 105 (4) (152) 242 2,088 1,126 (265) (1,431) 1,518 Other receivables 234 121 – (172) 183 P=2,322 P=1,247 (P=265) (P=1,603) P=1,701
2010
Residential Commercial Industrial Flat
Streetlights Others Total (Amounts in Millions)
Individually impaired P=247 P=73 P=41 P=2 P=– P= 363 Collectively impaired 114 785 16 240 183 1,338 Total P=361 P=858 P=57 P=242 P=183 P=1,701
2009
Balance at Beginning
of Year Provisions
(see Note 29) Recoveries (see Note 29) Write-offs
Balance at End
of Year (Amounts in Millions)
Billed trade receivables: Residential P=774 P=319 (P=84) (P=480) P=529 Commercial 608 478 (8) (71) 1,007 Industrial 267 22 (8) (22) 259 Flat streetlights 278 26 (1) (10) 293 1,927 845 (101) (583) 2,088 Other receivables 92 148 (6) – 234 P=2,019 P=993 (P=107) (P=583) P=2,322
2009
Residential Commercial Industrial Flat
Streetlights Others Total (Amounts in Millions)
Individually impaired P=452 P=303 P=187 P=87 P=185 P=1,214 Collectively impaired 77 704 72 206 49 1,108 Total P=529 P=1,007 P=259 P=293 P=234 P=2,322
Trade Receivables – Electricity
Trade receivables of the Parent Company and CEDC include charges for pass-through costs. Pass-through costs consist of generation and transmission charges, which constitute 67% and 11%, respectively, of the total billed amount in 2010. Billed receivables are generally due 10 days after bill date.
- 56 -
*SGVMC213786*
Unbilled receivables represent electricity consumed after the meter reading cut-off dates, which will be billed to customers in the immediately succeeding billing period. This also includes the current portion of pass-through cost under-recoveries already approved for recovery by the ERC. The Parent Company’s and CEDC’s trade receivables are noninterest-bearing and are substantially secured by bill deposits. See Note 22 – Customers’ Deposits.
Installment Contracts Receivable
Installment contracts receivable represent receivables from sale of condominium units with credit terms ranging from one to five years. As at December 31, 2010 and 2009, the gross undiscounted trade receivables (both recognized and future receivables) from sale of the “Number One Rockwell” or One Rockwell and ”The Grove by Rockwell” or The Grove, condominium projects amounting to P=1,400 million and P=1,100 million, respectively, have been assigned as security for interest-bearing long-term financial liabilities. Under the terms of the assignment, Rockwell Land will deliver all Contracts to Sell and customers’ copies of the Condominium Certificates of Title covered by these receivables to be held in custody by the counterparty until the receivables are paid and/or repurchased by Rockwell Land. Rockwell Land also agreed that the counterparty may at its sole option, assign, sell, transfer or otherwise dispose of, or encumber or create a lien or liability on the receivables in favor of any third party. See Note 21 – Interest Bearing Long-term Financial Liabilities.
Service Contracts and Others
Service contracts receivable arise from contracts entered into by Miescor and subsidiaries, eMVI, RSIC, CIS and Bayad Center for construction, engineering, consulting, insurance underwriting, bill payment collection, tellering, data transport and e-business development services to third parties.
Receivables from service contracts and others are noninterest-bearing and are generally on 30 to 60-day terms.
16. Inventories
2010 2009 (Amounts in Millions) Materials and supplies: At net realizable value P=2,030 P=1,801 At cost 2,088 1,862 Condominium units for sale: At net realizable value 13 56 At cost 13 56 Total inventories at the lower of cost or
net realizable value P=2,043 P=1,857
No significant writedown of inventories and supplies was recognized in December 31, 2010, 2009 and 2008.
See Note 6 – Significant Accounting Judgments and Estimates, and Note 29 – Expenses and Income.

- 57 -
*SGVMC213786*
17. Land and Development Costs
As at December 31, 2010 and 2009, this account represents land and development costs of Rockwell Land, consisting of the following:
Note 2010 2009 (Amounts in Millions)
Land and development costs: 11 At net realizable value P=1,708 P=1,191 At cost 1,717 1,200 Land and development costs at the lower
of cost or net realizable value P=1,708 P=1,191
Development costs pertains to the Edades Tower an Garden Villas Project or Edades, and One Rockwell, residential condominium projects within the Rockwell Center in Makati City and The Grove located in Pasig City.
Total cash received from pre-selling activities for Edades and The Grove projects amounted to P=741 million as of December 31, 2010 and P=343 million as at December 31, 2009, respectively. These are shown under “Deposits from pre-selling of condominium units” account in the consolidated statements of financial position.
18. Other Current Assets
Notes 2010 2009
(Amounts in Millions)
Advances to suppliers P=847 P=1,197 Prepaid expenses 512 497 Creditable withholding tax 172 905 Input VAT 156 177 Current portion of derivative assets 13 and 31 24 11 Others 316 182 P=2,027 P=2,969
Advances to Suppliers
This mainly represents advances made to suppliers and contractors of Rockwell Land for various construction projects.

- 58 -
*SGVMC213786*
19. Equity
Common Stock
The movements of the Company’s common stock as at December 31, 2010 and 2009 are as follows:
Number
of Shares Amount (In Millions)
Authorized - P=10 par value a share 1,250 P=12,500
Issued: Balance as at January 1, 2009 1,104 P=11,038 Issuances 23 235 Balance as at December 31, 2009 1,127 P=11,273
Balance as at January 1, 2010 1,127 P=11,273 Issuances – – Balance as at December 31, 2010 1,127 P=11,273
See Note 20 – Share-based Payment Plan for discussion of common stock issuances.
Unappropriated Retained Earnings
The balance of unappropriated retained earnings as at December 31, 2010 and 2009 include the balance of revaluation increment in utility plant and others and investment properties carried at deemed cost amounting to P=18,375 million and P=19,232 million, respectively. Such amounts are restricted for dividend declaration purposes until they are realized through depreciation or disposal of the related assets.
The following are cash dividends declared on common shares in 2010 and 2009:
Declaration Date Record Date Payment Date Dividend
Per Share Amount (In Millions)
March 22, 2010 April 21, 2010 May 11, 2010 P=3.15 P=3,551 July 26, 2010 August 23, 2010 September 16, 2010 2.50 2,818
December 13, 2010 December 29, 2010 January 17, 2011 1.30 1,465 May 26, 2009 June 9, 2009 June 30, 2009 1.00 1,078
October 29, 2009 November 13, 2009 December 11, 2009 1.50 1,617
The Parent Company pays regular cash dividends equivalent to 50% of core earnings, which may be supplemented by a special dividend determined on a “look-back” basis. Any declaration and payment of a special dividend is dependent on the availability of unrestricted retained earnings and cash. The declaration, record and payment dates shall be consistent with the guidelines of the SEC and the PSE. The foregoing policy was previously approved by the BOD.
On February 28, 2011, the BOD declared cash dividend equivalent to P=2.65 per share to all common stockholders of record as at March 28, 2011 payable on April 20, 2011.

- 59 -
*SGVMC213786*
Appropriated Retained Earnings
As at December 31, 2010, retained earnings of P=6,000 million have been appropriated for planned business expansion of the Parent Company. Plans for business expansion are being developed.
20. Share-based Payment Plan
The Parent Company has an ESPP, which entitles participants to purchase common shares of the Company subject to certain terms and conditions, during a nominated offer period. Following are the salient features of the ESPP:
Participants • Qualified regular employees of the Parent Company and
subsidiaries
• Retirees of the Parent Company Purchase Price • No less than 80% of the weighted average daily closing market
price at the PSE during a 30-day calendar period that ends two weeks before the start of the offer period.
Holding Period • Maximum of three years (as approved by the Board of Administrators or BOA for each offering)
Cancellation • Cancellation option at anytime prior to full payment of the purchase price with refund of net amount paid by the grantee
Movements in the number of option shares outstanding under the ESPP are as follows:
2010 12th 13th 13th A 14th Total Balance as at January 1, 2010 – 1,911,319 407,137 12,416,994 14,735,450 Issued – (362,915) – (6,478) (369,393) Balance as at December 31, 2010 – 1,548,404 407,137 12,410,516 14,366,057
2009 12th 13th 13th A 14th Total Balance as at January 1, 2009 2,789,031 6,978,620 – – 9,767,651 Issued (2,789,031) (5,008,902) – – (7,797,933) Subscriptions during the offer period – – 419,453 12,448,838 12,868,291 Cancelled – (58,399) (12,316) (31,844) (102,559) Balance as at December 31, 2009 – 1,911,319 407,137 12,416,994 14,735,450
The Parent Company allotted a total of 55 million common shares for ESPP awards. As at December 31, 2010, 12 million common shares are available for any future offerings.
The fair value of the offerings was estimated at the dates of the grant using the Black-Scholes Option Pricing Model, which considered annual stock volatility, risk-free interest rate, expected life of the offering, exercise price of P=51.00 to P=74.00 a share for the 13th to the 14th offerings. The expected volatility reflects the assumption that the historical volatility is indicative of future trends, which may not necessarily be the actual outcome.
- 60 -
*SGVMC213786*
Below are the grant dates and inputs to the models used for each of the grants:
12th 13th 13th A 14th Grant dates December 31, 2003 May 31, 2007 January 12, 2009 April 28, 2009 Historical volatility (%) 50.00 52.62 46.77 50.99 Weighted average share price
on grant date (P=) 18.70 62.00 51.00 74.00 Risk-free interest rate (%) 10.28 4.67 5.60 5.77 Expected life of option (years) 3.17 3.17 3.22 3.43
In July 2009, the BOD ratified the resolution of the BOA of the ESPP to shorten the vesting period of the 13th offering from three years to two years. This resulted in the acceleration of the recognition of the cost of the grant. Total expense arising from the share-based payment plan amounted to P=174 million in 2010, P=301 million in 2009 and P=116 million in 2008.
See Note 29 – Expenses and Income. 21. Interest-bearing Long-term Financial Liabilities
This account consists of the following:
2010 2009 (Amounts in Millions) Long-term portion of interest-bearing financial
liabilities: Long-term debt P=15,498 P=16,909 Redeemable preferred stock – 325 15,498 17,234 Current portion of interest-bearing financial
liabilities: Long-term debt 3,654 2,285 Redeemable preferred stock 1,920 1,784 5,574 4,069 P=21,072 P=21,303
The current portion of redeemable preferred shares includes shares which have matured and have been called for redemption by the Company totaling P=1,318 million and P=1,149 million as at December 31, 2010 and 2009, respectively. Interest is no longer accrued on the preferred shares, which has been called for redemption.
The details of interest-bearing financial liabilities are as follows:
Description 2010 2009 (Amounts in Millions) Peso-denominated Debt Parent Company
P=5.0 Billion Fixed Rate Note Facility Agreement P=5,000 P=– P=4.8 Billion Fixed Rate Note Facility Agreement 4,800 –
P=5.0 Billion Note Facility Agreement 2,443 2,715 P=3.0 Billion Term Loan Facility 2,400 3,000 (Forward)

- 61 -
*SGVMC213786*
Description 2010 2009 (Amounts in Millions) P=5.5 Billion Note Facility Agreement: Fixed rate notes P=1,600 P=1,600 Floating rate notes – 3,900 P=12.0 Billion Note Facility Agreement*: Fixed rate notes – 5,127 Loans payable to government entities in quarterly
installments – 1 Rockwell Land P=2.0 Billion Note Facility Agreement 1,579 1,860 Bridge Facilities and Term Loan 1,444 1,060
Euro-denominated Debt Parent Company Availment under the Master Credit Agreement
payable in equal semi-annual installments – 35
CHF-denominated Debt Parent Company Availment under the Master Credit Agreement
payable in equal semi-annual installments – 19 Total long-term debt 19,266 19,317 Less unamortized debt issue costs 114 123 19,152 19,194 Redeemable Preferred Stock 1,920 2,109 21,072 21,303 Less portion maturing within one year 5,574 4,069 Long-term portion of interest-bearing financial
liabilities P=15,498 P=17,234 * Includes value of embedded call option in 2009. See Note 31 – Financial Assets and Liabilities.
The scheduled maturities of the Company’s outstanding long-term debt at nominal values as at December 31, 2010 and 2009 are as follows:
December 31, 2010
Year Peso Debt 2011 P=3,654 2012 1,126 2013 1,000 2014 3,958 2015 97 After 2015 9,431 Total P=19,266

- 62 -
*SGVMC213786*
As at December 31, 2010, all of the interest-bearing long-term financial liabilities are denominated in Philippine peso.
December 31, 2009
Euro Debt Swiss Franc Debt Year Peso Debt In € In P= In CHF In P= Total
(Amounts in Millions)
2010 P=2,230 €0.54 P=35 CHF0.44 P=19 P=2,284 2011 2,233 – – – – 2,233 2012 1,779 – – – – 1,779 2013 4,902 – – – – 4,902 2014 4,718 – – – – 4,718 After 2014 3,315 – – – – 3,315 Total P=19,177 €0.54 P=35 CHF0.44 P=19 P=19,231
Peso-denominated Debt
P=5.0 Billion Fixed Rate Note Facility Agreement
In December 2010, MERALCO entered into a Note Facility Agreement for the issuance of P=23 million, 5-year fixed rate notes with maturity in December 2015 and P=4,977 million, 5.5-year fixed rate notes due in June 2016. The 5-year fixed rate notes are payable at maturity while the 5.5-year fixed rate notes are payable in annual installments of 1% of the original principal amount from 2011 to 2015 with the remaining balance payable in 2016.
P=4.8 Billion Fixed Rate Note Facility Agreement
In November 2010, MERALCO signed a Fixed Rate Note Facility Agreement for the issuance of P=1,997 million, 7-year fixed rate notes and P=2,803 million, 10-year fixed rate notes. The notes were issued on December 2, 2010. The 7-year fixed rate notes are payable in annual installments of 0.5% of the original amount from 2011 to 2016 with the remaining balance payable in 2017. The 10-year fixed rate notes are payable in annual installments of 0.5% of the original amount from 2011 to 2019 with the remaining balance payable in 2020.
P=5.0 Billion Note Facility Agreement
In January 2009, MERALCO entered into a Note Facility Agreement for the issuance of P=2,715 million fixed rate notes with final maturity in January 2014 and P=2,285 million floating rate due in January 2010. The floating rate notes were prepaid in October 2009 while the fixed rate notes are payable in annual installments of 10% of the original principal amount from 2010 to 2013 with the remaining balance payable in 2014.
P=3.0 Billion Term Loan Facility
The P=3,000 million, 5-year bilateral term loan agreement with Unionbank of the Philippines is due in October 2014.
P=5.5 Billion Note Facility Agreement
On December 9, 2009, MERALCO signed a P=5,500 million Note Facility Agreement for the issuance of fixed and floating rate notes. The P=1,600 million fixed rate notes mature in 2014 while the P=3,900 million floating rate notes mature in 2015. The fixed rate notes are payable at maturity while the floating rate notes are payable in annual installments of 3% of the original
- 63 -
*SGVMC213786*
principal amount from 2010 to 2014 with the remaining balance payable in 2015. In December 2010, the Parent Company prepaid the floating rate notes without penalty.
P=12.0 Billion Note Facility Agreement
The P=12,000 million Note Facility Agreement consists of P=6,000 million fixed-rate notes and P=6,000 million floating rate corporate notes. The proceeds were utilized to prepay all of the Parent Company’s secured loans. In December 2009, the Parent Company prepaid the balance of its floating rate notes. The fixed rate notes are payable in 24 quarterly installments until December 2013 inclusive of a one-year grace period. The amortization schedule is back-ended with the first 20 quarterly installments representing 2% of the original principal amount while the last four quarterly installments represent 15% of the original principal amount.
The fixed rate note has an embedded call option (prepayment option), which gives the Parent Company the right to redeem all or a part of any of the outstanding notes at an amount equivalent to 105% of the outstanding principal amount on any interest payment starting at the end of the second year from issue date. The Parent Company prepaid the balance of its fixed rate note in December 2010.
P=2.0 Billion Note Facility Agreement
The P=2.0 billion fixed rate corporate notes were drawn by Rockwell Land from a consortium of local banks and were used to finance the development of the BPO buildings located in the MERALCO compound. The notes consist of two tranches at P=1,000 million each ,P=1,400 million of which is payable in 20 quarterly installments starting August 2009 and the balance of P=600 million is due in August 2014.
On February 2, 2011, Rockwell Land also took a bridge loan from a local bank and preterminated the facility agreement. Accordingly, such loan was classified as current liability in the 2010 consolidated statement of financial position.
See Note 11 – Investment Properties.
Peso Bridge Facilities and Term Loan
As at December 31, 2010, Rockwell Land’s loans from various banks and financial institutions consist of bridge facilities payable in 2011 and a term loan payable in December 2014.
Euro-denominated Debt
The €3.764 million loan was drawn under the Master Credit Agreement with a foreign financial institution to finance the supply and installation of a 115 kV gas-insulated substation at the Central Business Park. The loan was fully paid in November 2010.
CHF-denominated Debt
The CHF3.055 million loan was drawn under the Master Credit Agreement with a foreign financial institution to finance the supply and installation of another 115 kV gas-insulated substation at the Central Business Park. The loan was fully paid in November 2010.

- 64 -
*SGVMC213786*
Fixed Rate Loans
Principal Amount Interest Rate Maturity Date 2010 2009 (Amounts in Millions)
P=5.0 Billion Fixed Rate Note Facility Agreement
5-year and 7-year
PDST-F** plus spread 2016 P=5,000 P=– P=4.8 Billion Fixed Rate Note Facility
Agreement 7-year and 10-year
PDST-F** plus spread 2020 4,800 – P=3.0 Billion Notes 5-year PDST-F plus
spread 2014 2,443 2,715 P=5.5 Billion Notes 5-year PDST-F plus
spread 2014 1,600 1,600 P=12.0 Billion Notes 5-year and 7-year
PDST-F** plus spread 2013* – 5,127 P=2.0 Billion Notes 9% 2014 1,579 1,860 €3.764 Million Availment under the
Master Credit Agreement 9% 2010 – 35 P=200 Million Term Loan 7.2632% 2010 – 149 P=150 Million Term Loan 8.5% 2014 123 148 P=100 Million Term Loan 8.5% 2014 84 – Loans payable to government entities 3.5% 2011 – 1 Total P=15,629 P=11,635 ** The Company prepaid the outstanding balance in December 2010. **Weighted average or interpolated rate.
Floating Rate Loans
Principal Amount Interest Rate Maturity Date 2010 2009 (Amounts in Millions)
P=3.0 Billion Term Loan 6-month PDST-F plus spread 2014 P=2,400 P=3,000
P=5.5 Billion Notes 3-month PDST-F plus spread 2015* – 3,900
Bridge Facilities and Term Loan 1-year PDST-F plus spread, 3-month PDST-F plus spread in 2009 and 3-month PDST-F plus spread;1-year PDST-F plus spread 1,237 763
CHF3.055 Million Availment under the Master Credit Agreement
6-month LIBOR plus spread 2010 – 19
Total P=3,637 P=7,682 * The Company prepaid the outstanding balance in December 2010.
The average annual interest rates for the loans as at December 31, 2010 are as follows:
Fixed Rate Note Floating Rate Note Parent Company 4.00% to 8.79% 4.60% to 5.88% Rockwell Land 8.5% to 8.8% 4.2% to 7.01%

- 65 -
*SGVMC213786*
On December 21, 2010, the Parent Company signed a 7-year, P=2,500 million floating rate Term Loan Agreement with a local bank. The loan was fully drawn on January 10, 2011. Interest rate was at 7-year interpolated PDSTF plus a spread.
Debt Covenants and Security Arrangements
The Parent Company’s loan agreements require compliance with financial ratios such as debt service coverage of 1.2 times calculated at relevant measurement dates.
The Parent Company’s loan agreements also contain restrictions with respect to the creation of liens or encumbrances on assets, issuance of guarantees, mergers or consolidations, disposition of a significant portion of its assets and related party transactions.
As of December 31, 2010, the Parent Company is in compliance with all covenants of the loan agreements.
The interest-bearing financial obligations of Rockwell Land are secured by the assignment of receivables from the sale of One Rockwell and The Grove units and Mortgage Participation Certificates on a Mortgage Trust Indenture and its amendments and supplements over the Rockwell Power Plant Mall.
Unamortized Debt Issuance Costs
Unamortized debt discount, representing debt issuance costs and any difference between the fair value of consideration given or received upon initial recognition, included in the financial liabilities amounted to P=114 million and P=123 million as at December 31, 2010 and 2009, respectively.
The following presents the changes to the unamortized debt issuance costs as at December 31, 2010 and 2009:
Note 2010 2009 (Amounts in Millions) Unamortized debt issuance costs at beginning
of year P=123 P=80 Additions during the year 67 97 Accretions during the year charged to interest
and other financial charges 29 (76) (54) Unamortized debt issuance costs at end of year P=114 P=123
Redeemable Preferred Stock
The movements, in terms of number of shares, of the Company’s redeemable preferred stock are as follows:
2010 2009 Balance at beginning of year 210,928,655 266,364,384 Redemptions (18,964,630) (55,435,729) Balance at end of year 191,964,025 210,928,655
The original “Terms and Conditions” of MERALCO’s Special Stock Subscription Agreement, which require an applicant to subscribe to preferred stock with 10% dividend to cover the cost of such extension or new distribution facilities, has been amended by the Magna Carta and the

- 66 -
*SGVMC213786*
DSOAR effective July 19, 2004 and January 18, 2006, respectively. The amendment sets forth the issuance of preferred stock, only if such instrument is available.
The following table details the total quarterly dividends paid at 10% per annum to preferred shareholders in 2010 and 2009:
Record Date Payment Date Amount
(In Millions)
March 22, 2010 April 30, 2010 P=13 June 28, 2010 July 30, 2010 12
September 27, 2010 October 29, 2010 12 December 29, 2010 January, 29 2011 11
March 31, 2009 April 30, 2009 37 June 30, 2009 July 31, 2009 35
September 30, 2009 October 30, 2009 33 December 31, 2009 January 29, 2010 14
22. Customers’ Deposits
This account consists of:
2010 2009
Current Portion
(see Note 26) Long-term
Portion Total
Current Portion
(see Note 26) Long-term
Portion Total (Amounts in Millions) Meter deposits:
Principal P=1,226 P=– P=1,226 P=744 P=645 P=1,389 Accrued interest 1,175 – 1,175 628 644 1,272
Bill deposits: Principal 541 16,675 17,216 518 15,256 15,774 Accrued interest 137 7,086 7,223 167 8,518 8,685 P=3,079 P=23,761 P=26,840 P=2,057 P=25,063 P=27,120
Meter Deposits
Meter deposit is intended to guarantee the cost of meter installed.
The Magna Carta for residential customers (effective June 17, 2004) and DSOAR (effective January 18, 2006) for non-residential customers exempt all customer groups from payment of meter deposits.
The ERC released Resolution No. 8, Series of 2008, otherwise known as “Rules to Govern the Refund of Meter Deposits to Residential and Non-Residential Customers,” or Rules, which required the refund of meter deposits to be completed not later than 66 months from the effectivity of the said Rules of July 5, 2008. Under the terms of the Resolution No. 8, Series of 2008, a customer has the option of receiving his refund through cash, credit to future monthly billings, or as an offset to other due and demandable claims of the private utility against him.

- 67 -
*SGVMC213786*
The total amount of refund shall be equivalent to the meter deposit paid by the customer plus the total accrued interest earned from the time the customer paid the meter deposit until the day prior to the start of refund.
Interests due on meter deposits are calculated at 6% or 10% depending on when such deposits were paid.
On August 8, 2008, in compliance with ERC Resolution No. 8, the Parent Company submitted to the ERC an accounting of the total meter deposit principal amount for refund which was at P=1,507 million as at June 30, 2008. The actual refund of meter deposits commenced on November 3, 2008.
As at December 31, 2010 and 2009, the Parent Company has refunded P=546 million (inclusive of P=274 million in interests) and P=251 million (inclusive of P=123 million in interests), respectively.
Bill Deposits
Bill deposit serves to guarantee payment of bills by a customer, which based on existing regulation is to equal the value of one month’s consumption or bill of the customer.
As required under the Magna Carta and DSOAR, residential and non-residential customers, respectively, are required to deposit with the DU an amount equivalent to the estimated monthly bill calculated based on applied load, which shall be recognized as bill deposit of the customer. Such deposit shall be adjusted after one year based on the historical 12-month average bill. A customer who has paid his electric bills on or before due date for three consecutive years, may apply for the full refund of the bill deposit, together with the accrued interests, anytime thereafter, prior to the termination of his service. Otherwise, bill deposits and accrued interests shall be refunded within one month from termination of service, provided all bills have been paid and identification requirements have been complied with.
A series of exchanges was initiated by MERALCO with the Energy Regulatory Board or ERB and its successor organization, ERC to seek clarification with respect to the interest rate applicable to the bill deposits of the customers as well as the effectivity dates.
Up to March 31, 2010, the interest rate on bill deposits collected from residential and non-residential customers ranged from 1% to 10% depending on the contract effectivity date. The ERC, on February 22, 2010, promulgated the amended DSOAR, which became effective on April 1, 2010. Under such amended DSOAR, interest on bill deposits for both residential and non-residential customers shall be computed using the equivalent peso savings account interest rate of the Land Bank of the Philippines or Land Bank, or other government banks on the first working day of the year, subject to the approval of the ERC. Based on the foregoing, the interest rate effective April 1, 2010 through December 31, 2010 was 0.75% per annum.
The following are the movements of bill deposits account:
December 31, 2010 Deposits Interest Total Balance as at January 1 P=15,774 P=8,685 P=24,459 Additions 1,857 – 1,857 Reversals – (1,326) (1,326) Payments (415) (136) (551) Balance as at December 31 17,216 7,223 24,439 Less portion maturing within one year 541 137 678 Long-term portion of bill deposits P=16,675 P=7,086 P=23,761

- 68 -
*SGVMC213786*
December 31, 2009 Deposits Interest Total Balance as at January 1 P=14,448 P=7,733 P=22,181 Additions 1,713 1,119 2,832 Payments (387) (167) (554) Balance as at December 31 15,774 8,685 24,459 Less portion maturing within one year 518 167 685 Long-term portion of bill deposits and
interest P=15,256 P=8,518 P=23,774 23. Provisions
Provisions consist of amounts provided for legal and regulatory claims, as well as probable losses and possible refunds on for transmission charge over-recoveries, among others.
Movements in 2010 and 2009 are as follows:
2010 2009
Claims Losses and
Refunds Total Claims Losses and
Refunds Total
(Amounts in Millions)
Balance at beginning of year P=4,978 P=2,514 P=7,492 P=1,645 P=4,098 P=5,743 Provisions 4,636 887 5,523 3,351 3,333 6,684 Reversals – – – – (4,917) (4,917) Settlements (140) – (140) (18) – (18) Balance at end of year P=9,474 P=3,401 P=12,875 P=4,978 P=2,514 P=7,492
See Note 6 – Significant Accounting Judgments and Estimates and Note 33 – Contingencies. 24. Customers’ Refund
This account represents the balance of the unclaimed refund related to the SC decision promulgated on April 30, 2003:
2010 2009 (Amounts in Millions)
Gross refund amounts: Phase I P=361 P=335 Phase II 321 295 Phase III 385 181 Phase IV 6,064 8,561 7,131 9,372 Less present value effect: Balance at beginning of year 225 780 Less interest accretion during the year 225 555 Balance at end of year – 225 P=7,131 P=9,147

- 69 -
*SGVMC213786*
In June 2003, the ERC, in the implementation of the SC decision, ordered MERALCO to refund to its customers an equivalent P=0.167 per kWh for billings covering the period February 1994 to April 2003. The refund was implemented in four phases up to December 2010 as follows:
a. Phase I, covered refunds to residential and general service customers who consumed 100 kWh or less of electricity as at April 2003 (or in their last complete month’s bill for services whose contracts with the Parent Company have been terminated), from June 2003 to August 2003.
b. Phase II, covered refunds to residential and general service customers who consumed 101 to 300 kWh as at April 2003 (or in their last complete month’s bill for services whose contracts with the Parent Company have been terminated), from September 2003 to February 2004.
c. Phase III, covered refunds to residential and general service customers who consumed more than 300 kWh of electricity as at April 2003, was implemented by the Parent Company over a period of 12 months starting January 2004.
d. Phase IV, covered refunds to commercial and industrial customers and all government accounts and other customers not covered by Phases I–III. There are two sub-phases for Phase IV, based on the kWh consumption, which were implemented by the Parent Company from July 2005 until December 2010.
Based on the ERC order, the Parent Company shall complete payment of all refund claims by December 31, 2010. In an order dated February 7, 2011, the ERC approved the Parent Company’s proposal for the extension of the SC refund process for five years up to December 31, 2015, in view of difficulties encountered by (i) the customers in meeting the necessary documentation requirements for approval and payment of the refund and (ii) the Parent Company in contacting or locating customers entitled to the refund.
25. Notes Payable
Notes payable represent unsecured, peso-denominated, interest-bearing working capital loans obtained from various local financial institutions maturing within a year or less. Annual interest rates ranged from 8.5% to 11% in 2010 and 4.00% to 9.50% in 2009.
Interest expense on notes payable amounted to P=26 million, P=170 million and P=595 million in 2010, 2009 and 2008, respectively. See Note 29 – Expenses and Income.
26. Trade Payables and Accrued Expenses
This account consists of the following:
Note 2010 2009
(Amounts in Millions)
Trade accounts payable 27 P=15,538 P=16,943 Output VAT - net 2,435 2,238 Accrued expenses: Taxes 1,387 770 Interest 21 487 430 Liability for GSL payout 446 124
(Forward)

- 70 -
*SGVMC213786*
Note 2010 2009
(Amounts in Millions)
Current portions of: Meter deposits 22 P=1,226 P=744 Interest on meter deposits 22 1,175 628 Bill deposits 22 541 518 Security deposit 192 191 Interest on bill deposits 22 137 167 Deferred lease income 27 62 Retentions payable 23 96 Derivative liability 31 1 28 CERA I and II overrecoveries and carrying charges – 983 Liability arising from deferred pass-through fuel costs 12 – 433 Dividends payable on: Common stock 19 1,672 26 Redeemable preferred stock 284 288 Accrued employee benefits 1,300 739 Advances for construction 774 163 Accrued development costs 525 276 Regulatory fees 318 199 Reinsurance liability 225 122 Accrued universal charges 219 425 Excess collections over recognized receivables 185 – Transmission backbillings 131 132 Government grants 106 35 Other current liabilities 1,784 1,501 P=31,138 P=28,261
Trade Accounts Payable
Trade accounts payable mainly represent obligations to power suppliers, namely, NPC, NGCP (effective January 15, 2009), TransCo (for transmission costs up to January 14, 2009) Philippine Electricity Market Corporation or PEMC, FGPC and FGP, Quezon Power (Philippines) Limited Company or QPPL, Philippine Power Development Corporation and Montalban Methane Power Corporation or MMPC for costs of power purchased. In addition, this account includes liabilities due to local and foreign suppliers for purchase of goods and services, which are mainly transformers, poles, operating materials and supplies, and contracted services.
As at December 31, 2009, the Parent Company’s obligation to NPC (assigned to Power Sector Assets and Liabilities Management Corporation or PSALM) of P=5,712 million was included in a P=64 million garnishment issued by the Municipal Trial Court of Pili, Camarines Sur on December 16, 2009 in favor of the Estate of Susano J. Rodriguez. Separately, on December 23, 2009, another order of garnishment in favor of NPC Drivers and Mechanics Association, et. al., amounting to P=38 million was issued by the SC. Thus, as at December 31, 2009, the Parent Company was legally prevented from paying its obligation to NPC. Such balance was paid in January 2010.
Trade payables are noninterest-bearing and are generally settled within the 15 to 60-day terms. Other payables are noninterest-bearing and are due in no more than six months from incurrence.
See Note 27 – Related Party Transactions and Note 34 - Significant Contracts and Commitments.

- 71 -
*SGVMC213786*
CERA I and II
The amounts of CERA I and II refunds pertain to over-recoveries of foreign exchange adjustments related to foreign currency-denominated debt outstanding from June 2003 to December 2006. The related foreign currency-denominated loans were substantially settled in 2006.
MERALCO began to refund such over-recoveries amounting to P=3,092 million plus carrying charge of P=833 million, at the rate of P=0.1461 per kWh. The refund was implemented since March 2009 and shall continue until such time that the full amount shall have been fully refunded.
As at December 31, 2010, there was an over-refund of P=30 million while the outstanding balance as at December 31, 2009 is P=983 million, inclusive of P=209 million in carrying charges. The refund was completed in April 2010.
Transmission Backbillings
This account pertains to the amount refundable to customers related to ERC’s decision on the revision of the minimum charge provision in the Parent Company’s rate schedules. This revision, which involves a change in the basis of the computation of the transmission charge component of the minimum charge, resulted in a liability to customers estimated at P=1,085 million. MERALCO implemented the refund based on an ERC order beginning 2006.
As at December 31, 2010 and 2009, the outstanding liability amounted to P=131 million and P=132 million, respectively.
Advances for Construction
Article 14 of the Magna Carta, specifically, “Right to Extension of Lines and Facilities” requires customers requesting for an extension of lines and facilities beyond 30-meter serving distance from the nearest voltage facilities of the DU to advance the cost of the project. Up to March 31, 2010 such advances from customers were being refunded at the rate of 25% of the distribution revenue generated from the extension lines and facilities until such amounts are fully refunded or five years, whichever is shorter. The customer advances are noninterest-bearing. The related asset forms part of the Company’s rate base only at the time a refund has been paid out.
The amended DSOAR, which became effective April 1, 2010 increased the refund rate from 25% to 75% of the gross distribution revenue generated from the extension lines and facilities until such amounts are fully refunded.
As at December 31, 2010 and 2009, the noncurrent portion of advances for construction of P=3,271 million and P=2,989 million, respectively, is presented as “Advances for construction- net of current portion” account in the consolidated statement of financial position.

- 72 -
*SGVMC213786*
27. Related Party Transactions
The following provides the total amount of transactions, which have been provided and/or contracted by the Company with related parties for the relevant financial year. The outstanding balances are unsecured, interest-free (except those relating to deferred pass-through fuel costs) and settled in cash. There have been no guarantees provided or received for any receivables from or payables to related parties. See Note 12 – Deferred Pass-Through Fuel Costs and Note 34 - Significant Contracts and Commitments for the related discussions.
PPA with FGPC and FGP
MERALCO has distinct PPAs with FGPC and FGP for the purchase of 7,271 million kWh from the Sta. Rita Power Plant and 3,635 million kWh of power from the San Lorenzo Power Plant, respectively. Total power purchased from FGCP and FGP amounted to P=53,322 million, P=48,519 million and P=55,283 million for the years ended December 31, 2010 2009, and 2008, respectively. As at December 31, 2010 and 2009, outstanding accounts payable to FGPC and FGP under the PPA amounted to P=2,038 million and P=2,909 million, respectively.
Pole Attachment Contracts with PLDT
The Parent Company has a Pole Attachment Contract with PLDT for a period of three year up to December 31, 2011. PLDT facilities shall be attached to their designated pole space in accordance with the standards similar to other pole attachment contracts set forth by MERALCO. Under the Pole Attachment Contract, PLDT shall use the contacted cable position exclusively for its telecommunication cable network facilities.
For the year ended December 31, 2010, total fees billed under this contract amounted to P=199 million and P=67 million for the period July 14, 2009 (date at which PLDT has effective ownership interests in MERALCO) to December 31, 2009. As at December 31, 2010 and 2009, outstanding receivable of the Parent Company from PLDT under this contract amounted less than a million and P=126 million, respectively.
Sale of Electricity under Various Service Contracts
Several offices, service branches, manufacturing facilities of the Company’s shareholders and affiliates are located within the franchise area of MERALCO. Thus, MERALCO sells electricity to such shareholders and affiliates. The rates charged to related parties are the same ERC-mandated rates charged to all unrelated customers within the franchise area.
Total revenues billed to its shareholders, PLDT, MPIC, SMC and First Holdings and their respective subsidiaries are as follows:
2010 2009 (Amounts in Millions)
PLDT P=2,104 P=719* MPIC 518 105** SMC 1,026 1,004*** First Holdings 295 81*** P=3,943 P=1,909 *** For the period July 14, 2009 to December 31, 2009. *** For the period October 2, 2009 to December 31, 2009. *** For the period January 1 to December 31, 2009.

- 73 -
*SGVMC213786*
Purchase of Telecommunication Services from PLDT and Subsidiaries
The Company’s primary telecommunications carriers are PLDT for its wireline and SMART for its wireless services. Such services are covered by distinct service contracts between the telecommunications carriers and each legal entity within the MERALCO group.
The total amount of services purchased by the Parent Company from PLDT and SMART for the period ended December 31, 2010 and for the period July 14, 2009 (date at which PLDT has effective ownership interests in MERALCO) to December 31, 2009 is as follows:
2010 2009 (Amounts in Millions)
PLDT and affiliates P=53 P=33 SMART 8 6 P=61 P=39
Purchase of Goods and Services
In the ordinary course of business, the Company purchases goods and services from its affiliates and sells power to such affiliates. The details of the transactions are as follows:
Related Party Relationship Nature of Transaction Year Purchases
Amount Owed by
Related Party
Amount Owed to Related
Party (Amounts in Millions)
GEPMICI Associate Purchase of meters and devices
2010 P=52 P=– P=– 2009 194 – –
Indra Philippines Associate IT solutions provider 2010 510 5 13 2009 571 6 15
Philippine Electric Corporation Affiliate Purchase of power transformers
2010 1,070 – 25 2009 957 – 24
Compensation of Key Management Personnel of the Company
The compensation of key officers of the Company by benefit type is as follows:
2010 2009 2008
(Amounts in Millions)
Short-term employee benefits P=376 P=312 P=275 Long-term and retirement benefits 133 66 71 Share-based payments 14 11 25 Total compensation paid to key
management personnel P=523 P=389 P=371
Each of the directors is entitled to a director’s fee of P=120,000 for every BOD meeting attended. Each of the members or advisors of the Audit and Risk Management, Compensation and Benefits, Finance, Governance and Nomination Committees is entitled to a fee of P=20,000 for every committee meeting attended.

- 74 -
*SGVMC213786*
There are no agreements between the MERALCO Group and any of its key management personnel providing for benefits upon termination of employment or retirement, except with respect to benefits provided under the retirement and pension plans.
28. Revenues and Purchased Power
Electricity Revenue
Electricity revenues account for 97% of the total revenues both in 2010 and in 2009 and 98% in 2008. Following is a breakdown of electricity revenues:
2010 2009 2008
(Amounts in Millions)
Pass-through charges: Generation charge P=159,292 P=106,695 P=120,445 Transmission charge 25,429 23,250 25,511 System loss charge 11,567 16,108 16,139 Power Act reduction (219) (660) (814) Inter-class, lifeline subsidies and
others (634) 1,600 (488) Wheeling charges: Distribution charges 29,518 21,276 17,594 Supply charge 8,705 6,560 5,753 Metering charge 5,506 3,923 2,923 239,164 178,752 187,063 Less intersegment sales 87 66 64 P=239,077 P=178,686 P=186,999
Distribution revenue accounted for 18% of total revenues in 2010 and 2009 and 14% in 2008.
See Note 7 – Segment Information
Purchased Power
Actual purchased power costs are pass-through costs and revenue-neutral to the Parent Company. The details are as follows:
2010 2009 2008
(Amounts in Millions)
Generation charge P=172,946 P=127,116 P=131,863 Transmission charge 27,970 23,812 25,009 P=200,916 P=150,928 P=156,872
Purchased power includes capacity fees, fixed operating fees and transmission line fees that are accounted for similar to a lease under Philippine Interpretation IFRIC 4. These amounted to P=19,960 million, P=20,900 million and P=21,592 million in 2010, 2009 and 2008, respectively, and are presented as part of “Purchased power” account in the consolidated statements of income. This also includes the allowable system loss charge up to 8.5% in 2010 and 9.5% in 2009 and 2008. In 2010, 2009 and 2008, the Parent Company’s actual SL rates were 7.9%, 8.6% and 9.3%, respectively.

- 75 -
*SGVMC213786*
The details of purchased power follow:
2010 2009 2008 (Amounts in Millions)
FGPC and FGP P=53,322 P=48,519 P=55,283 NPC/PSALM (including NPC successor
generating companies) 65,170 51,807 49,406 WESM/PEMC 39,140 11,284 13,083 TransCo/NGCP 27,970 23,812 25,009 QPPL 15,238 15,477 14,072 Others 76 29 19 P=200,916 P=150,928 P=156,872
29. Expenses and Income
Operations and Maintenance
Note 2010 2009 2008
(Amounts in Millions)
Salaries, wages and employee benefits 20, 27 and 30 P=8,843 P=7,866 P=7,279
Contractors’ services 3,975 3,626 3,283 Provision for doubtful accounts, net
of recoveries 15 982 886 1,566 Transportation and travel 354 398 272 Materials and supplies 433 326 338 Corporate expenses 297 302 306 Supervision and regulatory fees 88 55 52 Others 739 152 255 P=15,711 P=13,611 P=13,351
Cost of Services
2010 2009 2008
(Amounts in Millions)
Salaries, wages and employee benefits P=783 P=708 P=584 Contractors’ cost 496 661 517 Materials and supplies 428 171 163 Others 289 263 192 P=1,996 P=1,803 P=1,456

- 76 -
*SGVMC213786*
Salaries, Wages and Employee Benefits
Note 2010 2009 2008
(Amounts in Millions)
Operations and maintenance: Salaries and wages P=5,748 P=5,198 P=4,809 Net pension costs 30 1,767 1,887 1,890 Health, medical and related benefits 755 267 176 Employee share-based payments 20 174 301 116 Other long-term employee benefits 30 285 109 184 Social security costs 114 104 104 Cost of services - Salaries, wages and employee benefits 783 708 584 P=9,626 P=8,574 P=7,863
Interest and Other Financial Charges
Note 2010 2009 2008
(Amounts in Millions)
Interest expense on interest-bearing long-term financial liabilities, net of interest capitalized 21 P=1,333 P=1,366 P=1,237
Interest expense on bill deposits 22 (1,326) 1,120 925 Carrying charge on ERC-approved
over-recoveries 2 108 543 934 Interest expense on notes payable 25 26 170 595 Interest expense on meter deposits 22 76 81 89 Amortization of: Debt issue costs 21 76 54 18 Loan premium 21 (24) (27) (27) Interest expense on deferred
pass-through fuel costs 9 15 141 Others 215 6 223 P=493 P=3,328 P=4,135
Interest and Other Financial Income
Note 2010 2009 2008 (Amounts in Millions) Carrying costs on ERC-approved
under-recoveries 2 P=723 P=2,782 P=813 Interest income on placements 536 413 321 Amortization of unearned interest on
installment trade receivables 551 293 450 Gain on return of investment 355 – – MTM gains (losses) from derivative
instruments 31 3 82 (167) Loss on disposal of investment – (46) – Others 522 722 1,502 P=2,690 P=4,246 P=2,919

- 77 -
*SGVMC213786*
30. Long-term Employee Benefits
Accrued long-term employee benefits consist of the following:
2010 2009 (Amounts in Millions) Pension asset (included in “Other noncurrent assets”
account) (P=50) (P=66)
Long-term employee benefits: Pension liability P=8,227 P=10,301 Long-term incentives 400 – Post employment benefits 920 686 P=9,547 P=10,987
Retirement Plan
The features of the Company’s defined benefit plans are discussed in Note 5 – Summary of Significant Accounting Policies.
Actuarial valuations are prepared annually by independent actuaries.
Net Pension Costs (included in “Operations and maintenance expenses - Salaries, wages and employee benefits” account)
2010
Parent Rockwell
Land
MIESCOR Group and
Other Subsidiaries Total
(Amounts in Millions) Interest costs P=2,006 P=12 P=5 P=2,023 Current service costs 865 14 4 883 Expected return on plan assets (1,132) (17) (1) (1,150) Past service costs 1 7 – 8 Actuarial loss – – 2 2 Net pension costs P=1,740 P=16 P=10 P=1,766
Actual return on plan assets P=4,178 P=44 P=– P=4,222
2009
Parent Rockwell
Land
MIESCOR Group
and Other Subsidiaries Total
(Amounts in Millions) Interest costs P=2,033 P=6 P=4 P=2,043 Current service costs 793 5 2 800 Expected return on plan assets (722) (4) (1) (727) Past service costs 1 17 – 18 Actuarial loss (gain) – (1) 5 4 Settlement gain (252) – – (252) Net pension costs P=1,853 P=23 P=10 P=1,886
Actual return on plan assets P=4,127 P=21 P=2 P=4,150

- 78 -
*SGVMC213786*
2008
Parent Rockwell
Land
MIESCOR Group
and Other Subsidiaries Total
(Amounts in Millions) Interest costs P=1,730 P=6 P=4 P=1,740 Current service costs 964 9 3 976 Expected return on plan assets (826) (4) (1) (831) Past service costs 1 1 – 2 Actuarial loss – – 2 2 Net pension costs P=1,869 P=12 P=8 P=1,889
Actual return (loss) on plan assets (P=1,695) (P=6) P=1 (P=1,700)
Pension Liability (Asset)
2010
Parent Rockwell
Land
MIESCOR Group
and Other Subsidiaries Total
(Amounts in Millions) Defined benefit obligation P=32,483 P=168 P=77 P=32,728 Fair value of plan assets (22,775) (208) (21) (23,004) Unrecognized net actuarial gains (losses) (1,505) 13 (29) (1,521) Unrecognized past service costs (3) (23) – (26) Pension liability (asset) P=8,200 (P=50) P=27 P=8,177
2009
Parent Rockwell
Land
MIESCOR Group
and Other Subsidiaries Total
(Amounts in Millions) Defined benefit obligation P=25,067 P=126 P=62 P=25,255 Fair value of plan assets (16,166) (164) (18) (16,348) Unrecognized net actuarial gains (losses) 1,380 2 (20) 1,362 Unrecognized past service cost (4) (30) – (34) Pension liability (asset) P=10,277 (P=66) P=24 P=10,235

- 79 -
*SGVMC213786*
Changes in the present value of the defined benefit obligation are as follows:
2010
Parent Rockwell
Land
MIESCOR Group
and other Subsidiaries Total
(Amounts in Millions) Defined benefit obligation at beginning
of year P=25,067 P=126 P=62 P=25,255 Interest costs 2,006 12 5 2,023 Current service costs 865 14 4 883 Benefits paid (1,386) – (4) (1,390) Past service costs Actuarial losses (gains) due to: Changes in assumptions 6,385 15 8 6,408 Experience adjustments (454) 1 2 (451) Defined benefit obligation at end of year P=32,483 P=168 P=77 P=32,728
2009
Parent Rockwell
Land
MIESCOR Group
and Other Subsidiaries Total
(Amounts in Millions) Defined benefit obligation at beginning
of year P=22,594 P=50 P=50 P=22,694 Interest costs 2,033 6 4 2,043 Current service costs 793 5 2 800 Benefits paid (1,282) – (4) (1,286) Past service costs – 40 – 40 Actuarial losses (gains) due to: Changes in assumptions 2,051 18 2 2,071 Experience adjustments (482) 7 8 (467) Effect of settlement (640) – – (640) Defined benefit obligation at end of year P=25,067 P=126 P=62 P=25,255
Changes in the fair value of plan assets are as follows:
2010
Parent Rockwell
Land
MIESCOR Group
and Other Subsidiaries Total
(Amounts in Millions) Fair value of plan assets at beginning
of year P=16,166 P=164 P=18 P=16,348 Expected return on plan assets 1,132 17 1 1,150 Actuarial gains (losses) 3,046 27 (1) 3,072 Benefits paid (1,386) – – (1,386) Contributions by employer 3,817 – 3 3,820 Fair value of plan assets at end of year P=22,775 P=208 P=21 P=23,004

- 80 -
*SGVMC213786*
2009
Parent Rockwell
Land
MIESCOR Group
and Other Subsidiaries Total
(Amounts in Millions) Fair value of plan assets at beginning
of year P=10,309 P=82 P=17 P=10,408 Expected return on plan assets 722 4 1 727 Actuarial gains 3,405 17 1 3,423 Benefits paid (1,705) – (4) (1,709) Contributions by employer 3,435 61 3 3,499 Fair value of plan assets at end of year P=16,166 P=164 P=18 P=16,348
The Parent Company expects to contribute P=3,045 million to its defined benefit pension plan in 2011.
The major categories of plan assets of the MERALCO Pension Fund as a percentage of the fair value of total plan assets are as follows:
2010 2009 (In Percentage)
Marketable equity securities 39 94 Government securities 26 – Cash and cash equivalents 16 – Bonds and commercial notes 14 1 Real properties 4 5 Receivables 1 – 100 100
Marketable equity securities, government securities, bonds and commercial notes are investments held by the trustee banks. The Pension Fund does not have any direct interests in the Company’s shares.
The overall expected rate of return on assets is determined based on the prevailing rates of return on equity and fixed income securities applicable to the period over which the obligation is to be settled.
The key information of the retirement plan is as follows:
For the years ended 2010 2009 2008 2007 2006 (Amounts in Millions) Present value of defined benefit
obligation P=32,728 P=25,255 P=22,694 P=24,825 P=27,473 Fair value of plan assets (23,004) (16,348) (10,408) (11,857) (5,967) Excess of present value of defined
benefit obligation over fair value of plan assets 9,724 8,907 12,286 12,968 21,506
Experience losses (gains) on plan liabilities (451) (467) 165 (748) 233
Experience gains (losses) on plan assets (3,072) 3,423 (2,531) 5,518 3,176

- 81 -
*SGVMC213786*
Other Long-term Employee Benefits (included as part of “Operations and maintenance expenses - Salaries, wages and employee benefits” account)
2010 2009 2008 (Amounts in Millions)
Interest costs P=151 P=78 P=92 Current service costs 34 43 33 Actuarial loss 100 36 59 Settlement gain – (48) – Net other long-term employee
benefits P=285 P=109 P=184
Other Long-term Employee Benefits Liability
2010 2009 (Amounts in Millions)
Other long-term employee benefits obligation P=2,471 P=1,887 Unrecognized net actuarial losses (1,551) (1,201) Benefits liability at end of year P=920 P=686
Changes in the present value of other long-term employee benefits liability are as follows:
2010 2009 (Amounts in Millions)
Balance at beginning of year P=1,887 P=1,115 Actuarial losses 450 835 Interest costs 151 78 Current service costs 34 43 Benefits paid (51) (51) Effect of settlement – (133) Balance at end of year P=2,471 P=1,887
The principal assumptions used as at January 1, 2010, 2009 and 2008 in determining pension and other long-term employee benefits obligations are shown below:
2010 2009 2008 Annual Discount rate 6%–8% 8%–9.2% 7%–10.2% Expected annual rate of return on assets 7%–10% 6%–10% 7% Future range of annual salary increases 5%–9.6% 5%–10% 5%–10%
Defined Contribution Plan or Provident Fund
In addition to its defined benefit retirement plan, MIESCOR has a contributory defined contribution retirement plan. The annual contribution of MIESCOR to the Provident Fund is equivalent to 6% of the current monthly basic salaries of covered employees. The Provident Fund is maintained primarily for the purpose of establishing periodically the amounts of the benefits pertaining to the covered employees and is managed by a Board of Trustees. The employees’ shares are represented by the units of the Provident Fund. Each unit is determined by dividing the net asset value of the Provident Fund by the aggregate number of units earned by the employee. Although the plan is a defined contribution, MIESCOR regularly monitors compliance with
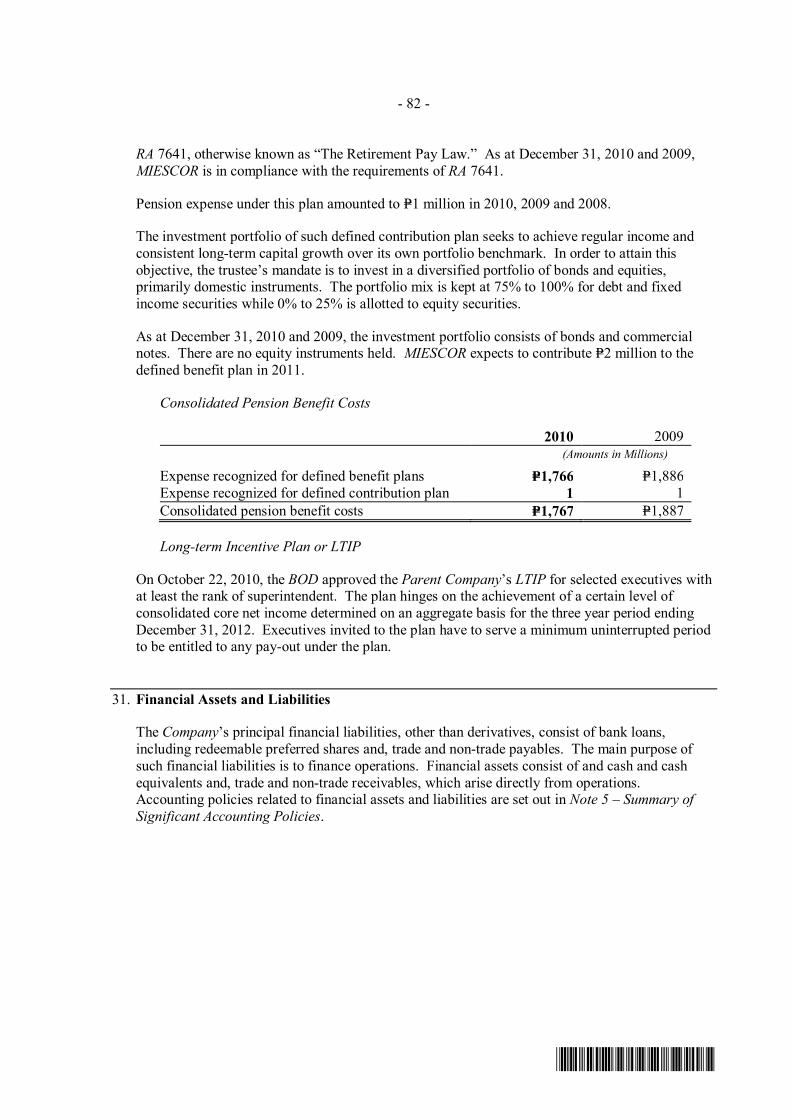
- 82 -
*SGVMC213786*
RA 7641, otherwise known as “The Retirement Pay Law.” As at December 31, 2010 and 2009, MIESCOR is in compliance with the requirements of RA 7641.
Pension expense under this plan amounted to P=1 million in 2010, 2009 and 2008.
The investment portfolio of such defined contribution plan seeks to achieve regular income and consistent long-term capital growth over its own portfolio benchmark. In order to attain this objective, the trustee’s mandate is to invest in a diversified portfolio of bonds and equities, primarily domestic instruments. The portfolio mix is kept at 75% to 100% for debt and fixed income securities while 0% to 25% is allotted to equity securities.
As at December 31, 2010 and 2009, the investment portfolio consists of bonds and commercial notes. There are no equity instruments held. MIESCOR expects to contribute P=2 million to the defined benefit plan in 2011.
Consolidated Pension Benefit Costs
2010 2009 (Amounts in Millions)
Expense recognized for defined benefit plans P=1,766 P=1,886 Expense recognized for defined contribution plan 1 1 Consolidated pension benefit costs P=1,767 P=1,887
Long-term Incentive Plan or LTIP
On October 22, 2010, the BOD approved the Parent Company’s LTIP for selected executives with at least the rank of superintendent. The plan hinges on the achievement of a certain level of consolidated core net income determined on an aggregate basis for the three year period ending December 31, 2012. Executives invited to the plan have to serve a minimum uninterrupted period to be entitled to any pay-out under the plan.
31. Financial Assets and Liabilities
The Company’s principal financial liabilities, other than derivatives, consist of bank loans, including redeemable preferred shares and, trade and non-trade payables. The main purpose of such financial liabilities is to finance operations. Financial assets consist of and cash and cash equivalents and, trade and non-trade receivables, which arise directly from operations. Accounting policies related to financial assets and liabilities are set out in Note 5 – Summary of Significant Accounting Policies.

- 83 -
*SGVMC213786*
The following table sets forth the financial and nonfinancial assets and liabilities as at December 31, 2010 and 2009:
Loans and
Receivables
Held-to- maturity
Investments
Designated at Fair Value
through Profit
or Loss Held-for-
trading
Available- for-sale
Financial Assets
Liabilities Carried at Amortized
Cost
Total Financial
Assets and Liabilities
Non- financial
Assets and liabilities Total
(Amounts in Millions)
Assets as at December 31, 2010 Noncurrent Utility plant and others - net P=– P=– P=– P=– P=– P=– P=– P=101,009 P=101,009 Construction in progress – – – – – – – 2,241 2,241 Investment in associates and a joint
venture – – – – – – – 321 321 Investment properties - net – – – – – – – 8,037 8,037 Deferred pass-through fuel costs – – – – – – – 1,222 1,222 Deferred tax assets - net – – – – – – – 42 42 Other noncurrent assets 4,163 61 – – 403 – 4,627 5,712 10,339 Current Cash and cash equivalents 24,370 – – – – – 24,370 – 24,370 Trade and other receivables - net 25,609 – – – – – 25,609 – 25,609 Inventories – – – – – – – 2,043 2,043 Land and development costs – – – – – – – 1,708 1,708 Other current assets – – 24 – – – 24 2,003 2,027 Total assets 54,142 61 24 – 403 – 54,630 124,338 178,968 Liabilities as at December 31, 2010 Noncurrent Interest-bearing long-term financial
liabilities - net of current portion – – – – – 15,498 15,498 – 15,498 Customers’ deposits - net of current
portion – – – – – 23,761 23,761 – 23,761 Deposits from condominium units sold – – – – – – – 741 741 Deferred tax liabilities - net – – – – – – – 3,322 3,322 Long-term employee benefits – – – – – – – 9,547 9,547 Provisions – – – – – – – 12,875 12,875 Advances for construction – – – – – 3,271 3,271 – 3,271 Other noncurrent liabilities – – – – – 1,777 1,777 575 2,352 Current Notes payable – – – – – 149 149 – 149 Trade payables and accrued expenses – – 1 – – 23,913 23,914 7,224 31,138 Income tax payable – – – – – – – 413 413 Customers’ refund – – – – – 7,131 7,131 – 7,131
Interest-bearing long-term financial liabilities - current portion – – – – – 5,574 5,574 – 5,574
Total liabilities – – 1 – – 81,074 81,075 34,697 115,772 Net Assets (Liabilities) P=54,142 P=61 P=23 P=– P=403 (P=81,074) (P=26,445) P=89,641 P=63,196
Assets as at December 31, 2009 Noncurrent Utility plant and others - net P=– P=– P=– P=– P=– P=– P=– P=98,231 P=98,231 Construction in progress – – – – – – – 3,627 3,627 Investment in associates and a joint
ventures – – – – – – – 1,203 1,203 Investment properties - net – – – – – – – 8,021 8,021 Deferred pass-through fuel costs – – – – – – – 3,161 3,161 Deferred tax assets - net – – – – – – – 17 17 Other noncurrent assets 6,404 57 172 – 361 – 6,994 6,190 13,184 Current Cash and cash equivalents 17,068 – – – – – 17,068 – 17,068 Trade and other receivables - net 21,600 – – – – – 21,600 – 21,600 Inventories – – – – – – – 1,857 1,857 Land and development costs – – – – – – 1,191 1,191 Other current assets – – 11 – – – 11 2,958 2,969 Total assets 45,072 57 183 – 361 – 45,673 126,456 172,129

- 84 -
*SGVMC213786*
Loans and
Receivables
Held-to- maturity
Investments
Designated at Fair Value
through Profit
or Loss Held-for-
trading
Available- for-sale
Financial Assets
Liabilities Carried at Amortized
Cost
Total Financial
Assets and Liabilities
Non- financial
Assets and liabilities Total
(Amounts in Millions)
Liabilities as at December 31, 2009 Noncurrent Interest-bearing long-term financial
liabilities - net of current portion P=– P=– P=– P=– P=– P=17,234 P=17,234 P=– P=17,234 Customers’ deposits - net of current
portion – – – – – 25,063 25,063 – 25,063 Deposits from condominium units sold – – – – – – 343 343 Deferred tax liabilities - net – – – – – – – 4,230 4,230 Long-term employee benefits – – – – – – – 10,987 10,987 Provisions – – – – – – – 7,492 7,492 Advances for construction - net of
current portion – – – – – 2,989 2,989 – 2,989 Other noncurrent liabilities – – – – – – – 522 522 Current Notes payable – – – – – 513 513 – 513 Trade payables and accrued expenses – – 28 – – 22,888 22,916 5,345 28,261 Income tax payable – – – – – – – 133 133 Customers’ refund – – – – – 9,147 9,147 – 9,147 Interest-bearing long-term financial
liabilities - current portion – – – – – 4,069 4,069 – 4,069 Total liabilities – – 28 – – 81,903 81,931 29,052 110,983 Net Assets (Liabilities) P=45,072 P=57 P=155 P=– P=361 (P=81,903) (P=36,258) P=97,404 P=61,146
The following table sets forth the consolidated carrying values and estimated fair values of the Company’s financial assets and liabilities recognized as at December 31, 2010 and 2009:
Carrying Value Fair Value 2010 2009 2010 2009
(Amounts in Millions)
Noncurrent Financial Assets AFS financial assets: Quoted equity securities P=381 P=339 P=381 P=339 Unquoted equity securities 22 22 22 22 Other noncurrent assets: Unbilled receivables 3,063 5,406 3,063 5,406 SC GRAM case refund 780 780 780 780 Advance payment to suppliers 253 135 253 135 Installment contract receivable 39 54 39 54 Derivative assets – 172 – 172 HTM 61 57 61 57 Notes receivable 28 29 28 29 Total noncurrent financial assets 4,627 6,994 4,627 6,994 Current Financial Assets Cash and cash equivalents: Cash on hand and in banks 3,631 6,399 3,631 6,399 Temporary cash placements 20,739 10,669 20,739 10,669 Trade and other receivables - net: Billed electricity 16,258 13,274 16,258 13,274 Unbilled electricity 5,011 5,537 5,011 5,537 Current portion of installment contracts 2,183 367 2,183 367 Service contracts and others 1,326 1,278 1,326 1,278 Nontrade - others 831 1,144 831 1,144 Other current assets - Derivative assets 24 11 24 11 Total current financial assets 50,003 38,679 50,003 38,679 Total Financial Assets P=54,630 P=45,673 P=54,630 P=45,673

- 85 -
*SGVMC213786*
Carrying Value Fair Value 2010 2009 2010 2009
(Amounts in Millions)
Noncurrent Financial Liabilities Interest-bearing long-term financial liabilities: P=15,498 P=17,234 P=15,498 P=17,574 Customers’ deposits - net of current portion 23,761 25,063 23,761 25,063 Advances for construction 3,271 2,989 3,271 3,022 Other noncurrent liabilities 1,777 – 1,777 – Total noncurrent financial liabilities 44,307 45,286 44,307 45,659 Current Financial Liabilities Trade payables and accrued expenses: Trade accounts payable 15,538 16,943 15,538 16,943 Accrued expenses: Interest 487 430 487 430 Liability for GSL payout 446 124 446 124 Current portion of: CERA I and II over-recoveries and carrying charges – 983 – 983 Meter deposits 1,226 744 1,226 744 Interest on meter deposits 1,175 628 1,175 628 Bill deposits 541 518 541 518 Liability arising from deferred pass-through fuel
costs – 433 – 433 Security deposits 192 191 192 191 Interest on bill deposits 137 167 137 167 Retentions payable 23 96 23 96 Derivative liability 1 28 1 28 Dividends payable 1,956 314 1,956 314 Advances for construction 774 163 774 163 Accrued development costs 525 276 525 276 Regulatory fees 318 199 318 199 Reinsurance liabilities 225 122 225 122 Accrued universal charges 219 425 219 425 Transmission backbillings 131 132 131 132 Customers’ refund - current portion 7,131 9,147 7,131 9,147 Interest-bearing financial liabilities: Notes payable 149 513 149 513 Current portion of long-term debt 5,574 4,069 5,574 4,069 Total current financial liabilities 36,768 36,645 36,768 36,645 Total Financial Liabilities P=81,075 P=81,931 P=81,075 P=82,304
The fair value of the financial assets and liabilities are included at the amount at which the instrument could be exchanged in a current transaction between willing parties, other than in a forced or liquidation sale. The following methods and assumptions were used to estimate the fair value of each class of financial instrument for which it is practicable to estimate such value:
Cash and Cash Equivalents, Trade and Other Receivables – Billed, Unbilled, Service Contracts and Others and Nontrade, Refundable Deposits, Trade payables and accrued expenses, Notes Payable and Liability Arising from Deferred Pass-Through Fuel Costs
Due to the short-term nature of transactions, the fair values of these instruments approximate their carrying amounts as at reporting date. The value of “Trade payables and accrued expenses” includes the value of bifurcated embedded currency forwards.

- 86 -
*SGVMC213786*
Installment Contracts Receivable
The fair values of installment contracts receivable were calculated by discounting the expected future cash flows at prevailing credit adjusted PDEx interest rates ranging from 1.08% to 6.59% in 2010 and 6.5% to 8.3% in 2009.
Bifurcated Foreign Currency Forward and Foreign Currency Forward
The fair values of embedded currency forwards and freestanding currency forwards were calculated by reference to forward exchange market rates.
Meter Deposits and Customers’ Refund
Meter deposits and customers’ refund are due and demandable. Thus, the fair values of these instruments approximate their carrying amounts.
Bifurcated Call Option
The fair values of the embedded prepayment option were estimated based on prices derived using the binomial pricing model. The following inputs were used to determine the fair value of the bifurcated call option; contractual future cash flows, exercise price of P=105, interest rate volatility of 26.29%, interest rate spot curves ranging from 6.28% to 8.12% in 2009. The related interest-bearing long-term financial liabilities were prepaid in December 2010.
AFS Investments
The fair values were determined by reference to market bid quotes as at reporting date. The unquoted equity securities were carried at cost.
Interest-bearing Long-term Financial Liabilities
The fair values of interest bearing long-term financial liabilities were computed by discounting the expected future cash flows using the prevailing credit adjusted USD London interbank offered rate or USD LIBOR, Philippine Dealing System Treasury Fixing or PDST-F, CHF LIBOR and Euro interbank offered rates or EURIBOR ranging from 1.08% to 6.59% in 2010 and 4.68% to 7.30% in 2009. There were no foreign currency denominated long-term financial liabilities in 2010.
Bill Deposits
The fair values of bill deposits are not determinable since the timing of each refund is linked to the termination of service, which is not reasonably predictable. Bill deposits are presented at cost.
Preferred Stock
The carrying cost of the preferred stock represents the fair value. Except with respect to P=192 million of such preferred stocks, which are callable and redeemable as at December 31, 2010, the remaining balance of preferred stock have been called and are redeemable anytime upon presentation by such shareholder of their certification. Preferred stock is presented at cost. This is included under “Interest-bearing long-term financial liabilities” account.

- 87 -
*SGVMC213786*
Retention Payable and Security Deposits
The fair values were calculated by discounting the expected future cash flows at prevailing credit adjusted PDEx interest rates ranging from 1.08% to 6.6% in 2010 and 6.3% to 7.4% in 2009.
Fair Value Hierarchy
The Parent Company held the following financial instruments measured at fair value. The Parent Company uses the following hierarchy for determining and disclosing the fair value of financial instruments by valuation technique:
§ Level 1: quoted (unadjusted) prices in active markets for identical assets or liabilities
§ Level 2: other techniques for all inputs which have a significant effect on the recorded fair value are observable, either directly or indirectly
§ Level 3: techniques with inputs which have a significant effect on the recorded fair value that are not based on observable market data
Below is the list of financial assets and liabilities carried at fair value that are classified using a fair value hierarchy:
December 31, 2010 December 31, 2009 Level 1 Level 2 Total Level 1 Level 2 Total (Amounts in millions) Noncurrent financial assets: AFS investments P=275 P=128 P=403 P=– P=361 P=361 Derivative assets – – – – 11 11 Current financial assets - Derivative assets – 24 24 – 172 172 Total P=275 P=152 P=427 P=– P=544 P=544
Current financial liability - Derivative liability P=– (P=1) (P=1) P=– (P=28) (P=28)
As at December 31, 2010 and 2009, the Company does not have financial instruments with fair values determined using inputs that are not based on observable market data (Level 3).
For the years ended December 31, 2010 and 2009, there were no transfers between Level 1 and Level 2 fair value measurements, and no transfers into and out of Level 3 fair value measurements.
Derivative Financial Instruments
Embedded Currency Forward
The Parent Company has bifurcated embedded currency forwards noted in various purchases and service agreements denominated in currencies other than Philippine peso, which includes U.S. dollar, Euro, among others. As at December 31, 2010 and 2009, these agreements represent 25% and 15% of the Parent Company’s trade payables, respectively. As at December 31, 2010, the U.S. dollar- and Euro-denominated agreements amounted to $9 million (equivalent to P=404 million) and €8 million (equivalent to P=450 million), respectively. As at December 31, 2009, the U.S dollar and Euro-denominated agreements amounted to $12 million (equivalent to P=572 million) and €4 million (equivalent to P=259 million), respectively. These are part of “Trade

- 88 -
*SGVMC213786*
payables and accrued expenses” account in the consolidated statements of financial position. The net fair value of the embedded currency forward amounted to P=40 million and P=13 million as of December 31, 2010 and 2009, respectively.
Currency Forward
Rockwell Land entered into deliverable currency forward contracts to hedge its foreign currency exposure arising from its U.S. dollar-denominated receivables. As at December 31, 2010 and 2009, the Company has outstanding currency forward contracts to sell U.S. dollar with an aggregate notional amount of $0.09 million and $2.4 million, respectively, and weighted average contracted forward rate of P=43.88 to $1.00 and P=46.21 to $1.00, respectively. Outstanding derivatives will mature in 2011. The net fair value gain on the outstanding currency forward contracts amounted to P=10.4 million as of December 31, 2010 and 2009.
Embedded Call Option
As discussed in Note 21, the Parent Company has an embedded call option (prepayment option) in its P=6,000 million 9% Tranche A Fixed rate corporate note issued in December 2006. In December 2010, the call option on the P=6,000 million fixed rate corporate note was exercised by the Parent Company. As at December 31, 2009, the fair value of this derivative amounted P=172 million.
The net movements in fair value changes of the Company’s derivative instruments for the year ended December 31, 2010 and 2009 are as follows:
2010 2009 (Amounts in Millions)
Balance at beginning of year P=155 P=72 Net changes in fair value of derivatives not
designated as accounting hedges 3 82 Fair value of settled instruments (135) 1 Balance at end of year P=23 P=155
The fair value changes of the Company’s derivative instruments as of December 31, 2010 and 2009 are presented as follows:
Note 2010 2009 (Amounts in Millions) Derivative assets: Current portion 18 P=24 P=11 Noncurrent portion 13 – 172 Derivative liabilities - current 26 (1) (28) P=23 P=155

- 89 -
*SGVMC213786*
Financial Risk Management Objectives and Policies
The main risks arising from the Company’s financial instruments are cash flow interest rate risk, foreign currency risk, commodity price risk, credit risk and liquidity risk. The importance of managing those risks has significantly increased in light of the considerable change and volatility in the Philippine and international financial markets. The BOD reviews and approves policies for managing each of these risks. Management monitors the market price risk arising from all financial instruments. The policies for managing these risks are as follows:
Cash Flow Interest Rate Risk
The Company’s exposure to the changes in market interest rates relates primarily to the Company’s debt obligations with floating interest rates since the Company’s interest-bearing short-term investments mature within 90 days or less.
The Company’s policy is to manage its interest rate risk exposure using a mix of fixed and variable rate debts. The strategy which yields a reasonably lower effective cost based on market conditions is adopted. Refinancing of fixed rate loans may also be undertaken to manage interest cost. As at December 31, 2010 and 2009, approximately 85% and 61% of the Company’s borrowings are at a fixed rate of interest, respectively.
Rockwell Land’s policy is to source loans with fixed interest rates whenever available.
The following table sets out the maturity profile of the Company’s financial instruments that are exposed to interest rate risk (exclusive of debt issuance costs):
Within 1 Year 1–2 Years 2–3 Years 3–4 Years 4–5 Years
More than 5 Years Total
(Amounts in Millions)
2010 Floating Rate Parent Company P=600 P=600 P=600 P=600 P=– P=– P=2,400 Rockwell Land 1,107 130 – – – – 1,237
2009 Floating Rate Parent Company 1,044 1,173 717 717 716 3,315 7,682 Rockwell Land 763 – – – – – 763
Interest on bank loans classified as floating rate is repriced at intervals of less than one year. The other financial liabilities of the Company that are not included in the foregoing have fixed interest rate, are noninterest-bearing or have no fixed or determinable maturity and are, therefore, not subject to cash flow interest rate risk. As previously mentioned, the Company’s short-term investments are not exposed to significant changes in market rates because they mature within 90 days or less to coincide with the Company’s monthly payment obligations.

- 90 -
*SGVMC213786*
The following table demonstrates the sensitivity to a reasonably possible change in interest rates, with all other variables held constant, of the Parent Company’s and Rockwell Land’s profit before tax as at December 31, 2010 and 2009 (through the impact on floating rate borrowings). There is no other impact on the Parent Company’s and Rockwell Land’s equity other than those already affecting the consolidated statement of income.
2010 2009
Increase (Decrease) in Basis Points
Effect on Profit
before Tax
Increase (Decrease) in Basis Points
Effect on Profit
before Tax (Amounts in Millions) Parent Company Floating rate loans from various banks +100 (P=24 million) +100 (P=69 million) (100) 24 million (100) 69 million Rockwell Land Floating rate loans from various banks +100 (P=9 million) +100 (P=3 million) (100) 9 million (100) 3 million
Interest expense on floating rate loans is computed for the year, taking into account actual principal movements during the year, based on management’s best estimate of a +/-100 basis points change in interest rates. There has been no change in the methods and assumptions used by the management in the foregoing analysis.
Foreign Currency Risk
The revaluation of any of the Company’s foreign currency-denominated financial assets and liabilities as a result of the appreciation or depreciation of the Philippine peso is recognized as foreign exchange gains or losses as at the end of each reporting period. The extent of foreign exchange gains or losses is largely dependent on the amount of foreign currency-denominated debt. While an insignificant percentage of the Company’s revenues and debt is denominated in U.S. dollars, a substantial portion of the Company’s capital expenditures for electricity capital projects and a portion of the operating expenses are denominated in foreign currencies, mostly in U.S. dollars. As such, a strengthening or weakening of the Philippine peso against the U.S. dollar will decrease or increase in Philippine peso terms, the principal amount of the Company’s foreign currency-denominated liabilities and the related interest expense, foreign currency-denominated capital expenditures and operating expenses as well as U.S. dollar-denominated revenues.
To manage foreign currency risks and stabilize cash flows, the Parent Company is allowed to recover foreign exchange losses on foreign currency-denominated loans through adjustments in customers’ bills in accordance with CERA II.
The following table shows the consolidated foreign currency-denominated financial assets and liabilities as at December 31, 2010 and 2009, translated to Philippine peso at the following exchange rates:
2010 2009 U.S. Dollar ($) P=43.84 P=46.20 Euro (€) 58.03 66.67

- 91 -
*SGVMC213786*
December 31, 2010 Foreign Currency
U.S. Dollar Euro Peso
Equivalent Financial assets: Cash and cash equivalents $9 €– P=395 Trade and other receivables 5 – 219 Advance payments to suppliers 7 – 307 21 – 921 Financial liabilities: Trade payables and accrued expenses (78) – (3,420) (78) – (3,420) ($57) (€–) (P=2,499)
December 31, 2009 Foreign Currency
U.S. Dollar Euro Peso
Equivalent Financial assets: Cash and cash equivalents $85 €– P=3,936 Trade and other receivables 4 – 150 Advance payments to suppliers 3 – 138 92 – 4,224 Financial liabilities: Trade payables and accrued expenses (140) (2) (6,582) Liability arising from deferred pass-
through fuel costs (9) – (433) Interest-bearing long-term financial
liabilities – (1) (54) (149) (3) (7,069) ($57) (€3) (P=2,845)
a. All of the Parent Company’s long-term financial liabilities are denominated in Philippine Peso. However, an insignificant portion of its trade payables are denominated in U.S. dollars. Thus, the impact of P=1 movement of the Philippine Peso against the U.S. dollar will not have a significant impact on the Parent Company’s principal and interest payments. Further, PBR assumes a forecast level of foreign currency movements in its calculation of the forecasted regulatory asset base and expenditures. PBR also allows for adjustment of the rates the Parent Company charges under PBR should there be significant deviations in the foreign exchange forecast from what is actually realized.
b. Rockwell Land markets its developments in the United States. Thus, its statement of financial position may be affected significantly by movements in the U.S. dollar exchange rates.
It is Rockwell Land’s policy to limit its U.S. dollar-denominated receivables to an amount that approximately matches the U.S. dollar-denominated component of its development costs as well as its U.S. dollar-denominated borrowings. Also, Rockwell Land enters into deliverable currency forward contracts to hedge its foreign currency exposure should there be an excess in U.S. dollar-denominated assets over the U.S. dollar-denominated liabilities.

- 92 -
*SGVMC213786*
The following table demonstrates the sensitivity to a reasonably possible change in the U.S. dollar exchange rate vis-a-vis the peso, with all other variables held constant, of the Company’s profit before tax as at December 31, 2010 and 2009 (due to changes in the fair value of financial assets and liabilities). There is no other impact on the Company’s equity other than those already affecting the profit and loss.
2010 2009
Change
in US$ Rate
Effect on Profit
before Tax Change
in US$ Rate
Effect on Profit
before Tax (In %) (In Millions) (In %) (In Millions)
U.S. dollar-denominated financial assets and liabilities
+5 (P=125) +5 (P=140) –5 125 –5 140
Euro-denominated financial assets and liabilities
+5 – +5 (P=9) –5 – –5 9
Foreign exchange gain or loss is computed for the year based on management’s best estimate of a +/–5 percent change in the closing Philippine peso-U.S. dollar conversion rate using the year end balances of U.S. dollar-denominated cash and cash equivalents, accounts receivable, loans, and forward contracts. There has been no change in the methods and assumptions used by management in the above analysis.
Commodity Price Risk
Commodity price risk is the risk that the fair value or cash flows of a financial instrument will fluctuate because of changes in commodity prices. The Company’s exposure to price risk is minimal. The cost of fuel is part of the Parent Company’s and CEDC’s generation cost that is recoverable from the customers through their generation charge.
Credit Risk
Credit risk is the risk that the Company will incur a loss arising from customers, clients or counterparties who fail to discharge their contracted obligations. The Company manages and controls credit risk by setting limits on the amount of risk that the Company is willing to accept for individual counterparties and by monitoring exposures in relation to such limits.
The Company trades only with recognized, creditworthy third parties. It is the Company’s policy that all customers who wish to trade on credit terms are subject to credit verification procedures. In addition, receivables are monitored on an ongoing basis to reduce exposure to bad debt. Power distribution receivables are, to a certain extent, backed by bill deposits. Also, as a policy, disconnection notices are sent three days after the due date and disconnections are carried out on the third day after receipt of disconnection notice.
Trade receivables from sale of condominium units are secured with pre-completed condominium units the legal title and ownership of which are transferred to the customers upon full payment of the contract price. Receivables from leases are secured by security deposits, while receivables from sale of club shares are guaranteed by the shares held by the Company.
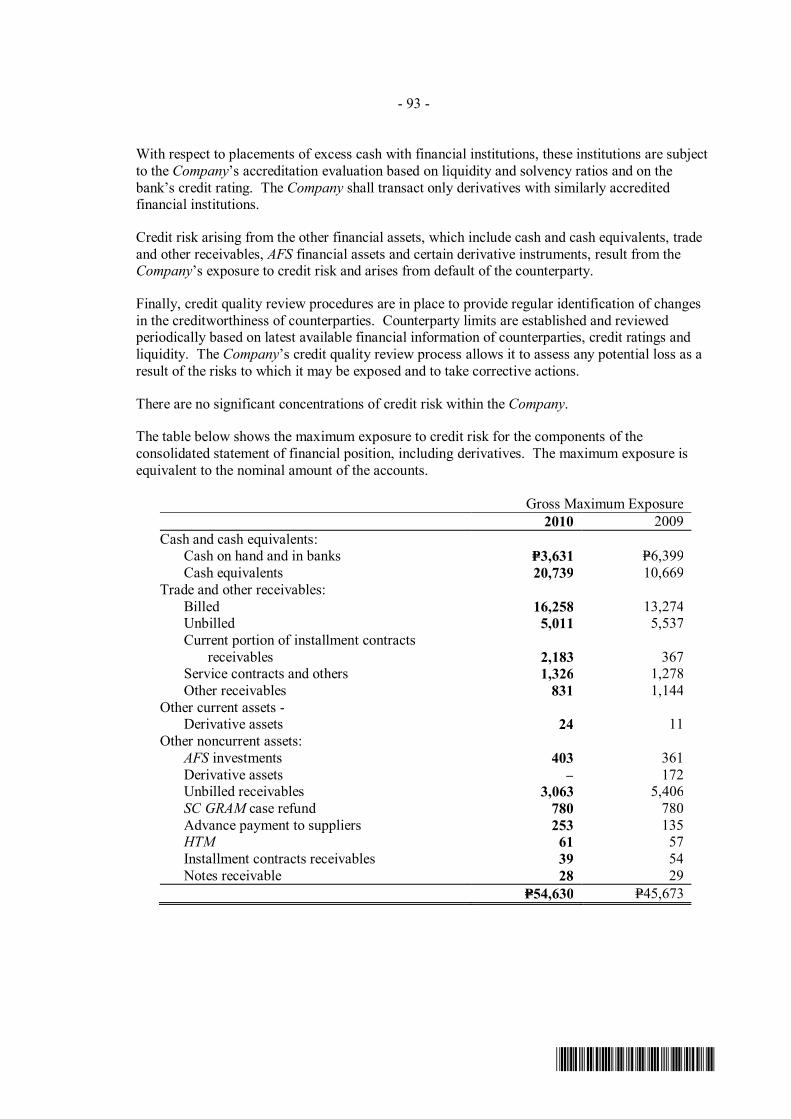
- 93 -
*SGVMC213786*
With respect to placements of excess cash with financial institutions, these institutions are subject to the Company’s accreditation evaluation based on liquidity and solvency ratios and on the bank’s credit rating. The Company shall transact only derivatives with similarly accredited financial institutions.
Credit risk arising from the other financial assets, which include cash and cash equivalents, trade and other receivables, AFS financial assets and certain derivative instruments, result from the Company’s exposure to credit risk and arises from default of the counterparty.
Finally, credit quality review procedures are in place to provide regular identification of changes in the creditworthiness of counterparties. Counterparty limits are established and reviewed periodically based on latest available financial information of counterparties, credit ratings and liquidity. The Company’s credit quality review process allows it to assess any potential loss as a result of the risks to which it may be exposed and to take corrective actions.
There are no significant concentrations of credit risk within the Company.
The table below shows the maximum exposure to credit risk for the components of the consolidated statement of financial position, including derivatives. The maximum exposure is equivalent to the nominal amount of the accounts.
Gross Maximum Exposure 2010 2009 Cash and cash equivalents: Cash on hand and in banks P=3,631 P=6,399 Cash equivalents 20,739 10,669 Trade and other receivables: Billed 16,258 13,274 Unbilled 5,011 5,537 Current portion of installment contracts
receivables 2,183 367 Service contracts and others 1,326 1,278 Other receivables 831 1,144 Other current assets - Derivative assets 24 11 Other noncurrent assets: AFS investments 403 361 Derivative assets – 172 Unbilled receivables 3,063 5,406 SC GRAM case refund 780 780 Advance payment to suppliers 253 135 HTM 61 57 Installment contracts receivables 39 54 Notes receivable 28 29 P=54,630 P=45,673

- 94 -
*SGVMC213786*
The credit quality of financial assets is managed by the Parent Company using “High Grade,” “Standard Grade” and “Sub-standard Grade” as internal credit ratings. The following tables show the credit quality by asset class:
2010 Neither Past Due nor Impaired
High
Grade Standard
Grade
Sub-standard
Grade
Past Due but not
Impaired
Impaired Financial
Assets Total
(Amounts in Millions)
Cash and cash equivalents P=22,504 P=– P=– P=– P=– P=22,504 Trade and other receivables: Trade: Billed 5,532 3,357 5,328 1,886 1,516 17,619 Unbilled 5,011 – – – – 5,011 Nontrade: Related parties 1 3 12 304 – 320 Others 276 – 33 180 – 489 AFS investments 109 – – – – 109 Derivative assets 23 – – – – 23 Other noncurrent assets – – 4,121 – – 4,121 P=33,456 P=3,360 P=9,494 P=2,370 P=1,516 P=50,196
2009 Neither Past Due nor Impaired
High
Grade Standard
Grade
Sub- standard
Grade
Past Due but not
Impaired
Impaired Financial
Assets Total
(Amounts in Millions)
Cash and cash equivalents P=15,430 P=– P=– P=– P=– P=15,430 Trade and other receivables: Trade: Billed 3,676 2,835 4,547 2,100 2,088 15,246 Unbilled – 5,537 – – – 5,537 Nontrade 372 – 236 233 50 891 Other current assets - – Derivative assets 11 – – – – 11 Other noncurrent assets: AFS investments 98 – – – – 98 Derivative assets 172 – – – – 172 Unbilled receivables – 6,186 – – – 6,186 P=19,759 P=14,558 P=4,783 P=2,333 P=2,138 P=43,571
Credit ratings are determined as follows:
§ “High Grade”
This includes cash and cash equivalents, derivative assets and AFS investments to counterparties with good credit rating or bank standing, thus credit risk is minimal. This normally includes large prime financial institutions, companies and government agencies. For trade receivables, this consists of current month’s billings (less than 30 days) that are expected to be collected within 10 days from the time bills are delivered.

- 95 -
*SGVMC213786*
§ “Standard Grade”
This includes AFS investments that are not classified as “High Grade.” For trade receivables, these consist of current month’s billings (less than 30 days) that are expected to be collected before expiry date (10 to 14 days after billed date).
§ “Sub-standard Grade”
This includes trade receivables that consist of current month’s billings, which are not expected to be collected within 60 days.
The credit quality of financial assets of Rockwell Land is managed using an internal credit ratings method. The table below shows the credit quality by class of asset as at December 31:
2010 A Rating B Rating Total (Amounts in Millions)
Cash and cash equivalents P=321 P=– P=321 Trade receivables from: Sale of condominium units 919 467 1,386 Leases 65 – 65 Advances to officers and employees 7 – 7 Other receivables 50 – 50 AFS investments 278 – 278 P=1,640 P=467 P=2,107
2009 A Rating B Rating Total (Amounts in Millions)
Cash and cash equivalents P=393 P=– P=393 Trade receivables from: Installment contracts 175 140 315 Leases 60 7 67 Advances to officers and employees 9 – 9 Other receivables 17 – 17 AFS investments 245 – 245 P=899 P=147 P=1,046
For trade receivables from sale of condominium units, customers who have no history of delayed payment are classified as having an “A”credit rating while customers who have history of delayed payment but is currently updated are given a “B” credit rating.
Trade receivables from leases are classified as having a credit rating of “A” when tenants pay within the discount period and “B” when tenants pay on or before due date.

- 96 -
*SGVMC213786*
The following table shows the aging analysis of financial assets of the Company as at December 31:
2010
Neither
Past Due Past Due But Not Impaired Impaired
nor
Impaired 31–60 Days
61–90 Days
Over 90 Days
Financial Assets Total
(Amounts in Millions) Cash and cash equivalents: Cash on hand and in banks P=3,631 P=– P=– P=– P=– P=3,631 Cash equivalents 20,739 – – – – 20,739 Trade and other receivables: Trade: Billed electricity 14,353 1,303 393 209 1,518 17,776 Unbilled electricity 5,011 – – – – 5,011 Current portion of installment
contracts receivables 1,385 525 46 227 – 2,183 Service contracts and others 848 95 48 163 172 1,326 Nontrade receivables 434 118 37 414 11 1,014 Other current assets - Derivative assets 24 – – – – 24 Other noncurrent assets: Unbilled receivables 3,063 – – – – 3,063 SC GRAM case refund 780 – – – – 780 AFS investments 403 – – – – 403 Advance payment to suppliers 253 – – – – 253 HTM 61 – – – – 61 Installment contracts receivable 39 – – – – 39 Derivative assets – – – – – – Others 28 – – – – 28 P=51,052 P=2,041 P=524 P=1,013 P=1,701 P=56,331
2009
Neither
Past Due Past Due But Not Impaired Impaired
nor
Impaired 31–60 Days
61–90 Days
Over 90 Days
Financial Assets Total
(Amounts in Millions) Cash and cash equivalents: Cash on hand and in banks P=6,399 P=– P=– P=– P=– P=6,399 Cash equivalents 10,669 – – – – 10,669 Trade and other receivables: Trade: Billed electricity 11,165 – 1,064 1,045 2,088 15,362 Unbilled electricity 5,537 – – – – 5,537 Current portion of installment
contracts receivables 262 62 15 28 – 367 Service contracts and others 1,144 78 18 38 – 1,278 Nontrade receivables 902 2 4 236 234 1378 Other current assets - Derivative assets 11 – – – – 11 Other noncurrent assets: Unbilled receivables 5,406 – – – – 5,406 SC GRAM case refund 780 – – – – 780 AFS investments 361 – – – – 361 Derivative assets 172 – – – – 172 Advance payment to suppliers 135 – – – – 135 HTM 57 – – – – 57 Installment contracts receivable 54 – – – – 54 Notes receivable 29 – – – – 29 P=43,083 P=142 P=1,101 P=1,347 P=2,322 P=47,995

- 97 -
*SGVMC213786*
Liquidity Risk
Liquidity risk is the risk that the Company will be unable to meet its payment obligations when they fall due. The Company manages this risk through monitoring of cash flows in consideration of future payment of obligations and the collection of its trade receivables. The Company also ensures that there are sufficient, available and approved working capital lines that it can draw from at any time.
The Company maintains an adequate amount of cash and cash placements in the event of unforeseen interruption of its cash collections and if available, government securities. The Company also maintains accounts with several relationship banks to avoid significant concentration of cash with one institution.
The following table sets out the maturity profile of the Company’s financial liabilities based on contractual undiscounted payments:
2010
Less than 3
Months 3–12 Months 1–5 Years More than
5 Years Total
(Amounts in Millions) Notes payable P=149 P=– P=– P=– P=149 Trade payables and accrued expenses 20,563 1,193 29 – 21,785 Customers’ refund 1,787 5,344 – – 7,131 Interest-bearing long-term financial
liabilities: Floating rate borrowings 1,107 688 2,028 – 3,823 Fixed rate borrowings 2,077 762 7,226 10,682 20,747 Preferred stock 551 1,653 – – 2,204 Customers’ deposits 600 600 – – 1,200 Other noncurrent liabilities 22 142 241 – 405 Total undiscounted financial liabilities P=26,856 P=10,382 P=9,524 P=10,682 P=57,444
2009
Less than 3
Months 3–12 Months 1–5 Years More than
5 Years Total
(Amounts in Millions) Notes payable P=513 P=– P=– P=– P=513 Trade payables and accrued expenses 23,602 495 32 – 24,129 Customers’ refund 365 8,782 – – 9,147 Interest-bearing long-term financial
liabilities: Floating rate borrowings 104 1,366 4,968 3,668 10,106 Fixed rate borrowings 807 1,395 12,711 – 14,913 Preferred stock – 1,784 325 – 2,109 Customers’ deposits 350 1,188 26,595 – 28,133 Other noncurrent liabilities – – 3,180 – 3,180 Total undiscounted financial liabilities P=25,741 P=15,010 P=47,811 P=3,668 P=92,230
The maturity profile of bill deposits is not determinable since the timing of each refund is linked to the cessation of service which is not reasonably predictable. However, the Company estimates that a portion of bill deposits (including related interest), amounting to P=678 million, will be refunded in 2011. This is shown as part of “Trade payables and accrued expenses” account in the 2010 consolidated statement of financial position.
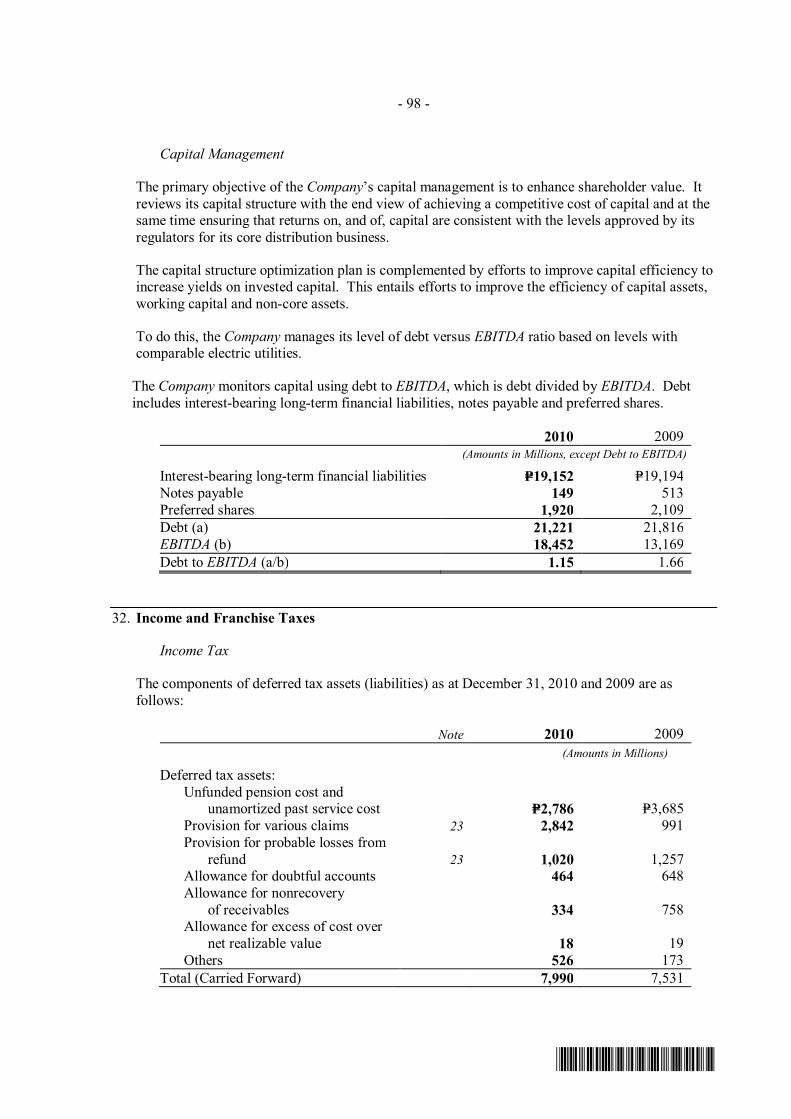
- 98 -
*SGVMC213786*
Capital Management
The primary objective of the Company’s capital management is to enhance shareholder value. It reviews its capital structure with the end view of achieving a competitive cost of capital and at the same time ensuring that returns on, and of, capital are consistent with the levels approved by its regulators for its core distribution business.
The capital structure optimization plan is complemented by efforts to improve capital efficiency to increase yields on invested capital. This entails efforts to improve the efficiency of capital assets, working capital and non-core assets.
To do this, the Company manages its level of debt versus EBITDA ratio based on levels with comparable electric utilities.
The Company monitors capital using debt to EBITDA, which is debt divided by EBITDA. Debt includes interest-bearing long-term financial liabilities, notes payable and preferred shares.
2010 2009 (Amounts in Millions, except Debt to EBITDA)
Interest-bearing long-term financial liabilities P=19,152 P=19,194 Notes payable 149 513 Preferred shares 1,920 2,109 Debt (a) 21,221 21,816 EBITDA (b) 18,452 13,169 Debt to EBITDA (a/b) 1.15 1.66
32. Income and Franchise Taxes
Income Tax
The components of deferred tax assets (liabilities) as at December 31, 2010 and 2009 are as follows:
Note 2010 2009
(Amounts in Millions)
Deferred tax assets: Unfunded pension cost and
unamortized past service cost P=2,786 P=3,685 Provision for various claims 23 2,842 991 Provision for probable losses from
refund 23 1,020 1,257 Allowance for doubtful accounts 464 648 Allowance for nonrecovery
of receivables 334 758 Allowance for excess of cost over
net realizable value 18 19 Others 526 173 Total (Carried Forward) 7,990 7,531
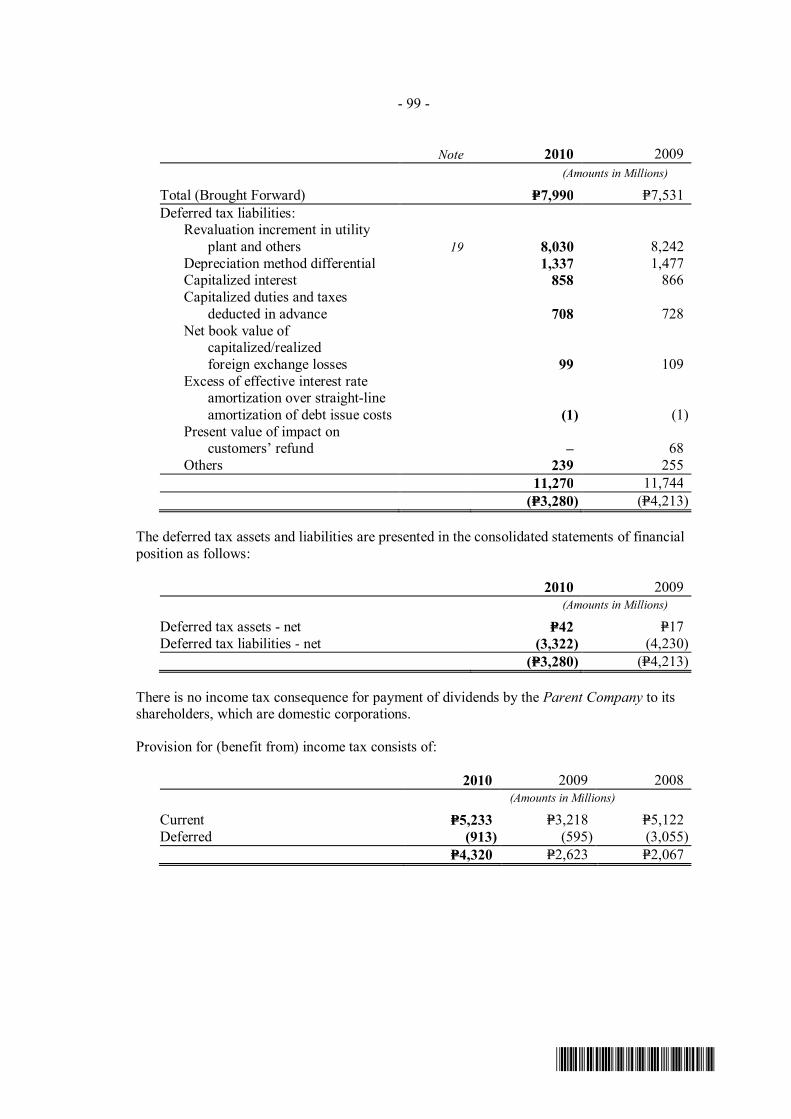
- 99 -
*SGVMC213786*
Note 2010 2009
(Amounts in Millions)
Total (Brought Forward) P=7,990 P=7,531 Deferred tax liabilities: Revaluation increment in utility
plant and others 19 8,030 8,242 Depreciation method differential 1,337 1,477 Capitalized interest 858 866 Capitalized duties and taxes
deducted in advance 708 728 Net book value of
capitalized/realized foreign exchange losses 99 109
Excess of effective interest rate amortization over straight-line amortization of debt issue costs (1) (1)
Present value of impact on customers’ refund – 68
Others 239 255 11,270 11,744 (P=3,280) (P=4,213)
The deferred tax assets and liabilities are presented in the consolidated statements of financial position as follows:
2010 2009 (Amounts in Millions)
Deferred tax assets - net P=42 P=17 Deferred tax liabilities - net (3,322) (4,230) (P=3,280) (P=4,213)
There is no income tax consequence for payment of dividends by the Parent Company to its shareholders, which are domestic corporations.
Provision for (benefit from) income tax consists of:
2010 2009 2008 (Amounts in Millions)
Current P=5,233 P=3,218 P=5,122 Deferred (913) (595) (3,055) P=4,320 P=2,623 P=2,067

- 100 -
*SGVMC213786*
A reconciliation between the provision for (benefit from) income tax computed at statutory income tax rate using tax rates of 30% in 2010 and 2009 and 35% in 2008, and provision for (benefit from) income tax as shown in the consolidated statements of income is as follows:
2010 2009 2008 (Amounts in Millions)
Income tax computed at statutory tax rates P=4,331 P=2,695 P=1,820 Income tax effects of: Interest income subjected to lower
final tax rate (183) (113) (105) Nondeductible interest expense 61 43 77 Equity in net earnings of associates
and a joint venture (85) (73) (70) Nondeductible expenses 79 265 65 Nontaxable income (63) (54) (4) Others 180 (140) 284 P=4,320 P=2,623 P=2,067
On December 18, 2009, the BIR issued Revenue Regulation, or RR No. 16–2008, which implemented the provisions of RA No. 9504 on Optional Standard Deductions or OSD. Such regulation allowed both individual and corporate taxpayers to use OSD in computing their taxable income. For corporations, they may elect a standard deduction in an amount not exceeding 40% of gross income in lieu of the itemized allowed deduction. For the years ended December 31, 2010 and 2009, none of the entities in the MERALCO Group availed of the OSD in computing taxable income, except for RSIC.
The Company’s temporary difference for which deferred tax assets have not been recognized pertains to the allowance for doubtful accounts amounting P=39 million and P=41 million as at December 31, 2010 and 2009, respectively.
In 2009, MCIT amounting to P=6 million was applied to current RCIT due.
Franchise Tax
Local Franchise Tax
Consistent with the Decisions of the ERC on Case Nos. 2001-646 and 2001-900, franchise tax is presented as a separate line item in the customers’ bill and computed as a percentage of the sum of all charges, except taxes and the universal charge.
Further, the Implementing Rules and Regulations provide that franchise taxes shall be paid only on its distribution wheeling and captive market supply revenues. At present, pending the promulgation of guidelines from the Department of Finance, the Parent Company is paying local franchise tax based on the sum of the charges in the customers’ bill, except on taxes and the universal charge.

- 101 -
*SGVMC213786*
33. Contingencies
Contingent Assets
Advances for Pass-Through Costs
As at December 31, 2010, MERALCO has contingent assets relating to unrecovered system loss charges of P=805 million.
Up to May 2008, MERALCO referred to the “Guidelines for the Calculation of the Over-under- Recovery in the Implementation of the System Loss Rate by Distribution Utilities” issued by the ERC on November 23, 2005 to recover the system loss under-recoveries and began to bill customers for such under-recoveries beginning the February 2006 billing month. The guidelines allowed the recovery to be implemented over a period of 17 months or until such time that the amount has been collected. Following such guideline, a total of P=284 million in unbilled system loss charges have been billed as at February 28, 2011. However, on June 4, 2008, the ERC decided and directed MERALCO to file a new application for the recovery of the system loss adjustments after the former has confirmed and approved the average transmission rate to be used in computing the system loss adjustment.
Overpayment of Income Tax related to SC Refund
As a result of the Decision of the SC for MERALCO to refund P=0.167 per kWh to affected customers covering the period February 1994 to May 2003, MERALCO overpaid income tax in the amount of P=7,107 million for taxable years 1994 to 1998 and 2000 to 2001. Hence, MERALCO filed a claim for the recovery of such excess income taxes paid. After examination of the books of MERALCO for the covered periods, the BIR determined that MERALCO had in fact overpaid income taxes in the amount of P=6,690 million. However, the BIR also maintained that MERALCO is entitled to a refund amount of only P=894 million, which pertains to taxable year 2001 on the ground that the period for filing a claim has prescribed.
The BIR then approved the refund of P=894 million through issuance of tax credit certificates or TCCs, proportionate to the actual refund of claims to utility customers. The BIR initially issued TCC amounting to P=317 million corresponding to actual refund to customers as at August 31, 2005.
As at December 31, 2010 and 2009, the amount of unissued TCCs of P=577 million out of the P=894 million refund entitlement is presented as part of “Other noncurrent assets” account in the consolidated statement of financial position.
MERALCO filed a Petition assailing the denial by the BIR of its tax refund claim of P=5,796 million, net of P=894 million, as approved by the BIR for taxable year 2001. In a Decision dated December 6, 2010, the Court of Tax Appeals Second Division granted MERALCO’s claim and ordered the BIR to refund or to issue tax credit certificate in favor of MERALCO in the amount of P=5,796 million. The said Decision is now subject of a Motion for Clarification and Partial Reconsideration filed by MERALCO and a Motion for Reconsideration filed by the BIR. Both motions are pending resolution as at February 28, 2011.

- 102 -
*SGVMC213786*
Change in Tax Basis
On February 4, 2008, the SC denied with finality a motion for reconsideration filed by the Commissioner of Internal Revenue or CIR, against MERALCO, with respect to the issue on excess income tax paid by the latter. The SC affirmed a CA decision and ordered the CIR to refund or issue a TCC in favor of MERALCO for P=107 million representing overpaid income taxes for taxable years 1987 and 1988. The overpayment stemmed from the effectivity of Executive Order No. 72, which subjected MERALCO to regular corporate income tax instead of 2% franchise tax based on gross receipts it was previously liable for. As at February 28, 2011, Meralco is in the process of filing its application for the issuance of the TCC.
Contingent Liabilities
Real Property Tax or RPT Assessments
Six local governments units or LGUs assessed MERALCO for deficiency real property taxes on certain assets of the Parent Company. The assets include any of electric poles, wires, insulators, and transformers, collectively referred to as TWIP. Of these LGUs, one has secured a favorable decision from the CA, whereby the appellate court directed the LGU concerned to present an assessment of the foregoing properties and collect the pertinent tax in accordance with the Local Government Code or LGC of 1991. Such Decision was further appealed to the SC where it is now submitted for resolution. With respect to the cases of the five other LGUs, these are pending with their respective administrative bodies or government offices.
Accordingly, MERALCO deemed it prudent to include in its third RP operating expenses, payment of RPT on its TWIP commencing RY 2011. The Company, however, continues to pursue its legal actions and avail of legal remedies with respect to the legality, validity and applicability of the assessments, and in the event, payment is warranted or appropriate, to recover any resulting real estate tax payments through separate application under Article 11 of the “Rules for Setting Distribution Wheeling Rates for Privately Owned Distribution Utilities Operating under Performance Based Regulation (First Entry Group: Third Regulatory Period).”
Local Franchise Tax Assessments
Certain municipalities have served assessment notices on MERALCO for local franchise taxes. As provided in the LGC, only cities and provincial governments may impose taxes on establishments doing business in their localities. On the basis of the foregoing, the management of MERALCO and its legal counsel believe that it has strong legal grounds to contest such assessments.
Income Tax Assessment on Taxable Year 1999
In line with the Decision of the SC ordering MERALCO to refund P=0.167 per kWh to affected consumers for the period February 1994 to May 2002, MERALCO amended its tax return for taxable year 1999, which had then been served a Letter of Authority to examine its books by the BIR. The amended tax return for 1999 reflected an overpayment of P=977 million, which was subsequently applied against the income tax liability for taxable year 2002. As discussed under “Overpayment of Income Tax related to SC Refund” section of this Note, a claim for refund has been filed for taxable years 2000 and 2001.
In February 2010, the BIR issued MERALCO a tax clearance, which included taxable year 1999.

- 103 -
*SGVMC213786*
Mediation with NPC
The NPC embarked into a Power Development Program or PDP, which consisted of contracting generating capacities and the construction of its own as well as private sector generating plants, to avoid a power supply crisis. To address the concerns of the creditors of NPC, namely, Asian Development Bank and the World Bank, the then Department of Energy or DOE required MERALCO to enter into a long-term supply contract with NPC.
On November 21, 1994, MERALCO entered into a 10-year CSE with NPC to commence on January 1, 1995, the terms of the CSE and the rates charged to MERALCO of which approved by the BOD of NPC and the then ERB, respectively.
Separately, the DOE further asked MERALCO’s support and commitment to provide a market for half of the output of the Camago-Malampaya gas field, which was to generate significant revenues for the Philippine Government.
MERALCO’s purchases from NPC exceeded the contract level in the first seven years of the CSE. However, the 1997 Asian crisis resulted in a significant dip in energy sales.
While the events were beyond the control of MERALCO, NPC refused to honor the Parent Company’s good faith notification. A dispute ensued and both parties agreed to go into mediation.
The mediation resulted in the signing of a SA conditioned on ERC’s approval on July 15, 2003. The SA was approved by the respective BODs of NPC and MERALCO. The net settlement amount of P=14.3 billion was agreed upon by NPC and MERALCO and manifested before the ERC through a Joint Compliance dated January 19, 2006.
Subsequently, the Office of the Solicitor General or OSG filed a “Motion for Leave to Intervene with Motion to Admit Attached Opposition to the Joint Application and Settlement Agreement between NPC and the Parent Company.” As a result, MERALCO separately sought judicial clarifications with RTC-Pasig. Pre-trials are ongoing. However, the OSG refused to participate in the pre-trial and opted to seek a Temporary Restraining Order or TRO from the CA.
In the event the SA is disapproved, MERALCO and NPC shall revert to their respective positions before the mediation, which shall be resolved through arbitration. On the other hand, a decision by the RTC Pasig shall mean that the agreement is valid although enforcement of the SA is dependent on the final approval by the ERC, which shall be the basis for the recognition of any liability or receivable.
Deferred PPA
On October 14, 2009, the ERC released its findings on the Parent Company’s implementation of the collection of the approved pass-through cost under-recoveries. According to the ERC, MERALCO over-recovered P=268 million of deferred PPA, transmission line costs related to QPPL and deferred accounting adjustments, or DAA incurred in 2004. Consequently, it directed MERALCO to refund said amount to customers, along with P=184 million in carrying charges, or an equivalent of P=0.0169 per kWh. MERALCO implemented the refund beginning November 2009 until September 2010. However, the ERC has yet to rule on MERALCO’s under-recovered deferred PPA of P106 million. As at December 31, 2010, MERALCO has filed a Motion for Reconsideration, which is pending decision of the ERC.

- 104 -
*SGVMC213786*
COA Audit
As discussed in Note 2 – Rate Regulations, the SC, in its Decision dated December 6, 2006 on the MERALCO Unbundling case, ruled that a COA audit was not a prerequisite for the determination of a utility’s rates in connection with MERALCO’s rate unbundling case. While affirming the ERC’s authority on rate-fixing, the SC nevertheless directed the ERC to request the COA to conduct a complete audit of the books, records and accounts of MERALCO. Thus, in compliance with the SC directive , the ERC engaged the COA on January 15, 2007 to conduct an audit using calendar years 2004 and 2007 as test years.
The COA audit, which began in September 2008 was completed in August 2009.
On February 17, 2010, the Parent Company received a copy of the ERC Order related to Case No. 2001-900 RC, entitled “In the Matter of the Application for the Approval of the Unbundled Rates pursuant to the Provision of the Application for the Approval of the Unbundled Rates pursuant to the Provision of RA No. 9136, MERALCO, Applicant,” which directed all intervenors in the case to submit within 15 days from receipt of their respective comments on the COA’s “Report No. 2009-01 Rate Audit Unbundled Charges.”
The Company has already submitted its comment on the COA audit report. Similarly, the intervenors have filed their comments to the COA audit report and the Company has responded to the same. The Company is awaiting the action of the ERC on the COA Audit Report.
Others
Related provisions for items estimable amounted to P=4,652 million, P=3,351 million, P=318 million in 2010, 2009 and 2008 respectively, gross of potential recoveries.
Management, together with its internal and external counsels, believes that the probable resolution of these issues will not materially affect the Company’s financial position and results of operations.
34. Significant Contracts and Commitments
NPC
Transition Supply Contract or TSC with NPC
MERALCO and NPC have a Transition Supply Contract or TSC, effective the shorter of five years from November 16, 2006 or one year after the introduction of open access, should open access be in place within the five-year contract period. Two addenda for additional contracted volumes were signed, the most recent being in 2010. The adjusted contracted volume was for a total of more than 40,000 GHW up to 2011. The terms of the TSC include the following among others:
a. Billings for the contracted volume to be based on NPC’s time-of-use or TOU generation rate as approved by the ERC, plus certain mandated adjustments;
b. Submission of month-end and day-ahead nominations of energy quantities in kilowatt hours for committed purchase quantity;
c. Adjustments to the monthly contracted energy subject to certain conditions;

- 105 -
*SGVMC213786*
d. Conditions of and when MERALCO may source power from NPC in excess of the Contracted Energy responsibility of NPC to provide replacement power; and
e. Energy off-take in excess of the TSC quantities deemed to be taken.
While additional TSC volumes have been contracted , discussions between the Parent Company and NPC for the extension of the TSC are ongoing.
FGPC and FGP
MERALCO is committed to contract 1,500-MW of the 3,000-MW output of the Camago-Malampaya gas field, as directed by the Department of Energy.
Hence, the Parent Company entered into separate 25-year PPAs with FGPC (March 14, 1995) and FGP (July 22, 1999) for a minimum number of kWh of the net electrical output of the Sta. Rita and San Lorenzo power plants, respectively. The PPA with FGPC terminates on March 13, 2020, while that of FGP ends on January 8, 2022.
On January 7, 2004, Meralco, FGP and FGPC signed the Amendment to their respective PPAs. The negotiations resulted in a package of concessions including the assumption of FGP and FGPC of community taxes at current tax rate, while conditional concessions include increasing the discounts on excess generation, payment of higher penalties for non-performance up to a capped amount, recovery of accumulated deemed delivered energy until 2011 resulting in the non-charging of Meralco of excess generation charge for such energy delivered beyond the contracted amount but within a 90% capacity quota. The amended terms under the respective PPAs of FGP and FGPC were approved by the ERC on May 31, 2006.
Under the respective PPAs of FGP and FGPC, the fixed capacity fees and fixed operating and maintenance fees are recognized monthly based on the actual Net Dependable Capacity tested and proven, which is usually conducted on a semi-annual basis.
QPPL
The Parent Company entered into a PPA with QPPL on August 12, 1994, which was subsequently amended on December 1, 1996. Under the terms of the amended PPA, MERALCO is committed to purchase a specified volume of electric power and energy from QPPL, subject to certain terms and conditions. The Power Purchase Contract is for a period of 25 years.
In the amended PPA signed on February 21, 2008, the amount billable by QPPL included a transmission line charge reduction in lieu of a previous rebate program. The Agreement also included an advance payment mechanism under which requires Meralco to pay QPPL $2.85 million per annum for ten years beginning 2008. Thereafter, QPPL shall return the same amount annually without adjustment for cost of money in equal annual payments. However, if Meralco is able to dispatch QPPL at a plant capacity factor of no less than 86% in any particular year, Meralco shall not be required to pay the $2.85 million in that year. This advance Payment Mechanism was requested by QPPL to offset the difference between the transmission line charge specified in the TLA and the ERC-approved T/line charge in March 2003.
On December 16, 1997, NPC, QPPL and Meralco entered into a Substation Interconnection Agreement, similar to the one entered with FGPC.
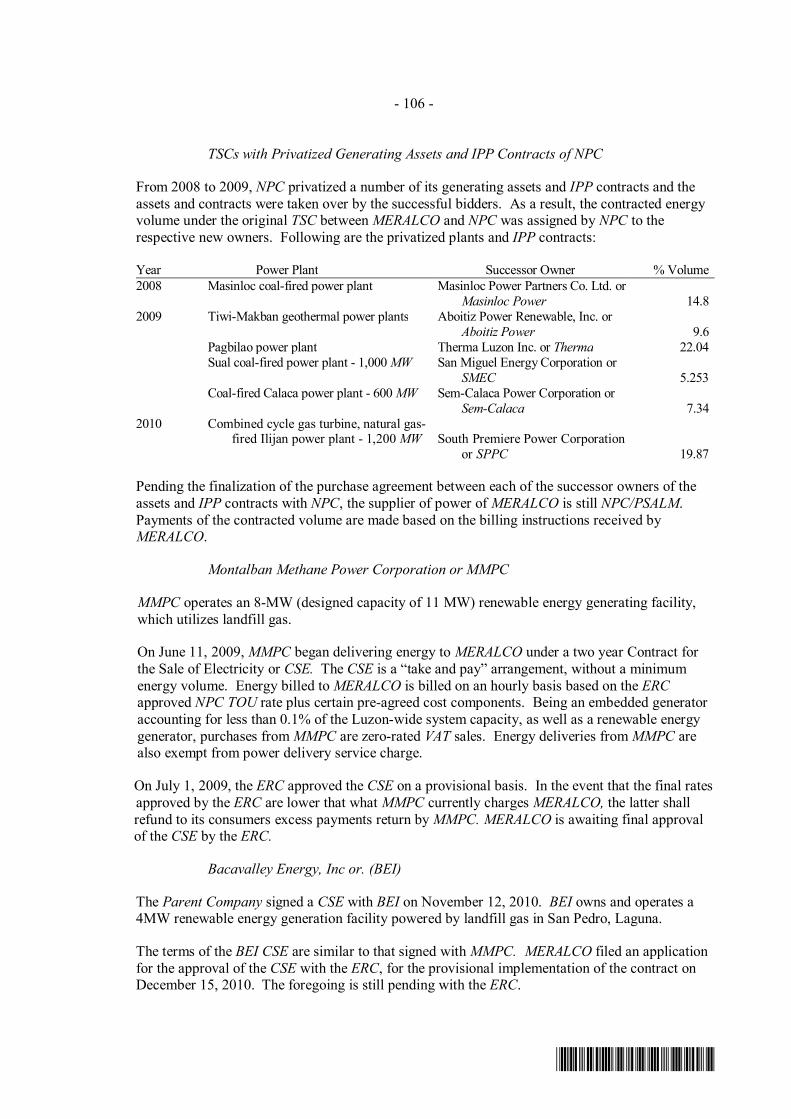
- 106 -
*SGVMC213786*
TSCs with Privatized Generating Assets and IPP Contracts of NPC
From 2008 to 2009, NPC privatized a number of its generating assets and IPP contracts and the assets and contracts were taken over by the successful bidders. As a result, the contracted energy volume under the original TSC between MERALCO and NPC was assigned by NPC to the respective new owners. Following are the privatized plants and IPP contracts:
Year Power Plant Successor Owner % Volume 2008 Masinloc coal-fired power plant Masinloc Power Partners Co. Ltd. or
Masinloc Power 14.8 2009 Tiwi-Makban geothermal power plants Aboitiz Power Renewable, Inc. or
Aboitiz Power 9.6 Pagbilao power plant Therma Luzon Inc. or Therma 22.04 Sual coal-fired power plant - 1,000 MW San Miguel Energy Corporation or
SMEC 5.253 Coal-fired Calaca power plant - 600 MW Sem-Calaca Power Corporation or
Sem-Calaca 7.34 2010 Combined cycle gas turbine, natural gas-
fired Ilijan power plant - 1,200 MW South Premiere Power Corporation
or SPPC 19.87
Pending the finalization of the purchase agreement between each of the successor owners of the assets and IPP contracts with NPC, the supplier of power of MERALCO is still NPC/PSALM. Payments of the contracted volume are made based on the billing instructions received by MERALCO.
Montalban Methane Power Corporation or MMPC
MMPC operates an 8-MW (designed capacity of 11 MW) renewable energy generating facility, which utilizes landfill gas.
On June 11, 2009, MMPC began delivering energy to MERALCO under a two year Contract for the Sale of Electricity or CSE. The CSE is a “take and pay” arrangement, without a minimum energy volume. Energy billed to MERALCO is billed on an hourly basis based on the ERC approved NPC TOU rate plus certain pre-agreed cost components. Being an embedded generator accounting for less than 0.1% of the Luzon-wide system capacity, as well as a renewable energy generator, purchases from MMPC are zero-rated VAT sales. Energy deliveries from MMPC are also exempt from power delivery service charge.
On July 1, 2009, the ERC approved the CSE on a provisional basis. In the event that the final rates approved by the ERC are lower that what MMPC currently charges MERALCO, the latter shall refund to its consumers excess payments return by MMPC. MERALCO is awaiting final approval of the CSE by the ERC.
Bacavalley Energy, Inc or. (BEI)
The Parent Company signed a CSE with BEI on November 12, 2010. BEI owns and operates a 4MW renewable energy generation facility powered by landfill gas in San Pedro, Laguna.
The terms of the BEI CSE are similar to that signed with MMPC. MERALCO filed an application for the approval of the CSE with the ERC, for the provisional implementation of the contract on December 15, 2010. The foregoing is still pending with the ERC.

- 107 -
*SGVMC213786*
Committed Energy Volume to be Purchased
The following are forecasted purchases/payments to IPPs corresponding to the TOP volume provisions of the contracts. The assumptions used for the TOP volume include (i) fixed cost components, (ii) variable cost components, (iii) fixed cost forecasts projected using the U.S. and Philippine Consumer Price Index or CPI and foreign exchange rate, (iv) fuel cost forecasts based on heat rates and fuel prices projected using U.S. CPI, among others.
Year Minimum Energy Quantity (MEQ) Equivalent Amount
(In Million Kilowatt-Hours) (In Millions) 2011 14,880 71,899 2012 14,880 72,306 2013 14,880 73,448 2014 14,880 74,615 2015 14,880 76,128 2016 14,780 77,230 2017-2025 133,024 746,208
Operating Lease Commitments
Rockwell Land is a lessor of commercial spaces included in the investment properties portfolio. These noncancellable leases have remaining terms between two to 10 years up to 2015. All leases include an annual escalation. Future minimum lease revenue follows:
Amount (In Millions)
2011 P=365 2012 111 2013 68 2014 64 2015 18 P=626
Construction Contracts of Rockwell Land
One Rockwell
In April 2008, Rockwell Land entered into a contract with DATEM incorporated for the construction of the superstructure of One Rockwell, amounting to P=2,500 million, inclusive of all taxes and related costs. As at December 31, 2010 the accumulated amount incurred was P=1,800 million.
The Grove
The superstructure works related to The Grove project was contracted by Hilmarc’s Construction Corporation or Hilmarc. The contract sum for the work amounted to P=1,600 million, inclusive of all pertinent local and national taxes, overhead and cost of labor and materials and all cost necessary for the proper execution of the work. Superstructure works commenced in February 2010 and is currently ongoing. As at December 31, 2010, total amount incurred and paid related to this contract amounted to P=113 million.

- 108 -
*SGVMC213786*
Edades Garden and Villas
In October 2010, Rockwell Land contracted Hilmarc to do substructure works related to the Edades Garden and Villas Project. The contract amounted to a fixed fee of P=2,500 million, inclusive of all pertinent local and national taxes, overhead and cost of labor and materials and all cost necessary for the proper execution of the works. Substructure works commenced in November 2010 and is currently ongoing. As at December 31, 2010, P=133 million has been incurred and was already paid.
35. Earnings Per Share Attributable to Equity Holders of the Parent
Basic and diluted earnings per share are calculated as follows:
2010 2009 2008
(In Millions, Except per Share Data)
Net income attributable to equity holders of the parent (a) P=9,685 P=6,005 P=2,800
Shares: Common shares at beginning of year 1,127 1,104 1,103 Weighted average common shares – issuances – 4 1 Weighted average common shares (b) 1,127 1,108 1,104 Number of shares under option – – 10 Weighted average number of shares that would
have been issued at fair value – – (8) Adjusted weighted average common shares –
diluted (c) 1,127 1,108 1,106
Per Share Amounts: Basic earnings per share (a/b) P=8.59 P=5.42 P=2.54
Diluted earnings per share (a/c) P=8.59 P=5.42 P=2.53 36. Other Matters
Revised SL Caps
On September 29, 2004, the ERC issued the “Guidelines for the Application and Approval of Cap on the Recoverable Rate of Distribution System Losses” requiring the submission of segregated system loss caps for technical, non-technical and administrative losses and the Parent Company estimates for the succeeding five years. Thereafter, a series of exchanges were made between ERC and the different distribution utilities.
On December 8, 2008, the ERC promulgated Resolution No. 17, Series of 2008, entitled “A Resolution Adopting a New System Loss Cap for Distribution Utilities,” where a lower maximum rate of system loss (technical and non-technical) that a utility can pass on to its customers. The new system loss cap shall be the lower of the actual but not to exceed 8.5% for private utilities, effective January 2010 billing, which is one percentage point lower than the 2009 system loss cap of 9.5%. The actual company use (administrative loss) shall be treated as part of the operation and maintenance expense in the next reset for utilities under PBR. The manner by
- 109 -
*SGVMC213786*
which the utility will be rewarded for their efforts in system loss reduction shall be addressed by the ERC in the PIS under PBR.
On December 8, 2009, MERALCO filed a Petition to Amend the said Resolution and suspension of the implementation of the new system loss cap of 8.5% starting January 2010. The proposed amendment aims for the consistency with the provisions of RA No. 9136 and RA No. 7832, by increasing the level of system loss cap to not less than 9%.
Prior to the Petition, the ERC denied MERALCO’s appeal contained in a letter to the ERC, seeking deferment of the imposition of the revised system loss cap.
As at February 28, 2011, the ERC has yet to act on the Petition.
Retail Competition
On February 18, 2011, the ERC pursuant to its mandate under Section 3, Rule 12 of the EPIRA Implementing Rules and Regulations issued an Order setting public hearings for the purpose of determining whether or not Open Access and Retail Competition may already be declared. The DOE, NPC and PSALM were directed to appear at the hearings and present evidence on the matter. MERALCO is an intervenor in said case. Hearings have been conducted and the parties have been directed to submit a legal memorandum on this matter. Another hearing has been set for April 6, 2011.
Philippine Export Zone Authority or PEZA – ERC Jurisdiction
On September 13, 2007, PEZA issued “Guidelines in the Registration of Electric Power Generation Facilities/Utilities/Entities Operating Inside the Ecozones” and “Guidelines for the Supply of Electric Power in Ecozones.” These Guidelines effectively give PEZA franchising and regulatory powers in ecozones. The Guidelines are the subject of an injunction case filed by the DUs at the RTC-Pasig.
Meantime, in support of the government’s objective of providing lower cost to ecozone locators, the Company entered into a MOA with NPC on September 17, 2007 for the provision of special ecozone rates to high load factor PEZA-accredited industries. The ERC allowed the immediate implementation of the program, which is still ongoing.
Sucat-Araneta-Balintawak Transmission Line
The Sucat-Araneta-Balintawak transmission line is a two-part transmission line, which completed the 230kV-line loop within Metro Manila. The two main parts are the Araneta to Balintawak leg and, the Sucat to Araneta leg, which cuts through Dasmariñas Village, Makati City.
Up to May 2001, NPC operated and developed the nationwide transmission grid. Thereafter, with the effectivity of the EPIRA, the authority and responsibility were transferred to TransCo. The distribution lines of MERALCO are connected to the transmission grid of TransCo. Since January 15, 2009, NGCP began to operate the transmission grid of TransCo under a Concession Agreement.

- 110 -
*SGVMC213786*
On March 10, 2000, the residents along Tamarind Road, Dasmariñas Village, Makati City or plaintiffs, filed a case with the RTC-Makati against NPC enjoining the latter from further preparing and installing high voltage cables to the steel pylons erected near the plaintiffs’ homes and from energizing and transmitting high voltage electric current through said cables because of the alleged health risks and danger posed by the same. On March 13, 2000, the RTC-Makati initially issued an Order directing the parties to maintain the status quo. On April 3, 2000, RTC-Makati granted the preliminary injunction prayed for by the plaintiffs. The decision was confirmed by the SC on March 23, 2006, which effectively reversed a decision of the CA to the contrary. The RTC-Makati subsequently issued a writ of execution based on the order of the SC, as moved by the plaintiffs. MERALCO, in its capacity as an intervenor, was constrained to file an Omnibus Motion to maintain status quo because of the significant effect of a de-energization of the Sucat-Araneta line to the public and economy. Shutdown of the 230-kV line will result in widespread and rotating brownouts within MERALCO’s franchise area with certain power plants unable to run at their full capacities.
On September 8, 2009, the RTC-Makati granted the motions for intervention filed by intervenors MERALCO and NGCP and dissolved the Writ of Preliminary Injunction issued, upon the posting of a counter bond by defendant NPC in the amount of P=10 million, intervenor MERALCO in the amount of P=2 million, and intervenor NGCP in the amount of P=2 million, subject to the condition that NPC and intervenors pay all damages, which the plaintiffs may incur as a result of the Writ of Preliminary Injunction.
Thereafter, the plaintiffs questioned the RTC-Makati order before the CA. As at February 28, 2011, this case remains pending for resolution in the CA.
Purchase of Subtransmission Assets or STAs
On June 30, 2008, the ERC approved the sale of various STAs of Transco to the Parent Company as covered by a Contract to Sell for P=188 million, which was fully paid in September 2008.The Parent Company began billing customers connected to the STAs from August 26, 2009 to September 25, 2009.
On November 25, 2009, the Parent Company signed a Contract to Sell with Transco for the sale and purchase of subtransmission assets for P=86 million. On December 3, 2009, the Parent Company and Transco jointly filed an application with the ERC for the sale of various subtransmission lines/assets of Transco to MERALCO. On February 25, 2010, the ERC approved the sale of Transco’s subtransmission assets in favor of MERALCO under the terms provided in the Contract to Sell. As at February 28, 2011, the actual settlement between the Parent Company and Transco remains pending upon the request of Transco.
With respect to metering arrangement, NGCP will continue to be the meter service provider until NGCP is able to install its totalizing meters at the new delivery points. Thereon, it will be the Parent Company’s obligation and responsibility to meter the customers. However, even if the Parent Company has the technical capability to meter all these customers, it can assume the metering function from NGCP for the customers with electric service contracts only upon securing a WESM Metering Provider License from the ERC.
A MOA, which will cover in detail the protocol between the Parent Company, NGCP, the Suppliers (NPC and Team Energy) and PEMC with regard to the foregoing arrangements, is being finalized.

- 111 -
*SGVMC213786*
Acquisition of Carmelray Industrial Park II or CIP2’s existing Distribution System and Concession Agreement
On April 11, 2009, pursuant to a MOA entered into between MERALCO and Carmelray-JTCI Corporation or CJC, and duly approved by the PEZA, MERALCO took over the 13.8-kV distribution line facilities and switching stations of the CIP2 in order to ensure adequate supply of electricity to the park and its locators for a period of 19 years from effective date until June 28, 2028. CIP2 is located in Calamba, Laguna, which is within the franchise area of MERALCO. On April 17, 2009, the board of PEZA approved the registration by MERALCO as a PEZA-registered utilities enterprise subject to certain conditions.
As a PEZA-registered enterprise, MERALCO has the option to pay income tax at 5% of gross income generated from locators in CIP2, in lieu of all national and local taxes, except real property taxes. However, Meralco opted to file its income tax return under the regular corporate income tax calculation method.
Petition for Dispute Resolution
On September 9, 2008, MERALCO filed a Petition for Dispute Resolution with the ERC, against PEMC, TransCo, NPC and PSALM as a result of the congestion in the transmission system of TransCo arising from the outage of the San Jose-Tayabas 500kV Line 2 on June 22, 2008, followed by the outage of the 500kV 600 MVA Transformer Bank No.2 of TransCo’s San Jose, Bulacan substation on July 11, 2008. The Petition seeks to, among others, and direct PEMC to adopt the NPC-TOU rate or the new price determined through the price substitution methodology of PEMC as approved by the ERC, as basis for its billing during the period of the congestion; direct NPC and PSALM to refund the transmission line loss components of the line rentals associated with NPC/PSALM bilateral transactions from the start of WESM operation on June 26, 2006.
In relation to said Petition, PEMC has agreed to implement the segregation of the line rental amounts associated with the Parent Company’s bilateral contracts from the WESM energy trading amount in accordance with the WESM Rules, as requested by the Parent Company.
Hearings on the petition have been completed and pending the resolution by the ERC.
PSALM versus PEMC and MERALCO
Due to the significant increases in WESM prices during the 3rd and 4th months of the WESM operations, a concern was raised by the Parent Company with the PEMC to investigate whether WESM rules were breached or if anti-competitive behavior has occurred.
While resolutions were initially issued by the PEMC directing adjustments of WESM settlement amounts, a series of exchanges and appeals with the ERC ensued. A decision of the ERC, which directed the WESM settlement price for the 3rd and 4th billing months to be NPC-TOU rates, prompted PSALM to file a Motion for Reconsideration with the CA, which was denied on November 6, 2009. In December 2009, PSALM filed a Petition for Review on Certiorari with the SC.
As at February 28, 2011, PSALM’s petition for review is pending resolution by the SC.
- 112 -
*SGVMC213786*
Petition for Dispute Resolution with NPC on Premium Charges
On June 2, 2009, MERALCO filed a Petition for Dispute Resolution against NPC and PSALM with respect to NPC’s imposition of premium charges for the alleged excess energy it supplied to MERALCO covering the billing periods May 2005 to June 2006. The premium charges amounted to P=315 million during the May–June 2005 billing periods which has been paid for by the Parent Company and P=318 million during the November 2005, February 2006 and April-June 2006 billing periods, which is being disputed and withheld by the Parent Company. MERALCO believes that there is no basis for the imposition of the premium charges as there was no ERC-approved TSC between petitioner and NPC and the premium charges imposed by NPC has not been approved by the ERC.

*SGVMC213786*
INDEPENDENT AUDITORS’ REPORT ON SUPPLEMENTARY SCHEDULES The Stockholders and the Board of Directors Manila Electric Company Lopez Building Ortigas Avenue, Pasig City We have audited in accordance with Philippine Standards on Auditing, the consolidated financial statements of Manila Electric Company and Subsidiaries included in this Form 17-A and have issued our report thereon dated February 28, 2011. Our audits were made for the purpose of forming an opinion on the basic financial statements taken as a whole. The schedules listed in the Index to Financial Statements and Supplementary Schedules are the responsibility of the Company’s management. These schedules are presented for purposes of complying with the Securities Regulation Code Rule 68.1 and SEC Memorandum Circular No. 11, Series of 2008 and are not part of the basic financial statements. These schedules have been subjected to the auditing procedures applied in the audit of the basic financial statements and, in our opinion, fairly state in all material respects the financial data required to be set forth therein in relation to the basic financial statements taken as a whole. SYCIP GORRES VELAYO & CO. Gemilo J. San Pedro Partner CPA Certificate No. 32614 SEC Accreditation No. 0094-AR-2 Tax Identification No. 102-096-610 BIR Accreditation No. 08-001998-34-2009, June 1, 2009, Valid until May 31, 2012 PTR No. 2641562, January 3, 2011, Makati City February 28, 2011
SyCip Gorres Velayo & Co. 6760 Ayala Avenue 1226 Makati City Philippines
Phone: (632) 891 0307 Fax: (632) 819 0872 www.sgv.com.ph BOA/PRC Reg. No. 0001 SEC Accreditat ion No. 0012-FR-2
A member firm of Ernst & Young Global Limited

Name of Issuing entity and association of each issue
Number of shares or
principal amount of
bonds and notes
Amount shown in
the balance sheet
Valued based on
market quotation at
balance sheet date
Income received
and accrued
Manila Electric Company
Short-Term Investments - Peso Principal Amount
Land Bank of the Philippines P 1,762 P 1,762 P 93
Banco de Oro Unibank, Inc. 2,871 2,871 77
China Banking Corporation 2,635 2,635 45
Security Bank Corporation 53
Union Bank of the Philippines 2,220 2,220 17
Allied Banking Corporation 38
Metropolitan Bank and Trust Company 28
Bank of Commerce 7
Bank of the Philippine Islands Asset Management and Trust Group 4,800 4,800 18
Rizal Commercial Banking Corporation 2,064 2,064 17
Development Bank of the Philippines 1,733 1,733 9
Corporate Investments of the Philippines, Inc. 10
Philippine Commercial Capital, Inc. (6)
Bank of the Philippine Islands 1,386 1,386 8
Citibank 8
Banco de Oro Trust 4
Philippine Savings Bank 2
Bayan Telecommunications, Inc. 1
Amalgated Investment Bancorporation 50 50 1
ANZ Bank - Philippines 0
Sub-total 19,521 19,521 430
Short-Term Investments - Dollar
Banco de Oro Unibank, Inc. 1
China Banking Corporation 263 263 15
Security Bank Corporation 1
Union Bank of the Philippines 27
Allied Banking Corporation 0
Metropolitan Bank and Trust Company 0
Bank of Commerce 16
Development Bank of the Philippines 7
Sub-total 263 263 67
Total Parent 19,784 19,784 497
Subsidiaries
CEDC 61 61 3
Rockwell Land Corporation or Rockwell Land 411 411 3
MERALCO Industrial Engineering Services Corporation or MIESCOR , and subsidiaries 370 370 12
MERALCO Energy, Inc. or MEI 6 6 0
Corporate Information Solutions, Inc. or CIS and subsidiaries 58 58 6
Lighthouse Overseas Insurance Ltd. or LOIL 49 49 0
Total Subsidiaries 956 956 24
Grand Total P 20,740 P 20,740 P 521
Manila Electric Company and Subsidiaries
Schedule A. Marketable Securities
As at December 31, 2010
(Amounts in millions)

Additions Amounts Amounts Current Not
collected written off Current
Name and Designation of Debtor (2) (3)
Car Loan P 1 P - P 1 P - P - P - P -
Employees Stock Option Plan 961 821 1,044 - 738 - 738
Total Parent 962 821 1,045 - 738 - 738
Total Subsidiaries - - - - - - -
Grand Total P 962 P 821 P 1,045 P - P 738 P - P 738
(Amounts in millions)
Balance at beginning
of period
Balance at end of
period
Manila Electric Company and Subsidiaries
Schedule B. Amounts Receivable from Directors, Officers
Employees, and Principal Stockholders (other than Affiliates)
For the Year Ended December 31, 2010

Name of Issuing entity and description of Investment (1)Number of shares or principal amount
of bonds and notes (2) Amount in millions
Equity in
earnings
(losses) of
investees for
the period (3)
Other (4) Distribution of earnings
by investees (5) Other (6)
Number of
shares or
principal
amounts of
bonds and notes
(2)
Amount in millions (7)
Dividends received
from investments
not accounted for by
the equity method
Manila Electric Company
Investment in Proprietary Shares No. of shares No. of shares
Canlubang Golf and Country Club, Inc. 1 P 0.37 1 P 0.37
Manila Southwoods Golf and Country Club, Inc. 2 0.40 2 0.40
Alabang Country Club, Inc. 2 3.10 2 3.10
Valle Verde Country Club, Inc. 1 0.15 1 0.15
Manila Golf and Country Club, Inc. 2 53.00 2 53.00
Puerto Azul Beach & Country Club, Inc. 12 0.48 12 0.48
Wack Wack Golf & Country Club 2 24.00 2 24.00
Sta. Elena Golf & Country Club, Inc. 2 3.40 2 3.40
Valley Golf & Country Club, Inc. 5 1.10 5 1.10
Evercrest Golf Club Resort Inc. 2 0.10 2 0.10
Green Valley Country Club, Inc. 2 0.06 2 0.06
Eastridge Golf Club, Inc. 4 0.28 4 0.28
Club Filipino 1 0.14 1 0.14
Luisita Golf and Country Club, Inc. 1 0.18 1 0.18
Maya Maya Reef Resort 4,000 0.02 4,000 0.02
Mimosa Golf & Country Club, Inc. 2 1.00 2 1.00
The Orchard Golf & Country Club, Inc. 1 0.28 1 0.28
Quezon City Sports Club, Inc. 2 0.42 2 0.42
Royale Tagaytay Country Club, Inc. 3 0.30 3 0.30
Subic Bay Yatch Club, Inc. 1 0.10 1 0.10
Tagaytay Highlands International Golf Club, Inc. 1 0.58 1 0.58 Sub-total 89.46 89.46
Investment - Others
Philippine Long Distance Telephone Company 2.49 2.49
Asian Eye Institute, Inc. 15.00 15.00
Meralco Employees Savings and Loan Association, Inc. 1.78 1.78
Sub-total 19.26 19.26 Total Parent 108.72 108.72
SubsidiariesMERALCO Industrial Engineering Services Corporation or MIESCOR , and subsidiaries 12.51 12.51 Corporate Information Solutions, Inc. or CIS and subsidiaries 2.73 2.73 Republic Surety and Insurance Company, Inc. or RSIC 0.97 0.97 Rockwell Land Corporation or Rockwell Land 278.05 278.05
Total Subsidiaries 294.26 294.26
Grand Total P 402.98 P 402.98
Manila Electric Company and Subsidiaries
Schedule C. Non-Current Marketable Equity Securities, Other Long-Term Investments in Stock, and Other Investments
As at December 31, 2010

Title of Issue (2)Number of shares
authorized
Number of shares
issued and
outstanding at
shown under
related balance
sheet caption
(in millions)
Number of shares
reserved for options,
warrants,
conversion and
other rights
(in millions)
Number of shares
held by related
parties (3)
Directors, officers
and employeesOthers
Common Stock 1,250 1,127 - - 16 1,111
Manila Electric Company
Schedule I. Capital Stock (1)
As at December 31, 2010

Unappropriated retained earnings, as at December 31, 2009 P 34,253
Revaluation increment on utility plant and others (18,736)
Net income during the year 9,238
Deferred tax assets (7,894)
Dividends declared (7,834)
Appropriation during the year (6,000)
Reversal of appropriation during the year 4,198
Derivative assets (16)
Unappropriated retained earnings, as adjusted to available for dividends P 7,209
Manila Electric Company
Schedule J. Reconciliation of Parent Company Retained Earnings for Dividend Declaration
As at December 31, 2010
( Amounts in millions )

Annex A–Aging of Trade and Other Receivables As at December 31, 2010 (Amount in millions)
Over T o t a l 1 - 30 days 31 - 60 days 61 - 90 days 90 days Trade Receivables – Electricity –
MERALCO A) Billed trade receivables Regular General Service Private P=7,572 P=6,443 P=507 P=135 P=487 Government 814 291 110 58 355 General Power Private 6,568 6,270 174 23 101 Government 2,258 1,202 410 137 509 Flat / Streetlights Private 29 - 9 4 16 Government 376 10 77 34 255 B) Unbilled trade receivables Regular General Service Private 2,272 2,272 - - - Government 103 103 - - - General Power Private 2,210 2,210 - - - Government 424 424 - - - Flat / Streetlights Private - - - - - Government 4 4 - - - Trade Receivables – Electricity – CEDC 157 136 17 2 2
Total Trade Receivables – 22,787 19,365 1,304 393 1,725 Other Trade Receivables 3,509 2,405 620 93 391 Gross Trade Receivables 26,296 21,770 1,924 486 2,116 Non Trade Receivables 1,014 418 132 37 427 Total Receivables 27,310 22,188 2,056 523 2,543 Less: Allowance for doubtful accounts (1,701) - - - (1,701) Net Receivables P=25,609 P=22,188 P=2,056 P=523 P=842