041065a 5/11/04 7:28 am page 1 - annualreports.com€¦ · · 2016-11-17041065a 5/11/04 7:28 am...
TRANSCRIPT

7402 South Kyrene RoadSuite 101Tempe, Arizona 85283Phone: 480-894-6311www.mobilemini.com
THE STORAGE AND OFFICE SOLUTIONS SPECIALISTS
2003 Annual Report
041065a 5/11/04 7:28 AM Page 1

■
■
•
PortableStorage
Solutions
01 02 03
EARNINGS PER SHARE(diluted)
$1.34$1.38(3)(4)
$1.21(1)(2)
01 02 03
OPERATING INCOME($in millions)
$40.6$44.1(3) $44.9 (1)
01 02 03
REVENUES($in millions)
$114.7
$133.1$146.6
1 Pro forma financial information for 2003 excludes Florida litigation expense of approximately $ 5.2 million, net of income tax benefit of $3.3 million.
2 Net income for 2003 excludes debt restructuring expense of approximately $6.4 million, net of income tax benefit of $4.0 million.3 Net income for 2002 excludes debt restructuring expense of approximately $0.8 million, net of income tax benefit of $0.5 million.4 Before extraordinary item.
2003 (1) 2002 (3) 2001
Margin Analysis % of total % of total % of totalrevenues revenues revenues
EBITDA 38.2 40.2 42.6
Operating Income 30.7 33.1 35.3
Net Income 11.9 (2) 14.9 16.3
Corporate Profile
Mobile Mini, Inc. is North America’s leading provider of portable storage solutions through its total fleet of over 91,000portable storage units and portable offices. Through a Company-owned network of 47 branches located in 27 states and oneCanadian province, the Company implements a replicable operating strategy of leasing secure, high quality portable storage con-tainers and office units, to offer a diversified product line and to deliver excellent customer service.
Mobile Mini’s ongoing success in deploying this strategy stems from the Company’s consistent attention to a number of keyoperational drivers. These include expanding and strengthening its infrastructure; adding new or adapting existing products thatsolve customers’ storage problems, marketing, retaining dedicated employees and promoting from within.
Since its founding in 1983, Mobile Mini’s diligent focus on these initiatives has driven the Company’s expansion from one location to a net-work of 47 locations with nearly 300 commissioned sales people and more than 1,400 total employees. At the same time, this strategic focushas enabled the Company to build a solid financial foundation and positioned Mobile Mini, Inc. to continue its pattern of profitable growth.
Branches Coast to Coast
■ Branch Location■ Manufacturing Plant
• Corporate Headquarters
DIRECTORS AND OFFICERS
BOARD OF DIRECTORS
Steven G. BungerChairman, President and Chief Executive Officer
Lawrence TrachtenbergExecutive Vice President and Chief Financial Officer
Carolyn A. ClawsonPresident – SkilQuest, Inc.A sales and management support company
Thomas R. GraunkeCEO and President – KnowledgeNetA business e-learning company
Ronald J. MarusiakDivision President – Micro-Tronics, Inc.A precision machining and tool & die company
Stephen A McConnellPresident – Solano VenturesA private capital investment company
Michael L. WattsChairman and CEO – Sunstate Equipment Company, LLCA construction equipment rental company
CORPORATE OFFICERS
Kyle G. BlackwellSenior Vice President
Russell C. LemleySenior Vice President
Ronald E. MarshallSenior Vice President
Michael J. BungerVice President – Operations
Aric T. ClawsonVice President – Manufacturing
Deborah K. KeeleyVice President – Controller
CORPORATE INFORMATION
SHAREHOLDER INFORMATION
Investor RelationsThe Equity Group800 Third Avenue, 36th FloorNY, NY 10022-7604Telephone: 212-371-8660Fax: 212-421-1278
Transfer Agent and RegistrarWells Fargo Bank Minnesota, N.A.Shareowner Services161 N. Concord Exchange St.South St. Paul, MN 55075-1139
Independent Public AuditorsErnst & Young LLPTwo North Central Avenue, Suite 2300Phoenix, Arizona 85004-2347
Independent CounselBryan Cave LLPTwo North Central Avenue22nd Floor Phoenix, AZ 85004-4406
Corporate Office7420 South Kyrene Road, Suite 101Tempe, AZ 85283-4578Telephone: 480-894-6311Fax: 480-894-6433
Recent press releases, quarterly reports and additionalinformation about Mobile Mini, Inc. can be obtainedby visiting our World Wide Web site at:www.mobilemini.com
041065a 5/11/04 7:28 AM Page 2

Solutions for allyour storage needs
Message to Our Fellow Shareholders
2003 was a highly productive year at Mobile Mini. As you willread, the recession, while it slowed our growth rate, did not stop ourprogress. Because of our people and our business model, combinedwith our commitment to customer service and product differentia-tion, we fared far better than our competitors, whose dependenceupon construction customers and short-term holiday business madethem particularly vulnerable to the economic vagaries of the past twoyears. Writing this letter several months into 2004, we are seeingearly signs of stronger business conditions. The measures taken overthe past several years, in terms of fortifying our financial structure,creating a national branch network, deploying system-wide produc-tivity-enhancing technology, and offering the best and broadest lineof portable storage and mobile offices, have positioned Mobile Minifor at least 7% internal growth in 2004, and possibly better if theeconomy does its part.
2003 marked our 20th year in the business of providing storagesolutions. But it was in 1996 that Mobile Mini began its transfor-mation into a customer service-driven marketing enterprise focusedon leasing storage solutions through Company-owned and managedbranches, and since 1996 we have increased:
■ Branch locations from 8 in 3 states to 47 in 27 states and oneCanadian province;
■ Our total lease fleet from 13,600 units to 89,500 units, for a com-pound annual growth rate (“CAGR”) of 30.9%;
■ Total revenues from $42.4 million to $146.6 million, for a CAGRof 19.4%;
■ Leasing revenues from $17.9 million to $128.5 million, for aCAGR of 32.5%;
■ Lease revenues as a percent of the total revenues from under 50%in 1996 to just under 88% in 2003; and,
■ Proforma1 operating income from $5.4 million to $44.9 million,for a CAGR of 35.2%.
As this summary of our financial performance in 2003 shows,leasing and sales revenue rose at a faster rate than profits. Risinginsurance costs, property taxes and licensing fees depressed thegrowth rate in pro forma operating profits, which along withincreased interest expense, reduced 2003 pro forma net income andearnings per share compared to 2002.
While we did experience a lower average rental rate in the fourthquarter, on an annualized basis, our average rental rates in 2002approximated those of 2001. The lower average rental rate we expe-rienced in the final quarter of the year reflected a number of factors,most notably the impact of our purchase of storage container assetsfrom Transport International Pool (TIP), a unit of GE Capital. Thisacquisition was large in size and the lease fleet which we acquired,while of high quality, was concentrated in the eastern states whereprevailing rental rates are lower than rates that we traditionallyachieve. The drag on rental rates was magnified by the exceptionalgrowth at the new branches that we acquired or opened in the east-ern states in conjunction with the purchase of TIP storage containerassets. Exclusive of these factors, our average rental rate wasunchanged at branches that we have operated for more than one year.
Financial Highlights 2003 versus 2002
■ Total revenues rose 10.1% to $146.6 million from $133.1 million;
■ Lease revenues rose 10.6% to $128.5 million and constituted87.7% of total revenues, up from $116.2 million and 87.3% of2002 total revenues;
■ Internal growth in leasing revenues was 7.4% nearly the same asthe 7.5% rate in 2002;
■ Pro forma operating income was up 1.9% to $44.9 million from$44.1 million;
■ Pro forma net income was $17.5 million compared to $19.8 million;
■ Pro forma earnings per diluted share were $1.21 versus $1.38;and,
■ Adjusted EBITDA2 rose 4.6% to $56.0 million from $53.6 million.
2003 Operating Highlights
■ The number of customers served by Mobile Mini reached approx-imately 67,400 compared to 62,000 in 2002, a gain of 8.7%;
■ Our lease fleet at year-end was approximately 89,500 units, upfrom 83,600 units at the start of the year;
■ With the addition of a new branch in Portland, Oregon, there arenow 47 Mobile Mini locations;
1
041065b 4/29/04 15:30 Page 2

■ A comprehensive refinancing was undertaken in June, comprisedof the sale of $150 million of 91/2% senior notes due 2013. At thesame time, we obtained an amendment of our $250 millionrevolving credit facility, giving us better terms, longer duration andfar greater financial flexibility.
Business Overview
The tempered business environment that pervaded most of 2002continued throughout 2003. At Mobile Mini, it was a year ofretrenching and strengthening our market position at existing loca-tions rather than geographic expansion. Having added 11 newbranches in 2002, new markets were low on our priority list for2003. We did, however, add Portland, Oregon to our branch net-work in October through the purchase of a lease fleet of high quali-ty ISO containers. The addition of Portland gave us West Coastbranch coverage from Seattle to San Diego.
Slower growth continued in older markets, due primarily to thedepressed state of non-residential construction. In addition, at thosebranches in close proximity to military installations, demand forportable storage containers and mobile offices subsided as troops,equipment and supplies were deployed to the war in Iraq.
Our average utilization rate was down slightly for the year to78.7% from 79.1% in 2002. Yield had been depressed throughmuch of the year as many locations in the Class of 2002 were on theEast Coast, where rental rates were lower than our branch average.However, by the fourth quarter, yield began to improve. Our abilityto grow and operate profitable branches, and our overall enduranceduring this lengthy period of economic malaise, is a testament to thestrength and scalability of our business model.
The Mobile Mini Business Model
Mobile Mini’s business model entails substantial fixed costs at allof our locations. The key to growing operating margins and operat-ing profits is expanding containers and offices on lease at our branch-es, both new and older ones. Newer branches add containers on leaseat a far more rapid pace than older branches, making them the accel-erant for lease revenue and earnings growth as they mature. Duringtheir first year as Mobile Mini branches, new locations have histori-cally achieved strong organic growth and reached breakeven. Aftertheir first year, the new branches are profitable, but nowhere near asprofitable as our larger and more mature branches. In 2003, forexample, the average pro forma operating margin at branches estab-lished in 1998 was 40.4% compared with 5.5% for those establishedin 2002.
Our core portable storage business produces particularly com-pelling economic characteristics, including:
■ Predictable, recurring revenues from leases, with an average leaseduration of approximately 25 months;
■ Average monthly lease rates that recoup our current unit invest-ment within an average of 34 months;
■ Long useful lives exceeding 25 years, low maintenance and highresidual values;
■ Rental rates that are generally not effected by the age of theportable storage unit; and,
■ 73% EBITDA margins and approximately 58% pretax marginson incremental leasing revenue.
Since 1998, Mobile Mini has devoted much time and resources toentry into new markets. Although 2003 was not such a year, itbears repeating that our branch expansion formula has never beena rollup or consolidation strategy. For the most part, we enter anew market by purchasing a lease fleet that is currently generatingrevenues so as to forego the expenses of a start-up. Once we entera new market, we move quickly to enlarge the fleet inventory withour differentiated products, launch an aggressive advertising anddirect marketing campaign, staff the branch with seasoned MobileMini personnel and integrate our customized management infor-mation systems designed to optimize branch productivity. Thisstrategy appears to be working; of the 39 branches added since1998, not a single location has been closed.
Year Branch After Tax Return on Operating Margin % Established Invested Capital (after corporate allocation)
(NOPLAT)
Pro Forma (1) (2) Pro Forma (1)
12 months ended Dec. 31 12 months ended Dec. 31
All branches 2003 2003
Pre-1998 14.8% 38.1%
1998 14.9% 40.4%
1999 6.2% 19.3%
2000 9.0% 27.7%
2001 7.2% 20.5%
2002 6.1% 16.6%
All branches 11.2% 30.7%
1 Pro forma financial information for 2003 excludes Florida litigation expense of approximately$5.2 million, net of income tax benefit of $3.3 million.
2 Net income for 2003 excludes debt restructuring expense of approximately $6.4 million,net of income tax benefit of $4.0 million.
01 02 03
STOCKHOLDERS’ EQUITY($ in millions)
$161.7$178.7
$189.3
01 02 03
LEASE FLEET UNITS(in thousands at end of year)
70.183.6 89.5
01 02 03
LEASE REVENUE GROWTH(from prior year)
31.0%
16.5%10.6%
2
041065b 4/29/04 15:30 Page 3

About Our Customers
Our customers include, but are not limited to, all kinds and sizesof retailers, construction companies, medical centers, schools anduniversities, utilities, distributors, the U.S. military, hotels, restau-rants, entertainment complexes, and consumers, some 67,400 alltold in 2003. In 2003, 62.6% of our customers rented a single unit;our largest and our second-largest customers accounted for 4.9%and 0.5% of our leasing revenues, respectively; and our 20 largestcustomers represented 7.4% of total leasing revenues. We feel diver-sity, both in terms of geographic coverage and types and numbers ofcustomers, is a hugely favorable business dynamic.
The Winning Combination: Product Differentiation and Customer Service
Product differentiation is a critical competitive advantage for usand the reason why we can and do stay on the sidelines when ourcompetitors battle for commodity-driven, low margin, price sensitivestorage business. The composition of our lease fleet, which has over100 different types of units, may be best characterized as mass cus-tomization. Most often, our customers use our units for storage ofinventory, raw materials, records and documents, and all types ofequipment. Our steel and wooden offices are commonly used as firstaid, guard/security, sales and job site offices.
Having our own manufacturing and refurbishment capabilitiesenables us to provide a storage solution for just about every appli-cation and budget. While we build 10-foot wide units in Maricopa,Arizona, most of our portable storage and steel office lease fleetwere once 40-foot ocean-going containers that meet the standardsof the International Organization of Standards (ISO) that weredecommissioned after about eight to twelve years of service. Weoverhaul ISO containers, splitting them into 5-, 10-, 15-, 20- or 25-foot lengths, removing rust and dents, and repairing or replacingfloors and sidewalls. Once painted and signed with our name andlogo, the units are made secure with our patented locking systemand easy opening doors. So that our branches are ready and able toserve just about any customer need, the units may be fitted withdoors on both ends, doors on the sides, fully adjustable shelving,windows and partitions, electrical outlets, lights and plumbing, car-pet or tiled floors, phone jacks, as well as air conditioning and heat-ing. We also do our own fleet maintenance and repair, which gen-erally entails a coat of paint, rust removal, and hammering outdents. There are no “model years” for portable storage containersand even I, who have been with Mobile Mini most of my life, can-not distinguish between a new and old unit by sight.
Wood mobile offices, introduced to our product mix in 2000, nowcomprise approximately 4% of our lease fleet. Our all-steel groundmounted security offices represent 9% of our lease fleet. Mobile officesare offered with restrooms, carpet, French doors, exterior stairs orramps, awnings, and skirting. Wood mobile offices, which are pur-chased from third parties, are attractive, functional and a growing partof our lease fleet and lease revenue. This addition helps make MobileMini the single source for storage and office units.
With breadth of product offered at Mobile Mini, it takes knowl-edgeable sales people to help customers identify the correct solutionfor their need and budget. That is why we are sticklers for contin-ued training and branch monitoring. Customer service means fastdelivery, which is generally accomplished within 24 hours, moreoften than not using our own fleet of trucks.
Financial Flexibility Paves the Way for Higher Operating Margins
In June 2003, we completed a series of simultaneous financialtransactions that strengthened the financial backbone of ourCompany. In the short run, the comprehensive refinancing reducedearnings per share by approximately $0.12 in 2003 through higherinterest costs. The benefit is that our new capital structure givesMobile Mini the framework on which we can pursue acceleratedlong-term growth and profitability. One of these transactions was thesale of $150 million of 91/2% senior notes due 2013. The second wasthe amendment of our $250 million revolving credit facility, whichnow runs through February 2008, one year longer than our prioragreement. But the agreement now permits us to operate at higherlevels of leverage and, as of the closing of the transactions, weenhanced our borrowing capacity by $65 million under the mostrestrictive covenant of our loan agreement.
Mobile Mini is the nation’s leading provider of portable storage solutions.
3
041065b 4/29/04 15:31 Page 4

By tapping the high yield debt market and increasing capital avail-ability at a time when interest rates were at historically low levels, wenow have the capital structure that will allow us to leverage the infra-structure in place at all our locations and support a vastly higher levelof containers on lease and replicating the operating income expan-sion we have experienced at our older branches at our newer ones.
When we closed the year, our debt-to-book capitalization wasapproximately 56%, which is low for leasing companies. Share-holders’ equity at year-end was $189.3 million, up 6% from $178.7million, one year earlier. Cash flow from operations was $43.1million, compared to $45.4 million in 2002. While our currentcapital structure will support our 2004 published guidance of a 7%internal growth rate in revenues, it is our duty to be preparedshould a heartier economic picture unfold, which we see early indi-cations may be happening. That is why in 2003 we placed a highpriority on ensuring access to funds at the best possible termsbefore they were needed.
For the continuity of this letter, (for which we provide a table, cal-culating our pro forma information) it bears noting that major com-ponents differentiating pro forma versus actual results were the one-time (after-tax) charge of approximately $6.4 million related to therefinancing of the credit agreement and termination of certain inter-est rate swap agreements and an after tax charge of approximately$5.2 million related to the litigation discussed below.
Legal Proceedings Completed
To make a long, painful and costly story short, in September 2002Mobile Mini was ordered by a Florida jury to pay $7.2 million indamages for interfering with a contract between Nuko Holdings andA-1 Trailer Rental in connection with our purchase of A-1 TrailerRental’s container storage rental business in Florida in 2000. Weappealed the verdict but we did not prevail. We continue to believethe jury’s verdict was wrong and unsupported by the evidence, andwe would not have fought so hard and for so long if there were aninkling that any aspect of our 2000 acquisition agreement was theleast bit awry. Be that as it may, Mobile Mini took a fourth quartercharge of approximately $8.2 million for the judgment, interest andlegal fees. As is discussed above, much of the reconciliation betweenpro forma and GAAP financial measures relates to this fourth quar-ter charge. The only good thing to say about this experience is thatit is over.
Outlook and Plans for 2004
There were some favorable indicators in our Q4’03 financialresults, namely the first upturn in comparative quarter yield since thesecond quarter of 2002 and the reversal of the decline in the internalgrowth rate that pervaded the first three quarters of ’03. Withoutcalling it a trend, the signs of business improvement are continuinginto 2004. In the first three months of 2004, internal growth in unitson lease was running considerably ahead of the same period in 2003and was accelerating throughout the quarter. The most encourag-ing indicator is that our core, non-construction, commercial,industrial and institutional business has begun to show markedprogress. These customers typically rent containers for longer
periods and are far less subject to project starts and stops as com-pared to holiday retail and construction industry customers.
While we never want to be reliant on the construction industry,those customers can make a big difference in our lease fleet utiliza-tion and incremental margins. We therefore welcome the long-awaited improvement in the construction side of our business, whichwe also began to see during the first quarter of 2004. While we arenot pegging our expectations on a turnaround in construction, itcould, if continued, have a dramatic impact on our margins as con-tainers on lease grow. To repeat a point made earlier, as we add con-tainer leasing revenues to existing branches, we enjoy 73% EBITDAmargins and 58% pretax margins on incremental leasing revenues.
We are confident in our ability to deliver an annualized internalgrowth rate of at least 7% for 2004. With no improvement in yield,we estimate EBITDA for 2004 in the $61 million to $62 millionrange and diluted earnings per share between $1.20 to $1.25. These2004 results do not include any change in accounting for stockoptions.
Depending upon market conditions and opportunity, we wouldconsider entering between two and four new markets in 2004. Nowthat we are a national company, the urgency to open new locationshas given way to optimizing our 47 existing branches.
In closing, a special thanks goes to each of the 1,455 members ofour staff. They have worked especially hard and have done an excel-lent job ensuring Mobile Mini’s position as the undisputed leader inthe portable storage industry. We also appreciate the support andconfidence of our shareholders, our noteholders and our commerciallenders.
Sincerely yours,
Steven G. Bunger
Chairman, President & Chief Executive Officer
4
041065b 4/29/04 15:30 Page 1

Footnotes to Shareholders’ Letter
1 We define “pro-forma” as operating results excluding non-operating charges. The non-operating charges that we exclude consistof items such as expenses associated with material litigation and debt restructuring expense, where these expenses are presented asseparate line items on our statement of income for the relevant period. The table below sets forth our calculation from GAAP toPro forma for fiscal years ended 2002 and 2003.
2002 2003
Income from operations $ 42,773,656 $ 36,429,837
Florida litigation expense 1,320,054 8,501,679
Pro forma operating income $ 44,093,710 $ 44,931,516
Net income $ 18,239,056 $ 5,912,323
Florida litigation expense, net of tax 805,233 5,186,024
Debt restructuring expense, net of tax 792,781 6,368,611
Pro forma net income $ 19,837,070 $ 17,466,958
We include a reconciliation of our pro forma results and our actual results in our press releases announcing our operating results.The reconciliation of our fiscal 2003 and 2002 results is set forth in our current report on Form 8-K filed with the Securities andExchange Commission on February 24, 2004, which is available on our Internet website at http://www.mobilemini.com.
2 EBITDA is defined as net income before interest expense, income taxes, depreciation, amortization and debt restructuring expense.In comparing EBITDA from year to year, we typically ignore the effect of what we consider non-recurring events not related to ourcore business operations to arrive at adjusted EBITDA. The only non-recurring events reflected in the adjusted EBITDA over thelast several years has been the effect in 2002 and 2003 of our Florida litigation expenses and the effect in 1996 of a restructuringcharge for winding down our modular sales division. We present a reconciliation of net income to EBITDA in Item 6, “SelectedFinancial Data” of our annual report on Form 10-K for the fiscal year ended December 31, 2003. That Form 10-K is included else-where herein.
5

(This page intentionally left blank)

U.S. SECURITIES AND EXCHANGE COMMISSION
WASHINGTON, D.C. 20549 Form 10-K
ANNUAL REPORT PURSUANT TO SECTION 13 OR 15(d) OF THE SECURITIES EXCHANGE ACT OF 1934 For the fiscal year ended December 31, 2003. Commission File Number 1-12804
(Exact Name of Registrant as Specified in its Charter)
Delaware
86-0748362
(State or other jurisdiction of (IRS Employer Identification No.) incorporation or organization)
7420 S. Kyrene Road, Suite 101
Tempe, Arizona 85283 (Address of Principal Executive Offices)
(480) 894-6311
(Registrant’s Telephone Number)
Securities Registered Under Section 12(g) of the Exchange Act:
Title of Class Name of Each Exchange on Which Registered Common Stock, $.01 par value NASDAQ National Market
Preferred Share Purchase Rights Indicate by checkmark whether the Registrant: (1) has filed all reports required to be filed by Section 13 or 15(d) of the Securities Exchange Act of 1934 during the preceding 12 months (or for such shorter period that the registrant was required to file such reports), and (2) has been subject to such filing requirements for the past 90 days. Yes X No __ Indicate by checkmark if disclosure of delinquent filers pursuant to Item 405 of Regulation S-K is not contained herein, and will not be contained, to the best of registrant’s knowledge, in definitive proxy or information statements incorporated by reference in Part III of this Form 10-K or any amendment to this Form 10-K. Indicate by checkmark whether the registrant is an accelerated filer (as defined in Rule 12b-2 of the Act) Yes No The aggregate market value on June 30, 2003 of the voting stock owned by non-affiliates of the registrant was approximately $223.7 million. As of March 5, 2004, there were outstanding 14,352,903 shares of the issuer’s common stock, par value $.01. Documents incorporated by reference: Portions of the Proxy Statement for the Registrant’s 2004 Annual Meeting of Stockholders are incorporated herein by reference in Item 5 of Part II and in Part III of this Form 10-K to the extent stated herein. Certain Exhibits are incorporated in Item 15 of this Report by reference to other reports and registration statements of the Registrant which have been filed with the Securities and Exchange Commission. Exhibit Index is at page 65.

1
MOBILE MINI, INC. 2003 FORM 10-K ANNUAL REPORT
TABLE OF CONTENTS
PART I Page Item 1 Description of Business 2 Item 2 Description of Property 19 Item 3 Legal Proceedings 19 Item 4 Submission of Matters to a Vote of Security Holders
Executive Officer of the Company 19
PART II Item 5 Market for Common Equity and Related Stockholder Matters 20 Item 6 Selected Financial Data 21 Item 7 Management’s Discussion and Analysis of Financial Condition and Results of
Operations 23 Item 7A Quantitative and Qualitative Disclosures About Market Risk 36 Item 8 Financial Statements and Supplementary Data F-1 Item 9 Changes in and Disagreements with Accountants on Accounting and Financial
Disclosure 64 Item 9A Controls and Procedures 64 PART III Item 10 Directors and Executive Officers of the Registrant 64 Item 11 Executive Compensation 64 Item 12 Security Ownership of Certain Beneficial Owners and Management 64 Item 13 Certain Relationships and Related Transactions 65 Item 14 Principal Accountant Fees and Services 65 PART IV Item 15 Exhibits, Financial Statement Schedules and Reports on Form 8-K 65

2
PART I ITEM 1. DESCRIPTION OF BUSINESS. Founded in 1983, we believe we are the nation's largest provider of portable storage solutions through our lease fleet of approximately 89,500 portable storage and portable office units at December 31, 2003. We base this belief on the review of public filings by our largest competitors. We offer a wide range of portable storage products in varying lengths and widths with an assortment of differentiated features such as our proprietary security systems, multiple doors, electrical wiring and shelving. At December 31, 2003, we operated through a network of 47 branches located in 27 states and one Canadian province. Our portable units provide secure, accessible temporary storage for a diversified client base of approximately 67,400 customers, including large and small retailers, construction companies, medical centers, schools, utilities, distributors, the U.S. military, hotels, restaurants, entertainment complexes and households. Our customers use our products for a wide variety of storage applications, including retail and manufacturing inventory, construction materials and equipment, documents and records and household goods. Based on an independent market study, we believe our customers are engaged in a vast majority of the industries identified in the four-digit SIC (Standard Industrial Classification) manual published by the U.S. Bureau of the Census. For the twelve months ended December 31, 2003, we generated revenues of $146.6 million. Since 1996, we have followed a strategy of focusing on leasing rather than selling our portable storage units. We believe this leasing model is highly attractive because the vast majority of our fleet consists of steel portable storage units which:
• provide predictable, recurring revenues from leases with an average duration of approximately 25 months; • have average monthly lease rates that recoup our current unit investment within an average of 34 months; • have long useful lives exceeding 20 years, low maintenance and high residual values; and • produce incremental leasing operating margins of over 60%.
Since 1996, we have increased our total lease fleet, by approximately 76,000 units, for a compound annual growth rate, or CAGR, of 30.9%. As a result of our focus on leasing, we have achieved substantial increases in our revenues and profitability. Our annual revenues have increased from $42.4 million in 1996 to $146.6 million in 2003, representing a CAGR of 19.4%. In addition to our leasing operations, we sell new and used portable storage units and provide delivery, installation and other ancillary products and services. Our fleet is primarily comprised of refurbished and customized steel portable storage containers, which were built according to the standards developed by the International Organization for Standardization ("ISO"), and other steel containers that we manufacture. We refurbish and customize our purchased ISO containers by adding our proprietary locking and easy opening door systems. These assets are characterized by low risk of obsolescence, extreme durability, long useful lives and a history of high value retention. We maintain our steel containers on a regular basis. This maintenance consists primarily of repainting units every two to three years, essentially keeping them in the same condition as when they entered our fleet. Repair and maintenance expense for our fleet has averaged 2.0% of lease revenues over the past three fiscal years and is expensed as incurred. We believe our historical experience with leasing rates and sales prices for these assets demonstrates their high value retention. We are able to lease our portable storage containers at similar rates, without regard to the age of the container. In addition, we have sold units from our lease fleet at an average of 145% of original cost from 1997 to 2003. Appraisals are conducted on a regular basis on our containers, and the appraiser does not differentiate in value based upon the age of the container or the length of time it has been in our fleet. Our most recent fair market value appraisal, conducted in January 2002, appraised our fleet at a value in excess of net book value. An orderly liquidation value appraisal on which our borrowings under our revolving credit facility are based, was performed in March 2003, and the value was determined to be $314.1 million, which equates to 82.4% of the lease fleet's net book value, at December 31, 2003. Industry Overview The storage industry includes two principal segments, fixed self-storage and portable storage. The fixed self-storage segment consists of permanent structures located away from customer locations used primarily by consumers to temporarily store excess household goods. We do not participate in the fixed self-storage segment. The portable storage segment, in which our business operates, differs from the fixed self-storage segment in that it brings the storage solution to the customer's location and addresses the need for secure, temporary storage with immediate access. The advantages of

3
portable storage include convenience, immediate accessibility, better security and lower price. In contrast to fixed self-storage, the portable storage segment is primarily used by businesses. This segment of the storage industry is highly fragmented and remains local in nature with only a few national participants. Historically, portable storage solutions included containers, trailers and roll-off units. We believe portable storage containers are achieving increased market share from other options because of an increasing awareness of the advantages portable storage provides and growing availability of portable storage products to meet the needs of a diverse range of customers. Portable storage containers provide ground level access, higher security and improved aesthetics compared with portable storage alternatives such as trailer storage solutions. Although there are no published estimates of the size of the portable storage segment, we believe the size of the segment is expanding due to increasing awareness of the advantages of portable storage. Our products also serve the mobile office industry. This industry provides mobile offices and other modular structures and is estimated to exceed $2.5 billion in revenue annually. We offer combined storage/office and mobile offices in varying lengths and widths, with lease terms averaging approximately 22 months. We also offer portable record storage units and many of our regular storage units are used for document and record storage. The documents and records storage industry is experiencing significant growth as businesses continue to generate substantial paper records that must be kept for extended periods. Our goal is to continue to be the leading national provider of portable storage solutions. We believe our competitive strengths and business strategy will enable us to achieve this goal. Competitive Strengths Our competitive strengths include the following: Market Leadership. We maintain a total fleet of both units held for lease and for sale of over 91,000 units at December 31, 2003, and are the largest provider of portable storage solutions in a majority of our markets. We believe we are creating brand awareness and the name "Mobile Mini" is associated with high quality portable storage products, superior customer service and value-added storage solutions. We have achieved significant growth in new and existing markets by capturing market share from competitors and by creating demand among businesses and consumers who were previously unaware of the availability of our products to meet their storage needs. Superior, Differentiated Products. We offer the industry's broadest range of portable storage products, with many customized features that differentiate our products from those of our competition. We design and manufacture our own portable storage units in addition to restoring and modifying used ocean-going containers. These capabilities allow us to offer a wide range of products and proprietary features to better meet our customers' needs, charge premium lease rates and gain market share from our competitors, who offer more limited product selections. Our portable storage units vary in size from five to 48 feet in length and eight to 10 feet in width. The 10-foot wide units we manufacture provide 40% more usable storage space than the standard eight-foot-wide ocean-going containers offered by our competitors. The vast majority of our products have a proprietary locking system and multiple door options. In addition, we offer portable storage units with electrical wiring, shelving and other customized features. Geographic and Customer Diversification. From our 47 branches which are located in 27 states and one Canadian province, in 2003 we served approximately 67,400 customers from a wide range of industries. Our customers include large and small retailers, construction companies, medical centers, schools, utilities, distributors, the U.S. military, hotels, restaurants, entertainment complexes and households. Our diverse customer base demonstrates the broad applications for our products and our opportunity to create future demand through targeted marketing. In 2003, our largest and our second-largest customers accounted for 4.9 % and 0.5% of our leasing revenues, respectively. Our twenty largest customers accounted for approximately 7.4% of our leasing revenues. During 2003, approximately 62.6% of our customers rented a single unit. We believe this diversity also reduces our susceptibility to economic downturns in our markets or in any of the industries in which our customers operate. The fact that our business continued to grow during the economic downturn of 2002 and 2003, although at a slower than historic pace, demonstrates some measure of resilience against recession in our business model. Customer Service Focus. We believe the portable storage industry is particularly service intensive and essentially local. Our entire organization is focused on providing high levels of customer service, and our salespeople work out of our branch locations to better understand local market needs. We have trained our sales force to focus on all aspects of customer service from the sales call onward. We differentiate ourselves by providing flexible lease terms, security, convenience, product quality, broad product selection and

4
availability, and competitive lease rates. We conduct on-going training programs for our sales force to assure high levels of customer service and awareness of local market competitive conditions. Our customized management information systems also increase our responsiveness to customer inquiries and enable us to efficiently monitor our sales force's performance. Due to our orientation towards customer service, 53.1% of our 2003 leasing revenues were derived from repeat customers. Sales and Marketing Emphasis. We target a diverse customer base and, unlike most of our competitors, we have developed sophisticated sales and marketing programs enabling us to expand market awareness of our products and generate strong internal growth. We have almost 300 dedicated commissioned salespeople. Our salespeople are instrumental in leasing our storage products to approximately 67,400 customers. We assist our salespeople by providing them with our highly customized contact management system and intensive sales training programs. We monitor our salespersons' effectiveness through our extensive sales monitoring programs. Yellow page and direct mail advertising are integral parts of our sales and marketing approach. In 2003, our total advertising costs were $6.9 million, and we mailed over approximately 8.7 million product brochures to existing and prospective customers. Our 2003 total advertising expenses were approximately $1.7 million greater than our 2001 total advertising expenses, and approximately $0.7 million greater than our 2002 expenses. Customized Management Information Systems. We have made substantial investments in our management information systems that enable us to optimize fleet utilization, capture detailed customer data, improve financial performance and support our growth by projecting near-term capital needs. Our management information systems allow us to carefully monitor, on a daily basis, the size, mix, utilization and lease rates of our lease fleet by branch. Our systems also capture relevant customer demographic and usage information, which we use to target new customers within our existing and new markets. Our headquarters and each branch are linked through a scaleable PC-based wide area network that provides real-time transaction processing and detailed reports on a branch-by-branch basis. We intend to invest further in upgrading our management information systems in 2004 and 2005. Business Strategy Our business strategy consists of the following: Focus on Core Portable Storage Leasing Business. We focus on growing our core leasing business because it provides predictable, recurring revenue and high margins. We believe there is substantial demand for our portable storage units throughout the United States. Our leasing revenues have grown from $17.9 million in 1996 to $128.5 million in 2003, reflecting a CAGR of 32.5%. Generate Strong Internal Growth. We focus on increasing the number of portable storage units we lease from our existing branches to both new and repeat customers. Historically, we have been able to generate strong internal growth within our existing markets through sophisticated sales and marketing programs aimed to increase brand recognition, expand market awareness of the uses of portable storage and differentiate our superior products from our competitors. Our internal growth rate for fiscal years 2000 and 2001 was 22.3% and 22.2%, respectively. During the economic slowdown in fiscal 2002, our internal growth rate was 7.5% and remained steady at 7.4% for fiscal 2003. In the San Diego, California market, a market we have served for over nine years, we increased leasing revenues by 9.2%, 11.9% and 26.3% in 2003, 2002 and 2001, respectively, from their levels in the prior year, demonstrating the level of internal growth we can continue to realize from our existing branches, even during an economic slowdown. We define internal growth as growth in lease revenues in markets opened for at least a year, excluding any growth arising as a result of additional acquisitions in those markets. Branch Expansion. We believe we have an attractive geographic expansion opportunity and we have developed a new market entry strategy, which we replicate in each new market. We typically enter a new-market by acquiring the lease fleet assets of a small local portable storage business to minimize start-up costs and then overlay our business model onto the new branch. Our business model consists of significantly expanding the fleet inventory with our differentiated products, introducing our sophisticated sales and marketing program supported by increased advertising and direct marketing expenditures, adding experienced Mobile Mini personnel and implementing our customized management information systems. As a result of implementing our business model, our new branches typically achieve strong organic growth in the first year. Our new branches are also typically breakeven during their first year of operation as Mobile Mini branches and are profitable thereafter.

5
We have identified many markets in the United States where we believe demand for portable storage units is underdeveloped. Typically, these markets are being served by small, local competitors. In 1998, we began entering new markets through our expansion strategy as illustrated in the following table:
New Market Expansion Year Established Acquisition Start-up Total
1998 3 1 4 1999 6 1 7 2000 9 1 10 2001 6 0 6 2002 10 1 11 2003 1 0 1 Total 35 4 39
Our expansion program and other factors can affect our overall utilization rate. From 1996 through 2003, our annual utilization levels averaged 81.4%, and ranged from a low of 78.7% in 2003 to a high of 89.7% in 1996. The lower utilization rate in the last few years was primarily a result of (i) the fact that many of our acquisitions have had utilization levels lower than our historic average rates, especially after we add our proprietary product, (ii) the fact that it is easier to maintain a higher utilization rate at a larger branch and we increased the number of small branches in more recent years, and (iii) the economic slowdown in the general economy and in particular the slowdown in the construction sector. We entered six markets in 2001, 11 markets in 2002, and only one market in 2003. From 1996 through 2003, we grew our lease fleet from approximately 13,600 units to approximately 89,500 units at the end of 2003. Continue to Enhance Product Offering. We continue to enhance our existing products to meet our customers’ needs and requirements. We have historically been able to introduce new products and features that expand the applications and overall market for our storage products. For example, in 1998 we introduced a 10-foot wide storage unit that has proven to be a popular product with our customers. In 1999, we completed the design of a records storage unit, which provides highly secure, on-site, easily accessible storage. We market this unit as a records storage solution for customers who require easy access close at hand. In 2000, we added wood mobile offices as a complementary product to better serve our customers. In 2001, we redesigned and improved our security locking system, making it easier to use, especially in colder climates. We were issued four patents in connection with the new locking system design and other improvements made in 2003, and one patent is still pending. In 2002, we added a 10-by-30-foot steel combination storage/office unit to complement the various other sizes we have in our fleet. Currently, the 10-foot-wide unit, the record storage unit and the 10-by-30-foot steel combination storage/office unit are exclusively offered by Mobile Mini. We believe our design and manufacturing capabilities increase our ability to service our customers' needs and demand for our portable storage solutions. Products We provide a broad range of portable storage products to meet our customers' varying needs. Our products are managed and our customers are serviced locally by our employee team at each of our branches, including management, sales personnel and yard facility employees. Some features of our different products are listed below:
• Refurbished and Modified Storage Units. We purchase used ocean-going containers from leasing companies or brokers. These containers are eight feet wide, 8'6" to 9'6" high and 20, 40 or 45 feet long. After acquisition, we refurbish and modify ocean-going containers. Restoration typically involves cleaning, removing rust and dents, repairing floors and sidewalls, painting, adding our signs and installing new doors and our proprietary locking system. Modification typically involves splitting those containers into 5-, 10-, 15-, 20- or 25-foot lengths.
• Manufactured Storage Units. We manufacture steel portable steel storage units for our lease fleet and for sale. We do this at
our manufacturing facility in Maricopa, Arizona. We can manufacture units up to 12 feet wide and 50 feet long and can add doors, windows, locks and other customized features. We now offer a 10-foot-wide unit, which provides 40% more usable storage space than a standard eight-foot-wide unit. Typically, we manufacture "knock-down" units, which we ship to our branches. These units are then assembled by our branches that have assembly capabilities or by third party assemblers. This method of shipment is less expensive than shipping fully assembled storage units.

6
• Steel Combination Mobile Office and Storage/Office Units. We manufacture steel combination storage/office and mobile
office units that range from 10 to 40 feet in length. We offer these units in various configurations, including office and storage combination units that provide a 10- or 15-foot office with the remaining area available for storage. We believe our office units provide the advantage of ground accessibility for ease of access and high security in an all-steel design. These units are equipped with electrical wiring, heating and air conditioning, phone jacks, carpet or tile, proprietary doors and windows with security bars.
• Wood Mobile Office Units. We added wood office units to our product line in 2000. We purchase these units, which range
from eight to 24 feet in width and 20 to 60 feet in length, from manufacturers. These units have a wide range of exterior and interior options, including exterior stairs or ramps, awnings and skirting. These units are equipped with electrical wiring, heating and air conditioning, phone jacks, carpet or tile and windows with security bars. Many of these units contain restrooms.
• Records Storage Units. We market and manufacture proprietary portable records storage units that enable customers to store
documents at their location for easy access, or at one of our facilities. Our units are 10.5 feet wide and are available in 12-and 23-foot lengths. The units feature high-security doors and locks, electrical wiring, shelving, folding work tables and air filtration systems. We believe our product is a cost-effective alternative to mass warehouse storage, with a high level of fire and water damage protection.
• Van Trailers and Other Non-Core Storage Units. Our acquisitions typically entail the purchase of small companies with lease
fleets primarily comprised of standard ISO containers. However, many of these companies also have van trailers and other manufactured storage products that are inferior to standard containers. It is our goal to dispose of these sub-standard units from our fleet either as their initial rental period ends or within a few years. We do not refurbish these products. See "Product Lives and Durability — Van Trailers and Other Non-Core Storage Products."
We purchase used ocean-going containers and refurbish and modify them at our manufacturing facility in Arizona and at our other branch locations. At certain branches, we also contract with third parties to refurbish and modify the units at their locations. We manufacture new portable storage units at our Arizona facility. We believe we are able to purchase used ocean-going containers at competitive prices because of our volume purchasing power. The used ocean-going containers we purchase are typically about eight to 12 years old. We believe our steel portable storage units, steel offices, and wood modular offices have estimated useful lives of 25 years, 25 years, and 20 years, respectively, from the date we build or acquire and refurbish them, with residual values of our per unit investment ranging from 50% for our mobile offices to 62.5% for our core steel products. Van trailers, which comprised approximately 1.1% of the gross book value of our lease fleet at December 31, 2003, are depreciated over seven years to a 20% residual value. For the past three full fiscal years, our cost to repair and maintain our lease fleet units averaged approximately 2.0% of our lease revenues. Repainting the outside of storage units is the most frequent maintenance item. Product Lives and Durability Core Portable Storage Products. Most of our fleet is comprised of refurbished and customized ISO containers, manufactured steel containers and record storage units, along with our combined storage/office and mobile office units. These products are built to last a long period of time with proper maintenance. We generally purchase used ISO containers when they are eight to 12 years old, a time at which their useful life as ocean-going shipping containers is over according to the standards promulgated by the International Organization for Standardization. Because we do not have the same stacking and strength requirements as apply in the ocean-going shipping industry, we have no need for these containers to meet ISO standards. We purchase these containers in large quantities, truck them to our locations, refurbish them by removing any rust, painting them with a rust inhibiting paint, adding our locking system and further customizing them, typically by adding our proprietary, easy opening door system and our proprietary locking system. We maintain our steel containers on a regular basis by painting them on average every two to three years, removing rust, and occasionally replacing the wooden floor or a rusted panel. This periodic maintenance keeps the container in essentially the same condition as after we initially refurbished it.

7
Our revolving credit agreement lenders have our containers appraised on a periodic basis, and the appraiser does not differentiate value based upon the age of the container or the length of time it has been in our fleet. Our manufactured containers and steel offices are not built to ISO standards, but are built in a similar manner so that, like the ISO containers, they will maintain their utility and value as long as they are maintained in accordance with our maintenance program. As with our refurbished and customized ISO containers, our lenders' appraiser does not differentiate the value of manufactured units based upon the age of the unit. Our most recent fair market value appraisal appraised our fleet at a value in excess of net book value. At December 31, 2003, the net book value of our fleet was approximately $382.8 million. Approximately 11.8% of our 2003 revenue was derived from sales of portable storage and mobile office units. Because the containers in the lease fleet do not significantly depreciate in value, we have no program in place to sell lease fleet containers as they reach a certain age. Instead, most of our container sales involve either highly customized containers that would be difficult to lease on a recurrent basis, or unrefurbished and refurbished containers that we had recently acquired but not yet leased. In addition, due primarily to availability of inventory at various locations at certain times of the year, we sell a certain portion of containers and offices from the lease fleet. Our gross margins increase for containers in the lease fleet for greater lengths of time prior to sale, because although these units have been historically depreciated based upon a 20 year useful life and 70% residual value (1.5% per year), in most cases fair value may not decline by nearly that amount due to the nature of the assets and our stringent maintenance policy. The following table shows the gross margin on containers and steel offices sold from inventory (which we call our sales fleet) and from our lease fleet from 1997 through 2003 based on the length of time in the lease fleet.
Number of
Units
Sales Revenue
Original Cost (1)
Sales Revenues as a Percentage of Original Cost
Sales Revenues as a Percentage of Net Book Value
Sales fleet (2) 17,539 $57,744,248 $ 38,252,974 151% 151% Lease fleet, by period held before
sale: Less than 5 years 5,760 21,958,233 15,060,247 146 150
5 to 10 years 1,910 5,877,229 4,126,831 142 157 10 to 15 years 239 679,906 502,698 135 159 15 to 20 years 22 72,506 53,292 136 171
(1) "Original cost" for purposes of this table includes (i) the price we paid for the unit plus (ii) the cost of our manufacturing, which
includes both the cost of customizing units and refurbishment costs incurred, plus (iii) the freight charges to our branch where the unit is first placed in service. For manufactured units, cost includes our manufacturing cost and the freight charges to the branch location.
(2) Includes sales of unrefurbished ISO containers. Because steel storage containers keep their value when properly maintained, we are able to lease containers that have been in our lease fleet for various lengths of time at similar rates, without regard to the age of the container. Our lease rates vary by the size and type of unit leased, length of contractual term, custom features and the geographic location of our branch at which the lease is originated. To a degree, competition, market conditions and other factors can influence our leasing rates. The following chart shows, for containers that have been in our lease fleet for various periods of time, the average monthly lease rate that we currently receive for various types of containers. We have added our 10 foot wide containers and security offices to the fleet only in the last several years and those types of units are not included in this chart. This chart includes the eight major types of containers in the fleet for at least 10 years (we have been in business for over 20 years), and specific details of such type of unit are not provided due to competitive considerations.

8
Age of Containers
(by number of years in our lease fleet)
0 – 5 6 – 10 11 – 15 16 – 20 Total Number/Average Dollar
Type 1 Number of Units 3,291 1,181 59 ⎯ 4,531 Average rent $ 80.51 $ 80.70 $ 75.92 $ ⎯ $ 80.50
Type 2 Number of Units 631 127 51 ⎯ 809 Average rent $ 78.75 $ 76.78 $ 77.27 $ ⎯ $ 78.35
Type 3 Number of Units 6,170 2,953 833 3 9,959 Average rent $ 79.50 $ 83.47 $ 81.59 $ 70.42 $ 80.85
Type 4 Number of Units 223 254 25 ⎯ 502 Average rent $ 100.64 $ 103.90 $ 97.50 $ ⎯ $ 102.13
Type 5 Number of Units 1,343 136 31 ⎯ 1,510 Average rent $ 116.38 $ 117.94 $ 117.00 $ ⎯ $ 116.53
Type 6 Number of Units 3,904 1,026 82 7 5,019 Average rent $ 119.32 $ 126.15 $ 125.15 $ 126.90 $ 120.82
Type 7 Number of Units 12,715 1,532 143 12 14,402 Average rent $ 102.62 $ 120.60 $ 124.88 $ 114.38 $ 104.76
Type 8 Number of Units 342 278 25 2 647 Average rent $ 155.36 $ 162.25 $ 164.06 $ 262.71 $ 158.99
We believe fluctuations in rental rates based on container age are primarily a function of the location of the branch from which the container was leased rather than age of the container. Some of the units added to our lease fleet during recent years through our acquisitions program have lower lease rates than the rates we typically obtain because the units remain on lease under terms (including lower rental rates) that were in place when we obtained the units in acquisitions. We periodically review our depreciation policy against various factors, including the following:
• results of our lenders' independent appraisal of our lease fleet; • practices of the larger competitors in our industry; • our experience concerning useful life of the units; • profit margins we are achieving on sales of depreciated units; and • lease rates we obtain on older units.
Our depreciation policy for our lease fleet uses the straight-line method over the units' estimated useful life, in most cases 20 years after the date that we put the unit in service, with estimated residual values of 70% on steel units and 50% on wood office units. Effective in 2004, some of our steel units will have been in our fleet longer than 20 years, and our depreciation policy on our steel units will be modified to increase the useful life to 25 years, and to decrease the residual value to 62.5% which effectively results in continual depreciation on these containers at the same annual rate. Van trailers, which are a small part of our fleet, are depreciated over seven years to a 20% residual value. Van trailers are only added to the fleet as a result of acquisitions of portable storage businesses.

9
Wood Mobile Office Units. We began adding wood mobile office units to the lease fleet in 2000 as a complement to our core portable storage products. At December 31, 2003, we had nearly 4,000 of these units at an average original book value of approximately $17,500 per unit. These units are manufactured by third parties and are very similar to the units in the lease fleets of other mobile office rental companies. Because of the wood structure of these units, they are more susceptible to wear and tear than steel units. We depreciate these units over 20 years down to a 50% residual value (2.5% per year) which we believe to be consistent with most of our major competitors in this industry. Wood mobile office units lose value over time and we may sell older units from time to time. However, at the end of 2003, our wood mobile offices were all less than four years old. These units are also more expensive than our storage units, causing an increase in the average carrying value per unit in the lease fleet over the last three years. Additionally, the operating margins on mobile offices are lower than the margins on portable storage, and because we have added minimum inventories of these units to most of our branches (initially resulting in lower utilization rates), the addition of mobile offices has reduced our overall return on invested capital. However, these mobile offices are rented using our existing infrastructure and therefore provide incremental returns far in excess of our fixed expenses. This adds to our overall profitability and operating margins. Van Trailers and Other Non-Core Storage Products. At December 31, 2003 van trailers made up approximately 1.1% of the gross book value of our lease fleet. When we acquire businesses in our industry, the acquired businesses often have van trailers and other manufactured storage products that are sub-standard compared to our core steel container storage product. We attempt to purge most of these inferior units from our fleet as they come off rent or within a few years after we acquire them. We do not utilize our resources to refurbish these products and instead resell them. Van trailers are initially manufactured to be attached to trucks to move merchandise in interstate commerce. The initial cost of these units can be $18,000 or more. They are leased to, or purchased by, cross country truckers and other companies involved in cross country transportation of merchandise. They are made of light weight material in order to make them ideal for transport and have wheels and brakes. They are typically made of aluminum, but have steel base frames to maintain some structural integrity. Because of their light weight, moving parts, the heavy loads they carry and the wear and tear involved in hundreds of thousands of miles of transport, these units depreciate quite rapidly. This business and the cartage business described below are also very economically cyclical. Once van trailers become too old to use in interstate commerce without frequent maintenance and downtime, they are sold to companies that use them as “cartage trailers.” At this point, they may have a depreciated cost of approximately $5,000. As cartage trailers, they are used to move loads of merchandise much shorter distances and may be used to store goods for some period of time and then to move them from one part of a facility or a city to another part. They continue to depreciate quite rapidly until they reach the point where they are not considered safe or cost effective to move loaded with merchandise. At this point, near the end of the life cycle of a van trailer, it may be used for storage. Unlike a storage container, however, van trailers are much less secure, can fairly easily be stolen (as they are on wheels) and are unsightly. Most importantly, they are not ground level and, under the Occupational Safety and Health Administration (OSHA) regulations, must be attached to approved stairs or ramps to prevent accidents when they are accessed. A large part of our leasing effort involves demonstrating to our customers the superiority of our containers to van trailers. Mobile Mini has found that when it markets steel storage containers against storage van trailers, customers recognize the superiority of containers. As a result, we believe that eventually the use of van trailers will primarily be limited to dock height storage and to customers who must frequently move storage units. The average initial unit value given to the van trailers we have purchased in acquisitions is approximately $1,550 (excluding refrigerated units which are valued higher), and we depreciate these units over seven years down to a 20% residual value. As noted above, we sell these units as soon as practicable. During 2003, we disposed of over 300 van trailers, representing approximately 10% of our van trailer fleet. Lease Fleet Configuration Our lease fleet is comprised of over 100 different types of units. Throughout the year we add units to our fleet through purchases of used ISO containers and containers obtained through acquisitions, both of which we refurbish and customize. We also purchase new

10
manufactured mobile offices in various configurations and sizes, and manufacture our own custom steel units. Our initial cost basis of an ISO container includes the purchase price from the seller, the cost of refurbishment, which can include removing rust and dents, repairing floors, sidewalls and ceilings, painting, signage, installing new doors, seals and a locking system. Additional modification may involve the splitting of a unit to create several smaller units and adding customized features. The restoring and modification processes do not necessarily occur in the same year the units are purchased or acquired. We procure larger containers, typically 40-foot units, and split them into two 20-foot units or one 25-foot and one 15-foot unit, or other configurations as needed, and then add new doors along with our proprietary locking system and sometimes we add custom features. We also will sell units from our lease fleet to our customers.
The table below outlines those transactions that effectively increased the net asset value of our lease fleet from $337.1 million at December 31, 2002 to $382.8 million at December 31, 2003:
Dollars Units Lease fleet at December 31, 2002, net $ 337,084,303 83,642
Purchases: Container purchases and containers obtained through acquisitions, including freight
1,822,563 1,626
Manufactured units: Steel containers, combination storage/office combo units and steel security offices
26,175,246 3,329
New wood mobile offices 13,165,281 671
Refurbishment and customization: Refurbishment or customization of 1,626 units purchased or acquired in the current year
2,662,049
Refurbishment or customization of 3,167 units purchased in a prior year
8,732,764 1,556 (1)
Refurbishment or customization of 2,268 units obtained through acquisition in a prior year
3,719,179 253 (2)
Other (8,232) (62) Cost of sales from lease fleet (3,968,544) (1,523) Depreciation (6,630,706) Lease fleet at December 31, 2003, net $ 382,753,903 89,492
(1) These units represent the net additional units that were the result of splitting steel containers into one or more shorter units, such as splitting a 40-foot container into two 20-foot units, or one 25-foot unit and one 15-foot unit.
(2) Includes units moved from finished goods to lease fleet.
The table below outlines the composition of our lease fleet at December 31, 2003: Net Book
Value Number of
Units
Steel storage containers $252,449,396 74,848 Offices 148,244,087 11,866 Van trailers 4,464,269 2,778 Other, primarily flatbed type chassis 424,833 Accumulated depreciation (22,828,682) $382,753,903 89,492
11
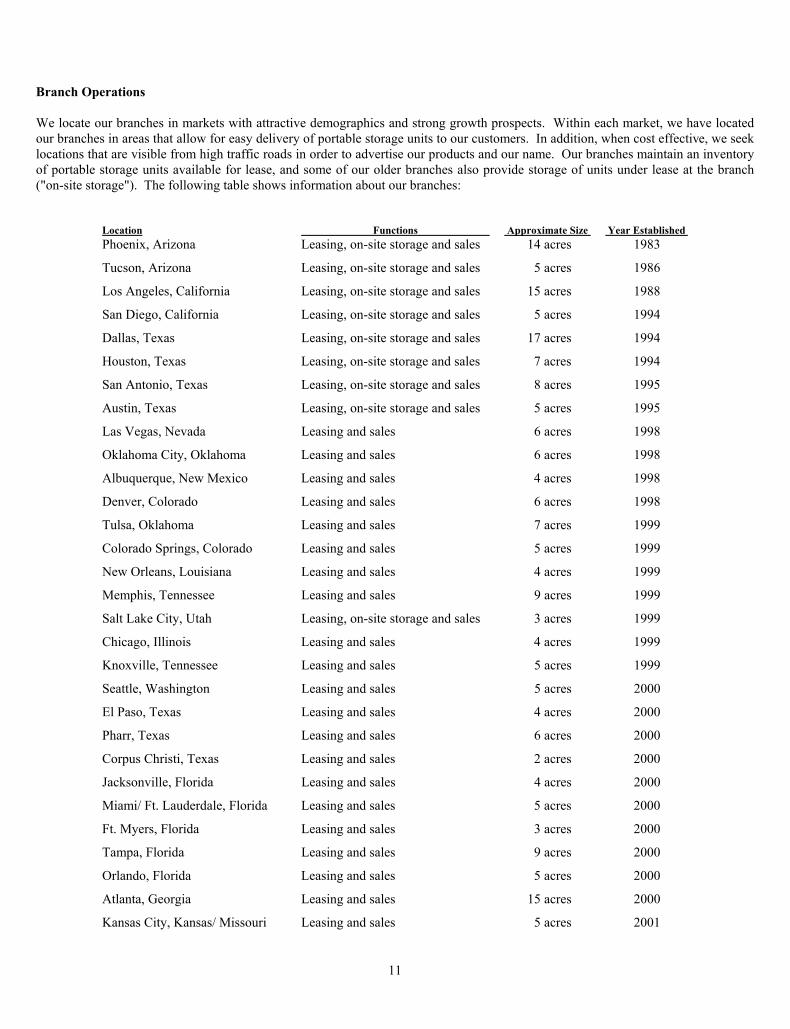
Branch Operations We locate our branches in markets with attractive demographics and strong growth prospects. Within each market, we have located our branches in areas that allow for easy delivery of portable storage units to our customers. In addition, when cost effective, we seek locations that are visible from high traffic roads in order to advertise our products and our name. Our branches maintain an inventory of portable storage units available for lease, and some of our older branches also provide storage of units under lease at the branch ("on-site storage"). The following table shows information about our branches:
Location Functions Approximate Size Year Established Phoenix, Arizona Leasing, on-site storage and sales 14 acres 1983
Tucson, Arizona Leasing, on-site storage and sales 5 acres 1986
Los Angeles, California Leasing, on-site storage and sales 15 acres 1988
San Diego, California Leasing, on-site storage and sales 5 acres 1994
Dallas, Texas Leasing, on-site storage and sales 17 acres 1994
Houston, Texas Leasing, on-site storage and sales 7 acres 1994
San Antonio, Texas Leasing, on-site storage and sales 8 acres 1995
Austin, Texas Leasing, on-site storage and sales 5 acres 1995
Las Vegas, Nevada Leasing and sales 6 acres 1998
Oklahoma City, Oklahoma Leasing and sales 6 acres 1998
Albuquerque, New Mexico Leasing and sales 4 acres 1998
Denver, Colorado Leasing and sales 6 acres 1998
Tulsa, Oklahoma Leasing and sales 7 acres 1999
Colorado Springs, Colorado Leasing and sales 5 acres 1999
New Orleans, Louisiana Leasing and sales 4 acres 1999
Memphis, Tennessee Leasing and sales 9 acres 1999
Salt Lake City, Utah Leasing, on-site storage and sales 3 acres 1999
Chicago, Illinois Leasing and sales 4 acres 1999
Knoxville, Tennessee Leasing and sales 5 acres 1999
Seattle, Washington Leasing and sales 5 acres 2000
El Paso, Texas Leasing and sales 4 acres 2000
Pharr, Texas Leasing and sales 6 acres 2000
Corpus Christi, Texas Leasing and sales 2 acres 2000
Jacksonville, Florida Leasing and sales 4 acres 2000
Miami/ Ft. Lauderdale, Florida Leasing and sales 5 acres 2000
Ft. Myers, Florida Leasing and sales 3 acres 2000
Tampa, Florida Leasing and sales 9 acres 2000
Orlando, Florida Leasing and sales 5 acres 2000
Atlanta, Georgia Leasing and sales 15 acres 2000
Kansas City, Kansas/ Missouri Leasing and sales 5 acres 2001

12
Milwaukee, Wisconsin Leasing and sales 5 acres 2001
Charlotte, North Carolina Leasing and sales 4 acres 2001
Nashville, Tennessee Leasing and sales 6 acres 2001
San Francisco, California Leasing and sales 7 acres 2001
Raleigh, North Carolina Leasing and sales 7 acres 2001
Columbus, Ohio Leasing and sales 7 acres 2002
Little Rock, Arkansas Leasing and sales 12 acres 2002
St. Louis, Missouri Leasing and sales 7 acres 2002
Ft. Worth, Texas Leasing and sales 5 acres 2002
Louisville, Kentucky Leasing and sales 7 acres 2002
Columbia, South Carolina Leasing and sales 5 acres 2002
Baltimore, Maryland Leasing and sales 9 acres 2002
Philadelphia, Pennsylvania Leasing and sales 4 acres 2002
Richmond, Virginia Leasing and sales 4 acres 2002
Boston, Massachusetts Leasing and sales 4 acres 2002
Toronto, Canada Leasing and sales 4 acres 2002
Portland, Oregon Leasing and sales 2 acres 2003
Each branch has a branch manager who has overall supervisory responsibility for all activities of the branch. Branch managers report to one of our twelve regional managers. Our regional managers, in turn, report to one of our three senior vice presidents. Incentive bonuses are a substantial portion of the compensation for these senior vice presidents, branch and regional managers. Each branch has its own sales force and a transportation department that delivers and picks up portable storage units from customers. Each branch has delivery trucks and forklifts to load, transport and unload units and a storage yard staff responsible for unloading and stacking units. Steel units can be stored by stacking them three high to maximize usable ground area. Our larger branches also have a fleet maintenance department to maintain the branch's trucks, forklifts and other equipment. Our smaller branches perform preventative maintenance tasks and outsource major repairs. Sales and Marketing We have approximately 300 dedicated sales people at our branches and 17 people in sales management at our headquarters and other locations that conduct sales and marketing on a full-time basis. We believe that by locating most of our sales and marketing staff in our branches, we can better understand the portable storage needs of our customers and provide high levels of customer service. Our sales force handles all of our products and we do not maintain separate sales forces for our various product lines. Our sales and marketing force provides information about our products to prospective customers by handling inbound calls and by initiating cold calls. We have on-going sales and marketing training programs covering all aspects of leasing and customer service. Our branches communicate with one another and with corporate headquarters through our management information system. This enables the sales and marketing team to share leads and other information and permits the headquarters staff to monitor and review sales and leasing productivity on a branch-by-branch basis. Our sales and marketing employees are compensated primarily on a commission basis. Our nationwide presence allows us to offer our products to larger customers who wish to centralize the procurement of portable storage on a multi-regional or national basis. We are well equipped to meet multi-regional customers needs through our National Account Program, which simplifies the procurement, rental and billing process for those customers. Over 470 customers currently participate in our National Account Program. We also provide our national account customers with service guarantees which assure

13
them they will receive the same high level of customer service from any of our branch locations. This program has helped us succeed in leveraging customer relationships developed at one branch throughout our branch system. We advertise our products in the yellow pages and use a targeted direct mail program. In 2003, we mailed over 8.7 million product brochures to existing and prospective customers. These brochures describe our products and features and highlight the advantages of portable storage. Our total advertising costs were approximately $6.9 million in 2003, $6.2 million in 2002 and $5.2 million in 2001. Customers During 2003, approximately 67,400 customers leased our portable storage, combination storage/office and mobile office units, compared to approximately 62,000 in 2002. Our customer base is diverse and consists of businesses in a broad range of industries. Our largest single leasing customer accounted for 4.9% and 5.7% of our leasing revenues in 2003 and 2002, respectively. Our next largest customer accounted for less than 0.5% and 0.6% of our leasing revenues in 2003 and 2002, respectively. Our twenty largest customers combined accounted for approximately 7.4% of our lease revenues in 2003 and approximately 8.8% of our lease revenues in 2002. Approximately 62.6% of our customers rented a single unit during 2003. We target customers who can benefit from our portable storage solutions either for seasonal, temporary or long-term storage needs. Customers use our portable storage units for a wide range of purposes. The following table provides an overview at December 31, 2003 of our customers and how they use our portable storage, combination storage/office and mobile office units:
Business
Approximate Percentage of
Units on Lease
Representative Customers
Typical Application Consumer service and retail businesses 38.5% Department, drug, grocery and
strip mall stores, hotels, restaurants, dry cleaners and service stations
Inventory storage, record storage and seasonal needs
Construction 32.0% General, electrical, plumbing and mechanical contractors, landscapers and residential homebuilders
Equipment and materials storage and job offices
Consumers 11.6% Homeowners Backyard storage and storage of household goods during relocation or renovation
Industrial and commercial 9.1% Distributors, trucking and utility companies, finance and insurance companies and film production companies
Raw materials, equipment, document storage, in-plant office and seasonal needs
Institutions, government agencies and others
8.8% Hospitals, medical centers and military, Native American tribal governments and reservations and Federal, state, county and local agencies
Athletic equipment, storage, disaster preparedness, supplier, record storage, security office, supplies, equipment storage, temporary office space and seasonal needs

14
Manufacturing We build new steel portable storage units, steel mobile offices and other custom-designed steel structures as well as refurbish used ocean going containers at our Maricopa, Arizona manufacturing plant. We also refurbish used ocean-going containers at this plant and at our branch locations. Our manufacturing capabilities allow us to differentiate our products from our competitors and enable us to provide a broader product selection to our customers. Our manufacturing process includes cutting, shaping and welding raw steel, installing customized features and painting the newly constructed units. Typically, we manufacture "knock-down" units, which we ship to our branches. These units are then assembled by our branches that have assembly capabilities or third party assemblers. We can ship up to twelve "knock-down" 20-foot containers on a single flat-bed trailer. By comparison, only two or three assembled 20-foot ocean-going containers can be shipped on a flat-bed trailer. This reduces our cost of transporting units to our branches and permits us to economically ship our manufactured units to any city in the continental United States or Canada. At December 31, 2003, we had about 160 manufacturing workers at our Maricopa facility, and an additional 275 workers who participate in manufacturing and repair activities in our branch facilities. We believe we can expand the capacity of our Maricopa facility at a relatively low cost, and that numerous third parties have the facilities needed to perform refurbishment and assembly services for us on a contract basis. We purchase raw materials such as steel, vinyl, wood, glass and paint, which we use in our manufacturing and restoring operations. We typically buy these raw materials on a purchase order basis. We do not have long-term contracts with vendors for the supply of any raw materials. Our manufacturing capacity protects us to some extent from price increases for used ocean-going containers. Used ocean-going containers vary in price from time to time based on market conditions. Should the price of used ocean-going containers increase substantially, we can increase our manufacturing volume and reduce the number of used steel containers we buy and refurbish. Vehicles At December 31, 2003, we had a fleet of nearly 400 delivery trucks, of which approximately 300 were owned and nearly 100 were leased. We use these trucks to deliver and pick up containers at customer locations. We supplement our delivery fleet by outsourcing delivery services to independent haulers when appropriate. Management Information Systems We use a customized management information system in an effort to optimize lease fleet utilization and the effectiveness of our sales and marketing. This system consists of a wide-area network that connects our headquarters and all of our branches. Headquarters and each branch can enter data into the system and access data on a real-time basis. We generate weekly management reports by branch with leasing volume, fleet utilization, lease rates and fleet movement as well as monthly profit and loss statements on a consolidated and branch basis. These reports allow management to monitor each branch's performance on a daily, weekly and monthly basis. We track each portable storage unit by its serial number. Lease fleet and sales information are entered in the system daily at the branch level and verified through monthly physical inventories by branch or corporate employees. Branch salespeople also use the system to track customer leads and other sales data, including information about current and prospective customers. We intend to invest further in upgrading our management information systems in 2004 and 2005. Lease Terms Based on the composition of our leases at the end of 2003, our steel portable storage unit leases have an average initial term of approximately 11 months and provide for the lease to continue at the same rental rate on a month-to-month basis until the customer cancels the lease. The average duration of these leases has been 25 months and the average monthly rental rate for units on lease was $98 during 2003. Most of our steel portable storage units rent for approximately $50 to over $200 per month. Our van trailers normally lease for substantially lower amounts than our portable storage units. Our combination storage/office and mobile office units typically have a scheduled initial lease term of approximately 15 months, and typically rent for $100 to over $1,500 per month. Our leases provide that the customer is responsible for the cost of delivery at lease inception and pickup at lease termination. Our leases specify that the customer is liable for any damage done to the unit beyond ordinary wear and tear. However, our customers may purchase a damage waiver from us to avoid some of this liability. This provides us with an additional source of recurring revenue. The customer's possessions stored within the portable storage unit are the responsibility of the customer.

15
Competition We face competition from several local companies and usually one or two regional or national companies in all of our current markets. We compete with several large national and international companies in our mobile office product line. Our competitors include lessors of storage units, mobile offices, used van trailers and other structures used for portable storage. We compete with conventional fixed self-storage facilities to a lesser extent. We compete primarily in terms of security, convenience, product quality, broad product selection and availability, lease rates and customer service. In our core portable storage business, we typically compete with Mobile Storage Group and a number of smaller local competitors. In the mobile office business, we typically compete with GE Capital Modular Space, Williams Scotsman and other national, regional and local companies. Employees As of December 31, 2003, we employed approximately 1,455 full-time employees in the following major categories:
Management 80 Administrative 230 Sales and marketing 295 Manufacturing 435 Drivers and storage unit handling 415
Access to Information Our Internet address is www.mobilemini.com. We make available at this address, free of charge, our annual report on Form 10-K, quarterly reports on Form 10-Q, current reports on Form 8-K and amendments to those reports filed or furnished pursuant to Section 13(a) or 15(d) of the Securities Exchange Act of 1934, as soon as reasonably practicable after we electronically file such material with, or furnish it to, the Securities and Exchange Commission. Reports of our executive officers, directors and any other persons required to file securities ownership reports under Section 16(a) of the Securities Exchange Act of 1934 are also available through our web site. Information contained on our web site is not part of this Report. Cautionary Factors That May Affect Future Operating Results Our discussion and analysis in this report, in other reports that we file with the Securities and Exchange Commission, in our press releases and in public statements of our officers and corporate spokespersons contain forward-looking statements. Forward-looking statements give our current expectations or forecasts of future events. You can identify these statements by the fact that they do not relate strictly to historical or current events. They include words such as “anticipate,” “estimate,” “expect,” “intend,” “plan,” “believe” and other words of similar meaning in connection with discussion of future operating or financial performance. These include statements relating to future actions, acquisition and growth strategy, future performance or results of current and anticipated products, sales efforts, expenses, the outcome of contingencies such as legal proceedings and financial results. Forward-looking statements may turn out to be wrong. They can be affected by inaccurate assumptions or by known or unknown risks and uncertainties. Many factors mentioned in this report, for example, the availability to Mobile Mini of additional equity and debt financing that could be needed to continue to achieve growth rates similar to those of the last several years, will be important in determining future results. No forward-looking statement can be guaranteed, and actual results may vary materially from those anticipated in any forward-looking statement. Mobile Mini undertakes no obligation to update any forward-looking statement. We provide the following discussion of risks and uncertainties relevant to our business. These are factors that we think could cause our actual results to differ materially from expected and historical results. Mobile Mini could also be adversely affected by other factors besides those listed here. We operate with a high amount of debt and we may incur significant additional indebtedness. Our operations are capital intensive, and we operate with a high amount of debt relative to our size. In June 2003, we issued $150.0 million in aggregate principal amount of 9.5% Senior Notes, due 2013. Under our revolving credit facility, we can borrow up to

16
$250.0 million on a revolving loan basis, which means that amounts repaid may be reborrowed. As of March 5, 2004, we had outstanding borrowings of approximately $105.0 million and letters of credit of approximately $2.0 million under the credit facility, leaving approximately $143.0 million, available for further borrowing, of which approximately $72.6 million was immediately available computed under the most restrictive covenant contained in the revolving credit facility. Our substantial indebtedness could have important consequences. For example, it could:
• require us to dedicate a substantial portion of our cash flow from operations to payments on our indebtedness, which could reduce the availability of our cash flow to fund future working capital, capital expenditures, acquisitions and other general corporate purposes;
• make it more difficult for us to satisfy our obligations with respect to our Senior Notes;
• expose us to the risk of increased interest rates, as certain of our borrowings will be at variable rates of interest;
• require us to sell assets to reduce indebtedness or influence our decisions about whether to do so;
• increase our vulnerability to general adverse economic and industry conditions;
• limit our flexibility in planning for, or reacting to, changes in our business and our industry;
• restrict us from making strategic acquisitions or pursuing business opportunities;
• place us at a competitive disadvantage compared to our competitors that have relatively less indebtedness; and
• limit, along with the financial and other restrictive covenants in our indebtedness, among other things, our ability to borrow
additional funds. Failing to comply with those covenants could result in an event of default which, if not cured or waived, could have a material adverse effect on our business, financial condition and results of operations.
Subject to the restrictions in our revolving credit facility and the indenture governing our Senior Notes, we and our subsidiaries may incur significant additional indebtedness. Although the terms of the revolving credit facility and the indenture contain restrictions on the incurrence of additional indebtedness, these restrictions are subject to a number of qualifications and exceptions, and additional indebtedness incurred in compliance with these restrictions could be substantial. If new debt is added to our current debt levels, the related risks that we now face could increase. Covenants in our debt instruments restrict or prohibit our ability to engage in or enter into a variety of transactions. The indenture governing our Senior Notes and our revolving credit facility agreement contain various restrictive covenants that limit our discretion in operating our business. In particular, these agreements limit our ability to, among other things:
• make restricted payments (including paying dividends on, limitations on redeeming or repurchasing our capital stock);
• issue preferred stock of subsidiaries;
• make certain investments or acquisitions;
• create liens on our assets to secure debt;
• engage in transactions with affiliates;
• merge, consolidate or transfer substantially all of our assets; and
• transfer and sell assets. In addition, our revolving credit facility requires us to maintain certain financial ratios and limits our ability to make capital expenditures. These covenants and ratios could have an adverse effect on our business by limiting our ability to take advantage of

17
financing, merger and acquisition or other corporate opportunities and to fund our operations. Breach of a covenant in our debt instruments could cause acceleration of a significant portion of our outstanding indebtedness. Any future debt could also contain financial and other covenants more restrictive than those imposed under the indenture governing the Senior Notes, and the restated revolving credit facility. A breach of a covenant or other provision in any debt instrument governing our current or future indebtedness could result in a default under that instrument and, due to cross-default and cross-acceleration provisions, could result in a default under our other debt instruments. Upon the occurrence of an event of default under the revolving credit facility or any other debt instrument, the lenders could elect to declare all amounts outstanding to be immediately due and payable and terminate all commitments to extend further credit. If we were unable to repay those amounts, the lenders could proceed against the collateral granted to them, if any, to secure the indebtedness. If the lenders under our current or future indebtedness accelerate the payment of the indebtedness, we cannot assure you that our assets or cash flow would be sufficient to repay in full our outstanding indebtedness, including the Senior Notes. Our planned growth strains our management resources, which could disrupt our development of our new branch locations. Our future performance will depend in large part on our ability to manage our planned growth. Our growth could strain our management, human and other resources. To successfully manage this growth, we must continue to add managers and employees and improve our operating, financial and other internal procedures and controls. We also must effectively motivate, train and manage our employees. If we do not manage our growth effectively, some of our new branches and acquisitions may lose money or fail, and we may have to close unprofitable locations. Closing a branch would likely result in additional expenses that would cause our operating results to suffer. We may need additional debt or equity to sustain our growth, but we do not have commitments for such funds. We finance our growth through a combination of borrowings, cash flow from operations, and equity financing. Our ability to continue growing at the pace we have historically grown will depend in part on our ability to obtain either additional debt or equity financing. The terms on which debt and equity financing is available to us varies from time to time and is influenced by our performance and by external factors, such as the economy generally and developments in the market, that are beyond our control. Also, additional debt financing or the sale of additional equity securities may cause the market price of our common stock to decline which will make it less likely that we will pursue any equity financing. If we are unable to obtain additional debt or equity financing on acceptable terms, we may have to curtail our growth by delaying new branch openings, or, under certain circumstances, lease fleet expansion. Continued slowdown in the economy could further reduce demand from some of our customers, which could result in lower demand for our products. At the end of 2003 and 2002, customers in the construction industry accounted for approximately 32% and 30%, respectively, of our leased units. This industry tends to be cyclical and particularly susceptible to slowdowns in the overall economy. If sustained economic slowdown in this sector continues, we may experience less demand for leases and sales of our products. If we do, our results of operations may decline, and we may decide to slow the pace of our planned lease fleet growth and new branch expansion. Our internal growth rate slowed from 22.2% in 2001 to 7.5% in 2002 and to 7.4% in 2003 due to a slowdown in the economy. The supply and price of used ocean-going containers fluctuates, and this can affect our pricing, our ability to grow, and the amount we can borrow under our credit facility. We purchase, refurbish and modify used ocean-going containers in order to expand our lease fleet. The availability of these containers depends in part on the level of international trade and overall demand for containers in the ocean cargo shipping business. When international shipping increases, the availability of used ocean-going containers for sale often decreases, and the price of available containers increases. Conversely, an oversupply of used ocean-going containers may cause container prices to fall. Our competitors may then lower the lease rates on their storage units. As a result, we may need to lower our lease rates to remain competitive. This would cause our revenues and our earnings to decline. Ours is not the only type of business that purchases used ocean-going containers. Various freight transportation companies, freight forwarders and commercial and retail storage companies purchase used ocean-going containers. Some of these companies have greater financial resources than we do. As a result, if the number of available containers for sale decreases, these competitors may be

18
able to absorb an increase in the cost of containers, while we could not. If used ocean-going container prices increase substantially, we may not be able to manufacture enough new units to grow our fleet. These price increases also could increase our expenses and reduce our earnings. The amount we can borrow under our revolving credit facility depends in part on the value of the portable storage units in our lease fleet. If the value of our lease fleet declines, we cannot borrow as much. Therefore, we may be unable to add as many units to our fleet as we would like. Also, we are required to satisfy several covenants with our lenders that are affected by changes in the value of our lease fleet. We would breach some of these covenants if the value of our lease fleet drops below specified levels. If this happened, we could not borrow the amounts we would need to expand our business, and we could be forced to liquidate a portion of our existing fleet. The supply and cost of raw materials we use in manufacturing fluctuates and could increase our operating costs. We manufacture portable storage units to add to our lease fleet and for sale. In our manufacturing process, we purchase steel, vinyl, wood, glass and other raw materials from various suppliers. We cannot be sure that an adequate supply of these materials will continue to be available on terms acceptable to us. The raw materials we use are subject to price fluctuations that we cannot control. Changes in the cost of raw materials can have a significant effect on our operations and earnings. Rapid increases in raw material prices are difficult to pass through to customers. If we are unable to pass on these higher costs, our profitability will decline. If raw material prices decline significantly, we may have to write down our raw materials inventory values. If this happens, our results of operations and financial condition will decline. Some zoning laws restrict the use of our storage units and therefore limit our ability to offer our products in all markets. Most of our customers use our storage units to store their goods on their own properties. Local zoning laws in some of our markets do not allow some of our customers to keep portable storage units on their properties or do not permit portable storage units unless located out of sight from the street. If local zoning laws in one or more of our markets no longer allow our units to be stored on customers' sites, our business in that market will suffer.
Future changes in financial accounting standards may cause lower than expected operating results and affect our reported results of operations. Changes in accounting standards may have a significant effect on our reported results and may affect our reporting of transactions completed before the change becomes effective. New pronouncements and varying interpretations of pronouncements have occurred and may occur in the future. Changes to existing standards or current practices may adversely affect our reported financial results. One illustration of this would be a change requiring compensation expense for employee stock options be recorded in the statement of operations which could have a negative effect on our results of operations. We depend on a few key management persons. We are substantially dependent on the personal efforts and abilities of Steven G. Bunger, our Chairman, President and Chief Executive Officer, and Lawrence Trachtenberg, our Executive Vice President and Chief Financial Officer. The loss of either of these officers or our other key management persons could harm our business and prospects for growth. The market price of our common stock has been volatile and may continue to be volatile and the value of your investment may decline. The market price of our common stock has been volatile and may continue to be volatile. This volatility may cause wide fluctuations in the price of our common stock on the Nasdaq National Market. The market price of our common stock is likely to be affected by:
• changes in general conditions in the economy, geo political or the financial markets; • variations in our quarterly operating results; • changes in financial estimates by securities analysts; • other developments affecting us, our industry, customers or competitors; • the operating and stock price performance of companies that investors deem comparable to us; and • the number of shares available for resale in the public markets under applicable securities laws.

19
ITEM 2. DESCRIPTION OF PROPERTY. We own our branch locations in Dallas, Texas, Oklahoma City, Oklahoma and a portion of our Phoenix, Arizona location. We lease all of our other branch locations. All of our major leased properties have remaining lease terms of at least 3 years, and we believe that satisfactory alternative properties can be found in all of our markets if necessary. We own our manufacturing facility in Maricopa, Arizona, approximately 30 miles south of Phoenix. This facility is 12 years old and is on approximately 45 acres. The facility includes nine manufacturing buildings, totaling approximately 166,600 square feet. These buildings house our manufacturing, assembly, restoring, painting and vehicle maintenance operations. We lease our corporate and administrative offices in Tempe, Arizona. These offices have 25,000 square feet of space. The lease term is through August 2008. ITEM 3. LEGAL PROCEEDINGS. In April 2000, we acquired the portable storage business that was operated in Florida by A-1 Trailer Rental and several affiliated entities (collectively, "A-1 Trailer Rental"). As previously reported in our quarterly reports on Form 10-Q and our previous annual report on Form 10-K, which are filed with the Securities and Exchange Commission, two lawsuits were filed against us in the State of Florida arising out of that acquisition. One lawsuit, Nuko Holdings I, LLC v. Mobile Mini, Inc., was an action against us brought in the Circuit Court of the 13th Judicial District in and for Hillsborough County, Florida (Case No. 0003500), and resulted in a verdict of $7,215,000 being entered against us. In the second case, A-1 Trailer Rental filed an action (A-1 Trailer Rental, et al. v. Mobile Mini, Inc. (Case No. 8:02-cv-323-T-27TGW, in the United States District Court for the Middle District of Florida, Tampa Division)) requesting that the court find that A-1 Trailer Rental has no contractual agreement to indemnify us against any losses we suffer as a consequence of the Nuko Holdings lawsuit and that the $2,200,000 held in escrow in accordance with the terms of the A-1 Trailer Rental acquisition agreement and a subsequent agreement be delivered to A-1 Trailer Rental. In a Form 8-K filed with the SEC on December 22, 2003, we announced that a panel of the Florida Second District Court of Appeals had affirmed the jury verdict award against Mobile Mini. Mobile Mini filed motions in December 2003 requesting a rehearing en banc by the court and requesting a written opinion of the court’s decision upholding the jury verdict award of $7.2 million in damages to Nuko Holdings. The court has denied these motions. The judgment and interest (totaling approximately $8.0 million) have been paid in 2004 through Mobile Mini’s revolving line of credit and fully accrued at December 31, 2003. A letter of credit of about $4.3 million under that credit line as of December 31, 2003, which had been used to support the appeal bond has been released. Payment of the judgment and interest thereon will not have a material adverse affect on Mobile Mini’s financial condition. The financial covenants under our revolving credit facility and the indenture related to our Senior Notes exclude the amount of the judgment and related interest costs when measuring compliance with the terms of the related facilities. With respect to the litigation with A-1 Trailer Rental, on February 9, 2004, a final judgment was entered in the United States District Court, Middle District of Florida, Tampa Division. Pursuant to the terms of the final judgment, A-1 is not obligated to indemnify Mobile Mini for losses relating to the judgment. Mobile Mini was awarded money relating to other claims, and some fees and costs. The judgment will not be appealed. The amount due to Mobile Mini under the judgment (approximately $217,000) has been paid to the Company out of an escrow account. The remainder of the escrowed funds has been paid over to A-1 Trailer. ITEM 4. SUBMISSION OF MATTERS TO A VOTE OF SECURITY HOLDERS. No matters were submitted to a vote of our security holders during the quarter ended December 31, 2003. EXECUTIVE OFFICERS OF MOBILE MINI, INC. Set forth below is information respecting the name, age and position with Mobile Mini of our executive officer who is not a continuing director or a director nominee. Information respecting our executive officers who are continuing directors and director nominees is set forth in Item 10 of this report which incorporates by reference to Mobile Mini’s definitive proxy statement to the 2004 annual meeting of shareholders, to be filed with the Securities and Exchange Commission pursuant to Regulation 14A. Deborah K. Keeley has served as our Vice President of Accounting since August 1996 and Corporate Controller since September
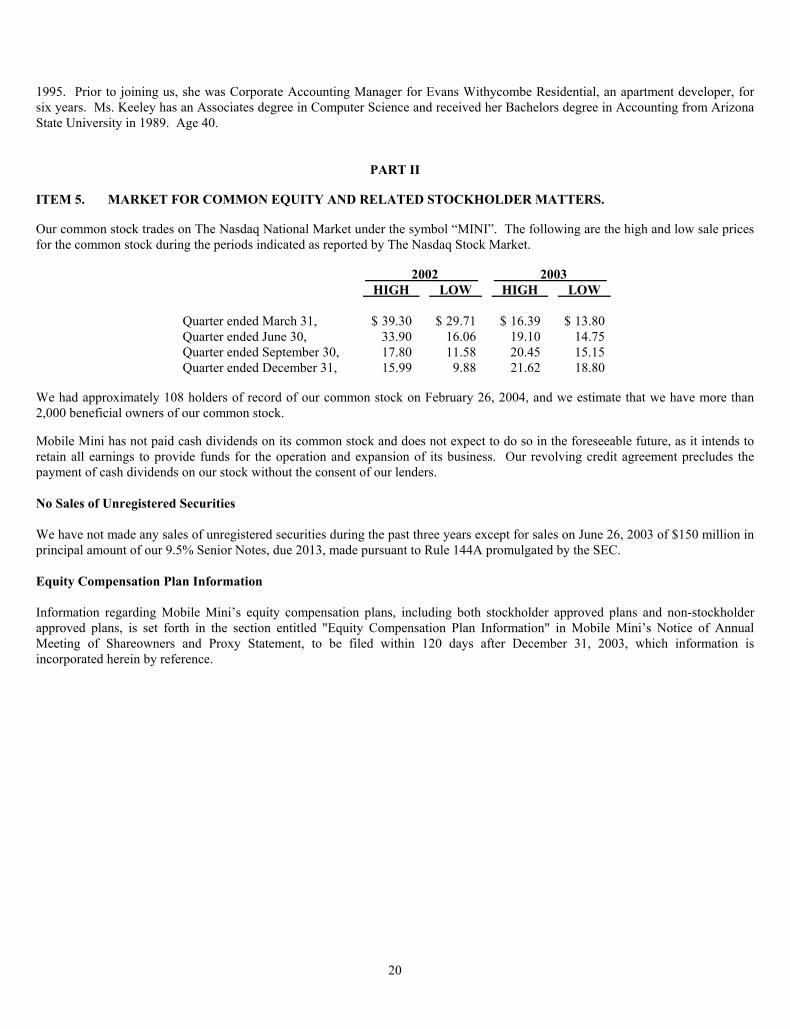
20
1995. Prior to joining us, she was Corporate Accounting Manager for Evans Withycombe Residential, an apartment developer, for six years. Ms. Keeley has an Associates degree in Computer Science and received her Bachelors degree in Accounting from Arizona State University in 1989. Age 40.
PART II
ITEM 5. MARKET FOR COMMON EQUITY AND RELATED STOCKHOLDER MATTERS. Our common stock trades on The Nasdaq National Market under the symbol “MINI”. The following are the high and low sale prices for the common stock during the periods indicated as reported by The Nasdaq Stock Market.
2002 2003 HIGH LOW HIGH LOW Quarter ended March 31, $ 39.30 $ 29.71 $ 16.39 $ 13.80 Quarter ended June 30, 33.90 16.06 19.10 14.75 Quarter ended September 30, 17.80 11.58 20.45 15.15 Quarter ended December 31, 15.99 9.88 21.62 18.80
We had approximately 108 holders of record of our common stock on February 26, 2004, and we estimate that we have more than 2,000 beneficial owners of our common stock. Mobile Mini has not paid cash dividends on its common stock and does not expect to do so in the foreseeable future, as it intends to retain all earnings to provide funds for the operation and expansion of its business. Our revolving credit agreement precludes the payment of cash dividends on our stock without the consent of our lenders. No Sales of Unregistered Securities We have not made any sales of unregistered securities during the past three years except for sales on June 26, 2003 of $150 million in principal amount of our 9.5% Senior Notes, due 2013, made pursuant to Rule 144A promulgated by the SEC. Equity Compensation Plan Information Information regarding Mobile Mini’s equity compensation plans, including both stockholder approved plans and non-stockholder approved plans, is set forth in the section entitled "Equity Compensation Plan Information" in Mobile Mini’s Notice of Annual Meeting of Shareowners and Proxy Statement, to be filed within 120 days after December 31, 2003, which information is incorporated herein by reference.

21
ITEM 6. SELECTED FINANCIAL DATA. The following table shows our selected consolidated historical financial data for the stated periods. Certain amounts include the effect of rounding. You should read this material with “Management’s Discussion and Analysis of Financial Condition and Results of Operations” and the financial statements included elsewhere in this report.
Year ended December 31, 1999 2000 2001 2002 2003 (in thousands, except per share and operating data) Consolidated Statements of Income Data: Revenues:
Leasing $ 53,302 $ 76,084 $ 99,684 $ 116,169 $ 128,482 Sales 12,820 13,406 14,519 16,008 17,248 Other 531 686 520 920 838
Total revenues 66,653 90,176 114,723 133,097 146,568 Costs and expenses:
Cost of sales 8,506 8,681 9,546 10,343 11,487 Leasing, selling and general expenses 32,218 44,369 56,387 69,203 79,071 Florida litigation expense ⎯ ⎯ ⎯ 1,320 8,502 Depreciation and amortization 4,065 6,023 8,237 9,457 11,079
Total costs and expenses 44,789 59,073 74,170 90,323 110,139 Income from operations 21,864 31,103 40,553 42,774 36,429 Other income (expense):
Interest income 47 80 34 13 2 Interest expense (6,162) (9,511) (9,959) (11,587) (16,299) Debt restructuring expense (1) (707) ⎯ ⎯ (1,300) (10,440)
Income before provision for income taxes 15,042 21,672 30,628 29,900 9,692 Provision for income taxes 6,016 8,452 11,945 11,661 3,780 Preferred stock dividend (22) ⎯ ⎯ ⎯ ⎯ Net income available to common stockholders $ 9,004 $ 13,220 $ 18,683 $ 18,239 $ 5,912
Net income per share: Basic $ 0.89 $ 1.15 $ 1.38 $ 1.28 $ 0.41 Diluted $ 0.85 $ 1.11 $ 1.34 $ 1.26 $ 0.41
Weighted average number of common and common share equivalents outstanding:
Basic 10,153 11,542 13,515 14,254 14,312 Diluted 10,640 11,944 13,954 14,442 14,462
Operating Data: Number of branches (at year end) 19 29 35 46 47 Number of states and Canadian provinces (at year end) 11 14 18 27 28 Lease fleet units (at year end) 37,077 55,472 70,070 83,642 89,492 Lease fleet utilization (annual average) 85.6% 85.3% 82.5% 79.1% 78.7%Lease revenue growth from prior year 46.2% 42.7% 31.0% 16.5% 10.6%Operating margin 32.8% 34.5% 35.3% 32.1% 24.9%Net income margin 13.5% 14.7% 16.3% 13.7% 4.0% At December 31,
(in thousands) Consolidated Balance Sheet Data: 1999 2000 2001 2002 2003 Lease fleet, net $ 121,277 $ 195,865 $ 277,020 $ 337,084 $ 382,754 Total assets 178,392 279,960 376,506 460,890 515,080 Total debt 78,271 150,090 162,490 213,222 240,610 Stockholders’ equity 77,387 92,431 161,703 178,669 189,293
(1) In 1999 and 2002, extraordinary items were recorded under SFAS No. 4, Reporting Gains and Losses from Extinguishment of Debt. Pursuant to SFAS No. 145, losses from debt extinguishment have been reclassified to pre-tax earnings as debt restructuring expense for consistency in selected financial data presentations.
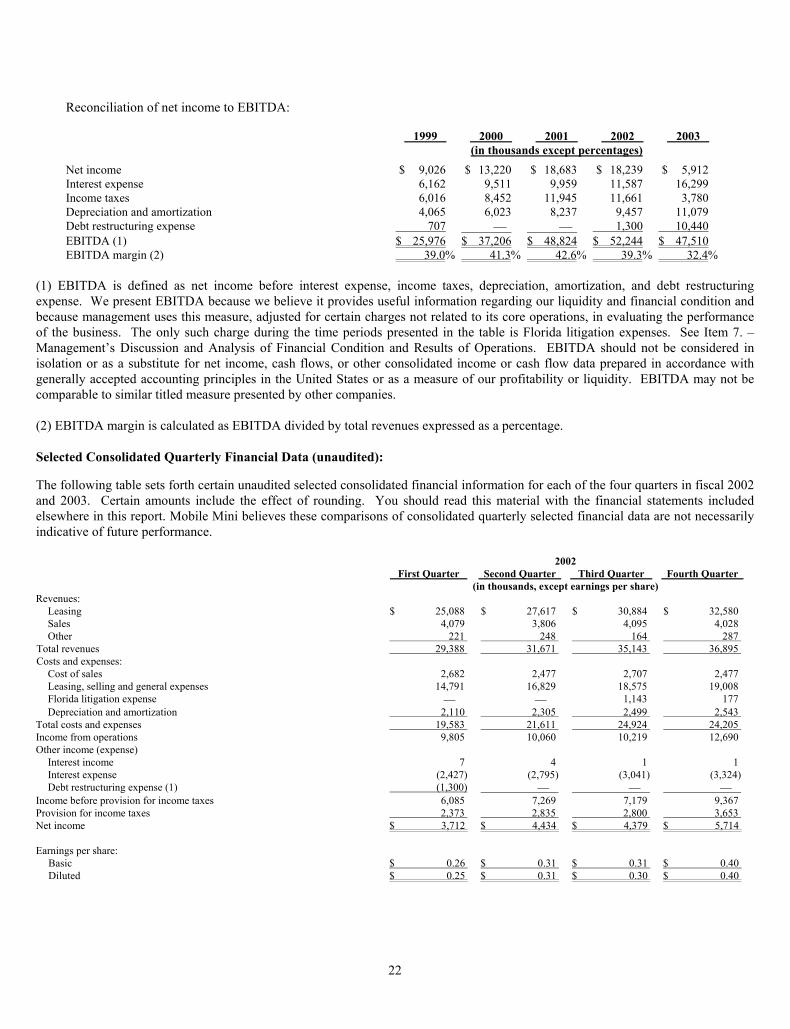
22
Reconciliation of net income to EBITDA:
1999 2000 2001 2002 2003 (in thousands except percentages) Net income $ 9,026 $ 13,220 $ 18,683 $ 18,239 $ 5,912 Interest expense 6,162 9,511 9,959 11,587 16,299 Income taxes 6,016 8,452 11,945 11,661 3,780 Depreciation and amortization 4,065 6,023 8,237 9,457 11,079 Debt restructuring expense 707 ⎯ ⎯ 1,300 10,440 EBITDA (1) $ 25,976 $ 37,206 $ 48,824 $ 52,244 $ 47,510 EBITDA margin (2) 39.0% 41.3% 42.6% 39.3% 32.4%
(1) EBITDA is defined as net income before interest expense, income taxes, depreciation, amortization, and debt restructuring expense. We present EBITDA because we believe it provides useful information regarding our liquidity and financial condition and because management uses this measure, adjusted for certain charges not related to its core operations, in evaluating the performance of the business. The only such charge during the time periods presented in the table is Florida litigation expenses. See Item 7. – Management’s Discussion and Analysis of Financial Condition and Results of Operations. EBITDA should not be considered in isolation or as a substitute for net income, cash flows, or other consolidated income or cash flow data prepared in accordance with generally accepted accounting principles in the United States or as a measure of our profitability or liquidity. EBITDA may not be comparable to similar titled measure presented by other companies. (2) EBITDA margin is calculated as EBITDA divided by total revenues expressed as a percentage. Selected Consolidated Quarterly Financial Data (unaudited): The following table sets forth certain unaudited selected consolidated financial information for each of the four quarters in fiscal 2002 and 2003. Certain amounts include the effect of rounding. You should read this material with the financial statements included elsewhere in this report. Mobile Mini believes these comparisons of consolidated quarterly selected financial data are not necessarily indicative of future performance. 2002 First Quarter Second Quarter Third Quarter Fourth Quarter (in thousands, except earnings per share) Revenues:
Leasing $ 25,088 $ 27,617 $ 30,884 $ 32,580 Sales 4,079 3,806 4,095 4,028 Other 221 248 164 287
Total revenues 29,388 31,671 35,143 36,895 Costs and expenses:
Cost of sales 2,682 2,477 2,707 2,477 Leasing, selling and general expenses 14,791 16,829 18,575 19,008 Florida litigation expense ⎯ ⎯ 1,143 177 Depreciation and amortization 2,110 2,305 2,499 2,543
Total costs and expenses 19,583 21,611 24,924 24,205 Income from operations 9,805 10,060 10,219 12,690 Other income (expense)
Interest income 7 4 1 1 Interest expense (2,427) (2,795) (3,041) (3,324) Debt restructuring expense (1) (1,300) ⎯ ⎯ ⎯
Income before provision for income taxes 6,085 7,269 7,179 9,367 Provision for income taxes 2,373 2,835 2,800 3,653 Net income $ 3,712 $ 4,434 $ 4,379 $ 5,714 Earnings per share:
Basic $ 0.26 $ 0.31 $ 0.31 $ 0.40 Diluted $ 0.25 $ 0.31 $ 0.30 $ 0.40

23
2003 First Quarter Second Quarter Third Quarter Fourth Quarter (in thousands, except earnings per share) Revenues:
Leasing $ 29,704 $ 30,942 $ 32,772 $ 35,064 Sales 3,860 3,990 3,653 5,745 Other 178 120 211 330
Total revenues 33,742 35,052 36,636 41,139 Costs and expenses:
Cost of sales 2,454 2,494 2,354 4,185 Leasing, selling and general expenses 19,108 19,542 19,164 21,257 Florida litigation expense 64 155 65 8,218 Depreciation and amortization 2,617 2,673 2,832 2,957
Total costs and expenses 24,243 24,864 24,415 36,617 Income from operations 9,499 10,188 12,221 4,522 Other income (expense)
Interest income 1 ⎯ 1 ⎯ Interest expense (3,216) (3,240) (4,887) (4,957) Debt restructuring expense ⎯ (10,440) ⎯ ⎯
Income (loss) before provision for (benefit of) income taxes 6,284 (3,492) 7,335 (435) Provision for (benefit of) income taxes 2,451 (1,362) 2,861 (170) Net income (loss) $ 3,833 $ (2,130) $ 4,474 $ (265) Earnings (loss) per share:
Basic $ 0.27 $ (0.15) $ 0.31 $ (0.02) Diluted $ 0.27 $ (0.15) $ 0.31 $ (0.02)
(1) In 2002, extraordinary items were recorded under SFAS No. 4, Reporting Gains and Losses from Extinguishment of Debt. Pursuant to SFAS No. 145, Losses from debt extinguishment have been reclassified to pre-tax earnings as debt restructuring expense for consistency in selected financial data presentations. ITEM 7. MANAGEMENT’S DISCUSSION AND ANALYSIS OF FINANCIAL CONDITION AND RESULTS OF OPERATIONS. The following discussion of our financial condition and results of operations should be read together with the consolidated financial statements and the accompanying notes included elsewhere in this report. This discussion contains forward-looking statements that involve risks and uncertainties. Our actual results may differ materially from those anticipated in those forward-looking statements as a result of certain factors, including, but not limited to, those described under Item 1, "Description of Business -Cautionary Factors that May Affect Future Operating Results.” Overview General In 1996, we initiated a strategy of focusing on leasing rather than selling our portable storage units. As a result of this change, leasing revenues as a percentage of our total revenues increased steadily from 42.1% in 1996 to 87.7% in 2003. The number of portable storage and combination storage/office and mobile office units in our lease fleet increased from 13,604 at the end of 1996 to 89,492 at the end of 2003, representing a compounded annual growth rate, or CAGR, of 30.9%. Because of this shift in strategy, we derive most of our revenues from the leasing of portable storage containers and portable offices. The average contracted lease term at lease inception is approximately 11 months for portable storage units and approximately 15 months for portable offices. After the expiration of the contracted lease term, units continue on lease on a month-to-month basis. In 2003, the over-all lease term averaged 25 months for portable storage units and 22 months for portable offices. As a result of these long average lease terms, our leasing business tends to provide us with a recurring revenue stream and minimizes fluctuations in revenues. However, there is no assurance that the Company will maintain such lengthy overall lease terms.
In addition to our leasing business, we also sell portable storage containers and occasionally we sell portable office units. Since 1996, when we changed our focus to leasing, our sales revenues as a percentage of total revenues has decreased from 55.7% in 1996 to 11.8% in 2003.

24
Over the last six years, Mobile Mini has grown both through internally generated growth and acquisitions which we use to gain a presence in new markets. Typically, we enter a new market through the acquisition of the business of a smaller local competitor and then apply our business model, which is usually much more customer and marketing focused than the business we are buying. As a result, a new branch location will typically have fairly low operating margins during its early years, but as our marketing efforts help us penetrate the new market and we increase the number of units on rent at the new branch, we take advantage of operating efficiencies to improve operating margins at the branch and reach company average levels after several years. We believe that we incur lower start-up costs and a quicker growth curve using this acquisition model than if we were to establish the new location from the ground up, without the acquisition of assets immediately producing lease revenue in the new market. Among the external factors we examine to determine the direction of our business is the level of non-residential construction activity, especially in areas of the country where we have a significant presence. Construction activity represents approximately 32% of our units on rent at December 31, 2003, and because of the degree of operating leverage we have, declines in non-residential construction activity in 2002 and 2003 had a significant effect on our operating margins and net income. When we enter a new market, we incur certain costs in developing an infrastructure. For example, advertising and marketing costs will be incurred and certain minimum staffing levels and certain minimum levels of delivery equipment will be put in place regardless of the new market’s revenue base. Once we have achieved revenues during any period that are sufficient to cover our fixed expenses, we generate high margins on incremental lease revenues. Therefore, each additional unit put on lease in excess of the break even level, contributes significantly to profitability. Conversely, additional fixed expenses that we incur require us to achieve additional revenue as compared to the prior period to cover the additional expense. In 2003, in addition to increased costs associated with branches established in 2002, we experienced material increases in insurance, property taxes and fuel costs. In that year, we continued to see weakness in the level of leasing revenues from the non-residential construction sector of our customer base, resulting in an approximately 10.6% increase in leasing revenues during 2003 compared to 2002. This lower than historical growth rate combined with increases in fixed costs depressed our growth in adjusted EBITDA (as defined below) in 2003. In managing our business, we focus on our internal growth rate in leasing revenue, which we define as growth in lease revenues on a year over year basis at our branch locations in operation for at least one year, without inclusion of same market acquisitions. This internal growth rate has remained positive every quarter in 2002 and 2003, but has fallen to single digits from over 20% in prior quarters due to the slowdown in the economy, especially as the slowdown has affected the non-residential construction sector in areas where we have large branch operations, including Texas and Colorado. Mobile Mini’s goal is to increase its internal growth rate so that revenue growth will exceed inflationary growth in expenses and we can again take advantage of the operating leverage inherent in our business model. We are a capital-intensive business, so in addition to focusing on earnings per share, we focus on adjusted EBITDA. We calculate this number by first calculating EBITDA, which is a measure of our earnings before interest expense, debt restructuring costs, income tax, depreciation and amortization. This measure eliminates the effect of financing transactions that we enter into on an irregular basis based on capital needs and market opportunities and provides us with a means to measure internally generated cash from which we can fund our interest expense and our lease fleet growth. In comparing EBITDA from year to year, we typically ignore the effect of what we consider non-recurring events not related to our core business operations to arrive at adjusted EBITDA. The only non-recurring events reflected in the adjusted EBITDA over the last several years have been the effect in 2002 and in 2003 of our Florida litigation expenses. The Florida litigation is discussed under the caption “Legal Proceedings” in Part I, Item 3 of this Report. In addition, several of the covenants contained under our revolving credit facility are expressed by reference to this financial measure, similarly computed. Because EBITDA is a non-GAAP financial measure as defined by the Securities and Exchange Commission, we include in this Report a reconciliation of EBITDA to the most directly comparable financial measures calculated and presented in accordance with accounting principles generally accepted in the United States. This reconciliation is included in Item 6, “Selected Financial Data.” In managing our business, we routinely compare our adjusted EBITDA margins from year to year and based upon age of branch. We define this margin as adjusted EBITDA divided by our total revenues, expressed as a percentage. We use this comparison, for example, to study internally the effect that increased costs have on our margins. As capital is invested in our established locations, we achieve higher adjusted EBITDA margins on that capital than we achieve on capital invested to establish a new branch because our fixed costs are already in place. The fixed costs are those associated with yard and delivery equipment, as well as advertising, sales, marketing and office expenses. With a new market or branch, we must first fund and absorb the startup costs for setting up the facility, hiring and developing the management and sales team and developing our marketing and advertising programs. A new branch will have low adjusted EBITDA margins in its early years until the number of units on rent increases. Because of our high
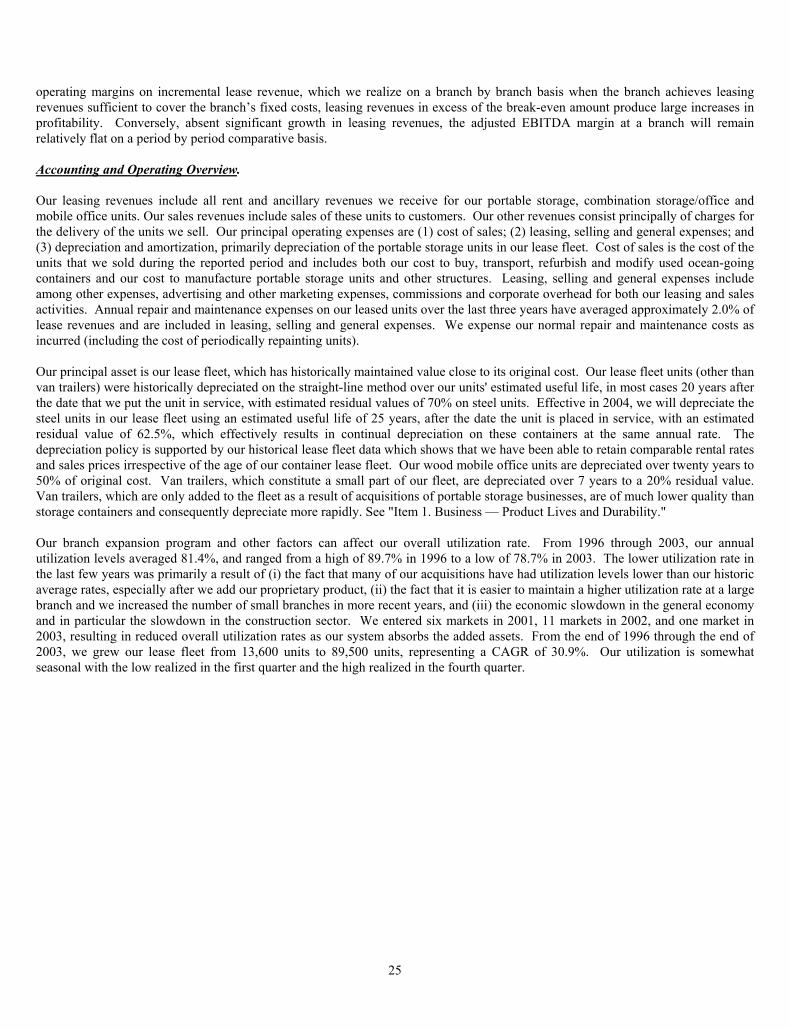
25
operating margins on incremental lease revenue, which we realize on a branch by branch basis when the branch achieves leasing revenues sufficient to cover the branch’s fixed costs, leasing revenues in excess of the break-even amount produce large increases in profitability. Conversely, absent significant growth in leasing revenues, the adjusted EBITDA margin at a branch will remain relatively flat on a period by period comparative basis. Accounting and Operating Overview. Our leasing revenues include all rent and ancillary revenues we receive for our portable storage, combination storage/office and mobile office units. Our sales revenues include sales of these units to customers. Our other revenues consist principally of charges for the delivery of the units we sell. Our principal operating expenses are (1) cost of sales; (2) leasing, selling and general expenses; and (3) depreciation and amortization, primarily depreciation of the portable storage units in our lease fleet. Cost of sales is the cost of the units that we sold during the reported period and includes both our cost to buy, transport, refurbish and modify used ocean-going containers and our cost to manufacture portable storage units and other structures. Leasing, selling and general expenses include among other expenses, advertising and other marketing expenses, commissions and corporate overhead for both our leasing and sales activities. Annual repair and maintenance expenses on our leased units over the last three years have averaged approximately 2.0% of lease revenues and are included in leasing, selling and general expenses. We expense our normal repair and maintenance costs as incurred (including the cost of periodically repainting units). Our principal asset is our lease fleet, which has historically maintained value close to its original cost. Our lease fleet units (other than van trailers) were historically depreciated on the straight-line method over our units' estimated useful life, in most cases 20 years after the date that we put the unit in service, with estimated residual values of 70% on steel units. Effective in 2004, we will depreciate the steel units in our lease fleet using an estimated useful life of 25 years, after the date the unit is placed in service, with an estimated residual value of 62.5%, which effectively results in continual depreciation on these containers at the same annual rate. The depreciation policy is supported by our historical lease fleet data which shows that we have been able to retain comparable rental rates and sales prices irrespective of the age of our container lease fleet. Our wood mobile office units are depreciated over twenty years to 50% of original cost. Van trailers, which constitute a small part of our fleet, are depreciated over 7 years to a 20% residual value. Van trailers, which are only added to the fleet as a result of acquisitions of portable storage businesses, are of much lower quality than storage containers and consequently depreciate more rapidly. See "Item 1. Business — Product Lives and Durability." Our branch expansion program and other factors can affect our overall utilization rate. From 1996 through 2003, our annual utilization levels averaged 81.4%, and ranged from a high of 89.7% in 1996 to a low of 78.7% in 2003. The lower utilization rate in the last few years was primarily a result of (i) the fact that many of our acquisitions have had utilization levels lower than our historic average rates, especially after we add our proprietary product, (ii) the fact that it is easier to maintain a higher utilization rate at a large branch and we increased the number of small branches in more recent years, and (iii) the economic slowdown in the general economy and in particular the slowdown in the construction sector. We entered six markets in 2001, 11 markets in 2002, and one market in 2003, resulting in reduced overall utilization rates as our system absorbs the added assets. From the end of 1996 through the end of 2003, we grew our lease fleet from 13,600 units to 89,500 units, representing a CAGR of 30.9%. Our utilization is somewhat seasonal with the low realized in the first quarter and the high realized in the fourth quarter.

26
Results of Operations The following table shows the percentage of total revenues represented by the key items that make up our statements of income; certain amounts may not add due to rounding:
Year Ended December 31, 1999 2000 2001 2002 2003 Revenues:
Leasing 80.0% 84.4% 86.9% 87.3% 87.7% Sales 19.2 14.9 12.7 12.0 11.8 Other 0.8 0.7 0.4 0.7 0.5
Total revenues 100.0 100.0 100.0 100.0 100.0 Costs and expenses:
Cost of sales 12.8 9.6 8.3 7.8 7.8 Leasing, selling and general expenses 48.3 49.2 49.2 52.0 53.9 Florida litigation expense ⎯ ⎯ ⎯ 1.0 5.8 Depreciation and amortization 6.1 6.7 7.2 7.1 7.6
Total costs and expenses 67.2 65.5 64.7 67.9 75.1 Income from operations 32.8 34.5 35.3 32.1 24.9 Other income (expense):
Interest income — — — — — Interest expense (9.2) (10.5) (8.7) (8.7) (11.1) Debt restructuring expense (1.1) ⎯ ⎯ (1.0) (7.2)
Income before provision for income taxes and preferred stock dividend
22.5
24.0
26.7
22.4
6.6
Provision for income taxes 9.0 9.3 10.4 8.7 2.6 Preferred stock dividend — — — — — Net income available to common stockholders 13.5% 14.7% 16.3% 13.7% 4.0%
Twelve Months Ended December 31, 2003 Compared to Twelve Months Ended December 31, 2002 Total revenues in 2003 increased $13.5 million, or 10.1%, to $146.6 million from $133.1 million in 2002. Leasing portable storage units and portable offices accounts for the majority of our revenues, and accounted for approximately 87.7% of total revenues during 2003. Leasing revenues in 2003 increased $12.3 million, or 10.6%, to $128.5 million from $116.2 million in 2002. This increase resulted primarily from an 11.9% increase in the average number of units on lease. In 2003, our internal growth rate was approximately 7.4% as compared to approximately 7.5% in 2002. We define internal growth as the growth in lease revenues in markets opened for at least one year, excluding any growth arising as a result of additional acquisitions in those markets. We completed only one small acquisition in Portland, Oregon in late 2003. The slowdown in our internal growth rate in 2002 and 2003 is principally due to general economic weakness, particularly associated with the non-residential construction sector and particularly in several of our more established markets. Internal growth at many of our newer locations was strong. This growth was offset by weakness at certain of our older more established branches, especially those in Texas and Colorado, which were affected by weakness in construction in the markets that those branches serve. Sales of portable storage units have accounted for approximately 11.8% to 12.7% of our total revenues over the past three years, and we generate less than 1.0% of our total revenues from other miscellaneous revenues, primarily related to our sales business, principally transportation charges for the delivery of units sold and the sale of ancillary products. Our revenues from the sale of portable storage units increased $1.2 million, or 7.8%, to $17.2 million in 2003 from $16.0 million in 2002. This 7.8% increase is partially due to increase sales at the locations we added in 2002 and a large government sale in the fourth quarter 2003, partially offset by lower sales volume at our more established locations. Cost of sales is the cost to us of units that we sold during the period. Cost of sales increased $1.1 million, or 11.1%, to $11.5 million in 2003 from $10.3 million in 2002. Cost of sales, as a percentage of sales revenues, increased to 66.6% in 2003 from 64.6% in 2002. This slight decrease in sales margins is not significant and is partially attributable to lower margins on the government sale made in the fourth quarter 2003, and the sales of van trailers at much lower margins than our principal products.

27
Leasing, selling and general expenses increased $9.9 million, or 14.3%, to $79.1 million in 2003 from $69.2 million in 2002. Leasing, selling and general expenses, as a percentage of total revenues, was 53.9% and 52.0% in 2003 and 2002, respectively. These expenses as a percentage of total revenues declined at older branches, as we were able to benefit from economies of scale as those branches grew. This was offset by higher leasing, selling and general expenses as a percentage of total revenues at newer branches. In general, new branches initially have lower operating margins until their fixed operating costs are covered by higher leasing volumes that typically are not achieved until the branch has been operated for several years. Among the other major increases in leasing, selling and general expenses in 2003 were increases in insurance expense ($2.1 million), advertising expense ($0.7 million), rent expense ($0.5 million) which related in significant part to the addition of 11 new locations during the second half of 2002, property tax expense ($0.8 million) and fuel expenses incurred in connection with the delivery and pick up of leased containers ($0.7 million). Florida litigation expense relates to litigation and related costs incurred in connection with our Florida litigation (see Item 3 of Part I of this report). We recorded approximately $8.5 million and $1.3 million of costs and legal expenses incurred to date in connection with this suit and related litigation in 2003 and 2002, respectively. EBITDA in 2003 was $47.5 million, which included the effect of $8.5 million of Florida litigation expense. In 2002, EBITDA was $52.2 million, which included the effect of $1.3 million of Florida litigation expense. Depreciation and amortization expenses increased $1.6 million, or 17.1%, to $11.1 million in 2003 from $9.5 million in 2002. The higher depreciation was directly related to a larger fleet in 2003, which enabled Mobile Mini to achieve higher lease revenues, and includes depreciation expenses associated with the refurbishment of portable storage units added to the lease fleet during 2003 following our acquisition of the units in transactions that occurred during 2002 and prior years and includes the higher depreciation rate associated with wood mobile offices which were a larger part of our fleet in 2003. See “Critical Accounting Policies and Estimates” within this Item 7. Interest expense increased $4.7 million, or 40.7%, to $16.3 million in 2003 from $11.6 million in 2002. The increase was primarily the result of the issuance in June 2003 of our Senior Notes, the proceeds of which were used to replace lower interest secured debt. Our average debt outstanding during 2003, compared to 2002, increased by 17.0%, with most of the increase occurring during the first six months of 2003, primarily due to increased borrowings under our credit facility to fund the growth of our lease fleet during that period. The increase in interest expense includes the higher interest cost associated with our Senior Notes, which effectively increased the weighted average interest rate on our debt from 5.7% for 2002 to 6.8% for 2003, excluding amortization of debt issuance costs. Taking into account the amortization of debt issuance costs, the weighted average interest rate was 5.9% in 2002 and 7.1% in 2003. Our weighted average interest rate is expected to be higher in 2004 due to the full year effect of the higher interest rate on the Senior Notes. Our Senior Notes bear interest at 9.5% per annum, which is higher than the average borrowing rate under our revolving credit facility. On an annualized basis, the additional interest cost incurred under the Senior Notes versus the senior secured credit facility is approximately $6 million based on floating rates and swap rates in effect at the time the transaction was concluded. The issuance of the Senior Notes provided the Company with a great deal of additional liquidity. See “Liquidity and Capital Resources” within this Item 7. Debt restructuring expense was $10.4 million and includes the termination expenses (approximately $8.7 million) related to unwinding certain interest rate swap agreements relating to debt repaid with the proceeds from our sale during June 2003 of $150.0 million of Senior Notes and the write off of certain capitalized debt issuance costs (approximately $1.7 million) associated with our revolving credit agreement before it was amended and restated in June 2003. During 2002, we incurred $1.3 million of expense related to the write off of certain capitalized debt issuance costs associated with a former credit agreement. The 2002 transaction was recorded as an extraordinary item in 2002 pursuant to SFAS No. 4, Reporting Gains and Losses from Extinguishment of Debt. In accordance with SFAS No. 145, which among other things rescinded SFAS No. 4, the 2002 transaction has been reclassified in our consolidated statements in pre-tax earnings as debt restructuring expense. Provision for income taxes was based on an annual effective tax rate of 39.0% for both 2003 and 2002. At December 31, 2003 and 2002, we had a federal net operating loss carryforward of approximately $67.9 million and $47.3 million, respectively, which expires if unused from 2008 to 2023. At December 31, 2003 and 2002, we had an Arizona net operating loss carryforward of approximately $10.4 million and $9.6 million, respectively, which expires if unused from 2004 to 2009. In addition, we had other net operating loss carryforward in the various states in which we operate. We believe, based on internal projections that we will generate sufficient taxable income needed to realize the corresponding federal and state deferred tax assets and implement tax planning strategies to reduce the probability of expiring net operating losses.

28
Net income in 2003 was $5.9 million, which included after tax charges of $5.2 million related to Florida litigation expense and after tax charges of $6.4 million related to debt restructuring expense. In 2002, net income was $18.2 million, which included the after tax charge of $0.8 million related to Florida litigation expense and an after tax charge of $0.8 million related to debt restructuring expense. Twelve Months Ended December 31, 2002 Compared to Twelve Months Ended December 31, 2001 Total revenues in 2002 increased $18.4 million, or 16.0%, to $133.1 million from $114.7 million in 2001. Leasing revenues in 2002 increased $16.5 million, or 16.5%, to $116.2 million from $99.7 million in 2001. This increase resulted primarily from a 17.6% increase in the average number of units on lease. In 2002, our internal growth rate was approximately 7.5% as compared to approximately 22.2% in 2001. The slowdown in our internal growth rate in 2002 was principally due to general economic weakness, particularly associated with the non-residential construction customer segment of our business and particularly in our more established markets. Our revenues from the sale of portable storage units increased $1.5 million, or 10.2%, to $16.0 million in 2002 from $14.5 million in 2001. This 10.2% increase is principally due to sales at our newer branches that were not opened during the entire 2001 year and our new branches added through acquisitions in 2002, large sales to a commercial airline that occurred in 2002, and from sales related to culling our fleet of a portion of non-core products, principally van trailers. Cost of sales increased $0.8 million, or 8.4%, to $10.3 million in 2002 from $9.5 million in 2001. Cost of sales, as a percentage of sales revenues, decreased to 64.6% in 2002 from 65.7% in 2001. This slight increase in sales margins is not significant and is partially attributable to higher margins achieved on large sales to a commercial airline in 2002, partially offset by the sales of van trailers at much lower margins than our principal products. Leasing, selling and general expenses increased $12.8 million, or 22.7%, to $69.2 million in 2002 from $56.4 million in 2001. Leasing, selling and general expenses, as a percentage of total revenues, was 52.0% and 49.2% in 2002 and 2001, respectively. These expenses as a percentage of total revenues declined at older branches, as we were able to benefit from operating leverage as those branches grew. This was offset by higher leasing, selling and general expenses as a percentage of total revenues at newer branches. In general, new branches initially have lower operating margins until their fixed operating costs are covered by higher leasing volumes that typically are not achieved until the branch has been operated for several years. We recorded approximately $1.3 million of legal expenses incurred during the year ended December 31, 2002 in connection with the litigation we were party to in Florida. EBITDA in 2002 was $52.2 million, which included the effect of $1.3 million of Florida litigation expense. In 2001, EBITDA had been $48.8 million. Depreciation and amortization expenses increased $1.2 million, or 14.8%, to $9.5 million in 2002 from $8.2 million in 2001. The increase is due to higher depreciation expense on our larger lease fleet and the higher depreciation rate associated with wood mobile offices, which were present in greater number in our fleet in 2002 than in 2001, partially offset by the lack of amortization of goodwill due to the adoption of SFAS No. 142, Goodwill and Other Intangible Assets, on January 1, 2002. Had SFAS No. 142 been effective for 2001, our depreciation and amortization expenses for 2001 would have been approximately $1.1 million lower than reported. Interest expense increased $1.6 million, or 16.3%, to $11.6 million in 2002 from $10.0 million in 2001. The increase was primarily the result of higher average debt outstanding during 2002. Our average debt outstanding increased 33.4%, primarily due to increased borrowings under our revolving credit facility to fund the growth of our lease fleet, including acquisitions. This increase in borrowings was offset by a decrease in the weighted average interest rate on our debt to 5.7% in 2002 from 6.3% in 2001 excluding amortization of debt issuance costs. Taking into account the amortization of debt issuance costs, the weighted average interest rate was 5.9% in 2002 and 6.7% in 2001.
Debt restructuring expense was $1.3 million in 2002, and was related to the write-off of certain capitalized debt issuance costs associated with our prior credit agreement. This write-off was taken in connection with our entering into a new credit agreement in February 2002. This write-off was originally presented as an extraordinary item for the year ended December 31, 2002 under SFAS No. 4, and in accordance with SFAS No. 145, has been reclassified in pre-tax earnings as debt restructuring expense for 2002.
Provision for income taxes was based on an annual effective tax rate of 39.0% for both 2002 and 2001.

29
Net income in 2002 was $18.2 million, which included after tax charges of $0.8 million related to Florida litigation expense and after tax charge of $0.8 million related to debt restructuring expense. In 2001, net income was $18.7 million. Liquidity and Capital Resources Liquidity Summary Over the last several years, Mobile Mini has financed an increasing proportion of its capital needs, most of which are for discretionary needs through working capital and funds generated from operations. Currently, we spend approximately $3.0 million per year in maintenance capital expenditures to replace forklifts and delivery trucks and trailers that must be replaced. The remainder of our capital expenditure during any year are discretionary and are used principally to acquire additional units for the lease fleet. Mobile Mini’s outside sources of liquidity include a $250.0 million senior secured revolving line of credit, and public equity offerings completed in 1999 and 2001. In addition, in June 2003, Mobile Mini issued $150.0 million of 9.5% Senior Notes and amended its $250.0 million senior secured revolving line of credit. The effect of this transaction was to increase the Company’s interest expense, but to replace floating rate debt with fixed rate debt and, through changes in covenants in our senior secured revolving line of credit made possible by the issuance of the Senior Notes to substantially increase the Company’s borrowing availability for expansion. Of the $250.0 million senior secured revolving line of credit, approximately $89.0 million (after the issuance of the Senior Notes) and $211.1 million was outstanding at December 31, 2003 and 2002, respectively. As a result of amending the $250.0 million senior secured revolving line of credit and issuing $150.0 million Senior Notes the Company’s borrowing availability was increased to approximately $76.4 million. Since 1996, Mobile Mini has focused the growth of its business on its leasing operations. Leasing is a capital intensive business that requires that we acquire assets before they generate revenues, cash flow and earnings. The assets Mobile Mini leases have very long useful lives and require relatively little recurrent maintenance expenditures. Most of the capital Mobile Mini has deployed into its leasing business has been of a discretionary nature in order to expand the company’s operations geographically, to increase the number of units available for lease at the company’s leasing locations, and to add to the mix of products the company offers. During recent years, Mobile Mini’s operations have generated cash flow that exceeds the company’s pre-tax earnings, particularly due to the deferral of income taxes due to accelerated depreciation which is used for tax accounting.
Historically, Mobile Mini has funded much of its growth through equity and debt issuances and borrowings under its revolving credit facility. Recently, as our operating cash flow has increased and our internal growth rate and rate of external expansion through acquisitions have slowed, Mobile Mini has been able to fund more of its capital expenditures from operating cash flow, and during 2003 Mobile Mini funded the bulk of its $56.5 million of capital expenditures with operating cash flow of $43.1 million. As a consequence, Mobile Mini’s borrowings under its revolving credit facility and the principal balance of its Senior Notes did not increase between June 30, 2003 and December 31, 2003, after having increased in the aggregate by $27.9 million between January 1, 2003 and June 30, 2003. Operating Activities. Our operations provided net cash flow of $43.1 million in 2003 compared to $45.4 million in 2002 and $37.8 million in 2001. The $2.3 million decrease in 2003 over 2002 in cash provided by operating activities was due primarily to increases in inventory (primarily raw materials and supplies), deposits and prepaid expenses (primarily advertising costs and lease expenses) and accrued liabilities, partially offset by reductions in accounts payable. The increase in accrued liabilities relates primarily to the Florida litigation reserve and the accrual of interest on our Senior Notes, which is paid semi-annually, in January and July. Cash provided by operating activities is enhanced by the rapid tax depreciation rate of our assets and our federal and state net operating loss carryforwards, which minimizes our tax payments at this time. At December 31, 2003 we had a federal net operating loss carryforward of approximately $67.9 million and a deferred tax liability of $47.4 million. Investing Activities. Net cash used in investing activities was $57.6 million in 2003, $93.3 million in 2002 and $101.6 million in 2001. In 2003, $1.7 million of cash was paid for acquisition of businesses compared to $30.8 million in 2002 period and $13.7 million in 2001. Capital expenditures for our lease fleet were $52.0 million for 2003, $57.0 million for 2002 and $80.7 million in 2001. Capital expenditures during 2003 primarily related to costs of new lease fleet units, which we added at our branches to meet demand, and refurbishment costs associated with bringing containers acquired in prior years up to Mobile Mini standards. During the past several years, our fleet has become more customized, enabling us to differentiate our product from our competitors’ product. Capital expenditures for property, plant and equipment were $4.5 million in 2003, $5.9 million in 2002 and $6.9 million in 2001. The

30
higher expenditures in 2002 primarily relate to expenditures at our locations acquired during 2002 where we made improvements to the yard facilities and purchased the required delivery equipment. The amount of cash that we use during any period in investing activities is almost entirely within management’s discretion. Mobile Mini has no contracts or other arrangements pursuant to which we are required to purchase a fixed or minimum amount of goods or services in connection with any portion of our business. Our maintenance capital expenditures during 2003 were approximately $3.0 million, to cover the cost to replace old forklifts, trucks and trailers that we use to move and deliver our products to our customers.
Financing Activities. Net cash provided by financing activities was $12.7 million in 2003, $49.0 million in 2002, and $62.7 million in 2001. During 2003, Mobile Mini completed an offering of $150 million of 9.5% Senior Notes due 2013 and, at the same time, amended its revolving credit facility to revise certain covenants. The net proceeds of the Senior Notes offering were used in part to unwind certain interest rate swap agreements (approximately $8.7 million) that had been entered into to hedge with floating rate indebtedness outstanding under the revolving credit facility prior to the transaction, and the remainder of the net proceeds was used to repay borrowings outstanding under the revolving credit facility. Upon the closing of the transactions, most of Mobile Mini’s outstanding debt was fixed rate debt, and the amount of unused borrowings available to Mobile Mini under the revolving credit facility increased to approximately $76.4 million. As of December 31, 2003, we had $89.0 million of borrowings outstanding under our credit facility, and approximately $84.3 million of additional borrowings were then available to us under the facility. During the third quarter of 2003, borrowings under our revolving credit facility (measured at daily close of business) averaged $89.1 million and ranged from $89.0 million to $90.8 million. During the fourth quarter of 2003, borrowings under our revolving credit facility (measured at daily close of business) averaged $90.3 million and ranged from $87.8 million to $92.1 million. We used $36.3 million less cash in financing activities during 2003 as compared to 2002, primarily as a result of our strategic decision to forego most business acquisition opportunities during 2003 in order to focus on growing our existing branch network. As of March 5, 2004, our borrowings outstanding under our credit facility were approximately $105.0 million, compared to $89.0 million at December 31, 2003. This increase is primarily due to the semi-annual interest payment on the Senior Notes in January 2004 ($7.3 million) and the payment of the Florida litigation judgment in February 2004 ($8.0 million). The interest rate under our revolving credit facility is based on our ratio of funded debt to earnings before interest expense, taxes, depreciation and amortization, debt restructuring expenses and any judgment settlement costs related to our Florida litigation. The interest rate, effective December 31, 2003, under our credit facility is the LIBOR (London Interbank Offered Rate) rate plus 2.25% or the prime rate plus 0.5%, whichever we elect, subject to certain conditions. All of our obligations under the revolving credit facility are unconditionally guaranteed by each of our subsidiaries. The revolving credit facility and the related guarantees are secured by substantially all of our assets and all assets of each guarantor, including but not limited to (i) a first-priority pledge of all of the outstanding capital stock or other ownership interest owned by us and each guarantor and (ii) first-priority security interests in all of our tangible and intangible assets and the tangible and intangible assets of each guarantor (in each case, other than certain equipment assets subject to capitalized lease obligations). As of December 31, 2003, we had no capital lease obligations. Loans under the revolving credit facility bear interest at a rate based, at our option and subject to certain conditions, on either (1) the prime rate plus a spread ranging from 0.00% (nil) to 1.00% depending on our leverage ratio, or (2) the London inter-bank offered rate, which we refer to as LIBOR, plus a spread ranging from 1.75% to 2.75% depending on our leverage ratio. Interest on outstanding borrowings is payable monthly or, which respect to LIBOR borrowings, either quarterly or on the last day of the applicable interest period (whichever is more frequent). In addition to paying interest on any outstanding principal amount, we pay an unused revolving credit facility fee to the senior lenders equal to a range of 0.30% to 0.50% per annum on the unused daily balance of the revolving credit commitment, payable monthly in arrears, based upon the actual number of days elapsed in a 360 day year. For each letter of credit we issue, we pay (i) a per annum fee equal to the margin over the LIBOR rate from time to time in effect, (ii) a fronting fee on the aggregate outstanding stated amounts of such letters of credit, plus (iii) customary administrative charges. The credit facility documentation contains covenants restricting our ability to, among others (i) declare dividends or redeem or repurchase capital stock, (ii) prepay, redeem or purchase other debt, (iii) incur liens, (iv) make loans and investments, (v) incur additional indebtedness, (vi) amend or otherwise alter debt and other material agreements, (vii) make capital expenditures, (viii) engage in mergers, acquisitions and asset sales, (ix) transact with affiliates, and (x) alter the business we conduct. We also must comply with specified financial covenants and affirmative covenants. These financial covenants set maximum values for Mobile Mini’s leverage, fixed charge coverage, capital expenditures, and minimum values for lease fleet utilization rates. The leverage or debt ratio covenant requires that our ratio of funded debt to EBITDA (as defined in our revolving credit agreement) not exceed a specified ratio, which is 5.9 to 1.0 currently and which decreases to 5.5 to 1.0 at December 31, 2005 and thereafter. EBITDA for

31
purposes of this covenant (i) includes our net income plus the amount of any non-cash extraordinary losses and debt restructuring costs arising from payments of termination costs of interest rate swaps and from write-offs of fees and expenses in connection with the initial funding under the loan and security agreement and (ii) gives pro forma effect to any permitted acquisition, in each case measured over our fiscal quarters ending on each quarterly measurement date. Our debt ratio covenant excludes all accruals and payments made by us in connection with our Florida litigation. Our fixed charge coverage ratio is 2.10 to 1.0 and is defined as the ratio of our cash flow for four quarters to the sum of interest expense for such four quarters plus the current portion of our funded debt, but the calculation excludes accruals or cash payments made in connection with our Florida litigation. Our capital expenditure covenant limits our permitted payments made in connection with the acquisition of fixed assets to $115 million per year, as adjusted by annual carry-forward amounts plus an amount equal to 300% of the net cash proceeds we receive from any issuance of our equity securities. Portable containers held for sale and inventory and equipment acquired in connection with acquisition permitted under our revolving credit agreement are excluded from the capital expenditures covenant limitation. Our lease fleet utilization covenant requires us to maintain minimum utilization ranging from 75% to 77.5%, depending upon the fiscal quarter that is the measurement period. The credit facility also contains limitations on, among other things, incurring debt, granting liens, making investments, making restricted payments, entering into transactions with affiliates and prepaying subordinated debt. Our compliance with financial covenants is measured as of the last day of each fiscal quarter. We were in compliance with all the covenants under the revolving credit facility agreement at December 31, 2003. Events of default under the revolving credit facility include, but are not limited to, (i) our failure to pay principal or interest when due, (ii) our material breach of any representations or warranty, (iii) covenant defaults, (iv) events of bankruptcy, (v) cross default to certain other debt, (vi) certain unsatisfied final judgments over a stated threshold amount, and (vii) a change of control. Prior to June 2003, we entered into interest rate swap agreements under which we effectively fixed the interest rate payable on $135.0 million of borrowings under our credit facility so that the rate is based upon a spread from fixed rates, rather than a spread from the LIBOR rate. In June 2003, in conjunction with our sale of our Senior Notes and the amendment of our credit facility, we terminated $110.0 million of these swap agreements. Accounting for these swap agreements is covered by Statement of Financial Accounting Standard (SFAS) No. 133, and pursuant to SFAS No. 133, the swap termination resulted in a charge to net income of approximately $5.3 million, net of an income tax benefit of approximately $3.4 million at June 30, 2003. At December 31, 2003, accumulated other comprehensive loss included $3.7 million, net of applicable income tax benefit of $2.4 million, related to our interest rate swap agreements. At December 31, 2003, all of our outstanding indebtedness bears interest at fixed rates (or the rate is effectively fixed due to a swap agreement), other than approximately $64.0 million of borrowings under our credit facility. During 2002, net cash provided by financing activities was primarily provided by our credit facility, which we used to expand our lease fleet and finance our branch expansion, including acquisitions of new branches during 2002. In 2001, cash provided by financing activities was primarily provided by our sale of approximately 2.2 million shares of common stock in March 2001, which resulted in net proceeds to us of approximately $47.1 million. Those proceeds were used to temporarily pay down our borrowings outstanding under our revolving line of credit. Mobile Mini believes that it has sufficient borrowings available under the facility to provide for its foreseeable capital needs over the next 12 to 36 months, with the duration dependent in large part upon the balance between the internal growth rates achieved during 2004 and subsequent periods and the expenses of entry into additional markets during the period, which will be the main determinant of how quickly the company uses its additional borrowing capacity under the revolving credit facility. Contractual Obligations and Commitments Our contractual obligations primarily consist of our outstanding balance under our secured revolving credit facility and $150.0 million of unsecured Senior Notes, together with other notes payable obligations both secured and unsecured. We also have operating lease commitments for: 1) real estate properties for the majority of our branches with remaining lease terms on our major leased properties ranging from 3 to 13 years, 2) delivery, transportation and yard equipment, typically under a five-year lease with purchase options at the end of the lease term at a stated or fair market value price; and 3) other equipment, primarily office machines. We currently do not have any obligations under purchase agreements or commitments. Historically, we enter into capitalized lease obligations from time to time to purchase delivery, transportation and yard equipment, but currently have no commitments recorded as a capital lease.

32
The table below provides a summary of our contractual commitments as of December 31, 2003. The operating lease amounts include the extended terms on real estate lease option renewals on those properties we currently anticipate we will exercise at the end of the lease term.
Payments due by period
(in thousands)
Total Less than 1
year 1-3 years 3-5 years More than 5
years
Revolving Credit Facility $ 89,000 $ — $ — $ 89,000 $ —
Senior Notes 150,000 — — — 150,000
Other Long-Term Debt 1,610 974 636 — —
Operating Leases 30,074 5,140 9,595 6,593 8,746
Capital Leases — — — — —
Total Contractual Obligations $ 270,684 $ 6,114 $ 10,231 $ 95,593 $ 158,746 Off-Balance Sheet Transactions Mobile Mini does not maintain any off-balance sheet transactions, arrangements, obligations or other relationships with unconsolidated entities or others that are reasonably likely to have a material current or future effect on Mobile Mini's financial condition, changes in financial condition, revenues or expenses, results of operations, liquidity, capital expenditures or capital resources. Seasonality Demand from some of our customers is somewhat seasonal. Demand for leases of our portable storage units by large retailers is stronger from September through December because these retailers need to store more inventory for the holiday season. Our retail customers usually return these leased units to us early in the following year. This causes lower utilization rates for our lease fleet and a marginal decrease in cash flow during the first quarter of the year. Critical Accounting Policies, Estimates and Judgments
Our significant accounting policies are disclosed in Note 1 to our consolidated financial statements. The following discussion addresses our most critical accounting policies, some of which require significant judgment.
Mobile Mini’s consolidated financial statements have been prepared in accordance with accounting principles generally accepted in the United States. The preparation of these consolidated financial statements requires us to make estimates and assumptions that affect the reported amounts of assets, liabilities, revenues and expenses during the reporting period. These estimates and assumptions are based upon our evaluation of historical results and anticipated future events, and these estimates may change as additional information becomes available. The Securities and Exchange Commission defines critical accounting policies as those that are, in management’s view, most important to our financial condition and results of operations and those that require significant judgments and estimates. Management believes that our most critical accounting policies relate to:
Revenue Recognition. Lease and leasing ancillary revenues and related expenses generated under portable storage units and office units are recognized monthly, which approximates a straight-line basis. Revenues and expenses from portable storage unit delivery and hauling are recognized when these services are billed, in accordance with SAB 101, as amended by SAB 104, as these services are considered inconsequential to the overall leasing transaction. We recognize revenues from sales of containers upon delivery.
Allowance for Doubtful Accounts. We maintain allowances for doubtful accounts for estimated losses resulting from the inability of our customers to make required payments. We establish and maintain reserves against estimated losses based upon historical loss
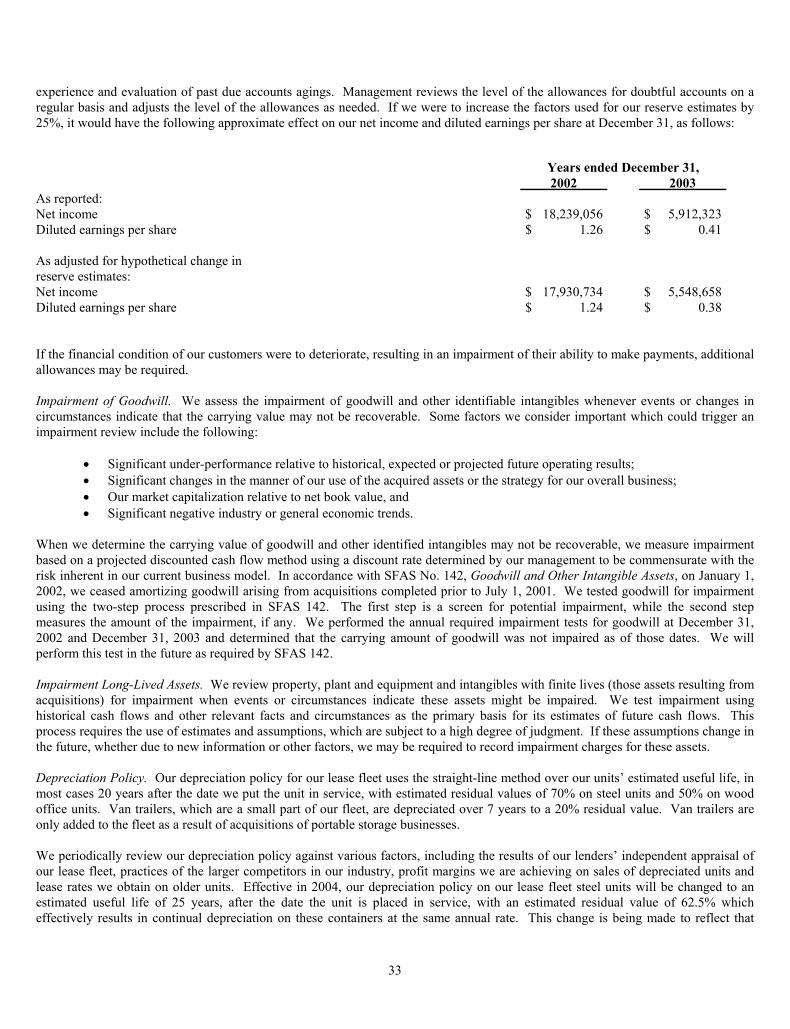
33
experience and evaluation of past due accounts agings. Management reviews the level of the allowances for doubtful accounts on a regular basis and adjusts the level of the allowances as needed. If we were to increase the factors used for our reserve estimates by 25%, it would have the following approximate effect on our net income and diluted earnings per share at December 31, as follows:
Years ended December 31, 2002 2003 As reported: Net income $ 18,239,056 $ 5,912,323 Diluted earnings per share $ 1.26 $ 0.41 As adjusted for hypothetical change in reserve estimates:
Net income $ 17,930,734 $ 5,548,658 Diluted earnings per share $ 1.24 $ 0.38 If the financial condition of our customers were to deteriorate, resulting in an impairment of their ability to make payments, additional allowances may be required. Impairment of Goodwill. We assess the impairment of goodwill and other identifiable intangibles whenever events or changes in circumstances indicate that the carrying value may not be recoverable. Some factors we consider important which could trigger an impairment review include the following:
• Significant under-performance relative to historical, expected or projected future operating results; • Significant changes in the manner of our use of the acquired assets or the strategy for our overall business; • Our market capitalization relative to net book value, and • Significant negative industry or general economic trends.
When we determine the carrying value of goodwill and other identified intangibles may not be recoverable, we measure impairment based on a projected discounted cash flow method using a discount rate determined by our management to be commensurate with the risk inherent in our current business model. In accordance with SFAS No. 142, Goodwill and Other Intangible Assets, on January 1, 2002, we ceased amortizing goodwill arising from acquisitions completed prior to July 1, 2001. We tested goodwill for impairment using the two-step process prescribed in SFAS 142. The first step is a screen for potential impairment, while the second step measures the amount of the impairment, if any. We performed the annual required impairment tests for goodwill at December 31, 2002 and December 31, 2003 and determined that the carrying amount of goodwill was not impaired as of those dates. We will perform this test in the future as required by SFAS 142. Impairment Long-Lived Assets. We review property, plant and equipment and intangibles with finite lives (those assets resulting from acquisitions) for impairment when events or circumstances indicate these assets might be impaired. We test impairment using historical cash flows and other relevant facts and circumstances as the primary basis for its estimates of future cash flows. This process requires the use of estimates and assumptions, which are subject to a high degree of judgment. If these assumptions change in the future, whether due to new information or other factors, we may be required to record impairment charges for these assets. Depreciation Policy. Our depreciation policy for our lease fleet uses the straight-line method over our units’ estimated useful life, in most cases 20 years after the date we put the unit in service, with estimated residual values of 70% on steel units and 50% on wood office units. Van trailers, which are a small part of our fleet, are depreciated over 7 years to a 20% residual value. Van trailers are only added to the fleet as a result of acquisitions of portable storage businesses. We periodically review our depreciation policy against various factors, including the results of our lenders’ independent appraisal of our lease fleet, practices of the larger competitors in our industry, profit margins we are achieving on sales of depreciated units and lease rates we obtain on older units. Effective in 2004, our depreciation policy on our lease fleet steel units will be changed to an estimated useful life of 25 years, after the date the unit is placed in service, with an estimated residual value of 62.5% which effectively results in continual depreciation on these containers at the same annual rate. This change is being made to reflect that

34
some of the units in our fleet are now more than 20 years old (measured by first date of service in our fleet) and we have not experienced any decline in these units fair rental or sales values. Any change to our depreciation policy on our steel units, from the 70% residual value and a 20-year life to a lower residual and a longer useful life, could have a positive, negative or neutral effect on our earnings, with the actual effect being determined by the change. For example, a change in our estimates used in our residual values and useful life on our steel units would have the following approximate effect on our net income and diluted earnings per share at December 31, as reflected in the table below.
Residual Useful Life In
Value Years 2002 2003 As Reported: 70% 20 Net income $ 18,239,056 $ 5,912,323 Diluted earnings per share $ 1.26 $ 0.41 As adjusted for change in estimates: 62.5% 25 Net income $ 18,239,056 $ 5,912,323 Diluted earnings per share $ 1.26 $ 0.41 As adjusted for change in estimates: 50% 20 Net income $ 16,610,123 $ 4,012,250 Diluted earnings per share $ 1.15 $ 0.28 As adjusted for change in estimates: 40% 40 Net income $ 18,239,056 $ 5,912,323 Diluted earnings per share $ 1.26 $ 0.41 As adjusted for change in estimates: 30% 25 Net income $ 16,121,444 $ 3,442,825 Diluted earnings per share $ 1.15 $ 0.28 As adjusted for change in estimates: 25% 25 Net income $ 15,795,657 $ 3,062,903 Diluted earnings per share $ 1.09 $ 0.21 Insurance Reserves. Our worker’s compensation, auto and general liability insurance is purchased under large deductible programs. Our current per incident deductibles are: worker’s compensation $250,000, auto $100,000 and general liability $100,000. We expense the deductible portion of the individual claims. However, we generally do not know the full amount of our exposure to a deductible in connection with any particular claim during the fiscal period in which the claim is incurred and for which we must make an accrual for the deductible expense. We make these accruals based on a combination of the claims review by our staff and our insurance companies, and, at year end, the accrual is reviewed and adjusted, in part, based on an independent actuarial review of historical loss data and using certain actuarial assumptions followed in the insurance industry. A high degree of judgment is required in developing these estimates of amounts to be accrued, as well as in connection with the underlying assumptions. In addition, our assumptions will change as our loss experience is developed. All of these factors have the potential for significantly impacting the amounts we have previously reserved in respect of anticipated deductible expenses, and we may be required in the future to increase or decrease amounts previously accrued. Contingencies. We are a party to various claims and litigation in the normal course of business. Management's current estimated range of liability related to various claims and pending litigation is based on claims for which our management can determine that it is probable (as that term is defined in SFAS 5) that a liability has been incurred and the amount of loss can be reasonably estimated. Because of the uncertainties related to both the probability of incurred and possible range of loss on pending claims and litigation, management must use considerable judgment in making reasonable determination of the liability that could result from an unfavorable outcome. As additional information becomes available, we will assess the potential liability related to our pending litigation and revise our estimates. Such revisions in our estimates of the potential liability could materially impact our results of operation. We do

35
not anticipate the resolution of such matters known at this time will have a material adverse effect on our business or consolidated financial position. Recent Accounting Pronouncements SFAS No. 145, Rescission of FASB Statements No. 4, 44, and 64, Amendment of FASB Statement No. 13, and Technical Corrections, was issued in April 2002, and became effective for fiscal years beginning after May 15, 2002. SFAS No. 4 and No. 64 related to reporting gains or losses from debt extinguishment. Under the prior guidance, if material gains or losses were recognized from debt extinguishment, the amount was not included in income from operations, but was shown as an extraordinary item, net of related income tax cost or benefit, as the case may be. Under the new guidance, all gains or losses from debt extinguishment are subject to criteria prescribed under Accounting Principals Board (APB) Opinion No. 30, Reporting the Results of Operations – Reporting the Effects of Disposal of a Segment of a Business, and Extraordinary, Unusual and Infrequently Occurring Events and Transactions, in determining an extraordinary item classification. The adoption of SFAS No. 145 required us to reclassify certain items for the period presented in 2002, to conform to the presentation required by SFAS No. 145 and, effective January 1, 2003, we reported losses on the extinguishment of debt in pre-tax earnings rather than in extraordinary items. SFAS No. 44 is not applicable to our operations. SFAS No. 13 was amended to require certain lease modifications with similar economic effects to be accounted for the same way as a sale-leaseback. We adopted this statement on January 1, 2003. This adoption did not have any impact on our results of operations or financial position. SFAS No. 146, Accounting for Costs Associated with Exit or Disposal Activities, was issued in June 2002. This statement is effective for any disposal or exit of business activities started after December 31, 2002. SFAS No. 146 nullified Emerging Issues Task Force (EITF) 94-3, which required that once a plan of disposal was put in motion, a liability for the estimated costs needed to be recorded. SFAS No. 146 states that a liability should not be recorded until the liability is incurred. This statement does not affect any liabilities established related to exiting an operation with duplicate facilities when acquired in a business combination. We adopted this accounting statement effective January 1, 2003. This adoption did not have any material effect on our results of operations or financial position. SFAS No. 148, Accounting for Stock-Based Compensation – Transition and Disclosure, was issued and becomes effective for fiscal years beginning after December 15, 2002. SFAS No. 148 amends SFAS No. 123, Accounting for Stock-Based Compensation, to provide alternative methods of transition to SFAS No. 123’s fair value method of accounting for stock-based employee compensation. This statement also amends the disclosure provisions of SFAS No. 123 and APB Opinion No. 28, Interim Financial Reporting, to require disclosure about the effects on reported net income and earnings per share of an entity’s accounting policy with respect to stock-based employer compensation in annual and interim financial statements. The disclosure provisions of SFAS No. 148 are applicable to all companies with stock-based compensation, regardless if they account for that compensation using the fair value method of SFAS No. 123 or the intrinsic value method of APB Opinion No. 25. We have elected to continue the accounting method prescribed by APB Opinion No. 25 and have adopted the disclosure requirements of SFAS No. 148 as of December 31, 2003.
Financial Accounting Standards Board, (FASB), Interpretation No. 46, Consolidation of Variable Interest Entities, (FIN 46) was issued in January 2003 and addresses consolidation by business enterprises of variable interest entities. FIN 46 clarifies existing accounting for whether interest entities, as defined in FIN 46, should be consolidated in financial statements based upon the investee’s ability to finance activities without additional financial support and whether investors possess characteristics of a controlling financial interest. FIN 46 applies immediately to variable interest entities created after January 31, 2003, and to variable interest entities in which an enterprise obtains an interest after that date. It applies in the first fiscal year or interim period beginning after June 15, 2003, to variable interest entities in which an enterprise holds a variable interest that it acquired before February 1, 2003. The Company does not have any variable interest entities and therefore this adoption did not have any effect on our results of operations or financial position. SFAS No. 149, Amendment of SFAS 133 on Derivative Instruments and Hedging Activities, was issued in April 2003 which amends and clarifies financial accounting and reporting for derivative instruments, including certain derivative instruments embedded in other contracts and for hedging activities under SFAS No. 133, Accounting for Derivative Instruments and Hedging Activities. SFAS No. 149 is effective for contracts entered into or modified after June 30, 2003 and hedging relationships designated after June 30, 2003. Our adoption of SFAS No. 149 on July 1, 2003 did not have a material effect on our financial condition or results of operations. In May 2003, SFAS No. 150, Accounting for Certain Financial Instruments with Characteristics of both Liabilities and Equity, was issued. SFAS No. 150 establishes standards for how an issuer classifies and measures certain financial instruments with characteristics of both liabilities and equity, and is effective for financial instruments entered into or modified after May 31, 2003 and

36
otherwise is effective July 1, 2003. The Company adopted the standard of July 1, 2003 and this adoption of SFAS No. 150 did not have a material impact on its financial condition or results of operations. ITEM 7A. QUANTITATIVE AND QUALITATIVE DISCLOSURES ABOUT MARKET RISK Interest Rate Swap Agreement. We seek to reduce earnings and cash flow volatility associated with changes in interest rates through a financial arrangement intended to provide a hedge against a portion of the risks associated with such volatility. We continue to have exposure to such risks to the extent they are not hedged. Interest rate swap agreements are the only instruments we use to manage interest rate fluctuations affecting our variable rate debt. At December 31, 2003, we had one interest rate swap agreement under which we pay a fixed rate and receive a variable interest rate on $25.0 million of debt. At December 31, 2003, in accordance with SFAS No. 133, comprehensive income included $3.7 million, net of income tax expense of $2.4 million, related to the fair value of our interest rate swap agreements, relating primarily to the unwinding of most of our interest rate swap agreements. The following table sets forth the scheduled maturities and the total fair value of our debt portfolio:
At December 31, Total at (in thousands, except percentages) December
31, 2004 2005 2006 2007 2008 Thereafter 2003 Liabilities: Fixed Rate $ 974 $ 542 $ 94 $ — $ — $ 150,000 $ 151,610 Average interest rate 9.44%
Floating rate $ — $ — $ — $ — $ 64,000 $ — $ 64,000 Average interest rate 3.44%
Fixed Rate Swap: Variable to fixed $ — $ — $ $ — $ 25,000 $ — $ 25,000 Average pay rate 3.7% Average receive rate 1 month
LIBOR-BBA
Operating leases $ 5,140 $ 5,089 $ 4,506 $ 3,863 $ 2,730 $ 8,745 $ 30,074 We enter into derivative financial arrangements only to the extent that the arrangement meets the objectives described above, and we do not engage in such transactions for speculative purposes. Impact of Foreign Currency Rate Changes. We currently have branch operations in Toronto, Canada, and we invoice those customers primarily in the local currency, the Canadian Dollar, under the terms of our lease agreements with those customers. We are exposed to foreign exchange rate fluctuations as the financial results of our Canadian branch operation are translated into U.S. dollars. The impact of foreign currency rate changes have historically been insignificant.
Cautionary Factors That May Affect Future Results Our disclosure and analysis in this report contains forward-looking information about our Company’s financial results and estimates and our business prospects that involve substantial risks and uncertainties. From time to time, we also may provide oral or written forward-looking statements in other materials we release to the public. Forward-looking statements are expressions of our current expectations or forecasts of future events. You can identify these statements by the fact that they do not relate strictly to historic or current facts. They include words such as “anticipate,” “estimate,” “expect,” “project,” “intend,” “plan,” “believe,” “will,” and other words and terms of similar meaning in connection with any discussion of future operating or financial performance. In particular, these include statements relating to future actions, future performance or results, expenses, the outcome of contingencies, such as legal proceedings, and financial results. Among the factors that could cause actual results to differ materially are the following:

37
• our ability to manage our planned growth, both internally and at new branches • competitive developments affecting our industry, including pricing pressures in newer markets • economic slowdown that affects any significant portion of our customer base, including economic slowdown in areas of
limited geographic scope if markets in which we have significant operations are impacted by such slowdown • the timing and number of new branches that we open or acquire • changes in the supply and price of used ocean-going containers • changes in the supply and cost of the raw materials we use in manufacturing storage units • legal defense costs, insurance expenses, settlement costs and the risk of an adverse decision or settlement related legal
proceedings • our ability to protect our patents and other intellectual property • interest rate fluctuations • governmental laws and regulations affecting domestic and foreign operations, including tax obligations • changes in generally accepted accounting principles • any changes in business, political and economic conditions due to the threat of future terrorist activity in the U.S. and other
parts of the world, and related U.S. military action overseas • growth in costs and expenses
We cannot guarantee any forward-looking statement will be realized, although we believe we have been prudent in our plans and assumptions. Achievement of future results is subject to risks, uncertainties and inaccurate assumptions. Should known or unknown risks or uncertainties materialize, or should underlying assumptions prove inaccurate, actual results could vary materially from past results and those anticipated, estimated or projected. Investors should bear this in mind as they consider forward-looking statements. We undertake no obligation to publicly update forward-looking statements, whether as a result of new information, future events or otherwise. You are advised, however, to consult any further disclosures we make on related subjects in our Form 10-Q, 8-K and 10-K reports to the Securities and Exchange Commission. Our Form 10-K lists and discusses (in “Item1. Business”) various important factors that could cause actual results to differ materially from expected and historic results. We note these factors for investors as permitted by the Private Securities Litigation Reform Act of 1995. Readers can find them in Item 1 of this report under the heading “Cautionary Factors That May Affect Future Operating Results.” You should understand that it is not possible to predict or identify all such factors. Consequently, you should not consider any such list to be a complete set of all potential risks or uncertainties. You may obtain a copy of our Form 10-K by requesting it from the Company’s Investor Relations Department at (480) 894-6311 or by mail to Mobile Mini, Inc., 7420 S. Kyrene Rd., Suite 101, Tempe, Arizona 85283. Our filings with the SEC, including the Form 10-K, may be accessed through Mobile Mini’s web site at www.mobilemini.com and at the SEC’s web site at http://www.sec.gov. Material on our web site is not incorporated in this report, except by express incorporation by reference herein.

F-1
ITEM 8. FINANCIAL STATEMENTS AND SUPPLEMENTARY DATA.
INDEX TO CONSOLIDATED FINANCIAL STATEMENTS AND SCHEDULE Report of Ernst & Young LLP, Independent Auditors
F-2
Report of Independent Public Accountants
F-3
Consolidated Balance Sheets – December 31, 2002 and 2003
F-4
Consolidated Statements of Income – For the Years Ended December 31, 2001, 2002 and 2003
F-5
Consolidated Statements of Stockholders’ Equity – For the Years Ended December 31, 2001, 2002 and 2003
F-6
Consolidated Statements of Cash Flows – For the Years Ended December 31, 2001, 2002 and 2003
F-7
Notes to Consolidated Financial Statements – December 31, 2002 and 2003
F-8

F-2
Report of Ernst & Young LLP, Independent Auditors Board of Directors and Shareholders Mobile Mini, Inc. We have audited the accompanying consolidated balance sheets of Mobile Mini, Inc. and subsidiaries as of December 31, 2002 and 2003, and the related consolidated statements of income, stockholders’ equity and cash flows for the years then ended. Our audit also included the financial statement schedule listed in Item 15(a)(2). These consolidated financial statements and schedule are the responsibility of the Company’s management. Our responsibility is to express an opinion on these consolidated financial statements and schedule based on our audits. The consolidated financial statements for the year ended December 31, 2001 were audited by other auditors who have ceased operations and whose report dated February 11, 2002 expressed an unqualified opinion on those statements before the revision to include the transitional disclosures included in Note 1. We conducted our audits in accordance with auditing standards generally accepted in the United States. Those standards require that we plan and perform the audit to obtain reasonable assurance about whether the financial statements are free of material misstatement. An audit includes examining, on a test basis, evidence supporting the amounts and disclosures in the financial statements. An audit also includes assessing the accounting principles used and significant estimates made by management, as well as evaluating the overall financial statement presentation. We believe that our audits provide a reasonable basis for our opinion. In our opinion, the financial statements referred to above present fairly, in all material respects, the consolidated financial position of Mobile Mini, Inc. and subsidiaries at December 31, 2002 and 2003 and the consolidated results of their operations and their cash flows for the years then ended, in conformity with accounting principles generally accepted in the United States. Also, in our opinion, the related 2003 financial statement schedule, when considered in relation to the basic consolidated financial statements taken as a whole, presents fairly in all material respects the information set forth therein. As discussed in Note 1 to the consolidated financial statements, effective January 1, 2002, the Company adopted Statement of Financial Accounting Standards No. 142, “Goodwill and Other Intangible Assets” and Statement of Financial Accounting Standards No. 144, “Accounting for the Impairment or Disposal of Long-Lived Assets.” As discussed above, the consolidated financial statements of Mobile Mini, Inc. for the year ended December 31, 2001 were audited by other auditors who have ceased operations. As described in Note 1, these consolidated financial statements have been revised to include the transitional disclosures required by Statement of Financial Accounting Standards No. 142, “Goodwill and Other Intangible Assets,” which was adopted by the Company as of January 1, 2002. Our audit procedures with respect to the disclosures in Note 1 with respect to 2001 included (a) agreeing the previously reported net income to the previously issued consolidated financial statements and the adjustments to reported net income representing amortization expense (including any related tax effects) recognized in those periods related to goodwill, to the Company’s underlying records obtained from management, and (b) testing the mathematical accuracy of the reconciliation of adjusted net income to reported income before extraordinary item. In our opinion, the disclosures for 2001 in Note 1 are appropriate. However, we were not engaged to audit, review, or apply any procedures to the 2001 consolidated financial statements of Mobile Mini, Inc. other than with respect to such disclosures and, accordingly, we do not express an opinion or any other form of assurance on Mobile Mini, Inc.’s 2001 consolidated financial statements taken as a whole. /s/ Ernst & Young LLP Phoenix, Arizona February 20, 2004

F-3
REPORT OF INDEPENDENT PUBLIC ACCOUNTANTS To Mobile Mini, Inc.:
We have audited the accompanying consolidated balance sheets of MOBILE MINI, INC. (a Delaware corporation) and subsidiaries as of December 31, 2000 and 2001, and the related consolidated statements of operations, stockholders’ equity and cash flows for each of the three years in the period ended December 31, 2001. These financial statements are the responsibility of the Company’s management. Our responsibility is to express an opinion on these financial statements based on our audits.
We conducted our audits in accordance with auditing standards generally accepted in the United States. Those standards require that we plan and perform the audit to obtain reasonable assurance about whether the financial statements are free of material misstatement. An audit includes examining, on a test basis, evidence supporting the amounts and disclosures in the financial statements. An audit also includes assessing the accounting principles used and significant estimates made by management, as well as evaluating the overall financial statement presentation. We believe that our audits provide a reasonable basis for our opinion.
In our opinion, the financial statements referred to above present fairly, in all material respects, the financial position of Mobile Mini, Inc. and subsidiaries as of December 31, 2000 and 2001, and the results of their operations and their cash flows for each of the three years in the period ended December 31, 2001, in conformity with accounting principles generally accepted in the United States.
Our audits were made for the purpose of forming an opinion on the basic financial statements taken as a while. The schedule listed in the Index to Consolidated Financial Statements is presented for purposes of complying with the Securities and Exchange Commission’s rules and is not a required part of the basic financial statements. This schedule has been subjected to the auditing procedures applied in the audits of the basic financial statements and, in our opinion, fairly states in all material respects the financial data required to be set forth therein in relation to the basic financial statements taken as a whole.
ARTHUR ANDERSEN LLP Phoenix, Arizona February 11, 2002 This is a copy of the independent public accountants report previously issued by Arthur Andersen LLP in connection with Mobile Mini, Inc.’s annual report to shareholders for the fiscal year ended December 31, 2001. This report has not been reissued by Arthur Andersen LLP in connection with this annual report to shareholders. The consolidated balance sheets as of December 31, 2000 and 2001 and the results of operations, stockholders’ equity and cash flows for periods prior to December 31, 2000 referred to in this report have not been included in the accompanying financial statements.

See accompanying notes.
F-4
MOBILE MINI, INC.
CONSOLIDATED BALANCE SHEETS
December 31, 2002 2003
ASSETS Cash $ 1,635,468 $ 97,323 Receivables, net of allowance for doubtful accounts of $2,131,000 and $2,102,000, respectively 16,234,002 15,907,342 Inventories 13,278,391 15,058,918 Lease fleet, net of accumulated depreciation of $16,268,000 and $22,892,000, respectively 337,084,303 382,753,903 Property, plant and equipment, net 34,102,709 34,506,768 Deposits and prepaid expenses 3,776,137 7,165,735 Other assets and intangibles, net 3,021,951 7,082,890 Goodwill 51,757,416 52,506,979 Total assets $ 460,890,377 $ 515,079,858
LIABILITIES AND STOCKHOLDERS’ EQUITY
Liabilities: Accounts payable $ 8,765,790 $ 7,178,725 Accrued liabilities 18,913,869 30,640,865 Line of credit 211,098,078 89,000,000 Notes payable 2,043,761 1,610,158 Obligations under capital leases 79,735 ⎯ Senior Notes ⎯ 150,000,000 Deferred income taxes 41,319,655 47,357,603 Total liabilities 282,220,888 325,787,351
Commitments and contingencies
Stockholders’ equity: Common stock; $0.01 par value, 95,000,000 shares authorized, 14,292,714 and 14,352,703 issued and outstanding at December 31, 2002 and December 31, 2003, respectively
142,928
143,528
Additional paid-in capital 116,117,301 116,956,025 Retained earnings 66,382,847 72,295,170 Accumulated other comprehensive loss (3,973,587) (102,216) Total stockholders’ equity 178,669,489 189,292,507 Total liabilities and stockholders’ equity $ 460,890,377 $ 515,079,858

See accompanying notes.
F-5
MOBILE MINI, INC.
CONSOLIDATED STATEMENTS OF INCOME
For the years ended December 31, 2001 2002 2003 Revenues:
Leasing $ 99,683,720 $116,168,681 $128,482,012 Sales 14,519,329 16,007,517 17,248,507 Other 520,265 920,331 837,977
Total revenues 114,723,314 133,096,529 146,568,496 Costs and expenses:
Cost of sales 9,545,897 10,343,451 11,487,167 Leasing, selling and general expenses 56,387,555 69,202,472 79,071,265 Florida litigation expense — 1,320,054 8,501,679 Depreciation and amortization 8,237,173 9,456,896 11,078,548
Total costs and expenses 74,170,625 90,322,873 110,138,659 Income from operations 40,552,689 42,773,656 36,429,837 Other income (expense):
Interest income 34,456 13,000 2,013 Interest expense (9,959,133) (11,586,923) (16,299,172)Debt restructuring expense — (1,299,641) (10,440,346)
Income before provision for income taxes 30,628,012 29,900,092 9,692,332 Provision for income taxes 11,944,925 11,661,036 3,780,009 Net income $ 18,683,087 $ 18,239,056 $ 5,912,323
Earnings per share: Basic $ 1.38 $ 1.28 $ 0.41 Diluted $ 1.34 $ 1.26 $ 0.41
Weighted average number of common and common share equivalents outstanding:
Basic 13,514,541 14,254,468 14,312,467 Diluted 13,954,086 14,442,066 14,462,479

See accompanying notes.
F-6
MOBILE MINI, INC.
CONSOLIDATED STATEMENTS OF STOCKHOLDERS’ EQUITY For the years ended December 31, 2001, 2002 and 2003
Shares of Common
Stock
CommonStock
Additional
Paid-in Capital
Retained Earnings
AccumulatedOther
Comprehensive Loss
Stockholders’Equity
Balance, December 31, 2000 11,591,584 $115,917 $ 62,854,726 $ 29,460,704 $ — $ 92,431,347
Net income — — — 18,683,087 — 18,683,087 Market value change in derivatives, (net of income tax benefit of $1,289,735) — — — — (2,017,278) (2,017,278) Comprehensive income — — — — — 16,665,809 Issuance of common stock 2,239,713 22,395 47,125,069 — — 47,147,464 Exercise of stock options, (including income tax benefit of $2,179,602)
329,750
3,298
5,064,062
—
—
5,067,360
Exercise of warrants 62,910 629 313,921 — — 314,550 Stock option compensation — — 76,255 — — 76,255
Balance, December 31, 2001 14,223,957 142,239 115,434,033 48,143,791 (2,017,278) 161,702,785 Net income — — — 18,239,056 — 18,239,056 Unrealized gain on short-term investments, (net of income tax expense of $22,272)
—
—
—
—
34,835
34,835
Market value change in derivatives, (net of income tax benefit of $1,273,361)
—
—
—
—
(1,991,668)
(1,991,668)
Foreign currency translation, (net of income tax expense of $335)
—
—
—
—
524
524
Comprehensive income — — — — — 16,282,747 Exercise of stock options, (including income tax benefit of $129,200)
24,750
249
387,418
—
—
387,667
Exercise of warrants 44,007 440 219,595 — — 220,035 Stock option compensation — — 76,255 — — 76,255
Balance, December 31, 2002 14,292,714 142,928 116,117,301 66,382,847 (3,973,587) 178,669,489 Net income ⎯ ⎯ ⎯ 5,912,323 ⎯ 5,912,323 Unrealized gain on short-term investments, (net of income tax expense of $22,272)
⎯
⎯
⎯
⎯
(34,835)
(34,835)
Market value change in derivatives, (net of income tax expense of $23,679)
⎯
⎯
⎯
⎯
36,990
36,990
Realized loss on termination of derivatives, (net of income tax expense of $2,352,266)
⎯
⎯
⎯
⎯
3,679,186
3,679,186
Foreign currency translation, (net of income tax expense of $121,495)
⎯
⎯
⎯
⎯
190,030
190,030
Comprehensive income ⎯ ⎯ ⎯ ⎯ ⎯ 9,783,694 Exercise of stock options, (including income tax benefit of $159,408)
59,989
600
838,724
⎯
⎯
839,324
Balance, December 31, 2003 14,352,703 $143,528 $ 116,956,025 $ 72,295,170 $ (102,216) $189,292,507

See accompanying notes.
F-7
MOBILE MINI, INC.
CONSOLIDATED STATEMENTS OF CASH FLOWS For the years ended December 31, 2001 2002 2003 Cash Flows From Operating Activities: Net income $ 18,683,087 $ 18,239,056 $ 5,912,323 Adjustments to reconcile income to net cash provided by operating activities:
Debt restructuring expense — 1,299,641 10,440,346 Provision for doubtful accounts 2,286,095 2,021,797 2,359,830 Amortization of deferred financing costs 599,825 440,491 591,290 Amortization of stock option compensation 76,255 76,255 — Depreciation and amortization 8,237,173 9,456,896 11,078,548 Loss on disposal of property, plant and equipment 5,392 47,111 44,431 Gain on sale of short-term investments — — (59,185) Deferred income taxes 11,944,070 11,542,981 3,843,713 Changes in certain assets and liabilities, net of effect of businesses acquired:
Receivables (6,018,107) (2,507,763) (2,033,170) Inventories (1,461,360) 2,334,400 (1,780,527) Deposits and prepaid expenses 879,158 274,731 (3,389,598) Other assets and intangibles (57,120) (240,302) (92,588) Accounts payable 469,687 937,355 (1,587,066) Accrued liabilities 2,205,480 1,500,619 17,819,087
Net cash provided by operating activities 37,849,635 45,423,268 43,147,434 Cash Flows From Investing Activities: Cash paid for businesses acquired (13,697,571) (30,833,173) (1,672,920) Net purchases of lease fleet (80,675,559) (57,037,912) (51,996,286) Net purchases of property, plant and equipment (6,854,749) (5,855,109) (4,482,969) Net proceeds on sale of short-term investment — — 122,912 Change in other assets (390,293) 425,282 423,605
Net cash used in investing activities (101,618,172) (93,300,912) (57,605,658) Cash Flows From Financing Activities: Net borrowings (repayments) under lines of credit 15,001,900 57,396,178 (130,866,078) Proceeds from issuance of notes payable 400,822 2,757,285 767,844 Proceeds from issuance of Senior Notes — — 150,000,000 Deferred financing costs (4,500) (2,202,993) (6,570,452) Principal payments on notes payable (2,916,939) (9,388,128) (1,201,447) Principal payments on capital lease obligations (85,064) (34,236) (79,735) Exercise of warrants 314,550 220,035 — Issuance of common stock, net of share cost 50,035,222 258,467 679,916
Net cash provided by financing activities 62,745,991 49,006,608 12,730,048 Effect of exchange rate changes on cash — 524 190,031 Net (decrease) increase in cash (1,022,546) 1,129,488 (1,538,145) Cash at beginning of year 1,528,526 505,980 1,635,468 Cash at end of year $ 505,980 $ 1,635,468 $ 97,323
Supplemental Disclosure of Cash Flow Information: Cash paid during the year for interest $ 9,532,467 $ 11,257,813 $ 8,840,671 Cash paid during the year for income taxes $ 254,810 $ 447,937 $ 297,952 Interest rate swap liability charged (credited) to equity $ 2,017,278 $ 1,991,668 $ (3,716,176)

F-8
MOBILE MINI, INC.
NOTES TO CONSOLIDATED FINANCIAL STATEMENTS
(1) Mobile Mini, its Operations and Summary of Significant Accounting Policies: Organization and Special Considerations Mobile Mini, Inc., a Delaware corporation (Mobile Mini or the Company), is a leading provider of portable storage solutions. At December 31, 2003, we have a fleet of portable storage units and offices and operated throughout the United States and one Canadian province. Our portable storage products offer secure, temporary storage with immediate access. We have a diversified client base, including large and small retailers, construction companies, medical centers, schools, utilities, distributors, the United States military, hotels, restaurants, entertainment complexes and households. Customers use our products for a wide variety of applications, including the storage of retail and manufacturing inventory, construction materials and equipment, documents and records and other goods. We have experienced rapid growth during the last several years. This growth is primarily related to our internal growth at existing branch locations, as well as some growth through acquisitions of new branches. Our ability to obtain used containers for our lease fleet is subject in large part to the availability of these containers in the market. This is in part subject to international trade issues and the demand for containers in the ocean cargo shipping business. Should there be a shortage in supply of used containers, we could supplement our lease fleet with new portable storage units that we manufacture. However, should there be an overabundance of these used containers available, container prices may fall. This could result in a reduction in the lease rates we can obtain from our portable storage unit leasing operations. In addition, under our revolving credit facility, we are required to comply with certain covenants and restrictions, as more fully discussed in Note 3. If we fail to comply with these covenants and restrictions, the lender has the right to refuse to lend additional funds and may require early payment of amounts owed. If this happens, it would materially impact our growth and ability to fund ongoing operations. Furthermore, because a substantial portion of the amount borrowed under the credit facility bears interest at a variable rate, a significant increase in interest rates could have an adverse affect on our consolidated results of operations and financial condition. Principles of Consolidation The consolidated financial statements include the accounts of Mobile Mini, Inc. and its wholly owned subsidiaries. All significant intercompany transactions have been eliminated. Reclassifications Certain prior period amounts in the accompanying consolidated financial statements have been reclassified to conform to the current financial presentation requirements. Revenue Recognition In December 2003, the Securities and Exchange Commission (SEC) issued staff accounting bulletin No. 104 (SAB 104) Revenue Recognition, which codifies, revises and rescinds certain sections of Staff Accounting Bulletin No. 101 Revenue Recognition, in order to make this interpretive guidance consistent with current authoritative accounting guidance and SEC rules and regulations. The changes noted in SAB 104 did not have a material effect on our consolidated financial statements. Mobile Mini follows SAB 101, Revenue Recognition in Financial Statements, as amended by SAB 104, for the recognition of revenue. Lease and leasing ancillary revenues and related expenses generated under portable storage units and office units are recognized monthly which approximates a straight-line basis. Revenues and expenses from portable storage unit delivery and hauling are recognized when these services are billed, in accordance with SAB 101, as amended, as these services are considered inconsequential to the overall leasing transaction. Mobile Mini recognizes revenues from sales of containers upon delivery.

NOTES TO CONSOLIDATED FINANCIAL STATEMENTS – (continued)
F-9
Cost of Sales Cost of sales in our consolidated statements of operations includes only the costs for units we sell. Similar costs associated with the portable storage units that we lease are capitalized on our balance sheet under “Lease fleet”. Advertising Costs Advertising costs are accounted for under Statement of Position, (SOP) 93-7, Reporting on Advertising Costs. All non direct-response advertising costs are expensed as incurred. Direct response advertising costs, principally Yellow Page advertising, are capitalized when paid and amortized over the period in which the benefit is derived. At December 31, 2002 and 2003, prepaid advertising costs were approximately $0.6 million and $2.8 million, respectively. The amortization period of the prepaid balance never exceeds 12 months. Our direct-response advertising costs are monitored by each branch through call logs and advertising source codes in a contact management information system. Advertising expense was $5.2 million, $6.2 million and $6.9 million in 2001, 2002 and 2003, respectively. Cash Our revolving credit agreement includes restrictions on excess cash. At December 31, 2002 the Company had restricted cash of approximately $257,000 on deposit in connection with the Florida litigation action. There was no restricted cash at December 31, 2003. Short-Term Investments Mobile Mini accounts for short-term investments in accordance with Statement of Financial Accounting Standard (SFAS) No. 115, Accounting for Certain Investments in Debt and Equity Securities. Our investments in 2002 consisted principally of equity securities and were classified as available for sale and were recorded at fair value, which approximates cost. We had no short-term investments at December 31, 2003. Receivables Receivables primarily consist of amounts due from customers from the lease or sale of containers. Mobile Mini records an estimated provision for bad debts and reviews the provision monthly for adequacy. Specific accounts are written off against the allowance when management determines the account is uncollectible. We require a security deposit on most leased office units to cover the cost of damages or unpaid balances, if any. Concentration of Credit Risk Financial instruments which potentially expose Mobile Mini to concentrations of credit risk, as defined by SFAS No. 105, Disclosure of Information about Financial Instruments with Off-Balance-Sheet Risk and Financial Instruments with Concentrations of Credit Risk, consist primarily of receivables. Concentration of credit risk with respect to receivables are limited due to the large number of customers spread over a large geographic area in many industry segments. Receivables related to our sales operations are generally secured by the product sold to the customer. Receivables related to our leasing operations are primarily small month-to-month amounts. We have the right to repossess leased portable storage units, including any customer goods contained in the unit, following non-payment of rent.

NOTES TO CONSOLIDATED FINANCIAL STATEMENTS – (continued)
F-10
Inventories Inventories are stated at the lower of cost or market, with cost being determined under the specific identification method. Market is the lower of replacement cost or net realizable value. Raw material inventory balances include raw steel, paint and other assembly components. Inventories at December 31, consist of the following:
2002 2003 Raw materials and supplies $10,778,502 $12,634,192 Work-in-process 474,871 758,603 Finished portable storage units 2,025,018 1,666,123 $13,278,391 $15,058,918
Property, Plant and Equipment Property, plant and equipment are stated at cost, net of accumulated depreciation. Depreciation is provided using the straight-line method over the assets’ estimated useful lives. Residual values are determined when the property is constructed or acquired and range up to 25%, depending on the nature of the asset. In the opinion of management, estimated residual values do not cause carrying values to exceed net realizable value. Normal repairs and maintenance to property, plant and equipment are expensed as incurred. When property or equipment is retired or sold, the net book value of the asset, reduced by any proceeds, is charged to gain or loss on the retirement of fixed assets. Property, plant and equipment at December 31, consist of the following:
Estimated Useful Life In Years 2002 2003 Land $ 777,668 $ 772,014 Vehicles and machinery 5 to 20 34,979,234 37,842,400 Buildings and improvements (1) 30 9,454,392 9,697,128 Office fixtures and equipment 5 6,562,040 7,532,319 51,773,334 55,843,861 Less accumulated depreciation (17,670,625) (21,337,093) $ 34,102,709 $ 34,506,768
(1) Improvements made to leased properties are depreciated over the remaining term of the respective lease. Income Taxes The Company utilizes the liability method of accounting for income taxes as set forth in SFAS No. 109, Accounting for Income Taxes. Under the liability method, deferred taxes are determined based on the difference between the financial statement and tax basis of assets and liabilities using enacted tax rates in effect in the years in which the differences are expected to reverse. Valuation allowances are established, when necessary, to reduce deferred tax assets to the amount expected to be realized. Income tax expense includes both taxes payable for the period and the change during the period in deferred tax assets and liabilities. Earnings Per Share Mobile Mini has adopted SFAS No. 128, Earnings per Share. Pursuant to SFAS No. 128, basic earnings per common share are computed by dividing net income by the weighted average number of shares of common stock outstanding during the year. Diluted earnings per common share are determined assuming the potential dilution of the exercise or conversion of options and warrants into common stock.

NOTES TO CONSOLIDATED FINANCIAL STATEMENTS – (continued)
F-11
Below are the required disclosures pursuant to SFAS No. 128 for the years ended December 31:
Year Ended December 31, 2001 2002 2003 BASIC: Common shares outstanding, beginning of year 11,591,584 14,223,957 14,292,714Effect of weighting shares: Weighted common shares issued 1,922,957 30,511 19,753Weighted average number of common shares outstanding 13,514,541 14,254,468 14,312,467Net income $ 18,683,087 $ 18,239,056 $ 5,912,323Earnings per share $ 1.38 $ 1.28 $ 0.41
DILUTED: Common shares outstanding, beginning of year 11,591,584 14,223,957 14,292,714Effect of weighting shares: Weighted common shares issued 1,922,957 30,511 19,753 Employee stock options and warrants assumed converted 439,545 187,598 150,012Weighted average number of common and common equivalent shares outstanding
13,954,086
14,442,066
14,462,479
Net income $ 18,683,087 $ 18,239,056 $ 5,912,323Earnings per share $ 1.34 $ 1.26 $ 0.41
Employee stock options to purchase 496,850, 518,550 and 1,332,920 shares were issued or outstanding during 2001, 2002 and 2003, respectively, but were not included in the computation of diluted earnings per share because the exercise price exceeded the average market price for that year and the effect would have been anti-dilutive. The anti-dilutive options could potentially dilute future earnings per share. Long-Lived Assets In accordance with SFAS No. 144, “Accounting for the Impairment of Long-Lived Assets and for Long-Lived Assets to Be Disposed Of,” the Company reviews long-lived assets for impairment whenever events or changes in circumstances indicate the carrying amount of such assets may not be fully recoverable. If this review indicates the carrying value of these assets will not be recoverable, as measured based on estimated undiscounted cash flows over their remaining life, the carrying amount would be adjusted to fair value. The cash flow estimates contain management’s best estimates, using appropriate and customary assumptions and projections at the time. We have not recognized any impairment losses during the three year period ended December 31, 2003. Goodwill On January 1, 2002, Mobile Mini adopted SFAS No. 141, Business Combinations, and SFAS No. 142, Goodwill and Other Intangible Assets. Purchase prices of acquired businesses that are accounted for as purchases have been allocated to the assets and liabilities acquired based on the estimated fair values on the respective acquisition dates. Based on these values, the excess purchase prices over the fair value of the net assets acquired were allocated to goodwill. Prior to January 1, 2002, Mobile Mini amortized goodwill over the useful life of the underlying asset, not to exceed 25 years. On January 1, 2002, Mobile Mini began accounting for goodwill under the provisions of SFAS Nos. 141 and 142 and discontinued the amortization of goodwill. The Company evaluates goodwill periodically to determine whether events or circumstances have occurred that would indicated goodwill might be impaired. At December 31, 2003, Mobile Mini had gross goodwill of $54.5 million and accumulated amortization of $2.0 million. For the years ended December 31, 2002 and 2003, Mobile Mini did not recognize amortization expense related to goodwill. In assessing the recoverability of Mobile Mini’s goodwill and other intangibles, Mobile Mini must make assumptions regarding estimated future cash flows and other factors to determine the fair value of the respective assets. If these estimates or their related assumptions change in the future, Mobile Mini may be required to record impairment charges for these assets not previously recorded.

NOTES TO CONSOLIDATED FINANCIAL STATEMENTS – (continued)
F-12
Some factors considered important which could trigger an impairment review include significant underperformance relative to expected historical or projected future operating results, significant changes in the manner of use of the acquired assets or the strategy for the overall business, Mobile Mini’s market capitalization relative to net book value, and significant negative industry or economic trends. Mobile Mini performed the annual required impairment tests for goodwill as of December 31, 2002 and 2003 and determined that goodwill was not impaired either year and it was not necessary to record any impairment losses related to goodwill and other intangible assets. Net income, basic earnings per share and diluted earnings per share for the years ended December 31, 2001, 2002 and 2003, respectively, adjusted to exclude amortization expense for goodwill, are as follows:
2001 2002 2003 Net income $ 18,683,087 $ 18,239,056 $ 5,912,323 Goodwill amortization, net of income tax benefit 684,077 ⎯ ⎯ Adjusted net income $ 19,367,164 $ 18,239,056 $ 5,912,323
Earnings per share:
Basic: Net income $ 1.38 $ 1.28 $ 0.41 Goodwill 0.05 ⎯ ⎯ Adjusted net income $ 1.43 $ 1.28 $ 0.41
Diluted:
Net income $ 1.34 $ 1.26 $ 0.41 Goodwill 0.05 ⎯ ⎯ Adjusted net income $ 1.39 $ 1.26 $ 0.41
Fair Value of Financial Instruments We determine the estimated fair value of financial instruments using available market information and valuation methodologies. Considerable judgment is required in estimating fair values. Accordingly, the estimates may not be indicative of the amounts we could realize in a current market exchange. The carrying amounts of cash, receivables, accounts payable and accrued liabilities approximate fair values based on the liquidity of these financial instruments or based on their short-term nature. The carrying amounts of our borrowings under our credit facility and notes payable and capital lease instruments approximate fair value. The fair values of our notes payable and credit facility are estimated using discounted cash flow analyses, based on our current incremental borrowing rates for similar types of borrowing arrangements. Based on the borrowing rates currently available to us for bank loans with similar terms and average maturities, the fair value of fixed rate notes payable and capital leases at December 31, 2002 and 2003 approximated the book values. Deferred Financing Costs Included in other assets and intangibles are deferred financing costs, of approximately $1.9 million and $6.2 million, net of accumulated amortization of $0.4 million at December 31, 2002 and 2003, respectively. The costs associated with our former credit agreement were written off to expense in 2002 and the remaining costs of the new credit facility prior to amending the agreement in June 2003, were written off to expense in 2003 (See Note 3 – Line of Credit). The costs of obtaining long-term financing, including our amended credit facility, are being amortized over the term of the related debt, using the straight-line method. Amortizing the deferred financing costs using the straight-line method approximates such costs using the effective interest method.

NOTES TO CONSOLIDATED FINANCIAL STATEMENTS – (continued)
F-13
Derivatives SFAS No. 133, Accounting For Derivative Instruments and Hedging Activities, amended by SFAS No. 137 and SFAS No. 138, establishes accounting and reporting standards requiring that every derivative instrument (including certain derivative instruments embedded in other contracts) be recorded in the balance sheet as either an asset or liability measured at its fair value. The statement requires that changes in the fair value of the derivative be recognized currently in earnings unless specific hedge accounting criteria are met. If specific hedge accounting criteria are met, changes in the fair value of derivatives will be recognized in other comprehensive loss until the hedged item is recognized in earnings. The ineffective portion of a derivative’s change in fair value will be immediately recognized in earnings. Derivative transactions entered into during 2002 and 2003 under SFAS No. 133 resulted in a charge to comprehensive income of approximately $2.0 million, net of an applicable income tax benefit of $1.3 million for 2002 and comprehensive income of $3.7 million, net of income tax expense of $2.4 million for 2003. The change from comprehensive loss in 2002 to comprehensive income in 2003 relates primarily to the termination of $110.0 million of interest rate swap agreements. Stock Based Compensation We grant stock options for a fixed number of shares to employees and directors with an exercise price equal to the fair market value of the shares at the date of grant. We account for such stock option grants using the intrinsic-value method of accounting in accordance with Accounting Principles Board, (APB), Opinion No. 25, “Accounting for Stock Issued to Employees,” (No. 25) and related Interpretations. Under APB No. 25, we generally recognize no compensation expense with respect to such awards. Also, we do not record any compensation expense in connection with our Employee Stock Option Plan. Accounting for Stock Based Compensation If we had accounted for stock options consistent with SFAS No. 123, these amounts would be amortized on a straight-line basis as compensation expense over the average holding period of the options and our net income and earnings per share would have been reported as follows for the years ended December 31:
2001 2002 2003 Net income as reported $ 18,683,087 $ 18,239,056 $ 5,912,323 Compensation expense, net of income tax benefit 1,287,278 2,263,877 2,464,183 Pro forma net income $ 17,395,809 $ 15,975,179 $ 3,448,140 Basic EPS: As reported $ 1.38 $ 1.28 $ 0.41 Pro forma $ 1.29 $ 1.12 $ 0.24 Diluted EPS: As reported $ 1.34 $ 1.26 $ 0.41 Pro forma $ 1.25 $ 1.11 $ 0.24
Pro forma results disclosed are based on the provisions of SFAS 123 using the Black-Scholes option valuation model and are not likely to be representative of the effects on pro forma net income for future years. In addition, the Black-Scholes option valuation model was developed for use in estimating the fair value of traded options, which have no vesting restrictions and are fully transferable. In addition, option valuation models require the input of highly subjective assumptions including the expected stock price volatility. Because our stock options have characteristics significantly different from those of traded options, and because changes in the subjective input assumptions can materially affect the fair value estimate, in our opinion, the estimating models do not necessarily provide a reliable single measure of the fair value of our stock options. See Note 9 for further discussion of the Company’s stock-based employee compensation. Foreign Currency Translation and Transactions For our Canadian operations, the local currency is the functional currency. All assets and liabilities are translated at period-end exchange rates and all income statement amounts are translated at an average of month-end rates. Adjustments resulting from this translation are recorded in accumulated other comprehensive income.

NOTES TO CONSOLIDATED FINANCIAL STATEMENTS – (continued)
F-14
Use of Estimates The preparation of financial statements in conformity with accounting principles generally accepted in the United States requires management to make estimates and assumptions that affect the amounts reported in the accompanying consolidated financial statements and the notes to those statements. Actual results could differ from those estimates. The most significant estimates included within the financial statements are the allowance for doubtful accounts, the estimated useful lives and residual values on the lease fleet and property, plant and equipment and goodwill and other asset impairments. Impact of Recently Issued Accounting Standards SFAS No. 145, Rescission of FASB Statements No. 4, 44, and 64, Amendment of FASB Statement No. 13, and Technical Corrections, was issued in April 2002, and became effective for fiscal years beginning after May 15, 2002. FASB No. 4 and No. 64 related to reporting gains or losses from debt extinguishment. Under the prior guidance, if material gains or losses were recognized from debt extinguishment, the amount was not included in income from operations, but was shown as an extraordinary item, net of related income tax cost or benefit, as the case may be. Under the new guidance, all gains or losses from debt extinguishment are subject to criteria prescribed under APB No. 30, Reporting the Results of Operations – Reporting the Effects of Disposal of a Segment of a Business, and Extraordinary, Unusual and Infrequently Occurring Events and Transactions, in determining an extraordinary item classification. The adoption of SFAS No. 145 required us to reclassify certain items for the period presented in 2002, to conform to the presentation required by SFAS No. 145 and, effective January 1, 2003, we reported losses on the extinguishment of debt in pre-tax earnings rather than in extraordinary items. SFAS No. 44 is not applicable to our operations. SFAS No. 13 was amended to require certain lease modifications with similar economic effects to be accounted for the same way as a sale-leaseback. We adopted this statement on January 1, 2003. This adoption did not have any impact on our results of operations or financial position. SFAS No. 146, Accounting for Costs Associated with Exit or Disposal Activities, was issued in June 2002. This statement is effective for any disposal or exit of business activities started after December 31, 2002. The statement nullified Emerging Issues Task Force, (EITF) 94-3, which required that once a plan of disposal was put in motion, a liability for the estimated costs needed to be recorded. SFAS No. 146 states that a liability should not be recorded until the liability is incurred. This statement does not affect any liabilities established related to exiting an operation with duplicate facilities when acquired in a business combination. We adopted this accounting guidance at the prescribed date of January 1, 2003. SFAS No. 146 which did not effect our results of operations or financial position. SFAS No. 148, Accounting for Stock-Based Compensation – Transition and Disclosure, was issued and became effective for fiscal years beginning after December 15, 2002. SFAS No. 148 amends SFAS No. 123, to provide alternative methods of transition to SFAS No. 123’s fair value method of accounting for Stock-based employee compensation. This statement also amends the disclosure provisions of SFAS No. 123 and APB No. 28, Interim Financial Reporting to require disclosure about the effects on reported net income and earnings per share of an entity’s accounting policy with respect to stock-based employer compensation in annual and interim financial statements. The disclosure provisions of SFAS No. 148 are applicable to all companies with stock-based compensation, regardless if they account for that compensation using the fair value method of SFAS No. 123 or the intrinsic value method of APB No. 25. The Company has elected to continue the accounting method prescribed by APB No. 25 and has adopted the disclosure requirements of SFAS No. 148 as of December 31, 2003. See Note 9 – Benefit Plans: Stock Option Plans.
Financial Accounting Standards Board (FASB) Interpretation No. 46, Consolidation of Variable Interest Entities, (FIN 46) was issued in January 2003 and addresses consolidation by business enterprises of variable interest entities. FIN 46 clarifies existing accounting for whether interest entities, as defined in FIN 46, should be consolidated in financial statements based upon the investee’s ability to finance activities without additional financial support and whether investors possess characteristics of a controlling financial interest. FIN 46 applies immediately to variable interest entities created after January 31, 2003, and to variable interest entities in which an enterprise obtains an interest after that date. It applies in the first fiscal year or interim period beginning after June 15, 2003, to variable interest entities in which an enterprise holds a variable interest that it acquired before February 1, 2003. The Company does not have any variable interest entities and therefore this adoption did not have any effect on our results of operations or financial position.
SFAS No. 149, Amendment of SFAS No. 133 on Derivative Instruments and Hedging Activities, was issued in April 2003 which amends and clarifies financial accounting and reporting for derivative instruments, including certain derivative instruments embedded in other contracts and for hedging activities under SFAS No. 133, Accounting for Derivative Instruments and Hedging Activities.

NOTES TO CONSOLIDATED FINANCIAL STATEMENTS – (continued)
F-15
SFAS No. 149 is effective for contracts entered into or modified after June 30, 2003 and hedging relationships designated after June 30, 2003. The adoption of SFAS No. 149 did not have a material impact on our financial condition or results of operations. In May 2003, SFAS No. 150, Accounting for Certain Financial Instruments with Characteristics of both Liabilities and Equity, was issued. SFAS No. 150 establishes standards for how an issuer classifies and measures certain financial instruments with characteristics of both liabilities and equity, and is effective for financial instruments entered into or modified after May 31, 2003 and otherwise is effective July 1, 2003. The adoption of SFAS No. 150, did not have a material impact on our financial condition or results of operations. On December 17, 2003, the Staff of the Securities and Exchange Commission (SEC) issued SAB 104, Revenue Recognition, which supersedes SAB 101, Revenue Recognition in Financial Statements. SAB 104‘s primary purpose is to rescind accounting guidance contained in SAB 101 related to multiple element revenue arrangements, superseded as a result of the issuance of EITF 00-21, Accounting for Revenue Arrangements with Multiple Deliverables. While the wording of SAB 104 has changed to reflect the issuance of EITF 00-21, the revenue recognition principles of SAB 101 remain largely unchanged by the issuance of SAB 104. The adoption of SAB 104 in December 2003 did not affect the Company’s revenue recognition policies, our financial condition or results of operations. (2) Lease Fleet: Mobile Mini has a lease fleet primarily consisting of refurbished, modified and manufactured portable units that are leased to customers under short-term operating lease agreements with varying terms. Depreciation is provided using the straight-line method over our units’ estimated useful life, in most cases 20 years after the date we put the unit in service, with estimated residual values of 70% on steel units and 50% on wood office units. Van trailers, which are a small part of our fleet, are depreciated over 7 years to a 20% residual value. Van trailers are only added to the fleet in connection with acquisitions of portable storage businesses. In the opinion of management, estimated residual values do not cause carrying values to exceed net realizable value. We continue to evaluate these depreciation policies as more information becomes available from other comparable sources and our own historical experience. Based on this information, effective January 1, 2004, we changed our depreciation policy on our steel units to an estimated useful life of 25 years with an estimated residual value of 62.5% which effectively results in continual depreciation on these containers at the same annual rate. At December 31, 2002 and 2003, all of our lease fleet units were pledged as collateral under the credit facility (see Note 3). Normal repairs and maintenance to the portable storage and mobile office units are expensed as incurred. Gains from sale-leaseback transactions were deferred and amortized over the estimated useful lives of the related assets. Unamortized gains at December 31, 2002 and 2003, approximated $186,000 and $169,000, respectively, and are reflected as a reduction to the lease fleet value in the accompanying consolidated balance sheets. Lease fleet at December 31, consists of the following:
2002 2003 Steel storage containers $ 226,853,579 $ 252,449,396 Offices 121,289,415 148,244,087 Van trailers 4,704,996 4,464,269 Other, primarily flatbed type chassis 504,405 424,833 Accumulated depreciation (16,268,092) (22,828,682) $ 337,084,303 $ 382,753,903
(3) Line Of Credit: On February 11, 2002, we entered into a Loan and Security Agreement with a group of lenders, led by Fleet Capital Corporation, which provides us with a $250.0 million revolving credit facility. The initial borrowings under that credit facility were used to refinance approximately $161.4 million of outstanding borrowings under a prior credit facility, which had a maturity date of March 2004. In connection with this refinancing, in the first quarter of 2002 we recorded an after-tax extraordinary charge (under SFAS No. 4) of approximately $0.8 million, net of tax of $0.5 million, which has been reclassified as debt restructuring expense in the accompanying consolidated financial statements in accordance with SFAS No. 145. The credit facility under the Loan and Security Agreement was then scheduled to expire in February 2007.

NOTES TO CONSOLIDATED FINANCIAL STATEMENTS – (continued)
F-16
In June 2003, we amended and restated the credit agreement, which we refer hereinafter as the Loan and Security Agreement, to permit us to issue $150 million of our Senior Notes, to operate at higher levels of leverage and to reduce required fleet utilization covenant levels. The term of the credit facility was extended by one year to February 2008. Borrowings under the present Loan and Security Agreement are secured by a lien on substantially all of our present and future assets. Borrowings of up to $250 million are available under this facility, based on the value of our lease fleet, property, plant, equipment, and levels of inventories and receivables. The lease fleet will be appraised at least twice annually and up to 90% of the lesser of cost or appraised orderly liquidation value, as defined, may be included in the borrowing base to determine how much we may borrow under this facility. The interest rate spread under the facility is based on a quarterly calculation of our ratio of funded debt to earnings before interest expense, taxes, depreciation and amortization and certain excluded expenses during the prior 12 months. Borrowings are, at our option, at either a spread from the prime or LIBOR rates, as defined. At December 31, 2003, the prime rate was 4.0% and the LIBOR rate was 1.1875%. The Loan and Security Agreement contains several covenants, including a minimum fixed charge coverage, maximum ratio of funded debt to EBITDA (as defined in the Loan and Security Agreement), a minimum borrowing base availability and minimum required utilization rates. The Loan and Security Agreement also restricts our capital expenditures, our incurrence of additional debt and prohibits our payment of cash dividends on the common stock. We were in compliance with all covenants at December 31, 2003. The most restrictive covenant is the ratio of funded debt to EBITDA, as defined in the Loan and Security Agreement, of 5.9 to 1.0 at December 31, 2003. We had approximately $84.3 million of availability, at December 31, 2003, under the requirements of this covenant. Our revolving line of credit balance outstanding was approximately $211.1 million and $89.0 million at December 31, 2002 and 2003, respectively. Our 2003 balance was affected by our issuance of $150.0 million of Senior Notes in June 2003. (See Note 6). The weighted average interest rate under the line of credit, including the effect of applicable interest rate swaps, was approximately 5.6% in 2002 and 5.4% in 2003%, and the average balance outstanding during 2002 and 2003 was approximately $194.5 million and $152.6 million, respectively, without giving effect to the interest rate swap agreements. In connection with our debt restructuring transaction on June 26, 2003, we terminated $110.0 million of the $135.0 million interest rate swap agreements then in effect. The termination fees for unwinding these agreements of approximately $8.7 million are included in debt restructuring expense in the accompanying consolidated financial statements. The fixed interest rate on the remaining $25.0 million swap is 3.66% plus the spread. Accounting for these swap agreements is covered by SFAS No. 133 and the aggregate change in the fair value of the interest rate swap agreements resulted in a charge to comprehensive income at December 31, 2002 of $2.0 million, net of an applicable income tax expense of $1.3 million and at December 31, 2003, an increase in comprehensive income of $3.7 million, net of an income tax of $2.4 million. These swap agreements are designated as cash flow hedges and interest expense on the borrowings under these agreements is accrued using the fixed rates identified in the swap agreements. Our objective in entering into these swap transactions was to reduce the risk associated with future interest rate fluctuations. We intend to continue to operate with leverage, and management believes it is prudent to lock in a fixed interest rate at a time when fixed rates are at historically advantageous rates. We began accounting for the swap agreements under SFAS No. 133 effective January 1, 2001.
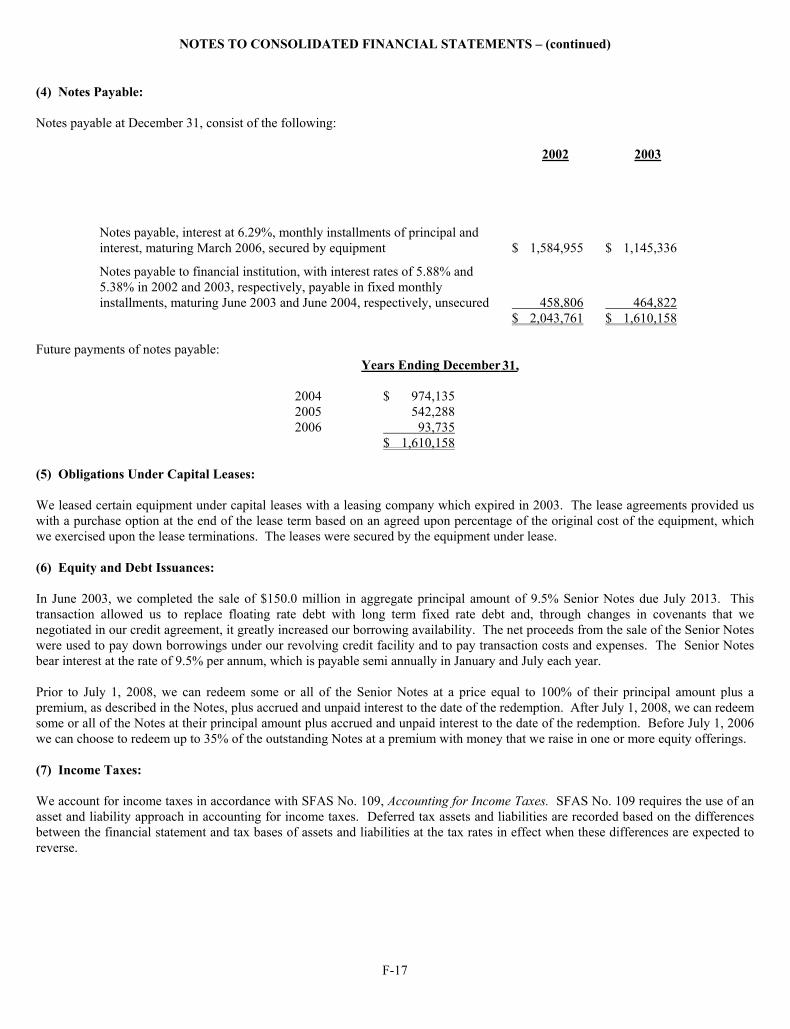
NOTES TO CONSOLIDATED FINANCIAL STATEMENTS – (continued)
F-17
(4) Notes Payable: Notes payable at December 31, consist of the following:
2002 2003
Notes payable, interest at 6.29%, monthly installments of principal and interest, maturing March 2006, secured by equipment
$ 1,584,955
$ 1,145,336
Notes payable to financial institution, with interest rates of 5.88% and 5.38% in 2002 and 2003, respectively, payable in fixed monthly installments, maturing June 2003 and June 2004, respectively, unsecured
458,806
464,822
$ 2,043,761 $ 1,610,158 Future payments of notes payable:
Years Ending December 31,
2004 $ 974,135 2005 542,288 2006 93,735
$ 1,610,158 (5) Obligations Under Capital Leases: We leased certain equipment under capital leases with a leasing company which expired in 2003. The lease agreements provided us with a purchase option at the end of the lease term based on an agreed upon percentage of the original cost of the equipment, which we exercised upon the lease terminations. The leases were secured by the equipment under lease. (6) Equity and Debt Issuances: In June 2003, we completed the sale of $150.0 million in aggregate principal amount of 9.5% Senior Notes due July 2013. This transaction allowed us to replace floating rate debt with long term fixed rate debt and, through changes in covenants that we negotiated in our credit agreement, it greatly increased our borrowing availability. The net proceeds from the sale of the Senior Notes were used to pay down borrowings under our revolving credit facility and to pay transaction costs and expenses. The Senior Notes bear interest at the rate of 9.5% per annum, which is payable semi annually in January and July each year. Prior to July 1, 2008, we can redeem some or all of the Senior Notes at a price equal to 100% of their principal amount plus a premium, as described in the Notes, plus accrued and unpaid interest to the date of the redemption. After July 1, 2008, we can redeem some or all of the Notes at their principal amount plus accrued and unpaid interest to the date of the redemption. Before July 1, 2006 we can choose to redeem up to 35% of the outstanding Notes at a premium with money that we raise in one or more equity offerings. (7) Income Taxes: We account for income taxes in accordance with SFAS No. 109, Accounting for Income Taxes. SFAS No. 109 requires the use of an asset and liability approach in accounting for income taxes. Deferred tax assets and liabilities are recorded based on the differences between the financial statement and tax bases of assets and liabilities at the tax rates in effect when these differences are expected to reverse.

NOTES TO CONSOLIDATED FINANCIAL STATEMENTS – (continued)
F-18
The provision for income taxes for the years ended December 31, consisted of the following:
2001 2002 2003 Current $ — $ 118,000 $ 54,000 Deferred 11,945,000 11,543,000 3,726,000 Total $ 11,945,000 $ 11,661,000 $ 3,780,000
The components of the net deferred tax liability at December 31, are approximately as follows:
2002 2003 Deferred tax assets (liabilities):
Net operating loss carryforward $ 17,154,000 $ 24,758,000 Accelerated tax depreciation (63,663,000) (77,106,000) Unrealized gain on hedge included in other comprehensive income
2,563,000
⎯
Other 2,626,000 4,990,000 Net deferred tax liability $ (41,320,000) $ (47,358,000)
A reconciliation of the federal statutory rate to Mobile Mini’s effective tax rate for the years ended December 31, is as follows:
2001 2002 2003 Statutory federal rate 34% 35% 35% State taxes, net of federal benefit 5 4 4 39% 39% 39%
At December 31, 2003, we had a federal net operating loss carryforward of approximately $67,888,000 which expires if unused from 2008 to 2023. At December 31, 2003, we had an Arizona net operating loss carryforward of approximately $10,417,000 which expires if unused from 2004 to 2009. At December 31, 2003, we had other net operating loss carryforward in the various states in which we operate. As a result of stock ownership changes during the years presented, it is possible that Mobile Mini has undergone one or more changes in ownership for federal income tax purposes, which can limit the amount of net operating loss currently available as a deduction. Such limitation could result in our being required to pay tax currently because only a portion of the net operating loss is available. Management believes that it is more likely than not that we will fully realize our net operating loss carryforward and therefore a valuation reserve was not necessary at December 31, 2003. (8) Transactions with Related Parties: When we were a private company prior to 1994, we leased some of our properties from entities controlled by our founder, Richard E. Bunger, and his family members. These related party leases remain in effect. We lease a portion of the property comprising our Phoenix location and the property comprising our Tucson location from entities owned by Steven G. Bunger and his siblings (including Carolyn A. Clawson, a member of our board of directors). Steven G. Bunger is our President and Chief Executive Officer and has served as our Chairman of the Board since February 2001. Annual lease payments under these leases totaled approximately $80,000, $81,000 and $83,000 in 2001, 2002 and 2003, respectively. In 2003, the term of each of these leases was extended for five years, under the same terms and conditions, and expire on December 31, 2008. Mobile Mini leases its Rialto, California facility from Mobile Mini Systems, Inc., a corporation wholly owned by Barbara M. Bunger, the mother of Steven G. Bunger and Carolyn A. Clawson. Payments in 2001, 2002 and 2003 under this lease were approximately $243,000, $247,000 and $252,000, respectively. The Rialto lease expires on December 31, 2016. Management believes that the rental rates reflect the fair market rental value of these properties. Mobile Mini obtains services throughout the year from Skilquest, Inc., a company engaged in sales and management support programs, including the monitoring of our sales personnel. Skilquest, Inc. is owned by Carolyn A. Clawson, a member of our board

NOTES TO CONSOLIDATED FINANCIAL STATEMENTS – (continued)
F-19
of directors. Mobile Mini made aggregate payments of approximately $201,000, $263,000, and $334,000 to Skilquest, Inc. in 2001, 2002 and 2003, respectively, which Mobile Mini believes represented the fair market value for the services performed. The increase in the amount we paid Skilquest was primarily due to increased market analysis which we engaged Skilquest to perform in the new markets we entered in 2002 and an increase in the average number of sales personnel being evaluated. In February 2001, Mobile Mini and its former Chairman of the Board, Richard E. Bunger, entered into an employment agreement pursuant to which Mr. Bunger provides services to Mobile Mini during the term of the agreement, which is scheduled to end on June 30, 2005. Under the agreement, Mobile Mini paid Mr. Bunger $230,000 during 2001, $180,000 during 2002 and $112,000 in 2003, and will pay him $1,000 per month during 2004 through June 30, 2005. Through February 2004, Mobile Mini also provided office space and an administrative assistant to Mr. Bunger. The agreement also provides that Mr. Bunger is bound by an agreement pertaining to confidentiality of Mobile Mini’s confidential information, and a non-competition agreement. It is Mobile Mini’s intention not to enter into any additional related party transactions other than extension of lease agreements and renewal of the relationship with Skilquest. (9) Benefit Plans: Stock Option Plans In August 1994, our board of directors adopted the Mobile Mini, Inc. 1994 Stock Option Plan, which was amended in 1998 and expired (with respect to granting additional options) in 2003. At December 31, 2003, there were outstanding options to acquire 463,870 shares under the 1994 Plan. In August 1999, our board of directors approved the Mobile Mini, Inc. 1999 Stock Option Plan, under which 2,200,000 shares of common stock are reserved for issuance upon the exercise of options which may be granted under this plan. The 1999 Plan was amended in 2003, to increase shares of common stock authorized for issuance from 1.2 million to 2.2 million shares. Both plans and amendments were approved by the stockholders at annual meetings. Under the 1999 Plan, both incentive stock options (ISOs), which are intended to meet the requirements of Section 422 of the Internal Revenue Code, and non-qualified stock options may be granted. ISOs may be granted to our officers and other employees. Non-qualified stock options may be granted to directors and employees, and to non-employee service providers. The purposes of the Plan are to attract and retain the best available personnel for positions of substantial responsibility and to provide incentives to, and to encourage ownership of stock by, our management and other employees. The board of directors believes that stock options are important to attract and to encourage the continued employment and service of officers and other employees by facilitating their purchase of a stock interest in Mobile Mini. The option exercise price for all options granted under the Plan may not be less than 100% of the fair market value of the common stock on the date of grant of the option (or 110% in the case of an incentive stock option granted to an optionee beneficially owning more than 10% of the outstanding common stock). The maximum option term is ten years (or five years in the case of an incentive stock option granted to an optionee beneficially owning more than 10% of the outstanding common stock). Payment for shares purchased under the Plan may be made either in cash or, if permitted by the particular option agreement, by exchanging shares of common stock with a fair market value equal to the total option exercise price plus cash for any difference. Options may, if permitted by the particular option agreement, be exercised by directing that certificates for the shares purchased be delivered to a licensed broker as agent for the optionee, provided that the broker tenders to Mobile Mini cash or cash equivalents equal to the option exercise price. The Plan is administered by the compensation committee of our board of directors. The committee is comprised of independent directors. They determine whether options will be granted, whether options will be ISOs or non-qualified options, which officers, employees and service providers will be granted options, the vesting schedule for options and the number of options to be granted. Each option granted must expire no more than 10 years from the date it is granted. Each non-employee director serving on our board of directors receives an automatic grant of options for 7,500 shares on August 1 of each year as part of the compensation we provide to such directors. The board of directors may amend the 1999 Plan at any time, except that approval by our stockholders may be required for an amendment that increases the aggregate number of shares which may be issued pursuant to the plan, changes the class of persons eligible to receive ISO’s, modifies the period within which options may be granted, modifies the period within which options may be exercised or the terms upon which options may be exercised, or increases the material benefits accruing to the participants under the

NOTES TO CONSOLIDATED FINANCIAL STATEMENTS – (continued)
F-20
plan. The board of directors may terminate or suspend the 1999 Plan at any time. The 1994 Plan expired in 2003. Unless previously terminated, the 1999 Plan will expire in August 2009. Any option granted under a plan will continue until the option expiration date, notwithstanding earlier termination of the plan under which the option was granted. On December 13, 2000, the compensation committee extended the term of 10,000 stock options granted to Steven G. Bunger, our President and Chief Executive Officer, that were to expire on December 29, 2000. The options were originally granted at an exercise price of $4.13 per share and were extended for five years with a two year vesting period. These options will now expire on December 29, 2005. In connection with this transaction, we amortized the expense over the pro rata vesting period of two years which approximated $76,000 in both 2001 and 2002. We account for stock-based compensation plans under APB No. 25, under which no compensation expense has been recognized in the accompanying consolidated financial statements for stock-based employee awards with an exercise price equal to or greater than the fair value of the common stock on the date of grant. For purposes of SFAS No. 123, the fair value of each option granted has been estimated at the date of the grant using the Black-Scholes option pricing model using the following assumptions:
2001 2002 2003 Risk free interest rates range 4.39 to 4.89% 3.03 to 4.81% 3.29 to 3.37% Expected holding period 5.0 years 5.0 years 5.0 years Dividend rate 0.0% 0.0% 0.0% Expected volatility 48.7% 80.0% 35.6%
Under these assumptions, the weighted average fair value of the stock options granted was $16.38, $9.63 and $8.26 for 2001, 2002 and 2003, respectively. The effect of applying SFAS No. 123 in the pro forma disclosures above is not likely to be representative of the effect on reported net income or earnings per share for future years, because options vest over several years, additional stock options are generally awarded in each year and SFAS No. 123 has not been applied to options granted prior to January 1, 1995. The following table summarizes the activities under our stock option plans for the years ended December 31: 2001 2002 2003 Weighted Weighted Weighted Average Average Average Number of Exercise Number of Exercise Number of Exercise Shares Price Shares Price Shares Price Options outstanding, beginning of year 1,243,950 $ 13.29 1,392,550 $ 21.25 1,692,700 $ 19.87 Granted 502,850 32.63 362,500 14.70 350,500 19.70 Canceled/ Expired (24,500) 18.35 (37,600) 26.53 (94,571) 22.40 Exercised (329,750) 8.81 (24,750) 11.43 (59,989) 11.40 Options outstanding, end of year 1,392,550 $ 21.25 1,692,700 $ 19.87 1,888,640 $ 19.98 Options exercisable, end of year 397,100 $ 13.01 699,220 $ 16.46 945,285 $ 17.99 Options available for grant, end of year 356,900 32,000 738,671

NOTES TO CONSOLIDATED FINANCIAL STATEMENTS – (continued)
F-21
Options outstanding and exercisable by price range as of December 31, 2003 are as follows:
Options Outstanding Options Exercisable Weighted Average Weighted Weighted Remaining Average Average Range of Options Contractual Exercise Options Exercise Exercise Prices Outstanding Life Price Exercisable Price $ 3.120 – $ 4.500 70,820 3.12 $ 3.575 70,820 $ 3.575 4.810 – 6.125 82,100 4.05 6.037 82,100 6.037 8.875 – 11.875 132,700 5.13 11.652 132,700 11.652 13.996 – 20.875 1,014,050 8.20 17.589 378,925 17.315 21.019 – 28.988 150,600 6.83 21.329 91,700 21.373 31.540 – 32.910 438,370 7.93 32.840 189,040 32.747 1,888,640 945,285
401(k) Plan In 1995, we established a contributory retirement plan, the 401(k) Plan, covering eligible employees with at least one year of service. The 401(k) Plan is designed to provide tax-deferred retirement benefits to employees in accordance with the provisions of Section 401(k) of the Internal Revenue Code. The 401(k) Plan provides that each participant may annually contribute 2% to 15% of his or her salary, not to exceed the statutory limit. Mobile Mini may make a qualified non-elective contribution in an amount it determines. Under the terms of the 401(k) Plan, Mobile Mini may also make discretionary profit sharing contributions. Profit sharing contributions are allocated among participants based on their annual compensation. Each participant has the right to direct the investment of their funds among certain named plans. Mobile Mini contributes 10% of employees’ contributions up to a maximum of $500 per employee. We made profit sharing contributions of $66,000, $72,000 and $76,000 in 2001, 2002 and 2003, respectively. Additionally, we incurred $16,000, $25,000 and $25,000 in 2001, 2002 and 2003, respectively, for administrative costs on this program.

NOTES TO CONSOLIDATED FINANCIAL STATEMENTS – (continued)
F-22
(10) Commitments and Contingencies: Leases As discussed more fully in Note 8, Mobile Mini is obligated under noncancellable operating leases with related parties. We also lease our corporate offices and other properties and operating equipment from third parties under noncancellable operating leases. Rent expense under these agreements was approximately $3,284,000, $4,224,000 and $5,165,000 for the years ended December 31, 2001, 2002 and 2003, respectively. Total future commitments under all noncancellable agreements for the years ended December 31, are approximately as follows:
2004 $ 5,140,000 2005 5,089,000 2006 4,506,000 2007 3,863,000 2008 2,730,000 Thereafter 8,746,000 $ 30,074,000
The above table, for future lease commitments, includes renewal options on certain real estate lease options we currently anticipate exercising at the end of the lease term. Insurance We maintain all major lines of insurance coverage for our operations and employees with appropriate aggregate, per occurrence and deductible limits as we reasonably determine is necessary or prudent with current operations and historical experience. The majority of these coverages have large deductible programs which allow for potential improved cash flow benefits based on our loss control efforts. Our employee group health insurance program is a minimum premium plan. The insurance provider is responsible for funding all claims in excess of the calculated monthly maximum liability. This calculation is based on a variety of factors including the number of employees enrolled in the plan. This plan allows for some cash flow benefits while guarantying a maximum premium liability. Actual results may vary from estimates, even favorably, based on our actual experience at the end of the plan policy periods based on the carrier’s loss predictions and our historical claims data. Our worker’s compensation, auto and general liability insurance is purchased under large deductible programs. Our current per incident deductibles are: worker’s compensation $250,000, auto $100,000 and general liability $100,000. We expense the deductible portion of the individual claims. However, we generally do not know the full amount of our exposure to a deductible in connection with any particular claim during the fiscal period in which the claim is incurred and for which we must make an accrual for the deductible expense. We make these accruals based on a combination of the claims review by our staff and our insurance companies, and, at year end, the accrual is reviewed and adjusted, in part, based on an independent actuarial review of historical loss data and using certain actuarial assumptions followed in the insurance industry. A high degree of judgment is required in developing these estimates of amounts to be accrued, as well as in connection with the underlying assumptions. In addition, our assumptions will change as our loss experience is developed. All of these factors have the potential for significantly impacting the amounts we have previously reserved in respect of anticipated deductible expenses, and we may be required in the future to increase or decrease amounts previously accrued. General Litigation Mobile Mini is a party to routine claims incidental to its business. Most of these routine claims involve alleged damage to customers’ property while stored in units leased from us and damage alleged to have occurred during delivery and pick-up of containers. We carry insurance to protect us against loss from these types of claims, subject to deductibles under the policy. We do not believe that any of these incidental claims, individually or in the aggregate, is likely to have a material adverse effect on our business or results of operations.

NOTES TO CONSOLIDATED FINANCIAL STATEMENTS – (continued)
F-23
Florida Litigation In April 2000, we acquired the portable storage business that was operated in Florida by A-1 Trailer Rental and several affiliated entities (collectively, "A-1 Trailer Rental"). As previously reported in our quarterly reports on Form 10-Q and our previous annual report on Form 10-K, which are filed with the Securities and Exchange Commission, two lawsuits were filed against us in the State of Florida arising out of that acquisition. One lawsuit, Nuko Holdings I, LLC v. Mobile Mini, Inc., was an action against us brought in the Circuit Court of the 13th Judicial District in and for Hillsborough County, Florida (Case No. 0003500), and resulted in a verdict of $7,215,000 being entered against us. In the second case, A-1 Trailer Rental filed an action (A-1 Trailer Rental, et al. v. Mobile Mini, Inc. (Case No. 8:02-cv-323-T-27TGW, in the United States District Court for the Middle District of Florida, Tampa Division)) requesting that the court find that A-1 Trailer Rental has no contractual agreement to indemnify us against any losses we suffer as a consequence of the Nuko Holdings lawsuit and that the $2,200,000 held in escrow in accordance with the terms of the A-1 Trailer Rental acquisition agreement and a subsequent agreement be delivered to A-1 Trailer Rental. In a Form 8-K filed with the SEC on December 22, 2003, we announced that a panel of the Florida Second District Court of Appeals had affirmed the jury verdict award against Mobile Mini. Mobile Mini filed motions in December 2003 requesting a rehearing en banc by the court and requesting a written opinion of the court’s decision upholding the jury verdict award of $7.2 million in damages to Nuko Holdings. The court has denied these motions. The judgment and interest (totaling approximately $8.0 million) have been paid in 2004 through Mobile Mini’s revolving line of credit and fully accrued at December 31, 2003. A letter of credit of about $4.3 million under that credit line as of December 31, 2003, which had been used to support the appeal bond has been released. Payment of the judgment and interest thereon will not have a material adverse affect on Mobile Mini’s financial condition. The financial covenants under our revolving credit facility and the indenture related to our Senior Notes exclude the amount of the judgment and related interest costs when measuring compliance with the terms of the related facilities. With respect to the litigation with A-1 Trailer Rental, on February 9, 2004, a final judgment was entered in the United States District Court, Middle District of Florida, Tampa Division. Pursuant to the terms of the final judgment, A-1 is not obligated to indemnify Mobile Mini for losses relating to the judgment. Mobile Mini was awarded money relating to other claims, and some fees and costs. The judgment will not be appealed. The amount due to Mobile Mini under the judgment (approximately $217,000) has been paid to the Company out of an escrow account. The remainder of the escrowed funds has been paid over to A-1 Trailer. (11) Stockholders’ Equity: Redeemable Warrants Redeemable Warrants to purchase 187,500 shares of common stock at $5.00 per share were issued in connection with our issuance in November 1997 of Senior Subordinated Notes. Redeemable Warrants of 62,910 and 44,007 had been exercised for an equal number of shares of common stock, with proceeds to Mobile Mini of approximately $315,000 and $220,000 in 2001 and 2002, respectively. The Redeemable Warrants expired on November 1, 2002, with 4,150 warrants expiring unexercised. (12) Acquisitions: Mobile Mini enters new markets in one of two ways, either by a new branch start up or through acquiring the portable storage assets and related leases of other companies. An acquisition provides us with cash flow which enables us to immediately cover the overhead cost at the new branch. On occasion, we also purchase portable storage businesses in areas where we have existing smaller branches either as part of multi-market acquisitions or in order to increase our operating margins at those branches. Mobile Mini acquired for cash, the assets and assumed certain liabilities of one business during the year ended December 31, 2003. The accompanying consolidated financial statements include the operations of the acquired business from the date of acquisition. The acquisition was accounted for as a purchase in accordance with SFAS No. 141, Business Combinations, and accordingly, the purchased assets and the assumed liabilities were recorded at their estimated fair values at the date of acquisition. Goodwill for acquisitions completed through June 30, 2001, was amortized using the straight-line method over 25 years from the date of the acquisition during 2001. In 2002 and 2003, goodwill for acquisitions was not amortized in accordance with SFAS No. 142. Goodwill was approximately $51.8 million and $52.5 million at December 31, 2002 and 2003 respectively. Intangible assets primarily represent non-compete agreements that are amortized from 2 to 5 years using the straight-line method with no residual value. Amortization expense for non tangible assets was approximately $201,000 and $244,000 in 2002 and 2003, respectively.

NOTES TO CONSOLIDATED FINANCIAL STATEMENTS – (continued)
F-24
The aggregate purchase price of the operations acquired consists of:
Year ended December 31, 2001 2002 2003 Cash $ 11,727,000 $ 28,002,000 $ 1,284,000 Retirement of debt 1,837,000 2,722,000 214,000 Other acquisition costs 134,000 109,000 175,000 Total $ 13,698,000 $ 30,833,000 $ 1,673,000
The fair value of the assets purchased has been allocated as follows:
Year ended December 31, 2001 2002 2003 Tangible assets $ 6,110,000 $ 10,842,000 $ 475,000 Intangible assets 175,000 390,000 25,000 Goodwill 7,829,000 20,423,000 1,173,000 Assumed liabilities (416,000) (822,000) ⎯ Total $ 13,698,000 $ 30,833,000 $ 1,673,000
The purchase prices for acquisitions have been allocated to the assets acquired and liabilities assumed based upon estimated fair values as of the acquisition dates and are subject to adjustment when additional information concerning asset and liability valuations are finalized. We do not believe any adjustments to the allocation will have any material effect on our results of operations or financial position. The table below represents the estimated annual amortization expense for intangible assets from acquisitions at December 31, 2003:
2004 $ 192,000 2005 141,000 2006 96,000 2007 33,000 2008 4,000
(13) Segment Reporting: Our management approach includes evaluating each segment on which operating decisions are made based on performance, results and profitability. Currently, our branch operation is the only segment that concentrates on our core business of leasing. Each branch has similar economic characteristics covering all products leased or sold, including the same customer base, sales personnel, advertising, yard facilities, general and administrative costs and the branch management. Management’s allocation of resources, performance evaluations and operating decisions are not dependent on the mix of a branch’s products. We do not attempt to allocate shared revenue nor general, selling and leasing expenses to the different configurations of portable storage and office products for lease and sale. The branch operations includes the leasing and sales of portable storage units, portable offices and combination units configured for both storage and office space. We lease to businesses and consumers in the general geographic area relative to each branch. The operation includes Mobile Mini’s manufacturing facilities, which are responsible for the purchase, manufacturing and refurbishment of products for leasing, sales or equipment additions to our delivery system, and residual sales from its dealer program that was discontinued in 1998. In managing our business, we focus on our internal growth rate in leasing revenue, which we define as growth in lease revenues on a year over year basis at our branch locations in operation for at least one year, without inclusion of same market acquisitions.

NOTES TO CONSOLIDATED FINANCIAL STATEMENTS – (continued)
F-25
In addition, we focus on earnings per share and on adjusted EBITDA. We calculate this number by first calculating EBITDA, which is a measure of our earnings before interest expense, debt restructuring costs, income tax, depreciation and amortization. This measure eliminates the effect of financing transactions that we enter into on an irregular basis based on capital needs and market opportunities. It provides us with a means to measure internally generated available cash from which we can fund our interest expense and our lease fleet growth. In comparing EBITDA from year to year, we typically ignore the effect of what we consider non-recurring events not related to our core business operations to arrive at adjusted EBITDA. The only such event during the last several years has been the effect of the Florida litigation. Discrete financial data on each of our products is not available and it would be impractical to collect and maintain financial data in such a manner; therefore, reportable information is the same as contained in our consolidated financial statements. (14) Selected Consolidated Quarterly Financial Data (unaudited): The following table sets forth certain unaudited selected consolidated financial information for each of the four quarters in fiscal 2002 and 2003. In management’s opinion, this unaudited consolidated quarterly selected information has been prepared on the same basis as the audited consolidated financial statements and includes all necessary adjustments, consisting only of normal recurring adjustments, that management considers necessary for a fair presentation when read in conjunction with the Consolidated Financial Statements and notes. The Company believes these comparisons of consolidated quarterly selected financial data are not necessarily indicative of future performance. Quarterly earnings per share may not total to the fiscal year earnings per share due to the weighted average number of shares outstanding at the end of each period reported.

NOTES TO CONSOLIDATED FINANCIAL STATEMENTS – (continued)
F-26
First
Quarter Second Quarter
Third Quarter
Fourth Quarter
2002 Leasing revenues $ 25,088,282 $ 27,616,851 $ 30,883,437 $ 32,580,111 Total revenues 29,388,165 31,670,739 35,142,816 36,894,809 Gross profit margin on sales 1,396,090 1,329,353 1,388,139 1,550,484 Income from operations 9,804,738 10,059,878 10,219,320 12,689,720 Net income 3,711,472 (1) 4,434,406 4,379,275 (2) 5,713,903 (3) Earnings per share: Basic $ 0.26 (1) $ 0.31 $ 0.31 (2) $ 0.40 (3) Diluted $ 0.25 (1) $ 0.31 $ 0.30 (2) $ 0.40 (3)
2003 Leasing revenues $ 29,704,244 $ 30,941,606 $ 32,772,488 $ 35,063,674 Total revenues 33,741,989 35,051,498 36,636,424 44,138,585 Gross profit margin on sales 1,405,981 1,496,254 1,298,602 1,560,503 Income from operations 9,499,164 10,188,081 12,220,704 4,521,888 Net income (loss) 3,833,127 (4) (2,129,875) (5)(6) 4,474,149 (7) (265,078) (8) Earnings (loss) per share: Basic $ 0.27 (4) $ (0.15) (5)(6) $ 0.31 (7) $ (0.02) (8) Diluted $ 0.27 (4) $ (0.15) (5)(6) $ 0.31 (7) $ (0.02) (8)
(1) Includes capitalized debt issuance costs written off in connection with entering into a new credit agreement, which approximated $0.8 million, net of income tax benefit of $0.5 million, or $0.06 per diluted share.
(2) Includes Florida litigation expenses, which approximated $0.7 million, net of income tax benefit of $0.4 million, or $0.05 per diluted share.
(3) Includes Florida litigation expenses, which approximated $0.1 million, net of income tax benefit of $0.07 million, or $0.01 per diluted share.
(4) Includes Florida litigation expenses, which approximated $0.04 million, net of income tax benefit of $0.03 million, or $0.0 per diluted share.
(5) Includes termination expenses for certain interest rate swap agreements and certain capitalized debt issuance costs, both incurred in connection with our entering into our amended and restated credit agreement and the issuance of our Senior Notes. These costs approximated $6.4 million, net of income tax benefit of $4.0 million, or $0.44 per diluted share.
(6) Includes Florida litigation expenses, which approximated $0.09 million, net of income tax benefit of $0.06 million, or $0.01 per diluted share.
(7) Includes Florida litigation expenses, which approximated $0.04 million, net of income tax benefit of $0.03 million, or $0.0 per diluted share.
(8) Includes Florida litigation expenses, which approximated $5.0 million, net of income tax benefit of $3.2 million, or $0.35 per diluted share.

64
ITEM 9. CHANGES IN AND DISAGREEMENTS WITH ACCOUNTANTS ON ACCOUNTING AND FINANCIAL DISCLOSURE.
In June 2002, the Board of Directors of Mobile Mini determined, in consultation with and upon the recommendation of its Audit Committee, to dismiss Arthur Andersen LLP as independent auditors, and to engage the services of Ernst & Young LLP as its independent auditors. The change in auditors became effective June 10, 2002. The audit report of Arthur Andersen on the consolidated financial statements of Mobile Mini as of and for the fiscal years ended December 31, 2000 and 2001 did not contain any adverse opinion or disclaimer of opinion, nor were they qualified or modified as to uncertainty, audit scope or accounting principles. During Mobile Mini’s two most recent fiscal years ended December 31, 2001, and through June 10, 2002, there were no disagreements between Mobile Mini and Arthur Andersen on any matter of accounting principles or practices, financial statement disclosure, or auditing scope or procedure which, if not resolved to Arthur Andersen’s satisfaction, would have caused Arthur Andersen to make reference to the subject matter of the disagreement in connection with its reports on Mobile Mini’s consolidated financial statements for such years. None of the reportable events described under Item 304(a)(1)(v) of Regulation S-K occurred during Mobile Mini’s two most recent fiscal years ended December 31, 2001, or thereafter through June 10, 2002. Mobile Mini requested Arthur Andersen to furnish it with a letter addressed to the Securities and Exchange Commission stating whether it agrees with the above statements made by Mobile Mini. A copy of such letter, dated June 13, 2002, was filed as Exhibit 16.1 to Mobile Mini’s Current Report on Form 8-K, dated June 14, 2002. During Mobile Mini’s two most recent fiscal years ended December 31, 2001, and through June 10, 2002, Mobile Mini did not consult Ernst & Young with respect to any of the matters or events set forth in Item 304(a)(2) of Regulation S-K. ITEM 9A. CONTROLS AND PROCEDURES Evaluation of disclosure controls and procedures: Mobile Mini maintains disclosure controls and procedures designed to provide reasonable assurance that the information required to be disclosed in the reports that it submits to the Securities Exchange Commission is recorded, processed, summarized and reported within the time periods specified in the rules and forms of the SEC. Mobile Mini’s management, with the participation of the chief executive officer and the chief financial officer, has evaluated the effectiveness of its disclosure controls and procedures (as such term is defined in Rules 13a-15(e) and 15d-15(e) under the Securities Exchange Act of 1934) as of the end of the period covered by this report. Based on the evaluation, our chief executive officer and our chief financial officer have concluded that, as of the end of such period, Mobile Mini’s disclosure controls and procedures are effective in recording, processing, summarizing and reporting, on a timely basis, information required to be disclosed by Mobile Mini in the reports it files or submits under the Exchange Act. Changes in internal controls: There were no significant changes in Mobile Mini’s internal controls over financial reporting (as such term is defined in Rules 13a-15(f) and 15d-15(f) under the Securities Exchange Act) subsequent to the date of Mobile Mini’s evaluation that have materially affected, or are reasonably likely to materially affect, Mobile Mini’s internal control over financial reporting.
PART III
ITEM 10. DIRECTORS AND EXECUTIVE OFFICERS OF THE REGISTRANT. The information set forth in our 2004 Proxy Statement under the heading “Election of Directors” is incorporated herein by reference. ITEM 11. EXECUTIVE COMPENSATION. The information set forth in our 2004 Proxy Statement under the heading “Executive Compensation” is incorporated herein by reference. ITEM 12. SECURITY OWNERSHIP OF CERTAIN BENEFICIAL OWNERS AND MANAGEMENT. The information set forth in our 2004 Proxy Statement under the headings “Security Ownership by Management and Other Stockholders” and “Equity Compensation Plan Information” is incorporated herein by reference.

65
ITEM 13. CERTAIN RELATIONSHIPS AND RELATED TRANSACTIONS. The information set forth in our 2004 Proxy Statement under the caption “Related Party Transactions” is incorporated herein by reference. ITEM 14. PRINCIPAL ACCOUNTANT FEES AND SERVICES. The information set forth in our 2004 Proxy Statement under the caption “Fees Billed by Independent Public Accountants” is incorporated herein by reference.
PART IV
ITEM 15. EXHIBITS, FINANCIAL STATEMENT SCHEDULES AND REPORTS ON FORM 8-K (a) Documents filed as part of this Report:
(1) The financial statements required to be included in this Report are included in ITEM 8 of this Report. (2) The following financial statement schedule for the years ended December 31, 2001, 2002 and 2003 is
filed with our annual report on Form 10-K for fiscal year ended December 31, 2003:
Schedule II – Valuation and Qualifying Accounts All other schedules have been omitted because they are not applicable or not required.
(3) Exhibits
Exhibit Number Description Page
3.1 Amended and Restated Certificate of Incorporation of Mobile Mini, Inc. (Incorporated by reference to the Registrant’s Report on Form 10-K for the fiscal year ended December 31, 1997).
3.1.1 Certificate of Amendment, dated July 20, 2000, to the Amended and Restated Certificate of Incorporation of the Registrant (Incorporated by reference to the Registrant’s Report on Form 10-Q for the quarter ended June 30, 2000).
3.1.2 Certificate of Designation, Preferences and Rights of Series C Junior Participating Preferred Stock of Mobile Mini, Inc., dated December 17, 1999 (Incorporated by reference to the Registrant’s Report on Form 8-K dated December 13, 1999)
3.2 Amended and Restated By-laws of Mobile Mini, Inc., adopted February 14, 2000. (Incorporated by reference to the Registrant’s Report on Form 10-K for the fiscal year ended December 31, 1999.)
4.1 Form of Common Stock Certificate. (Filed herewith.) 4.2 Rights Agreement, dated as of December 9, 1999, between Mobile Mini, Inc.
and Norwest Bank Minnesota, NA, as Rights Agent. (Incorporated by reference to the Registrant’s Report on Form 8-K dated December 13, 1999.)
4.3 Indenture, dated as of June 26, 2003, among Mobile Mini, Inc., the Guarantors named therein, and Wells Fargo Bank Minnesota, N.A., as Trustee. (Incorporated by reference to Exhibit 4.3 to the Registrant’s Registration Statement on Form S-4 filed on July 25, 2003 (No. 333-107373).)
10.1 Mobile Mini, Inc. Amended and Restated 1994 Stock Option Plan. (Incorporated by reference to the Registrant’s Report on Form 10-K for the fiscal year ended December 31, 1997.)
10.2 Mobile Mini, Inc. Amended and Restated 1999 Stock Option Plan (as amended through March 25, 2003). (Incorporated by reference to Appendix B of the Registrant’s Definitive Proxy Statement for its 2003 annual meeting of shareholders, filed with the Commission on April 11, 2003 under cover of

66
Schedule 14A.) 10.3.1 Amended and Restated Loan and Security Agreement, dated as of June 26,
2003, among Mobile Mini, Inc., each of the financial institutions a signatory thereto, together with assigns, as Lenders, and Fleet Capital Corporation, as Agent. (Incorporated by reference to Exhibit 10.3.1 to the Registrant’s Registration Statement on Form S-4 filed on July 25, 2003 (No. 333-107373).)
10.3.2 Subsidiary Security Agreement, dated February 11, 2002 by each subsidiary of Mobile Mini, Inc. and Fleet Capital Corporation, as Agent. (Incorporated by reference to the Registrant’s Report on Form 10-K for the fiscal year ended December 31, 2001.)
10.3.3 Pledge Agreement, dated February 11, 2002 by Mobile Mini, Inc., each of its subsidiaries and Fleet Capital Corporation, as Agent. (Incorporated by reference to the Registrant’s Report on Form 10-K for the fiscal year ended December 31, 2001.)
10.3.4 Guaranty by each subsidiary of Mobile Mini, Inc. to Fleet Capital Corporation, as Agent. (Incorporated by reference to the Registrant’s Report on Form 10-K for the fiscal year ended December 31, 2001.)
10.3.5 First Amendment to Amended and Restated Loan and Security Agreement, dated January 14, 2004. (Filed herewith.)
10.4 Lease Agreement by and between Steven G. Bunger, Michael J. Bunger, Carolyn A. Clawson, Jennifer J. Blackwell, Susan E. Bunger and Mobile Mini Storage Systems dated January 1, 1994. (Incorporated by reference to the Registrant’s Registration Statement on Form SB-2 (No. 33-71528-LA), as amended.)
10.5 Lease Agreement by and between Steven G. Bunger, Michael J. Bunger, Carolyn A. Clawson, Jennifer J. Blackwell, Susan E. Bunger and Mobile Mini Storage Systems dated January 1, 1994. (Incorporated by reference to the Registrant’s Registration Statement on Form SB-2 (No. 33-71528-LA), as amended.)
10.6 Lease Agreement by and between Steven G. Bunger, Michael J. Bunger, Carolyn A. Clawson, Jennifer J. Blackwell, Susan E. Bunger and Mobile Mini Storage Systems dated January 1, 1994. (Incorporated by reference to the Registrant’s Registration Statement on Form SB-2 (No. 33-71528-LA), as amended.)
10.7 Lease Agreement by and between Mobile Mini Systems, Inc. and Mobile Mini Storage Systems dated January 1, 1994. (Incorporated by reference to the Registrant’s Registration Statement on Form SB-2 (No. 33-71528-LA), as amended.)
10.8 Amendment to Lease Agreement by and between Steven G. Bunger, Michael J. Bunger, Carolyn A. Clawson, Jennifer J. Blackwell, Susan E. Bunger and Mobile Mini Storage Systems dated August 15, 1994. (Incorporated by reference to the Registrant’s Report on Form 10-QSB for the quarter ended September 30, 1994.)
10.9 Amendment to Lease Agreement by and between Steven G. Bunger, Michael J. Bunger, Carolyn A. Clawson, Jennifer J. Blackwell, Susan E. Bunger and Mobile Mini Storage Systems dated August 15, 1994. (Incorporated by reference to the Registrant’s Report on Form 10-QSB for the quarter ended September 30, 1994.)
10.10 Amendment to Lease Agreement by and between Steven G. Bunger, Michael J. Bunger, Carolyn A. Clawson, Jennifer J. Blackwell, Susan E. Bunger and Mobile Mini Storage Systems dated August 15, 1994. (Incorporated by reference to the Registrant’s Report on Form 10-QSB for the quarter ended September 30, 1994.)
10.11 Amendment to Lease Agreement by and between Mobile Mini Systems, Inc., a California corporation, and the Registrant dated December 30, 1994. (Incorporated by reference to the Registrant’s Report on Form 10-KSB for the fiscal year ended December 31, 1994.)
10.12 Lease Agreement by and between Richard E. and Barbara M. Bunger and the Registrant dated November 1, 1995. (Incorporated by reference to the Registrant’s Report on Form 10-KSB for the fiscal year ended December 31, 1995.)

67
10.13 Amendment to Lease Agreement by and between Richard E. and Barbara M. Bunger and the Registrant dated November 1, 1995. (Incorporated by reference to the Registrant’s Report on Form 10-KSB for the fiscal year ended December 31, 1995.)
10.14 Amendment No. 2 to Lease Agreement between Mobile Mini Systems, Inc. and the Registrant. (Incorporated by reference to the Registrant’s Report on Form 10-K for the fiscal year ended December 31, 1997.)
10.15 Employment Agreement dated September 22, 1999 between Mobile Mini, Inc. and Steven G. Bunger. (Filed herewith.)
10.16 Employment Agreement dated September 22, 1999 between Mobile Mini, Inc. and Lawrence Trachtenberg. (Filed herewith.)
10.17 Second Amendment to Lease, made and entered into effective as of December 31, 2003, by and between CAZ Enterprises, L.L.C. (successor in interest to Steven G. Bunger, Michael J. Bunger, Carolyn A. Clawson, Jennifer J. Blackwell and Susan E. Bunger), as Landlord, and Mobile Mini, Inc., as successor in interest to Mobile Mini Storage Systems, as Tenant [relates to premises identified as 3848 South 36th Street, Phoenix, Arizona]. (Filed herewith).
10.18 Second Amendment to Lease, made and entered into effective as of December 31, 2003, by and between CAZ Enterprises, L.L.C. (successor in interest to Steven G. Bunger, Michael J. Bunger, Carolyn A. Clawson, Jennifer J. Blackwell and Susan E. Bunger), as Landlord, and Mobile Mini, Inc., as successor in interest to Mobile Mini Storage Systems, as Tenant [relates to premises identified as 3434 East Wood Street, Phoenix, Arizona]. (Filed herewith).
10.19 Second Amendment to Lease, made and entered into effective as of December 31, 2003, by and between Three and Two Enterprises, L.L.C. (successor in interest to Steven G. Bunger, Michael J. Bunger, Carolyn A. Clawson, Jennifer J. Blackwell and Susan E. Bunger), as Landlord, and Mobile Mini, Inc., as successor in interest to Mobile Mini Storage Systems, as Tenant [relates to premises identified as 1485 West Glenn, Tucson, Arizona]. (Filed herewith).
21 Subsidiaries of Mobile Mini, Inc. (Filed herewith.) 23.1 Consent of Ernst & Young LLP, Independent Auditors. (Filed herewith.) 23.2 Information Regarding Consent of Arthur Andersen LLP. (Filed herewith.) 31.1 Certification of Chief Executive Officer pursuant to Item 601(b)(31) of
Regulation S-K. (Filed herewith).
31.2 Certification of Chief Financial Officer pursuant to Item 601(b)(31) of Regulation S-K. (Filed herewith).
32.1 Certification of Chief Executive Officer and Chief Financial Officer pursuant to Item 601(b)(32) of Regulation S-K. (Filed herewith).
(b) Reports on Form 8-K:
We filed a report on Form 8-K filed October 29, 2003, related to our announcement of third quarter 2003 results of operations. We filed a report on Form 8-K filed December 22, 2003, related to our announcement of a Florida appellate court decision. We filed a report on Form 8-K filed December 23, 2003, related to our announcement of Exchange Offering of $150 million principal amount of our 9½% Senior Notes due 2013.

68
SIGNATURES
Pursuant to the requirements of Section 13 or 15(d) of the Securities Exchange Act of 1934, the registrant has duly caused this report to be signed on its behalf by the undersigned, thereunto duly authorized.
MOBILE MINI INC.
Date: March 15, 2004 By: /s/ Steven G. Bunger Steven G. Bunger, President
Pursuant to the requirements of the Securities Exchange Act of 1934, this report has been signed by the following persons on behalf of the registrant and in the capacities and on the dates indicated.
Date: March 15, 2004 By: /s/ Steven G. Bunger Steven G. Bunger, President, Chief Executive Officer and Director (Principal Executive Officer) Date: March 15, 2004 By: /s/ Lawrence Trachtenberg Lawrence Trachtenberg, Executive Vice President, Chief Financial Officer and Director (Principal Financial Officer) Date: March 15, 2004 By: /s/ Deborah K. Keeley Deborah K. Keeley, Vice President and Controller (Principal Accounting Officer) Date: March 15, 2004 By: /s/ Carolyn A. Clawson Carolyn A. Clawson, Director Date: March 15, 2004 By: /s/ Thomas R. Graunke Thomas R. Graunke, Director Date: March 15, 2004 By: /s/ Ronald J. Marusiak Ronald J. Marusiak, Director Date: March 15, 2004 By: /s/ Stephen A McConnell Stephen A McConnell, Director Date: March 15, 2004 By: /s/ Michael L. Watts Michael L. Watts, Director

69
SCHEDULE II
MOBILE MINI, INC.
VALUATION AND QUALIFYING ACCOUNTS
For the years ended December 31,
2001 2002 2003 Allowance for doubtful accounts:
Balance at beginning of year $ 1,617,958 $ 2,280,408 $ 2,131,097 Provision charged to expense 2,286,095 2,021,797 2,359,830 Write-offs (1,623,645) (2,171,108) (2,388,450) Balance at end of year $ 2,280,408 $ 2,131,097 $ 2,102,477
70
Exhibit 31.1 CERTIFICATION
I, Steven G. Bunger, certify that:
1. I have reviewed this annual report on Form 10-K of Mobile Mini, Inc.;
2. Based on my knowledge, this annual report does not contain any untrue statement of material fact or omit to state a material fact necessary to make the statements made, in light of the circumstances under which such statements were made, not misleading with respect to the period covered by this annual report;
3. Based on my knowledge, the financial statements, and other financial information included in this annual report, fairly present in all material respects the financial condition, results of operations and cash flows of the registrant as of, and for, the periods presented in this annual report;
4. The registrant’s other certifying officer(s) and I are responsible for establishing and maintaining disclosure controls and procedures (as defined in Exchange Act Rules 13a-15(e) and 15d-15(e)) for the registrant and have:
a) Designed such disclosure controls and procedures, or caused such disclosure controls and procedures to be designed under our supervision, to ensure that material information relating to the registrant, including its consolidated subsidiaries, is made known to us by others within those entities, particularly during the period in which this report is being prepared;
b) Evaluated the effectiveness of the registrant’s disclosure controls and procedures and presented in this report our conclusions about the effectiveness of the disclosure controls and procedures, as of the end of the period covered by this report based on such evaluation and
c) Disclosed in this report any change in the registrant’s internal control over financial reporting that occurred during the registrant’s most recent fiscal quarter (the registrant’s fourth fiscal quarter in the case of an annual report) that has materially affected, or is reasonably likely to materially affect, the registrant’s internal control over financial reporting; and
5. The registrant’s other certifying officer(s) and I have disclosed, based on our most recent evaluation of internal control over financial reporting, to the registrant’s auditors and the audit committee of the registrant’s board of directors (or persons performing the equivalent functions):
a) All significant deficiencies and material weaknesses in the design or operation of internal control over financial reporting which are reasonably likely to adversely affect the registrant’s ability to record, process, summarize and report financial information; and
b) Any fraud, whether or not material, that involves management or other employees who have a significant role in the registrant’s internal control over financial reporting.
Date: March 15, 2004 /s/ Steven G. Bunger
Steven G. Bunger Chief Executive Officer
71
Exhibit 31.2 CERTIFICATION
I, Lawrence Trachtenberg, certify that: 1. I have reviewed this annual report on Form 10-K of Mobile Mini, Inc.; 2. Based on my knowledge, this annual report does not contain any untrue statement of material fact or omit to state a material
fact necessary to make the statements made, in light of the circumstances under which such statements were made, not misleading with respect to the period covered by this annual report;
3. Based on my knowledge, the financial statements, and other financial information included in this annual report, fairly
present in all material respects the financial condition, results of operations and cash flows of the registrant as of, and for, the periods presented in this annual report;
4. The registrant’s other certifying officer(s) and I are responsible for establishing and maintaining disclosure controls and
procedures (as defined in Exchange Act Rules 13a-14 and 15d-15(e)) for the registrant and have:
a) Designed such disclosure controls and procedures, or caused such disclosure controls and procedures to be designed under our supervision, to ensure that material information relating to the registrant, including its consolidated subsidiaries, is made known to us by others within those entities, particularly during the period in which this report is being prepared;
b) Evaluated the effectiveness of the registrant’s disclosure controls and procedures and presented in this report our conclusions about the effectiveness of the disclosure controls and procedures, as of the end of the period covered by this report based on such evaluation and
c) Disclosed in this report any change in the registrant’s internal control over financial reporting that occurred during the registrant’s most recent fiscal quarter (the registrant’s fourth fiscal quarter in the case of an annual report) that has materially affected, or is reasonably likely to materially affect, the registrant’s internal control over financial reporting; and
5. The registrant’s other certifying officer(s) and I have disclosed, based on our most recent evaluation of internal control over financial reporting, to the registrant’s auditors and the audit committee of the registrant’s board of directors (or persons performing the equivalent functions):
a) All significant deficiencies and material weaknesses in the design or operation of internal control over financial reporting which are reasonably likely to adversely affect the registrant’s ability to record, process, summarize and report financial information; and
b) Any fraud, whether or not material, that involves management or other employees who have a significant role in the registrant’s internal control over financial reporting.
Date: March 15, 2004 /s/ Lawrence Trachtenberg
Lawrence Trachtenberg Chief Financial Officer

72
Exhibit 32.1
CERTIFICATION PURSUANT TO 18 U.S.C. SECTION 1350,
AS ADOPTED PURSUANT TO SECTION 906 OF THE SARBANES-OXLEY ACT OF 2002
In connection with the annual report of Mobile Mini, Inc. (the “Company”) on Form 10-K for the year ending December 31, 2003, as filed with the Securities and Exchange Commission on the date hereof (the “Report”), we, Steven G. Bunger, Chief Executive Officer of the Company and Lawrence Trachtenberg, Chief Financial Officer of the Company, each, certify, to the best of our knowledge, pursuant to 18 U.S.C. Section 1350, as adopted pursuant to Section 906 of the Sarbanes-Oxley Act of 2002, that:
(1) The Report fully complies with the requirements of Section 13(a) or 15(d) of the Securities Exchange Act of 1934; and
(2) The information contained in the Report fairly presents, in all material respects, the financial condition
and results of operations of the Company. /s/ Steven G. Bunger Dated: March 15, 2004 Steven G. Bunger
Chief Executive Officer Mobile Mini, Inc.
/s/ Larry Trachtenberg Dated: March 15, 2004 Larry Trachtenberg
Executive Vice President and Chief Financial Officer Mobile Mini, Inc.
This certification accompanies this Report on Form 10-K pursuant to Section 906 of the Sarbanes-Oxley Act of 2002 and shall not, except to the extent required by such Act, be deemed filed by Mobile Mini, Inc. for purposes of Section 18 of the Securities Exchange Act of 1934, as amended (the “Exchange Act”). Such certification will not be deemed to be incorporated by reference into any filing under the Securities Act of 1933, as amended, or the Exchange Act, except to the extent that Mobile Mini, Inc. specifically incorporates it by reference.
A signed original of this written statement required by Section 906 has been provided to Mobile Mini, Inc. and will be retained by Mobile Mini, Inc. and furnished to the Securities and Exchange Commission or its staff upon request.

Mobile Mini, Inc.’s 2003 Annual Report
on Form 10-K
is available without charge from:
The Equity Group
800 Third Avenue, 36th Floor
New York, New York 10022

■
■
•
PortableStorage
Solutions
01 02 03
EARNINGS PER SHARE(diluted)
$1.34$1.38(3)(4)
$1.21(1)(2)
01 02 03
OPERATING INCOME($in millions)
$40.6$44.1(3) $44.9 (1)
01 02 03
REVENUES($in millions)
$114.7
$133.1$146.6
1 Pro forma financial information for 2003 excludes Florida litigation expense of approximately $ 5.2 million, net of income tax benefit of $3.3 million.
2 Net income for 2003 excludes debt restructuring expense of approximately $6.4 million, net of income tax benefit of $4.0 million.3 Net income for 2002 excludes debt restructuring expense of approximately $0.8 million, net of income tax benefit of $0.5 million.4 Before extraordinary item.
2003 (1) 2002 (3) 2001
Margin Analysis % of total % of total % of totalrevenues revenues revenues
EBITDA 38.2 40.2 42.6
Operating Income 30.7 33.1 35.3
Net Income 11.9 (2) 14.9 16.3
Corporate Profile
Mobile Mini, Inc. is North America’s leading provider of portable storage solutions through its total fleet of over 91,000portable storage units and portable offices. Through a Company-owned network of 47 branches located in 27 states and oneCanadian province, the Company implements a replicable operating strategy of leasing secure, high quality portable storage con-tainers and office units, to offer a diversified product line and to deliver excellent customer service.
Mobile Mini’s ongoing success in deploying this strategy stems from the Company’s consistent attention to a number of keyoperational drivers. These include expanding and strengthening its infrastructure; adding new or adapting existing products thatsolve customers’ storage problems, marketing, retaining dedicated employees and promoting from within.
Since its founding in 1983, Mobile Mini’s diligent focus on these initiatives has driven the Company’s expansion from one location to a net-work of 47 locations with nearly 300 commissioned sales people and more than 1,400 total employees. At the same time, this strategic focushas enabled the Company to build a solid financial foundation and positioned Mobile Mini, Inc. to continue its pattern of profitable growth.
Branches Coast to Coast
■ Branch Location■ Manufacturing Plant
• Corporate Headquarters
DIRECTORS AND OFFICERS
BOARD OF DIRECTORS
Steven G. BungerChairman, President and Chief Executive Officer
Lawrence TrachtenbergExecutive Vice President and Chief Financial Officer
Carolyn A. ClawsonPresident – SkilQuest, Inc.A sales and management support company
Thomas R. GraunkeCEO and President – KnowledgeNetA business e-learning company
Ronald J. MarusiakDivision President – Micro-Tronics, Inc.A precision machining and tool & die company
Stephen A McConnellPresident – Solano VenturesA private capital investment company
Michael L. WattsChairman and CEO – Sunstate Equipment Company, LLCA construction equipment rental company
CORPORATE OFFICERS
Kyle G. BlackwellSenior Vice President
Russell C. LemleySenior Vice President
Ronald E. MarshallSenior Vice President
Michael J. BungerVice President – Operations
Aric T. ClawsonVice President – Manufacturing
Deborah K. KeeleyVice President – Controller
CORPORATE INFORMATION
SHAREHOLDER INFORMATION
Investor RelationsThe Equity Group800 Third Avenue, 36th FloorNY, NY 10022-7604Telephone: 212-371-8660Fax: 212-421-1278
Transfer Agent and RegistrarWells Fargo Bank Minnesota, N.A.Shareowner Services161 N. Concord Exchange St.South St. Paul, MN 55075-1139
Independent Public AuditorsErnst & Young LLPTwo North Central Avenue, Suite 2300Phoenix, Arizona 85004-2347
Independent CounselBryan Cave LLPTwo North Central Avenue22nd Floor Phoenix, AZ 85004-4406
Corporate Office7420 South Kyrene Road, Suite 101Tempe, AZ 85283-4578Telephone: 480-894-6311Fax: 480-894-6433
Recent press releases, quarterly reports and additionalinformation about Mobile Mini, Inc. can be obtainedby visiting our World Wide Web site at:www.mobilemini.com
041065a 5/11/04 7:28 AM Page 2

7402 South Kyrene RoadSuite 101Tempe, Arizona 85283Phone: 480-894-6311www.mobilemini.com
THE STORAGE AND OFFICE SOLUTIONS SPECIALISTS
2003 Annual Report
041065a 5/11/04 7:28 AM Page 1