04 and 05 capacity and smt 9115 2011.ppt
DESCRIPTION
Capacity resources and business cycles. SMT, Inc. caseTRANSCRIPT

1
ESTIMATING AND MANAGING COSTS AND REVENUES
1 and 2. Information systems: theory and practice. How and why to estimate costs?
3. Information systems and process complexity. Seligram case.
4 and 5. Capacity resources and business cycles. SMT, Inc. case.
6 and 7. Activity-based costing. Coffee Services mini-case.
8. Midterm.
9 and 10. Estimating and managing customer profitability. Infinity Bank case.
TACTICAL AND STRATEGIC DECISIONS
2
Capacity Management
Capacity has a cost, whether it is used or not
3
Capacity
• Capacity is the maximum output or producing ability of a machine, person, factory, etc.
• Capacity can be measured in physical terms
– Measure of the amount of work done
– Capacity is the measure of the maximum amount of work that can be done in a given time
4
Capacity
• Capacity = R * T
– R is the rate of output per unit of time
– T is the maximum amount of time available
• Capacity has a cost
– Cost to acquire or rent the facility, machine, operating costs, wages, utilities, insurance, etc.
– The cost is incurred even if capacity is underused
5
Measuring the Cost of Capacity
• Traditional measures do not reflect the cost of capacity usage or over capacity
– Costs are part of overhead and allocated to production
• Focus is on inventory valuation, not managing capacity
• Allocation base is chosen from five alternatives
–Theoretical
»Maximum output when operating continuously at maximum efficiency

6
Measuring the Cost of Capacity
– Practical
» Level of output under current conditions, allowing for normal downtime for setups, maintenance, vacations, etc.
– Normal
» Average level of output achieved or anticipated over several years
– Budget
» Level of output anticipated for the current year
– Actual
» Level of output actually achieved in the current year
7
Measuring the Cost of Capacity
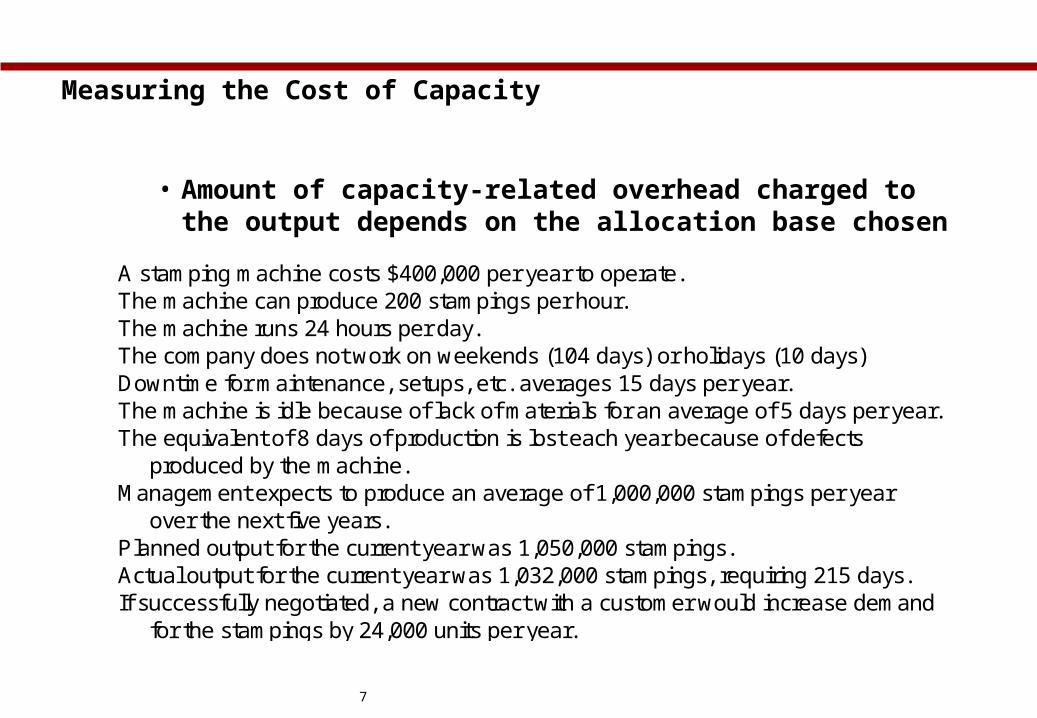
• Amount of capacity-related overhead charged to the output depends on the allocation base chosen
A stamping machine costs $400,000 per year to operate.The machine can produce 200 stampings per hour.The machine runs 24 hours per day.The company does not work on weekends (104 days) or holidays (10 days)Downtime for maintenance, setups, etc. averages 15 days per year.The machine is idle because of lack of materials for an average of 5 days per year.The equivalent of 8 days of production is lost each year because of defects produced by the machine.Management expects to produce an average of 1,000,000 stampings per year over the next five years.Planned output for the current year was 1,050,000 stampings.Actual output for the current year was 1,032,000 stampings, requiring 215 days.If successfully negotiated, a new contract with a customer would increase demand for the stampings by 24,000 units per year.

8
Measuring the Cost of Capacity
Traditional cost allocation measures
OutputOperating
costCost per
unitTheoretical capacityUnits per hour 200 Hours per day * 24 Days per year * 365 Theoretical capacity = 1,752,000 $400,000 $0.228
Practical capacityUnits per hour 200 Hours per day * 24 Operating days per year* * 231 Practical capacity = 1,108,800 $400,000 $0.361* 365-104-10-15-5=231 days
Normal capacityExpected 5 year average output 1,000,000 $400,000 $0.400
Budget capacityPlanned output for the current year 1,050,000 $400,000 $0.381
Actual capacityActual output for the current year 1,032,000 $400,000 $0.388

9
Traditional Cost AccountingTraditional Cost Accounting
The predetermined The predetermined overhead rate is based overhead rate is based on budgeted activity. on budgeted activity.
This results in applying This results in applying overhead costs of overhead costs of
unused, or idle, unused, or idle, capacity.capacity.
Activity BasedActivity BasedCostingCosting
Products are charged for Products are charged for the costs of capacity the costs of capacity they use – not for the they use – not for the costs of capacity they costs of capacity they
don’t use.don’t use.
Activity BasedActivity BasedCostingCosting
Products are charged for Products are charged for the costs of capacity the costs of capacity they use – not for the they use – not for the costs of capacity they costs of capacity they
don’t use.don’t use.
Cost of Idle Capacity

10
Difference Between ABC and Traditional Product Costs
Batch-level or product-Batch-level or product-level costs will level costs will
ordinarily shift overhead ordinarily shift overhead costs from high-volume costs from high-volume products produced in products produced in large batches to low-large batches to low-
volume products volume products produced in small produced in small
batches. batches.
Under ABC both Under ABC both manufacturing and manufacturing and nonmanufacturing nonmanufacturing
costs may be assigned costs may be assigned to products. to products.
Organization-sustaining Organization-sustaining costs and the costs of costs and the costs of idle capacity are not idle capacity are not
assigned to products.assigned to products.

11
Capacity
• Capacity can be expressed in several
ways, including:
Total labor hours.
Total machine hours.
Total units of output.

12
Alternative Denominator-Level Concepts
Theoretical capacity
Practical capacity
Normal capacity
Master-budget capacity

13
Capacity
» Theoretical Capacity: Maximum productive output possible over a given period of time.
» Practical capacity: Theoretical capacity reduced by normal, expected work stoppages.
» Normal capacity: Average annual operating capacity needed to satisfy expected sales demand.
» Master-budget capacity: the expected level of capacity utilization for the current budget period
» Excess Capacity: Extra machinery and equipment available when regular facilities are being repaired or when expected volume is greater.
14
Budgeted Fixed ManufacturingOverhead Rate
Lloyd’s Bicycles produces bicycle partsfor domestic and foreign markets.
Fixed overhead costs are $200,000 within therelevant range of the various capacity volume.

15
Budgeted Fixed ManufacturingOverhead Rate
Assume that the theoretical capacity is10,000 machine-hours, practical capacity
is 85%, normal capacity is 75%, andmaster-budget capacity is 60%.
What is the budgeted fixed manufacturingoverhead rate at the various capacity levels?

16
Budgeted Fixed ManufacturingOverhead Rate
Theoretical 100%:$200,000 ÷ 10,000 = $20.00/machine-hour
Practical 85%:$200,000 ÷ 8,500 = $23.53/machine-hour
Normal 75%:$200,000 ÷ 7,500 = $26.67/machine-hour
Master-budget 60%:$200,000 ÷ 6,000 = $33.33/machine-hour
17
Choosing a capacity level
Understand the major factorsmanagement considers in choosing
a capacity level to compute thebudgeted fixed overhead cost rate.

18
Choosing a Capacity Level
What factors are consideredin choosing a capacity level?
Productcosting
Pricingdecision
Performanceevaluation
Financialstatements
Regulatoryrequirements
Difficulty

19
Decision Making
Assume that Lloyd’s Bicycles’ standardhours are 2 hours per unit.
What is the budgeted fixed manufacturingoverhead cost per unit?

20
Decision Making
Theoretical capacity: $20 × 2 = $40.00
Practical capacity: $23.53 × 2 = $47.06
Normal capacity: $26.67 × 2 = $53.34
Master-budget capacity: $33.33 × 2 = $66.66

21
Explain how the capacitylevel chosen to calculate
the budgeted fixed overheadcost rate affects the
production-volume variance.

22
Effect on Financial Statements
Assume that Lloyd’s Bicycles actually used8,400 machine-hours during the year.
What is the production volume variance?

23
Production Volume Variance
Production volume variance= (Denominator level – Actual level)
× Budgeted fixed manufacturing overhead rate
Theoretical capacity:(10,000 – 8,400) × $20.00 = $32,000 U
Practical capacity:(8,500 – 8,400) × $23.53 = $2,353 U

24
Production Volume Variance
Normal capacity:(7,500 – 8,400) × $26.67 = $24,003
Master-budget capacity:(6,000 – 8,400) × $33.33 = $79,992
25
Death Spiral
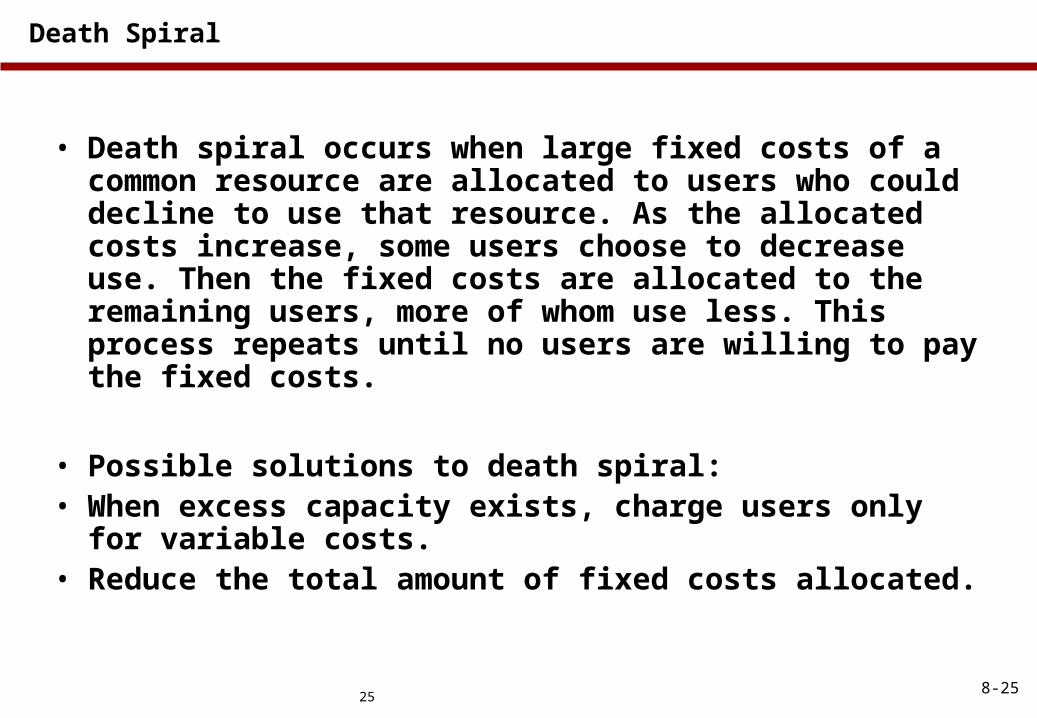
• Death spiral occurs when large fixed costs of a common resource are allocated to users who could decline to use that resource. As the allocated costs increase, some users choose to decrease use. Then the fixed costs are allocated to the remaining users, more of whom use less. This process repeats until no users are willing to pay the fixed costs.
• Possible solutions to death spiral:• When excess capacity exists, charge users only for
variable costs.• Reduce the total amount of fixed costs allocated.
8-25
26
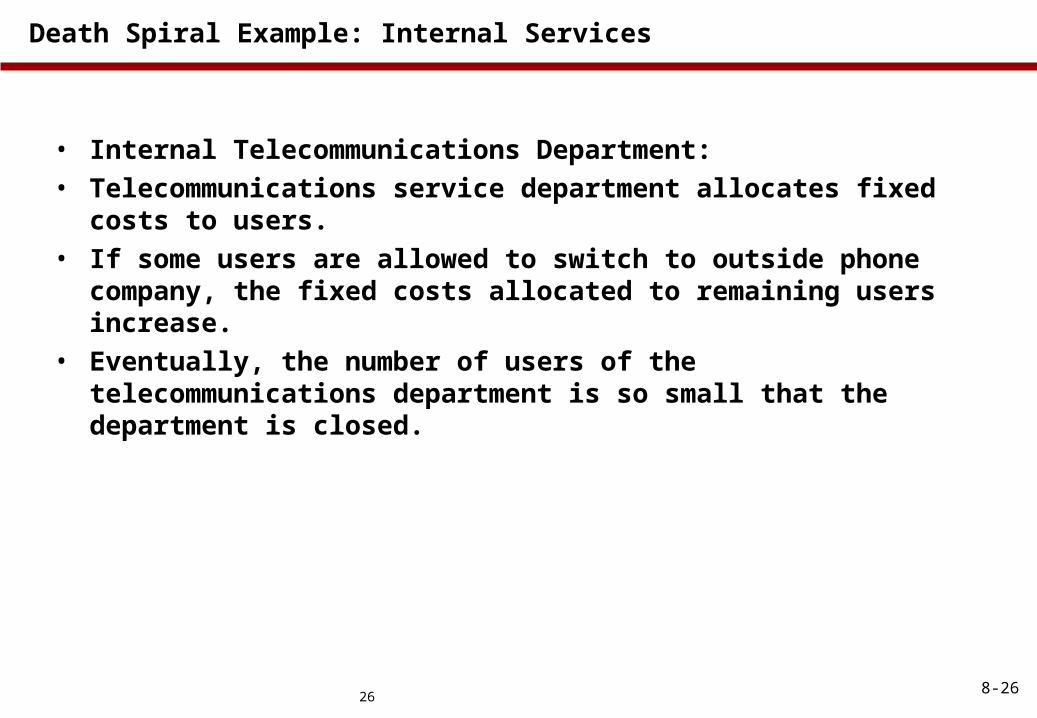
Death Spiral Example: Internal Services
• Internal Telecommunications Department:• Telecommunications service department allocates fixed costs to
users. • If some users are allowed to switch to outside phone company, the
fixed costs allocated to remaining users increase.• Eventually, the number of users of the telecommunications
department is so small that the department is closed.
8-26

27
Death Spiral Example: Cost-based Contracts
• Military Aircraft (not in text):• Defense contractors working on advanced
technology incur large fixed cost over-runs that are allocated to each aircraft manufactured.
• Government reduces number of aircraft purchased and that causes average cost to increase on remaining orders.
• Government responds by ordering even fewer aircraft.
• Eventually, the entire project is abandoned before all fixed costs are recovered.
8-27

28
Death Spiral in Reverse!
• Clay Sprays:• Increasing the allocation base for fixed costs can
lead to misleading product line profit figures.• Decisions should be consistent with an overall
economic strategy and a meaningful understanding of the impacts of accounting practices.
• “I left this to the accountants” would not cut it in today’s business environment.
8-28

29
Illustration of decision-making pitfall:
consequence of normal absorption costing;
particularly dangerous in cyclical industries.
Intro to measuring and managing capacity resources:
for decision support;
to generate signals for management attention.
One solution: practical capacity approaches.
PRIMARY CASE-STUDY OBJECTIVES

30
1997 1998 1999 2000 2001
Budgeted line 6 OH (000s) 2 512$ 2 520$ 2 696$ 2 678$ 2 768$ Expected line 6 MHs 4 380 7 008 7 183 5 256 3 504
OH Rate/MH 574$ 360$ 375$ 510$ 790$
Sunnyvale Line 6 Annual OH Rates
SMT OH RATES – Sunnyvale Line 6
31
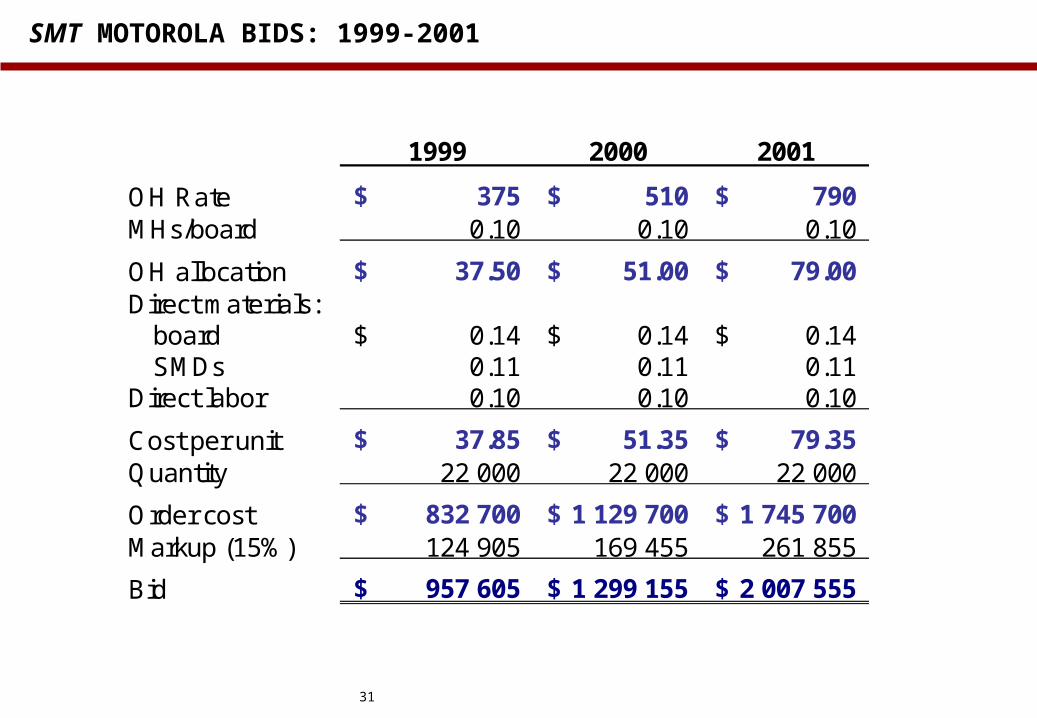
1999 2000 2001
OH Rate 375$ 510$ 790$ MHs/board 0.10 0.10 0.10
OH allocation 37.50$ 51.00$ 79.00$ Direct materials: board 0.14$ 0.14$ 0.14$ SMDs 0.11 0.11 0.11
Direct labor 0.10 0.10 0.10
Cost per unit 37.85$ 51.35$ 79.35$ Quantity 22 000 22 000 22 000
Order cost 832 700$ 1 129 700$ 1 745 700$ Markup (15%) 124 905 169 455 261 855
Bid 957 605$ 1 299 155$ 2 007 555$
SMT MOTOROLA BIDS: 1999-2001

32
Selling price = $107. Annual volume about 10 000.
Materials content $1.32. Labor $0.31.
Processing requirements 0.2 MHs / unit.
Profitability of this contract from 1999 - 2001?
PROJECT HP-HDC-32

33
1999 2000 2001
MHs per unit 0.2 0.2 0.2OH Rate 375$ 510$ 790$
OH allocation 75$ 102$ 158$ DM 1.32 1.32 1.32DL 0.31 0.31 0.31
Product cost 77$ 104$ 160$
Price 107$ 107$ 107$
Profit/unit 30$ 3$ (53)$
Annual volume 10 000 10 000 10 000
Annual profit 303 700$ 33 700$ (526 300)$
Annual revenues 1 070 000$ 1 070 000$ 1 070 000$
PROJECT HP-HDC-32

SALES VOLUMES
MACRO, INDUSTRY,COMPETITION, OTHERREASONS
OH RATES
REPORTED PRODUCTCOSTS
OH COSTS DO NOT
DECREASEAS FAST
AS VOLUMES
PRICES ?
CUT
PRODUCTS?
34

35
€0
€2,000,000
€4,000,000
€6,000,000
€8,000,000
€10,000,000
€12,000,000
200
400
600
800
1,00
01,
200
1,40
01,
600
1,80
02,
000
UNITS
Current operations
EXAMPLE

36
EXAMPLE
2,000 Units Forecast.
€ 10,000,000 / 2,000 = € 5,000 Cost Per Unit
Competitor enters our market; we lose 700 units, expect 1,300 units next year. 1,300 Units Forecast.
€ 10,000,000 / 1,300 = € 7,692 Cost Per Unit
Problems?

EXAMPLE: OVERHEAD ESTIMATION USING PRACTICAL CAPACITY —
€ 5,000 COST PER UNIT REGARDLESS OF EXPECTED PRODUCTION
37
€0
€2,000,000
€4,000,000
€6,000,000
€8,000,000
€10,000,000
€12,000,000
200
400
600
800
1,00
01,
200
1,40
01,
600
1,80
02,
000
UNITS

€0
€2,000,000
€4,000,000
€6,000,000
€8,000,000
€10,000,000
€12,000,000
200
400
600
800
1,00
01,
200
1,40
01,
600
1,80
02,
000
UNITS
€ 6.5 Million
USEDcapacity
€ 3.5 Million
EXCESScapacity
EXAMPLE: OVERHEAD ESTIMATION USING PRACTICAL CAPACITY —
€ 5,000 COST PER UNIT; 1,300 UNITS FORECAST
38

39
SMT: OH RATES WITH PRACTICAL CAPACITY
1997 1998 1999 2000 2001
Line 6 overhead 2,512,000$ 2,520,000$ 2,696,000$ 2,678,000$ 2,768,000$ Practical capacity (MHs) 7,066 7,014 7,186 6,986 7,256
OH Rate / MH $356 $359 $375 $383 $381

40
1999 2000 2001
OH Rate 375$ 383$ 381$ MHs/board 0.10 0.10 0.10
OH allocation 37.50$ 38.30$ 38.10$ Direct materials: board 0.14$ 0.14$ 0.14$ SMDs 0.11 0.11 0.11
Direct labor 0.10 0.10 0.10
Cost per unit 37.85$ 38.65$ 38.45$ Quantity 22 000 22 000 22 000
Order cost 832 700$ 850 300$ 845 900$ Markup (15%) 124 905 127 545 126 885
Bid 957 605$ 977 845$ 972 785$
Motorola bid MOT-F-23
BIDS WITH PRACTICAL CAPACITY RATES

41
EXCESS CAPACITY REPORTS
1997 1998 1999 2000 2001
Good production 4 380 7 008 7 183 5 256 3 504 Practical capacity 7 066 7 014 7 186 6 986 7 256
Utilization % 62% 100% 100% 75% 48%
Excess capacity:Machine hours 2 686 6 3 1 730 3 752 Rate 356$ 359$ 375$ 383$ 381$
Excess capacity 956 216$ 2 154$ 1 125$ 662 590$ 1 429 512$
Sunnyvale Line 6 Capacity Analysis (Forecasts)
42
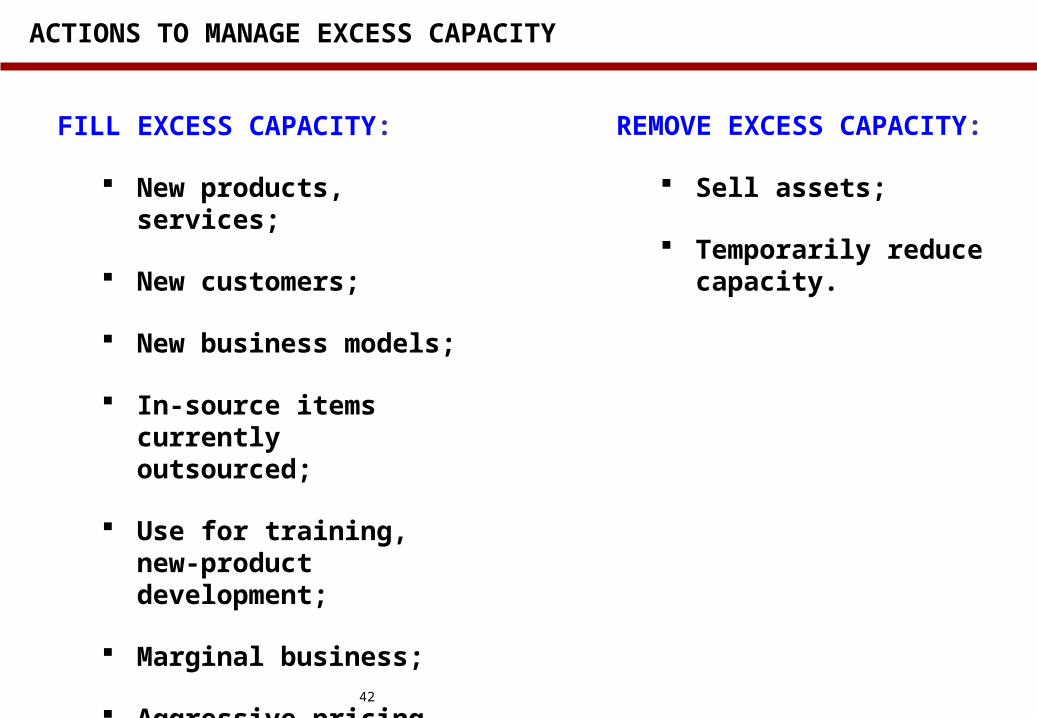
REMOVE EXCESS CAPACITY:
Sell assets;
Temporarily reduce capacity.
ACTIONS TO MANAGE EXCESS CAPACITY
FILL EXCESS CAPACITY:
New products, services;
New customers;
New business models;
In-source items currently outsourced;
Use for training, new-product development;
Marginal business;
Aggressive pricing.

43
PRACTICAL CAPACITY ADVANTAGES
1. Avoids the “death spiral”;
2. Generates signals about our capacity utilization;
3. Avoids wild fluctuations in OH costs;
4. Products do not incorporate the cost of our inefficient capacity utilization.
Remaining problem – still doesn’t tell us:
i. why we have excess capacity;
ii. how to determine the right level of excess capacity;
iii. how to get to that level.

44
Standard OH allocation techniques introduce a common decision pitfall when industry or macroeconomic conditions change.
The death spiral is a dangerous consequence of relying on budgeted capacity utilization to allocate costs.
Practical capacity is a solution to the death-spiral problem.
In addition, practical capacity approaches generate valuable signals about underutilized capacity.
KEY TAKEAWAYS – SMT