03503: 4$*&/$& 26 2 spring 2013 cls... · advertising for cls is accepted in accordance...
TRANSCRIPT

SPRING 2013 Volume 26/Number 2
Focus: Endocrinology

ASCLS Mission/Vision Statement The American Society for Clinical Laboratory Science serves as the voice of all clinical laboratory professionals, creating a vision for the advancement of the clinical laboratory practice field, and advocating the value and role of the profession ensuring safe, effective, efficient, equitable, and patient centered healthcare. ASCLS MEMBER EDITORS Editor-in-Chief Bernadette Rodak MS MT(ASCP)SH Clinical Laboratory Science Program Indiana University Clarian Pathology Laboratory 6002F 350 West 11th Street Indianapolis IN 46202 317-491-6218, fax 317-491-6212 [email protected] Continuing Education Editor Suzanne Campbell, PhD, MLS(ASCP)CM STEM Project Director Medical Laboratory Technician Program Coordinator Seward County Community College/Area Technical School P.O. Box 1137 Liberal, KS 67901 [email protected] Clinical Practice Editor Perry Scanlan, PhD, MT(ASCP) Medical Technology Austin Peay State University Department of Allied Health Sciences Room D212, Sundquist Science Complex Box 4668 Clarksville TN 37044 [email protected] Research and Reports Editor Maribeth L. Flaws, Ph.D., SM(ASCP)SI Associate Chairman and Associate Professor Department of Medical Laboratory Science Rush University Medical Center 600 S Paulina Suite 1018A Chicago IL 60612 [email protected] Education Editor Elizabeth Kenimer Leibach, EdD MS MLS SBB Professor Emeritus Departments of Biomedical and Radiological Technologies and Pathology Medical College of Georgia, EC 2437 Augusta, GA 30912 [email protected] Clinical Laboratory Science (ISSN 0894-959X) is published quarterly by the American Society for Clinical Laboratory Science, 1861 International Drive, Suite 200, McLean, VA 22102; (571) 748-3770. Annual Subscription Rates: USA Canada Non-USA Individuals $75 $90 $140 Institutions $90 $90 $140 Questions related to subscriptions should be addressed to: [email protected]. The cost of single copies is $16. Requests to replace missing issues free of charge are honored up to six months after the date of issue. Send requests to ASCLS headquarters. Annual membership dues of ASCLS are $99, $40 of which is allocated to a subscription of CLS. Periodical postage paid at Bethesda, MD and other additional mailing offices.
AMERICAN SOCIETY FOR CLINICAL LABORATORY SCIENCE
1861 International Drive, Suite 200
McLean, VA 22102 (571) 748-3770 www.ascls.org
Contributing Editors Hassan, Aziz, Doha, Qatar Eileen Carreiro-Lewandowski/N Dartmouth MA George Fritsma, Birmingham, AL Peter Hu/Houston TX Deborah Josko/Newark NJ Elaine Kohane/Newark NJ Rebecca Laudicina/Chapel Hill NC Don Lehman, Newark, DE Connie Mahon/Washington DC Carol McCoy/Minneapolis MN David McGlasson, Lackland AFB, TX Mary Ann McLane, Newark, DE Isaac Montoya/Houston TX Linda Smith/San Antonio TX Patricia Tille, Brookings, SD Michelle Wright-Kanuth/Galveston TX REVIEW BOARD Suzanne Campbell/ Liberal KS Dianne Cearlock/DeKalb IL Peter Colaninno/Jamaica NY Maria Delost/Youngstown OH Jo Ann Fenn/Salt Lake City UT Maribeth Flaws/Chicago IL Ellis Frohman/St Louis MO Mildred Fuller/Norfolk VA Abraham Furman/Portland OR Lester Hardegree/Bluffton SC Denise Harmening/Baltimore MD Rita Heuetz/St Louis MO Daniel Hoefner/Elon, NC Linda Hogan/Wichita KS Deborah Josko/Newark NJ Kelly Joyner/Durham NC Linda Kasper/Indianapolis IN Elaine Keohane/Newark NJ Nancy Konopka/Gettysburg PA Robin Krefetz/Cherry Hill NJ Linda Laatsch/Milwaukee WI Kristen Landis-Pinowar/Rochester MI Hal Larsen/Lubbock TX Sandra Latshaw/Omaha NE Rebecca Laudicina/Chapel Hill NC Louann Lawrence/New Orleans LA Susan Leclair/N Dartmouth MA Marcia Lee/Oxford OH Karen McClure/Houston TX Kathy Miller/ Fisherville VA Advertising for CLS is accepted in accordance with the ad-vertising policy of the ASCLS. Contact the CLS advertising representative at (571) 748-3770. Manuscript Submissions: To encourage consistency in style, refer to guidelines in Scientific Style and Format – The Council of Science Editors Manual for Authors, Editors, and Publishers, 2006. Detailed instructions for authors are available on the ASCLS web site. Contact the CLS Editorial Office for more information.
All articles published represent the opinions of the authors and do not reflect the official policy of ASCLS or the authors’ institutions unless specified.
Microfilm and microfiche editions of CLS are available from Proquest, 300 N Zeeb Road, Ann Arbor MI 48106.
ASCLS Core Values Core Values include enhancing quality standards and patient safety; providing professional development oppor-tunities; promoting expanded roles and contributions of clinical laboratory professionals to the healthcare team; increasing the diversity in the profession; and expanding the voice and role of under-represented individuals and groups. Nicholas Moore/Chicago IL Mary Muslow/Ruston LA Harriette Nadler/King of Prussia PA Joan Prince/Milwaukee WI Margaret Reinhart/Philadelphia PA Kyle Riding/Medford MA Masih Shokrani/Dekalb IL Stephen Sodeke/Tuskegee AL James Vossler/Syracuse NY Kathy Waller/Columbus OH Mara Williams/Santa Clara CA Lori Woeste/Normal IL Michele Wright-Kanuth/Galveston TX
P.A.C.E.® Liaison
Sherry Miner/Washington DC ASCLS BOARD OF DIRECTORS 2012-2013 Linda Smith, President J. R. Constance, President-elect Catherine Otto, Past President Gilma Roncancio-Weemer, Secretary/Treasurer Susan J. Leclair, Region I Barbara Snyderman, Region II Lisa Anderson, Region III Roslyn McQueen, Region IV Debra Rodahl, Region V Suzanne Campbell, Region VI Karen Chandler, Region VII Susan Morris, Region VIII Shellie Smith, Region IX Ginger Weeden, Region X Jasmin Davis, First Year Professional Chair Lacey Campbell, Student Forum Chair ASCLS Headquarters Executive Staff Elissa Passiment, Executive Vice President EDITORIAL OFFICE AND PRODUCTION Westminster Publishers 315 Westminster Court Brandon, MS 39047 (601) 214-5028 [email protected] Executive Editor David Fowler PhD Managing Editor Myra Fowler MT(ASCP)
Correspondence related to editorial content should be mailed to: Westminster Publishers 315 Westminster Court Brandon, MS 39047 (601) 214-5028 Email: [email protected] © Copyright 2013 American Society for Clinical Laboratory
Science Inc. All rights reserved.
Inclusion in the journal of product names or author opinions does not constitute endorsement by either Clinical Laboratory Science or ASCLS.
ADDRESS CHANGES Postmaster: Send address changes to Clinical Laboratory Science 1861 International Drive, Suite 200, McLean, VA 22102 20817

CLINICAL SPRING 2013 LABORATORY VOLUME 26/NUMBER 2
SCIENCE
DIALOG AND DISCUSSION 66 Letter to the Editor
George A. Fritsma 67 Independent Practice ASCLS Position Paper
CLINICAL PRACTICE 68 Alcohol Induced Diabetic Ketoacidosis Exacerbated by an Acute Respiratory Infection with
Klebsiella pneumoniae Caleb Distel, Stephanie Jacobson, Patricia M. Tille 72 Surviving Anaphylactoid Syndrome of Pregnancy: A Case Study Brandon R. Healy, Susan Leclair 76 Myiasis: Diagnosis, Treatment and Medical Use of Maggots Nadine A. Fydryszewski 82 Clinical Laboratory Educators’ Conference 2013 Abstracts
RESEARCH AND REPORTS 89 Do Elevated Hematocrits Prolong the PT/aPTT? Melissa Austin, Chris Ferrell, Morayma Reyes 95 Sequential Assessment of Troponin in the Diagnosis of Myocardial Infarction Brandon Edwards, Irsha Washington, Lester Pretlow, Gregory Passmore, James Dias, Scott Wise 100 Causes of Historically Low Abstract Submissions for the ASCLS Annual Meeting Michelle Butina, Lester G. Pretlow, Barbara Sawyer, Frank J. Scarano, Joan Polancic
FOCUS: ENDOCRINOLOGY 106 Introduction to Endocrine Focus Series Linda S. Gorman, Janelle M. Chiasera 107 Endocrinology Review – Adrenal and Thyroid Disorders Linda S. Gorman, Janelle M. Chiasera 112 Back to the Basics: Thyroid Gland Structure, Function and Pathology Janelle M. Chiasera 118 The Adrenal Gland: Common Disease States and Suspected New Applications Linda S. Gorman
126 CONTINUING EDUCATION QUESTIONS

66 VOL 26, NO 2 SPRING 2013 CLINICAL LABORATORY SCIENCE
DIALOGUE AND DISCUSSION
Letter to the Editor GEORGE A. FRITSMA
Editor, Clin Lab Sci:
There now exists a significant 2013 update to the protocol for the Brill-Edwards ex vivo heparin therapeutic range curve provided in our Winter edition Focus series, Anticoagulant Therapy Overview.1 Since the ex vivo curve was introduced in 1993, our combined conventional wisdom has required that we assay at least 50 non-Coumadin heparin specimens to produce a valid curve.2 The 50-specimen requirement also appears in CLSI document H47-A2.3 Interpreting data from an elegant experiment, Marlar and Gausman have concluded that the absolute minimum number of samples for an accurate heparin therapeutic range is only 20, and the optimum is 30, provided that fewer than 10% of the samples are collected from the same patient.4 Reducing the specimen demand by half eases the lab scientist’s burden for identifying, dispensing, and storing heparin samples, a concern especially for
small laboratories, without compromising the validity of the heparin therapeutic range. Please consider this new conclusion as you prepare and update your Brill-Edwards curves.
George A. Fritsma, MS MT (ASCP)
1. Fritsma GA, Anti-Xa inhibitors, from heparin to Eliquis. ClinLab Sci 2013;26:48–53.
2. Brill-Edwards P, Ginsberg JS, Johnston M, Hirsh J.Establishing a therapeutic range for heparin therapy. AnnIntern Med 1993;119:104–9.
3. Clinical and Laboratory Standards Institute (CLSI). One-StageProthrombin Time (PT) and Activated Partial ThromboplastinTime (APTT) Test; Approved Guideline—Second Edition.CLSI document H47-A2. CLSI, Wayne, PA, 2008.
4. Marlar RA, Gausman J: The optimum number and types ofplasma samples necessary for an accurate activated partialthromboplastin time–based heparin therapeutic range, ArchPathol Lab Med 2013;137:77−82.

VOL 26, NO 2 SPRING 2013 CLINICAL LABORATORY SCIENCE 67
DIALOGUE AND DISCUSSION
Independent Practice It is the position of the American Society for Clinical Laboratory Science (ASCLS) that clinical laboratory testing is the defined practice of qualified medical laboratory professionals and encompasses the design, performance, evaluation, reporting, interpreting, and clinical correlation of clinical laboratory testing, and the management of all aspects of these services. As healthcare professionals, medical laboratory scientists have the required knowledge and skills to perform, correlate, and interpret laboratory tests, supervise and direct clinical laboratories, and educate medical laboratory professionals. Medical laboratory scientists as members of the healthcare team, collaborate in the diagnosis and treatment of patients by implementing initial and reflex algorithms and testing protocols within prescribed guidelines. Medical laboratory scientists assure reliable and accurate laboratory test results, disseminate clinical laboratory test information to clinicians and patients in a timely manner, and evaluate the outcome of clinical laboratory testing for each individual patient and the entire healthcare system.
Medical laboratory scientists, with appropriate graduate education, can direct full-service clinical laboratories.
This function is firmly grounded in (a) applicable state law, and (b) federal regulations governing clinical laboratories under the Clinical Laboratory Improvement Amendments of 1988 and laboratory participation in Medicare and Medicaid.
Clinical Laboratory Science is a profession that practices independently as well as collaboratively with other healthcare professionals and is distinct from the practice of medicine. It is characterized by its own Body of Knowledge and Scope of Practice, certifies its own practitioners, requires of its practitioners competency in scientific, technical, managerial and scholarly principles, and high standards of performance and professional conduct. Artificial and arbitrary barriers to this practice should not be erected.
The current economic and regulatory healthcare environment benefits from expanded roles for non-physician health professionals to provide quality, cost-effective assessment, diagnosis, treatment, patient safety, appropriate utilization of laboratory services and information for healthcare consumers.
This position paper was approved by the 2012 American Society for Clinical Laboratory Science House of Delegates.

68 VOL 26, NO 2 SPRING 2013 CLINICAL LABORATORY SCIENCE
CLINICAL PRACTICE
Alcohol Induced Diabetic Ketoacidosis Exacerbated by an Acute Respiratory Infection
with Klebsiella pneumoniae
CALEB DISTEL, STEPHANIE JACOBSON, PATRICIA M. TILLE ABSTRACT Ketoacidosis is a metabolic condition that occurs as a result of an insufficient amount of insulin. The lack of insulin results in an increased release of glucose from the liver and an excess of ketone bodies as a result of the breakdown of adipose tissue. This occurs when carbohydrates are unable to be properly processed for needed energy requirements during cellular metabolism. Ketoacidosis is commonly linked to diabetes mellitus. Diabetes mellitus is a condition where the body is unable to produce the proper amount of insulin or is unable to effectively respond to insulin stimulation. Excessive alcohol use can damage the pancreas, reducing insulin secretion. Other conditions such as pneumonia or urinary tract infections can trigger the release of counter-regulatory hormones that may contribute to the decrease in insulin's activity and secretion. Symptoms of diabetic ketoacidosis often include nausea and vomiting, increased thirst and urine production, hyperglycemia, abdominal pain, shortness of breath, confusion, headache, general weakness, fatigue and increased heart rate. If left untreated, diabetic ketoacidosis can lead to more serious complications including circulatory collapse, decreased blood potassium levels, infection and cerebral edema. The following case study presents a complex condition of ketoacidosis associated with a bacterial infection compounded by the patient's history of alcohol abuse. ABBREVIATIONS: CBC - complete blood count, CMP - complete metabolic panel, IV - intravenous fluid, mg/dL-milligrams per deciliter, mmol/L - millimoles per liter, mM - milli molar, IU/L - international unit per liter, g/dL - grams per deciliter, mmHg - millimeters of mercury, pCO2 - partial pressure of carbon dioxide, CT - computed tomography, ICU - intensive care unit, µg/dL - micrograms per deciliter, ng/mL - nanograms per milliliter, U/L - units per liter, mOsm/kg - milliosmoles
per kilogram, µmol/L - micromole per liter, pKa - acid disassociation constant INDEX TERMS: Ketoacidosis, Klebsiella pneumonia, diabetes mellitus Clin Lab Sci 2013;26(2):68 Caleb Distel B.S., Medical Laboratory Science Program1 South Dakota State University, Brookings, SD Stephanie Jacobson M.S. MT(ASCP), Rapid City Regional Hospital, Rapid City SD Patricia Tille Ph.D. MT (ASCP), MLS Program, South Dakota State University, Brookings SD Address for Correspondence: Patricia Tille Ph.D. MT (ASCP), MLS Program, South Dakota State University, Box 2202, Brookings SD 57007, 605-688-6016, [email protected] PATIENT HISTORY A 30 year-old Native American male presented to the Emergency Department at 0200 complaining of nausea and vomiting. The patient has a history of alcohol abuse and reported experiencing intermittent episodes of nausea and vomiting, abdominal pain, weakness and a decrease in appetite during the past few months. Initial examination revealed a dry mouth, polyuria, polydipsia without fever and non-radiating abdominal pain in the mid-epigastric region. The patient’s previous medical history included a wrist surgery and no known drug allergies. He denied tobacco and illicit drug use and reported no alcohol use for the past month. Physical examination indicated no cervical or supraclavicular lymphadenopathy, a soft and non-tender abdomen that is not distended and normal

CLINICAL PRACTICE
VOL 26, NO 2 SPRING 2013 CLINICAL LABORATORY SCIENCE 69
extremity movement. The patients’ temperature was 36˚C, pulse was 75, respiration was 16 breaths per minute, blood pressure was 109 (systolic) over 67 (diastolic) and pulse oximetry showed 99% oxygen saturation. The patient’s eyes, lungs and heart examinations were normal. INITIAL LABORATORY ANALYSIS Initial testing included a complete blood count (CBC), complete metabolic panel (CMP), urinalysis and an arterial blood gas. Abnormal laboratory results are presented in Table 1.
Table 1. Abnormal test results of initial testing
Test Patient Result Reference Range Units Urine glucose 500 Negative mg/dL Urine ketone ≥80 Negative mg/dL Urine bilirubin Small Negative Ictotest Negative Negative AST 51 0-34 IU/L Albumin 2.7 3.4-5.0 g/dL Blood pCO2 30.4 35-45 mmHg Carbon Dioxide 16 21-32 mmol/L Anion Gap 17 3-11 mmol/L Quantitative Ketone 5.3 0.02-0.27 mM Serum Glucose 272 70-110 mg/dL ALT 67 0-65 IU/L Blood pH 7.34 7.35-7.45 Bicarbonate 16 23-29 mmol/L
Based on these results, the patient’s condition is consistent with ketoacidosis associated with underlying diabetes mellitus. Diabetic ketoacidosis results from insufficient insulin available for the metabolism of glucose. Ketoacidosis specifically is a result of an increase in the amount of ketones in the patient’s blood. The absence or reduction in insulin results in the release of free fatty acids from adipose tissue when the body is unable to metabolize carbohydrates for energy. The fatty acids are converted in the liver to ketone bodies (acetoacetate and β-hydroxybutyrate). Ketones have a low pKa (disassociation constant) that causes an increase in the body’s acidity (metabolic acidosis), which can cause extensive damage to organs if left untreated. Diabetes mellitus is a major risk factor contributing to the development of metabolic ketoacidosis. In addition, when a patient presents with a secondary infection, such as pneumonia, the demand for insulin increases as the body requires more energy to mount an effective
immune response against the ensuing invader. A variety of laboratory tests can be utilized to diagnose diabetic ketoacidosis. Arterial blood gases are performed to identify the metabolic state of the patient, and in this case acidosis. A venous blood sample is used for additional testing, including the CBC, metabolic panel to measure kidney function and electrolyte levels that are decreased during a state of dehydration. The urinalysis also provides information to substantiate excess levels of glucose in the urine, kidney damage and dehydration. An oral glucose tolerance test may also be used to diagnose the presence of diabetes. The test determines the patient’s ability to respond to ingested exogenous glucose. To perform the test, the patient must have a minimum of 150 grams of carbohydrates three days before the test is scheduled, with a 10 to 16 hour fast prior to the test.1 The patient is given a 75 gram dose of glucose orally, then the patient’s glucose level is checked every 30 minutes over a period of two hours. If the patient’s glucose level rises to above 200 mg/dL and remains at that level during the two hours, the patient is diagnosed as having diabetes mellitus. THREE YEARS LATER This patient returns to the hospital three years later, being referred from the same nearby clinic as previously. He has complaints of severe upper abdominal pain and anxiety that has lasted over the past week. He does not mention nausea, vomiting, difficulty breathing, chest pains or seizures. Arterial blood gas testing demonstrates a pH of 6.95 (7.35-7.45), a pCO2 of 10.6 mmHg (35-45) and bicarbonate of 2 mmol/L (23-29). The patient has a history of diabetes, reflux esophagitis and chronic alcohol use, although he has not been drinking for the last seven days. Physical examination shows the patient to be drowsy but rousable with deep painful stimuli and has rapid shallow mouth breathing. His blood pressure is 154 systolic over 94 diastolic, heart rate is around 135-145 beats per minute, respiratory rate is 45 breaths per minute, oxygen saturation is about 98% and the patient's temperature is 36.8˚C. He has right hypochondriac region tenderness, with normal pupil reactivity to light, no pedal edema or cyanosis. He is able to move all his extremities and has no external injuries or cranial abnormalities. The patient is tachycardic with no murmurs or gallops heard.

CLINICAL PRACTICE
70 VOL 26, NO 2 SPRING 2013 CLINICAL LABORATORY SCIENCE
The patient was quickly sent to the ICU (intensive care unit). Bicarbonate, IV (intravenous fluid) fluid and insulin were administered to stabilize him and intubated to compensate the respiratory distress. Physician orders included urine toxicology, CMP, lipid panel, serum osmolality and ketones. A CT (computed tomography) scan was performed to evaluate for gallstones and determine pancreas condition. Follow up lab results are presented in Table 2. Additional test results were within normal ranges. The patient also had a positive drug screen for opiates and cannabinoids. Over the next 6 days, the test values returned to near normal ranges. A chest X-ray revealed a bilateral infiltrate in the patient’s lungs. Culture of sputum revealed the presence of Klebsiella pneumoniae, which was successfully treated.
Table 2. Abnormal test results following repeated testing
Test Patient Result Reference Range Units WBC Count 14.7 3.7-9.6 x10³/µL Neutrophils 59 46-70 % Lymphocyte 11 15-47 % Urine Protein 100 Negative mg/dL Serum Iron 20 50-175 µg/dL TIBC 184 250-450 µg/dL Ferritin 1479.3 3-244 ng/mL Calcium 6.8 8.5-10.1 mg/dL Lipase 1083 20-342 U/L Bicarbonate 16 23-29 mmol/L Chloride 115 96-106 mmol/L CO2 4 21-32 mmol/L Anion Gap 21 3-11 mmol/L Quantitative Ketone 103.1 0.02-0.27 mM Glucose 308 70-110 mg/dL HgbA1C 13.4 4.8-6.0 % Osmolality 324 275-300 mOsm/kg Ammonia <125 <36 µmol/L Triglyceride 7391 <200 mg/dL
DISCUSSION The primary condition affecting the patient during his admissions was ketoacidosis. This condition is caused by the breakdown of body fats in order to supply cells with energy when a defect in carbohydrate metabolism occurs, usually due to a loss of insulin or insulin activity.2 Diabetes mellitus is commonly associated with the development of ketoacidosis. A decrease in the amount of insulin can be caused by an illness, which can cause the production of counter-regulatory hormones. This causes a reduction in the creation and secretion of insulin, leading to a hyperglycemic state.
Conditions that are most often associated with triggering ketoacidosis include pneumonia and urinary tract infections.3,4 Other conditions that can contribute to decreased insulin include stress, surgery, heart attack, stroke and alcohol or drug abuse. The condition usually presents with excessive thirst, increased urination, general weakness or fatigue, nausea and vomiting, abdominal pain, loss of appetite, shortness of breath with an increased respiratory rate. Outward symptoms include a fruity smelling breath, confusion, headache, muscle stiffness, low blood pressure and an increased heart rate. More specific signs include a high blood sugar level and a high urine ketone. Development of ketoacidosis begins with reduced action of insulin. Decreased production or decreased response to insulin such as that seen in diabetes mellitus causes an increase in glucagon secretion, triggering the liver to begin glycogenolysis or gluconeogenesis to increase blood glucose levels. This creates a hyperglycemic state in the patient since the carbohydrates are not being transferred into cells by insulin. The decreased insulin also causes lipolysis to increase, breaking down adipose tissue in order to supply energy for the cells.1 Ketones are formed from fat breakdown, and the accumulation of the ketones creates an acidotic state. Bicarbonate concentration shows a corresponding decrease. Alternative compensation is usually needed to buffer the ketones. This usually involves hyperventilation in order to remove CO2 from the system. The loss of bicarbonate along with the increased ketones creates an elevated anion gap in the patient’s blood.1 Eventually the glucose and ketones are flushed out through the kidneys along with an excessive amount of water, which increases electrolyte loss including potassium, magnesium and calcium. Underlying conditions may contribute to ketoacidosis by further decreasing the level of insulin in the patient or by increasing acidic products in the blood. Pancreatitis commonly contributes to ketoacidosis. Pancreatitis involves inflammation of the pancreas, which causes the enzymes to pool and damage the beta Islet of Langerhans cells, reducing the secretion of insulin.5 Excessive alcohol use may cause pancreatic inflammation by further destroying the beta pancreatic cells. Metabolism of alcohol impairs hepatic gluconeogenesis by preventing the conversion of lactate to pyruvate.6,7 This results in decreased insulin

CLINICAL PRACTICE
VOL 26, NO 2 SPRING 2013 CLINICAL LABORATORY SCIENCE 71
secretion, increased lipolysis, impaired fatty acid oxidation, ketogenesis and increased counter-regulatory hormones, all of which contribute to the ketoacidotic state. The infection with K. pneumoniae is significant. This infection in the lungs can trigger the development and release of stress hormones, including epinephrine and cortisol, which are counter-regulatory hormones against insulin. As these hormones are increased, insulin secretion is reduced, glucose entry into cells is decreased and gluconeogenesis and glycogenolysis in the liver is increased, creating a hyperglycemic state, fostering conditions that contribute to diabetic ketoacidosis. Ketoacidosis has a mortality rate in the range of 1%-10%. Death is normally caused by circulatory collapse, hypokalemia, infection or cerebral edema.8,9 Treatment of ketoacidosis involves replacing lost fluid and electrolytes using an IV. Insulin is administered in order to allow glucose to be absorbed into the cells, usually when a hyperglycemic state is above 300 mg/dL.1,10 This will also slow down the action of glucagon and lipase, which will help to reduce the amount of ketones in the blood. Bicarbonate can also be administered in order to control the patient’s acidotic state. When the cause of ketoacidosis is alcohol related, thiamin and vitamins maybe added to the IV, followed by an infusion of 5% dextrose with 0.9% saline.11,12 CONCLUSION The patient was diagnosed with diabetic ketoacidosis along with new onset diabetes during his first admission. He had a history of alcohol abuse, which contributed to his acidotic state. The patient presented with increased liver function test results that correspond to diabetic ketoacidosis, as well as alcohol damage. During his second admission, he presented with poorly controlled diabetes subsequent to diabetic ketoacidosis. The patient had an increased anion gap and decreased bicarbonate, which caused increased respiration, low pCO2 and tachycardia. The patient’s second admission was complicated with acute pancreatitis that developed
from continued alcohol use and poorly controlled diabetes. It is demonstrated by an extremely high lipase and abdominal pain. The acute pancreatitis may also be contributing to acute respiratory distress syndrome. The acute respiratory infection with K. pneumoniae exacerbated the ketoacidosis but was treated successfully. The patient’s drowsiness at admission was due to Ativan, alcohol withdrawal and severe acidosis. After the patient was treated, Gemfibrozil and Levemir insulin were prescribed to keep his triglyceride and insulin levels under control. It was also recommended that he change to a low fat diet and reduce alcohol consumption in order to prevent the reoccurrence of his ketoacidosis. He was also told to return at a later date to monitor his blood sugar and lipid levels. REFERENCES: 1. Wilson V. Diagnosis and Treatment of Diabetic Ketoacidosis.
Emerg Nurse 2012;20(7);14-9. 2. Wolfsdorf J, Craig ME, Daneman D, Dunger D, Edge J, Lee
WR et. Al. Diabetic ketoacidosis. Pediatr Diabetes 2007;8:28-43.
3. Gavrielatos G, Ioannidis I, Lionakis N. et. al. Clinical and Laboratory Characteristics of Diabetic Keotacidosis in Adult Diabetic Patients. Internet Journal of Endocrinology 2007;3:3.
4. Umpierrez GE, Kitabchi AE. Diabetic Ketoacidosis: Risk Factors and Management Strategies. Treat Endocrinol 2003;2:95-108.
5. Manikkan AT. Hyperlipasemia in Diabetic Ketoacidosis. Clin Diabetes 2013;31:31-2.
6. Hockenhull J, Dhillo W, Andrews R, Peterson S. Investigation of markers indicate and distinguish death due to Alcoholic Keotacidosis, Diabetic Ketoacidosis and Hyperosmolar Hyperglycemic State using post-mortem samples. Forensic Sci. Int. 2012;214:142-7.
7. Elliott S, Smith C, Cassidy D. The post-mortem relationship between beta-hydroxybutyrate (BHB), acetone and ethanol in ketoacidosis. Forensic Sci. Int. 2010;198:53-7.
8. Ali Z, Levine B, Ripple M, Fowler DR. Diabetic ketoacidosis: a silent death. Office of the Chief Medical Examiner, State of Maryland, Baltimore MD. 2012;33:189-93.
9. Centers for Disease Control and Prevention, Morbidity and Mortality Weekly Report MMWR. 2012;61:869-72.
10. Crump V. Hyperglycemic Crisis. RN. 2004;67:23-7. 11. Wrenn KD, Slovis CM, Minion GE, Rutkowski R. The
Syndrome of Alcoholic Ketoacidosis. Am J Med 1991;91:119-29.
12. AdroguiA, HJ, Madias NE. Management of Life-Threatening Acid-Base Disorders. N. Engl. J. Med. 1998;338:26-34.

72 VOL 26, NO 2 SPRING 2013 CLINICAL LABORATORY SCIENCE
CLINICAL PRACTICE
Surviving Anaphylactoid Syndrome of Pregnancy: A Case Study
BRANDON R. HEALY, SUSAN LECLAIR
ABSTRACT Anaphylactoid Syndrome of Pregnancy (ASP) is a rare complication of delivery in mother and/or infant during the process of birth. Known as either Anaphylactoid Syndrome of Pregnancy or Amniotic Fluid Embolism, the maternal mortality rate worldwide for this complication is between 10 and 16% while the fetal mortality rate is upwards of 30%. The majority of maternal survivors are expected to have long - term neurologic deficit. While the majority of infants will survive, the majority will also incur some form of neurologic defect. This report is of a case in which both the mother and infant survived with discharge occurring at eleven days for the mother and eighteen days for the infant.
ABBREVIATIONS: ASP - Anaphylactoid Syndrome of Pregnancy, AFE - Amniotic Fluid Embolism, DIC - Disseminated Intravascular Coagulation, FFP - Fresh Frozen Plasma
INDEX TERMS: Anaphylaxis/ therapy, Disseminated Intravascular Coagulation/ physiopathology, Embolism, Amniotic Fluid/ physiopathology, Multiple Organ Failure/ complications, Postpartum Hemorrhage, Pregnancy Complications/ physiopathology
Clin Lab Sci 2013;26(2):72
Brandon R. Healy MLS (ASCP)CM, South Shore Hospital, Weymouth, Ma
Susan Leclair PhD, Department of Medical Laboratory Science, University of Massachusetts Dartmouth, Dartmouth, MA.
Address for Correspondence: Brandon R. Healy MLS (ASCP)cm, 6 Nathaniel Way, Belchertown MA, 01007, (413) 687-9468, [email protected]
Patient History A 35-year-old Caucasian woman, 33 weeks pregnant and considered to be of high risk due to her age and four prior pregnancies, presented to the Emergency Department with complete placenta previa (abnormal positioning of placenta close to or over cervix) and bleeding. At 18 weeks gestation, both placenta previa and placental lakes (enlarged spaces in the placenta filled with maternal blood) were demonstrated by MRI. At 22 weeks another MRI was performed in order to determine if placenta accreta (abnormally deep attachment of the placenta into the myometrium) was a concern for the patient. Although there were limited views of the posterior placenta, anterior accreta was not seen. At 26 weeks a third MRI was performed and the fetus looked to be growing at a normal rate, but there was an increased number of placental lakes seen and the posterior previa is still noted, with an anterior involvement at this time. At 27 weeks the patient was admitted with vaginal bleeding and was given two doses of betamethasone (a glucocorticoid steroid) to decrease inflammation. After five days, the patient was discharged and placed on bed rest. At 30 weeks enlarged placental lakes were seen with the largest at 17 centimeters in diameter. During this visit, plans were put in place to administer “rescue steroids” at 33 weeks 5 days, and a Repeat Low Transverse Caesarian section (RLTCS) similar to a previous delivery was to be performed at 34 weeks. One day after the administration of the steroids, the woman was seen in the emergency department (ED).
Given her clinical presentation in the ED, an emergency C-section was performed. After the neonate was delivered, it was noticed that the uterus became flaccid or atonic. The patient was already on intravenous oxytocin so 0.2 mg of methylergonovine maleate was given intramuscularly to the patient. These agents firmed up the uterus slightly but blood continued to pool in the lower uterus. The patient then experienced a tonic spasm, became bradycardic and hypotensive

CLINICAL PRACTICE
VOL 26, NO 2 SPRING 2013 CLINICAL LABORATORY SCIENCE 73
signaling a complete circulatory collapse. Chest compressions were started, and an emergency hysterectomy was initiated to stop blood loss. To correct the blood loss, the patient had a central venous line placed and multiple units of compatible packed red blood cells, fresh frozen plasma, platelets and cryoprecipitate were transfused. Historical Overview First widely recognized in 1941 article by Steiner and Luschbaugh, the histopathology findings in the lungs of women dying of sudden shock during labor and delivery include amorphous eosinophilic material, mucin, and squamous cells.1 The first well-documented case of maternal survival was published by Resnik, et al in 1976.2 The syndrome can be detected during the second trimester up to 48 hours post partum. Risk factors are not consistently seen and currently this condition is not considered to be preventable.3 Table 1 lists some of the more commonly seen signs of ASP onset.
Table 1. Risk Factor Assessment of possible ASP. Some common signs of potential ASP. All of these risk factors are not consistently found in all patients.
Advanced maternal age Cervical laceration Chorioamnionitis Intrauterine fetal death Male fetal sex Multiparity Oxytocin use Previous caesarian section Placenta accreta Uterine rupture
At present, a biphasic model of pathophysiology has been proposed.4 During the initiating phase, amniotic fluid and fetal cells enter the maternal circulation stimulating biochemical mediators causing vasospasm and constriction in the pulmonary artery. The resulting pulmonary hypertension causes elevated right ventricular pressure leading to hypoxia. The cascade of myocardial and pulmonary damage causes left heart failure and acute respiratory distress syndrome. The second phase is characterized by uterine atony, hemorrhage, and disseminated intravascular coagulation. If treated properly and immediately, this syndrome is manageable, however, one of the most serious potential sequellae of this syndrome is mental
deficiency in some form, in either the mother or fetus.5 Pathogenesis The acute hypotension (cardiac arrest), acute hypoxia (respiratory arrest), and Disseminated Intravascular Coagulation (DIC) can occur during the birthing process or postpartum. In this case the patient experienced a complete cardiovascular collapse consistent with the first two criteria of the diagnosis. Soon after, the patient experienced DIC, as the entire hemostatic system was triggered as a response to systemic trauma. In the classic description of DIC, it is noted that massive hemorrhage is the first sign of this complication since the thrombi created to stop the massive bleeding are not working properly. 6 Anaphylactoid syndrome of pregnancy is often referred to as the common cause for the majority of maternal deaths during pregnancy and labor.7 This is a rare syndrome with an occurrence of between 1:8,000 to 1:83,000 births but accounts for up to eighteen percent of maternal deaths.8 This patient had a high overall risk of maternal fatality as she was within the older age group, had four previous pregnancies, a history of previous C-Sections with one planned for this pregnancy, placenta previa, large placental lakes, DIC, and massive blood volume loss. The two largest factors in successful treatment are access to available blood and/or blood products, and the speed with which they can be available and transfused. Presently, there is no laboratory tests that can be performed ahead of time in order to warn of such a reaction, and no fast acting definite treatment. There is some thought that serum tryptase can be measured to give an idea of increased risk, although most clinical laboratories do not perform this in-house. As such, while a valuable piece of evidence, it is not available in a time frame necessary for use. Tryptase is a degranulation product of basophil and mast cell stimulus that is released at the same time as histamine and other vasoactive amines that contribute to vascular collapse. Tryptase is measured using a fluoroimmunoenzymatic assay which measures total tryptase and there are multiple companies that utilize this assay. Total tryptase has a reference range of 1-15 mg/dL in normal serum. It has been seen that an increase in serum tryptase coincides with symptoms of ASP or other anaphylaxis related syndromes.9 The

CLINICAL PRACTICE
74 VOL 26, NO 2 SPRING 2013 CLINICAL LABORATORY SCIENCE
problem with using this test as a marker for the syndrome, is that the serum levels do not peak until one to two hours after the first onset of the syndrome. This along with the lengthy turn around time, makes this test more of a confirmatory test as opposed to a test to screening test. Maternal mortality rates have been reported to range from 26 to 86%.10 This vast range is due to the relatively low knowledge about this syndrome and the variety of symptoms that can be associated with this syndrome. Not every case of ASP will have all three of the major signs; hypotension, hypoxia and coagulopathy as DIC is not present in all cases. In those cases where it is present, such as this case, mortality is on the higher end of the range.2 This patient was in the group with the overall highest chances of maternal fatality due to previous C-section; 30-39 age group; DIC; more than four pregnancies; placenta previa; placental lakes; and massive blood volume loss.6 With all of these factors her chances of survival were slim. Relevant Laboratory Data Prior to admission, the patient’s blood specimen was tested and found to be Group A positive with a negative antibody screen. Four units of packed red blood cells were originally cross-matched and ready for the surgery. During the critical moments of this syndrome, most of the laboratory results are non-informative as the patient is experiencing vascular collapse at a critical rate and specimens take time to collect, transport, test, and report result. Given this, the laboratory’s value is to confirm that the treatment is working and not harming the patient. However, in this case, the availability of the first four units allowed time to prepare and release the additional components. Since one of the main problems in this case is DIC, the coagulation levels are very important. The two most critical specimens showing the severity of the patient’s DIC were taken thirty minutes apart (Table 2). The first specimen (drawn after onset of symptoms) had a Prothrombin Time (PT) of 25.7 seconds; an Activated Partial Thromboplastin Time (aPTT) of 27.6 seconds; the fibrinogen was 84 mg/dL; and the D-Dimer was above analytical range (the analyzer used has an upper analytical range of 20 mg/dL). The D-Dimer was measured on the STA-R Evolution using a photometric method. In this method when monochromatic light is
allowed to pass through the suspension of patient plasma and latex particles, the light that is detected by the sensor is used to determine the concentration in the sample.
Table 2. Laboratory Results over time during ASP
Pre-ASP Sample First Sample Second Sample drawn at 0705 Drawn at 0845 Drawn at 0915 PT (seconds) 13.1 25.7 22.1 aPTT (seconds) 23.4 27.6 68.3 Platelet Count (109/L) 213 58 136 Fibrinogen (mg/dL) 326 84 110 D-Dimer Not >Analytical >Analytical Performed Range Range Hemoglobin (g/L) 110 87 89 Hematocrit (L/L) 0.317 0.250 0.257
The second specimen had a PT of 22.1 seconds; an aPTT of 68.3 seconds; the D-Dimer was again above analytical range; and the fibrinogen was 110 mg/dL. Platelet counts were 58 x 109/L from the first specimen, and 136 x 109/L in the second specimen. All five key results support a diagnosis of DIC. The extensive blood loss caused hemoglobin and hematocrit values of 87 g/L and 0.25 L/L in the first sample and 89 g/L and 0.257 L/L in the second. These levels were significantly lower when compared to the patient’s previous hemoglobin and hematocrit results of 116g/L and 0.34 L/L, which were from the most recent prenatal checkup. The massive hemorrhage also caused a metabolic acidosis characterized by a decrease in blood pH and bicarbonate concentration. The patient’s pH dropped from 7.520 in the first sample to 7.120 within 30 minutes. The pH stayed acidic until the patient finally began to stabilize. The bicarbonate also follows this trend showing that this acidosis is caused by the excessive loss of blood.4 All of these laboratory results are typical of ASP. Treatment and Prognosis Treatment for this syndrome includes controlling the hemorrhaging, restarting the cardiovascular system, replacement of blood loss and correction of the DIC.11 Each problem needs to be dealt with separately and in order of severity. The largest issue for this patient was the massive hemorrhage. The surgeons cauterized, sutured and tied

CLINICAL PRACTICE
VOL 26, NO 2 SPRING 2013 CLINICAL LABORATORY SCIENCE 75
off any large sections of hemorrhages seen in order to slow the bleeding. The next issue to solve was the blood loss, as this may correct multiple problems at once. A central venous line was placed so that blood could be transfused. The patient received multiple units of blood and blood products in order to compensate for the massive loss. All told, 27 units of packed red blood cells, 16 units of fresh frozen plasma, three units of platelets and one unit of cryoprecipitate were used to stabilize the patient. The platelets, fresh frozen plasma and cryoprecipitate were pivotal in replacing the hemostatic components consumed by the DIC, and the packed red blood cells replaced the amount lost due to the hemorrhage and corrected the hypoxia. Patient Follow Up: Since a common secondary sequella is mental deficiency (to either mother, child, or both), a psychiatric evaluation was performed on the patient after she had recovered from this traumatic episode. She suffered from a panic attack after a minor bleeding incident when sutures were removed. For the panic attack the patient was given 0.5 mg of lorazepam. At the time of discharge, there were no noticeable mental impairments but the patient was advised to follow up with a therapist for post traumatic stress disorder (PTSD). Case Conclusion The outcome of this situation was made possible by the early notification of the laboratory to the potential of a high-risk delivery. That this notification included the evaluation of the placenta previa and increasing size of the placental lakes supported the preoperative testing of compatible blood products. The ability of the blood bank to release these units immediately upon request certainly played a role in the reestablishment of the circulatory system and in supporting minimal oxygen
saturation early on in the crisis. The timely reporting of hemostasis testing supported the medical decision to begin infusing the fresh frozen plasma, platelets and cryoprecipitate. Due to the rapid response, both mother and child survived. They were both released from the hospital within a relatively short time and at the time of discharge neither mother nor child had any adverse sequellae. The fear of delayed symptoms was eased when the patient returned for her postpartum check up and no mental disabilities were noted in mother or child. Both seemed to be in excellent physical health. REFERENCES 1. Steiner PE, Lushbaugh CC. Maternal pulmonary embolism by
amniotic fluid as a cause of obstetric shock and unexpected deaths in obstetrics. JAMA 1941;117:1245-54.
2. Resnik R, Swartz WH, Plumer MH, Benirschke K, et al. Amniotic Fluid Embolism with Survival. Obstet Gynecol 1976;47:295-8.
3. Peterson, EP, Taylor, HB. Amniotic fluid embolism. An analysis of 40 cases. Obstet Gynecol 1970;35:787.
4. Clark, SL, Montz, FJ, Phelan, JP. Hemodynamic alterations associated with amniotic fluid embolism: A reappraisal. Am J Obstet Gynecol 1985;151:617.
5. Clark, SL, Hankins, GD, Dudley, DA, et al. Amniotic fluid embolism: Analysis of the national registry. Am J Obstet Gynecol 1995;172:1158.
6. Mant MJ, King EG. Severe acute DIC. Am J Med 1979;67:557-63.
7. Gilmore DA, Wakim J, Secrest J, Rawson R. Anaphylactioid syndrome of pregnancy: A review of the literature with latest management and outcome data. AANA J 2003;71(2):120-6.
8. Stein P, Matta F, Yaekoub A. Incidence of amniotic fluid embolism: reaction to caesarian section and to age. JWH 2009;18(3):327-9.
9. Schwartz, LB. Diagnostic Value of tryptase in anaphylaxis and mastocytosis. Imunol Allergy Clin N Am; 2006;26:451-63.
10. DeJong MJ & Fausett MS. Anaphylactoid Syndrome of pregnancy: A devastating complication requiring intensive care. AJCC 2003;23(6):42-8.
11. Moore J and Baldisseri MR. Amniotic fluid embolism. Crit Care Med 2005;33:10 (Suppl.)
The peer-reviewed Clinical Practice Section seeks to publish case studies, reports, and articles that are immediately useful, are of a practical nature, or contain information that could lead to improvement in the quality of the clinical laboratory’s contribution to patient care, including brief reviews of books, computer programs, audiovisual materials, or other materials of interest to readers. Direct all inquiries to Perry Scanlan, PhD, MT(ASCP), Medical Technology, Austin Peay State University, Room D212, Sundquist Science Complex, Box 4668, Clarksville TN 37044. Clinical Laboratory Science encourages readers to respond with thoughts, questions, or comments regarding these articles. Email responses to [email protected]. In the subject line, please type the journal issue and lead author such as “CLIN LAB SCI 26(2) RE HEALY”. Selected responses may appear in the Dialogue and Discussion section in a future issue. Responses may be edited for length and clarity. We look forward to hearing from you.

76 VOL 26, NO 2 SPRING 2013 CLINICAL LABORATORY SCIENCE
CLINICAL PRACTICE
Myiasis: Diagnosis, Treatment and Medical Use of Maggots
NADINE A. FYDRYSZEWSKI
ABSTRACT Two myiasis cases are presented which illustrate aspects of this infestation, and the role of the medical laboratory scientist with regard to the importance of critical thinking, problem-solving, and interprofessional communication skills. The purpose is to heighten awareness of myiasis, and emphasize the role of the medical laboratory scientist as a member of the healthcare team in confirming diagnosis. ABBREVIATIONS: MLS - Medical Laboratory Scientist, MDT - maggot debridement therapy INDEX TERMS: myiasis, maggots, fly larva Clin Lab Sci 2013;26(2):76 Nadine A. Fydryszewski, PhD, MLS(ASCP), Rutgers, The State University of New Jersey, School of Health Related Professions, Department of Clinical Laboratory Sciences, Newark, NJ Address for Correspondence: Nadine A. Fydryszewski, PhD, MLS(ASCP) , Associate Professor, Rutgers, The State University of New Jersey, School of Health Related Professions, Department of Clinical Laboratory Sciences, 65 Bergen Street- SSB GB 20, Newark, NJ 07101, 973-972-5089, [email protected] INTRODUCTION: Myiasis refers to infestation of vertebrates by fly larva. In the United States, human infestation has been reported from rural areas where humans have increased contact with domestic and wild animals, and has also been associated with travel to tropical/sub-tropical areas.1 Though myiasis is infrequently seen in the United States, cases do occur. Myiasis presents a laboratory diagnostic challenge that requires the medical laboratory scientists (MLS) to utilize critical thinking, problem-solving, consultative and inter-professional communication skills. Two myiasis cases are presented
which illustrate the aspects of this infestation, and the role of the MLS as a member of the healthcare team in confirming diagnosis. CASE 1 A vaginal specimen from the outpatient clinic was sent to the microbiology laboratory for routine culture, and was evaluated by the medical laboratory scientist (MLS). Several cracks/tracks in the blood agar plate (BAP) were observed, and noted as possible agar contamination. The clinic was notified, a repeat specimen was sent to the lab, and after incubation cracks/tracks were again observed in the agar. Opening the cracks/tracks wider revealed small white/grayish structures embedded in the tracks. The structures where extracted, placed on a glass slide, and examined using a magnifying lens and microscope. Consultation between the MLS and the clinical pathologist confirmed the identification of the structures as fly larva (maggots). Minimal patient information was provided, and the MLS contacted the clinic to obtaining additional patient history that could assist in determining a rationale for observing fly maggots in the specimen. Patient history revealed a 42 year old homeless woman with extremely poor personal hygiene. The patient came to the clinic with symptoms of extreme discomfort in the vaginal area, as well as various other issues related to her homeless state, poor hygiene, and lack of medical care. Based on patient history and symptoms, and the identification of fly maggots from the genital area, the diagnosis of infestation of the genital tract with fly maggots, myiasis, was confirmed. CASE 2 A specimen from a pediatrician’s office was sent to the microbiology lab for ova and parasite workup. The specimen was sent in a white box that contained small white/grayish structures resting on a piece of gauze. The MLS viewed the structures using a magnifying lens and microscope, and identified the structures as fly larva. Consultation between the MLS and the clinical

CLINICAL PRACTICE
VOL 26, NO 2 SPRING 2013 CLINICAL LABORATORY SCIENCE 77
pathologist confirmed the identification of the structures as fly larva (maggots). Minimal patient information was provided, nor was the source of the structures noted. The pediatrician’s office was contacted by the MLS to obtain additional patient history that could assist in determining a rationale for observing fly maggots in the specimen. Patient history revealed an 18-year-old male with superficial abrasions on his abdomen. The small white structures sent to the lab were extracted from abdominal abrasions around the navel. Additional history noted that the patient sustained the abdominal abrasions while performing his work responsibilities. His summer employment was with the local fishing industry, mainly working on the fishing docks lifting crates, and he often worked without wearing a shirt. Based on patient history and symptoms, and the identification of fly maggots extracted from the dermal tissue, the diagnosis of myiasis was confirmed. MYIASIS: EPIDEMIOLOGY/PREVALENCE The root of the word myiasis comes from the Greek word for fly, myia.2 Myiasis is worldwide in distribution, and a common condition in wild and domestic animals.1 Though infrequently seen in humans, cases have been reported from rural areas where humans have increased contact with animals, both domestic and wild.1 In the United States most cases are associated with travel to tropical and subtropical areas, and in cases with no travel history, infestation is usually associated with wounds. The literature also documents cases of human infestation in homeless persons, and patients with conditions including alcoholism, peripheral vascular disease, and cancer, and infestation of body areas include skin, wounds, genital, intestine, oral, nasal, aural and ocular.3,4,5,6,7,8 Flies are in the Order Diptera, and several genera are associated with human myiasis.9,10 Genera associated with human infestation include Dermatobia, Cochliomyia, Chrysoma and Cordylobia, and the site of infestation and symptoms can vary based on the species and the life cycle. 9,10 Common names often used are the human bot fly (Dermatobia hominis), New World screwworm fly (Cochliomyia hominovorax), and the Old World screwworm fly (Chrysoma bezziana). The tumba fly (Cordylobia anthropophaga) is found in Africa.
Genera that primarily infest animals but may occasionally infect humans are Cuterebra, Oestrus and Wohlfahrtia.1,11
CLASSIFICATION There are several classification schemas for myiasis based on anatomical or ecological characteristics. However the anatomical model described by Bishopp and modified by James and Zumpt is considered the most practical in terms of diagnosis.12 A common modification of this schema describes myiasis as (1) Bloodsucking; (2) Cutaneous (furuncular); (3) Wound; or (4) Cavitary.13 Cutaneous (furuncular and wound) and cavitary (i.e. nasal, oral, genital, ear, etc.) myiasis are the most frequently encountered in human infection.14 In furnucular cases, lesions form at the site of penetration and resemble boils or furuncles and diagnosis is based on clinical symptoms and patient history. The larvae do periodically emerge from the lesions for respiration.15 Cavitary myiasis is associated with infestation of external body orifices and open wounds, and cause tissue necrosis with possible sequelae such as bacterial infections.16
Because of the diversity of genera and species that can cause myiasis and life cycle variations, another classification schema based on parasite-host relations and the site of infestation has also been employed. This classification method describes four major categories. Specific myiasis (obligate) refers to flies which are parasites and whose larval stage requires a host to develop and continue the life cycle. Examples include the human bot fly (Dermatobia hominis), and the tumbu fly (Cordylobia anthrolophaga).1,17 Semi-specific myiasis (facultative) refers to flies that usually develop on decaying organic matter, but may also deposit their eggs or larvae on live hosts. This category is sub-divided into three groups: Primary - in which the species can initiate infestation; Secondary - in which the species does not initiate myiasis but may be involved if the host has been infested by another species; Tertiary - may be associated with myiasis when the host is near death. Examples are the green-bottle fly (Lucilia), and the blowfly (Calliphora).1,17 Accidental myiasis refers to flies that do not have any specific requirements for a host, and larvae do not need a host for development. Eggs are accidentally deposited on the body or tissue, such as in the genital track and nasal passages (Figure 1), or larva may enter the intestinal tract. Examples are the

CLINICAL PRACTICE
78 VOL 26, NO 2 SPRING 2013 CLINICAL LABORATORY SCIENCE
common housefly (Musca domestica), and the latrine fly (Fannia).1,17 Nosocomial myiasis refers to hospitalized patients acquiring an infestation, usually in open wounds or bed sores.1,18,19,20,21,22 Figure 1. Larva from nose (VanHorn) DIAGNOSIS AND TREATMENT Diagnosis of myiasis can be challenging because of the numerous species associated with infestation, and symptom variation based on anatomical location. Misdiagnosis of myiasis is not uncommon. Symptoms are similar to other infections, ranging from a simply mosquito bite to cellulitis, impetigo, herpes zoster and parasitic infections such as Dracunculus and Leishmania.23,24 One case reported in the literature describes two athletes with myiasis infestation that were initially diagnosed as a methicillin resistant Staphylococcus aureus (MRSA) infection.25 In this case, further investigation revealed a travel history to a tropical area, emphasizing the importance of a thorough patient history which includes questions about recent travel.
The removal of the maggots from tissue can be difficult due to the anterior hooks that function as an anchor.26 (Figure 2) Preservation of maggots and mounting for observation can be performed in the laboratory. Larvae are killed by emersion in hot water, and preserved in 70% - 95% ethanol.7 Definitive speciation of the maggots involves viewing spiracular plates located on the posterior end of the larvae.17,27 Another method is to place the live maggots on raw meat in a container or petri dish with sand lining the bottom, wait for the development of the adult fly, and then view for identification.1 Though these procedures can be performed in the clinical laboratory, identification at the species level requires considerable entomological
expertise. Laboratories who do not have the expertise should consider sending the larva to a reference laboratory for speciation. An internet search of the major diagnostic reference laboratories in the United States yielded information related to arthropod and insect identification services. Alternate options are entomology reference labs and state department of health clinical laboratories. From an epidemiological perspective, full speciation may be relevant. However, issues of cost, efficient utilization and delivery of laboratory services, and relevance of speciation related to patient care and outcomes must also be considered. Figure 2. Anterior hooks of Phaenicia sp removed from surgical
wound. ( CDC-DPDx. Image courtesy of the Washing-ton State Public Health Laboratories)
The first treatment option is removal of the larvae. Coating the area with petroleum ointment (Vaseline) or other substances that are easily available such as pork fat, or raw beefsteak will restrict oxygen flow and force the larvae to surface for respiration.15 Forceps are used to extract the larvae once they surface.15,17 If this procedure is unsuccessful, surgical or vacuum extraction is recommended.28 Several reports in the literature demonstrate the successful use of ivermectin in treating human myiasis infestation.29,30,31,32,33 Ivermectin was approved by the US Food and Drug Administration (FDA) as an anthelmentic treatment for gastrointestinal roundworms, lung worms, cattle grubs, mites, lice and horn flies, but is not approved to treat human myiasis infestation.34,35 Though there are reports of success in treating human myiasis with ivermectin, the use of the drug in human myiasis infestation is off-label. The FDA does allow clinicians to prescribe medications for conditions that are unapproved by the FDA for use of a

CLINICAL PRACTICE
VOL 26, NO 2 SPRING 2013 CLINICAL LABORATORY SCIENCE 79
drug. This is referred to as off-label use of a medication.36,37 MEDICAL DEBRIDEMENT THERAPY The medical use of maggots in a controlled environment using sterilized maggots is referred to as maggot debridement therapy (MDT), larva therapy, biodebridement and/or biosurgery.38,39 MDT is, in essence, a controlled induced myiasis employed as a therapeutic approach to wound debridement. There is evidence that certain cultures and civilizations, such as the Australian aborigines, Burmese, and the Mayans, used maggots as a form of wound therapy.40,41 The literature also cites history noting the use of maggots in treating war wounds.42,43
There is renewed interest in MDT, particularly in the advent of antimicrobial resistance, and global interest in complementary and alternative medicine therapies/ strategies as alternatives to antimicrobial and chemotherapeutic agents.38,,44,45,46,47,48,49,50,51 The FDA approved the LB-01 strain of Phaenicia (Lucilia) sericata for use in medicinal maggot therapy.52 Cases have been reported of successful use of MDT in foot wounds of diabetic patients that have not responded well to conventional therapeutic regimes.53,54 The use of medicinal maggots is a cost effect treatment strategy (~$100) versus more expensive treatment options such as antimicrobial therapy and surgery.55 Research is being conducted to explore the use of sterile maggot secretions to prevent, inhibit, and break down biofilm formation in wounds and on medical devises, and efficacy has been reported with biofilms of Staphylococcus epidermidis, Staphylococcus aureus, and Pseudomonas aeruginosa.56,57,58 DISCUSSION/CONCLUSION The two cases presented were classified as accidental myiasis. Both cases demonstrate the importance of patient history as an essential component required by the medical laboratory scientist to aid in identification. Pertinent patient history, particularly in the microbiology laboratory, can aid in the decision-making process. The importance of critical thinking, problem-solving, and interprofessional communication skills, as well as a learning experience about an unusual infestation are important aspects of both cases. The cases provide a heighten awareness of myiasis, and emphasize the role of the medical laboratory scientist in diagnosis. Awareness and knowledge can increase a
medical laboratory scientist’s efficiency in confirming diagnosis as a member of the inter-professional healthcare team dedicated to patient care. ACKNOWLEDGEMENT: The author would like to acknowledge Dr. Kenneth G. Van Horn for Figure 1. REFERENCES: 1. David JT, Petri WA. Markell and Voge’s medical parasitology.
9th ed. St. Louis: Saunders; 2006. 2. Mosby's Medical Dictionary, 8th edition. 2009, Elsevier. 3. Cestari TF, Pessato S, Ramos-e-Silva M. Tungiasis and myiasis.
Clin Dermatol. 2007;25(2):158-64. 4. Bolognia JL, Jorizzo JL, Rapini R. Cutaneous myiasis. In:
Dermatology. Vol 1. 2nd ed. Mosby Elsevier; 2008. 5. Gursel M, Aldemir OS, Ozgur Z, Ataoglu A. A rare case of
gingival myiasis casued by Diptera (Calliphoridae). J Clin Periodontol 2002;29:777-80.
6. Mosheref M, Ansari G, Lotfi A. Oral gingival myiasis – A case report. Int J Trop Med. 2008;3:97–100.
7. McGraw TA, Turiansky GW. Cutaneous myiasis. J Am Acad Dermatol. 2008;58(6):907-26.
8. Wadhwa V, Kharband P, Rai S, Uppal B. Urogenital myiasis due to Chrysomyia bezziana. Indian J Med Microbiol. 2006;24(1):70-1.
9. Kumar S, Manuel S, John TV, Sivan MP. Extensive gingival myiasis - diagnosis, treatment, and prevention. J Oral Maxillofac Pathol. 2011;15(3):340–3.
10. Pollack R. Ectoparasite infestation and arthropod bites and stings. In Longo DL, Fauci AS, KasperDL, Hauser SL, Jameson JL, Loscalzo J, editors. Harrison's Online Principles of Internal Medicine, 18e.New York: McGraw Hill; 2012.
11. CDC.org [Internet]. Georgia: Myiasis [updated November 2, 2010]. Available from: http://www.cdc.gov/parasites/myiasis/ biology.html.
12. James MT. The flies that cause myiasis in man. U.S. Department of Agriculture miscellaneous publication no. 63.1947, 1–175, USDA,Washington, DC.
13. Francesconi F, Lupi O. Myiasis. Clin. Microbiol. Rev. 2012;25(1):79.
14. Diaz JH. Myiasis and tungiasis. In Mandell GL, Bennett JE, Dolin R, editors. Mandell, Douglas, and Bennett’s principles and practice of infectious diseases, vol 2. Philadelphia: Churchill, Livingstone, Elsevier; 2009.
15. Liebert PS, Madden RC. Human botfly larva in a child's scalp. J Ped Surg. 2004;39:629-30.
16. Delhaes L, Bourel, B, Scala L, Muanza B, Dutoit E, Wattel F, et al. Case report: recovery of Calliphora vicina first-instar larvae from a human traumatic wound associated with a progressive necrotizing bacterial infection. Am. J. Trop. Med. Hyg. 2001;64(3,4):159–61.
17. Telford SR. Arthropods of Medical Importance. In: Versalovic J, Carroll KC, Funke G, Jorgensen JH, Landry ML, Warnock DW, edotprs. Manual of Clinical Microbiology 10th ed. Washington: ASM Press; 2011.
18. Batista-da-Silva JA, Borja GEM, Queiroz MMC. 2011. Patient with tracheostomy parasitized in hospital by larvae of the screwworm, Cochliomyia hominivorax. Journal of Insect Science [Internet] 2011 [cited 2012 June 7]; 11:163. Available

CLINICAL PRACTICE
80 VOL 26, NO 2 SPRING 2013 CLINICAL LABORATORY SCIENCE
from: http://www.insectscience.org/11.163/i1536-2442-11-16 3.pdf.
19. Hira PR et al. Myasis in Kuwait: nosocomail infections causedby Lusilia sericata and Megaselia scalaris. AM J Trop Med Hyg.2004;70:386-9.
20. Dutto M, Pellegrino M, Vanin S. Nosocomial myiasis in apatient with diabetes. J Hosp Infect. 2013;83(1):74-6.
21. Maleki Ravasan N, Shayeghi M, Najibi B, Oshaghi MA.Infantile nosocomial myiasis in iran. J Arthropod Borne Dis.2012;6(2):156-63.
22. Pérez-Giraldo C, Márquez-Laffón I, Blanco MT, Muñoz DelRey JR, Chavero MJ, Habela MA, et al. A case of human oralmyiasis by lucilia sericata in a hospitalized patient inextremadura, spain. Case Report Med. 2012:792683.
23. Pallai L, Hodge J, Fishman SJ, Millikan LE, Phelps RG(1992). Case report: myiasis—the botfly boil. AmericanJournal of Medical Science. 303, 245-8. http://www.ncbi.nlm.nih.gov/pubmed/1562042?dopt=Abstract
24. Caissie R, Beaulieu F, Giroux M, Berthod F, Landry P.Cutaneous myiasis: diagnosis, treatment, and prevention. JOral Maxillofac Surg. 2008;66:560-8.
25. Lopez JJ, Coris EE. Cutaneous Myiasis Masquerading asMethicillin-Resistant Staphylococcus aureus. Clin J Sport Med.2013 Feb 7. [Epub ahead of print]
26. Shorter N, Werninghaus K, Mooney D, Graham A.Furuncular cuterebrid myiasis. J Ped Surg 1997;32:1511-3.
27. Bakos RM, Bakos L. Dermoscopic diagnosis of furuncularmyiasis. Arch. Dermatol. 2007;143:123–4.
28. Boggild AK, Keystone JS, Kain KC. Furuncular myiasis: asimple and rapid method for extraction of intact Dermatobiahominis larvae. Clin Infect Dis. 2002;35:336-8.
29. Osorio J, Moncada L, Molano A, Valderrama S, Gualtero S,Franco-Paredes C. Role of ivermectin in the treatment of severeorbital myiasis due to Cochliomyia hominivorax. Clin InfectDis. 2006;43(6):57-9.
30. Shinohara EH, Martini MZ, Oliveira Neto HG, Takahashi A.Oral myiasis treated with ivermectin: case report79. Braz DentJ. 2004:15(1):79-81.
31. De Tarso P, Pierre-Filho P, Minguini N, Pierre LM, PierreAM. Use of ivermectin in the treatment of orbital myiasiscaused by Cochliomyia hominivorax. Scand J Infect Dis.2004;36(6-7):503-5.
32. Costa DC, Pierre –Fiho PTP, Medina FMC, Mota RG,Carrera CRL. Use of oral ivermectin in a patient withdestructive rhino-orbital myiasis. Eye, 2005;19:1018–20.
33. Puthran N, Hegde V, Anupama B, Andrew S. Ivermectintreatment for massive orbital myiasis in an empty socket withconcomitant scalp pediculosis. Indian J Ophthalmol. 2012;60(3):225–7.
34. FDA Approval Letter: Indication for Use: Ivermectin [Interent]Available from: http://www.fda.gov/OHRMS/DOCKETS/98fr/anada-200-348-fois001-vol1.pdf
35. Ivermectin [Interent]. MedlinePlus-A Service of the NationalLibrary of Medicine NIH National Institutes of Health[Internet]. Available from: http://www.nlm.nih.gov/medlineplus/druginfo/meds/a607069.html
36. Guidance for Industry Responding to Unsolicited Requests forOff-Label Information About Prescription Drugs and MedicalDevices [Internet]. US Department of Health and HumanServices , Food and Drug Administration; 2011. Available
from: http://www.fda.gov/downloads/Drugs/GuidanceCompli anceRegulatoryInformation/Guidances/UCM285145.pdf
37. Definition of off-label use [Internet]. MedicineNet.com.Available from: http://www.medterms.com/script/main/art.asp?articlekey=4622
38. Sherman RA, Hall MJ, Thomas S. Medicinal maggots: anancient remedy for some contemporary afflictions. Annu. Rev.Entomol. 2000;45:55–81.
39. Church JCT. Larvatherapy—biosurgery. Eur. Tissue RepairSoc. Bull. 1995;2:109–10.
40. Dunbar GK. Notes on the Ngemba tribe of the CentralDarling River of Western New South Wales. Mankind.1944;3:177–80.
41. Weil GC, Simon RJ, Sweadner WR. A biological,bacteriological and clinical study of larval or maggot therapy inthe treatment of acute and chronic pyogenic infections. Am. J.Surg. 1933;19:36–48.
42. Crile G, Martin E. Clinical Congress of Surgeons of NorthAmerica, ‘‘war session,’’ JAMA. 1917;69:1538–41.
43. Baer WS. The treatment of chronic osteomyelitis with themaggot (larva of the blow fly). J Bone Joint Surg.1931;13:438–75.
44. Nigam Y, Bexfield A, Thomas S, Ratcliffe NA. Maggottherapy: the science and implication for CAM. Part I—historyand bacterial resistance. Evid. Based Complement. Alternat.Med. 2006;3:223–7.
45. Nigam Y, Bexfield A, Thomas S, Ratcliffe NA. Maggottherapy: the science and implication for CAM. Part II—maggots combat infection. Evid. Based Complement. Alternat.Med. 2006;3:303–8.
46. Collier R. New interest in maggot therapy. Can Med Assoc J.2010;182(2):123-4.
47. Hoppe I, Granick M. Debridement of chronic wounds: aqualitative systematic review of randomized controlled trials.Clin Plast Surg. 2012;39(3):221-8.
48. Opletalová K, Blaizot X, Mourgeon B, Chêne Y, Creveuil C,Combemale P, et al. Maggot therapy for wound debridement:a randomized multicenter trial. Arch Dermatol.2012;148(4):432-8.
49. Leak K. How to... ten top tips for wound debridement.Wounds International. 2012;3(1):21-3.
50. Biscoe AL, Bedlow A. Warfarin-induced skin necrosisdiagnosed on clinical grounds and treated with maggotdebridement therapy. BMJ Case Rep. 2013 Jan 28;2013. pii:bcr2012007455.
51. Heitkamp RA, Peck GW, Kirkup BC. Maggot debridementtherapy in modern army medicine: perceptions and prevalence.Mil Med. 2012;177(11):1411-6.
52. FDA CDRH 510(k) Summary. Avialable at:http://www.accessdata.fda.gov/cdrh_docs/pdf7/K072438.pdf
53. Sherman RA. Maggot therapy for treating diabetic foot ulcersunresponsive to conventional therapy. Diabetes Care.2003;26(2):446-51.
54. Rayman A, Stansfield G, Woollard T, Mackie A, Rayman G.Use of larvae in the treatment of the diabetic necrotic foot. TheDiabetic Foot. 1998;1:7–13.
55. Sherman R. Maggot therapy takes us back to the future ofwound care: new and improved maggot therapy for the 21stcentury. J Diabetes Sci Technol. 2009;3(2):336–44.
56. van der Plas MJA, Jukema GN, Sin-Wen Wai SW, Dogterom-

CLINICAL PRACTICE
VOL 26, NO 2 SPRING 2013 CLINICAL LABORATORY SCIENCE 81
Ballering HCM, Lagendijk EL, van Gulpen C, et al. Maggot excretions/secretions are differentially effective against biofilms of Staphylococcus aureus and Pseudomonas aeruginosa . J Antimicrob Chemother. 2008;61:117-22.
57. Harris LG, Bexfield A, Nigam Y, Rohde H, Ratcliffe NA,Mack D. Disruption of Staphylococcus epidermidis biofilms by
medicinal maggot Lucilia sericata excretions/secretions.Int J Artif Organs. 2009;32(9):555-64.
58. Cazander G, van Veen KEB, Bouwman LH, Bernards AT,Jukema GN. The influence of maggot excretions on PAO1 biofilm formation on different biomaterials. Clin Orthop Relat Res. 2009;467(2):536-45.
Clinical Lab Investigations: Case Studies for the Laboratory Professional Each peer reviewed case study is designed to take you beyond the laboratory test to
investigate the causes of abnormal laboratory results.
Download each case study for FREE, study at your own pace, then purchase the online quiz for $15 (reduced member rate!) to earn P.A.C.E.® credit. Available cases
include:
v Clinical Chemistry v Hematology v Immunohematology v Microbiology
View topics and download cases a t www.ascl s .org /CLI.

82 VOL 26, NO 2 SPRING 2013 CLINICAL LABORATORY SCIENCE
CLINICAL PRACTICE
Clinical Laboratory EducatorsÊ Conference 2013 Abstracts
KANSAS CITY, MO
The following abstracts were presented during the 2013 American Society for Clinical Laboratory Science (ASCLS) Clinical Laboratory Educators’ Conference February 14-16, 2013 in Kansas City, Missouri. Abstracts are reviewed by appropriate representatives of the ASCLS Educational Scientific Assembly. They are the final authority in selecting or rejecting an abstract.
Poster Presentations Audience Response Devices (ARD) Application to Three MLS Clinical Chemistry Courses: How Do MLS Students Feel? Linda S. Gorman, PhD, MLS(ASCP)CM, University of Kentucky, Lexington, KY
Utilization of Audience Response Devices (ARDs) in MLS Clinical Chemistry courses has been increasing without measurable evidence to support the application of these devices to the lecture/classroom. The purpose of this study was to collect student perceptions (before and after) of an ARD device (Turning Point clickers) applied to certain sections of a clinical chemistry lecture course. Three institutions participated in this study, two of which had never used these devices while one was currently using them. Student volunteers were asked to take a pre- and post-exposure survey about their learning experiences and use of ARDs during their academic careers. In addition, volunteers were asked to take nine-question “exams” over the course material that they learned using lecture and an ARD. Qualtrics, an on-line survey program, was used to administer the surveys and the “exam” questions. All the clinical chemistry lectures used in this study were given by the same instructor (PI). Total volunteers for this study from three locations came to 19 for the pre-exposure survey and 15 for the post-exposure one. The pre-exposure survey found that students preferred lectures and case studies as teaching tools. Post-exposure surveys showed that 100% of the volunteers found the use of this active learning device “comprehensive” and 73% found it “comprehensive and engaging”. Evidence from
this study indicates a favorable inclination by the students toward the use of ARDs as teaching tools. However, 53% of the students suggested using the clickers in conjunction with other teaching methods for MLS courses.
Be Part of the Clinical Team: Emphasizing Interprofessional Communication with Blood Bank Students Michelle R. Brown, MS, MLS(ASCP)SBBCM, Brianna V. Miller, MS, MLS(ASCP)CM, The University of Alabama at Birmingham, Birmingham, AL
Effective teamwork is necessary for optimal delivery of healthcare. With clinicians dependent on rapid turn-around times for blood components, it is essential the medical laboratory scientists (MLS) in the transfusion service communicate delays due to discrepancies, antibodies or difficulty procuring blood components. In order to emphasize the necessity of interprofessional (IP) communication to MLS students, we utilize an activity called transfusion medicine rounds. Initially, students are provided with a brief patient history and the results of the type, screen, and antibody identification. The student evaluates the case and provides two reviews: one technical and one clinical. The student must clearly define: 1) important information to discuss with a MLS, and 2) that which is key to a discussion with a clinician. The student presents the technical review to a panel of MLS. For the clinical review, the student discusses the case with a member of the clinical team (nurse or physician’s assistant arranged by the instructor prior to the exercise). The clinical participants are encouraged to ask any questions they would routinely ask in practice. A survey of students (n=16) revealed that 100% strongly agree the activity emphasized the importance of IP communication and helped them understand what blood bank information is important to clinicians. Likewise, 81% strongly agree and 19% agree they are more confident in their IP communication skills after

CLINICAL PRACTICE
VOL 26, NO 2 SPRING 2013 CLINICAL LABORATORY SCIENCE 83
participating in the activity. Having two distinct conversations enables the students to distinguish between information important to a laboratorian versus that which is important to a clinician. Blended Learning Model Provides a Link Between Distance-Learning and Laboratory Instruction Sandra Ackerman, MEd, MT(ASCP), Karen Hunter, PhD, MT(ASCP), Lindsay McElderry, MEd, MLS(ASCP)CM, University of Arkansas for Medical Sciences, Little Rock, AR
The demand for laboratory professionals continues to exceed supply. As a result, academic institutions preparing the future workforce need to design pathways that are more accessible for students. Traditional MLS programs develop student psychomotor skills weekly in a laboratory setting. To minimize student travel, instructors developed a blended learning model combining online teaching with traditional laboratory instruction. This innovative approach to laboratory education required distance-learning students to complete a weekly virtual lab in preparation for two rigorous on-campus laboratory sessions. Virtual laboratories were developed for distance-learning students to reflect the laboratory principles taught weekly to on-campus students. Methods: A two-year study was completed in which students’ perceptions were evaluated using an ordinal-scale designed questionnaire. Twenty-six survey questionnaires were distributed with a 100% response rate. Using SPSS version 18.0, frequencies and descriptives were generated. A majority of respondents indicated the virtual laboratories reinforced the laboratory concepts. However, students preferred hands-on learning to virtual laboratories. Respondents also indicated additional communication was needed with instructors when completing the virtual laboratory assignments. After three years of delivering the distance option, the overall program enrollment has increased and students completing the program have stayed in their local communities helping provide laboratory professionals in areas of the state considered underserved. Changing to a Clinical Experience Model Patricia J. Brennecke, MT(ASCP), Janice M. Conway-Klaassen, PhD, MT(ASCP)SM, University of
Minnesota, Minneapolis, MN In 2009-2010 our CLS program began a systematic review of the curriculum and assessment of the essential content for the clinical training component of our curriculum. The University-based curriculum provided extensive hands-on experience in our campus laboratories, but we lacked the ability to recreate the real hospital environment. Students didn’t need technique training at the bench as much as they needed to experience the clinical setting, multi-tasking, heavier workloads, and the integration of laboratory work. Due to this change in purpose, we realized that we no longer needed the large full-service laboratory for the traditional clinical internship training. Instead we could add a number of alternate locations for a clinical experience including commercial, reference, public health, out-patient clinics, and small rural hospital laboratories. This greatly increased the potential clinical sites for students. The curriculum focus on a clinical experience rather than a clinical training, allowed for a decrease in the total number of weeks in the clinical rotations from 22 to 12. Over the past 3 years we have implemented this new model for clinical training and expanded our clinical sites to 58 throughout the state. Students are sent to at least one traditional and one alternate site for the four primary CLS disciplines. Student outcomes have continued to meet the program metrics including certification scores, employment rates and employer satisfaction. A Comparison of On-Campus and Distance-Learning Student Exam Scores Karen Hunter, PhD, MT(ASCP), Cherry Childs, MS, MT(ASCP), University of Arkansas for Medical Sciences, Little Rock, AR To remain dynamic and viable, academic institutions preparing the future MLS workforce need to design more accessible pathways for students therefore, the medical laboratory program personnel at UAMS develop a distance option for completing a Bachelor’s degree in Medical Laboratory Science. Virtual laboratories across all disciplines were developed that reflect the laboratory principles taught weekly to on-campus students. Compare outcome measures that include practical exam scores, final course averages, and BOC scores for students completing the distance learning track and students completing the on-campus

CLINICAL PRACTICE
84 VOL 26, NO 2 SPRING 2013 CLINICAL LABORATORY SCIENCE
track. The two-group post-test-only experiment design was used for this study. The two groups were compared on multiple measures, and the Student’s T-test was used to assess whether the means of the two groups were statistically different from each other. The alpha level of .05 was set a-priori and SPSS v.19 was used for all data storage and analysis. Descriptive data and frequencies were generated. There was no statistical difference between the distance students and on-campus students’ performance on the comprehensive final. However, distance students scored slightly higher on hematology, microbiology and body fluids laboratory practical exams. In addition, distance student pass rate on the BOC is 93% as compared to on-campus student pass rate of 86%. The primary outcome of interest was whether the two groups were different after the distance education intervention was delivered. Using a blended learning approach MLS Faculty can successfully combine online and traditional laboratory instruction to accomplish quality student learning outcomes.
Enhancing the Simulated Laboratory Experience with a Commercial Laboratory Information System Sandra Cook, MS, MT(ASCP), Daniel de Regnier, MS, MT(ASCP), Ferris State University, Big Rapids, MI
Students at Ferris State University are required to enroll in a simulated laboratory course during the semester prior to their clinical experience. Through grant funds, a laboratory information system was purchased and installed on seven laboratory computers and interfaced to several instruments. Students order, review and result tests on a variety of patient samples ordered with the daily workload. This system provides a realistic simulation, however, during the initial use of the system a problem was noted when faculty observed that students would wait until the end of their lab period to enter all of their daily work results, often leading to a 2-3 hour gap between testing and data entry. This was determined to be inefficient and an unrealistic practice. Through faculty discussions, it was determined the problem would be alleviated and student performance would be enhanced with the ability for remote data entry from the student benchtop. An additional $5200 grant was awarded by the Ferris Foundation, and four laptop computers were acquired to enhance the simulated experience at the bench. Students are now able to directly enter data for manual testing, such as
differentials and experience paperless microbiology reporting. This has led to greater efficiency in the simulated laboratory testing and resulting process, and also better prepares students for the experience of more streamlined testing and resulting of samples during their clinical experience.
Evaluating the Effectiveness of a 3D Virtual Learning Environment in Clinical Laboratory Science Education Jose H. Salazar, MS, MLS(ASCP)CM, The University of Texas Medical Branch, Galveston, TX
Educational technology allows education to be virtual and accessible around the clock anywhere an internet connection is available. In an effort to make education more accessible to Clinical Laboratory Science (CLS) students, meet the demands of increased costs of medical laboratory education, and address the shortage of clinical preceptorship sites there is a need for the development of alternative teaching methods for teaching medical laboratory skills. Virtual learning environments (VLEs), such as Second Life (SL), offer the capability of creating virtual classrooms accessible via the internet and requiring no additional physical teaching space. VLEs are highly customizable and offer many educational tools to both the educator and student. The objective of this study was to evaluate the effectiveness of a 3D virtual medical laboratory simulation and examine students' perception of a virtual medical laboratory learning environment in Second Life. CLS students from 2010 and 2011 CLLS 3200 Basic Methods and Introduction to Laboratory Operations cohorts participated in this study. ANOVA statistics were used to determine if there was a significant difference in learning gains between SL and non-SL groups. Results revealed no significant learning gains between the two groups. Both SL and non-SL groups did experience significant learning gains using both methods of instruction. In addition, Pearson's correlation test revealed a weak negative correlation between the software's ease of use and overall satisfaction.
Implementing Gel Technology in the Student Laboratory Setting Tiffany Colvin, MHA, MLS(ASCP)CM; Kathleen Trudell, BS, MLS(ASCP)CMSBBCM, University of Nebraska Medical Center, Omaha, NE
CLINICAL PRACTICE
VOL 26, NO 2 SPRING 2013 CLINICAL LABORATORY SCIENCE 85
The University of Nebraska Medical Center Clinical Laboratory Science Program employs a 3+1 format. This format includes an 11-week student laboratory completed at the academic institution, followed by a nine-month clinical component completed at one of 18 clinical affiliate sites. Regular survey responses are monitored for opportunities/deficits in clinical education. A deficit was identified in the exposure of students to gel technology during the clinical blood bank rotation. Of the 16 sites responding to the survey, 100% indicated the use of non-tube methods as the primary means of antibody detection and identification. While 63% of sites indicated the use of gel technology, due to student distribution, 50% of 57 total students received no exposure to gel technology during the clinical year. To rectify this deficit, manual gel station technology was implemented during the 11-week student laboratory, complementing the tube and solid-phase testing already employed. As a result, 100% of students completing clinical training through UNMC and five partner universities across the Midwest have received clinical education in tube, solid-phase, and gel technologies in the blood bank. Outcome measures include increased preparation for the nine-month clinical rotation, increased exposure to multiple technologies in blood bank, and a higher satisfaction rate of clinical instructors at affiliate sites. While it can be difficult to implement advanced or new technologies in a student laboratory setting, implementing manual gel technology was neither cost prohibitive nor difficult. Education in multiple current technologies better prepares students to be excellent entry-level clinical laboratory scientists. Improving Student Writing Skills through Online Instruction Sallie A. Ruskoski, MS, MT(ASCP), Northeastern State University, Broken Arrow, OK There is an increasing expectation to produce medical laboratory science (MLS) students who are capable of expressing themselves through professional writing. The task is even more challenging when the entire MLS program is online. It has been our experience in the Northeastern State University (NSU) MLS program that many MLS students resort to “cutting and pasting” instead of writing in their own words. The purpose of this study was to address different methods of instruction in order to teach MLS students techniques
for writing clearly, professionally, and with academic integrity. Medical Laboratory Science online courses at NSU utilize the Blackboard Learning System. Traditional essays and research papers were assigned in each course in order to encourage the students to write in their own words and without plagiarism. Website links such as http://www.apastyle.org/ or http://cbc.ari zona.edu/sites/default/files/marc/Sci-Writing.pdf were provided to students as resources for writing instructions. Topics of discussion, like the use of specific research experiments, were posted to the Blackboard Learning System Discussion Board to facilitate the students’ practice of addressing issues with words. Furthermore, students created PowerPoints assignments over individual topics to help facilitate classroom learning. The students’ writing improved in flow and content as the semester progressed. Improvement in student’s writing was measured using a departmental rubric and class assignment averages were compared using an one-way ANOVA analysis. These various writing assignments helped students gain the writing confidence they need in order to write clearly and professionally, a skill that is needed in the laboratory field. Interdisciplinary Collaboration in the Development of a Cultural Awareness Survey Marvita D. McGuire, PhD, MT (ASCP), Jodi Gooden, PhD, Northeastern State University, Muskogee, OK Cultural awareness of the rich Oklahoma and global cultural diversities is a Northeastern State University educational goal intended to supply students with information regarding customs, beliefs, communication and educational needs of various ethnic groups. Faculty from the graduate Nursing Education Program and undergraduate Medical Laboratory Science Program collaboratively developed a discussion forum, aptly named Cultural Awareness Discussions. The online forum invited guests from various cultural groups to answer student questions regarding unique customs and beliefs. The course is intended to promote compassion, understanding and sensitivity to the students and patients served at regional education and health care facilities. The course utilized the online Blackboard Learning platform as the vehicle for guest/student interaction. Students were free to ask any question regarding cultural beliefs and customs especially

CLINICAL PRACTICE
86 VOL 26, NO 2 SPRING 2013 CLINICAL LABORATORY SCIENCE
regarding health, illness and death. Prior to posting questions to the guests, students were asked to submit an anonymous (number assigned by non-faculty administrator) pre course survey of ten questions that addressed student’s attitudes and knowledge of cultural customs and beliefs. Students submitted the same survey at the end of the semester (post course survey). Pre and post survey averages for each paired submission were calculated based on a range of 1(not confident) to 5 (very confident) for each question. Statistical evaluation of pre and post paired responses in both disciplines demonstrated that averages for each question increased in the post survey. The increase in confidence suggests that students gained knowledge and appreciation of cultural beliefs and customs upon completion of the course.
Personalized Education Plan**: A Paradigm Shift in Virtual Competency Based Education Farogh Nazari, PhD, MLS (ASCP)CM, Jennifer Sanderson, MS; William Magagna, MS, Siemens Healthcare Diagnostics, Newark, DE
The recent economic down turn has forced healthcare organizations to cut their budgets including allocations for continuing education. At the same time the complexity of clinical laboratory testing is increasing. However the need for more continuing education in clinical settings has never been greater. Seizing the opportunity, the diagnostic industry vendors can provide cost-effective ways to deliver sound continuing education programs to healthcare professionals. Siemens Healthcare Diagnostics has developed a unique platform called Personalized Education Plan** (PEP) for presenting virtual education based on adult learning principles (knowledge, skill, and ability). With classroom equivalency PEP is identical to traditional classroom education curriculum. PEP’s three content libraries (Instrument Specific, General Laboratory, and Clinical Applications) approach education in a holistic manner, because laboratory professionals need to know more than just how to run instruments. Since its launch in 2011 The Siemens’ PEP has been accessed by tens of thousands of learners around the world. General Laboratory library focuses on topics of interest to all laboratory professionals regardless of the discipline in which they work while Clinical Applications library focuses on disease state management. The Siemens’ PEP is also being used as a teaching tool for CLS students by
several universities, including the University of Canberra in Australia. Personalized Education Plan* offers comprehensive, competency-based virtual training and education using adult learning principles. Its user-friendly format can be tailored to job roles. PEP is an effective way to deliver continuing education to laboratory professionals. ** Patent pending
Student Engagement and Learning Strategies in Online Courses Mauri S. Brueggeman, MEd, MLS(ASCP), Janice Conway-Klaassen, PhD, MT(ASCP)SM, Joanna George, MEd, MLS, SBB(ASCP), Stephen M. Wiesner, PhD, MT, MLT(ASCP), University of Minnesota, Minneapolis, MN
As our Clinical Laboratory Science program transitions further to a hybrid education delivery format, program faculty have become interested in the changes in learning strategies that students employ to accommodate online educational environments. We also investigated the kinds of online instructional experiences the students found most engaging. Student participation aspects of three of our courses were reviewed. One course was delivered entirely online, another course was blended with approximately 70% online, and the third course had 15% online activity. Students enrolled in these courses participated in two surveys in which they were asked about ideal online course features and about changes in their learning strategies with respect to online course delivery. Only students that participated in all of these activities were considered for in depth interviews. Based on their responses to the survey questions, eight students were identified as candidates for interview, four of which chose to participate. In these interviews, students were asked to compare their learning strategies used relative to the level of online course activity and what they found most engaging. In addition, students’ ideal online course features were queried. In general, students commented that these approaches forced them to adopt a more independent learning strategy and that this was, overall, a positive outcome. Many students found synchronous online experiences more engaging than asynchronous activities. We conclude that, with the appropriate instructional design, hybrid educational models can effectively engage students and support independent life-long learning. The program anticipates incorporating these findings into future course

CLINICAL PRACTICE
VOL 26, NO 2 SPRING 2013 CLINICAL LABORATORY SCIENCE 87
development. Use and Acceptance of Information and Communication Technology Among Laboratory Science Students Brenda C. Barnes, MSEd, MLS(ASCP)SBBCM, Allen College, Waterloo. IA
Online and blended learning platforms are being promoted within laboratory science education under the assumption that students have the necessary skills to navigate online and blended learning environments. The purpose of this study was to explore factors that affect use and acceptance of information and communication technology (ICT) among laboratory science students through the theoretical lens of the Unified Theory of Acceptance and Use of Technology (UTAUT) model, developed based on eight models used in earlier research to explain information technology use and acceptance. An electronically delivered survey consisting of nine demographics questions and 32 ICT-related survey questions drew upon current students and recent graduates (within two years) of all accredited laboratory science training programs listed on the NAACLS and AABB Web sites in June 2012. During the four-week data collection period, 168 responses were received. Results showed that the UTAUT model did not perform well within this study, explaining 25.2% of the variance in use behavior. A new model incorporating attitudes toward technology and computer anxiety as two of the top variables, a model significantly different from the original UTAUT model, was developed based on the findings that explained 37.0% of the variance in use behavior. The potential significance of this study may affect curriculum design of laboratory science training programs wanting to incorporate more teaching techniques that use ICT-based educational delivery.
Technology Demonstrations Just the Right Image: Capturing Microscopic Images for Custom-made Presentations Lillian Mundt, EdD, MLS(ASCP)SH, Lombard, IL Educators in Medical Laboratory Sciences curricula often need fresh images to challenge students during laboratory sessions as well as for skills evaluation. Although many image banks and videos are available for purchase, sometimes educators have unique specimens
in their collections of smears or live specimens and may like to capture an image to incorporate into educational materials. In addition, clinical sites may provide an opportunity for educators or students to capture images of not-commonly-available specimens. Some of the laboratory skills students must develop require an understanding of how the use of various focal planes when performing microscopic observations aids in the identification of an object, cell, or organism. Demonstrating the use of focal planes and motion on a microscopic level is best observed as a laboratory exercise. Educators may be able to shorten the time it takes students to grasp these skills in the laboratory if they can provide students with previews of these skills by incorporating images and short video clips into their classroom presentations. This technology demonstra-tion shows educators how to use an intra-ocular digital microscope camera to capture still images as well as short videos for use in educational materials they wish to develop. Having the image capture software loaded on a portable device makes it possible to go to where the specimens are to capture them virtually. Managing Affiliation Agreements Stephanie Crawley, MLS (ASCP), Wichita State University, Wichita, KS The management of affiliation agreements with clinical practicum sites can become cumbersome for a small medical laboratory sciences educational program, and it is a common problem for many medical laboratory sciences programs, small and large. The Medical Laboratory Sciences program of Wichita State University presents their method for organizing affiliation agreements and information about those clinical affiliation sites through a Microsoft Access database. The Wichita State University database is used to make copies of clinical affiliation agreements available for viewing by multiple faculty and departments throughout the Wichita State University College of Health Professions. The database stores essential contact information, initiation date of agreement, and expiration date of agreement for the clinical facilities. Information about unique requirements of a particular clinical practicum site is available for each site. Use of the database has resulted in more efficient use of clinical sites and better monitoring of agreement expiration dates. The database may be merged with similar databases of other Health

CLINICAL PRACTICE
88 VOL 26, NO 2 SPRING 2013 CLINICAL LABORATORY SCIENCE
Professions for global review of sites in use by large organizations. The format of the database may be appropriate for other programs of health professions, looking to organize affiliation agreement information for viewing by more than one department in a timely manner.
Use of Short Hematology Laboratory Procedure Videos for Enhancing the Online and Onsite Learning Experience for Students Denise Harmening, PhD, MT(ASCP), Rush University, Chicago, IL
Educators continually take time from the students’ laboratories to give a discussion and demonstration of the procedure to be performed prior to the laboratory exercise. In addition, in an online hematology course, it is impossible to demonstrate the laboratory procedure to the entire student class at one time, if the delivery is
asynchronous. Incorporating new strategies combined with the traditional lecture format can increase the student’s learning outcomes in terms of knowledge, skills, and attitudes. Five to eight minute hematology procedure videos were prepared for the following laboratory exercises: 1) Making A Slide For Examining Peripheral Blood Smears, 2) Unopette And Loading A Hemocytometer, 3) Manual Reticulocyte Counts, 4) Performing Sickle Solubility Tests, and 5) Performing Sedimentation Rates. Highlights of the production process will be demonstrated with the videos. Laboratory demonstrations are a time-consuming exercise, often requiring one-on-one instruction with the student. In addition, these discussions and demonstrations need to be repeated for each new class. Using these short hematology laboratory procedure videos can reinforce concepts for the student, allow them to view them as many times as needed, and definitely saves time for the instructor.
Member Renewal Thank You! § ASCLS thanks you for renewing your 2012-‐13 membership
§ Receive 6 online quizzes at no charge to help with your CE
needs
§ For details* go to www.ascls.org/?Edu_MTY
§ We know you have choices as to which organization you
belong and we are thrilled you chose ASCLS!
*For PF1, PF2 and FYP members who renewed by 9/1/12
*Must complete quizzes by 7/31/13

VOL 26, NO 2 SPRING 2013 CLINICAL LABORATORY SCIENCE 89
RESEARCH AND REPORTS
Do Elevated Hematocrits Prolong the PT/aPTT? MELISSA AUSTIN, CHRIS FERRELL, MORAYMA REYES
ABSTRACT The Clinical and Laboratory Standards Institute guidelines require special processing of whole blood specimens with hematocrits greater than 55% due to the possibility of spurious prolongation of routine coagulation studies (PT, aPTT). As samples with hematocrits above 60% are rare at our institution, our study seeks to determine the effect of relative citrate excess on routine coagulation studies in samples with hematocrits of 60% to determine whether special processing is necessary. A calculated volume of 3.2% citrate was added to 1 mL aliquots of 40 whole blood samples in citrated tubes from adult patients to simulate a hematocrit of 60%. A dilutional control was created by adding an equivalent volume of saline to a separate 1 mL aliquot. Routine coagulation studies (PT, aPTT) were run on both samples on the STA Compact Analyzer in accordance with manufacturer instructions. While a paired Student’s t-test demonstrated a clinically significant change in both PT and aPTT with the addition of citrate (p = 0.0002 for PT and p = 0.0234 for aPTT), clinical management would not have been altered by any observed change. More interestingly, we observed a shortening of 27/40 PTs and 23/40 aPTTs rather than the expected prolongation. Based on our data, no adjustment of citrate volume appears to be necessary in samples with hematocrits less than or equal to 60%.
ABBREVIATIONS: CLSI - Clinical and Laboratory Standards Institute, PT - prothrombin time, aPTT - activated partial thromboplastin time , CBC - Complete Blood Count
INDEX TERMS: Prothrombin Time, Partial Thromboplastin Time, Hematocrit, Blood Coagulation Tests, Citrate
Clin Lab Sci 2013;26(2):89
Melissa Austin, MD, Departments of Pathology and Laboratory Medicine, University of Washington Medical Center, Seattle, WA
Chris Ferrell, MT(ASCP), Department of Laboratory Medicine, Harborview Medical Center, Seattle, WA
Morayma Reyes, MD, PhD, Department of Laboratory Medicine, University of Washington Medical Center, Seattle, WA
Address for Correspondence: Melissa Austin, MD, Resident in Anatomic and Clinical Pathology, Depart-ments of Pathology and Laboratory Medicine, University of Washington Medical Center, Seattle, WA, (206) 598‐6400, [email protected]
INTRODUCTION The Clinical and Laboratory Standards Institute (CLSI) guidelines require special processing of whole blood specimens with hematocrits greater than 55% due to the possibility of spurious prolongation of routine coagulation studies.1 As sodium citrate only equilibrates within the plasma component, samples with an elevated hematocrit will have a relative excess of citrate anticoagulant in relation to plasma volume.2,3,4 Excess citrate will in turn bind calcium added to initiate the clotting process and slow its initiation, leading to prolonged prothombin times (PT) and activated partial thromboplastin times (aPTT).4,5
In cases where polycythemia is chronic and stable, these patients may be pre-identified by nursing and phlebotomy staff and appropriate modification of the citrate volume in the empty blood tube can be accomplished prior to phlebotomy. However, there are many instances (e.g. markedly dehydrated patients) where the polycythemia is acute and transient and therefore impossible to identify prior to performance of a complete blood count (CBC). Repeat phlebotomy may be difficult or impossible, particularly in the outpatient or Emergency Department setting, with potential downstream effects including cancellation of procedures or surgery due to the inability to interpret results with confidence.
Previous studies have demonstrated that relative citrate

RESEARCH AND REPORTS
90 VOL 26, NO 2 SPRING 2013 CLINICAL LABORATORY SCIENCE
excess as a result of either polycythemia or short draws results in spuriously prolonged PT and aPTT results;2-8 however, it is important to note that some of the original studies were performed with 3.8% citrate2,5,6 rather than the 3.2% citrate2,3,6,7 that is currently the standard while other studies evaluated samples with hematocrits up to 72%. As hematocrits greater than 60% are rare at our institution in the absence of known, chronic polycythemia, we sought to determine the effect of relative citrate excess on routine coagulation studies (PT and aPTT) in samples with hematocrits of 60% and to determine whether clinical management would be altered by any observed change.
MATERIALS AND METHODS Materials Forty whole blood samples in standard 3-mL plastic tubes (Becton Dickinson Vacutainer Systems, Franklin Lakes, NJ) containing 0.3 mL of 3.2% buffered sodium citrate (final citrate/whole blood ratio of 1:9) with hematocrits ranging from 21-46% were selected at random from existing specimens submitted for routine coagulation studies. Two 1-mL aliquots were removed from each tube and transferred to empty 12x75 mm polypropylene tubes. A sufficient volume of 3.2% buffered sodium citrate was added to one of each pair of 1-mL aliquots to simulate a hematocrit of 60% (final citrate/plasma ratio of 1:3.6). An equivalent volume of 0.9% sodium chloride was added to the second 1-mL aliquot as a dilutional control. Both samples were centrifuged at 3,600g for 2 minutes, and the plasma was removed and maintained at room temperature prior to determination of the PT and aPTT.
Methods Hematocrit values were determined on concurrently drawn EDTA samples using a Sysmex XE 2100 (Sysmex America, Inc, Mundelein, IL) according to the manufacturer’s instructions. The PT and aPTT values (see Table 1 for reference ranges and assay variance) were determined on the STA Compact Analyzer (Diagnostica Stago, Asnieres, France) using the Neoplastin CI+ and PTT Automate reagents, respectively (Diagnostica Stago, Asnieres, France); all assays were performed according to the manufacturer’s package inserts. The unadjusted, citrate-adjusted and saline-diluted aliquots for each sample were analyzed simultaneously. The change in PT and aPTT between the citrate-adjusted and unadjusted samples was
calculated in seconds.
Studies on human subjects were carried out according to the principles of the Declaration of Helsinki. All samples were anonymized. The study was classified as a Nonhuman Subjects Protocol under the category of Use of Non-Identifiable Biological Specimens by the University of Washington (Seattle) Human Subjects Review Committee.
Data Analysis Statistical significance was determined using a two-tailed paired Student’s t-test with p<0.05 chosen as the cutoff for statistical significance, and linear regression was used to evaluate the correlation between citrate-adjusted and citrate-unadjusted PT and aPTT values (Microsoft Excel, Redmond, WA). Change in PT and aPTT was further evaluated from the perspective of the reference range and institutional clinical guidelines for PT and aPTT to determine whether clinical workup or management would be altered by any observed change.
RESULTS The PT and aPTT were compared for the citrate-adjusted and unadjusted samples, and overall results are presented in Table 2. The change in PT with the addition of citrate ranged from a shortening of 0.8 seconds to a prolongation of 0.7 seconds. The change in aPTT with the addition of citrate ranged from a shortening of 10 seconds to a prolongation of 8.5 seconds. On average, the PT was shortened by 1.6% and the aPTT was shortened by 2.7% with the addition of citrate. The PT and aPTT of the citrate-adjusted and unadjusted samples correlated well as shown in Figures 1 and 2 with PT values correlating better than aPTT. Both the change in PT and aPTT were statistically significant with p values and average changes in PT and aPTT shown in Table 1. Three of forty samples demonstrated a change that crossed the upper limit of the reference range for PT and four of forty samples demonstrated a similar change in aPTT and required further evaluation for any clinical significance.
DISCUSSION While a statistically significant change in both PT and aPTT was observed with the addition of sufficient citrate to simulate a hematocrit of 60%, the actual average change was a shortening in both PT and aPTT, and the majority of samples demonstrated a shortening

RESEARCH AND REPORTS
VOL 26, NO 2 SPRING 2013 CLINICAL LABORATORY SCIENCE 91
(a) PT vs. PT + Citrate (b) Change in PT with Addition of Citrate Figure 1. There was excellent correlation between PT and PT + Citrate (a), and the majority of PTs were shortened with addition of citrate (b). (a) PTT vs. PTT + Citrate (b) Change in PTT with Addition of Citrate Figure 2. The correlation coefficient between aPTT and aPTT + Citrate is 0.8577 (a), and the majority of aPTTs were shortened with
addition of citrate (b). in PT and aPTT rather than the prolongation expected based on results of previous studies.2-7 Given the small variance of both assays, it is not surprising that a minor change was deemed statistically significant. Many of the observed changes were within the accepted inter-assay variance for both PT and aPTT at our institution, so this is one potential explanation for the observed change. As demonstrated in Table 1 and Figure 3, the PT and aPTT demonstrated an average prolongation
with addition of saline, effectively ruling out a dilutional effect as the cause of the changes observed with addition of citrate. The most recent publication on the effects of elevated hematocrit on coagulation studies set clinical signi-ficance/difference as a 10% change in the PT or aPTT, and the majority of samples they evaluated had hematocrits >60%.3 We chose to evaluate the clinical

RESEARCH AND REPORTS
92 VOL 26, NO 2 SPRING 2013 CLINICAL LABORATORY SCIENCE
(a) Change in PT with Addition of Saline (b) Change in aPTT with Addition of Saline
Figure 3. In contrast to the effect seen with addition of citrate, the majority of samples demonstrated a prolongation in PT (a) and aPTT (b) with addition of saline.
Table 1. PT and aPTT Summary Data
PT PTTAverage Unadjusted (secs) 15.3 35.4 Average with Citrate Excess (secs) 15.1 34.2 Average Change with Citrate Excess (secs) -0.2 -1.3 Paired T-test (two tailed) p = 0.0002 p = 0.0234 Average with Saline (secs) 15.4 36.5 Average Change with Saline (secs) +0.1 +1.1 Paired T-test (two tailed) p = 0.1898 p = <0.0001 Reference Range (secs) 10.7-15.6 22-35 Accepted Inter-Assay Variance (secs) 0.4 1.1
implications of any observed change in PT or aPTT based on current guidelines for the stratification and evaluation of patients based on routine coagulation studies in use at our institution. Three of the 40 samples had a change in PT with addition of citrate sufficient to potentially change the clinical interpretation (gray highlighted in Table 2). In each case, the PT of the unadjusted sample was within 0.2 seconds of the upper limit of the reference range. In two samples, the PT shortened with the addition of citrate (15.8 to 15.2 and 15.7 to 15.2 seconds respectively); in the third case, the PT was prolonged to just above the upper limit of the reference range (15.6 to 15.7 seconds). However, since the INR is the primary means by which patients are stratified at our institution, the clinical interpretation would not have been changed because the INR of both the unadjusted and citrate-
adjusted samples was normal.
Four different samples also had a change in aPTT with addition of citrate sufficient to cross the upper limit of the reference range; in each case, a shortening of the aPTT was observed (36 to 34 seconds, 42 to 35 seconds, 36 to 34 seconds, and 36 to 33 seconds) (gray highlighted in Table 2). As the clinical standard for evaluation of a marginally elevated aPTT is to repeat the assay, and each of these patients subsequently had a normal aPTT study drawn within close proximity to this sample, the elevated unadjusted aPTTs were values that would have been unlikely to result in a substantial clinical workup on their own. The normal aPTT values seen in their citrate-adjusted counterparts would therefore have been unlikely to change ultimate clinical management had they been viewed in isolation.
CONCLUSIONS While it is clear from previous data2-5 that adjustment of citrate concentration in samples with markedly elevated hematocrits is necessary, our data suggest that routine coagulation studies from samples with hematocrits up to 60% may be safely performed and interpreted with confidence. It is important to note, however, that due to variance in phlebotomy technique, handling, processing, and coagulation instrumentation and reagents, each institution should independently validate our findings within their patient population.

RESEARCH AND REPORTS
VOL 26, NO 2 SPRING 2013 CLINICAL LABORATORY SCIENCE 93
Table 2. PT and aPTT Results
PT with PTT with Original PT Citrate Change Clinically PTT Citrate Excess Change Clinically Hct (%) (secs) Excess (secs) Significant (secs) (secs) (secs) Significant (secs)
37 14.9 14.8 -0.1 No 35.9 33.6 -2.3 No 38 23.0 23.0 0.0 No 41.3 41.7 0.4 No 25 15.8 15.2 -0.6 No 29.7 31.5 1.8 No 29 17.4 17.0 -0.4 No 36.0 44.5 8.5 No 43 13.1 12.5 -0.6 No 29.5 28.0 -1.5 No 34 13.2 12.5 -0.7 No 30.1 33.0 2.9 No 25 22.8 22.1 -0.7 No 42.1 35.2 -6.9 No 46 13.5 13.0 -0.5 No 41.9 38.2 -3.7 No 34 17.3 16.7 -0.6 No 61.5 54.4 -7.1 No 27 14.0 13.2 -0.8 No 30.7 30.1 -0.6 No 21 13.1 13.0 -0.1 No 28.9 25.0 -3.9 No 22 17.2 16.9 -0.3 No 40.5 40.7 0.2 No 37 12.0 12.2 0.2 No 29.6 30.0 0.4 No 24 14.5 14.5 0.0 No 49.6 52.5 2.9 No 44 12.7 12.5 -0.2 No 35.1 35.0 -0.1 No 39 13.4 13.1 -0.3 No 27.0 26.9 -0.1 No 34 12.2 12.3 0.1 No 29.2 29.5 0.3 No 44 13.0 12.9 -0.1 No 25.3 26.3 1.0 No 36 15.6 15.7 0.1 No 51.3 47.8 -3.5 No 35 20.3 21.0 0.7 No 33.7 32.2 -1.5 No 24 16.5 16.1 -0.4 No 41.4 35.5 -5.9 No 37 16.7 16.8 0.1 No 59.3 49.8 -9.5 No 41 13.9 13.4 -0.5 No 28.7 31.0 2.3 No 29 15.6 15.0 -0.6 No 39.1 38.9 -0.2 No 25 15.7 15.2 -0.5 No 32.5 30.1 -2.4 No 42 22.6 22.7 0.1 No 36.4 33.8 -2.6 No 21 12.7 12.5 -0.2 No 24.2 25.0 0.8 No 30 15.6 15.4 -0.2 No 45.6 35.6 -10.0 No 45 13.1 13.3 0.2 No 26.6 27.3 0.7 No 36 13.1 12.8 -0.3 No 26.5 26.4 -0.1 No 41 13.0 12.7 -0.3 No 29.7 30.3 0.6 No 43 12.7 12.1 -0.6 No 28.8 26.4 -2.4 No 36 14.3 13.7 -0.6 No 29.0 29.4 0.4 No 41 13.0 12.4 -0.6 No 38.3 36.9 -1.4 No 46 12.2 11.8 -0.4 No 25.6 25.6 0.0 No 37 21.1 21.5 0.4 No 37.1 37.2 0.1 No 25 18.2 18.2 0.0 No 42.2 38.3 -3.9 No 45 12.7 13.0 0.3 No 32.7 32.4 -0.3 No 28 16.7 16.9 0.2 No 36.0 33.3 -2.7 No 27 15.0 14.6 -0.4 No 29.2 27.5 -1.7 No
PT: Prothrombin Time, aPTT: activated Partial Thromboplastin Time, Hct: Hematocrit, nl: normal, INR: International Normalized Ratio REFERENCES: 1, Clinical and Laboratory Standards Institute. Collection,
Transport and Processing of Blood Specimens for Testing Plasma-Based Coagulation Assays and Molecular Hemostasis Assays. H21-A4. Wayne, PA: Clinical and Laboratory Standards Institute;2008.
2. Adcock DM, Kressin DC, Marlar R. Minimum Specimen Volume Requirements for Routine Coagulation Testing, Dependence on Citrate Concentration. Am J Clin Pathol
1998;109:598-99. 3. Marlar RA, Potts RM, Marlar AA. Effect on Routine and
Special Coagulation Testing Values of Citrate Anticoagulant Adjustment in Patients with High Hematocrit Values. Am J Clin Pathol 2006;126:400-5.
4. McGlasson DL. A review of variables affecting PTs/INRs. Clin Lab Sci 1999;12:353–8.
5. Koepke JA, Rodgers JL, Ollivier MJ. Pre-instrumental variables in coagulation testing. Am J Clin Pathol 1975;64:591-6.

RESEARCH AND REPORTS
94 VOL 26, NO 2 SPRING 2013 CLINICAL LABORATORY SCIENCE
6. Adcock DM, Kressin DC, Marlar RA. Effect of 3.2% vs. 3.8%sodium citrate concentration on routine coagulation testing.Am J Clin Pathol 1997;107:105-10.
7. Reneke J, Etzell J, Leslie S, et al. Prolonged prothrombin timeand activated partial thromboplastin time due to under-filled
specimen tubes with 109 mmol/L (3.2%) citrate anticoagulant. Am J Clin Pathol 1998;109:754-7.
8. Siegel JE, et al. Monitoring Heparin Therapy. APTT resultsfrom partial- vs full-draw tubes. Am J Clin Pathol 1998;110:184-7.
Purchase ASCLS logo and laboratory-related items at the ASCLS Custom Store. Shirts, mugs, iPad and Kindle covers, and more!
Show your professional pride!
Go to the ASCLS homepage, www.ascls.org, let your mouse hover over About Us and Celebrate, then click on Apparel Custom Store.

VOL 26, NO 2 SPRING 2013 CLINICAL LABORATORY SCIENCE 95
RESEARCH AND REPORTS
Sequential Assessment of Troponin in the Diagnosis of Myocardial Infarction
BRANDON EDWARDS, IRSHA WASHINGTON, LESTER PRETLOW, GREGORY PASSMORE,
JAMES DIAS, SCOTT WISE ABSTRACT According to the American Heart Association, cardiovascular disease accounts for more than one third of all deaths in the United States. 1 The purpose of this retrospective case-control study was to determine which sample taken in a sequential draw was most important in diagnosing an acute myocardial infarction (AMI). One-hundred subjects were selected from a convenience sample. The “risk” of AMI diagnosis was modeled using binary multiple logistic regression. Overall, 78% (39 out of 50 cases) were diagnosed with an AMI at Tinitial. Clearly, the initial cTnI assay is the most critical of the four sequential time points for the accurate assessment of the presence or absence of an AMI. Most importantly, sequential troponin testing increased the ability to diagnose AMI by 10-fold. ABBREVIATIONS: ECG - electrocardio-gram, CK - creatine kinase, AMI – acute myocardial infarction, cTnI - cardiac troponin I, CSRA - Central Savannah River Area, STEMI - ST-elevation myocardial infarction INDEX TERMS: Acute myocardial infarction, Troponin I, Electrocardiogram Clin Lab Sci 2013;26(2):95 Brandon Edwards, MHS, Department of Medical Labo-ratory, Imaging and Radiological Sciences, Georgia Regents University, Augusta, GA Irsha Washington, MHS, Department of Medical Labo-ratory, Imaging and Radiological Sciences, Georgia Regents University, Augusta, GA Lester G. Pretlow, Ph.D., C(ASCP)CM, NRCC(CC), De-partment of Medical Laboratory, Imaging and Radiological Sciences, Georgia Regents University, Augusta, GA
Gregory Passmore, PhD, Department of Medical Labo-ratory, Imaging and Radiological Sciences, Georgia Regents University, Augusta, GA James Dias, PhD Department of Medical Laboratory, Im-aging and Radiological Sciences, Georgia Regents University, Augusta, GA Scott Wise, MHS, Department of Medical Laboratory, Imaging and Radiological Sciences, Georgia Regents University, Augusta, GA Address for Correspondence: Lester G. Pretlow, Ph.D., C(ASCP)CM, NRCC(CC), Chair and Associate Professor, Department of Medical Laboratory, Imaging and Radiological Sciences, Georgia Regents University, 987 St. Sebastian Way, EC-3338, Augusta, GA 30912, 706-721-7629, [email protected] The American Heart Association (2008) reported that cardiovascular disease accounted for more than one third of all deaths in the United States.1 An early and accurate diagnosis of myocardial infarction (MI) has continued to be a safety issue for patients who present to the emergency department with chest pain. Previously, such patients were evaluated solely based on their past history, physical examination, electrocardio-gram (ECG), and assessment of creatine kinase (CK) and CK-MB fractions.2 As advancements in research continue to evolve, many hospitals have adopted the assessment for the cardiac protein troponin I in sequential blood sampling as a more rapid biomarker to correctly diagnose an AMI. The purpose of our study was to determine which sample out of multiple samples in a sequential draw was most predictive in the differential diagnosis of acute myocardial infarction for patients in an emergency department of the Central Savannah River area. Polanczyk et al (1998) conducted a cohort study to

RESEARCH AND REPORTS
96 VOL 26, NO 2 SPRING 2013 CLINICAL LABORATORY SCIENCE
evaluate the diagnostic and prognostic value of cardiac troponin I in chest pain patients over age 30 (mean age of 61) who presented to the emergency department of the Brigham and Women’s Hospital between July 1994 and June 1995.2 Blood sampling occurred after admission and every 8 hours for at least a 24 hour period to examine cardiac enzyme measurements for CK and CK-MB according to a standard; and likewise, cardiac troponin I (cTnI) was measured to rule out myocardial infarction (MI). The investigators analyzed all samples on the Stratus instrument with a lower level of detection (LLD) for cTnI at 0.4 ng/mL and an upper reference limit (URL) of cTnI at 1.5 ng/mL. Although determining cTnI was not the standard diagnostic tool for this hospital, the researchers concluded that it showed better performance than CK-MB mass assay for ruling out MI.
Kontos et al (2000) examined troponin I (cTnI) in relation to cardiac events in a large, heterogeneous, nonselected patient group for exclusion of myocardial infarction (MI) at the Medical College of Virginia Hospital’s Emergency Department.3 They collected samples at the time of admission, at 8 hours, and continued at 6 to 8 hour intervals for patients who had recurrent symptoms indicative of MI. cTnI was measured in plasma on the Opus Magnum Analyzer using 0.5 ng/mL as the lower limit for detectability and 2.0 ng/mL as the manufacturers’ suggested diagnostic value for MI. The predictive value demonstrated that when cTnI was used as part of an 8hr rapid diagnostic protocol, it had a high sensitivity (92 to 98%) for identifying patients who had an AMI.
The purpose of the study by Straface et al (2008) was to develop a more rapid and thorough screening protocol in the ED with multimarkers for MI to eliminate false positive results and unacceptable false negative results.1 The authors compared a rapid, point-of-care multimarker protocol with a single serial troponin I (cTnI) draw only. The conclusion of this study was that the new rapid multimarker protocol seemed to be superior to just the serial troponin draw alone approach for managing patients who present to the ED with chest pain or AMI.
From January 2007 through December 2008, Keller et al (2009) evaluated the diagnostic accuracy and clinical usefulness of a sensitive troponin I assay in a
multicenter study for early diagnosis of MI in 1818 consecutive chest pain patients who presented to three German study centers.4 The sensitive cTnI assay provided an overall 90.7% sensitivity and 90.2% specificity regardless of the time that had elapsed between chest pain onset and hospital admission. The researchers concluded that the elevated cTnI values measured at the time of admission with the sensitive assay provided diagnostic accuracy in early discrimination of MI.
Madsen et al (2006) performed a study to define the time course of cardiac troponin (cTnI) degradation in patients with acute ST-elevation myocardial infarction (STEMI).5 Using the ASSENT-2 study, the researchers randomized 26 males, ages 33-72, hospitalized with STEMI to 2 different thrombolytic drugs (tenecteplase and alteplase) within 6 hours after onset of their symptoms.6 Blood samples were drawn just before initiation of thrombolysis and at 30 minutes intervals (7 samples per patient). cTnI analysis was done by Western blot. The results were that all patients exceeded the cTnI cutoff for MI at admission. The study concluded that cTnI was detectable approximately 90 minutes after the onset of symptoms.
The purpose of this study was to determine which sequential cardiac troponin I (cTnI) sample was most predictive for accurately diagnosing an MI. The investigators expected that patients experiencing chest pain were admitted from the emergency department observational unit (EDOU) after their cTnI concentrations were above a normal reference range, and patients were not withheld for further cardiac observation if the cTnI assessment remained within normal limits after sequential testing. The covariants for this study were cardiovascular risk factors such as race, age, and gender, along with the protocol. The independent variables for the study were the times to the MI event (i.e. Tinitial, T3hr, T6hr, and T8-12hr). The dependent variable for the study was the presence or absence of an MI event. The investigators correlated the data statistically with the findings using a logistic regression model. Data was characterized by event-times which were determined from a specific initial time that reflected a starting point for cTnI assessment until the time that a patient was diagnosed with an MI. This data was limited to a 12-hour period wherein the investigators were concerned with any point in time

RESEARCH AND REPORTS
VOL 26, NO 2 SPRING 2013 CLINICAL LABORATORY SCIENCE 97
that an individual had a risk, or hazard, of having an MI. The binary multiple logistic regression model is a standard statistical model of analysis that named the serial blood sampling protocols as a dichotomous variable with two levels: Protocol Not Followed and Protocol Followed to aid the investigators in understanding the significant time points when an MI is diagnosed. The 𝜒2 and two-sample t-tests were conducted to determine case and control group differences in the proportions and means for the covariants. The investigators ascertained which sample was critical in the series of draws for cTnI as well as the significance of age and whether the protocol was followed or not in the determination of MI. METHODS The study was a retrospective case-control study of 50 consecutive patients who presented to the emergency department of Georgia Health Sciences Health Systems with angina pectoris, commonly known as chest pain, and underwent sequential blood sampling for cardiac troponin I (cTnI) analysis in an effort to diagnose acute myocardial infarction (AMI). The subjects were residents of Richmond and Columbia counties in Georgia and those who resided in the surrounding Central Savannah River Area (CSRA). Potential cases were men and women who were 40 – 79 years of age and were diagnosed with an MI between January 1, 2010 and December 31, 2010. Control subjects were of the same geographic regions as the cases and similar for race, gender, and age criteria. The MI cases and controls were identified and selected from the Georgia Health Sciences Health Systems’ medical records database using Powerchart from a patient work list based on specific ICD-9 code 786.50 for chest pain NOS (controls) and ICD-9 code 410.71 for AMI (cases). Medical records were reviewed to retrieve demographic characteristics and clinical history of the study population, cardiovascular risk factors, and laboratory analyses such as cTnI concentrations, admission status, MI diagnosis, and discharge. Subjects were eligible to be a case if the medical record showed a final diagnosis of MI based upon laboratory findings of the initial, second, third, or fourth cTnI assessment. Subjects who presented in the ED with a final diagnosis of chest pain were eligible to be controls. cTnI was measured either directly by using a point-of-care device (I-Stat, Abbott Laboratories) or a traditional method (Centaur, Siemens Health Systems) of testing in the core laboratory.
All data was analyzed statistically by a binary multiple logistic regression model. The binary multiple logistic regression model tested the covariable effects of each factor (e.g. race, gender, and age) and gave an odds ratio. An odds ratio was also calculated for the protocol being followed or not followed. Odds ratios represented the increased or decreased risk of an MI event at the points of cTnI assessment. The risks for the subgroups were assumed to be proportional in the odds ratios. Therefore, values above one (>1.0) indicated a higher risk, values below one (<1.0) indicated a lower risk, and values equal to one (=1.0) indicated that there was no increased or decreased risk of having an MI. Both race and gender covariables were selected equally for cases and controls. That is, equal proportions of males and females and equal proportions of Caucasians and African Americans were randomly chosen for both case and control subjects. According to the AMI diagnostic protocol for sequential cTnI testing, blood draws were to be taken when patients initially presented to the emergency department (ED) with angina pectoris (chest pain) and at 3 hours, 6 hours, and from 8 to 12 hours after their initial cTnI assessment. A dichotomous predictor variable of the chest pain pathway protocol was created with two levels: protocol not followed and protocol followed. All statistical tests were conducted at the α = 0.05 significance level. The objective was to identify the strength time interval that was most predictive and diagnostic of an MI based on the sequential assessment of cTnI. RESULTS Table 1 shows the characteristics of cases with a diagnosis of acute myocardial infarction (AMI) at the time of discharge. Table 1 also displays the characteristics of the controls who had a discharge diagnosis of chest pain. Control patients also received the cTnI testing protocol. As stated previously, there were equal proportions of males and females and equal proportions of Caucasians and African Americans who were chosen for both case and control subjects. Table 2 displays the odds ratios in the column (Exp (B)) and the 95% confidence intervals representing upper and lower limits for the dichotomous predictor variable (protocol followed) and the covariable (age). Age is a significant contributor to risk of having an AMI in that patients diagnosed were generally older. Following the protocol is a significant factor in being able to rule-in an AMI with the ability to detect an AMI having a 10-fold

RESEARCH AND REPORTS
98 VOL 26, NO 2 SPRING 2013 CLINICAL LABORATORY SCIENCE
increase when the protocol was followed. The Hosmer and Lemeshow goodness-of-fit test was conducted on the multiple logistic regression data to determine what percentage of cases and controls were correctly classified.7 Table 3 is a 2x2 contingency table representing either correct or incorrect classifications of cases and controls using the variables age, gender, race, and protocol. Seventy-seven percent of the cases and controls were correctly classified. The test indicated a good statistical fit of the research model (𝜒 2 = 10.6, 8 df, p = 0.226).
Table 1. Characteristics of study subjects with and without a diagnosis of acute myocardial infarction (AMI) at discharge
Variables No AMI (controls) AMI (cases) P-value* n = 50 n = 50
Age (yrs) 54.0 ± 8.414 61.5 ± 7.691 < 0.001 Gender Female 25 (50) 25 (50) 1 Male 25 (50) 25 (50) Race White 25 (50) 25 (50) 1 Black 25 (50) 25 (50) Protocol < 0.001 Not Followed 34 (68) 11 (22) Followed 16 (32) 39 (78)
Note: Table entries for the quantitative variables are of the form mean ± standard deviation. Table entries for the qualitative variables are of the form count (percentage). * Determined by t-test for quantitative variables and 𝜒 2 test for qualitativevariables
Table 2. Final statistics of the multiple logistic regression analysis of the presence of acute myocardial infarction (AMI) diagnosed at discharge
95% C.I. for Variable B S.E. Wald df Sig. Exp (B) Exp (B)
Lower Upper Age .137 .034 15.974 1 .000 1.146 1.072 1.226 Protocol (Not 2.342 .544 18.503 1 .000 10.402 3.578 30.237 Followed) Constant -9.586 2.220 18.645 1 .000 .000
Note: Reference categories for the dichotomous qualitative variables are in parentheses.
Three-hour cTnI assessments were not done for 23 (46%) controls and were not done for 48 (96%) cases. Six-hour cTnI assessments were not done for 16 (32%) controls and were not done for 26 (52%) cases. Eight-to-12-hour cTnI assessments were not done for 16
(32%) controls and were not done for 17 (34%) cases. There were only 11 out of 50 cases with an initial cTnI level < 0.5 ng/mL who were found on subsequent testing to have at least one cTnI level > 0.5ng/mL. Therefore, these 11 subjects were diagnosed as having an AMI.
Table 3. Classification table employing results of the multiple logistic regression prediction table with a cut value of 0.5
Predicted Observed Acute Myocardial Percent
Infarction Correct Control Case
Acute Myocardial Control 38 12 76 Infarction Case 11 39 78 Overall Percentage 77
Seventy-eight percent (39 out of 50 cases) were diagnosed with an AMI at Tinitial. None of these cases had a T3 performed which was a deviation from the protocol. Of the remaining 11 cases, 7 (14%) were diagnosed with an AMI at T6. The remaining 4 cases (8%) were diagnosed with an AMI at T8-12 (Table 4).
Table 4. What is the most significant draw in the series of cTnI analyses for the diagnosis of AMI?
n = 50 Tinitial T3 T6 T8-12 number diagnosed 39 0 7 4 % diagnosed 78 0 14 8
Note: Table entries show that most AMIs were diagnosed on the initial serial draw.
DISCUSSION What is the most significant draw in the series of cTnI analyses for the diagnosis of AMI? From the collected data, the investigators conclude that the initial cTnI blood draw is clearly the most important of the four sequential time points for the accurate assessment of the presence or absence of AMI for those presenting to the emergency department with angina pectoris. Table 4 highlights this observation showing that 78% of the cases were diagnosed at the Tinitial.
Table 1 reflects significant group differences in whether or not the sequential cTnI assessment protocol was followed. The protocol was not followed 32% of the time for controls as compared to 77% of the time for cases. Cases that were not followed were missing at least one cTnI assessment between the initial cTnI and when a positive result was obtained. If the AMI was diagnosed

RESEARCH AND REPORTS
VOL 26, NO 2 SPRING 2013 CLINICAL LABORATORY SCIENCE 99
on the initial or any cTnI in sequence, the protocol was considered followed. There was a 10-fold increase in the ability to diagnose an AMI if the protocol was followed compared to not followed (Table 2, Odds ratio 10.4, p-value < 0.001). Also note from Table 2, based on the 95% CI of the odds ratio, there was a maximum of a 30-fold increase of detecting an AMI if the protocol was followed. Therefore, it is critical that the AMI diagnostic protocol for sequential cTnI testing be followed consistently. The covariable age demonstrated a statistically significant difference between the cases and controls. The risk of an AMI increased by 15% with each year of advancing age (Table 2, Odds ratio = 1.146, p-value < 0.001). Subjects with an AMI diagnosis were, on average, approximately 7.5 years older than control subjects. This shows that older individuals experiencing chest pain are more likely to be having an MI than younger patients. Race and gender may also be a factor; however this experimental model controlled for both. Using the predictor variable (protocol followed/not followed) and the covariable (age), allowed the investigators to correctly classify cases and controls as having or not having an AMI 77% of the time using the Hosmer and Lemeshow goodness-of-fit test (Table 3). Out of 50 subjects in the control group, 38 were classified as true controls with the remaining 12 control subjects resembling cases. Out of 50 subjects in the case group, 39 were classified as true cases and the remaining 11 subjects in the case group resembled controls (Table 3). The Hosmer and Lemeshow goodness-of-fit test indicates a good fit of the multiple logistic regression model (𝜒2 = 10.6, 8 df, p = 0.226).7 The clinical findings of this study support that the AMI diagnostic protocol for sequential cTnI testing be followed in the future to improve the ability to diagnose an AMI quickly. However, these results also show that four
serial draws are not necessary to diagnose an AMI. Georgia Regents University has changed their protocol to include only an initial draw and a T6. LIMITATIONS A limitation of this study is that the protocol was not followed in all cases and controls. In addition, a small cohort of only 50 patients may not be representative of the population. The study excluded other biomarkers and assessments such as CK-MB and myoglobin. Finally, all collected data only reflected up to 12 hours after ED admission such that, AMI occurrences after 12 hours were not noted and patients discharged or readmitted before 12 hours were not followed. REFERENCES: 1. Straface A L, Myers J H, Kirchick H J, & Blick K E. A Rapid
Point-of-Care Cardiac Marker Testing Strategy Facilitates the Rapid Diagnosis and Management of Chest Pain Patients in the Emergency Department. Am J of Clin Path 2008:129(5): 788-95.
2. Polanczyk C A, Lee T H, & Cook E F, et al. Cardiac troponin I as a predictor of major cardiac events in emergency department patients with acute chest pain. J of the Am Col of Cardiology 1998;32(1):8-14.
3. Kontos M C, Anderson, F P, and Alimard R, et al. Ability of troponin I to predict cardiac events in patients admitted from the emergency department. J of the Am Col of Cardiology 2000;36(6):1818-23.
4. Keller T, Zeller T, Peetz D, & Tzikas S, et al. Sensitive troponin I assay in early diagnosis of acute myocardial infarction. The N Eng J of Med 2009;361:868-77.
5. Madsen L H, Christensen G, Lund T, & Serebruany V L. Time Course of Degradation of Cardiac Troponin I in Patients with Acute ST-Elevation Myocardial Infarction: The ASSENT-2 Troponin Substudy. Circ Res 2006;99(10):1141-7.
6. Sinnaeve P, Alexander J, Belmans A, & Bogaerts K, et al. One-year follow-up of the ASSENT-2 trial: a double-blind randomized comparison of single-bolus tenecteplase and front-loaded alteplase in 16,949 patients with ST-elevation acute myocardial infarction. Am Heart J 2003;146(1):27-32.
7. Hosmer, D.W., and S. Lemeshow. Applied Logistic Regression, 2nd ed. New York: JohnWiley and Sons, 2000.
The peer-reviewed Research and Reports Section seeks to publish reports of original research related to the clinical laboratory or one or more subspecialties, as well as information on important clinical laboratory-related topics such as technological, clinical, and experimental advances and innovations. Literature reviews are also included. Direct all inquiries to Maribeth L. Flaws, Ph.D., SM(ASCP)SI, Associate Chairman and Associate Professor, Department of Medical Laboratory Science, Rush University Medical Center, 600 S Paulina Suite 1018A, Chicago IL 60612, [email protected]. Clinical Laboratory Science encourages readers to respond with thoughts, questions, or comments regarding these articles. Email responses to [email protected]. In the subject line, please type the journal issue and lead author such as “CLIN LAB SCI 26(2) RE EDWARDS”. Selected responses may appear in the Dialogue and Discussion section in a future issue. Responses may be edited for length and clarity. We look forward to hearing from you.
100 VOL 26, NO 2 SPRING 2013 CLINICAL LABORATORY SCIENCE
RESEARCH AND REPORTS
Causes of Historically Low Abstract Submissions for the ASCLS Annual Meeting
MICHELLE BUTINA, LESTER G. PRETLOW, BARBARA SAWYER, FRANK J. SCARANO, JOAN POLANCIC
ABSTRACT The Abstract Review Committee (ARC) has an ongoing objective of encouraging abstract submissions for the American Society of Clinical Laboratory Science’s (ASCLS) Annual Meeting. The purpose of this research study was to survey ASCLS members to determine the cause of historically low abstract submissions and how submissions could be increased. An electronic survey was developed and sent to ASCLS members via electronic mail blast. The survey focused on five areas: 1) participant demographics, 2) positives and negativesof the current submission and review process, 3) suggestions for improvement, 4) barriers to participation, and 5) level of attendance at poster and oral presentation sessions at annual meetings. Results of the survey indicated that the foremost reason cited for not submitting an abstract was lack of active research. The ARC believes limited research activity is due to the lack of educational preparedness of educators and practitioners to conduct research.
ABBREVIATIONS: ASCLS - American Society for Clinical Laboratory Science, ARC - Abstract Review Committee, MLS - Medical Laboratory Science
INDEX TERMS: Research Activities, Research and Development, Peer Review, Research
Clin Lab Sci 2013;26(2):100
Michelle Butina, Ph.D., MLS(ASCP)CM, Medical Labo-ratory Sciences, University of Kentucky, Lexington, KY
Lester G. Pretlow, Ph.D., C(ASCP)CM, NRCC(CC), De-partment of Medical Laboratory, Imaging and Radiologic Sciences, Georgia Regents University, August, GA
Barbara Sawyer, Ph.D., MLS(ASCP)CM, MB(ASCP)CM, TTU Health Sciences Center, Dept. of Laboratory Sciences and Primary Care, Lubbock, TX
Frank J. Scarano, Ph.D., MLT(ASCP)MCM, Depart-ment of Medical Laboratory Science, University of Massachusetts Dartmouth, Dartmouth, MA 02747
Joan Polancic, MSEd, MLS(ASCP)CM, ASCLS, Director of Education & Project Planning, Tysons Corner, VA
Address for Correspondence: Michelle Butina, Ph.D., MLS(ASCP)CM, Program Director and Assistant Professor, Medical Laboratory Sciences, University of Kentucky,
Charles T. Wethington Bldg. Room 126E, 900 South Limestone Street,, Lexington, KY 40536-0200, 859-218-0852, [email protected]
According to the 2011-2012 Abstract Review Committee (ARC) Strategic Action Plan, abstract submissions for presentation at the American Society for Clinical Laboratory Science (ASCLS) Annual Meeting have remained low for several years. From 2004 to 2011, the average number of abstract submissions has been less than 50 per year. In 2011, the ARC extended the traditional abstract deadline of January 15th to April 15th in an effort to increase abstract submissions, a strategy that did indeed increase submissions that year. To determine further reasons for the low submission number, the ARC has continued its investigation of the issue, and in 2011 the committee developed a survey in an effort to understand two specific aims. The first aim was to assess why submissions have remained low for many years, and second, how could abstract submissions be increased. The ARC hypothesized that the answer to these specific aims was most likely related to the ability of medical laboratory scientist (MLS) professionals to conduct research.
Laudicina et al (2011) gathered data describing the educational preparation of MLS professionals for conducting research.1 The investigators developed a three-part online survey that was sent by electronic mail

RESEARCH AND REPORTS
VOL 26, NO 2 SPRING 2013 CLINICAL LABORATORY SCIENCE 101
to 7572 members of the ASCLS and 500 program directors of accredited clinical laboratory programs. The main outcomes were the quantitative and qualitative measures of professional preparation for conducting research. The investigators also collected descriptions of the clinical laboratory programs' research curricula. The results indicated that twenty-two percent of MLS undergraduate programs offer a separate research course in the curriculum while thirty-seven percent of the programs required completion of a research project. The remaining programs that responded to the survey had no research component in their curriculum. In addition, the investigators discovered certain barriers to participation in research for undergraduates such as time limitations, insufficient faculty, and lack of funds. They concluded that since less than one-fourth of MLS undergraduate programs offer a separate research course, the formal educational backgrounds of MLS professionals leave them unprepared and untrained to conduct research. The investigators also noted that of the relatively small number of programs that offer a graduate degree in MLS, not all of them required completion of a research project. In another article, Laudicina et al (2011) studied the state of research in clinical laboratory science by examining the research engagement and scholarly activities of MLS professionals in different employment settings.2 They found that 91 of 504 (18%) respondents were required to conduct research, with one to four hours a week dedicated to research by 17% of respondents. Also, the investigators discovered that only a small number of participants had ever served as principle investigator (PI) or co-PI on a grant or as a research team member. Laudicina et al (2011) identified several significant barriers to conducting research for MLS professionals, including lack of funding, time demands, lack of graduate students, and limited or insufficient access to statistical support.2 The investigators concluded that although MLS professionals were participating in research, major barriers, such as lack of funding, were prevalent across all employment settings. In a more focused study, Waller, Clutter and Karni (2010) studied the state of research and scholarship of faculty members in clinical laboratory science educational programs.3 They found that out of 275 respondents, the majority indicated teaching was their
primary responsibility and considered it more important than research. More than a third of respondents had not published a peer reviewed article or abstract. The investigators discovered that of the faculty members conducting research, the majority were those with a doctorate degree in a tenure track position. Interestingly, investigators discovered that generally 50% of scholarship in the profession was being performed by only 10% of faculty members.4 The purpose of the ARC Strategic Action Plan was to investigate the ongoing reasons for limited abstract submissions to the ASCLS Annual Meeting and to develop a plan for increasing abstract submissions in the future. The ARC developed a survey in the hope of answering questions in five overarching areas. First, what were the educational and certification backgrounds of participants? Second, what were the good and bad points of the abstract submission and review process? Third, how might the onsite oral and poster sessions be improved? Fourth, what are the barriers to participation in abstract submission? Finally, what abstracts sessions were supported or attended by participants at the annual meeting? The ARC believed that these five areas were important for understanding the processes that contribute to presentation in oral and poster sessions. The investigators hypothesized that lack of participation of MLS professionals in research would be a major causative agent for the stagnant number of abstract submissions over the past nine years. Additionally, the ARC believed that low number of abstract submissions were functions of the educational background and preparedness of MLS professionals to conduct research. METHODS To better serve ASCLS members, the ARC developed a fourteen question survey to poll laboratory practitioners regarding the ongoing reasons for limited abstract submissions as well as participation and satisfaction with the abstract submission and review process. Some survey questions were modified, with permission, from surveys used informally in the past by the ARC and other interested parties in ASCLS. Other questions were newly developed specifically for this activity. The questions were specifically designed to gather data in five general categories to address the five areas of concern mentioned previously: 1) demographics 2) positives and negatives of the current system 3)

RESEARCH AND REPORTS
102 VOL 26, NO 2 SPRING 2013 CLINICAL LABORATORY SCIENCE
suggestions for improvement 4) barriers to participation and 5) level of attendance at poster and oral presentation sessions at annual meetings.
The first two questions assessed the education level and certification of the participants in an attempt to categorize their level of preparedness for participation in a research presentation. The next questions divided the participants into two groups: those who had previously submitted abstracts and those who had not. Those who had submitted abstracts previously were asked about their satisfaction with the submission process, how it might be improved, and how they would rate their onsite experience at the Annual Meeting. Those who had not submitted previously were queried about reasons that prevented them from participating.
All survey participants were asked about the society meetings they attended and if they attended poster or oral member-submitted abstract sessions while at those meetings. All participants were also asked to make suggestions about how to improve the overall quality and quantity of abstract submissions and about topics that would peak interest and attendance at these types of sessions.
Participation in the survey was voluntary and anonymous. Survey participants were recruited via electronic mail blast to 7,541 ASCLS members. The e-mail blast contained a brief description of the survey and a link that directed the participants to a secure website (SurveyMonkey) for completion of the survey. Anonymous data were collected by the survey software and provided to the committee for review. Responses were linked such that an individual’s answers could be taken together and analyzed further (for example, demographics and level of participation), but no response could be linked to a specific person.
Collected data were tabulated by SurveyMonkey and analyzed by the ARC using quantitative and qualitative measures. Quantitative measures included review of close-ended questions in which statistical results were produced while qualitative measures included review of open-ended questions in which patterns or themes were produced.
RESULTS Responses to the ARC online survey were received from
411 ASCLS members, or 5.5% of those surveyed.
What were the Educational and Certification Backgrounds of Participants? Participant demographic questions assessed their highest education and certification levels. Highest academic degrees earned by respondents included: PhD 11.8%, EdD 1.2%, MS/MA 29.4%, BS/BA 45.3%, AAS/AS 5.1%, and other 7.1%. Respondents’ levels of certification (selecting all that applied) included: specialist 17.0%, generalist (baccalaureate degree level) 71.5%, categorical (baccalaureate degree level) 7.9%, generalist (associate degree level) 6.4%, and other 12.3%.
What were the Positives and Negatives of the Abstract Submission and Review Processes? One major objective of this online survey was to determine if participants had submitted an abstract for presentation (poster or oral) at an ASCLS Annual Meeting. Only 18.5% of the 411 respondents had submitted an abstract for the Annual Meeting, and of those 93.7% were accepted. Of the accepted abstracts, 34.0% were from respondents with a Ph.D., 11.8% of the total respondents. Three percent of the accepted abstracts were from Ed.D.’s, accounting for 1.0% of the total respondents. Forty-five percent of accepted abstracts were submitted by the 29.4 % of the respondents who possessed an MS/MA degree. Sixteen percent of the accepted abstracts were from respondents with a BS/BA degree that included 45.3% of the respondents. AAS/AS degree holders completed the survey (5.1% of respondents), but none submitted an abstract. For the category “Other” (7.1% of respondents), two percent had abstracts accepted for presentation. The complete results are summarized in Table 1.
Fifty-four percent of the Ph.D. respondents had never submitted an abstract. Seventy-two percent of the MA/MS respondents had never submitted an abstract. Percentages of respondents of other educational levels who had never submitted an abstract were: Ed.D., 40.0%, BS/BA, 93.0%, AAS/AS, 100.0%, and other, 86.2%.
Participants were asked to provide open-ended responses to what they liked most and least about the abstract review process. The foremost theme that

RESEARCH AND REPORTS
VOL 26, NO 2 SPRING 2013 CLINICAL LABORATORY SCIENCE 103
emerged from these responses (N=37) regarding the positive aspects of the review process was the helpful feedback given by the abstract reviewers. This result was further supported by a close-ended question in which 80.4% of 46 respondents found the abstract editorial revision process to be helpful. Other positives included the ease and timeliness of the revision and submission process.
Table 1. Abstract Submissions by Educational Level
Educational % of % of Abstracts % Respondents who Level Respondents Accepted have never submitted PhD 11.8 34.0 54.2 EdD 1.20 3.00 40.0 MS/MA 29.4 45.0 72.5 BS/BA 45.3 16.0 93.0 AAS/AS 5.10 0.00 100.0 Other 7.10 2.00 86.2
Note: A large number of questionnaire respondents from all educational levels have never submitted an abstract to the ARC. There were two prominent responses (N=38) regarding the negative aspects of the review process. One was the time lag between submission and final acceptance, and the other was that there were no complaints/issues with the abstract review process. The latter result was further supported by an open-ended question regarding recommendations for improvements in which the majority of respondents (N=36) indicated that the process was adequate with no improvements necessary. All survey participants were asked to provide open-ended recommendations to improve either the quality or quantity of Annual Meeting abstract submissions. The most prominent response that emerged from the responses (N=137) was the need for resources to assist those in preparing an abstract, or a poster or oral presentation. Other suggestions focused on specific presentation content, awareness and promotion issues and incentive possibilities. How the Onsite Oral and Poster Sessions Might be Improved? Regarding participants’ onsite ASCLS Annual Meeting experience, 67 respondents found their experiences to be: excellent 25.4%, favorable 89.6%, needs improvement 4.5%, and not applicable 6.0%. This indicates that there is not a strong need for improvement of the sessions at the meeting.
What are the Barriers to Participation in Abstract Submission? Reasons as to why 81.5% of respondents’ had not submitted an abstract to the Annual Meeting are presented in Table 2. It was revealing to note that 77.5% of respondents were not involved in research or the development of case studies.
Table 2. Reasons as to why respondents have not submitted an abstract. (N=297)
Answer Options Response % Frequency Not involved in research 48.5 144 I do not know enough about 44.8 133 the abstract process Expense of attending the 31.3 93 annual meeting I do not know how to get started 31.3 93 Not involved with case studies 29.0 86 No time for this type of activity 25.6 76 Employer does not support this 23.9 71 activity (travel, time off, printing posters) Other 20.9 62 I do not like public speaking 16.2 48 Nothing of interest to present 12.1 36 I submit to other scientific 10.1 30 meetings instead Inconvenient deadline for 3.0 9 abstract submission ASCLS Annual Meeting is 2.4 7 not appropriate for my discipline/institution
*Respondents could check all that apply. ASCLS = American Society for Clinical Laboratory Science. What Sessions were Supported or Attended by Respondents at the Annual Meeting? The majority of respondents attended poster presentations (75.1%) and oral presentations (64.3%) at the ASCLS Annual Meeting or when attending other professional meetings. Additionally, respondents were asked to select the conferences that they most often attended and responses were documented in Table 3. DISCUSSION The existence of most professional organizations depends in part on the input of interesting or innovative ideas from the members. For science-based organizations, these ideas are often presented at annual meetings or conferences in the form of data garnered from research projects or educational studies. In this regard, the number of submitted research abstracts to the ASCLS Annual Meetings has been relatively low. It

RESEARCH AND REPORTS
104 VOL 26, NO 2 SPRING 2013 CLINICAL LABORATORY SCIENCE
has been considered that this is due in part to the lack of participation of MLS professionals in research and additionally due to the educational background and preparedness, or lack thereof, of MLS professionals to conduct research. To examine these hypotheses, the ARC surveyed the ASCLS membership.
Table 3. Meetings respondents’ most often attend. (N=366)
Meeting Response % Frequency ASCLS 53.3 195 State or regional 42.3 155 CLEC 24.0 88 ASCP 15.3 56 Other 13.1 48 AACC 8.7 32 None 7.1 26 AABB 6.0 22 ASM 5.7 21 CLMA 5.7 21 CAP 3.3 12 CLSI 2.2 8
*Respondents could check all that apply. Key: ASCLS = American Societyfor Clinical Laboratory Science, CLEC = Clinical Laboratory Educators’ Conference, ASCP = American Society for Clinical Pathology, AACC = American Association for Clinical Chemistry, AABB = American Association of Blood Banks, ASM = American Society for Microbiology, CLMA = Clinical Laboratory Management Association, CAP = College of American Pathologists, CLSI = Clinical Laboratory Standards Institute
The majority of responses from the membership regarding their lack of abstract submission indicated that MLS professionals are indeed not involved in research (see Figure 1). Many of these ASCLS members are likely practicing laboratorians, perhaps best indicated by the percentage of respondents who are generalist baccalaureate degree holders. These individuals probably do not have much access to funding for initiation and completion of a study or project. Similar results were found by Mundt and Shanahan (2009) whose study focused on ASCLS members’ perceptions of research in which it was concluded that barriers to conducting research included lack of adequate resources and time.5
Results indicate that, as hypothesized, few MLS professionals actively participate in research. In today's economy, many MLS professionals must work extra shifts or longer hours. Even during a single shift there is little time to develop a case study, think of a project, develop and write a grant, or write down observations. Although not clearly indicated by the survey responses, MLS professionals who are educators almost certainly
face many of the same issues.
A curious response to the question of why respondents have not submitted an abstract is that they do not know enough about the abstract submission process or how to get started on an abstract or research project. This is of interest to ARC members because the ARC has published very concise and informative guidelines regarding the how-to of abstract submission on the ASCLS Annual Meeting website (http://www.ascls.org/ ?page=annual_meeting). In addition to this, a number of resources are available on the same website to all members that are intended to provide assistance to a first-time submitter or, once a submission has been accepted, support a first-time presenter. For MLS students and graduate MLS programs, program directors are sent email reminders about abstract submission for upcoming Annual Meetings. These aids were designed specifically to address the issue of MLS professionals and/or students being unaware of how to get started on an abstract or presentation.
The ARC has made abstract submission a simple, timely and helpful process. In 2011, the deadline for submission was moved to later in the spring to accommodate more schedules and increase the submission numbers. This strategy did result in a greater number of submissions than in previous years. Additionally, one of the positive aspects of abstract submission listed by the survey respondents is the helpful comments provided by the abstract reviewers. Each abstract is matched to two discipline-specific members of the ARC who remain anonymous to the submitter. Abstracts are reviewed and rated using a rubric that is consistent with the content category instructions given to the submitter prior to submission. If there are shortcomings in the abstract, each reviewer provides comments and suggestions for improvement.
The fact that only a fourth of undergraduate MLS programs offer a research course (Laudicina 2011) might explain in part why so few MLS professionals perform research.1 Some professionals are required to do so, but these are most likely employed in an educational setting. For students, including brief investigative research projects, such as method comparisons or assay designs with concomitant statistical analysis, in MLS undergraduate courses might alleviate this lack of education. Once the interest in research is sparked for

RESEARCH AND REPORTS
VOL 26, NO 2 SPRING 2013 CLINICAL LABORATORY SCIENCE 105
some students, they might be more willing to design a study, collect data in a clinical laboratory, or even pursue a position in a research laboratory setting when they become certified laboratorians. It has proven to be a difficult task to increase the number of abstract submissions to the ASCLS Annual Meeting. This survey study has given insight as to the reasons that abstract numbers have been low over the years, and the hypothesized reasons have been accepted as the explanation. The majority of MLS professionals do not actively participate in research or are inherently unprepared to do so. Perhaps it will take a major shift in thinking and education before this issue will be resolved.
REFERENCES: 1. Laudicina R, Fenn J, Freeman V, McCoy C, McLane MA,
Mundt L, et al. Research in Clinical Laboratory Science: Professionals’ Educational Preparation. Clin Lab Sci. 2011;24(4):243-8.
2. Laudicina R, Fenn J, Freeman V, McCoy C, McLane MA, Mundt L, et al. Research in Clinical Laboratory Science: Professionals’ Involvement. Clin Lab Sci. 2011;24(4):235-42.
3. Waller K, Clutter J, Karni K. Research and Scholarship of Clinical Laboratory Science Faculty Members. Clin Lab Sci. 2010;23(3)Suppl:3-32-8.
4. Waller K, Karni K. Scholarly Activities of the Most Productive CLS Faculty and Schools in the U.S.A. Clin Lab Sci. 2010;23(3):175-9.
5. Mundt L, Shanahan K. ASCLS Members Perceptions Regarding Research. Clin Lab Sci. 2009:22(3):170-5.
An outstanding webinar series by
laboratory experts!

106 VOL 26, NO 2 SPRING 2013 CLINICAL LABORATORY SCIENCE
FOCUS: ENDOCRINOLOGY
Introduction to Endocrine Focus Series LINDA S. GORMAN, JANELLE M. CHIASERA
Clin Lab Sci 2013;26(2):106
Linda S. Gorman, PhD, MLS (ASCP)CM, University of Kentucky, Lexington, KY
Janelle M. Chiasera, PhD, MT (ASCP), University of Alabama at Birmingham, Birmingham, Alabama
Address for Correspondence: Linda S. Gorman, PhD, MLS (ASCP)CM, CLS Education Co-ordinator, Associate Professor, 900 S. Limestone Ave, Rm 126G CTW, University of Kentucky, Lexington, KY 40536-0200, (859)-218-0855, [email protected]
The endocrine system is a complex system responsible for regulating many body functions through an elaborate network of hormones. The field of endocrinology enjoys a rather rich history; but it is a young history. Terms such as hormone and endocrinology were introduced in 1905 and 1909, respectively, and the study of endocrine function began in the late nineteenth century (1890 – 1905). The first comprehensive endocrinology textbook was published in 1913 and since that time, growth in the field of endocrinology has been exponential. As a result of the complex nature of the endocrine system, the diagnosis, management, and treatment of endocrine disturbances have always been challenging. Laboratory diagnosis has ranged from a panel of laboratory tests including total and free hormone levels, uptake tests, and stimulation tests to definitive guidelines for diagnosing endocrine disturbance using sometimes fewer than two laboratory tests.
Of the hormone assays performed in clinical chemistry, the most common are those associated with the thyroid gland. Numerous vendors have found ways to
incorporate the thyroid hormone testing on automated platforms. Less common but equally called for are the hormone assays associated with the adrenal gland. The foundation of the hormone physiology is the negative feedback mechanism. Both thyroid hormones and adrenal hormones demonstrate this mechanism. Both have hypothalamic and pituitary hormones that respond to the gland-produced hormone in a negative feedback way.
This series of articles examines the physiology and pathology associated with thyroid and adrenal hormones. How these hormones impact our metabolism normally and in disease states can be confusing and puzzling. This series of three articles will provide you with an overview of the complexity of the endocrine system and the details of structure, function, and pathology for two major endocrine organs, the thyroid and adrenal glands.
The first article looks at the negative feedback mechanism and gives an overview of the relationship between the hypothalamus, the pituitary and endocrine glands, in general. This article sets the stage for understanding the negative feedback mechanism and how it works. The second article looks at the thyroid gland and in more detail describes the physiology and pathology of this gland system. The utilization of laboratory testing to define the deficiencies and excesses of thyroid hormones in disease states demonstrates how this information aids the physicians in the diagnosis of thyroid disease. The third article examines the adrenal gland system, both the cortex and medulla, as to how these hormones affect normal metabolism. This article also looks at the various disease states associated with the adrenal gland hormones and delineates the laboratory testing that aids in diagnosis.

VOL 26, NO 2 SPRING 2013 CLINICAL LABORATORY SCIENCE 107
FOCUS: ENDOCRINOLOGY
Endocrinology Review – Adrenal and Thyroid Disorders
LINDA S. GORMAN, JANELLE M. CHIASERA
LEARNING OBJECTIVES 1. Define endocrinology and list the major endocrine
glands of the body. 2. Explain how feedback (positive and negative)
promotes maintenance of normal levels of hormones.
3. Differentiate between steroid and peptide hormones with regard to their mechanism of action.
4. Provide examples of peptide and steroid hormones. 5. Explain how endocrine disorders are categorized. ABBREVIATIONS: ACTH - adrenocorticotropic hor-mone; ADH - antidiuretic hormone; CRH – cortico-tropin releasing hormone; DHEA – dehydroepian-drosterone; FSH - follicle stimulating hormone; GHRH - growth hormone releasing hormone; GnRH – gona-dotropin releasing hormone; HPT - hypothalamus, pituitary, target gland; LH - luteinizing hormone; MBST - membrane-bound signal transducer; SRE - steroid response element; TRH - thyrotropin releasing hormone; TSH - thyroid stimulating hormone INDEX TERMS: Endocrine Glands, Hormones, Hy-drocortosone, Hypoalamo-hypophyseal System, Pitui-tary-Adrenal System, Stress Clin Lab Sci 2013;26(2):107 Linda S. Gorman, PhD, MLS (ASCP)CM, University of Kentucky, Lexington, KY Janelle M. Chiasera, PhD, MT (ASCP), University of Alabama at Birmingham, Birmingham, Alabama Address for Correspondence: Linda S. Gorman, PhD, MLS (ASCP)CM, CLS Education Co-ordinator, Associate Professor, 900 S. Limestone Ave, Rm 126G CTW, University of Kentucky, Lexington, KY 40536-0200, (859)-218-0855, [email protected]
This article represents the first of three articles focusing on the endocrine system. The first article will provide you with fundamental theory regarding the endocrine system that will serve as a basis for understanding the next two articles focusing on two specific endocrine glands, the thyroid and adrenal glands. Endocrinology is the branch of medical science that deals with the endocrine system, a system that consists of several glands located in different parts of the body that secrete hormones directly into the bloodstream. Although every organ system in the body may respond to hormones, endocrinology focuses specifically on endocrine glands whose primary function is hormone secretion. Major endocrine glands include the pituitary (anterior and posterior), hypothalamus, thyroid, parathyroid, pineal, pancreas, adrenal (cortex and medulla), and gonads (ovaries and testes). Figure 1 shows the various locations of endocrine glands. Figure 1. Location of the Major Endocrine Glands. Image reprinted with permission of John Nagy. The HPT Axis The endocrine system is part of the body’s extracellular communication system that links the brain to various

FOCUS: ENDOCRINOLOGY
108 VOL 26, NO 2 SPRING 2013 CLINICAL LABORATORY SCIENCE
parts of the body and acts to control body metabolism, growth and development, and reproduction. The production and circulating levels of hormones are controlled by means of a feedback process that links the hypothalamus to the pituitary and the pituitary to a target gland. This linkage is referred to as the hypothalamus, pituitary, target gland (HPT) axis.1,2 Refer to Figure 2.
Figure 2. Hypothalamus, Pituitary, Target Gland (HPT) axis
In general terms, hormones are produced by specialized glands in one part of the body and travel through the bloodstream to result in a biological effect at a distant site. The hypothalamus is considered to be the “master gland” of this axis as it takes signals from cortical inputs, autonomic function, and other environmental triggers and delivers signals (via releasing hormones) to target cell types in the pituitary gland. The pituitary gland responds by releasing hormones that act on target glands to produce specific target gland hormones. For example, thyrotrophin releasing hormone (TRH) produced by the hypothalamus acts on thyrotroph cells of the pituitary gland to produce thyroid stimulating hormone (TSH). Thyroid stimulating hormone acts directly on the thyroid gland (target gland) to produce thyroid hormones. Refer to Table 1 for other examples of releasing hormones and their effect on pituitary and target glands.1,2
The hypothalamus gland is located in the brain above the brain stem and below the thalamus.3 In humans, the hypothalamus is the size of an almond. Its functions include releasing the trophic hormones called “releasing hormones”. These trophic hormones span from Thyrotropin Releasing Hormone (TRH), which affects the release of thyroid hormones, Corticotropin
Releasing Hormone (CRH), which affects adrenal hormones, to ones that foster sexual characteristics (Gonadotropin Releasing Hormone) and growth (Growth Hormone Releasing Hormone). Our focus here is on the thyroid and adrenal glands so we will leave the other hypothalamic hormones for others to discuss. (Figure 2, Table 1.)
Table 1. Releasing Hormones and Their Effect on Pituitary and Target Glands
Hypothalamic Cellular Target/Pituitary Target Gland/Target Hormone Gland Hormone Gland Hormone(s)
Corticotropin Releasing Corticotroph/ Adrenal gland Hormone (CRH) ACTH (Cortisol)
Thyrotropin Releasing Thyrotroph/TSH Thyroid Gland/ Hormone (TRH) T3 and T4
Growth Hormone Somatotroph/GH All tissues Releasing Hormone
(GHRH)
Gonadotropin Releasing Gonadotroph/ Gonads/Testosterone Hormone (GnRH) LH and FSH and Estrogen
In the hypothalamus the tropic releasing hormones come from neurons in the anterior hypothalamus and are released thru the portal veins to the pituitary sinusoids. The hypothalamic hormones stimulate the selective pituitary release of hormones, often called “stimulating hormones”.4 The pituitary stalk links the posterior pituitary with the part of the hypothalamus that secretes anti-diuretic hormone (ADH) and oxytocin.4 These hormones are associated with the posterior pituitary and not of interest here.
The Thyrotrophic releasing hormone (TRH) and Corticotrophic releasing hormones of the hypothalamus are released into the hypothalamic portal vein system that is separate from the general human circulatory system. These releasing hormones can travel thru the portal veins to the pituitary without being evident in the venous blood.4 Once the tropic hormones enter the pituitary sinusoids they can stimulate the pituitary to produce/secrete specific stimulating hormones, such as Thyroid Stimulating Hormone (TSH) if the hypothalamus sends TRH or Adenocorticotropic hormone (ACTH) if the hypothalamus sends CRH. (Figures 3 and 4)
Target gland
Once s.mulated, the gland releases the hormone for target
Pituitary
S.mula.ng hormones are released that target the gland of interest
Hypothalmus
Releases trophic homormones that lead to release of s.mulators

FOCUS: ENDOCRINOLOGY
VOL 26, NO 2 SPRING 2013 CLINICAL LABORATORY SCIENCE 109
Figure 3. Adrenal gland stimulation to produce cortisol hormone.
Figure 4. Thyroid stimulation by TSH to produce thyroid
hormones T4 and T3. The Pituitary The pituitary gland, with its stimulating hormones, is like a bus stop or railroad station. The pituitary takes in the messages from hypothalamic released hormones and responds by sending out its own stimulating hormones. By itself the pituitary is the size of a pea5 and is located between the two optic nerves in the brain. This gland has 2 compartments with the anterior section made of individual cells that can produce individual stimulating hormones such as TSH, ACTH, LH/FSH, or Growth hormone. These anterior pituitary stimulating cells are individualized in their function. The 5 functional units of the anterior pituitary can be thought of as individual sections that do their job of producing only one type of stimulating hormone per functional unit. The posterior section takes what has been sent to it from the hypothalamus, namely ADH and oxytocin and sends these hormones into the blood circulation so they can exert their respective affects.
Mechanism of Action All hormones act on their specific glands/tissues through receptors located on the surface or within the cytosol of the cell. The binding between the hormones and the receptor serves as an initial signal resulting in a cascade of events that result in the production of a protein. Hormones are divided into two broad categories, peptide (water soluble) and steroid (water insoluble). Refer to Table 2. While all hormones react with receptors, their mechanism of action varies depending on how they are categorized. Because they are water soluble, peptide hormones must interact with receptors that are located at the surface of the cell. Once bound to its receptor, the hormone receptor complex activates a membrane-bound signal transducer (MBST). Often this signal transducer is guanine nucleotide-binding regulatory protein, also called the G-protein complex. The MBST is coupled to the adenylate cyclase and phospholipase enzyme systems and once activated results in the production of a peptide hormone. Due to their water insoluble nature, steroid hormones may diffuse across the surface of the cell membrane and bind to their receptors in either the cytoplasmic or nuclear fractions of the cells. Once the steroid hormone binds to its receptor, the receptor undergoes a conformational change resulting in activation of the entire hormone receptor complex. The activated complex has an increased affinity for chromatin at a site referred to as the steroid response element (SRE). The SRE binding ultimately causes the production of the nuclear product--a specific protein.6,7 Peptide hormones are synthesized as preprohormones and are packaged into secretory vesicles providing a ready available storage pool of hormones to draw from. Steroid hormones, on the other hand, are all produced from cholesterol and are available bound to proteins. Because they are protein bound their action takes longer to initiate; however, once initiated their action is sustained due to the increased half life from being protein bound. Hormone Regulation and Transport A unique feature of the endocrine system is that all hormones are controlled through positive and negative feedback systems. This feedback system involves two production units. The hormones from one unit usually cause the second unit to increase its hormone production. The second unit’s hormones then feed back to the first unit to control any further output from the first unit. It is through this feedback loop that the hu-
Adrenal Gland (cortex)
Cortisol hormone
Pituitary
Adrenocorticotropic Hormone or ACTH
Hypothalmus
Corticotropin Releasing Hormone or CRH
yroid gland
yroid T4 yroid T3
Pituitary
yroid Stimulating Hormone or TSH
Hypothalmus
yroid Releasing Hormone or TRH

FOCUS: ENDOCRINOLOGY
110 VOL 26, NO 2 SPRING 2013 CLINICAL LABORATORY SCIENCE
Table 2. Peptide and Steroid Hormones (note: this is not an exhaustive list of all endocrine hormones).
Hormone Category Hormones Peptide Thyroid Stimulating Hormone
Follicle Stimulating Hormones Luteinizing Hormone Prolactin Growth Hormone Parathyroid Hormone Adrenocorticotropic Hormone Thyroid Hormones Pancreatic hormones
Steroid Testosterone Dehydroepiandrosterone sulfate Estrogens Progesterone Cortisol Aldosterone
Figure 5. Thyroid hormone acting as Negative feedback to Pituitary
and Hypothalmus.
Figure 6. Cortisol Negative Feedback Mechanism inhibits the Pituitary and Hypothalmus secretions of stimulation.
man body is able to maintain normal levels of circulating hormones. Various textbooks1,2,4 and articles3,5,7 on hormones refer to the “negative feedback” mechanism as the predominant mechanism by which endocrine hormones are regulated in the human body. Figures 5 and 6 are included here to help demonstrate the negative feedback mechanism as it applies to the thyroid and adrenal gland in humans.
Negative feedback mechanisms are used to prevent overproduction of hormones from the gland and to inhibit the releasing and stimulating hormones produced from the hypothalamus and pituitary, respectively. Figure 6 shows the negative feedback loop for the adrenal gland. Cortisol from the adrenal gland is circulated in the blood back to the hypothalamus and pituitary so that inhibition of the ACTH and CRH will occur. As long as the level of cortisol hormone is meeting the body’s needs the pituitary and hypothalamus will not stimulate the adrenal gland. Once the cortisol level becomes low or inadequate in the function of this hormone the osmotic stimulation to the brain will cause the hypothalamus CRH to be released, stimulating the pituitary to release ACTH and leading to the adrenal glands release of cortisol once again.
Pituitary and hypothalamic hormones are stimulated to be released in a minute-by-minute pulsatile fashion. In addition to the pulsatile feature, pituitary hormones also exhibit a biorhythmic pattern. Biorhythms with a 24 hour time span are referred to as circadian (diurnal). The circadian (diurnal) cycle is controlled by both light cycles and sleep patterns and therefore any disruption to light cycles and/or sleep patterns may alter the normal diurnal cycle of hormones. While pituitary hormones exhibit circadian rhythm, this rhythm will differ depending on the pituitary hormone produced. For example, highest concentrations of adrenocorticotrophic hormone (ACTH) are seen at 0800 with lowest concentrations seen at midnight. Highest concentra-tions of Thyroid Stimulating Hormone (TSH) are seen just before midnight and lowest levels are seen midday. The pulsatile and diurnal features of endocrine hormones warrant closer consideration when interpreting their concentrations in light of making a clinical diagnosis.1,2
Steroid hormones circulate in the body bound to
Thyroid gland
Thyroid T4 Thyroid T3
Pituitary
Thyroid S.mula.ng Hormone or TSH
Hypothalmus
Thyroid Releasing Hormone or TRH
Adrenal • • Cortisol
Pituitary • , ≠• ACTH
Hypothalmus • ≠• CRH
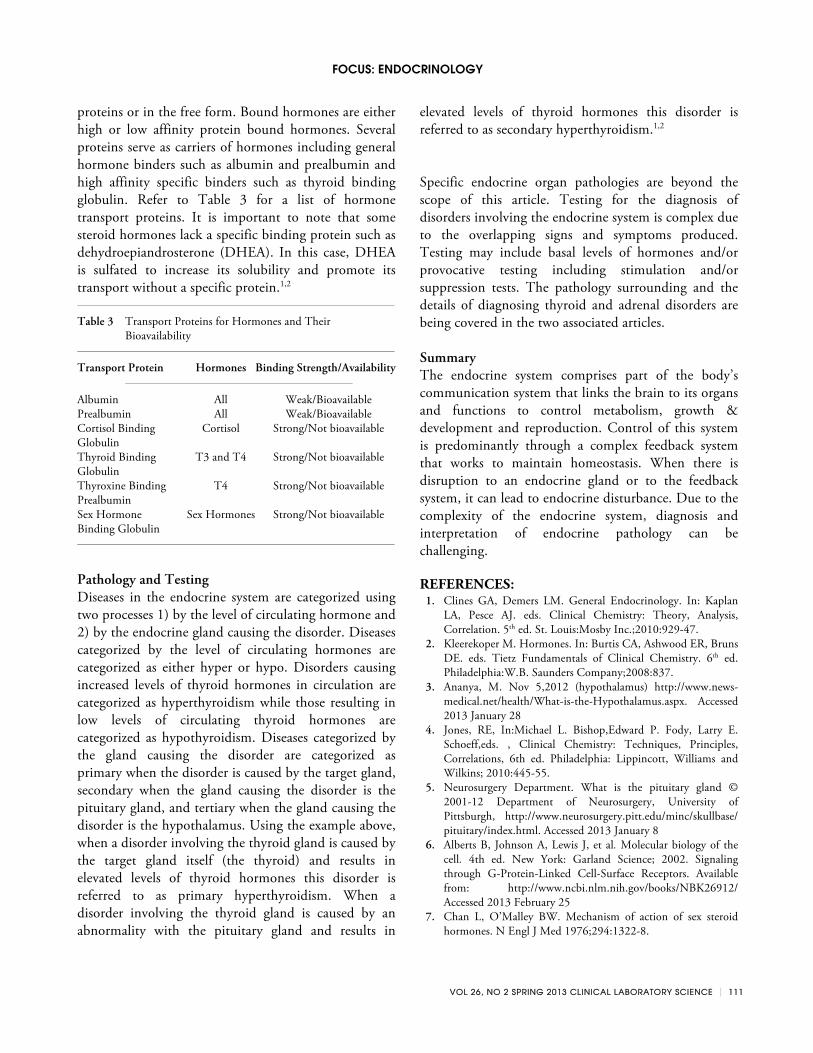
FOCUS: ENDOCRINOLOGY
VOL 26, NO 2 SPRING 2013 CLINICAL LABORATORY SCIENCE 111
proteins or in the free form. Bound hormones are either high or low affinity protein bound hormones. Several proteins serve as carriers of hormones including general hormone binders such as albumin and prealbumin and high affinity specific binders such as thyroid binding globulin. Refer to Table 3 for a list of hormone transport proteins. It is important to note that some steroid hormones lack a specific binding protein such as dehydroepiandrosterone (DHEA). In this case, DHEA is sulfated to increase its solubility and promote its transport without a specific protein.1,2
Table 3 Transport Proteins for Hormones and Their Bioavailability
Transport Protein Hormones Binding Strength/Availability
Albumin All Weak/Bioavailable Prealbumin All Weak/Bioavailable Cortisol Binding Cortisol Strong/Not bioavailable Globulin Thyroid Binding T3 and T4 Strong/Not bioavailable Globulin Thyroxine Binding T4 Strong/Not bioavailable Prealbumin Sex Hormone Sex Hormones Strong/Not bioavailable Binding Globulin Pathology and Testing Diseases in the endocrine system are categorized using two processes 1) by the level of circulating hormone and 2) by the endocrine gland causing the disorder. Diseases categorized by the level of circulating hormones are categorized as either hyper or hypo. Disorders causing increased levels of thyroid hormones in circulation are categorized as hyperthyroidism while those resulting in low levels of circulating thyroid hormones are categorized as hypothyroidism. Diseases categorized by the gland causing the disorder are categorized as primary when the disorder is caused by the target gland, secondary when the gland causing the disorder is the pituitary gland, and tertiary when the gland causing the disorder is the hypothalamus. Using the example above, when a disorder involving the thyroid gland is caused by the target gland itself (the thyroid) and results in elevated levels of thyroid hormones this disorder is referred to as primary hyperthyroidism. When a disorder involving the thyroid gland is caused by an abnormality with the pituitary gland and results in
elevated levels of thyroid hormones this disorder is referred to as secondary hyperthyroidism.1,2
Specific endocrine organ pathologies are beyond the scope of this article. Testing for the diagnosis of disorders involving the endocrine system is complex due to the overlapping signs and symptoms produced. Testing may include basal levels of hormones and/or provocative testing including stimulation and/or suppression tests. The pathology surrounding and the details of diagnosing thyroid and adrenal disorders are being covered in the two associated articles. Summary The endocrine system comprises part of the body’s communication system that links the brain to its organs and functions to control metabolism, growth & development and reproduction. Control of this system is predominantly through a complex feedback system that works to maintain homeostasis. When there is disruption to an endocrine gland or to the feedback system, it can lead to endocrine disturbance. Due to the complexity of the endocrine system, diagnosis and interpretation of endocrine pathology can be challenging. REFERENCES: 1. Clines GA, Demers LM. General Endocrinology. In: Kaplan
LA, Pesce AJ. eds. Clinical Chemistry: Theory, Analysis, Correlation. 5th ed. St. Louis:Mosby Inc.;2010:929-47.
2. Kleerekoper M. Hormones. In: Burtis CA, Ashwood ER, Bruns DE. eds. Tietz Fundamentals of Clinical Chemistry. 6th ed. Philadelphia:W.B. Saunders Company;2008:837.
3. Ananya, M. Nov 5,2012 (hypothalamus) http://www.news-medical.net/health/What-is-the-Hypothalamus.aspx. Accessed 2013 January 28
4. Jones, RE, In:Michael L. Bishop,Edward P. Fody, Larry E. Schoeff,eds. , Clinical Chemistry: Techniques, Principles, Correlations, 6th ed. Philadelphia: Lippincott, Williams and Wilkins; 2010:445-55.
5. Neurosurgery Department. What is the pituitary gland © 2001-12 Department of Neurosurgery, University of Pittsburgh, http://www.neurosurgery.pitt.edu/minc/skullbase/ pituitary/index.html. Accessed 2013 January 8
6. Alberts B, Johnson A, Lewis J, et al. Molecular biology of the cell. 4th ed. New York: Garland Science; 2002. Signaling through G-Protein-Linked Cell-Surface Receptors. Available from: http://www.ncbi.nlm.nih.gov/books/NBK26912/ Accessed 2013 February 25
7. Chan L, O’Malley BW. Mechanism of action of sex steroid hormones. N Engl J Med 1976;294:1322-8.

112 VOL 26, NO 2 SPRING 2013 CLINICAL LABORATORY SCIENCE
FOCUS: ENDOCRINOLOGY
Back to the Basics: Thyroid Gland Structure, Function and Pathology
JANELLE M. CHIASERA
LEARNING OBJECTIVES 1. Explain the HPT feedback system involving the
thyroid gland. Include the hormone produced from each gland and the effect of that hormone on the other unit.
2. Describe thyroid hormone synthesis including adescription of the 5 steps of hormone production and the rate limiting step to the production of thyroid hormones.
3. Differentiate between hyperthyroidism andhypothyroidism including associated laboratory data, signs and symptoms presented, primary cause, and treatment.
4. Explain the importance of neonatal screening andindicate the type of screening method used by the U.S.
5. Explain the difference between overt and subclinicalthyroid disorders and euthyroid sick syndrome and explain what the laboratory data would look like in both conditions.
ABBREVIATIONS: AAP - American Academy of Pediatrics; DIT - diiodotryrosine; fT3 - Free T3; fT4 - Free T4; HPT - hypothalamus, pituitary, thyroid axis; MIT - monoiodotryrosine; rT3 - reverse T3; ESS - euthyroid sick syndrome; T3 - triiodothyronine; T4 - thyroxine; TBG - thyroxine-binding globulin; TBPA - thyroxine-binding prealbumin; THBR - thyroid hor-mone binding ratio; TRH - thyrotropin-releasing hormone; TSH - thyroid stimulating hormone; TT3 - total T3; TT4 - total T4
INDEX TERMS: Thyroid, Hyperthyroidism, Hypothyroidism, Grave’s Disease, Hashimoto’s Thyroiditis, Antithyroid Agents
Clin Lab Sci 2013;26(2):112
Janelle M. Chiasera, PhD, MT (ASCP), University of Alabama at Birmingham, Birmingham, Alabama
Address for Correspondence: Janelle M. Chiasera, PhD, MT(ASCP), Chair and Professor, University of Alabama at Birmingham, 1705 University Blvd, SHPB 431, Birmingham, Alabama 35294, 205-975-3111, [email protected]
The thyroid gland is one of many glands associated with the endocrine system and it is responsible for the production and secretion of the thyroid hormones, triiodothyronine (T3) and thyroxine (T4). The thyroid gland is located at the front of the neck and is bilobular in structure such that it has a butterfly appearance. The thyroid gland is made up of two cell types, follicular and parafollicular cells. The follicular cells are responsible for producing thyroid hormones. The follicular cells enclose a space called the colloid which contains stored thyroglobulin, a glycoprotein that contains the precursors T3 and T4. The parafollicular cells, also known as C-cells, secrete the hormone calcitonin, a hormone responsible for the regulation of calcium.1-3
The thyroid gland, like other glands of the endocrine system, is controlled through a feedback system involving the hypothalamus, the pituitary, and the target gland (the thyroid). The relationship between the hypothalamus, the pituitary and the thyroid gland is referred to as the HPT axis. The hypothalamus is responsible for producing thyrotropin-releasing hormone (TRH), a tripeptide which is secreted into the venous system that drains to the pituitary gland. At the pituitary, TRH binds to receptors in thyrotroph cells causing the production and secretion of thyroid stimulating hormone (TSH), also known as thyrotropin. Thyroid stimulating hormone binds to TSH receptors in the follicular cells of the thyroid gland causing the production and secretion of thyroid hormones, T3 and T4. As with all endocrine glands, the thyroid gland exhibits both negative and positive feedback; however, the negative feedback system predominates. In negative feedback, the hormones

FOCUS: ENDOCRINOLOGY
VOL 26, NO 2 SPRING 2013 CLINICAL LABORATORY SCIENCE 113
produced by the thyroid gland negatively feed back to the hypothalamus and pituitary to shut off any further production of thyroid hormones. This negative feedback is ultimately responsible for maintaining relatively constant levels of circulating hormones. Refer to Figure 1.1-3 Figure 1. HPT axis for the thyroid gland showing positive (+) and
negative (-) feedback Thyroid hormone synthesis takes place in the follicular cells of the thyroid gland. It involves multiple steps including iodide trapping, organification, coupling, storage, and secretion. Iodine is essential for the production of thyroid hormones and is considered the rate-limiting step in production of thyroid hormones. The energy dependent trapping of iodide occurs in the follicular cell (iodide trapping). Once in the follicular cell iodide is oxidized to iodine, it combines with tyrosine residues within thyroglobulin (TG) to form monoiodotyrosine (MIT) and diiodotyrosine (DIT) (organification). Enzymatic coupling of MIT and DIT takes place producing intrathyroglobulin T3 and T4 which is released from the follicular cell for storage in the colloid (coupling and storage). This serves as a ready storage pool of thyroid hormones. Upon stimulation by TSH, drops of colloid are engulfed by the follicular cells
and are digested by proteases, which releases T3, T4, MIT, and DIT. The MIT and DIT molecules are rapidly deiodinated and their iodine is reutilized for subsequent hormone synthesis. T3 and T4 are resistant to deiodination and are secreted from the follicular cell into the circulation.1-3 Refer to Figure 2.
Figure 2. Synthesis of Thyroid Hormones. Image reprinted with permission of John Nagy. Both T3 and T4 are produced from the thyroid gland; however, T3 and T4 are not produced in equal amounts. All of T4 is produced in the thyroid gland while only 20% of T3 is produced directly from the thyroid gland. The other 80% of T3 is produced from the extrathyroidal deiodination of T4. The extrathyroidal deiodination occurs mainly by the liver and/or the kidneys. The deiodination of the outer ring of the T4 molecule results in the production of T3 and the deiodination of the inner ring of the T4 molecule results in the production of reverse T3 (an inactive compound). Refer to Figure 3. Although the principal thyroid hormones are T3 and T4, there is evidence to suggest that only T3 has hormonal activity, therefore T4 serves as a prohormone.1-4
Figure 3. Deiodination of T4 at an outer ring to produce T3 and the inner ring to produce rT3. Highlighted areas represent the deiodination
sites.
THYROID Triiodothyronine (T3) and yroxine (T4)
PITUITARY
Hormone Stimulating Hormone (TSH)
HYPOTHALAMUS
yroid Releasing Hormone (TRH) (+)
(+) (-)
(-)

FOCUS: ENDOCRINOLOGY
114 VOL 26, NO 2 SPRING 2013 CLINICAL LABORATORY SCIENCE
Once produced, thyroid hormones circulate bound to one of three plasma proteins, thyroxine binding globulin (TBG), thyroxine binding prealbumin (TBPA), and albumin. Most of T3 and T4 circulate bound to TBG and to a much lesser extent they circulate bound to TBPA and albumin. Refer to Table 1. TBG has the greatest affinity for T3 and T4 (K =1010), has one single binding site per molecule, and circulates in the lowest concentrations (0.37 µM). Thyroxin binding prealbumin has an intermediate affinity for T3 and T4 (K = 107) and circulates in moderate concentrations (4.6 µM). Albumin has the lowest affinity for T3 and T4 (K = 105), has multiple binding sites per molecule, and circulates in the body in high concentrations (590 µM ).1-3
Table 1. Thyroid binding proteins
Binding Protein T3 Bound (%) T4 Bound (%) TBG 80% 60-70% TBPA 9% 15-30%
Albumin 11% 10%
Thyroid Hormone Function Thyroid hormones have widespread function effecting metabolism, growth and maturation, and other organ-specific effects. From a metabolic perspective, thyroid hormones are calorigenic in nature and result in oxygen consumption and the generation of body heat. They increase protein catabolism, promote gluconeogenesis, increase the utilization of glucose and promote lipid metabolism. With regard to other organ-specific effects, thyroid hormones influence cardiac function by increasing heart rate, myocardial contractility, blood volume, and cardiac output while decreasing peripheral vascular volume. They stimulate the production of cytokines, growth factors and other factors to stimulate bone development and growth. Thyroid hormones also promote increased motility in the gastrointestinal system and increase adrenergic activity and sensitivity in the central nervous system. Because they also promote cell differentiation, growth and maturation thyroid hormones are essential in early fetal life to promote normal growth and brain development.1-2
Given the widespread function of thyroid hormone, deficiencies and elevations in hormone levels cause many clinical signs and symptoms. These deficiencies or
elevations cross multiple organ systems causing great discomfort for those with associated abnormalities. However, depending on the severity of the disease the signs and symptoms may be absent to full blown in nature. Refer to Table 2 for a list of usual signs and symptoms for those with hyperthyroidism and hypothyroidism.1-2
Thyroid Pathology Disorders of the thyroid gland are usually described by the level of circulating hormone. Hyperthyroidism occurs when there is an overproduction of thyroid hormones and hypothyroidism results when there is an under production of thyroid hormones. These disorders are further categorized by the endocrine gland causing the disorder being further classified as primary, secondary, or tertiary. Diseases categorized as primary arise from a disorder with the thyroid gland, while those categorized as secondary or tertiary arise from damage to the pituitary and hypothalamus gland, respectively. Disorders of the thyroid gland include hypothyroidism, hyperthyroidism, euthyroid sick syndrome, and those resulting from medications. In addition, due the recent advances in highly sensitive assays to detect thyroid stimulating hormone, disorders may also be categorized as overt or subclinical. Subclinical disorders are identified before the signs and symptoms appear in the patient and before thyroid hormone levels are abnormal. The only abnormality seen in subclinical disorders is an abnormality with TSH values. Thyroid hormone levels will be normal in these cases. Overt cases present with clinical signs and symptoms and abnormalities in TSH and thyroid hormone levels.5
Table 2. Usual signs and symptoms seen with hyperthyroidism and hypothyroidism
Hyperthyroidism Hypothryoidism Heat intolerance Cold intolerance
Flushed skin Dry skin Increase appetite Lethargy Muscle wasting Generalized weakness
Weight loss Weight gain Exopthalmus
Heart palpitations Tachycardia Bradycardia
Shortness of breath Heart enlargement Restlessness Apathy Nervousness Mental sluggishness
Fatigue Mental retardation Hyperdefecation Constipation

FOCUS: ENDOCRINOLOGY
VOL 26, NO 2 SPRING 2013 CLINICAL LABORATORY SCIENCE 115
Hypothyroidism Hypothyroidism occurs when there are insufficient thyroid hormones available to the tissues. The majority of hypothyroid cases are primary in nature meaning that they arise from a disorder from the thyroid gland itself such as conditions or treatments that destroy thyroid tissue or interfere with thyroid hormones production. To a much lesser extent they may be due to pituitary and/or hypothalamic disease that results in TSH and/or TRH deficiencies. Refer to Table 3 for the causes of hypothyroidism and hyperthyroidism. Autoimmune thyroiditis, also known as Hashimoto’s thyroiditis, is the most common cause in iodine-sufficient areas. Hashimoto’s thyroiditis is caused by the autoimmune destruction of thyroid tissue leading to thyroid gland inflammation and reduced thyroid hormone production. Because this disorder is autoimmue in nature, it frequently occurs with other diseases that are immune in nature and often presents with circulating antithyroid antibodies. Approximately 2-15% of the population is afflicted with this disorder and it carries a gender bias as it is seen more frequently in women.1-3,6
Table 3. Causes of Hypothyroidism and Hyperthyroidism
Disorder Causes Hypothyroidism Autoimmune thyroiditis (Hashimoto’s) Iatrogenic (treatment related) Post-thyroidectomy Post-radioactive iodine treatment Transient thyroiditis Congenital hypothyroidism Iodine deficiency Drugs Hyperthyroidism Autoimmune (Grave’s) Thyroiditis Nodular disease TSH producing pituitary adenoma hCG-mediated Exogenous thyroid hormone intake
When the disorder is overtly expressed, signs and symptoms will likely be presented in conjunction with elevated TSH and decreased T3 and T4 concentrations. In cases of subclinical hypothyroidism, signs and symptoms are not present, thyroid hormones are in the normal range, and only the TSH level is abnormal. Refer to Table 4. Treatment for those with hypothyroidism involves oral replacement through the drug levothyroxine. Oral replacement of thyroid
hormones will reverse the laboratory finding and clinical signs and symptoms.1-3,7
Table 4. Common Laboratory Values seen in Hypothyroidism and hyperthyroidism
Disorder TSH fT4 fT3 Primary Hypothyroidism Subclinical Increased Normal Normal Overt Increased Decreased Decreased Primary Hyperthyroidism Subclinical Decreased Decreased Decreased Overt Decreased Increased Increased
An additional cause of hypothyroidism is neonatal hypothyroidism, also known as congenital hypothyroidism or cretinism. This disorder affects infants from birth and results from the complete absence of the thyroid gland (athyreosis) or it is secondary to defects in thyroid hormone synthesis. This disorder occurs in approximately 1 in 3500 – 4000 live births and if left untreated can lead to profound mental retardation. Proper screening and initiation of therapy early, beginning within 2 weeks of age can normalize cognitive development and prevent the progression to profound mental retardation in infants with hypothyroidism. Because this is one of the most preventable causes of mental retardation, the American Academy of Pediatrics (AAP) recommended that all newborns be screened for hypothyroidism in 1993. Most newborn screening programs in the U.S. use the primary TSH/backup T4 screening method performed on filter-paper-blood-spots usually collected before discharge (optimally between 48 hours and 4 days of age); however other screening methods exist. Treatment for infants with hypothyroidism involves replacement therapy (10-15 µg/kg depending on severity) to normalize T4 within 2 weeks and TSH within 1 month. In addition, the AAP recommends that infants being treated for hypothyroidism receive clinical examinations including assessment of growth and development every few months for the first 3 years of life and regular assessment of T4 and TSH as detailed in Table 5. The aim of therapy is to ensure normal growth and development through maintenance of T4 and TSH in the upper half of the reference interval (optimally 0.5-2.0 mU/L).1-3,8 Hyperthyroidism Hyperthyroidism occurs when there is an excessive

FOCUS: ENDOCRINOLOGY
116 VOL 26, NO 2 SPRING 2013 CLINICAL LABORATORY SCIENCE
production of thyroid hormones and may be caused by a variety of conditions (Table 3). The term thyrotoxicosis is used to describe the clinical state of high thyroid hormone concentrations. The most common cause of hyperthyroidism (thyrotoxicosis) in the U.S. is Grave’s disease. Grave’s disease represents an autoimmune disorder where the antibodies produced are directed against the TSH receptors in the thyroid gland causing an overproduction of T3 and T4. Grave’s disease has a low prevalence rate in the population (0.3 – 0.6%) and occurs more frequently in women.
Table 5. T4 and TSH assessment in Infants treated for Hypothyroidism
Time Period Evaluation 2-4 weeks after initiation of treatment TSH and T4 Every 1 to 2 months during first 6 months of life TSH and T4 Every 3 to 4 months between 6 months – 3 years TSH and T4 Every 6 to 12 months until growth in completed TSH and T4 More frequently when warranted TSH and T4
When hyperthyroidism is overtly expressed, signs and symptoms will likely be presented in conjunction with decreased TSH and increased T3 and T4 concentrations. In cases of subclinical hyperthyroidism, thyroid hormones are in the normal range, and only the TSH level is abnormal. Refer to Table 4. Treatment for hyperthyroidism may involve the use of antithyroid drugs to inhibit the production of thyroid hormones or surgical thyroidectomy or radioactive iodine to reduce the hyperfunctioning thyroid tissue. Often physicians will prescribe β-blockers to help suppress the symptoms of hyperthyroidism until the other treatments take effect. While on antithyroid drugs it is recommended that free-T4 (fT4) be monitored 4 weeks after initiation of therapy and at intervals of 4-8 weeks until euthyroid levels are achieved.9
Euthyroid Sick Syndrome Abnormal thyroid hormone levels may occur without the presence of thyroid disease. This is particularly common in hospitalized patients and is often due to alterations in the concentration of hormone binding proteins, the actions of certain drugs, effects of nonthyroidal illnesses, or peripheral resistance to thyroid hormones. Conditions resulting in abnormal thyroid hormones in the absence of thyroid disease are referred to as Euthyroid Sick Syndrome or low T3
syndrome. This syndrome is characterized by decreased T3 levels coupled with an elevation in reverse T3. TSH levels in this condition vary from high-normal to high and T4 values are of little clinical value as they are variable in their levels during this syndrome. As patients recover from these illnesses the thyroid laboratory tests appear to return to normal; therefore, assessments of thyroid status should be performed when illnesses subside, unless deemed necessary for a patient outcome.10
Laboratory Tests There are often issues between clinical findings and laboratory testing that make the diagnosis of thyroid disorders (and endocrine disorders) challenging. The overall goal of screening for thyroid disease is to identify and treat patients at risk for the consequences of thyroid dysfunction before the disorders become clinically apparent. Screening for thyroid dysfunction should be performed using a medical history, physical examination, and laboratory tests. However, there are a variety of laboratory tests that have been developed to measure thyroid function including TSH, free T4 (fT4), total T4 (TT4), free T3 (fT3), total T3 (TT3), thyroxine-hormone binding ratio ( THBR), reverse T3 (rT3), and index methods. Recent advances in laboratory testing have shifted diagnostics to a TSH centered approach for the detection of thyroid disorders. High sensitive TSH assays are now the recommended initial screening test to detect thyroid disorders and fT4 and/or fT3 can be used as reflex testing as applicable. This TSH-centered approach for the evaluation of thyroid function is both cost effective and efficient.1-3,11
Conclusion The thyroid gland is a complex endocrine organ that has widespread function and control over multiple organ systems and processes. It functions through an elaborate connection between the hypothalamus, pituitary, and the thyroid gland to maintain normal levels of circulating hormones. High and low levels of thyroid hormones can lead to abnormalities such as hypo- and hyperthyroidism that arise from a variety of causes, the most common being Hashimoto’s thyroiditis (hypothyroidism) and Grave’s disease (hyperthyroid-ism). The laboratory plays an important role in the treatment and diagnosis of thyroid disorders as sensitive TSH tests can be used to detect disorders before the

FOCUS: ENDOCRINOLOGY
VOL 26, NO 2 SPRING 2013 CLINICAL LABORATORY SCIENCE 117
signs and symptoms of the disorders appear. Current recommendations to evaluate thyroid function have progressed from thyroid panel testing to a TSH centered approach that is more cost effective and medically efficient.
REFERENCES: 1. Clines G, Demers L, General Endocrinology. In: Kaplan L,
Pesce A. eds. Clinical Chemistry: Theory, Analysis, Correlation. 5th ed. St. Louis:Mosby Inc.; 2010.
2. Kleerekoper M. Hormones. In: Burtis C., Ashwood E., BrunsD. eds. Tietz Fundamentals of Clinical Chemistry. 6th ed. Philadelphia:W.B. Saunders Company;2008.
3. Bertholf R. Laboratory Evaluation of Thyroid Function. In:Clarke W. ed. Contemporary Practice in Clinical Chemistry. 2nd ed. Washington, DC:AACCPress;2011.
4. Liu Y, Brent G. Thyroid hormone crosstalk with nuclearreceptor signaling in metabolic regulation. Trends Endocrinol Metab 2012;21:166-73.
5. U.S. Prevention Services Task Force. Screening for Thyroid
Disease: Recommendation Statement. Ann Intern Med. 2004; 140(2):125-7.
6. Ridgeway E. Modern concepts of primary gland failure.Clinical Chemistry, 1996;42:179-82.
7. Brent G. Larsen P, Davies T. Hypothyroidism and thyroiditis.In: Kronenberg. Melmed S. Polonsky K., Larsen P, eds. Williams Textbook of Endocrinology. 11th ed. Philadelphia: Saunders Elsevier; 2008.
8. American Academy of Pediatrics and Pediatric endocrineSociety. Update of newborn screening and therapy for congenital hypothyroidism. Pediatrics, 2006;117:2290-303.
9. Bahn R, Burch H, Cooper D, Garber J, et al. Hyperthyroidismand other causes of thyrotoxicosis: management guidelines of the American thyroid association and American association of clinical endocrinologists. Thyroid, 2010;21(6):593-646.
10. Mclver B, Gorman C. Euthyroid Sick Syndrome: an overview.Thyroid, 1997;(1);125-32.
11. Spencer C, Lopresti J, Middlesworht L, et al. Screening forthyroid dysfunction: which test is best. JAMA, 1993;270:2297-8.
ASCLS Online CE – Expand Your Knowledge!
Vitamin D Regulation, Clinical Significance and Treatment ∞ authored by expert Hershel Raff, PhD, Endocrine Research Laboratory,
St. Luke’s Medical Center, Milwaukee
Sexually Transmitted Bacterial Infect ions ∞ authored by expert Lynda Britton, PhD, MLS(ASCP)CM, Professor,
LSU Health Science Center Shreveport
v Two of many online learning experiences v Easy to navigate courses v Learn at your own pace v Earn P.A.C.E.® credit
For more information, go to www.ascls.org/ store and select Online Learning category in the Merchandise area.
118 VOL 26, NO 2 SPRING 2013 CLINICAL LABORATORY SCIENCE
FOCUS: ENDOCRINOLOGY
The Adrenal Gland: Common Disease States and Suspected New Applications
LINDA S. GORMAN
LEARNING OBJECTIVES 1. Explain the renin-angiotensin-aldosterone mecha-
nism and how it maintains blood pressure.2. Describe the present laboratory findings for a
soldier suffering from Post Traumatic StressDisorder (PTSD).
3. Characterize how we differentiate between thevarious forms of Cushing’s syndrome and thetesting that makes that possible.
4 Describe the symptoms and laboratory findings for a patient with Addison’s disease.
5 Characterize how we deduce a finding of pheochromocytoma in a patient.
ABBREVIATIONS: ACTH - adrenocorticotropic hormone; ACE - angiotensin converting enzyme; ARR - aldosterone-renin ratio; CAH - congenital adrenal hyperplasia; CRH - corticotropin releasing hormone; CT - computerized axial tomography; DHEA – dehy-droepiandrosterone; 11-DOC - 11-deoxycorticosterone; GR - glucocorticoid receptor; HPLC-high pressure liquid chromatography; HIV - human immuno-deficiency virus; LC/MS-MS - liquid chromate-graphy/mass spectroscopy-mass spectrophotometry; MRI - magnetic resonance imaging; MS - mass spectroscopy; PTSD - post-traumatic stress disorder; RIA - radio-immunoassay; TB - tuberculosis; SRE - steroid response element; VMA - vanillylmandelic acid
INDEX TERMS: Adrenal Gland, Adrenal Hyperplasia, Adrenocortical Adenoma, Aldosterone, Hyperaldo-steronism, Hypokalemia, Renin, Adrenal Insufficiency
Clin Lab Sci 2013;26(2):118
Linda S. Gorman, PhD, MLS (ASCP)CM, University of Kentucky, Lexington, KY
Address for Correspondence: Linda S. Gorman, PhD, MLS (ASCP)CM, CLS Education Co-ordinator, Associate Professor, 900 S. Limestone Ave, Rm 126G CTW,
University of Kentucky, Lexington, KY 40536-0200, (859)-218-0855, [email protected]
This article covers the physiology of the adrenal gland as well as the common disease states. Post-traumatic stress disorder is discussed in relation to the possible role of the adrenal gland hormones and this disorder. Laboratory testing used to diagnose adrenal disorders is briefly described using reference laboratory methods.
Historically, the adrenal gland was thought to be “excess renal” tissue and not significant by anatomist Batholemeus Eustachius (1520-1574).1 In the early 1800’s, Culver (1769-1832) was the first to recognize the difference between the outer layer of the adrenal gland and the inner central core. It would not be until 1836 before N. Nagel termed these as “cortical” for the outer layer and “medulla” for the inner layer. Definitive descriptions of the adrenal gland awaited the microscopic anatomical examination by R. A. Von Kolliker (1817-1905). He described his findings as “the cortical and medullary substances are physiologically distinct and have different functions.”
The adrenal gland is viewed as a pyramid-shaped gland that is positioned above each kidney within the human body (Figure 1). This gland can be divided into the cortex and medulla regions, with the cortex producing steroid type hormones and the medulla producing neuropeptide type hormones. Embryonic development of the cortex comes from mesothelium adjacent to the dorsal mesentery.2 The adrenal cortex differentiates into 3 zones- the glomerulosa, fasiculata and reticularis. Development of the adrenal cortex leads to the zona glomerulosa and zona fasiculata being present at birth with the zona reticularis presence delayed until the 3rd year after birth. The embryonic development of the adrenal medulla comes from the neural crest cells that migrate to a cavity of the developing cortex. Initially these neuron-like cells are not encapsulated by the fetal cortex. During month two of development these cells

FOCUS: ENDOCRINOLOGY
VOL 26, NO 2 SPRING 2013 CLINICAL LABORATORY SCIENCE 119
are encapsulated and the cell types that develop are 80% epinephrine-secreting and 20% norepinephrine-secreting in the adult.2 The mature adrenal gland is 90% adrenal cortex and 10% adrenal medulla.3
Figure 1.Adrenal gland with cortex and medulla
The adrenal cortex, with its 3 distinct zones, produces steroid type hormones from the common substrate pregnenolone, formed in the cortex biochemical pathway from cholesterol to make various steroid hormones unique to the adrenal gland. The outer layer of the cortex is called the zona glomerulosa. Production of the steroid hormone aldosterone in this zone leads to regulation of body sodium levels and influences blood pressure by altering fluid volumes. This layer is a regulator of salt content in blood and fluids.3 Aldosterone plays a key role in regulating the kidney retention of sodium as well as potassium release and thus regulation of blood-fluid volumes. The zona fasiculata is known for its use of the common substrate pregnenolone to make cortisol and other gluco-corticoids of interest. Cortisol is the major hormone of interest and influences glucose homeostasis, protein catabolism, and blood pressure to some extent.4 The zona reticularis produces the androgens made by the adrenal gland, in particular DHEA or dihydro-epiandrosterone and the sulfated form DHEAS.4
Aldosterone Aldosterone’s physiologic impact is to regulate sodium’s affect on blood-fluid volume in the circulation. Classically, aldosterone regulates the reabsorption of sodium from the effulate leaving the kidney nephron for the collecting duct. At the distal nephron or the receptors in the renal cortical collecting ducts of the kidney, the presence of aldosterone facilitates the reabsorption of sodium into the bloodstream, the
passive ejection of potassium to the collecting duct, and the increase in blood pressure of circulation leaving the kidney.6,7 Electrolytic regulation exerted by aldosterone has a unique feedback mechanism for regulating aldosterone secretions. The renin-angiotensin system is described in Figure 2. Renin is a proteolytic enzyme released from the juxtaglomerular apparatus of the kidney when the blood flow or blood pressure through the renal artery is low. Renin release enzymatically acts on angiotensinogen from the liver to form angiotensin-I. Angiotensin-I traveling in the bloodstream is enzymatically changed to angiotensin-II by the lung enzyme angiotensin converting enzyme (ACE). Angio-tensin-II is a potent vasoconstrictor that constricts blood vessel muscle to increase blood pressure as it stimulates the adrenal gland to release aldosterone from the adrenal cortex zona glomerulosa. This increase in aldosterone secretion will foster sodium reabsorption from the distal nephrons of the kidney.6 As the sodium content increases in the bloodstream it changes the salt content and raises the blood pressure. An increased blood pressure then shuts off the renin release causing the renin-angiotensin-aldosterone system to shutdown until the blood pressure thru the kidney is low again.
Figure 2. Renin-Angiotensinogen-Aldosterone mechanism.
The common precursor to aldosterone and cortisol production is the conversion of cholesterol to pregnenolone, a common steroid precursor. Within the glomerulosa layer where aldosterone is formed there is an aldosterone synthetase enzyme that fosters the production of this hormone from pregnenolone precursor products.3 The presence of this enzyme in other cortex layers is circumvented by the activity for aldosterone synthetase being low in the fasciculata and the reticularis layers. Along the same lines the enzyme 17-alpha-hydroxylase, which is important in the
cortex
cortex
Medulla
cortex
Renin
• low blood pressure thur kidney• renin acts on liver angiotensinogen
ACE
• Angiotensin I from above• ACE converts it to Angiotensin II
Aldosterone
• Angiotensin II vasoconstricts blood vessels• Aldosterone release from cortex

FOCUS: ENDOCRINOLOGY
120 VOL 26, NO 2 SPRING 2013 CLINICAL LABORATORY SCIENCE
production of cortisol and its precursors from pregnenolone, has a low activity rate in the glomerulosa layer, but active in the fasiculata layer.3 More aldosterone is generated by the renin-angiotensin-aldosterone system than by the negative feedback mechanism used for cortisol production.3 This divergence in controlling pathways for the two major adrenal hormones contributes to their ability to work in concert or individually.
Cortisol Cortisol release from the adrenal cortex results from the hypothalamus stimulation of the pituitary to release ACTH. ACTH acts on the adrenal cortex to foster cortisol release. Cortisol travels in the blood to its target of interest attached to Cortisol-binding globulin (CBG). Cortisol attaches at the cellular level to a glucocorticoid receptor (GR) and enters the cell.5 This cortisol-GR complex moves thru the cell cytoplasm to the cell nucleus, where it will affect responsive genes or the steroid-binding element (SBE). The messenger RNA (mRNA) generated by the cortisol action on the nucleus leads to the formation of proteins/enzymes that will influence the cell’s function or metabolism. Cortisol from the adrenal gland also acts as the negative feedback compound to the hypothalamus (CRH) and pituitary (ACTH) leading to suspension of their respective hormonal actions. Cortisol expresses diurnal variation with high blood concentrations in the morning and low concentrations at midnight. Morning reference ranges typically are 7-25 ug/dL while evening ranges run 2-9 ug/dL with midnight cortisol levels less than 5 ug/dL.5,9
Cortisol, from the zona fasiculata, influences glucose levels, protein function of those proteins involved in inflammation, circulating levels of free fatty acids, and body response to stress.5,6 Cortisol helps to maintain normal glucose levels by increasing the gluconeogenic process when blood glucose levels fall. Cortisol induces lipid breakdown and amino acid release from muscle so that these gluconeogenic substrates can be turned into glucose and stored as liver glycogen.3 Winter et. al. report that this gluconeogenic process of cortisol can lead to insulin resistance in skeletal muscle, liver and adipose tissue.5 They also state that excess cortisol can produce diabetes mellitus. The lipid lipolysis that cortisol fosters in adipose tissue increases the level of circulating free fatty acids. Winter et. al. state that
excess cortisol affecting lipids can thus lead to hypertriglyceridemia and/or hypercholesterolemia, indicating the patient can develop risk for lipid associated pathologies.5 As for the protein effect of cortisol, its anti-inflammatory effect makes cortisol-derived drugs useful in treating diseases like arthritis, inflammation, and dermatitis.5 Normal body immune function uses the cortisol affect on proteins to suppress immune response to inflammation and the allergic response.6 The influence of cortisol on the body’s response to stress is seen in how the cortisol hormone in high doses leads to stronger heart contractions, increased heart rate, and blood vessel tone with decreased endothelial permeability.5 These actions help maintain body readiness to move. Cortisol also affects appetite, wakefulness, mood, and behavior.
Cortisol changes associated with stress have been examined in soldiers with post-traumatic stress disorder (PTSD).8 PTSD can lead to soldier-patient depression, insomnia, swings in mood from happy to anger and rage with little provocation. Medical teams have tried to find physiological and psychological reasons for this condition. In the laboratory the work-up for PTSD will show decreased cortisol levels with increases in norepinephrine and epinephrine levels.8 The hypothala-mic-pituitary-adrenal negative feedback mechanism can be abnormal in its response to the stress of PTSD. Morning cortisol levels are lower than the typical 7-25 ug/dL. This finding is not fully validated yet and may be related to the upswing in natural opiates produced in these soldiers when faced with danger or the perceived danger of the past. These natural opiates may cause the affected soldier to be uninvolved with family, friends, and healthcare providers. Whether the cortisol and catecholamine changes are the cause or result of PTSD is yet to be determined.
Medications for soldiers with PTSD have been used to address the psychosis, sleep issues, and rage/anxiety flare-ups. Medications directed at specific symptoms like benzodiazepines for anxiety, anti-depressants for depression and clonidine for nightmares are being prescribed.8 New studies using alpha-1-antagonists have improved the sleep-associated symptoms of PTSD and low-dose glucocorticoids (cortisol) seem to decrease the trauma of past events of war in soldiers afflicted with PTSD.8

FOCUS: ENDOCRINOLOGY
VOL 26, NO 2 SPRING 2013 CLINICAL LABORATORY SCIENCE 121
Cortisol Measurements Cortisol measurements on specimens of plasma, serum, or urine typically use immunoassays where the tag or marker for cortisol is attached to the antibody.9 Reference laboratory methods for cortisol use a chemiluminescent immunoassay where the label is released from a substrate affording a strong signal for detection. Results from immunoassays are tempered by the realization that a number of steroid-like compounds in the cortisol synthetic pathway can crossreact with the antibody used in these immunoassays.5 Winter et. al. lists the drug prednisolone as having a 171% cross-reactivity with cortisol in such assays.5 Thus a patient on cortisol therapy would not give a reliable answer for cortisol using these types of immunoassay methods. Dexamethasone has a very low cross-reactive capacity (<0.08%) with immunoassays so its utility in suppression testing is not compromised.5 At this time, the superior method for performing cortisol assays is to use the mass spectrophotometric (MS) method. According to Winter et.al. the MS method is the best for tracking free cortisol levels.5 Laboratories without mass spectroscopy capabilities can perform the immunoassay but should follow up by sending the specimen to a reference laboratory for mass spectrophotometer assay. Kit methods for urinary free cortisol may require sample pre-testing preparation before performing the assay. Other immunoassay kits exist for the measurement of ACTH, but specimen integrity is an issue and must be strictly adhered to when this assay is needed. CRH is usually not measured in cases of suspected cortisol deficiency or excess.5
Aldosterone measurements Measurement of aldosterone varies from radioimmuno-assay (RIA) to fluorimetric immunoassays. Since this is not a commonly performed laboratory procedure, reference laboratories perform the majority of aldosterone assays. Quantitative RIA seems to be the dominate methodology used by reference facilities to measure aldosterone.10 Serum and urine samples have to be collected under controlled conditions to provide the best results. The dietary sodium level should be between 100-200 mEq/day for approximately 3 days before the collection of urine and/or serum for this assay.10 The reference range for serum aldosterone of an upright patient draw is 4.0-31.0 ng/dL using a quantitative radioimmunoassay.11 Urine aldosterone levels are obtained from a 24-hr collection that has been
preserved with 1 gram of boric acid per 100 mL of urine or has had the pH adjusted with 6M HCl or 50% acetic acid to pH 2-4.
Aldosterone/renin ratios (ARR)s are used to determine hyperaldosteronism.12 Measurements of aldosterone and renin from properly collected specimens, when the patient is supine or upright for 2 hours, are used to calculate the ARR. If the ratio is greater than 25, with an aldosterone value of 15 ng/dL or more, the patient is believed to have primary hyperaldosteronism.12 The ratio in secondary hyperaldosteronism is less than 25 as is the ARR for a patient with Addison’s disease.
Adrenal Diseases Classically when discussing the disease states of the adrenal gland, we divide them into cortex disorders and medulla disorders. The adrenal cortex, where aldosterone and cortisol are the major hormones, can be discussed as hyperadrenal diseases or hypoadrenal diseases. The hormone aldosterone can be classified as either a hypoaldosteronism state or hyperaldosteronism state when the adrenal disease affects only the outer adrenal cortex. Genetic disorders such as congenital adrenal hyperplasia (CAH), affecting a small group of patients, are not included in this discussion of adrenal disorders. For cortisol the diseases of interest are Addison’s disease (hypocorticolism) or Cushing’s syndrome (hypercorticolism). For the adrenal medulla pheochromocytoma, due to increased epinephrine levels, is the primary disorder of interest with no significant disorder associated with low medulla activity. The interplay between the various layers of the adrenal cortex and the fact that negative feedback mechanisms regulate these hormones means that most of the adrenal disorders discussed here can show an effect on other adrenal hormones. The primary hormone marker for each of these diseases stands out but other adrenal hormones can show variation from reference range levels when the disease is present.
Hypercorticolism or Cushing’s Syndrome Excesses of cortisol are seen in Cushing’s syndrome. Cushing’s syndrome is rare, with 90% occurring in adulthood, and an incidence of 2 new cases per million population per year.13 While an adrenal tumor in the adrenal cortex would be a primary hypercorticolism and source for Cushing’s syndrome, the majority of cases of Cushing’s are due to exogenous cortisol administra-

FOCUS: ENDOCRINOLOGY
122 VOL 26, NO 2 SPRING 2013 CLINICAL LABORATORY SCIENCE
tion.3,5,6 Non-exogenous incidents of Cushing’s can be divided into ACTH-independent and ACTH-dependent Cushing’s syndromes. In adults, the ACTH-independent Cushing’s is only 10-20% of the Cushing cases seen. These patients have a tumor in their adrenal gland that often needs to be removed due to the risk of malignancy associated with such neoplasms.13 The adult patients with ACTH-dependent Cushing’s constitute 80-90% of the Cushing’s cases and often have a pituitary tumor that is secreting ACTH in excess of patient needs.13
Cushing’s syndrome patients exhibit a number of physical symptoms that can initiate laboratory testing and screening for the disease. The patient’s physical appearance can include weight gain with much of the weight located centrally around the abdomen. Patients often have a classic “moon face” or rounding to their facial features, along with the “buffalo hump” or fat deposition across the back and shoulders. Adult patients complain about poor wound healing, collapsing spinal discs, cataracts, hirsutism, acne, and hypertension. Often the patient has a voracious appetite and increased susceptibility to infections.3,13 Given cortisol functions, the excess cortisol in Cushing’s syndrome can lead to compromise of the patients' immune function, loss of bone development leading to osteoporosis, renal hypertension, and metabolic issues from insulin resistance.3
Laboratory testing (Figure 3) to confirm Cushing’s syndrome includes testing for cortisol as well as complete metabolic profile. Decreases in potassium and increases in total carbon dioxide follow with elevated glucose values and a possible decrease in patient eosinophil count.13 Cortisol is measured on samples taken at 8am and 4pm.7 Diurnal variation of cortisol secretion necessitates the timed draws. Cortisol values at 8am are normally between 7-25ug/dL and 4pm cortisol levels are 2-9ug/dL, demonstrating the expected variation in blood levels.13 Patients with Cushing’s syndrome lose this diurnal variation and their evening cortisol value is often >15 ug/dL.3 The difficulty in differentiating Cushing’s syndrome as either ACTH-independent or ACTH-dependent types is compounded by the fact that both demonstrate this loss of cortisol diurnal variation.
Figure 3. Laboratory testing for Cushing’s syndrome, Primary hypercorticolism
By including ACTH assays, further differentiation can occur. The immunoassay for ACTH is often a quantitative chemiluminescent immunoassay with a range of 6-69 pg/mL.14 When the patient’s evening cortisol level is >15 ug/dL and the ACTH level is <5 pg/mL, the problem is believed to be a tumor in the adrenal gland and thus an ACTH-independent issue. When the ACTH level is greater than its upper range, as is the cortisol, the problem is said to be an ACTH-dependent Cushing’s pathology.3 While this assay is useful it is often not practical for local laboratories. Better screening for suspected Cushing’s syndrome is achieved using the 24-hour urine collection and assaying for free cortisol, the high-dose dexamethazone test, and/or the salivary collections for cortisol and ACTH collected at midnight.3,5 The urinary free cortisol level should be determined by tandem mass spectroscopy which has a 95-100% sensitivity and 98% specificity.3 One should use creatinine determinations to verify the 24-hour collection as random urine collections do not give a true representation of the cortisol cyclic secretions.5
High dose dexamethazone testing is used to differentiate ectopic ACTH-secreting tumors from pituitary ACTH-secreting tumors. Patients are given 8-12 mg of dexamethazone at 11pm. The next morning blood collections for ACTH and cortisol plus urine for free cortisol concentrations are collected.3 The suppression of ACTH, cortisol and urinary free cortisol concentrations after dexamethazone high-dose indicates a pituitary ACTH-dependent tumor. Lack of suppression after this dexamethazone suppression test indicates an ectopic ACTH-secreting tumor. Salivary sampling is useful if the patient must be sampled at midnight or have frequent sampling as with proving a case of intermittent Cushing’s syndrome.3
Urinary free corAsols
Mass Specrtroscpy assay for CorAsol
ACTH assay
Primary HypercorAcolism

FOCUS: ENDOCRINOLOGY
VOL 26, NO 2 SPRING 2013 CLINICAL LABORATORY SCIENCE 123
When Cushing’s syndrome is due to ACTH-independent causes, the aldosterone level tends to be regulated by the renin-angiotensin-aldosterone process because the ACTH level is low and not stimulating the adrenal cortex. In Cushing’s syndrome due to ACTH-dependent causes, there is an increase in stimulation of the adrenal cortex to produce more aldosterone as well as more cortisol. While there may be slight increases in aldosterone level under these circumstances, the renin role helps to minimize the change in aldosterone. Once the laboratory data confirms the high probability of Cushing’s syndrome, the patient will undergo a MRI or CT scan that will locate the cortisol tumor in the adrenal gland or if an ACTH-dependent tumor, located in the pituitary, lung, or GI tract.3,13 Ectopic ACTH secreting tumors are usually malignant making up 15% of the causes of Cushing’s Syndrome.3 Pituitary ACTH-secreting tumors constitute 68% of the cause for Cushing’s syndrome while adrenal tumors constitute 17% of the cause.3 Verification by 2 laboratory screening tests for elevated cortisol are required before an MRI or CT scan can be used to identify the tumor location. Surgery is the best option, but radiation and/or medication to suppress the adrenal cortisol production can also be used.3 Should surgery lead to adrenal removal, the cortex hormones aldosterone and cortisol need daily replacement via medication.3 Hypocortisolism or Addison’s Disease A deficiency of cortisol from the adrenal cortex fasciculata layer leads a patient to complain about weakness, fatigue, weight loss, and anorexia in 100% of the cases. Nausea and diarrhea complaints occur in 50% of the cases, and pain in only 10% of the cases.3 Patients with Addison’s disease often exhibit hyperpigmentation and adrenal gland calcification.3 Because the entire adrenal cortex is affected, this condition exhibits hypotension and glucose deficiency abnormalities. It is not unusual for a patient with Addison’s disease to have both a low cortisol level and aldosterone level. The lack of cortisol means less fatty acid and amino acid release and therefore less gluconeogenesis resulting in lower blood glucose levels during fasting states.3,5 The lack of aldosterone results in decreased sodium reabsorption by the kidneys and a decrease in blood pressure, resulting in hypotension. The laboratory assessment of a patient with these symptoms will confirm the patient’s Addison’s disease pathology.
Laboratory markers for Addison’s disease include cortisol, electrolytes and glucose. The electrolytic picture shows a decreased sodium value, increased potassium level, and slightly decreased total carbon dioxide (tCO2), indicating a mild metabolic acidosis. Additionally the serum total calcium level will be increased and the BUN may be elevated (pre-renal azotemia).3 Because the cortisol level is decreased, the fasting glucose value is also decreased, explaining the symptoms of weakness and fatigue. Morning cortisol levels will be low, while ACTH levels from samples at the same time will be >200pg/mL.3 To further substantiate the cortisol findings, the patient can be given 250 ug dose of cosyntropin, a synthetic cortisol and aldosterone stimulator, after an overnight fast.5 The patient has a baseline blood draw at 8am, then the drug, then a 30 minute and 60 minute blood draw.5 The patient with Addison’s disease will have cortisol level < 20 ug/dL indicating a lack of adrenal function with no rise in cortisol seen following the drug stimulation. This testing sequence is capable of detecting primary adrenal insufficiency or hypocorticolism but not the secondary causes of Addison’s disease. Addison’s disease or hypocortisolism is a pathology that is silently forming while the patient is unaware. Often over 70% of the adrenal gland has been lost before symptoms cause the patient to seek medical advice. Primary causes of adrenal insufficiency include autoimmune adrenal inflammation (70%), infections (fungal, HIV, and TB), bilateral adrenal hemorrhage, infiltrative processes, and metastasis.7 Secondary causes of adrenal insufficiency are those that interfere with ACTH pituitary production, such as cortisol medications or pituitary tumors and various other abnormalities.3 Differentiating primary adrenal insufficiency from secondary adrenal insufficiency can become frustrating due to a lack of clear answers. The cosynthopin stimulation test is not capable of differentiating between these conditions. Metyrapone will block the 11-B-hydroxylase enzyme and lead to an increase in 11-deoxycortisol (11-DOC) with a decrease in cortisol production in normal patients.3 Giving metyrapone dose at midnight and seeing an abnormal response where the cortisol is not decreased can indicate a secondary cause for the adrenal insufficiency.3 MRIs can be used to detect brain and pituitary problems if there is

FOCUS: ENDOCRINOLOGY
124 VOL 26, NO 2 SPRING 2013 CLINICAL LABORATORY SCIENCE
no apparent cause for adrenal insufficiency, such as with exogenous cortisol treatments. The long term treatment of adrenal insufficiency is to replace the missing adrenal hormones.3
Medullary disease Epinephrine formed by the adrenal medulla can be secreted into the blood circulation, allowing this hormone to act in seconds compared to the 20 minutes or so that cortisol action requires.3 The formation of epinephrine in the adrenal medulla chromaffin cells or pheochromoblasts begins with the amino acid phenylalanine and its conversion thru steps to tyrosine, then dopamine, thru norepinephrine, to epinephrine. The conversion of norepinephrine to epinephrine requires the enzyme phenylethanolamine N-methyl transferase (PNMT), which is a cortisol-dependent enzyme. Epinephrine is housed in storage vesicles within the chromaffin cells of the medulla. These secretory storage vesicles allow for quick release of epinephrine into the blood circulation from the medulla when stimuli of stress or hypotension lead to its release from the medulla.3
Degradation of epinephrine produces the metane-phrines and vanillylmandelic acid (VMA) products that can be measured to assess patient epinephrine output. While assays exist for measuring the epinephrine released from the medulla, the speed of degradation, uptake or removal of this hormone from the circulation makes successful assay completion very difficult. Epinephrine moves quickly from hormone action to removal as it moves from the blood to the target cell. The urinary catecholamines, namely free norepinphrine and epinephrine, can be measured by HPLC, fluorometric assays, or LC-MS/MS.3 Preserving the free catecholamines and metanephrines in urine enables the medical laboratory professional to determine the amount of epinephrine hormone released from the medulla. Elevations of the catecholamine content in a 24-hr urine followed by looking at the fraction that is metanephrine in origin, enables the medical laboratory professional to identify patients with pheochromocy-tomas.
Patients with hypertension symptoms and elevated metanephrine concentrations are evaluated for pheochromocytoma. This disease is a tumor of the chromaffin cells that leads to excessive release of
epinephrine, resulting in serious hypertension and the accompanying jumpiness associated with excess epinephrine hormone being present.3 Surgery is the usual option to treat a medullary tumor. Replacement hormones of cortisol, aldosterone, and other adrenal products are necessary if the adrenal gland is removed in order to treat a pheochromocytoma.
Summary The adrenal gland, while small in size, provides a major punch to human metabolism. The interplay between the adrenal cortex hormones aldosterone and cortisol provides needed regulation to human metabolism. Aldosterone regulates the body sodium content affecting blood pressure thru fluid-volume regulation by the kidney. Cortisol, also from the adrenal cortex, contributes to regulation of glucose and protein metabolism. Diseases like Addison’s disease and Cushing’s syndrome that affect the normal levels of these hormones can lead to serious pathologies that need to be detected thru clinical laboratory testing. The inner core of the adrenal gland, called the medulla, houses the catecholamine epinephrine, a fast acting neuropeptide hormone that can influence body action and energy levels quickly. The pheochromocytomas pathology of the adrenal medulla adversely affects the medulla hormones and needs to be recognized by clinical laboratory testing.
This overview of the adrenal gland and its potential pathologies needs to be looked at anew in relation to post-traumatic stress disorder to find any linkages that may aid in the treatment and cure of our affected military soldiers. This interrelationship between cortisol and epinephrine in PTSD should be closely evaluated to determine if the suspected linkages are significant.
REFERENCES 1. Leoutsakos, B. and Leoutsakos, A. “The adrenal glands: a brief
historical perspective”, Homones 2008;7(4):334-62. Hill, M. 2012, UNSW Embryology ISBN: 978 0 7334 2609 4
- UNSW CRICOS Provider Code No. 00098G http://php.med.unsw.edu.au/embryology/index.php?title=Endocrine_-_Adrenal_Development#Adrenal_Development. Access 2013January 28
3. Hungerford, R and Meikle, A. "Endocrine Hormones",Chapter 20, Clinical Chemistry: Techniques, Principles,Correlations”, 6th ed. In: Michael L. Bishop, Edward P. Fody,Larry E. Schoeff. Philadelphia: Lippincott, Williams, andWilkins, (2010),458-74.
4. Kay, S. and Reynolds, M. Medscape Reference http://emedicine.medscape.com/article/940347-overview#aw2aab6b4

FOCUS: ENDOCRINOLOGY
VOL 26, NO 2 SPRING 2013 CLINICAL LABORATORY SCIENCE 125
Oct 22, 2008. Accessed 2013 January 12. 5. Winter, WE, Bazydlo, LAL, Harris, NS, “Cortisol Clinical
Indications and Laboratory Testing” Clinical Laboratory News, 2012;38(9):8-10.
6. Sunheimer, R. and Graves, L. "The Endocrine Chapter" Upper Saddle River, New Jersey:Pearson Education , Inc, 2011.
7. Virk, R. “Clinical Chemistry: Adrenal Tests: Aldosterone”, University of Massachusetts Memorial Hospital, revised Sept. 21, 2012, c. 2009-2010. http://www.pathologyoutlines.com/ topic/adrenalhyperaldosteronism.html. Accessed 2013 January 12.
8. Gore, T. and Ahmed, I. “Posttraumatic Stress Disorder Workup”, Medscape Reference: Drugs, Diseases, Procedures, http://emedicine.medscape.com/article/288154-workup#aw2 aab6b5b 2aa Accessed 2012 December 11.
9. ARUP Cortisol assay, ARUP Laboratory Test Directory: 0070030, http://www.aruplab.com/guides/ug/tests/0070030. jsp Accessed 2013 January 12.
10. ARUP Aldosterone urine assay, ARUP Laboratory Test Directory: 0070480, http://www.aruplab.com/guides/ug/tests/ 0070480.jsp Accessed 2013 January 12.
11. ARUP Aldosterone serum assay, ARUP Lab Test Directory: http://www.aruplab.com/guides/ug/tests/0070015.jsp Accessed 2013 January 11.
12. ARUP Aldos/renin ratio sheet, ARUP Lab Test Directory: 0070073, http://www.aruplab.com/guides/ug/tests/0070073. jsp Access 2013 January 12
13. Chrousos, G. and Kemp, S, et. al. “Glucocorticoid Therapy and Cushing’s syndrome” Medscape Reference: Drugs, Diseases, Procedures, March 5, 2012. http://emedicine. medscape.com/article/921086-overview#a0104 Accessed 2013 January 12.
14. ARUP ACTH assay, ARUP Lab Test Directory: 0070010, http://www.aruplab.com/guides/ug/tests/0070010.jsp Accessed 2013 January 12.
The Focus section seeks to publish relevant and timely continuing education for clinical laboratory practitioners. Section editors, topics, and authors are selected in advance to cover current areas of interest in each discipline. Readers can obtain continuing education credit (CE) through P.A.C.E.® by completing the continuing education registration form, recording answers to the examination, and mailing a photocopy of it with the appropriate fee to the address designated on the form. Suggestions for future Focus topics and authors, and manuscripts appropriate for CE credit are encouraged. Direct all inquiries to the Clin Lab Sci Editorial Office, Westminster Publishers, 315 Westminster Court, Brandon MS 39047. (601) 214-5028, (202) 315-5843 (fax). [email protected].
CLEC 2014 Call for Abstracts
The deadline for abstracts for poster presentations or technology demonstrations at the 2014 ASCLS Clinical Laboratory Educators Conference (CLEC) is October 1, 2013. Submission instructions and the proposal form may be found at www.ascls.org/CLEC. The completed proposal form and abstract must be submitted electronically by the deadline.
The 2014 CLEC will be held February 20-22 in San Jose, California. Additional meeting information will be available at www.ascls.org/CLEC.

126 VOL 26, NO 2 SPRING 2013 CLINICAL LABORATORY SCIENCE
FOCUS: ENDOCRINOLOGY
Continuing Education Questions SPRING 2013
1. A focus on the endocrine glands and theirsecretions is the medical science of ___________.An example of this is the pituitary release of TSHimpacting on the thyroid gland to produce ____.a. Digestion, T3b. Endocrinology, T4c. Metabolism, rT3d. Reproduction, calcitonin
2. The HPT axis refers to the linkage between:a. gland, hypothalamus, and pituitaryb. hypothalamus, pituitary, and target glandc. pituitary, target gland and thalamusd. target tissues, hormone receptors, and proteins
produced
3. Hormones can be divided in to peptides and steroidtypes. This article talked about how the peptidehormones are bound to the cell receptor and utilizea MBST to start the cascade of reactions that willresult in the designated hormone activity. In thecase of TSH, a peptide, hormone, the MBST wasa(n)__.a. adenyl cyclase transducerb. chromaffin cellular complexc. G-protein complexd. phophatase cascade of activation
4. Most steroid hormones are carried by a bindingprotein to the site of action because they areinsoluble in aqueous environments. In the case ofcortisol, a steroid hormone, the binding protein fortransport isa. albuminb. CBGc. TBGd. SHBG
5. Negative feedback was described in text anddiagrams. If you had a patient with elevated cortisollevels and abnormally low ACTH levels, you wouldsuspect that this patient had lost his
a. ability to produce TSH in response tohypothalamic stimulation
b. ability to inhibit the hypothalamus CRHproduction
c. diurnal variation biorhythm pattern betweenthe pituitary and the gland
d. hypothalamic function to produce thenecessary releasing hormone
6. When blood pressure decreases, the release of reninfrom the _____ initiates the_____ mechanism.a. kidney, angiotensinogen-aldosteroneb. kidney, Embden-Myer glucosec. liver, renin-angiotensind. lung, renin-cortisol
7. Cortisol from the adrenal gland plays a role inquelling inflammatory processes. However, whenpregnosone, a cortisol-derived medication, is givenfor anti-inflammatory purposes, the immunoassayfor cortisol on that patient will:a. be subject to DOC interferencesb. continue to give reliable results because the
cortisol antibody is specificc. demonstrate a result that is falsely elevatedd. lose its diurnal variation between AM and PM
assays
8. Soldiers with Post-Traumatic Stress Disorder(PTSD) have a number of hormone changesassociated with their condition. Recent evidence hasbeen looking at the hormone changes of:a. elevations of aldosterone and decreases in
epinephrineb. elevations of cortisol and decreases in DHEAc. decreases in aldosterone and increases in opiatesd. decreases in cortisol and increases in
epinephrine
9. Aldosterone Renin Ratios (ARRs) are useful in thedetermination of hyperaldosteronism or hypoaldo-steronism. The criteria for hyperaldosteronism isthat the ARR be:

FOCUS: ENDOCRINOLOGY
VOL 26, NO 2 SPRING 2013 CLINICAL LABORATORY SCIENCE 127
a. less than 25 with an aldosterone value that is above 30 ng/dL
b. less than 30 with an aldosterone value greater than 15 ng/dL
c. greater than 25 with an aldosterone value greater than 15 ng/dL
d. greater than 30 with an aldosterone value above 30 ng/dL
10. A physician detects the presence of Cushing’s
syndrome in a patient and needs to determine the cause. Once he can rule out exogenous reasons, he orders testing to detect which type of Cushing’s syndrome his patient has. Which result here would indicate that the patient has an ACTH-dependent Cushing’s syndrome? a. ACTH value <5 pg/mL with PM cortisol value
>15ug/dL b. ACTH value >5 pg/mL with AM cortisol value
< 15 ug/dL c. ACTH value >70 pg/mL with PM cortisol
value > 15 ug/dL d. ACTH value >70 pg/mL with AM cortisol
value < 10 ug/dL 11. A patient has a history of fungal infections. He
comes to his physician complaining of weakness and fatigue. His laboratory results show a decreased glucose, increased potassium, decreased total carbon dioxide, slightly increased BUN, and a decreased cortisol level. These results would lead you to suspect that the patient has: a. Addison’s disease b. Cushing’s syndrome c. Intermittant Adrenal Hyperplasia d. Pheochromocytoma
12. Thyroid hormones T4 and T3 are secreted in
response from pituitary stimulation by: a. CRH b. TRH c. TSH d. Somatostatin
13. The thyroid synthesis of T4 within the follicular
cells is a multi-step process. The organification step is when:
a. iodine combines with tyrosine residues to form MIT and DIT
b. iodide is trapped in follicular cell and oxidized to iodine for MIT and DIT
c. proteases digest drops of colloid and release T3 and T4 to circulation
d. there is enzymatic coupling of the MIT and DIT forms to produce intrathyroglobulin T3
14. Congenital hypothyroidism or cretinism, according
to the American Academy of Pediatrics, necessitates that all newborns be screened via: a. blood test for hyperthyroidism using the
genetic markers for Graves disease b. blood spots collected for TSH/backup T4
screening for hypothyroidism c. heel sticks for T4 and T3 using immunoassays
for blood d. isometric radial circumferences of their thigh
muscles prior to discharge
15. A female patient during her routine physical exam has blood drawn for a comprehensive metabolic panel (CMP) and thyroid panel due some medication she is on. Her laboratory findings are within acceptable ranges except her TSH level is decreased. A follow-up thyroid panel test shows only her TSH value is decreased and her T4 is fine. The physician tells the patient that she has: a. primary hypothyroidism b. primary hyperthyroidism c. subclinical hyperthyroidism d. secondary hypothyroidism
16. Sick Euthyroid Syndrome (SES) occurs when a
patient has abnormal thyroid hormone levels without the presence of thyroid disease. Which set of results represents the findings on a SES patient? a. elevated TSH, with no increase in T3 and T4,
patient has diabetes b. decreased T3 levels with elevated reverse T3,
patient is on amiodarone for cardiac arrhythmias
c. elevated TSH with decreased T4 , patient who had a baby 4 months ago
d. decreased TSH with increased T4, patient who exhibits eye orbit prominence

FOCUS: ENDOCRINOLOGY
128 VOL 26, NO 2 SPRING 2013 CLINICAL LABORATORY SCIENCE
17. Laboratory testing for thyroid-related disease coulddraw on a number of potential thyroid tests. Atpresent the detection of thyroid disorders initiallydepends on:
a. TSH, T4, and THBRb. free T3 and free T4 testingc. TT4 and reverse T3, followed by TSHd. TSH with reflex testing of free T4
CERTIFICATION MAINTENANCE MEMBERSHIP (CMM)
ASCLS CERTIFICATION MAINTENANCE MEMBERSHIPS
EASILY EARN CE CREDIT!
Renewing or joining members can select the CMM option which provides a subscription for 12 hours of online P.A.C.E.® approved continuing education (CE) for only $55plus national and state dues.
CMM is a 1-year subscription with ASCLS’ partner, MediaLab, Inc.
The 12 hours cover designated discipline areas for the Board of Certification (BOC) Certification Maintenance Program.
CERTIFICATION MAINTENANCE MEMBERSHIP PLUS (CMMP)
Upgrade to unlimited hours of CE and select the course you want for $95 plus national and state dues.
CMMP is a 1-year subscription with ASCLS’ partner, MediaLab, Inc.
ASCLS | 1861 International Drive, Suite 200, McLean, VA 22102 | phone 571.748.3770
Go to www.ascls.org/cmm for more information.

Continuing Education Registration Form To earn continuing education (P.A.C.E.®) credit, (1) complete the form below, (2) record your answers, and (3) mail a photocopy with a check or money order ($18 for ASCLS members, $28 for non-members) to:
American Society for Clinical Laboratory Science 1861 International Dr., Suite 200, McLean, VA 22102
A certificate of completion will be awarded to participants who achieve a passing grade of 70% or better. Participants should allow eight weeks for notification of scores and receipt of certificates. Alternately the Focus exam can be completed online. To register as a participant and receive a username and password to access the online quiz, go to the ASCLS Online Store at http://www.ascls.org/store and log in to the website (non-members will need to create an account). Select “Merchandise” in the “Shop for” pull down menu; select “Online Quizzes” in the “Select Category” pull down menu; then find your quiz title. Allow 1-2 business days to receive username, password and instructions. Focus: Endocrinology carries 2.0 hours of Intermediate level P.A.C.E.® credit. This form can be submitted for credit for up to two years from the date of issue. Print or type carefully. (01) NAME___________________________________________________________________________________________ Last First M.I. ASCLS membership number ____________________________ Licensure number _________________________________ (02) ADDRESS _______________________________________________________________________________________ (03) CITY____________________________ (04) STATE/COUNTRY _______ (05) ZIP/POSTAL CODE _____________ (06) DAYTIME PHONE ( ____ )__________________ (07) E-MAIL:____________________________________________ (08) CREDIT CARD # _____________________________ TYPE (CIRCLE) AE MC VIS EXP. DATE ______________ _____________________________________________________________________________________________________ Check all that apply: Participant Information Please circle the most appropriate answers.
Send my certificate of completion via email I would like to receive ASCLS membership information 1. Is this program used to meet your CE requirements for: I would like information on other continuing education sources (a) state license (b) BOC (c) employment (d) other
Answers 2. Did these articles achieve their stated objectives? Circle correct answer. 1. a b c d 12. a b c d 3. How long did it take you to complete both the reading 2. a b c d 13. a b c d and the quiz? _______ minutes 3. a b c d 14. a b c d 4. a b c d 15. a b c d 4. What subjects would you like to see addressed in the 5. a b c d 16. a b c d future Focus articles? 6. a b c d 17. a b c d 7. a b c d 8. a b c d 9. a b c d 10. a b c d 11. a b c d

Make your plans to attend!
Why attend the Annual Meeting?
Exceptional continuing education....updates on lab issues ....fantastic clinical laboratory expo ....networking with MLS leaders and experts! I bring back leading edge management and techni-‐cal information to my lab, and to all labs served through our facility's outreach program! The 'icing on the cake' from attendance of the annual meeting is the essential renewal of my professional spirit... which is as they say "priceless"!
Lezlee Koch, MT(ASCP), Clinical Laboratory Manager, Outreach, Avera McKennan Regional Laboratory, Sioux Falls SD
I attend the ASCLS Annual Meeting because it is one of the few opportunities I have to be reinvigorated as a professional. Between helping promote the voice, value, and vision of the clinical
laboratory through opportunities in the ASCLS governance structure, networking with colleagues from around the country, and hearing world-‐class speakers, the return on investment I get is unmatched. This professional 'reboot' allows me to return to the workplace with new information and a refreshed sense of the important role we play in healthcare.
Kyle Riding, MLS(ASCP)CM. Medical Laboratory Scientist, Boston Children's Hospital, Boston, MA
Need Visit the Clinical Lab Expo
Registration includes admission to the largest show of clinical laboratory products! Talk to vendors one-‐to-‐one for all of your laboratory needs. Located at the George R. Brown Convention Center. Shuttle service from ASCLS hotel.
See everything this year’s meeting has to offer!
Download the preliminary program at www.ascls.org/AnnualMeeting. Smart phone & tablet users may also access meeting information via the ASCLS Annual Meeting Mobile App. Earn P.A.C.E.® credit at scientific sessions.
Register Conveniently Online
Register using our online system or download a copy of the registration form at www.ascls.org/ AnnualMeeting. Register by June 7 and save with the early-‐bird rate!
Book Your Housing
The Royal Sonesta Hotel will be the headquarters hotel. Book no later than June 23 to ensure you receive the ASCLS discounted room rate of $155/night, plus taxes and fees. Book online at www.ascls.org/AnnualMeeting or call directly at 1.800.766.3782 and mention rate code 'ASCLS Annual Meeting' to receive the discounted rate.
Need More Information?
Go to the ASCLS website at www.ascls.org/ AnnualMeeting for more details.