034-2011: applied revolutionary bi - sas
TRANSCRIPT

1
Paper 034-2011
Applied Revolutionary BI
Chuck Kincaid, COMSYS, Portage, MI
ABSTRACT
Two years ago, Revolutionary BI described a way to bring business analytics reporting into the twenty-first century. By taking advantage of internet usage patterns developed outside of the corporation (as learned from Google, Twitter, Facebook and many more), the business analytics paradigm inside the corporation can achieve a new level of capability.
However, to take these revolutionary ideas into the corporate cubicles, many of the technical and process details within SAS® and between SAS and other technologies have to be worked out. This paper presents ideas, suggestions, and questions that start the conversation for implementing Revolutionary BI in your organization.
INTRODUCTION
Two years ago the author published the paper Revolutionary BI – A Vision for Business Intelligence[1]. It was well received as a strategic, forward-looking paper. The concepts and methodologies can radically modify the Business Analytics Reporting Lifecycle. Instead of the standard, static, hierarchical, formal approach that has been around since Ancient Egypt, the author proposed a more organic approach based on the Web 2.0 usage patterns of tools provided by Stumble, Google, YouTube, Amazon, Flickr, Wikipedia, and the many others currently in use and coming all the time. This new approach will complement rather than replace the traditional lifecycle, as each has an important place in the corporate lifecycle of Business Analytics.
These ideas are all well and good, but to actually make changes, we need to start applying the concepts. Some concepts have associated tools that already exist and others that need to be developed. At the same time, the culture needs to adapt to this type of approach, so that when the tools are in place, they will indeed be used.
This paper will give a review of the new Business Analytics Lifecycle concepts, discuss the practicality of their application first from a technical perspective and, then, from a culture perspective. We will base the discussion on SAS® tools whenever possible. SAS® is making great headway into this area, but no one is there yet.
The focus on Business Analytics and not Business Intelligence is intentional. The corporate world is beginning to realize the value of analytics, as evidenced by the popularity of books like Super Crunchers[2], Competing on Analytics[3], Moneyball[4] and Analytics at Work[5]. They turn the descriptive, historical view of Business
Intelligence into the future improving the capability of management to make truly intelligent and effective decisions. Business Intelligence is best viewed as a subset and precursor to the more mature Business Analytics. Besides, it’s easier to not have to say both all the time!
BUSINESS ANALYTICS LIFECYCLE
First we’ll review the Business Analytics Reporting Lifecycle as proposed in the Revolutionary BI paper two years ago. The review will be a shortened version of the previous paper, adding some new comments and pointers. A lot has happened in the last two years.
For the purposes of this paper, there are four proposed areas to the business analytics lifecycle: Gathering Data, Analyzing Data, Collaborative Reporting, and Analyzing Reports.
Gathering Data
Data is becoming the oil that makes the wheels of business turn. The amount of data, sources of data, and types of data are becoming both a blessing and a curse to those that use it. Three ideas that can be added to the standard, formal data gathering process in order to enhance it are Mash-ups, Non-traditional Data Sources and Auto-Integration.
Mash-ups are simple ways for people to integrate data in ways that the original authors may not have foreseen. (See Figure 1) This allows the Analytician to “think outside the box” with regards to what is important information. Non-Traditional Data Sources adds web queries, RSS feeds, video, pictures, text, RFID, geo-location, etc to the standard RDBMS or even Excel spreadsheets so prevalent and important.
Business Intelligence and AnalyticsSAS Global Forum 2011

2
Figure 1 Yahoo Pipes 2.0
Auto-Integration automatically proposes relationships among data sources along with a measure of confidence in the relationship and a means for subject matter experts to confirm or deny the relationship. The data sources could be specifically chosen or mined from corporate networks in the manner of a webcrawler.
Taking this idea even farther we run into Tim Berners-Lee’s exciting idea of Linked Data[6]; DBpedia, which “is a community effort to extract structured information from Wikipedia and to make this information available on the Web;”[7] and gapminder.org whose mission is “Unveiling the beauty of statistics for a fact based world view.”[8]
They create access to data around the world (430 at this time) and tools to easily explore the data, such as Gapminder World, a “web-service displaying time series of development statistics for all countries.” See Figure 2.
Analyzing Data
Data analysis will stay primarily in the hands of statisticians (or analyticians) and others, because they are trained for that task. We can, however, make that task easier for them and for non-professionals by enhancing their tools. The tools they should have available to them would allow advanced analytics and multi-dimensional, interactive graphics without a lot of work to make it happen. Gapminder World is one such example outside of the corporate world. It should also help the analytician deliver the fruits of their labors to their customers. The tool will keep track as the analytician goes about their daily tasks as part of developing analytical reports, watching for when they would repeatedly perform the same set of tasks. At that time it will pop up an alert pointing that out and offering to convert that set of tasks into a stored process. There would also be a “Publish” button so that when the analytician comes up with a particular analytical report that they find valuable for their colleagues, they can, with a click make this report available to others. Apple, as an example, uses this idea in their product, iMovie®, so that a person can easily publish their movies to YouTube or another forum.
Figure 2 Gapminder World
Business Intelligence and AnalyticsSAS Global Forum 2011

3
Figure 3 Sharing to YouTube
Collaborative Reporting
But where would those reports go and how would they get there? We want to deliver the reports to a YouTube® like server that allows others to view, rate, discuss, and share the analytical report. We might also want to take advantage of the aggregate intelligence of our colleagues to refine and enhance the information portrayed. To do this, we can use a Wikipedia® style server to allow others to borrow, refine, suggest and enhance analytical reports. Figure 4 shows the revision history for an article about Mr. Peabody’s WABAC Machine. What better way to asynchronously collaborate on the analysis and presentation of data and information.
Figure 4 Revision History for The WABAC Machine
Other users would be able to check out the report with data and code, edit it, and check it back in. The authors of various versions would get an e-mail indicating that their report has been edited, just like a discussion forum would alert a contributor that someone had responded to their post.
Analyzing Reports
In this new system we have many people easily creating many reports and making them available to the rest of the corporation. We now want to somehow structure and deliver this plethora of reports in such a way that people can easily manage and utilize them, but at the same time isn’t too rigid nor requires a lot of pre-defined structures. Tags are a Web 2.0 structure that organically (that is, develops naturally) structures of connectedness. A report can have tags associated with it that describe the report. By connecting reports via their tags, we have a multi-dimensional relationship that does not depend on a rigid, pre-defined structure.
Business Intelligence and AnalyticsSAS Global Forum 2011
4
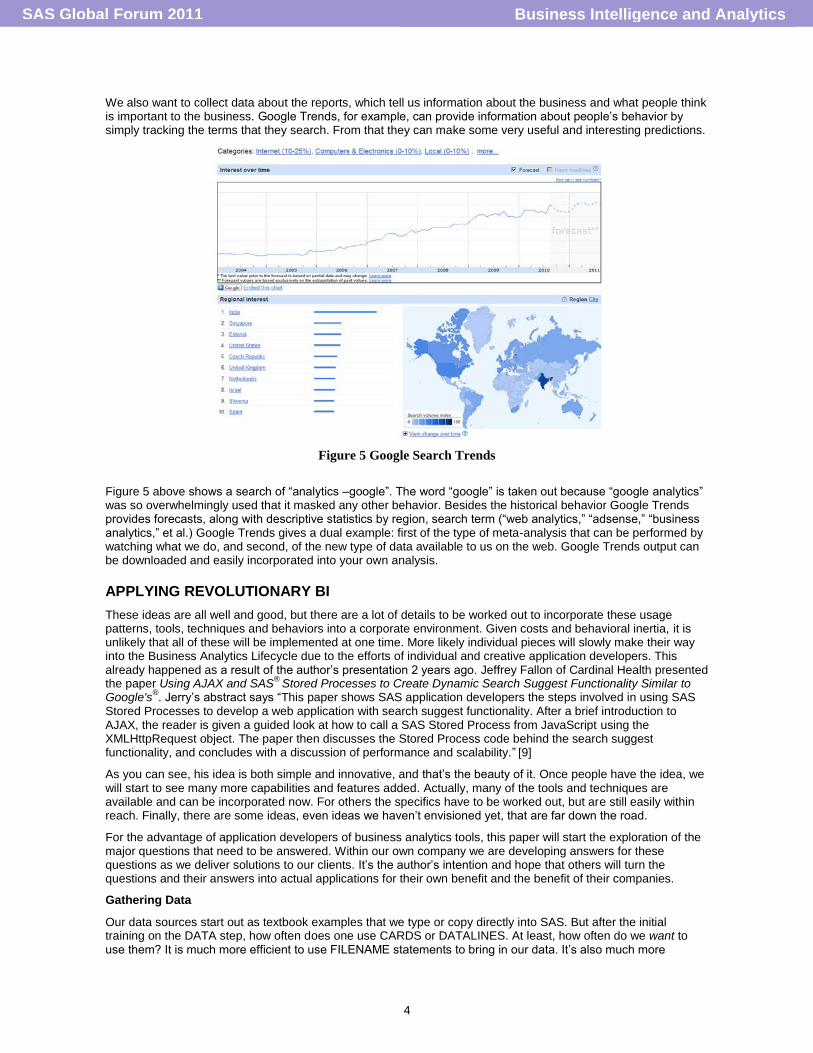
We also want to collect data about the reports, which tell us information about the business and what people think is important to the business. Google Trends, for example, can provide information about people’s behavior by simply tracking the terms that they search. From that they can make some very useful and interesting predictions.
Figure 5 Google Search Trends
Figure 5 above shows a search of “analytics –google”. The word “google” is taken out because “google analytics” was so overwhelmingly used that it masked any other behavior. Besides the historical behavior Google Trends provides forecasts, along with descriptive statistics by region, search term (“web analytics,” “adsense,” “business analytics,” et al.) Google Trends gives a dual example: first of the type of meta-analysis that can be performed by watching what we do, and second, of the new type of data available to us on the web. Google Trends output can be downloaded and easily incorporated into your own analysis.
APPLYING REVOLUTIONARY BI
These ideas are all well and good, but there are a lot of details to be worked out to incorporate these usage patterns, tools, techniques and behaviors into a corporate environment. Given costs and behavioral inertia, it is unlikely that all of these will be implemented at one time. More likely individual pieces will slowly make their way into the Business Analytics Lifecycle due to the efforts of individual and creative application developers. This already happened as a result of the author’s presentation 2 years ago. Jeffrey Fallon of Cardinal Health presented the paper Using AJAX and SAS
® Stored Processes to Create Dynamic Search Suggest Functionality Similar to
Google's®. Jerry’s abstract says “This paper shows SAS application developers the steps involved in using SAS
Stored Processes to develop a web application with search suggest functionality. After a brief introduction to AJAX, the reader is given a guided look at how to call a SAS Stored Process from JavaScript using the XMLHttpRequest object. The paper then discusses the Stored Process code behind the search suggest functionality, and concludes with a discussion of performance and scalability.”
[9]
As you can see, his idea is both simple and innovative, and that’s the beauty of it. Once people have the idea, we will start to see many more capabilities and features added. Actually, many of the tools and techniques are available and can be incorporated now. For others the specifics have to be worked out, but are still easily within reach. Finally, there are some ideas, even ideas we haven’t envisioned yet, that are far down the road.
For the advantage of application developers of business analytics tools, this paper will start the exploration of the major questions that need to be answered. Within our own company we are developing answers for these questions as we deliver solutions to our clients. It’s the author’s intention and hope that others will turn the questions and their answers into actual applications for their own benefit and the benefit of their companies.
Gathering Data
Our data sources start out as textbook examples that we type or copy directly into SAS. But after the initial training on the DATA step, how often does one use CARDS or DATALINES. At least, how often do we want to use them? It is much more efficient to use FILENAME statements to bring in our data. It’s also much more
Business Intelligence and AnalyticsSAS Global Forum 2011

5
productive, since we can pull in data from Excel spreadsheets, CSV files, and relational databases. The capability of SAS to access these standard data sources is beyond comparison. However, the FILENAME statement is even more powerful than that. A colleague in the Analytics Development Practice at COMSYS, Jack Fuller, published a paper on using the FILENAME statement along with some perl pre-processing to gain access to a wide variety of web data sources. In that paper he accessed CSV and XML files, HTML documents, and local tax records.
Scott Davis, another colleague, has applied these ideas by accessing Google Docs from SAS. See his paper in the MWSUG 2010 conference proceedings.
Looking at some of the other SAS products in this direction, we have SAS Data Surveyor for Clickstream Data which is new in SAS 9.2. The data surveyor provides access to particular data sources. In this case it “automates the extraction of useful information from large volumes of clickstream data collected in Web logs.” Another new data surveyor provides that same type of access to Salesforce.com. Watch for new data surveyors to become available for other web data in future releases.
The exciting thing is how much data is available on the web. Jeffrey S. Simonoff, Professor of Statistics and Robert Stansky Research Faculty Fellow, in the Leonard N. Stern School of Business at New York University, maintains a web page, albeit sporadically, with links to a wealth of web data[10]. Three examples are below.
Links to Economic and Financial Data
TITLE WEB SITE DATA TYPE FORMAT AVAILABLE
Stern OnLine Data Access
http://www.stern.nyu.edu/it/rds/research/index.html
data on basic economics, industrial compustat, bank compustat, business information compustat, global vantage, stock, bond & indices;
data available as SAS data files & ASCII files; user name and password required;
Global Financial Data
https://www.globalfinancialdata.com/
annual data on stock markets, inflation rates, interest rates, exchange rates,etc;
data available in various formats;
National Bureau of Economic Research Macrohistory Database
http://www.nber.org/databases/macrohistory/contents/index.html
historic data on production, construction, employment, money, prices, asset market transactions, foreign trade and government activity;
data available in Micro-TSP.db format which is readable by TSP, Micro-TSP, Eviews, RATS and other packages;
Federal Reserve Economic Data
http://www.stls.frb.org/fred/ historical U.S.economic and financial data, including daily U.S. interest rates, monetary and business indicators, exchange rate, balance of payments and regional economic data;
compressed files in .zip or self-extracting.exe formats, others in ASCII format;
Bureau of Labor Statistics
http://stats.bls.gov/ employment, average annual pay, and many other economic statistics;
data available in ASCII format;
WebEc Economics Data
http://www.helsinki.fi/WebEc/webecc8d.html
one of the best and complete economics data links including data on both international and domestic data categorized by area and country;
various data formats, some data available as ASCII,Excel and other convenient format; others available as print-out tables;
Bill Goffe's Resources for Economists
http://rfe.org/showCat.php?cat_id=2
data for U.S. and regional economies; links to many other U.S. data sites; links to world/non-U.S. data;
data available in different forms depending on source;
Business Intelligence and AnalyticsSAS Global Forum 2011

6
TITLE WEB SITE DATA TYPE FORMAT AVAILABLE
The Connecticut Economic Information System
http://www.ct.gov/ecd/site/default.asp
data on employment and labor force, demographic and social statistics; exports, the growth of economy and other economic indicators;
data available in excel format;
Yahoo! Finance
http://finance.yahoo.com/ stock quotes & other data on financial market;
data downloadable in spreadsheet format;
National Economic Accounts
http://www.bea.gov/bea/regional/data.htm
Local area economic data for states, counties and metropolitan areas;
data available in excel file;
Financial Data Finder
http://fisher.osu.edu/cgi-bin/DB_Search/ db_search.cgi?setup_file=finance.setup.cgi
links to historical data and quotes on banks, derivatives, equity, exchanges, fixed income, investment, real estate, etc;
data available in printed-out table or ASCII file;
Damodaran Online
http://www.stern.nyu.edu/~adamodar
This page provides information on how to collect data from a variety of sources; it also allows you to look at and download a number of data sets that you might find useful in corporate finance and valuation;
data available in downloadable format;
Economagic http://www.economagic.com/ This page provides links to more than 100,000 economic time series.
data available through cutting and pasting; Excel files are available by subscription;
Free Lunch http://www.economy.com/freelunch
Links to many financial, economic, and demographic data
data available through cutting and pasting
Links to Other Social Science Data
TITLE WEB SITE DATA TYPE FORMAT AVAILABLE
EH.net http://eh.net/ehresources/ databases include data on U.S. population series; labor force data by all kinds of categories; data of the rural agricultural workforce by sex and by age-group, by county at census dates from 1800-1900;
data available in both ASCII and Excel format;
Crime & Justice Electronic Data Abstracts
http://bjs.ojp.usdoj.gov/ crime and justice data containing thousands of numbers and hundreds of categories, displayed by jurisdiction and over time;
data presented in spreadsheets in .wk1 format; convenient to use with analytic software;
Yale StatCat http://ssrs.yale.edu/statcat/index.jsp
links to a lot of social science survey data;
data provided within extract and analysis systems and/or in downloadable formats;
Survey Documentation & Analysis
http://sda.berkeley.edu/ data on national omnibus surveys; racial attitudes and prejudice; health surveys; US census microdata and data for testing;
data available in ASCII format;
Business Intelligence and AnalyticsSAS Global Forum 2011

7
TITLE WEB SITE DATA TYPE FORMAT AVAILABLE
Data and Information Services Center
http://www.disc.wisc.edu/ a complete social science data archive for use in social science research;
data are free to download;
Yahoo Social Science Data Archive
http://dir.yahoo.com/Social_Science/Social_Research/Data_Collections/ Science/Social_Research/Data_Collections/
links to all kinds of data archives data available in different kinds of formats;
Social Sciences Data Collection (SSDC)
http://ssdc.ucsd.edu/ links to all kinds of social sciences data
data available in different kinds of formats; some data have access restrictions;
Links to Comprehensive Data
TITLE WEB SITE DATA TYPE FORMAT AVAILABLE
The Info Service
http://info-s.com/ Links to just about everything you can think of
data available in different forms depending on source
Regional Statistics
http://www.fedstats.gov/ links to more than 70 federal agencies with regional statistics on agriculture; demographic and economic; crime; education; energy and environment; health; labor and national accounts;etc;
data available in compressed ASCII files;
International OECD Statistics
http://www.oecd.org/statsportal/0,2639,en_2825_293564_1_1_1_1_1,00.html 0,2639,en_2825_293564_1_1_1_1_1,00.html
links to Organisation for Economic Co-operation and Development statistics on agriculture; demographic and economic; crime; education; energy and environment; health;
some data available in Excel and ASCII files; others as printed-out tables
Center for International Earth Science Information Network
http://www.ciesin.org/ data resources including archive of census related products; China dimensions data collection; environmental treaty texts; gridded population of the world, etc;
data usually available in ASCII format;
National Climatic Data Center
http://lwf.ncdc.noaa.gov/oa/ncdc.html
links to weather-related data categorized as Climate; Geophysical; Oceanographic; Radar and Satellite;
data available as downloadable format;
Statistical Resources on the Web
http://www.lib.umich.edu/govdocs/stcomp.html libhome/Documents.center/ stcomp.html
complete links to all kinds of online data archives;
data available in different forms depending on source;
Statistics Data Sources
http://www.statistics.com/ links to many different data archives data available in different forms depending on source
Business Intelligence and AnalyticsSAS Global Forum 2011

8
Almost every one of these can be brought into SAS using the FILENAME statement. For many, the data retrieval can be made automatic via batch processing by using the techniques in Jack’s paper.
The Linked Data Organization[6] created by Tim Berners-Lee with the goal “to extend the Web with a data commons by publishing various open datasets as RDF on the Web and by setting RDF links between data items from different data sources.” In 2006, the man who invented the World Wide Web, set out to make data accessible to everyone in such a way that all data is part of one global data space.[11] Put simply, his principles for achieving this utilize HTTP URI’s (Universal Resource Identifiers) to name things and refer to them, and the standard RDF (Resource Description Framework) to provide useful information about those things. RDF was designed as a “standard model for data interchange on the Web.”[12] The standard is very useful to the new Business Analytics Lifecycle, since it incorporates the three paradigms being proposed. It has the potential to integrate all kinds of data sources from all over the world, as well as inside a corporation through RDF wrappers. It promotes mash-ups because it facilitates the merging of data regardless of whether their schemas are the same or different. Finally, it sets up a process so that relationships between data sets can be traversed, new data sets discovered, and the similarity between entities of different data sets can be easily calculated. These capabilities facilitate the auto-integration that we are looking for.
Figure 6 Linking Open Data cloud diagram, by Richard Cyganiak and Anja Jentzsch.
http://lod-cloud.net/
Figure 6 shows a cloud diagram of data linked as of September 2010 by the Linking Open Data Project. One of the first steps in using this information is to incorporate Berners-Lee’s principles into the SAS FILENAME. This means we first process the RDF triples, which use URI’s to identify the subject and object of the relationship and the type of relationship. Michael Hausenblas in his paper, Linked Data Applications[13], gives an introduction to surfacing data as linked data and building applications that use linked data. There are also tools and applications available to help jumpstart the developer.
Finally, there is great work being done along the auto-integration lines. Raimond, Sutton, and Sandler at the Centre for Digital Music have published a paper on their “interlinking algorithm” that automatically integrates two data sets surfaced via the RDF standard.[14]
Business Intelligence and AnalyticsSAS Global Forum 2011

9
Analyzing Data
Like the FILENAME statement for collecting data, SAS already has a very strong foundation for analyzing data in its Visual Data Discovery suite, i.e. Enterprise Guide and JMP. Advanced analytics and multi-dimensional graphics are available and easy to use. Let’s look at what capabilities around these two are available and what’s still to come. The further capabilities that we want are a “Publish” button so that advanced analytics and multi-dimensional reports can be easily delivered to a collaborative web server. We’d also like to have the system track what’s done in order to suggest productionalizing a particular set of report building tasks. Next, we want to tag these reports with appropriate keywords, both manually and automatically. Finally, we want these reports to be delivered to a server in such a way that they can be shared, edited,
Both of these capabilities are already there in their nascent form or can be added. For example, JMP has the capability to convert certain graphics – a JMP Bubble plot, the JMP Profiler, and the JMP Histogram – to SWF (Adobe Flash) files. See Figure 7.
Figure 7 JMP Export to Flash
This publish button should now be expanded to deliver any combination of JMP output directly to a server. Our Analytics Development Practice has added this capability to Enterprise Guide. The analytician builds a model for the particular analysis on which they’re working. When they’re done, they publish that model to a collaborative web server. It gets put in the proper location based on the tags associated with the model. Their customers (product developers) can use the model for what-if scenario analyses to help improve their products. The customers also have discussion forum capabilities to dialogue about the efficacy of the model, ask questions, suggest improvements, etc.
Within Enterprise Guide this capability was added using OLE Automation. The Enterprise Guide documentation can be found online. See the reference section at the end of this paper. Kevin Kramer’s White Paper outlining the steps for automating Enterprise Guide can be found on the COMSYS Analytics Development Practice website[15].
The other capability that’s already there is JSL, the JMP Scripting Language. (Reference for JSL) JMP gives the user the capability to keep a journal of their work. In this journal, the user can create and save a script that
Business Intelligence and AnalyticsSAS Global Forum 2011

10
contains links to all of the relevant reports and data tables. Right now it’s manual (see Figure 8 below), but the developers can certainly make it automatic.
Figure 8 JMP Scripting Capability
On the other end, Enterprise Guide creates projects from which report processes can be extracted and analyzed.. Each of these applications keep a record of sorts of the work that’s been done. The next step is to intelligently analyze the journals and projects for patterns. At a high level, proposed steps are listed below along with some possible directions and challenges to be overcome.
Table 1 Analyzing Path Patterns
TASK POSSIBLE DIRECTIONS CHALLENGES
Mark the beginning and end of report development sequences.
Identify certain steps as potential beginning and end steps. e.g. DATA, PROC REPORT, ODS CLOSE;
There may be false starts and extra steps that are part of the exploratory development process
Catalogue the paths taken in each sequence
Behavior maps Paths may have repeated or unnecessary steps
Simplify paths to key steps Intersection analysis Key steps may have low frequency
Calculate distribution of paths and high probability transitions
Path analysis and Markov Chains
Overall frequency needs to be high enough for transition probabilities to be useful
Evaluate path probability versus threshold
Markov Chains Determine appropriate thresholds
Business Intelligence and AnalyticsSAS Global Forum 2011

11
TASK POSSIBLE DIRECTIONS CHALLENGES
Present path to Analytician for production
Enterprise Guide package Learn from refinements made to path for future
Collaborative Reporting
After we’ve built these reports and published them to the web, we want to allow collaboration on the development of the reports. SAS Web Report Studio has the beginnings of this capability. Edit and Comment capabilities can be provided to certain users or groups of users. One developer can create a report using SAS Web Report Studio and publish it for others to view. Those who have permissions can edit the report, tweaking it or adding features to it. In SAS 9.2, they or others can also comment on the report discussing, for example, its appropriateness and interesting things it shows. The editing capability is not full-fledged document management that would provide versioning of the reports. As this capability becomes more prevalent, the versioning will be an essential feature for the same reasons that Sharepoint versioning, or better yet, MS Word Track Changes are important.
We also want this capability for Stored Processes, especially ones created as Enterprise Guide Projects, and for JMP journals. Stored Processes and JMP journals can do so much more than Web Report Studio reports, especially with analytics and, with JMP, advanced interactive graphics. There are two obstacles to making them as collaborative as we want them to be. The first is that we need software for a server that has the capabilities to perform the collaboration. The second is that we need a way to distribute enough information so that people can do the collaboration. Let’s look at each of these.
There are way too many software packages out there to say that a particular one is the one to use. One that would work for what we want is WikiMedia, begun in 2002, which runs the Wikipedia web site[16]. This software is used as a content management system by corporations such as Novell, Intel Corporation, and End Point Corporation[17]. The “Article” page would be where the report is presented, and the “Discussion” page is for, well, any discussion about the report. We would want the ability to upload our report to be viewed directly on the Article page.
For the sake of the free market, we mention one other software package for forums, Vanilla Forums[18]. It is “an open-source, standards-compliant, customizable, modern, community-building discussion forum. Over 350,000 sites use Vanilla Forums to manage feedback, spark discussion, and make customers smile.” There are a lot of other software packages out there as well.
To publish reports to a wiki server, we need the ability to communicate with the wiki to format and display the output appropriately. One option is to create an ODS tagset for Wiki Markup Language. Creating an ODS tagset is not easy, but it is doable. There is SAS documentation[19][20] and user presentations, such as the one by Jack Hamilton at a previous WUSS[21].
Unfortunately, there is not a particular Wiki Markup Language that everyone uses, and, in fact, there are many. A project that appears to be very helpful in standardizing these multiple markup languages is WikiCreole[22], begun in 2006. Like the Creole language which was made up by mixing multiple languages together, WikiCreole has “conducted intensive research on common wiki markup elements. Each element was discussed in detail on the talk pages of this wiki, and chosen according to the goals and good practices…” Though not all of the wiki’s will understand WikiCreole, Creole 1.0 has been published with the efforts “…of wiki developers and users from different engines.”
Once we have the capability to deliver a package of understandable content to a collaborative server, the next question becomes “what content to deliver?” It seems that there are 3 pieces to the package: 1) the report output, 2) some form of the code that created the report and 3) the data or access to the data. The report would be some combination of graphics, tables and text. Its structure could be a PDF, yet following the spirit of this paper, we want to give them an interactive report, with HTML 5.0, Ajax, Flash or another technology. In order to do the collaboration, the user would need to have Enterprise Guide, JMP, or another appropriate tool. This could be on their local or remote desktop.
The second piece of the package is the code that created the report. These can be, and maybe ideally will be, highly complex reports with many steps that perform data preparation, call statistical procedures and create interactive graphics. Part of the package uploaded to the collaborative server, therefore, would be the Enterprise Guide project or the JMP Scripting Language. They would then be downloaded to a user’s desktop in order for them to play with it. If the person wanted to upload a new version, then they could check out the report, modify it, upload it, and check it back in. This would give the versioning that we’d like in a corporate environment. Users would be able to compare two versions of the reports and the corresponding differences in the JSL or SAS code.
Business Intelligence and AnalyticsSAS Global Forum 2011

12
The third piece of the package is the data or access to the data. In order for a user to give their input into a report, they have to be able to re-run the code that created the report. Obviously, that means they need to have the data that was used. In a desktop environment, the entire data set could be uploaded to the server and then downloaded to the user’s desktop, but that has the obvious complication that the data set could be very large and, unless you’re part of Internet2[23], may not be something you desire. If the data is zipped, then it may be small enough to transport. However, there are other options.
The data may be part of some data mart or warehouse. Rather than uploading the data, we can send a link to the data. If the user has permissions, then they can access the data in the same way the original developer probably did. The other way for large data sets is a client-server environment. The user makes their changes to the code locally and executes it on the server. Finally, if the development environment is on the server, then there is likely not any problem with large data sets.
Analyzing Reports
The last level of the new business analytics paradigm is to consider the reports and their content, the use of the reports, and the behavior of the users all as data. With this data, we can bring the Business Analytics Lifecycle to a new level. Let’s look at some examples.
We discussed above the Web 2.0 idea of tagging content such as blogs and photos. In our Business Analytics Lifecycle, reports would be tagged based on aspects such as their content and purpose. For example, suppose the business manager for Bacon Widgets created a report that forecasted their product’s sales figures based on macroeconomic data, competitor’s prices and non-economic drivers. They might give that report the tags “sales,” “forecast,” “Bacon Widgets,” and maybe one for each competitor and driver. When they uploaded it to the server, the server would link this report with any other report that shared a tag or set of tags. The number of common tags would be a distance between the two reports. The more tags in common the closer those reports would be. Maybe the distance could be weighted so that tags that are used more would have a greater weight. Understanding these distance functions is an open question.
The tags can be displayed with the common tag cloud. The font size of the text string is often related to the frequency of use. Kent Bye of the Echo Chamber Project[24] gives an algorithm for the font distribution of tag clouds in his blog of June 24
th, 2005. Wikipedia references his work and gives a simple formula for the font size of
a particular tag in the cloud[25]. They say that …
“For small frequencies it's sufficient to indicate directly for any number from one to a maximum font size. For larger values, a scaling should be made. In a linear normalization, the weight ti of a descriptor is mapped to a size scale of 1 through f, where tmin and tmax are specifying the range of available weights.
si: display fontsize
fmax: max. fontsize
ti: count
tmin: min. count
tmax: max. count
Since the number of indexed items per descriptor is usually distributed according to a power law, for larger ranges of values, a logarithmic representation makes sense.
Implementations of tag clouds also include text parsing and filtering out unhelpful tags such as common words, numbers, and punctuation.” An implementation of this algorithm for SGPLOT is an open question that would be fairly straightforward, but interesting.
As for determining tags, Yahoo has a web service that does term extraction[26]. Python, a language used to develop websites also has a Content Term Extraction package[27]. On the other hand, SAS Text Miner would be easier to use, provide more capabilities out of the box and allow more security, since it would be deployed within the corporate environment.
What kind of analyses could be done on the content, the use of the reports and the behavior of the users? First, what kind of questions do you want answered? What do we want to know about our business analytics? Some questions that come up are below. Please pardon the grammar.
Business Intelligence and AnalyticsSAS Global Forum 2011

13
What reports are people looking at? How does that differ by department and position?
Which reports are people not looking at? Can we get rid of them?
What types of questions are people answering with their reports?
How many reports do they have to look at to get their questions answered? What data seems to be missing from each of the reports?
How many times do people look at a report during a given time period? Is the data refreshed that often? Is there a problem?
Where are people using advanced statistical analyses and where not? Is there a training opportunity?
Whose reports are widely read? What new ideas or insights does that person have?
What reports are top performing employees looking at? How does that differ from weaker performers? How is that comparison across brands? Similar departments?
Are there disparate groups that have common reports? What kind of cross-pollination can be done by getting them together?
Which reports have results that seem to be leading indicators of business trends? Which reports have usage patterns that seem to be leading indicators?
What kind of meta-analysis can we do on the results presented in the reports to understand the deeper relationships among our organization?
The reader can probably think of other good questions. Certainly the business user will, even upper management may, once they understand the data available to them.
Once we have the questions, we can apply analytical techniques to the data that is now at hand.
CHANGE MANAGEMENT
A key area besides the technological innovation we can implement is the cultural change required in order for these technologies to be fruitful. Many companies have tried to “empower” their business people by giving them access to reporting applications, with both success and failure. One necessary component for success is how intuitively easy it is to use the application. Apple and Google both understand this and their products are very successful. Regardless of the mindset of the user, if the tool is complicated, slow or cryptic, then it will hardly be used.
Another component is the willingness to change the way we do things. Some people find it harder to use new tools than others, even if it helps make their jobs easier. The phenomenon is not generally tied to age. The University of Wisconsin-Milwaukee says that people may resist new behavior patterns…[28]
1. When the reason for the change is unclear. Ambiguity--whether it is about costs, equipment, jobs--can trigger negative reactions among users.
2. When the proposed users have not been consulted about the change, and it is offered to them as an accomplished fact. People like to know what's going on, especially if their jobs may be affected. Informed workers tend to have higher levels of job satisfaction than uninformed workers.
3. When the change threatens to modify established patterns of working relationships between people.
4. When communication about the change--timetables, personnel, monies, etc.--has not been sufficient.
5. When the benefits and rewards for making the change are not seen as adequate for the trouble involved.
6. When the change threatens jobs, power or status in an organization.
All of these can be applicable, but for our discussion, reason #3, #5 and #6 are most important and relevant.
The traditional paradigm for the business reporting lifecycle can be said to be founded on good project management techniques and the waterfall method of software development. We gather requirements for something we want (database, statistical analysis, report, web application). We then build the something that we want and deliver it to the user. Project management books boast about the fact that this technique is what built the pyramids, without questioning whether, 5000 years later, there might be another way of doing things to consider. (Though, to be honest, the new method is not truly original. Brainstorming, haphazard creations, and the like have been around for thousands of years. It’s the tools and technology that make it feasible in our setting.)
Business Intelligence and AnalyticsSAS Global Forum 2011

14
In this traditional paradigm, there can be set roles for organizational members: IT builds the databases; Statisticians perform the analyses; and the BI Competency Center creates the reports. The new Business Analytics Lifecycle will change the established patterns of interaction for all these people. (Reason #3) Production managers, product developers, sales people, MBA’s could be building their own databases, performing their own analyses, and creating their own reports. These additional tasks could easily be met with resistance if there is not greater advantages that come from them. (Reason #5) That also means that IT, Statisticians, and SAS programmers will also have to change what they do. Even more, they may feel that their jobs or power are threatened (Reason #4) and therefore be resistant to change.
If the changes are incremental and provide clear benefits at each stage, like Jeffry Fallon’s below, then they will be much more accepted.
Another reason these changes may be well accepted, is if they are primarily implemented as tools for the people who are already doing the work in order to make them more productive and make their jobs easier. Certainly, we should “eat our own dog food.”
CONCLUSION
In conclusion, there are a lot of usage patterns in the Web 2.0 world and new ones being designed every day. It is no easy feat to know and understand all of them. We first start with the ones we know. We just have to think differently about them and apply them to our Business Analytics Lifecycle. It is not expected, and maybe not even possible or desired, for all of these ideas to be implemented within a particular corporate environment at a given time. And the eventual implementation may not even look like the vision we are applying here. Once developers start thinking through the application of these ideas and start answering the questions they bring up, the sky’s the limit.
REFERENCES
1) Kincaid, Chuck, Revolutionary BI - A Vision for Business Intelligence,
http://corp.comsys.com/docs/analytics/WP_BA_Revolutionary_BI_032709.pdf
2) Ayres, Ian, Super Crunchers, Bantam Dell, http://www.amazon.com/Super-Crunchers-Thinking-
Numbers-Smart/dp/0553805401/ref=cm_lmf_tit_6
3) Davenport,Thomas H., Jeanne G. Harris, Competing on Analytics, Harvard Business Press,
http://www.amazon.com/Competing-Analytics-New-Science-
Winning/dp/1422103323/ref=cm_lmf_tit_1
4) Lewis, Michael, Moneyball, W.W. Norton and Company, http://www.amazon.com/Moneyball-Art-
Winning-Unfair-Game/dp/0393324818/ref=cm_lmf_tit_5
5) Davenport,Thomas H., Jeanne G. Harris, Robert Morison, Analytics at Work, Harvard Business Press,
http://www.amazon.com/Analytics-Work-Smarter-Decisions-
Results/dp/1422177696/ref=pd_bxgy_b_text_b
6) Linked Data - Connect Distributed Data across the Web, http://linkeddata.org/
7) http://dbpedia.org/
8) http://www.gapminder.org/
9) Fallon, Jeffery A., Using AJAX and SAS®
Stored Processes to Create Dynamic Search Suggest
Functionality Similar to Google's®
, Cardinal Health,
http://www.mwsug.org/proceedings/2009/appdev/MWSUG-2009-A05.pdf
10) Simonoff, Jeffrey S., Professor of Statistics and Robert Stansky Research Faculty Fellow, Leonard N.
Stern School of Business, New York University,
http://pages.stern.nyu.edu/~jsimonof/classes/datalink.html
Business Intelligence and AnalyticsSAS Global Forum 2011

15
11) Christian Bizer, Freie Universität Berlin, Germany, Tom Heath, Talis Information Ltd, United
Kingdom, Tim Berners-Lee, Massachusetts Institute of Technology, USA, Linked Data - The Story So
Far, http://tomheath.com/papers/bizer-heath-berners-lee-ijswis-linked-data.pdf
12) Resource Description Framework (RDF), The Semantic Web, http://www.w3.org/RDF/
13) Michael Hausenblas, Linked Data Applications, Digital Enterprise Research Institute,
http://linkeddata.deri.ie/sites/linkeddata.deri.ie/files/lod-app-tr-2009-07-26_0.pdf
14) Yves Raimond, Christopher Sutton and Mark Sandler, Centre for Digital Music, Queen Mary,
University of London, Automatic Interlinking of Music Datasets on the Semantic Web,
http://events.linkeddata.org/ldow2008/papers/18-raimond-sutton-automatic-interlinking.pdf
15) Kevin Kramer, SAS® Enterprise Guide® OLE Automation Using C#, COMSYS,
http://corp.comsys.com/docs/analytics/WP_BA_SAS_EnterpriseGuide_OLE_Auto_Using.pdf
16) MediaWiki, http://en.wikipedia.org/wiki/MediaWiki
17) Sites using MediaWiki/corporate, http://www.mediawiki.org/wiki/Sites_using_MediaWiki/corporate
18) Vanilla Forums, http://vanillaforums.org/
19) TEMPLATE Procedure: Creating Markup Language Tagsets,
http://support.sas.com/documentation/cdl/en/odsug/61723/HTML/default/a002565723.htm
20) Base SAS: ODS MARKUP Resources, http://support.sas.com/rnd/base/ods/odsmarkup/index.html
21) Hamilton, Jack, An Introduction to Creating and Using ODS Tagsets, First Health,
http://www.excursive.com/sas/wuss-tagsets-doc.pdf
22) WikiCreole, http://wikicreole.org/wiki/Home
23) Internet2, http://www.internet2.edu/about/
24) Tag Cloud Font Distribution Algorithm, http://www.echochamberproject.com/node/247
25) Creation of a Tag Cloud, Tag Cloud, http://en.wikipedia.org/wiki/Tag_cloud#Creation_of_a_tag_cloud
26) Yahoo Term Extraction Web Service,
http://developer.yahoo.com/search/content/V1/termExtraction.html
27) Content Term Extraction using POS Tagging, http://pypi.python.org/pypi/topia.termextract/
28) University of Milwaukee, Center for Urban Transportation Studies, Resistance to Change,
http://www4.uwm.edu/cuts/bench/change.htm
ACKNOWLEDGEMENTS
The author would like to thank the COMSYS Analytics Development Team at our SAS Center of Excellence in Kalamazoo, MI, particularly, Mike Vanderlinden, Brian Varney, Jack Fuller, Scott Davis and Cindy Gardner, for their own ideas, their enthusiastic support, and their skillful application of some of these challenging concepts.
RECOMMENDED READING
See the Reference List.
Business Intelligence and AnalyticsSAS Global Forum 2011

16
CONTACT INFORMATION
Your comments and questions are valued and encouraged. Contact the author at:
Chuck Kincaid COMSYS, A Manpower Company 5250 Lovers Lane Portage, MI 49002 Phone: 269-553-5140 Fax: 269-553-5101 E-mail: [email protected] SAS and all other SAS Institute Inc. product or service names are registered trademarks or trademarks of SAS Institute Inc. in the USA and other countries. ® indicates USA registration. Other brand and product names are trademarks of their respective companies.
Business Intelligence and AnalyticsSAS Global Forum 2011