0$&21 %,%% &2817< *(25*,$...i macon‐bibb county finance office 700 poplar street room...
TRANSCRIPT

MACON-BIBB COUNTY, GEORGIA
COMPREHENSIVE ANNUAL FINANCIAL REPORT
FISCAL YEAR ENDED JUNE 30, 2018

MACON-BIBB COUNTY, GEORGIA
COMPREHENSIVE ANNUAL FINANCIAL REPORT
FOR THE FISCAL YEAR ENDED JUNE 30, 2018
PREPARED BY:
Finance Department

MACON-BIBB COUNTY, GEORGIA
COMPREHENSIVE ANNUAL FINANCIAL REPORT FOR THE FISCAL YEAR ENDED JUNE 30, 2018
TABLE OF CONTENTS
INTRODUCTORY SECTION
Page
Letter of Transmittal ........................................................................................................................................... i – v
GFOA Certificate of Achievement ......................................................................................................................... vi
Organizational Chart .............................................................................................................................................. vii
List of Principal Officials ...................................................................................................................................... viii
FINANCIAL SECTION
Independent Auditor's Report .......................................................................................................................... 1 – 4
Management’s Discussion & Analysis .......................................................................................................... 5 – 20
Basic Financial Statements
Government-wide Financial Statements:
Statement of Net Position ........................................................................................................................ 21
Statement of Activities ................................................................................................................. 22 and 23
Fund Financial Statements
Balance Sheet – Governmental Funds ................................................................................................... 24
Reconciliation of the Balance Sheet of Governmental Funds
to the Statement of Net Position ........................................................................................................... 25
Statement of Revenues, Expenditures and Changes in
Fund Balances – Governmental Funds ................................................................................................ 26
Reconciliation of the Statement of Revenues, Expenditures and Changes
in Fund Balances of Governmental Funds to the Statement of Activities ........................................ 27
Statement of Revenues, Expenditures and Changes in
Fund Balances – Budget and Actual – General Fund ................................................................. 28 – 30
Statement of Net Position – Proprietary Funds ......................................................................... 31 and 32
Statement of Revenues, Expenses and Changes in
Fund Net Position – Proprietary Funds ................................................................................................ 33
Statement of Cash Flows – Proprietary Funds .......................................................................... 34 and 35
Statement of Fiduciary Net Position – Fiduciary Funds ....................................................................... 36
Statement of Changes in Fiduciary Net Position – Fiduciary Funds ................................................... 37
Notes to Financial Statements ............................................................................................................... 38 – 110
Required Supplementary Information
Pension Plans ................................................................................................................................ 111 – 116
Other Post-employment Benefit Plan ..................................................................................... 117 and 118
Supplementary Information:
Nonmajor Governmental Funds
Combining Balance Sheet ............................................................................................................ 119 – 122
Combining Statement of Revenues, Expenditures
and Changes in Fund Balances ................................................................................................. 123 – 126

MACON-BIBB COUNTY, GEORGIA
COMPREHENSIVE ANNUAL FINANCIAL REPORT FOR THE FISCAL YEAR ENDED JUNE 30, 2018
TABLE OF CONTENTS
FINANCIAL SECTION (CONTINUED)
Page
Supplementary Information (Continued):
Nonmajor Governmental Funds (Continued)
Schedule of Revenues, Expenditures and Changes in
Fund Balances – Budget and Actual – Emergency 911 Fund .......................................................... 127
Schedule of Revenues, Expenditures and Changes in
Fund Balances – Budget and Actual – Hotel/Motel Tax Fund .......................................................... 128
Schedule of Revenues, Expenditures and Changes in
Fund Balances – Budget and Actual – Grants Fund ......................................................................... 129
Schedule of Revenues, Expenditures and Changes in
Fund Balances – Budget and Actual – Special Street Light District Fund ..................................... 130
Schedule of Revenues, Expenditures and Changes in
Fund Balances – Budget and Actual – Middle Georgia Education
Corridor BID Fund ................................................................................................................................. 131
Schedule of Revenues, Expenditures and Changes in
Fund Balances – Budget and Actual – Law Enforcement Commissary Fund ................................ 132
Schedule of Revenues, Expenditures and Changes in
Fund Balances – Budget and Actual – Law Enforcement Confiscation Fund ............................... 133
Schedule of Revenues, Expenditures and Changes in
Fund Balances – Budget and Actual – Drug Abuse Treatment
and Education Fund.............................................................................................................................. 134
Schedule of Revenues, Expenditures and Changes in
Fund Balances – Budget and Actual – Alternative Dispute Resolution Fund ................................ 135
Schedule of Revenues, Expenditures and Changes in
Fund Balances – Budget and Actual – Crime Victims Assistance Fund ........................................ 136
Schedule of Revenues, Expenditures and Changes in
Fund Balances – Budget and Actual – Juvenile Court Supervision Fund ...................................... 137
Schedule of Revenues, Expenditures and Changes in
Fund Balances – Budget and Actual – Law Library Fund ................................................................ 138
Schedule of Revenues, Expenditures and Changes in
Fund Balances – Budget and Actual – District Attorney RICO Fund .............................................. 139
Schedule of Revenues, Expenditures and Changes in
Fund Balances – Budget and Actual – Sponsored Programs Fund ................................................ 140
Schedule of Revenues, Expenditures and Changes in
Fund Balances – Budget and Actual – Macon-Bibb County Jail Fund ........................................... 141
Schedule of Revenues, Expenditures and Changes in
Fund Balances – Budget and Actual – DFACS MIL Fund ................................................................. 142
Schedule of Revenues, Expenditures and Changes in
Fund Balances – Budget and Actual – ECD CDBG Fund ................................................................. 143
Schedule of Revenues, Expenditures and Changes in
Fund Balances – Budget and Actual – ECD HOME Grant Fund ...................................................... 144

MACON-BIBB COUNTY, GEORGIA
COMPREHENSIVE ANNUAL FINANCIAL REPORT FOR THE FISCAL YEAR ENDED JUNE 30, 2018
TABLE OF CONTENTS
FINANCIAL SECTION (CONTINUED)
Page
Supplementary Information (Continued):
Nonmajor Governmental Funds (Continued)
Schedule of Revenues, Expenditures and Changes in
Fund Balances – Budget and Actual – ECD ESG Fund .................................................................... 145
Schedule of Revenues, Expenditures and Changes in
Fund Balances – Budget and Actual – Downtown Macon BID Fund ............................................... 146
Schedule of Revenues, Expenditures and Changes in
Fund Balances – Budget and Actual – Debt Service Fund ............................................................... 147
Nonmajor Enterprise Funds
Combining Statement of Net Position .................................................................................................. 148
Combining Statement of Revenues, Expenses
and Changes in Fund Net Position ..................................................................................................... 149
Combining Statement of Cash Flows ................................................................................................... 150
Internal Service Funds
Combining Statement of Net Position .................................................................................................. 151
Combining Statement of Revenues, Expenses and
Changes in Fund Net Position ............................................................................................................. 152
Combining Statement of Cash Flows ................................................................................................... 153
Employee Benefit Trust Funds
Combining Statement of Net Position .......................................................................................................... 154
Combining Statement of Changes in Fund Net Position ............................................................................ 155
Agency Funds
Combining Statement of Assets and Liabilities............................................................................. 156 and 157
Combining Statement of Changes in Assets and Liabilities ............................................................ 158 – 160
Nonmajor Component Units
Combining Statement of Net Position ............................................................................................ 161 and 162
Combining Statement of Activities ................................................................................................. 163 and 164
Schedule of Expenditures of Special Purpose Local Option
Sales Tax Proceeds – 2012 Issue (County) ..................................................................................................... 165
Schedule of Expenditures of Special Purpose Local Option
Sales Tax Proceeds – 2012 Issue (City) ........................................................................................................... 166
Schedule of Expenditures of Special Purpose Local Option
Sales Tax Proceeds – 2018 Issue ..................................................................................................................... 167

MACON-BIBB COUNTY, GEORGIA
COMPREHENSIVE ANNUAL FINANCIAL REPORT FOR THE FISCAL YEAR ENDED JUNE 30, 2018
TABLE OF CONTENTS
STATISTICAL SECTION
Page
Fund Information:
Financial Trends
Net Position by Component ................................................................................................................... 168
Changes in Net Position ........................................................................................................... 169 and 170
Governmental Activities Tax Revenues by Source ............................................................................. 171
Fund Balances of Governmental Funds ............................................................................................... 172
Changes in Fund Balances of Governmental Funds ............................................................ 173 and 174
Revenue Capacity
General Government Tax Revenues by Source ................................................................................... 175
Assessed Value and Estimated Actual Value of Taxable Property ................................................... 176
Direct and Overlapping Property Tax Rates ........................................................................................ 177
Principal Property Taxpayers ................................................................................................................ 178
Property Tax Levies and Collections .................................................................................................... 179
Debt Capacity
Ratios of Outstanding Debt by Type ..................................................................................................... 180
Ratios of General Bonded Debt Outstanding ...................................................................................... 181
Direct and Overlapping Governmental Activities Debt ....................................................................... 182
Legal Debt Margin Information .............................................................................................................. 183
Pledged Revenue Coverage ................................................................................................................... 184
Demographic and Economic Information
Demographic and Economic Statistics ................................................................................................ 185
Principal Employers ............................................................................................................................... 186
Full-time Equivalent County Government Employees by Function .................................................. 187
Operating Information
Operating Indicators by Function/Program ......................................................................................... 188
Capital Assets Statistics by Function ................................................................................................... 189
COMPLIANCE SECTION
Independent Auditor’s Report on Internal Control over Financial Reporting and
on Compliance and Other Matters Based on an Audit of Financial Statements
Performed in Accordance with Government Auditing Standards ................................................ 190 and 191
Independent Auditor’s Report on Compliance for Each Major Federal Program
and on Internal Control Over Compliance Required by the Uniform Guidance ............................... 192 – 195
Schedule of Expenditures of Federal Awards .................................................................................. 196 and 197
Notes to the Schedule of Expenditures of Federal Awards ............................................................................ 198
Schedule of Findings and Questioned Costs ................................................................................... 199 and 200
Schedule of Prior Year Findings ....................................................................................................................... 201
Management’s Corrective Action Plan ............................................................................................................. 202

INTRODUCTORY SECTION

i
Macon‐Bibb County Finance Office
700 Poplar Street
Room 307
Macon, Georgia 31201
Christy W. Iuliucci Phone: (478) 751‐7240 Kimberly T. Roberts
Finance Director Fax: (478) 751‐7252 Assistant Finance Director
December 31, 2018
Honorable Members of the Macon-Bibb County Board of Commissioners and Citizens of Macon-Bibb County, Georgia:
State law requires all local governments publish a complete set of financial statements within six months of the close of each fiscal year. This report is to be based on accounting principles generally accepted in the United States of America and audited in accordance with generally accepted auditing standards by a firm of licensed certified public accountants. Pursuant to that requirement, we hereby issue Macon-Bibb County, Georgia’s Comprehensive Annual Financial Report for the fiscal year ended June 30, 2018. This financial report consists of management’s representations concerning the finances of Macon-Bibb County, and it is complete and reliable in all material respects, to the best of my knowledge and belief. All disclosures necessary to enable interested citizens to gain a reasonable understanding of Macon-Bibb County’s financial activities have been included. As management, we assume full responsibility for the completeness and reliability of all information presented. The County’s financial statements have been audited by Mauldin & Jenkins, LLC, a firm of licensed certified public accountants. The goal of the independent audit was to provide reasonable assurance the financial statements in this report are free of material misstatement. The independent audit involved examining, on a test basis, evidence supporting the amounts and disclosures in the financial statements; assessing the accounting principles used and significant estimates made by management; and evaluating the overall financial statement presentation. The independent auditor concluded, based upon the audit, that there was a reasonable basis for rendering an unmodified opinion of Macon-Bibb County’s financial statements for the fiscal year ended June 30, 2018, and that they are fairly presented in conformity with generally accepted accounting principles (GAAP). The independent auditor’s report is presented as the first component of the financial section of this report. The independent audit of the financial statements of the County was part of a broader, federally mandated “Single Audit” designed to meet the special needs of federal grantor agencies. The standards governing Single Audit engagements require the independent auditor to report not only on the fair presentation of the financial statements, but also on the audited government’s internal controls and compliance with legal requirements, with special emphasis on the administration of federal awards. These reports are available in the Single Audit section of the Comprehensive Annual Financial Report for Macon-Bibb County. GAAP requires management provide a Management’s Discussion and Analysis (MD&A), which includes a narrative introduction, overview, and analysis, to accompany the basic financial statements. The County’s MD&A can be found immediately following the report of the independent auditors, and this letter of transmittal should be read in conjunction with it.

ii
Profile of the Government On April 20, 2012, Act 625 was signed into law by the Governor of Georgia to create and incorporate a new consolidated government under the name of Macon-Bibb County, subject to the approval by the voters of both the City of Macon and Bibb County, Georgia. The voters approved creating a new consolidated government on July 30, 2012, and a new Macon-Bibb County government became effective January 1, 2014. Macon-Bibb County is located in the central part of the state, approximately 80 miles south of Atlanta on Interstate 75. As a consolidated entity, the government is considered both a city and county. The government serves a population of approximately 155,000, making it the fourth largest city in the state of Georgia. Macon-Bibb County is empowered to levy a property tax on both real and personal properties located within its boundaries. The Macon-Bibb County Board of Commission is the legislative branch of the government and consists of the Mayor (serving as Chair of the Commission and Chief Executive Officer of the government) and nine (9) Commissioners elected by districts. The Board of Commissioners is responsible for guiding policies by passing ordinances and resolutions, adopting the budget, confirming department heads, and making appointments to agencies and authorities within the County. A County Manager is responsible for the day-to-day operations of the County. The annual budget serves as the foundation for Macon-Bibb County’s financial planning and control. The Commission holds public hearings on the proposed budget and adopts a final budget no later than June 30, which is the close of Macon-Bibb County’s fiscal year. The appropriated budget is prepared by fund (e.g., general), function (e.g., public works) and department (e.g., engineering). All departments and agencies funded by the County are required to submit a request for appropriations to the government’s Finance Officer each year. Factors Affecting Financial Condition The information presented in the financial statements is perhaps best understood when it is considered from the broader perspective of the specific environment within which Macon-Bibb County operates. Local Economy Some of the strengths of the local economy are the location in the state along the interstates, the quality of life, the airports, the continued and growing investment in attracting new industries, the partnerships that focus on economic development, and the diversification of the types of industries located here. A few of the catalytic projects are detailed below. The Second Street Downtown Corridor Revitalization Project – funded with SPLOST dollars and recently awarded a GTIB grant – will serve as a multi-modal transportation spine connecting two interstates and moving people from east to west within the county. A recent FTA grant awarding the first electric buses to MTA will serve as a catalyst to implement a dedicated electric bus route. Additionally, the complete street model will include pedestrian and bicycle traffic and stimulate significant private sector investment within the district by creating a gateway into City Center while connecting neighborhoods, educational institutions, and employment opportunities. Providing additional bicycle and pedestrian access to the only natural greenway trail in Middle Georgia will be a key to sustaining growth within the urban core. Already, the investment made by the local government has led to private investment opening new businesses, revitalizing older buildings, and attracting new development. Downtown Macon is a vibrant hub of activity. The Georgia Sports Hall of Fame, Historic Douglass Theatre, Tubman African American Museum, Hargray Capitol Theater, Grand Opera House, and City Auditorium and Centreplex anchor the downtown entertainment district. The Museum of Arts and Sciences, located centrally in Macon-Bibb County, is Georgia’s largest museum devoted to the arts and sciences. Restaurants and entertainment venues used to be located primarily on Cherry Street, but in recent years have begun opening throughout the entire footprint of Downtown.

iii
Two public airport facilities serve Macon-Bibb County and the Middle Georgia region. The Middle Georgia Regional Airport provides a hub for maintenance, repair, and overhaul services for airlines, while the Downtown Airport serves private users along with a growing aviation training program run by Middle Georgia State University. Passenger service to Washington, D.C. from Middle Georgia Regional Airport began in August 2017, and in October 2018, enplanements passed the FAA’s milestone of 10,000 for the year. Also that month, passenger service to Tampa was announced and began December 19, 2018. Macon-Bibb County continues to support expansion and growth of the airport and extension of the primary runway, which would be a major boost to becoming a transportation and logistics hub for the state and region. Macon-Bibb County continues to provide tax incentives that would attract large employers to the area in an effort to provide jobs for its residents and improve the local economy. The 2012 SPLOST included $5.9 million in funds for Economic Development that has assisted in bringing the Tractor Supply Company Distribution Center to Macon-Bibb County, and has the potential to bring in other companies and jobs to Middle Georgia. In November 2016, the voters of Macon-Bibb approved a continuation of the SPLOST, and it includes $29 million for economic development.
Macon-Bibb County, the Macon-Bibb County Industrial Authority, the Macon Economic Development Commission, and the Greater Macon Chamber of Commerce work together as a team to promote and encourage economic development. The collaborative efforts of this team have made it possible to successfully recruit and/or retain more than 59 new or expanding industries with a capital investment of $811,587,690. An intergovernmental agreement provided for a $25 million-dollar commitment to the Industrial Authority annualized over ten years to continue to develop properties for economic development opportunities. This past year, existing industries like Nichiha Corporation and Graphic Packaging International announced expansions, and several new industries announced new locations in Macon-Bibb, including an Amazon Fulfillment Center, Stevens Aerospace and Defense Systems, Embraer, and more.
In addition to the strong commitment of local companies to stay in Macon-Bibb, efforts have drawn new businesses to the area. Love’s Travel Center opened off of Sardis Church Road providing more than 50 job opportunities. The largest announcement of the year brought the Governor to town to help announce Irving Consumer Products investment of $400 million dollars and the creation of more than 200 jobs.
Major employers within Macon-Bibb County include GEICO, Navicent Health Medical Center, the Bibb County School District, Coliseum Health System, Mercer University, Macon-Bibb County Consolidated Government, and YKK, Inc. Macon-Bibb County has more than 500 practicing physicians using three full service and two psychiatric hospitals, totaling more than 1,150 beds. This includes Navicent Health Medical Center, which is a regional care facility serving a 50 county area.
The aerospace, manufacturing, lodging, and food service industries also provide a large number of well-paid jobs. Robins Air Force Base (RAFB), located in adjacent Houston County, continues to favorably impact the Macon-Bibb County economy. RAFB has an annual federal payroll of $1.3 billion and a retiree payroll of $692 million. Using the standard Air Force formula, the annual value of indirect jobs created was $1.41 billion for a total economic impact of $2.75 billion in Georgia for fiscal 2015. Long-Term Financial Planning The voters of Macon-Bibb County have passed two major financial boosts for the community. First, they passed a Special Purpose Local Option Sales Tax in 2011, which began in 2012 to provide funding that would start major capital projects and pay off debt that would otherwise be paid from General Fund revenues. In 2016, the voters approved continuing that SPLOST to continue the penny collection for capital projects. In order to continue the forward momentum, Commissioners approved $35 million in bond funding to continue project progress prior to the penny collection, which began in April 2018. Included in the 2018 SPLOST are: more recreation center improvements; millions of dollars for economic development; an airport runway extension; funding to attack blight in our neighborhoods; public safety equipment; road and bridge construction improvements and repairs; a courthouse addition; storm water improvements; closure of the landfill; and more.

iv
The FY18 budget was impacted by increases in health care expenses absorbed by Macon-Bibb County. Through the establishment of a health care committee, the health care plan design was amended and rebid to achieve savings. The expectation of the FY20 budget will include the anticipated savings. Additionally, Mayor and Commission have funded actuarial studies to determine savings of creating a new retirement plan for employees hired after July 1, 2019. The plan proposal is to have a matching contribution from employee and employer to be housed in a 457 plan. This will mean only current employees and current retirees will continue to have access to the current defined benefit pension plans. Relevant Financial Policies Macon-Bibb County has established a comprehensive internal control framework that is designed to both protect the government’s assets from loss, theft, or misuse and to compile sufficient reliable information for the preparation of financial statements in conformity with GAAP. Because the cost of internal controls should not outweigh their benefits, the comprehensive framework of internal controls has been designed to provide reasonable, rather than absolute, assurance of the safeguarding of assets and the proper recording of financial transactions. Budgetary control is maintained at the department level. No increase in the overall budget can be made without the approval of the Board of Commissioners and amendment to the budget. Unencumbered appropriations in the annual operating budget lapse at fiscal year-end. Major Initiatives The focus of the Macon-Bibb County Forward Together Strategic Plan is to strengthen our core and grow our community within five focus areas: Economic and Community Development, Safe Neighborhoods and Safe Communities, Effective and Efficient Government, Infrastructure Improvements, and Quality of Life. For the past several years, $14 million has been used to directly attack blight in neighborhoods through a variety of strategies, including abandoned house demolition, creating green space and recreation areas, adding lighting, building sidewalks, and more. Another $10 million has been allocated in the 2016 SPLOST to continue this effort, and additional funds were allocated in the General Fund budget for FY19 to help with house demolitions. This initiative is part of the Economic and Community Development focus area. Macon-Bibb County’s goal is to create a walkable, bikeable community by focusing on adding sidewalks, bike lanes, and recreational spaces and improving the downtown urban core. One exciting initiative of the Safe Neighborhood and Safe Community focus area is the pedestrian-friendly Second Street Corridor, which will connect East Macon to the business and residential areas of Downtown to Mercer University, and eventually all the way to Middle Georgia State College. The Solid Waste Management Plan is part of the Infrastructure Improvement focus area. In the next five to seven years, Macon-Bibb County must close the landfill, which necessitates a Solid Waste Management Plan to identify how we will divert waste out of the landfill and what we will do with the waste once the landfill is closed. The goal is to build a recycling center. Three components of the plan include: expanding our recycling program, building a transfer station to other landfills, and educating the public on the importance of recycling. Macon-Bibb County’s Quality of Life focus area incorporates arts and cultural events, tourism improvements, and a community-wide system of passive and active recreation. A significant initiative in this area has been upgrading and improving the County’s recreation facilities. With SPLOST funding of approximately $80 million, Macon-Bibb County is addressing the upgrades needed as well as opening a new recreation center in the southern portion of the County.

v
Awards and Acknowledgements The Government Finance Officers Association (GFOA) has awarded Macon-Bibb County a Certificate of Achievement for Excellence in Financial Reporting for its Comprehensive Annual Financial Report (CAFR) for Fiscal Year 2017 (FY17). According to GFOA, the Certificate of Achievement is the highest form of recognition in the area of governmental accounting and financial reporting, and its attainment represents a significant accomplishment by a government and its management. “I want to congratulate our finance team and thank our external auditors for the work they do every year to ensure we are holding ourselves to national best practices, and that we remain accountable to the public by publishing these reports,” says Macon-Bibb County Mayor Robert Reichert. Macon-Bibb County’s Comprehensive Annual Financial Report was judged by an impartial panel to meet the high standards of the program, which includes demonstrating a constructive “spirit of full disclosure” to clearly communicate its financial story. It was developed by the Macon-Bibb County Finance Department working with a team from Mauldin & Jenkins, Certified Public Accountants. In January, Mayor Reichert and the audit team reviewed it with the Commission and let them know they had received an Unmodified (Clean) Opinion for the fourth consecutive year. The Comprehensive Annual Financial Report provides information regarding how funds are being managed, and is part of the Commission’s Effective Government & Governance Focus Area of its Forward Together Strategic Plan. The preparation of this report would not have been possible without the efficient and dedicated services of the entire staff of the Finance Department, Budget and Strategic Planning, and the Office of the Mayor. We would like to express our appreciation to all members of the departments who assisted and contributed to the preparation of this report. Credit must also be given to the Board of Commissioners for maintaining the highest standards of professionalism in the oversight of Macon-Bibb County’s finances. Respectfully submitted,
Christy W. Iuliucci, CPA Finance Director

vi
Government Finance Officers Association
Certificate of Achievement for Excellence
in Financial Reporting
Presented to
Macon-Bibb County
Georgia
For its Comprehensive Annual Financial Report
for the Fiscal Year Ended
June 30, 2017
Executive Director/CEO

vii
Summary
County Attorney
I l I I ___ ,,
Special Assistant to County Attorney
E-911
Animal Welfare
Municipal Court
Vehicle Maintenance
Citizens of Macon-Bibb County
----J_ Mayor County Commissioners
- -,
County Manager
Internal Auditor
-----------1-~~~~~~~~~~~~-Clerk of
Commission
Assistant County Manager
Recreation
Business Development Services
Small Business Affairs
Engineering
Solid Waste
Public Works
Beautification
Facilities Management
Assistant to the County Manager -Public Affairs
Customer Service
Communication
Multimedia
UGA Extension Services
Airport
Assistant to the County Manager· Budget and Strategic Planning
: ,
Non-elected appointed offices
Board of Tax Assessors
..
Planning and Zoning
Board of Elections
Fire Department
Human Reources
Information Technology
••• ··•11 . . . . . . . • : · . . - . ••... . . -·:-· , .. . . -- . • : ·
Public Defender
(appointed)
State Court Probation
Juvenile Court (2)
Indigent Defense

MACON-BIBB COUNTY, GEORGIA
LIST OF PRINCIPAL OFFICIALS JUNE 30, 2018
Titles Names Mayor Robert A.B. ReichertMayor Pro-Tem Bert Bivins III Commissioner Valerie WynnCommissioner Joe AllenCommissioner Mallory JonesCommissioner Elaine LucasCommissioner Larry SchlesingerCommissioner Warren “Scotty” Shepherd Commissioner Al Tillman Commissioner Virgil Watkins
Constitutional Officers: Probate Court Judge Sarah HarrisSheriff David DavisSuperior Court Clerk Erica Woodford Tax Commissioner Wade McCord
Elected Officials: Civil and Magistrate Judge William P. Randall Chief Superior Court Judge Edgar Ennis, Jr. Coroner Leon JonesDistrict Attorney David CookePublic Defender Rick WallerState Court Judge Jeffrey HansonState Court Judge Jeffery O’Neal MonroeState Court Solicitor General Rebecca GristSuperior Court Judge Verda ColvinSuperior Court Judge David Mincey IIISuperior Court Judge Philip RaymondSuperior Court Judge Howard Simms
Administrative: County Manager Dr. Keith MoffettAssistant to County Manager – Budget/Strategic Planning Julie Moore Assistant to County Manager – Public Affairs Chris FlooreDirector of Human Resources Ben HubbardDirector of Finance Christy W. Iuliucci County Attorney Judd Drake Fire Chief Marvin RigginsInterim Director of E-911 Shandel GrahamEmergency Management Director Spencer Hawkins Interim Director of Business Development Ricky Fuller Director of Facilities Management Robert RyalsDirector of Recreation Robert WalkerDirector of Vehicle Maintenance Sam HughleyEconomic & Community Development Manager Wanzina Jackson Director of Parks and Beautification Sam Kitchens Chief Information Officer Brett Lavender Municipal Court Clerk LaTonya SlaughterDirector of Public Works Marvin LandDirector of Engineering Dave FortsonDirector of Solid Waste Kevin BarkleyDirector of Animal Welfare Tracey BelewDirector of Small Business Affairs VacantMunicipal Court Judge Robert FaulknerClerk of the Commission Janice RossAirport Manager Erick D’LeonInternal Auditor Stephanie Jones Elections Supervisor Janetta Watson
viii

FINANCIAL SECTION

INDEPENDENT AUDITOR’S REPORT

300 MULBERRY STREET, SUITE 300 • POST OFFICE BOX 1877 • MACON, GEORGIA 31202-1877 • 478-464-8000 • FAX 478-464-8051 • www.mjcpa.com MEMBERS OF THE AMERICAN INSTITUTE OF CERTIFIED PUBLIC ACCOUNTANTS
INDEPENDENT AUDITOR'S REPORT
To the Board of Commissioners of
Macon-Bibb County, Georgia
Macon, Georgia
Report on the Financial Statements
We have audited the accompanying financial statements of the governmental activities, the business-type activities, the aggregate discretely presented component units, each major fund, and the aggregate remaining fund information of Macon-Bibb County, Georgia (the “County”) as of and for the year ended June 30, 2018, and the related notes to the financial statements, which collectively comprise Macon-Bibb County, Georgia’s basic financial statements as listed in the table of contents.
Management’s Responsibility for the Financial Statements
Management is responsible for the preparation and fair presentation of these financial statements in accordance with accounting principles generally accepted in the United States of America; this includes the design, implementation, and maintenance of internal control relevant to the preparation and fair presentation of financial statements that are free from material misstatement, whether due to fraud or error.
Auditor’s Responsibility
Our responsibility is to express opinions on these financial statements based on our audit. We did not audit the financial statements of the Macon-Bibb County Industrial Authority, the Middle Georgia Regional Library, the Macon-Bibb County Board of Health, the Macon-Bibb County Urban Development Authority, the Macon-Bibb County Convention and Visitors Bureau, the Macon-Bibb County Planning and Zoning Commission, or the Development Authority of Bibb County, which represent 83.1% of the assets, 80.2% of net position, and 75.1% of revenues of Macon-Bibb County, Georgia’s component units as of and for the year ended June 30, 2018. Those statements were audited by other auditors whose report has been furnished to us, and our opinion, insofar as it relates to the amounts included for the Macon-Bibb County Industrial Authority, the Middle Georgia Regional Library, the Macon-Bibb County Board of Health, the Macon-Bibb County Urban Development Authority, the Macon-Bibb County Convention and Visitors Bureau, the Macon-Bibb County Planning and Zoning Commission, and the Development Authority of Bibb County is based solely on the report of the other auditors. We conducted our audit in accordance with auditing standards generally accepted in the United States of America and the standards applicable to financial audits contained in Government Auditing Standards, issued by the Comptroller General of the United States. Those standards require that we plan and perform the audit to obtain reasonable assurance about whether the financial statements are free from material misstatement.

2
An audit involves performing procedures to obtain audit evidence about the amounts and disclosures in the financial statements. The procedures selected depend on the auditor’s judgment, including the assessment of the risks of material misstatement of the financial statements, whether due to fraud or error. In making those risk assessments, the auditor considers internal control relevant to the entity’s preparation and fair presentation of the financial statements in order to design audit procedures that are appropriate in the circumstances, but not for the purpose of expressing an opinion on the effectiveness of the entity’s internal control. Accordingly, we express no such opinion. An audit also includes evaluating the appropriateness of accounting policies used and the reasonableness of significant accounting estimates made by management, as well as evaluating the overall presentation of the financial statements.
We believe that the audit evidence we have obtained is sufficient and appropriate to provide a basis for our audit opinions.
Opinions
In our opinion, based on our report and the reports of other auditors, the financial statements referred to above present fairly, in all material respects, the respective financial position of the governmental activities, the business-type activities, the aggregate discretely presented component units, each major fund, and the aggregate remaining fund information of Macon-Bibb County, Georgia, as of June 30, 2018, and the respective changes in financial position, and, where applicable, cash flows thereof and the budgetary comparison information for the General Fund for the year then ended in accordance with accounting principles generally accepted in the United States of America.
Emphasis of Matter
As described in Note 16, Macon-Bibb County, Georgia implemented Governmental Accounting Standards Board Statement No. 75, Accounting and Financial Reporting for Post-employment Benefits Other Than Pensions,
effective July 1, 2017. Our opinions are not modified with respect to this matter.

3
Other Matters
Required Supplementary Information
Accounting principles generally accepted in the United States of America require that the Management’s Discussion and Analysis on pages 5 through 20 and the schedules of changes in the County’s net pension liabilities and related ratios for the respective pension plans, the schedules of County contributions for the respective pension plans, the schedules of pension investment returns for the respective pension plans, the schedule of changes in the County’s net other post-employment benefit liability and related ratios, the schedule of County contributions for the other post-employment benefit plan, and the schedule of investment returns for the other post-employment benefit plan on pages 111 through 118 be presented to supplement the basic financial statements. Such information, although not a part of the basic financial statements, is required by the Governmental Accounting Standards Board who considers it to be an essential part of financial reporting for placing the basic financial statements in an appropriate operational, economic, or historical context. We have applied certain limited procedures to the required supplementary information in accordance with auditing standards generally accepted in the United States of America, which consisted of inquiries of management about the methods of preparing the information and comparing the information for consistency with management’s responses to our inquiries, the basic financial statements, and other knowledge we obtained during our audit of the basic financial statements. We do not express an opinion or provide any assurance on the information because the limited procedures do not provide us with sufficient evidence to express an opinion or provide any assurance.
Other Information
Our audit was conducted for the purpose of forming opinions on the financial statements that collectively comprise Macon-Bibb County, Georgia’s basic financial statements. The introductory section, combining and individual nonmajor fund financial statements and schedules, and statistical section are presented for purposes of additional analysis and are not a required part of the basic financial statements. The accompanying schedules of expenditures of special purpose local option sales tax proceeds are presented for purposes of additional analysis as required by the Official Code of Georgia 48-8-121, and are not a required part of the basic financial statements. The accompanying schedule of expenditures of federal awards is presented for purposes of additional analysis as required by Title 2 U.S. Code of Federal Regulations (CFR) Part 200, Uniform Administrative Requirements, Cost
Principles, and Audit Requirements for Federal Awards, and is also not a required part of the basic financial statements of the County.

4
The combining and individual nonmajor fund financial statements and schedules, the schedules of expenditures of special purpose local option sales tax proceeds, and the schedule of expenditures of federal awards are the responsibility of management and were derived from and relate directly to the underlying accounting and other records used to prepare the basic financial statements. Such information has been subjected to the auditing procedures applied in the audit of the basic financial statements and certain additional procedures, including comparing and reconciling such information directly to the underlying accounting and other records used to prepare the basic financial statements or to the basic financial statements themselves, and other additional procedures in accordance with auditing standards generally accepted in the United States of America. In our opinion, the combining and individual nonmajor fund financial statements and schedules, the schedules of expenditures of special purpose local option sales tax proceeds, and the schedule of expenditures of federal awards are fairly stated, in all material respects, in relation to the basic financial statements as a whole.
The introductory and statistical sections have not been subjected to the auditing procedures applied in the audit of the basic financial statements and, accordingly, we do not express an opinion or provide any assurance on them.
Other Reporting Required by Government Auditing Standards
In accordance with Government Auditing Standards, we have also issued our report dated December 31, 2018, on our consideration of Macon-Bibb County, Georgia’s internal control over financial reporting and on our tests of its compliance with certain provisions of laws, regulations, contracts and grant agreements, and other matters. The purpose of that report is to describe the scope of our testing of internal control over financial reporting and compliance and the results of that testing, and not to provide an opinion on internal control over financial reporting or on compliance. That report is an integral part of an audit performed in accordance with Government Auditing
Standards in considering Macon-Bibb County, Georgia’s internal control over financial reporting and compliance.
Macon, Georgia December 31, 2018

MACON-BIBB COUNTY, GEORGIA
MANAGEMENT’S DISCUSSION AND ANALYSIS
As management of Macon-Bibb County, Georgia, we offer readers of the County’s financial statements this narrative overview and analysis of the financial activities of the County for the fiscal year ended June 30, 2018. We encourage readers to consider the information presented here in conjunction with additional information that we have furnished in our letter of transmittal, which can be found on pages i - v of this report. Financial Highlights
The assets and deferred outflows of the County exceeded its liabilities and deferred inflows as of June 30, 2018, by $62,206,282 (net position).
The government’s total net position decreased $77 million, consisting of a current fiscal year increase of $2.4 million and a prior period adjustment of $79 million for recognition of Other Post-Employment Benefit liabilities required by Governmental Accounting Standards Board (GASB) Statement 75.
As of June 30, 2018, the County’s governmental funds reported combined ending fund balances of $84,133,553, a decrease of $6,971,052 in comparison with the prior year. Approximately 90% of this total amount, $76,257,948 was restricted.
For the fiscal year ended June 30, 2018, fund balance for the General Fund decreased $2.3 million to $5,460,064. Unassigned fund balance decreased $509,279 to $0. Assigned for working capital decreased $1.4 million to $4.2 million. Assigned fund balance totaled $5.4 million or 4% of General Fund expenditures.
During the FY 2018 fiscal year, Macon-Bibb County’s total long-term debt increased by $57 million. Principal retirements in governmental activities included general obligation sales tax bonds $7.6 million, general obligation tax allocation bonds $3.3 million, revenue bonds $1.2 million, capital leases $319,923, and notes payable $143,297. Principal retirements in business-type activities included revenue bonds $645,000, and capital leases $101,937. Proceeds from new governmental activities debt included general obligation bonds $3,174,278, revenue bonds $1,150,000 and capital lease $470,167. Other changes in long-term debt included a decrease in Group Insurance Fund claims payable of $523,678; an increase in Workers Compensation Fund claims payable of $2,136,000; an increase in the liability for compensated absences of $382,743; an increase in the Post-employment benefit obligation $78,152,322; a decrease in the Pension benefit obligation $17,067,712; an increase in the landfill post-closure liability $3,510,000 and a decrease due to net amortization of bond premiums and discounts totaling $1.2 million.
Overview of the Financial Statements
This Management Discussion and Analysis is intended to serve as an introduction to the County’s basic financial statements. The basic financial statements are comprised of three components: 1) government-wide financial statements, 2) fund financial statements, and 3) notes to the financial statements. This report also contains other supplementary information in addition to the basic financial statements.
The statements within the first component are government-wide financial statements that provide both long-term and short-term information about the County’s overall financial status in a manner similar to a private-sector business.
The statements within the second component are fund financial statements that focus on individual parts of the County government, reporting the County’s operations in more detail than the government-wide financial statements. The notes to the financial statements are the third component of the basic financial statements. The notes provide descriptions of policies underlying the amounts displayed in the financial statements, additional detail or explanations concerning amounts displayed in the financial statements, and additional information on items that do not meet the criteria for recognition and so are not reflected in the financial statements.

MANAGEMENT’S DISCUSSION AND ANALYSIS
6
Government-wide Financial Statements. The government-wide financial statements are designed to provide readers with a broad overview of the County’s finances. These two statements are: 1) statement of net position, and 2) statement of activities.
The statement of net position presents information on all of the County’s assets and liabilities, with the difference between the two reported as net position. Over time, increases or decreases in net position may serve as a useful indicator of whether the financial position of the County is improving or deteriorating. The statement of activities presents information showing how the government’s net position changed during FY 2018. All changes in net position are reported as soon as the underlying event giving rise to the change occurs, regardless of the timing of related cash flows. Thus, revenues and expenses are reported in this statement for some items that will only result in cash flows in future fiscal periods (e.g., uncollected taxes and earned but unused vacation leave). Both government-wide financial statements distinguish functions of the County that are principally supported by taxes and intergovernmental revenues (governmental activities) from functions that are intended to recover all or a significant portion of their costs through user fees and charges (business-type activities). The governmental activities of the County include general government, judicial, public safety, public works, housing and development, health and welfare, and culture and recreation. The business-type activities are Lake Tobesofkee Recreation, Solid Waste, Airport, Coliseum, Mulberry Street Parking Garage, and Bowden Golf Course.
The government-wide financial statements include not only Macon-Bibb County Government (known as the primary government), but also the component units of Macon-Bibb County. Financial information for the component units is reported separately from the financial information presented for the primary government itself. Data for the component units is combined into a single aggregated presentation. Additional information for all component units can be found in the combining statements on pages 161 - 164 of this report. The government-wide financial statements can be found on pages 21 - 23 of this report.
Fund Financial Statements. The remaining statements are fund financial statements that focus on individual parts of the County government, reporting the County’s operations in more detail than the government-wide statements. A fund is a grouping of related accounts that is used to maintain control over resources that have been segregated for specific activities or objectives. Macon-Bibb County, like other state and local governments, uses fund accounting to ensure and demonstrate compliance with finance-related legal requirements. All of the funds of the County can be divided into three (3) categories: 1) governmental funds, 2) proprietary funds, and 3) fiduciary funds. Governmental Funds. Governmental funds are used to account for essentially the same functions reported as governmental activities in the government-wide financial statements. However, unlike the government-wide financial statements, governmental fund financial statements focus on near-term inflows and outflows of spendable resources, as well as balances of spendable resources available at the end of the fiscal year. Such information may be useful in evaluating a government’s near-term financing requirements.
Because the focus of governmental funds is narrower than that of the government-wide financial statements, it is useful to compare the information presented for governmental funds with similar information presented for governmental activities in the government-wide financial statements. By doing so, readers may better understand the long-term impact of the government’s near-term financing decisions. Both the governmental fund balance sheet and the governmental fund statement of revenues, expenditures and changes in fund balance provide a reconciliation to facilitate this comparison between governmental funds and governmental activities.

MANAGEMENT’S DISCUSSION AND ANALYSIS
7
Macon-Bibb County maintains thirty-two (32) individual governmental funds. Information is presented separately in the governmental fund balance sheet and in the governmental fund statement of revenues, expenditures and changes in fund balance for the General Fund, SPLOST 2012 City, SPLOST 2012 County, and SPLOST 2018 Project Fund, which are considered major funds. Data from the other twenty-eight (28) governmental funds is combined into a single, aggregated presentation. Individual fund data for each of these non-major governmental funds is provided in the form of combining fund statements elsewhere in this report. The County adopts an annual appropriated budget for its general fund, special revenue funds and debt service fund. A budgetary comparison statement has been provided for each fund to demonstrate compliance. The basic governmental fund financial statements can be found on pages 24 - 30 of this report. Proprietary Funds. The County maintains two (2) different types of proprietary funds. Enterprise funds are used to report the same functions presented as business-type activities in the government-wide financial statements. The County uses enterprise funds to account for Lake Tobesofkee Recreation, Sanitation, Airport, Coliseum, Mulberry Street Parking Garage and Bowden Golf Course. Internal service funds are an accounting device used to accumulate and allocate costs internally among the County’s various functions. Internal service funds are used to account for the County’s Group Insurance and Vehicle Maintenance Funds. The costs of these services have been allocated between the governmental activities and the business-type activities in the government-wide financial statements. Proprietary fund financial statements provide the same type of information as the government-wide financial statements, only in more detail. The proprietary fund financial statements provide separate information for the Solid Waste Fund and Airport Fund. Data from the other enterprise funds is combined into a single, aggregated presentation. The two (2) internal service funds are combined into a single, aggregated column in the proprietary fund financial statements. Individual fund data for the internal service funds is provided in the form of combining fund statements elsewhere in this report. The basic proprietary fund financial statements can be found on pages 31 - 35 of this report. Fiduciary Funds. Fiduciary fund statements provide information about the financial relationships in which the County acts solely as a trustee or agent for resources held for the benefit of parties outside the government, such as the pension plan and other post-employment benefit plan for Macon-Bibb County employees. Fiduciary funds are not reflected in the government-wide financial statement because the resources of those funds are not available to support the County’s own programs. The accounting used for fiduciary funds is much like that used for proprietary funds. Individual fund data for the fiduciary funds is provided in the form of both combining statements and individual fund statements elsewhere in this report. The basic fiduciary fund financial statements can be found on pages 36 - 37 of this report. Notes to the Financial Statements. The notes to the financial statements provide additional information that is essential to a full understanding of the data provided in the government-wide and fund financial statements. The notes to the financial statements can be found on pages 38 - 110 of this report.

MANAGEMENT’S DISCUSSION AND ANALYSIS
8
Government-wide Financial Analysis
Summary of Net Position
Governmental Activities Business-Type Activities Total 2018 2017 2018 2017 2018 2017 Current and Other Assets $112,758,720 $116,505,121 $22,193,651 $15,748,574
$134,952,371
$132,253,695
Capital Assets 318,200,446 312,962,450 36,840,853 36,561,474 355,041,299 349,523,924 Total Assets 430,959,166 429,467,571 59,034,504 52,310,048 489,993,670 481,777,619 Deferred Outflows 38,597,712 46,130,952 1,092,485 1,986,109 39,690,197 48,117,061 Long-Term Liabilities 381,409,330 325,824,477
23,446,430
22,112,704 404,855,760 347,937,181
Other Liabilities 16,190,438 14,368,958 7,844,307 2,611,102 25,034,745 16,980,060 Total Liabilities 397,599,768 340,193,435 31,290,737 24,723,806 428,890,504 364,917,241 Deferred Inflows 38,188,014 25,411,901 399,066 428,927 38,587,080 25,840,828 Net Position: Net investment in capital assets 255,168,651 254,832,779 36,378,755 35,354,716 291,547,406 290,187,495 Restricted 76,257,948 82,056,773 - - 76,257,948 82,056,773 Unrestricted (297,657,503) (226,896,365) (7,941,569) (6,211,292) (305,599,072) (233,107,657) Total Net Position $33,769,096 $109,993,187 $28,437,186 $29,143,424 $62,206,282 $139,136,611
Net position may serve over time as a useful indicator of a government’s financial position. Macon-Bibb County’s, assets and deferred outflows exceeded liabilities and deferred inflows by $62,206,282 at the close of FY 2018. By far the largest portion of the County’s net position reflects its investment in capital assets (e.g., infrastructure, land, buildings, machinery, equipment and vehicles); less any related debt used to acquire those assets that is still outstanding. These capital assets are used to provide services to citizens; consequently, these assets are not available for future spending. Although Macon-Bibb County’s investment in capital assets is reported net of related debt, it should be noted that the resources needed to repay this debt must be provided from other sources, since the capital assets themselves cannot be used to liquidate these liabilities.

MANAGEMENT’S DISCUSSION AND ANALYSIS
9
There was a decrease of $5.8 million in restricted net position reported for the County’s governmental activities.
The total restricted for debt service increased $3,961,984. o The Special Purpose Local Option Sales Tax 2018 Fund had an increase in restricted for debt
service of $1,971,573. SPLOST collections began in April 2018. The SPLOST resolution requires the prefunding of an annual debt service reserve for the calendar year’s debt service requirements.
o The General Debt Service Fund had an increase in restricted for debt service totaling $1,792,365 primarily due to activity of the GMA Leasepool program. The Fund transferred $72,955 to reimburse capital outlay purchases in the Capital Improvement Fund. Repayments to the pool totaled $1,805,846.
o The Special Purpose Local Option Sales Tax 2012 County and City Project Funds had an increase in restricted for debt service of $198,046. The SPLOST resolution requires the prefunding of an annual debt service reserve for the calendar year’s debt service requirements.
The total restricted for grant programs decreased $293,115. o The Grants Fund restricted fund balance decreased $293,121 in FY 2018, with ending fund balance
of $1.8 million. The balance primarily consists of state LMIG funds received in FY 2018 but not yet expended. LMIG funds received in FY 2018 totaled $2,010,263.
The total restricted for capital projects decreased $10,690,709. o The Special Purpose Local Option Sales Tax 2018 Project Fund had a decrease in restricted for
capital projects of $11,243,477. The County issued general obligation sales tax bonds of $35 million in FY 2017. Sales tax collections began in April 2018. Project expenditures totaled $13 million, and debt service expenditures totaled $3 million in FY 2018.
o The Special Purpose Local Option Sales Tax 2012 Project Funds had a combined increase in restricted for capital projects of $933,402 SPLOST County Fund had a net decrease of $854,298, and the City Fund had a net increase of $1,787,700. Expenditures totaled $16 million in the County Fund and $6 million in the City Fund. Sales tax collections for the 2012 SPLOST Funds ended March 2018.
o The Capital Improvements Fund had an increase in restricted for capital outlay of $3.5 million. The County sold property for $3.8 million in FY 2018, with proceeds restricted for improvements to Henderson Stadium.
o The 2013 MBCUDA Fund had a decrease in restricted for capital outlay of $425,191, with remaining funds available on these bonds totaling $621,474.
o The 2015 MBCUDA Project Fund balance restricted for capital outlay decreased $3.7 million. FY 2018 expenditures totaled $3.9 million leaving $3.6 million available for the projects provided in the bond issue.
The total restricted for judicial programs increased $1,235,614. o The DA RICO Forfeiture Fund had an increase in fund balance of $1,127,020. Current year
revenues totaled $2.4 million with current year expenditures of $1.3 million.
Other restricted net position decreased $12,581.

MANAGEMENT’S DISCUSSION AND ANALYSIS
10
2018 2017 2018 2017 2018 2017
Revenues:Program Revenues:
Charges for services 21,710,623$ 20,447,747$ 15,921,544$ 15,327,245$ 37,632,167$ 35,774,992$ Operating grants and contributions 13,254,664 8,248,564 2,175,791 165,534 15,430,455 8,414,098 Capital grants and contributions 964,893 2,792,461 - - 964,893 2,792,461
General Revenues: Property Taxes 77,683,519 65,468,270 - - 77,683,519 65,468,270 Other taxes 93,845,657 89,092,202 - - 93,845,657 89,092,202
Interest 1,267,461 1,221,953 27,811 6,666 1,295,272 1,228,619 Other 72,202 128,424 - - 72,202 128,424
Total revenues 208,799,019 187,399,621 18,125,146 15,499,445 226,924,165 202,899,066
Expenses:General government 28,854,100 35,261,988 - - 28,854,100 35,261,988 Judicial 20,254,786 22,274,374 - - 20,254,786 22,274,374 Public safety 90,520,341 109,749,053 - - 90,520,341 109,749,053 Public works 19,088,846 17,605,752 - - 19,088,846 17,605,752 Housing and development 13,790,513 18,254,975 - - 13,790,513 18,254,975 Health and Welfare 9,311,368 9,940,194 - - 9,311,368 9,940,194 Culture and recreation 14,767,434 13,033,320 - - 14,767,434 13,033,320 Interest and fees on long-term debt 4,386,818 4,825,637 - - 4,386,818 4,825,637 Recreation facility - - 1,536,576 1,593,442 1,536,576 1,593,442 Solid waste - - 17,434,748 11,249,729 17,434,748 11,249,729 Airport - - 1,997,072 1,884,643 1,997,072 1,884,643 Coliseum - - 1,708,007 1,830,691 1,708,007 1,830,691 Mulberry parking garage - - 156,163 179,604 156,163 179,604 Bowden golf course - - 727,643 720,558 727,643 720,558
Total expenses 200,974,206 230,945,293 23,560,209 17,458,667 224,534,415 248,403,960 Decrease in net position before Special Item and Transfers 7,824,813 (43,545,672) (5,435,063) (1,959,222) 2,389,750 (45,504,894) Transfers (4,728,825) (4,156,769) 4,728,825 4,156,769 - - Increase (Decrease) in net position 3,095,988 (47,702,441) (706,238) 2,197,547 2,389,750 (45,504,894) Net Position, Beginning, Restated 30,673,108 157,695,628 29,143,424 26,945,877 59,816,532 184,641,505 Net Position, Ending 33,769,096$ 109,993,187$ 28,437,186$ 29,143,424$ 62,206,282$ 139,136,611$
Activities Activities
Summary of Changes in Net Position
Governmental Business-type
Total
Governmental Activities. Governmental activities increased the County’s net position by $3,095,989. Key elements of this increase are as follows: General Revenues increased $17,864,161.
Property tax revenue is the largest source of revenue for financing governmental activities. Property tax revenues increased $13 million in FY 2018. The County millage increased 3 mills from 14.652 in FY 2017 to 17.652 in FY 2018.
Sales tax revenue increased $4 million to $62,032,480. Sales tax includes the local option sales tax reported in the General Fund and the special purpose local option sales tax reported in the SPLOST funds.
Insurance premium tax increased $629,464 to $10.3 million in FY 2018. Hotel/Motel tax revenue increased $225,985 to $4.2 million reported in the Hotel/Motel Tax Special
Revenue Fund. Franchise taxes decreased $192,983 to $11.6 million in FY 2018. All other taxes decreased $175,043.

MANAGEMENT’S DISCUSSION AND ANALYSIS
11
Charges for Services increased $1,262,876 or 6% from FY 2017. Fine revenues increased $1.5 million. The District Attorney RICO Special Revenue Fund reported fine
revenues of $2.4 million in FY 2018, an increase of $1.6 million. This increase was partially offset by a decrease in fine revenue in General Fund of $99,878.
General Fund licenses and permits revenue increased $553,388 in FY 2018. General Fund other revenue declined $531,733. FY 2017 included a one-time revenue source not
applicable in FY 2018. Operating grant revenue increased $5,006,100 from the previous year.
Public Works grant revenue increased $4.7 million. FY 2018 included the initial year of a new Alternate Essential Air Service Program Grant to assist with providing flights from Macon-Bibb County to Washington, DC. Flights began in August 2017. Revenues totaled $4,124,308 for FY 2018.
Capital grants and contributions revenue decreased $2,733,839 from the previous year.
Public Works capital grant revenue decreased $2,296,391. Prior year revenues in the Grants Fund included approximately $1.5 million for Airport improvement funds.
Housing and Development grant revenue decreased $906,171. FY 2017 included one-time contributions toward improvements in the TAD Second Street Fund.
Total expenses decreased $29,971,087 from the previous year. Discussion of individual variances can be found in subsequent areas of this Management Discussion and Analysis. Business-Type Activities. The County charges fees to customers to help cover the cost of certain services provided. The net cost of these services, consisting of six (6) business-type activities, decreased the County’s net position by $706,238. Total revenue of business-type activities increased $2.6 million.
Tobesofkee Recreation Fund had an increase in charges for services revenue of $17,701, or 2% over prior year.
Solid Waste Fund had an increase in charges for services revenue of $711,201 or 6% over prior year. Operating grants increased $2 million. FY 2018 included $2,175,791 in Federal Emergency Management Agency (FEMA) reimbursements for debris monitoring and removal expenditures incurred as a result of Hurricane Irma.
Airport Fund revenues decreased $47,604 or 3%. Mulberry Parking Garage revenues decreased $18,163 or 12%. The County entered into an interim
agreement with Macon-Bibb County Urban Development Authority for management of the garage beginning May 1, 2018 through July 31, 2018.
Bowden Golf Course Fund revenues decreased $68,836 or 23%. The golf course was closed for approximately two months in FY 2018, undergoing extensive capital improvements.
Expenses of business-type activities had a net increase of $6,101,542.
Tobesofkee Recreation Fund had a decrease of $56,866 including $109,142 in salaries and benefits. This decrease includes a reduction of $159,405 compared to FY 2017 in recognition of GASB 68 pension obligations.
Solid Waste Fund had an increase of $6.2 million. Expenditures for debris monitoring and removal as a result of Hurricane Irma totaled $2.4 million. The liability for post-closure costs increased expenses by $3.5 million in FY 2018 compared to a decrease in the liability in the prior fiscal year.
Airport Fund had an increase of $112,429 or 6% primarily due to an increase of $76,411 in contract service expense for management of the airport.
Coliseum Fund had a decrease of $122,684 or 7%. Mulberry Street Parking Garage Fund had a decrease of $23,441 due to the interim agreement with
Macon-Bibb County Urban Development Authority to manage the garage beginning May 1, 2018. Bowden Golf Course Fund had an increase of $7,086 or 1%.

MANAGEMENT’S DISCUSSION AND ANALYSIS
12
Financial Analysis of the Government’s Funds The fund financial statements provide more detailed information about the County’s individual funds, not the County as a whole. Funds are accounting devices that the County uses to track specific sources of funding and spending for particular purposes. Some funds are required by State law and/or by bond covenants. The Board of Commissioners establishes other funds to control and manage money for particular purposes (like the purchase or construction of major capital facilities within the County) or to show that it is properly using certain grants and taxes (like the 1 cent special purpose local option sales tax). Governmental Funds. Most of the County’s basic services are included here, such as judicial, public safety, public works, housing and development, health and welfare, culture and recreation and general administration. These focus on (1) cash and other financial assets that can readily be converted to cash flow in and out, and (2) the balances left at year-end that are available for spending. Such information is useful in assessing financing requirements. In particular, unassigned fund balance may serve as a useful measure of a government’s net resources available for spending at the end of each fiscal year. For the fiscal year ended June 30, 2018, Macon-Bibb County’s governmental funds reported combined ending fund balances of $84,133,553, a decrease of $6,971,052 over the prior year. Funds with significant decreases included: General Fund $2.3 million; SPLOST 2018 $9.3 million; 2015 MBCUDA Project Fund $3.7 million. Funds with significant increases in fund balance included: SPLOST 2012 City $1.8 million; DA RICO Forfeiture Fund $1.1 million; Capital Improvements Fund $4.4 million; General Debt Service Fund $1.8 million. The various other governmental funds accounted for a net decrease of $865,198. These increases and decreases are addressed on pages 12 through 14 of this discussion. Of the total ending fund balances of governmental funds, $4.2 million constitutes assigned for working capital. Restricted fund balance totals $76 million and includes $23 million for debt service, $46 million for capital outlay, $1.8 million for grant programs, $1.2 million for community development, $2.3 million for judicial programs, and $1.2 million for a variety of other programs. Committed fund balance totals $1.6 million committed for law enforcement purposes reported in the Law Enforcement Commissary Fund. Assigned fund balance totals $5.4 million and includes $4.2 million assigned for working capital, $334,747 assigned for capital outlay, and $868,020 for outstanding purchases on order as of June 30, 2018. Nonspendable fund balance totals $1,006,329 representing inventories, prepaid items and long-term receivables not in spendable form. The general fund is the chief operating fund of the County. At the end of FY 2018, fund balance totaled $5.5 million. As a measure of the general fund’s liquidity, it may be useful to compare total fund balance to total fund expenditures. Total fund balance represented 3.7% of total general fund expenditures for FY 2018. For FY 2018, the fund balance of the County’s general fund decreased by $2.3 million. Total revenues increased $14.7 million. Key factors in the increase in general fund revenues are as follows:
General property tax revenue increased $12.5 million, primarily due to an increase in the millage rate from 14.652 to 17.652.
Local option sales tax revenue increased $2.1 million. Franchise tax revenue decreased $192,983. Insurance premium tax revenue increased $629,465. Other tax revenues decreased $175,043. License and permit revenue increased $553,388. Intergovernmental revenues decreased $64,082. Charges for services revenues decreased $89,204. Fines and forfeitures decreased $99,878. Investment earnings decreased $29,370. Rent revenue increased $29,272. Other revenues decreased $531,743. FY 2017 included a one-time refund of prior year payroll taxes for
those employees who opted out of social security.

MANAGEMENT’S DISCUSSION AND ANALYSIS
13
Total general fund expenditures increased by $4.9 million in FY 2018. Significant increases and decreases in general fund expenditures are as follows:
The majority of departments had an increase in salaries and benefits, which increased by $5.8 million in FY 2018.
o Pension costs increased $1.8 million, primarily due to an increase in contribution rates. The Macon Fire & Police Pension contribution rate increased from 18.72% to 26.33%. The Macon-Bibb Employee Pension contribution rate increased from 16.85% to 18.40%. These increases were slightly offset by a decrease in the contribution rate for the Macon General Employees’ Pension from 43.77% to 40.79%.
o General Fund contributions to the Group Insurance Fund increased $2.3 million.
General government expenditures increased by $37,790, or 0.14%. o Board of Commissioner expenditures decreased $130,311. Other professional services
decreased $100,000 due to one-time contract expenditures incurred in FY 2017. o County Manager expenditures decreased $201,059. Salaries and benefits decreased $197,380
due to vacancies in FY 2018. o County Attorney expenditures decreased $153,682. Outside counsel expenditures decreased
$143,065 in FY 2018. o Information Technology expenditures increased $446,230. Salaries and benefits increased
$332,766. Computers and hardware expenditures increased $64,191. o Human Resources expenditures increased $93,328. Contract services increased $137,410,
primarily due to one-time relocation costs incurred in FY 2018. o Risk Management expenditures decreased $108,810. Insurance premium expenditures
decreased $69,535. Repairs and settlement expenditures for damaged vehicles decreased $41,176.
o Nondepartmental expenditures increased $92,534. FY 2018 expenditures included $174,975 for demolition special project expenditures funded by FEMA/GEMA grant revenues.
The Judicial function expenditures increased by $502,860 or 3%.
o District Attorney expenditures increased $250,927. Salaries and benefits increased $41,602. Contract labor increased $204,249 due to two (2) additional state paid-county reimbursed positions.
o Municipal Court expenditures decreased $159,068. Contract services decreased $151,525. Prior years included contract services for case management, which has been eliminated with transitioning the court to new software.
o Public Defender expenditures increased $61,576, primarily due to an increase in Georgia Public Defender Council contract salaries and benefits totaling $65,800.
o Salaries and benefits in all other Judicial departments increased $376,156.
Public Safety expenditures increased by $5,463,818 or 8%. o The Commissioners approved salary increases for Public Safety in FY 2018, with increases of
4% to 8%, effective in January 2018. o Expenditures for Sheriff Divisions increased $3.2 million. Salaries and benefits increased $2.7
million or 8%. Expenditures for repairs and maintenance to vehicles increased $151,790. Contract medical services increased $97,119. Small equipment and improvements increased $169,269. Expenditures for fuel increased $85,730.
o Expenditures for Fire Divisions increased $2.3 million. Salaries and benefits increased $2.4 million.
o Expenditures for Coroner increased $213,589. Contract services for burials increased $207,779.

MANAGEMENT’S DISCUSSION AND ANALYSIS
14
Public Works expenditures increased by $445,372 or 8%. o Public Works Administration and Streets and Roads expenditures increased $589,036. Salaries
and benefits increased $359,750. Contract labor for prison crews increased $148,632. o Engineering expenditures decreased $143,665. Contract engineering services decreased
$102,886.
Housing and Development expenditures increased $105,587 or 2%. o Extension Service expenditures increased $31,353. Salaries and benefits increased $32,427. o Business Development expenditures decreased $63,866. Salaries and benefits decreased
$101,576 due to vacant positions. This decrease was partially offset by an increase in rent of $46,181.
o Expenditures for Industrial and Urban Development increased $138,200. Appropriations increased to the Macon-Bibb County Urban Development Authority $59,600, Macon-Bibb County Industrial Authority $59,600, and Keep Macon-Bibb Beautiful Commission $19,700.
Health and Welfare expenditures decreased by $73,531.
o Expenditures for welfare services decreased $242,419. Appropriations to the Macon-Bibb County Transit Authority decreased $340,470. This decrease was partially offset by an increase in funding provided to the Macon-Bibb County Economic Opportunity Council of $26,585.
o Expenditures for Community Service increased $168,887. Funding increases included: Middle Georgia Regional Library $144,786, Museum of Arts and Sciences $4,375, Tubman African American Museum $4,375, Macon-Bibb County Arts Alliance $4,850, and the Cherry Blossom Festival $10,000.
Culture and Recreation expenditures decreased by $31,740 or 0.45%. o Parks and Recreation expenditures increased $538,994. Salaries and benefits increased
$226,991. Contract services in Parks and Recreation Maintenance Division increased $199,863 due to the reallocation of certain expenditures between Parks and Recreation and Parks and Beautification.
o Parks and Beautification expenditures decreased $570,733. Salaries and benefits decreased $146,680. Contract services decreased $203,088 due to the reallocation of certain expenditures between Parks and Recreation and Parks and Beautification. Contract labor for prison crews decreased $78,874. Repairs and maintenance expenditures decreased $126,293.
Debt Service expenditures decreased $1.5 million or 71%. o Expenditures for interest on prior year revenue bonds decreased $1.2 million, as many of the
prior year bond issues were paid from SPLOST Funds in FY 2018. o Capital lease expenditures decreased $443,941, primarily due to the payment of prior year
leases from SPLOST Funds in FY 2018.
Transfers to other funds increased $355,170. o Transfers to the General Debt Service Fund decreased $2.3 million as a result of moving prior
year lease obligations to payment from SPLOST Funds. Transfers to Group Insurance Fund increased $1.9 million in FY 2018. Transfers to close out the Special Street Light District Fund increased $608,665. Other significant increases included: E911 $174,000, Capital Improvement Fund $150,000, and Bowden Golf Course Fund $132,000. Other significant decreases included: Coliseum and Auditorium Fund $149,162 and Vehicle Maintenance Fund $114,000.

MANAGEMENT’S DISCUSSION AND ANALYSIS
15
Voters approved a SPLOST in 2016 with collections beginning in April 2018. In FY 2017, the County issued $35 million in General Obligation SPLOST debt to provide funds for capital outlay projects defined in the SPLOST resolution. Expenditures totaled $16 million in FY 2018. The SPLOST 2018 Fund ended the fiscal year with total fund balance of $30.9 million. Voters approved a SPLOST in 2011 with collections beginning in April 2012. The original SPLOST agreement split the proceeds with 33.5% of taxes going to former City of Macon debt service and projects and 66.5% to former Bibb County debt service and projects. The funds are accounted for in the SPLOST 2012 Fund City and SPLOST 2012 Fund County. The SPLOST 2012 City Fund ended the fiscal year with total fund balance of $7.4 million. Revenues totaled $8.1 million in FY 2018. Expenditures totaled $6.3 million in FY 2018. The largest project expenditures in FY 2018 included storm water management and drainage $871,689 and public safety equipment $748,917. Debt service payments on the Series 2012 former City of Macon bond issue totaled $3.8 million. The SPLOST 2012 County Fund ended the fiscal year with total fund balance of $8.4 million. Revenues totaled $15.4 million. Expenditures totaled $16.1 million in FY 2018. The largest project expenditures included recreation $7.3 million and fire stations $2 million. Debt service payments on the Series 2012 former Bibb County bond issue totaled $4.2 million. The DA RICO Forfeiture Fund increased $1.1 million in FY 2018 and ended the fiscal year with fund balance of $1.8 million. FY 2018 revenues included $2.4 million in fines. Expenditures totaled $1.3 million. The Capital Improvements Fund increased $4.4 million in FY 2018 and ended the fiscal year with fund balance of $4.5 million. Proceeds from sale of property totaled $4.8 million in FY 2018, with a balance of $3.5 restricted for capital improvements at Henderson Stadium. FY 2018 also included $1.15 million in proceeds from revenue bonds utilized for urban development and $470,167 in capital lease proceeds for public works equipment. The 2015 MBCUDA Project Fund ended the fiscal year with total fund balance of $4 million. Macon-Bibb County issued bonds totaling $18.4 million to advance refund certain maturities of the Macon-Bibb County Urban Development Authority bond issues Series 2007 and 2013 and provide $14 million for projects to address blight and public infrastructure needs. Current year expenditures totaled $3.9 million. The General Debt Service Fund increased $1.8 million in FY 2018. Current year transfers in from other funds to repay GMA leasepool principal totaled $1.8 million. New leases transferred to other governmental funds totaled $72,955. Intergovernmental revenues of $447,477 represented the accumulation of sinking fund and debt service reserve funds to be used for the 2016 MBCUDA revenue bonds. Proprietary Funds. Macon-Bibb County’s proprietary funds provide the same information found in the government-wide financial statements, but in more detail. At the end of the current fiscal year, Enterprise Fund net investment in capital assets and unrestricted net position were $36 million and ($7.9 million), respectively. The total increase in net position was $706,238. Other factors concerning the finances of these funds have been addressed in the discussion of the County’s business-type activities on page 6 of this report.

MANAGEMENT’S DISCUSSION AND ANALYSIS
16
General Fund Budgetary Highlights In comparing the final FY 2018 budget figures to actual, revenues were less than budgetary estimates by $49,260. Revenues exceeded original budget estimates by $2.5 million.
Sales taxes totaled $31 million in FY 2018 and exceeded original budget estimates by $1.7 million. Actual revenues increased by $2.1 million over the prior year.
Insurance premium tax revenue totaled $10.3 million in FY 2018 and exceeded original budget estimates by $435,611. FY 2018 actual revenues increased by $629,465 over FY 2017.
Motor vehicle TAVT revenue totaled $5.7 million in FY 2018. TAVT revenue exceeded original budget estimates by $525,102 and reflected an increase over the prior year of $767,562.
Licenses and permits revenue totaled $4.4 million in FY 2018 and exceeded original budget estimates by $557,263. Revenues increased over prior year $553,387.
Expenditures were more than final budgetary estimates by $40,151. Differences between the original budget for expenditures and other financing sources and the final amended budget totaled $4.8 million. The amended budget projected a decrease in fund balance of $2.3 million. Supplemental appropriations for items originally budgeted and encumbered in FY 2017 that rolled to FY 2018 totaled $922,716. Additional supplemental appropriations included $400,000 in the County Attorney’s Office; $215,108 for Macon-Bibb County Transit Authority capital reserve funding; $132,100 for relocation costs of Human Resources and Internal Audit departments; $86,000 for newly required GIRMA insurance for firefighters; and $71,724 for other expenditures. The final year-end budget adjustment included $435,651 from fund balance to cover overages in various departments, with the most significant being transfers to other funds. A discussion of the changes in appropriations by function is as follows: General Government
The budget for General Government decreased $57,652. County Manager budget decreased $191,700. Salaries and benefits were less than the original budget
by $163,317 due to vacant positions. County Attorney budget increased $347,393, which included a $400,000 supplemental for outside
counsel expenditures. Human Resource budget decreased $214,507. The original budget included $273,500 for awards and
recognition expenditures, which were not utilized in FY 2018. This was partially offset by an increase in contract services of $131,000 to cover relocation expenditures.
Risk Management budget decreased $119,599. Budget decreases included insurance premiums $48,715 and judgments and losses $40,000.
Nondepartmental budget increased $254,634. The budget for property demolition expenditures increased $175,399 for expenditures funded by FEMA/GEMA grant revenues. The budget was also increased $79,235 for investment management fee expenditures.
Judicial The budget for Judicial expenditures increased $176,198. District Attorney budget increased $322,325. Salaries and benefits budget increased $78,763 with the
addition of a new position. Contract services budget increased $241,920 due to two (2) additional state paid-county reimbursed positions.
State Court Judge budget decreased $110,467. Salaries and benefits budget decreased $91,842, primarily due to a vacancy for part of the fiscal year.
State Court Probation budget decreased $70,471. Salaries and benefits budget decreased $36,790 due to a vacancy for part of the fiscal year. Professional services other decreased $32,000, as projected contract services were less than originally anticipated.
Public Defender budget increased $114,421. An increase in state contract salaries and benefits required an increase in the budget of $90,890.
MANAGEMENT’S DISCUSSION AND ANALYSIS
17
Public Safety The Public Safety budget increased $3.5 million. Sheriff Department budget increased $736,488.
o Salaries and benefits budget increased $2.3 million. The Commissioners approved an increase for public safety employees effective mid-year in FY 2018. Eligible employees received increases from 4-8%.
o Fuel budget decreased $706,235. o Repairs and maintenance to vehicles budget decreased $151,265. o Travel and education budget decreased $158,268. o Ammunition budget expenditures decreased $166,429.
Fire Department budget increased $2.4 million. o Salaries and benefits budget increased $2.3 million. The Commissioners approved an increase
for public safety employees effective mid-year in FY 2018. Eligible employees received increases from 4-8%.
Coroner’s Office Department budget increased $294,502, primarily due to an increase in funds budgeted for contract services of $284,050.
Public Works The Public Works budget increased $643,738. Streets and Roads division budget for salaries and benefits increased $572,804. Budget for repairs and
maintenance to vehicles increased $216,405. Budget for prison crews increased $164,146. Engineering division budget for salaries and benefits decreased $117,464. Budget for professional
services other decreased $83,009. Housing and Development The Housing and Development budget decreased $155,633. Business Development Services budget decreased $156,107. Salaries and benefits budget decreased
$188,453, primarily due to vacant positions.
Health and Welfare The Health and Welfare budget increased $317,535. The budget for Macon-Bibb County Transit Authority increased $215,108 to cover capital reserve deficit
funding required. The budget for North Central Health District increased $74,838. The County was awarded FEMA/GEMA
disaster relief funds in FY 2018, with $74,838 due to North Central Health District. Culture and Recreation The Culture and Recreation budget decreased $337,588. Parks and Recreation budget decreased $280,742. Salaries and benefits budget decreased $232,883,
primarily due to vacant positions. Parks and Beautification budget decreased $56,816. Salaries and benefits budget increased by $58,940;
Fuel Expenditures budget was reduced by $70,099, and Small Equipment and Improvements budget decreased $30,332.
Debt Service The budget for Debt Service decreased $3 million. Certain Debt Service obligations originally budgeted to be paid from General Fund were paid from
SPLOST 2018 funds in FY 2018. Other Financing Uses Appropriations for interfund transfers increased $3.8 million; with the most significant increases being
Group Insurance $2 million, Special Street Light District $554,665, Vehicle Maintenance $500,000, Bowden Golf Course $300,000, Airport $300,000.

MANAGEMENT’S DISCUSSION AND ANALYSIS
18
Capital Assets and Debt Administration Capital Assets. Macon-Bibb County’s investment in capital assets for its governmental and business-type activities as of June 30, 2018, amounted to $355,041,299 (net of accumulated depreciation). This investment in capital assets includes land, buildings and systems, improvements, machinery and equipment, park facilities, dam, roads, highways and bridges.
2018 2017 2018 2017 2018 2017
Land 50,651,640$ 50,189,531$ 7,639,561$ 7,639,561$ 58,291,201$ 57,829,092$
Earthen Dam - - 2,625,294 2,625,294 2,625,294 2,625,294
Construction in Process 46,503,302 58,087,573 297,273 89,346 46,800,575 58,176,919
Buildings and Improvements 93,403,546 79,357,941 11,796,207 12,089,547 105,199,753 91,447,488
Land Improvements 12,786,714 10,771,942 6,038,705 6,307,423 18,825,419 17,079,365
Dam Improvements - - 710,435 633,494 710,435 633,494
Machinery, Equipment and Furniture 11,374,056 12,375,950 1,138,787 719,060 12,512,843 13,095,010
Vehicles 7,214,411 9,008,670 1,712,438 1,300,311 8,926,849 10,308,981
Infrastructure 96,266,777 93,170,843 4,882,153 5,157,438 101,148,930 98,328,281
Total 318,200,446$ 312,962,450$ 36,840,853$ 36,561,474$ 355,041,299$ 349,523,924$
Summary of Capital Assets(net of depreciation)
GovernmentalActivities
Business-typeActivities Total
Additional information on the County’s capital assets can be found in the capital asset schedules in the notes to the financial statements on pages 70 - 72 of this report. Long-term Debt. At the end of the current fiscal year, the County’s governmental activities had outstanding general obligation sales tax bond debt totaling $48,223,454, tax allocation district bond debt totaling $3,174,278, revenue bond debt totaling $68,474,353, other contractual obligation debt totaling $14,365,944, and a note payable to component unit of $1,288,954. The governmental activities revenue bond debt represents revenue bond debt issued by various authorities and guaranteed by the taxing power of the government through contracts. The County’s business-type activities had capital lease obligations of $462,098 and landfill post-closure liability of $18.8 million.

MANAGEMENT’S DISCUSSION AND ANALYSIS
19
Summary of Outstanding Debt
Governmental Business-type Activities Activities Total 2018 2017 2018 2017 2018 2017 General obligation sales tax bonds $48,223,454 $56,773,081 $ - $ - $48,223,454 $56,773,081 Tax allocation bonds 3,174,278 3,300,000 - - 3,174,278 3,300,000 Revenue bonds 68,474,353 68,732,387 - 642,723 68,474,353 69,375,110 Other contractual obligations 913,944 763,700
462,098
564,035 1,376,042 1,327,735
Certificates of participation 13,452,000 13,452,000 - - 13,452,000 13,452,000 Note payable to component unit 1,288,954 1,432,251 - - 1,288,954 1,432,251 Compensated absences liability 7,597,763 7,228,339 173,746 160,427 7,771,509 7,388,766 Claims payable 12,542,748 10,930,426 - - 12,542,748 10,930,426 Landfill post-closure - - 18,790,000 15,280,000 18,790,000 15,280,000 Net pension liability 90,176,614 105,799,393 4,020,586 5,465,519 94,197,200 111,264,912 Net post-employment benefit liability 135,565,222 57,412,900 - - 135,565,222 57,412,900
Total
$381,409,330
$325,824,477 $23,446,430 $22,112,704 $404,855,760 $347,937,181 Macon-Bibb County maintains an “A1” rating from Moody’s and an “A” rating from Standard & Poor’s Corporation for general obligation debt. State statutes limit the amount of general obligation debt a governmental entity may issue to 10% of the assessed value of all taxable property (tax digest) within said county. The current debt limitation for Macon-Bibb County is $409,447,686 based upon total assessed values of $4,436,344,351 with $42,875,000 of general obligation sales tax bonds outstanding, $3,174,278 of tax allocation bonds outstanding and $11,862,528 restricted for debt service of the sales tax bonds. Additional information on the County’s long-term debt can be found on the schedule of general long-term debt and in the notes to the financial statements on page 180 and on pages 73 - 83 of this report, respectively. Economic Factors In the past 20 months, Macon-Bibb industrial relocations and expansions totaled more than $800 million in investments. This includes the creation of 2 million square feet of new space and the addition of 1,100 jobs. Additionally, 700 existing jobs have been retained due to the efforts of the Industrial Authority in partnership with the School Board and Macon Bibb County Commission. The unemployment rate for Macon-Bibb County is 5.4% just slightly higher than the State of Georgia rate at 4.7%, which is based upon the 2017 annual average unemployment statistics. As these planned industries continue to open doors in 2019, we expect the unemployment rate to continue to decline. A key investment is a fulfillment center for Amazon. The one million square foot facility is ready to accept the 500-1,000 employees in January 2019. Another significant investment was made by the Canadian based Irving Consumer Products, which made a $400 million state of the art tissue plant in the Sofkee Industrial Park next to Kumho Tires. Expansions for Graphic Packing, Nichiha, and Tyson Foods, along with new industries, will carry a $40 million estimated payroll.

MANAGEMENT’S DISCUSSION AND ANALYSIS
20
The Middle Georgia Regional Airport has begun a daily flight into BWI and is running at a 90% average capacity rate and has led to the expansion of a second destination to Tampa, Florida. The planned extension of the runway continues to draw business to hangar space at the regional airport. The Downtown Macon Revitalization efforts have proven that retail follows rooftops. Renovating the historic downtown buildings to provide loft space has led to more than 600 housing units downtown. Just eighteen (18) years ago, there were only twenty-nine (29) units. The Urban Core now boasts fifty-three (53) restaurants alongside retail and entertainment venues. We anticipate increased sales tax collection as people come to work, live, and play in the Hub City for Middle Georgia. Next Year’s Budget The FY 2019 General Fund budget presented challenges with the need to increase revenue resulting in an increase in property tax by three (3) mils. The demand for an increase in public safety salaries resulted in Fire and Sheriff department certified personnel receiving salary increases effective January 1, 2018, with the first full year of the increases in FY 2019. Commitments for three (3) pension plans and rising healthcare costs continue to impact the general fund budget. Requests for Information This financial report is designed to provide a general overview of Macon-Bibb County, Georgia’s finances for those with an interest in the government’s finances. Questions concerning any of the information provided in this report or requests for additional information should be addressed to the Office of the Finance Director, 700 Poplar Street, P.O. Box 247, Macon, Georgia 31202.

21
Governmental Business-type ComponentActivities Activities Total Units
ASSETSCash and cash equivalents $ 26,745,740 $ 878,042 $ 27,623,782 $ 17,131,287Investments 75,769,792 691,349 76,461,141 1,263,740Receivables, net of allowance
Taxes 5,360,169 - 5,360,169 - Special assessments 7,547 - 7,547 - Accounts 2,156,248 7,898,099 10,054,347 2,409,310 Accrued interest 16,742 - 16,742 107 Lease receivable - - - 1,235,382 Loan receivable - - - 1,639,156
Due from other governments 8,064,604 2,175,791 10,240,395 131,006 Due from primary government - - - 1,288,954 Internal balances (10,533,512) 10,533,512 - - Inventories - - - 1,161,032 Prepaid items 106,329 16,858 123,187 555,264 Long-term loans receivable 2,391,421 - 2,391,421 - Net pension asset - - - 173,042 Fair market value of interest-rate swap 2,673,640 - 2,673,640 - Capital assets, non-depreciable 97,154,942 10,562,128 107,717,070 42,117,772Capital assets, depreciable (net of accumulated
depreciation) 221,045,504 26,278,725 247,324,229 21,496,748 Total assets 430,959,166 59,034,504 489,993,670 90,602,800
DEFERRED OUTFLOWS OF RESOURCESOPEB 212,327 - 212,327 346,545 Pensions 38,385,385 1,092,485 39,477,870 3,221,073
Total deferred outflows of resources 38,597,712 1,092,485 39,690,197 3,567,618
LIABILITIES Accounts payable 10,565,278 1,702,822 12,268,100 1,742,397 Checks issued in excess of bank balance - - - 515,162 Retainage payable 431,890 - 431,890 - Accrued liabilities 3,934,843 147,082 4,081,925 520,094 Accrued interest payable 475,992 11,255 487,247 - Environmental remediation - - - 300,000 Security deposits 272,974 4,000 276,974 69,975 Unearned revenue 509,461 5,979,148 6,488,609 338,104 Line of credit - - - 2,558,018 Noncurrent liabilities
Due within one yearClaims payable 796,748 - 796,748 - Capital leases payable 262,043 68,807 330,850 - Bonds payable 16,140,031 - 16,140,031 1,407,000 Notes payable - - - 494,764 Workers compensation claims 2,131,000 - 2,131,000 - Compensated absences 3,900,725 84,611 3,985,336 278,402 Due to component unit 147,198 - 147,198 -
Due in more than one yearCapital leases payable 651,901 393,291 1,045,192 - Certificates of participation 13,452,000 - 13,452,000 - Bonds payable 103,732,054 - 103,732,054 20,547,000 Notes payable - - - 2,815,134 Net pension liability 90,176,614 4,020,586 94,197,200 13,030,501 Landfill closure/post-closure - 18,790,000 18,790,000 - Workers compensation claims 9,615,000 - 9,615,000 - Post-employment benefit liability 135,565,222 - 135,565,222 3,490,301 Compensated absences 3,697,038 89,135 3,786,173 - Due to component unit 1,141,756 - 1,141,756 155,358
Total liabilities 397,599,768 31,290,737 428,890,505 48,262,210
DEFERRED INFLOWS OF RESOURCESFair value of effective hedge 2,673,640 - 2,673,640 - Straight-line lease liability - - - 31,854 OPEB 9,023,539 - 9,023,539 470,094 Pensions 26,490,835 399,066 26,889,901 887,297
Total deferred inflows of resources 38,188,014 399,066 38,587,080 1,389,245
NET POSITIONNet investment in capital assets 255,168,651 36,378,755 291,547,406 37,209,171 Restricted for:
Debt service 23,392,110 - 23,392,110 - Grant programs 1,812,742 - 1,812,742 - Capital projects 46,324,743 - 46,324,743 1,675,663 Community development 1,203,428 - 1,203,428 - Culture and recreation - - - 47,645 Program loans - - - 1,692,196 Prior year program income - - - 2,054,334 Debt covenants - - - 111,420 Other purposes 3,524,925 - 3,524,925 507,640
Unrestricted (deficit) (297,657,503) (7,941,569) (305,599,072) 1,220,894 Total net position $ 33,769,096 $ 28,437,186 $ 62,206,282 $ 44,518,963
The accompanying notes are an integral part of these financial statements.
MACON-BIBB COUNTY, GEORGIA
Primary Government
JUNE 30, 2018STATEMENT OF NET POSITION

22
Program Revenues Operating Capital
Charges for Grants and Grants andFunctions/Programs Expenses Services Contributions ContributionsPrimary government:
Governmental activitiesGeneral government $ 28,854,100 $ 8,512,227 $ 1,432,707 $ 7,567 Judicial 20,254,786 2,363,504 1,092,164 - Public safety 90,520,341 8,490,549 196,330 116,527 Public works 19,088,846 170,837 7,303,817 408,572 Housing and development 13,790,513 1,759,506 3,212,711 - Health and welfare 9,311,368 - 9,303 - Culture and recreation 14,767,434 414,000 7,632 432,227 Interest on long-term debt 4,386,818 - - -
Total governmental activities $ 200,974,206 $ 21,710,623 $ 13,254,664 $ 964,893
Business-type activitiesTobesofkee Recreation Fund $ 1,536,576 $ 776,607 $ - $ - Solid Waste Fund 17,434,748 13,325,284 2,175,791 - Airport Fund 1,997,072 1,448,812 - - Coliseum Fund 1,708,007 - - - Mulberry Street Parking Garage Fund 156,163 135,828 - - Bowden Golf Course Fund 727,643 235,013 - -
Total business-type activities $ 23,560,209 $ 15,921,544 $ 2,175,791 $ -
Component units:Macon-Bibb County Industrial Authority $ 11,196,054 $ 1,945,902 $ 279,350 $ 3,257,808 Middle Georgia Regional Library 4,087,506 124,114 4,127,425 - Macon-Bibb County Transit Authority 8,604,531 1,456,379 2,816,015 512,968 Macon-Bibb County Board of Health 4,264,543 2,164,975 3,190,198 - Macon-Bibb County Urban Development Authority 2,106,506 282,423 447,281 1,628,090 Macon-Bibb Convention and Visitors Bureau 1,955,248 43,853 2,294,362 - Macon-Bibb Planning and Zoning Commission 1,878,747 582,883 355,910 - Development Authority of Bibb County 17,509 - - - Macon-Bibb County Land Bank Authority 686,339 - 452,595 -
Total component units $ 34,796,983 $ 6,600,529 $ 13,963,136 $ 5,398,866
General revenues:Property taxesSales taxesHotel/motel taxesAlcoholic beverage taxesRecording intangible taxesReal estate transfer taxFranchise taxesInsurance premium taxFinancial institution taxesPayments in lieu of taxesInterest and penalties on delinquent taxesGrants and contributions not restricted to specific programsUnrestricted investment earningsPayment from Macon-Bibb CountyOther revenuesGain on sale of capital assets
TransfersTotal general revenues and transfers
Change in net positionNet position, beginning of year, as restatedNet position, end of year
The accompanying notes are an integral part of these financial statements.
MACON-BIBB COUNTY, GEORGIA
FOR THE FISCAL YEAR ENDED JUNE 30, 2018STATEMENT OF ACTIVITIES
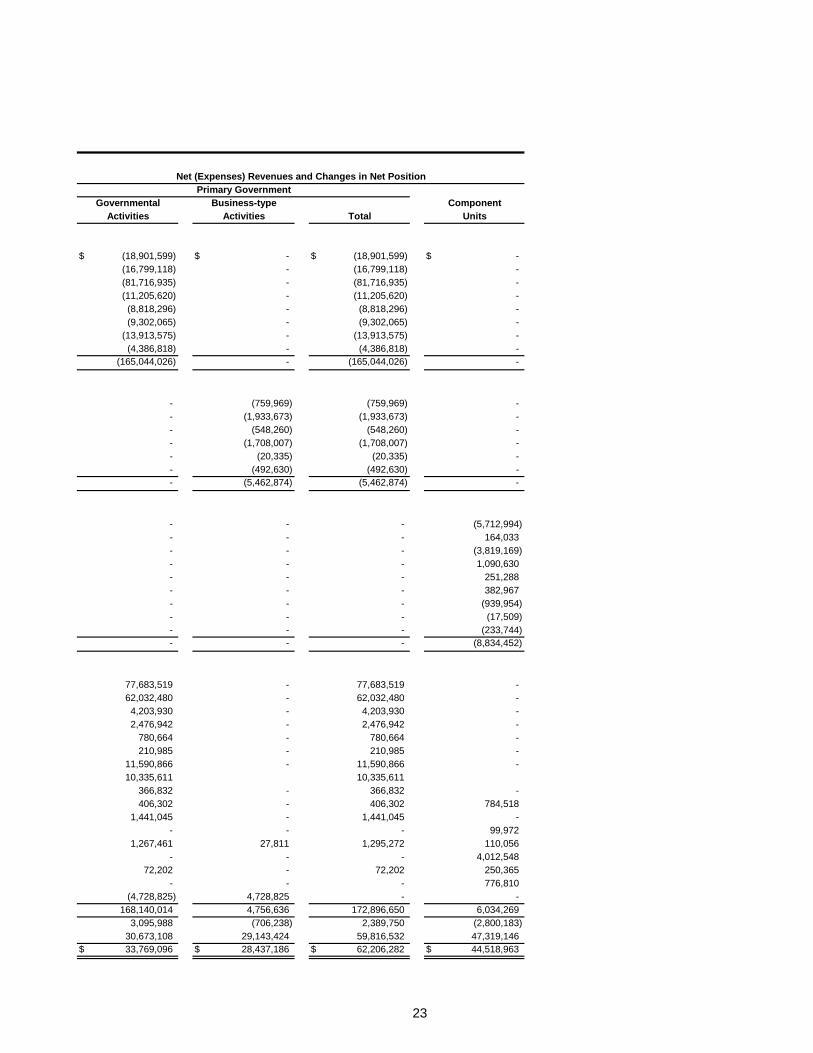
23
Net (Expenses) Revenues and Changes in Net Position
Governmental Business-type ComponentActivities Activities Total Units
$ (18,901,599) $ - $ (18,901,599) $ - (16,799,118) - (16,799,118) - (81,716,935) - (81,716,935) - (11,205,620) - (11,205,620) - (8,818,296) - (8,818,296) - (9,302,065) - (9,302,065) -
(13,913,575) - (13,913,575) - (4,386,818) - (4,386,818) -
(165,044,026) - (165,044,026) -
- (759,969) (759,969) - - (1,933,673) (1,933,673) - - (548,260) (548,260) - - (1,708,007) (1,708,007) - - (20,335) (20,335) - - (492,630) (492,630) - - (5,462,874) (5,462,874) -
- - - (5,712,994) - - - 164,033 - - - (3,819,169) - - - 1,090,630 - - - 251,288 - - - 382,967 - - - (939,954) - - - (17,509) - - - (233,744) - - - (8,834,452)
77,683,519 - 77,683,519 - 62,032,480 - 62,032,480 - 4,203,930 - 4,203,930 - 2,476,942 - 2,476,942 -
780,664 - 780,664 - 210,985 - 210,985 -
11,590,866 - 11,590,866 - 10,335,611 10,335,611
366,832 - 366,832 - 406,302 - 406,302 784,518
1,441,045 - 1,441,045 - - - - 99,972
1,267,461 27,811 1,295,272 110,056- - - 4,012,548
72,202 - 72,202 250,365- - - 776,810
(4,728,825) 4,728,825 - - 168,140,014 4,756,636 172,896,650 6,034,269
3,095,988 (706,238) 2,389,750 (2,800,183) 30,673,108 29,143,424 59,816,532 47,319,146
$ 33,769,096 $ 28,437,186 $ 62,206,282 $ 44,518,963
Primary Government

24
SPLOST SPLOST Nonmajor2012 Fund 2012 Fund SPLOST Governmental
General City County 2018 Funds TotalASSETS
Cash and cash equivalents 11,459,645$ 3,359,381$ 2,485,300$ 10,653 8,292,013$ 25,606,992$ Investments 14,037,971 3,822,836 6,588,599 32,723,908 18,596,478 75,769,792 Receivables, net of allowance
Taxes 4,962,414 - - - 397,755 5,360,169 Special assessments 7,547 - - - - 7,547 Accounts 1,276,972 - - 1,355 590,917 1,869,244 Accrued interest 16,742 - - - - 16,742
Due from other governments 3,282,894 255,804 - 2,827,806 1,644,873 8,011,377 Due from other funds 3,974,464 - - - 6,657,262 10,631,726 Prepaid items 102,318 - - - 4,011 106,329 Long-term receivables, net of allowance - - - - 2,391,421 2,391,421
Total assets 39,120,967$ 7,438,021$ 9,073,899$ 35,563,722$ 38,574,730$ 129,771,339$
LIABILITIES, DEFERRED INFLOWS OF RESOURCES AND FUND BALANCES
LIABILITIES Accounts payable 4,471,393$ -$ 439,465$ 1,387,831$ 3,005,322$ 9,304,011$ Retainage payable - 32,580 230,365 140,263 28,682 431,890 Deposits payable 272,974 - - - - 272,974 Accrued payroll deductions 2,656,765 - - - 171,950 2,828,715 Due to other governments - - - - 19,393 19,393 Due to other funds 13,214,000 - - 3,008,000 849,364 17,071,364 Advances from other funds 8,000,000 - - - - 8,000,000 Unearned revenues 3,595 - - - 505,866 509,461
Total liabilities 28,618,727 32,580 669,830 4,536,094 4,580,577 38,437,808
DEFERRED INFLOWS OF RESOURCESUnavailable revenue - taxes 4,509,258 - - - 13,438 4,522,696 Unavailable revenue - housing and development loans - - - - 1,491,421 1,491,421 Unavailable revenue - grants 379,211 - - 119,000 533,943 1,032,154 Unavailable revenue - special assessments 7,547 - - - - 7,547 Unavailable revenue - other 146,160 - - - - 146,160
Total deferred inflows of resources 5,042,176 - - 119,000 2,038,802 7,199,978
FUND BALANCES Nonspendable
Prepaid items 102,318 - - - 4,011 106,329 Long-term receivable - - - 900,000 900,000
Restricted forDebt service - 3,822,836 4,339,820 3,699,872 11,529,582 23,392,110 Grant programs - - - - 1,812,742 1,812,742 Capital outlay - 3,582,605 4,064,249 27,208,756 11,469,133 46,324,743 Law enforcement - - - - 1,135,998 1,135,998 Street light district - - - - - - Victim assistance - - - - 45,506 45,506 Court programs - - - - 2,343,421 2,343,421 Community development - - - - 1,203,428 1,203,428
Committed forLaw enforcement - - - - 1,630,990 1,630,990
Assigned forCapital outlay - - - - 84,947 84,947 Working capital 4,239,926 - - - - 4,239,926 Risk management - - - - - - Recreation 249,800 - - - - 249,800 Purchases on order 868,020 - - - - 868,020
Unassigned (deficit) - - - - (204,407) (204,407)
Total fund balances 5,460,064 7,405,441 8,404,069 30,908,628 31,955,351 84,133,553
Total liabilities, deferred inflows of resources and fund balances 39,120,967$ 7,438,021$ 9,073,899$ 35,563,722$ 38,574,730$ 129,771,339$
The accompanying notes are an integral part of these financial statements.
MACON-BIBB COUNTY, GEORGIA
JUNE 30, 2018GOVERNMENTAL FUNDS
BALANCE SHEET

25
$ 84,133,553
Capital assets used in governmental activities are not financial resources and, therefore, are not reported in the funds.
Cost of the assets 807,854,880 Accumulated depreciation (489,828,842)
Deferred outflows of resources are not due and payable in the current period and, therefore, are not reported inthe funds. These deferred outflows of resources relate to the County's pension plans and OPEB plans. 38,034,331
Some of the government's revenues will be collected after year-end, but are not available soon enough to payfor the current period's expenditures and, therefore, are deferred in the funds. 7,199,978
Internal service funds are used by management to charge the costs of risk management and health insuranceservices to individual funds. The assets and liabilities of the internal service funds are included in thegovernmental activities in the statement of net position.
Total net position of internal service funds 1,143,460 Less amount attributable to business-type activities 406,126
Deferred inflows of resources are not available to pay for current expenditures and, therefore, are not reportedin the funds. These deferred inflows related to the County's pension plans and OPEB plans. (35,235,363)
Long-term liabilities are not due and payable in the current period and, therefore, are not reported as fundliabilities. Interest on long-term debt is not accrued in governmental funds, but rather is recognized as anexpenditure when due. All liabilities, both current and long-term, are reported in the statement of net position.
Long-term liabilities at year-end consist of the following:Bonds payable (119,872,085) Certificates of participation (13,452,000) Capital leases payable (913,944) Workers' compensation payable (11,746,000) Net pension liability (89,107,361) Net OPEB liability (135,565,222) Compensated absences (7,517,469) Note payable - due to component unit (1,288,954) Accrued interest payable (475,992)
(50,364,457)
$ 33,769,096
MACON-BIBB COUNTY, GEORGIARECONCILIATION OF THE BALANCE SHEET
OF GOVERNMENTAL FUNDS TO THESTATEMENT OF NET POSITION
JUNE 30, 2018
The accompanying notes are an integral part of these financial statements.
Total fund equity per balance sheet of governmental funds
Revenues
Internal service funds
Long-term liabilities
Total adjustments
Total net position of governmental activities
Deferred outflows of resources
Deferred inflows of resources
Amounts reported for governmental activities in the statement of net position are different from amounts reportedin the balance sheet of governmental funds due to the following:
Capital assets

26
SPLOST SPLOST Nonmajor2012 Fund 2012 Fund SPLOST Governmental
General City County 2018 Funds TotalsREVENUES
Taxes:Property taxes 76,382,235$ -$ -$ -$ 1,126,470$ 77,508,705$ Sales taxes 31,022,324 7,715,394 15,315,633 7,979,129 - 62,032,480 Hotel/Motel taxes - - - - 4,203,930 4,203,930 Alcoholic beverage taxes 2,476,942 - - - - 2,476,942 Intangible taxes 780,664 - - - - 780,664 Real estate transfer tax 210,985 - - - - 210,985 Franchise taxes 11,590,866 - - - - 11,590,866 Financial gross receipts tax 366,832 - - - - 366,832 Payments in lieu of taxes 406,302 - - - - 406,302 Insurance premium tax 10,335,611 - - - - 10,335,611 Interest and penalties 1,441,045 - - - - 1,441,045
Licenses and permits 4,401,263 - - - - 4,401,263 Intergovernmental 1,497,670 336,249 - - 10,576,532 12,410,451 Charges for services 6,659,986 - - - 3,311,327 9,971,313 Fines and forfeitures 1,647,933 - - - 3,150,748 4,798,681 Investment earnings 292,636 49,956 84,869 493,820 970,810 1,892,091 Rent 1,737,806 - - - 490,591 2,228,397 Other revenue 406,368 - - - 559,834 966,202
Total revenues 151,657,468 8,101,599 15,400,502 8,472,949 24,390,242 208,022,760
EXPENDITURES Current:
General government 27,305,657 - - - 5,431,348 32,737,005 Judicial 17,557,794 - - - 1,693,785 19,251,579 Public safety 77,003,598 - - - 3,675,228 80,678,826 Public works 6,275,716 - - - 2,698,207 8,973,923 Housing and development 4,395,929 - - - 3,279,241 7,675,170 Health and welfare 8,758,133 - - - 457,676 9,215,809 Culture and recreation 6,956,993 - - - 3,007,285 9,964,278
Capital outlay - 1,961,126 10,611,093 13,011,772 7,999,746 33,583,737 Debt service: Principal 187,451 3,890,542 4,935,000 - 3,526,853 12,539,846 Interest and other charges 425,126 406,828 566,065 3,087,358 983,126 5,468,503 Bond issuance costs - - - - 141,028 141,028 Total expenditures 148,866,397 6,258,496 16,112,158 16,099,130 32,893,523 220,229,704
Excess (deficiency) of revenues over (under) expenditures 2,791,071 1,843,103 (711,656) (7,626,181) (8,503,281) (12,206,944)
OTHER FINANCING SOURCES (USES)Proceeds from sale of capital assets 420,744 - - - 5,004,382 5,425,126 Issuance of capital lease - - - - 470,167 470,167 Issuance of bonds - - - - 4,324,278 4,324,278 Insurance recoveries 72,202 - - - - 72,202 Transfers in 283,262 - - - 3,707,338 3,990,600 Transfers out (5,870,721) - - (1,645,724) (1,530,036) (9,046,481)
Total other financing sources (uses) (5,094,513) - - (1,645,724) 11,976,129 5,235,892
Net change in fund balances (2,303,442) 1,843,103 (711,656) (9,271,905) 3,472,848 (6,971,052)
FUND BALANCES, beginning of year 7,763,506 5,562,338 9,115,725 40,180,533 28,482,503 91,104,605
FUND BALANCES, end of year 5,460,064$ 7,405,441$ 8,404,069$ 30,908,628$ 31,955,351$ 84,133,553$
The accompanying notes are an integral part of these financial statements.
MACON-BIBB COUNTY, GEORGIA
FOR THE FISCAL YEAR ENDED JUNE 30, 2018GOVERNMENTAL FUNDS
STATEMENT OF REVENUES, EXPENDITURES AND CHANGES IN FUND BALANCES

27
$ (6,971,052)
To recognize change in liability resulting from contributions after the measurement date and OPEB expense. (7,643,455)
Governmental funds report capital outlays as expenditures. However, in the statement of activities, the cost of those assets isallocated over their estimated useful lives and reported as depreciation expense. This is the amount by which capital outlaysexceeded depreciation in the current period.
Total capital outlays 22,662,343 Total depreciation (16,185,578) The net effect of the disposal of capital assets is to decrease net position (1,204,842)
The issuance of bonds and similar long-term debt provides current financial resources to governmental funds, and thuscontributes to the change in fund balance. In the statement of net position, however, issuing debt increases long-term liabilitiesand does not affect the statement of activities. Similarly, repayment of principal is an expenditure in the governmental funds, butreduces the liability in the statement of net position. Also, governmental funds report the effect of premiums, discounts, andsimilar items when debt is first issued, whereas these amounts are deferred and amortized in the statement of activities. Theamount of the items that make up these differences in the treatment of long-term debt and related items are as follows:
Debt issued or incurred (4,794,445)
Principal repayments and refundings:
Leases payable 304,696
Notes payable - due to component unit 143,297
Bonds payable 12,091,853
Under the modified accrual basis of accounting used in governmental funds, expenditures are not recognized for transactionsthat are not normally paid with expendable available financial resources. In the statement of activities, however, which ispresented on the accrual basis, expenses and liabilities are reported regardless of when financial resources are available. Inaddition, interest on long-term debt is not recognized under the modified accrual basis of accounting until due, rather than as itaccrues. The adjustments for these items are as follows:
Compensated absences (366,896)
Workers' compensation (2,136,000)
Accrued interest on debt 57,024
Amortization of bond premium 1,165,808
Net pension liabilityTo recognize change in liability resulting from contributions after the measurement date and pension expense. 3,052,207
Revenues Because some revenues will not be collected for several months after the County's fiscal year-end, they are not consideredavailable revenues and are deferred in the governmental funds. Deferred inflows related to revenues decreased by this amountduring the fiscal period. 700,042
Internal service fundsInternal service funds are used by management to charge the cost of risk management and health insurance services toindividual funds. The net revenue is reported with governmental activities.
Net income of internal service funds 2,118,908 Portion of net income allocated to business-type activities 102,078
Total adjustments 10,067,040
Change in net position of governmental activities $ 3,095,988
The accompanying notes are an integral part of these financial statements.
Amounts reported for governmental activities in the statement of activities differ from amounts reported in the governmental fundstatement of revenues, expenditures and changes in fund balances due to the following:
Net OPEB Liability
Capital Assets
Long-term debt
MACON-BIBB COUNTY, GEORGIARECONCILIATION OF THE STATEMENT OF REVENUES, EXPENDITURES
AND CHANGES IN FUND BALANCES OF GOVERNMENTAL FUNDSTO THE STATEMENT OF ACTIVITIES
FOR THE FISCAL YEAR ENDED JUNE 30, 2018
Net change in fund balances, total governmental funds

28
Variance
Original FinalREVENUES
Taxes:Property taxes $ 75,985,088 $ 76,193,954 $ 76,382,235 $ 188,281 Sales taxes 29,300,000 31,022,324 31,022,324 - Alcoholic beverage taxes 2,500,000 2,500,000 2,476,942 (23,058) Intangible taxes 800,000 800,000 780,664 (19,336) Real estate transfer tax 200,000 200,000 210,985 10,985 Franchise taxes 12,032,000 12,032,000 11,590,866 (441,134) Financial gross receipts tax 420,000 420,000 366,832 (53,168) Payments in lieu of taxes 404,500 404,500 406,302 1,802 Insurance premium tax 9,900,000 10,335,611 10,335,611 - Interest and penalties 1,775,000 1,775,000 1,441,045 (333,955)
Licenses and permits 3,844,000 4,010,863 4,401,263 390,400 Intergovernmental 1,402,842 1,402,842 1,497,670 94,828 Charges for services 6,481,000 6,481,000 6,659,986 178,986 Fines and forfeitures 2,254,500 2,254,500 1,647,933 (606,567) Interest earned on investments 301,500 301,500 292,636 (8,864) Rent 1,533,650 1,533,650 1,737,806 204,156 Other revenue 271,920 271,920 406,368 134,448
Total revenues 149,406,000 151,939,664 151,657,468 (282,196)
EXPENDITURESCurrent:General government:
Board of commissioners 404,400 385,106 385,098 8 Mayor's office 403,000 383,139 383,130 9 Clerk of commission 263,450 251,479 251,468 11 County manager 1,743,250 1,551,550 1,551,511 39 Board of elections 830,500 777,708 777,687 21 General services 220,000 244,295 244,295 - Finance office 1,625,600 1,590,093 1,590,086 7 Risk management 809,600 690,001 690,001 - Internal audit 243,200 242,220 242,203 17 Tax assessors 2,008,500 1,903,673 1,944,574 (40,901) Tax commissioner 2,800,000 2,897,949 2,897,948 1 Purchasing 200,600 195,719 195,710 9 County attorney 1,191,500 1,538,893 1,538,882 11 Human resources 1,515,500 1,300,993 1,300,983 10 Facilities management 8,000,000 8,003,662 8,003,619 43 Information and technology 4,324,200 4,325,117 4,325,022 95 Small business affairs 279,600 262,818 262,810 8 General administrative fees 311,800 317,998 317,997 1 Other general government 148,000 402,634 402,633 1
Total general government $ 27,322,700 $ 27,265,047 $ 27,305,657 $ (40,610)
(Continued)
FOR THE FISCAL YEAR ENDED JUNE 30, 2018
MACON-BIBB COUNTY, GEORGIASTATEMENT OF REVENUES, EXPENDITURES AND CHANGES IN FUND BALANCES
BUDGET AND ACTUALGENERAL FUND
Budget withActual Final Budget

29
Variance
Original FinalEXPENDITURES (CONTINUED)
Current (Continued):Judicial:
Superior Court $ 1,472,300 $ 1,508,937 $ 1,508,935 $ 2 Public defender 2,774,000 2,888,421 2,888,420 1 Clerk of Superior Court 1,977,800 1,926,592 1,926,585 7 District attorney 2,989,200 3,311,525 3,311,524 1 DA victim witness program - 42,947 42,943 4 Grand jury 30,000 23,972 23,970 2 Juvenile Court 1,213,200 1,207,317 1,207,306 11 State Court judge 1,276,800 1,166,333 1,166,323 10 State Court probation 1,032,500 962,029 962,019 10 State Court solicitor 1,046,500 1,011,997 1,011,984 13 Magistrate Court 460,900 440,005 439,999 6 Civil Court 1,436,300 1,401,089 1,401,062 27 Probate Court 942,400 957,984 957,983 1 Municipal Court 729,800 708,751 708,741 10
Total judicial 17,381,700 17,557,899 17,557,794 105
Public safety:Sheriff 48,300,000 49,036,488 49,036,311 177 Fire 24,033,200 26,419,620 26,419,617 3 Coroner 324,500 619,002 619,002 - Animal welfare 535,900 576,513 576,494 19 Emergency management 353,400 352,208 352,174 34
Total public safety 73,547,000 77,003,831 77,003,598 233
Public works:Public works 4,000,000 4,912,151 4,912,143 8 Engineering 1,632,000 1,363,587 1,363,573 14
Total public works 5,632,000 6,275,738 6,275,716 22
Health and welfare:Health 1,535,400 1,535,400 1,535,400 - Welfare 3,329,200 3,630,046 3,630,045 1 Community service 3,576,000 3,592,689 3,592,688 1
Total health and welfare 8,440,600 8,758,135 8,758,133 2
Culture and recreation:Recreation 4,561,200 4,280,458 4,280,420 38 Parks and beautification 2,733,400 2,676,584 2,676,573 11
Total culture and recreation $ 7,294,600 $ 6,957,042 $ 6,956,993 $ 49
(Continued)
MACON-BIBB COUNTY, GEORGIASTATEMENT OF REVENUES, EXPENDITURES AND CHANGES IN FUND BALANCES
GENERAL FUND
Budget withActual Final Budget
BUDGET AND ACTUAL
FOR THE FISCAL YEAR ENDED JUNE 30, 2018

30
Variance
FinalEXPENDITURES (CONTINUED)
Current (Continued):Housing and development:
Extension service $ 276,600 $ 274,246 $ 274,223 $ 23 Business development services 1,998,000 1,841,893 1,841,878 15 Industrial and urban development 2,277,000 2,279,828 2,279,828 -
Total housing and development 4,551,600 4,395,967 4,395,929 38
Total current expenditures 144,170,200 148,213,659 148,253,820 (40,161)
Debt service:Principal 2,050,800 187,454 187,451 3 Interest and other charges 1,636,000 425,129 425,126 3
Total debt service 3,686,800 612,583 612,577 6
Total expenditures 147,857,000 148,826,242 148,866,397 (40,155)
Excess of revenues over expenditures 1,549,000 3,113,422 2,791,071 (322,351)
OTHER FINANCING SOURCES (USES)Proceeds from sale of capital assets 140,000 140,000 420,744 280,744 Insurance recoveries 120,000 120,000 72,202 (47,798) Transfers in 234,000 234,000 283,262 49,262 Transfers out (2,043,000) (5,870,721) (5,870,721) -
Total other financing sources (uses) (1,549,000) (5,376,721) (5,094,513) 282,208
Net change in fund balances - (2,263,299) (2,303,442) (40,143)
FUND BALANCES, beginning of year 7,763,506 7,763,506 7,763,506 -
FUND BALANCES, end of year $ 7,763,506 $ 5,500,207 $ 5,460,064 $ (40,143)
The accompanying notes are an integral part of these financial statements.
GENERAL FUND
MACON-BIBB COUNTY, GEORGIASTATEMENT OF REVENUES, EXPENDITURES AND CHANGES IN FUND BALANCES
BUDGET AND ACTUAL
FOR THE FISCAL YEAR ENDED JUNE 30, 2018
Budget withActual Final BudgetOriginal

31
GovernmentalNonmajor Activities -
Solid Waste Airport Enterprise Internal ServiceFund Fund Funds Total Funds
AssetsCurrent assets
Cash and cash equivalents $ 349,191 $ 55,790 $ 473,061 $ 878,042 $ 1,138,748 Investments 691,349 - - 691,349 - Receivables, net of allowance for
uncollectibles accounts 7,821,392 44,499 32,208 7,898,099 287,004 Due from other governments 2,175,791 - - 2,175,791 53,227 Due from other funds 3,090,000 - 280,000 3,370,000 3,500,000 Prepaid expenses - 16,858 - 16,858 -
Total current assets 14,127,723 117,147 785,269 15,030,139 4,978,979
Noncurrent assetsAdvances to other funds 8,000,000 - - 8,000,000 -
Capital assetsLand 73,126 6,301,663 1,264,772 7,639,561 80,132 Construction in progress - - 297,273 297,273 - Earthen dam - - 2,625,294 2,625,294 - Land improvements - 6,165,111 2,617,963 8,783,074 - Dam improvements - - 2,084,004 2,084,004 - Buildings 133,131 10,926,106 15,081,957 26,141,194 808,943 Building improvements - - 941,458 941,458 - Machinery, equipment and furniture 567,918 909,650 4,528,401 6,005,969 266,262 Vehicles 8,024,685 319,347 570,536 8,914,568 60,485 Infrastructure 2,097,678 4,743,176 356,307 7,197,161 -
10,896,538 29,365,053 30,367,965 70,629,556 1,215,822 Less accumulated depreciation (7,496,657) (9,348,192) (16,943,854) (33,788,703) (1,041,414)
3,399,881 20,016,861 13,424,111 36,840,853 174,408
Total noncurrent assets 11,399,881 20,016,861 13,424,111 44,840,853 174,408
Total assets 25,527,604 20,134,008 14,209,380 59,870,992 5,153,387
Deferred Outflows of ResourcesPensions 852,140 - 240,345 1,092,485 563,381
Total deferred outflows of resources $ 852,140 $ - $ 240,345 $ 1,092,485 $ 563,381
(Continued)
PROPRIETARY FUNDSSTATEMENT OF NET POSITION
MACON-BIBB COUNTY, GEORGIA
JUNE 30, 2018
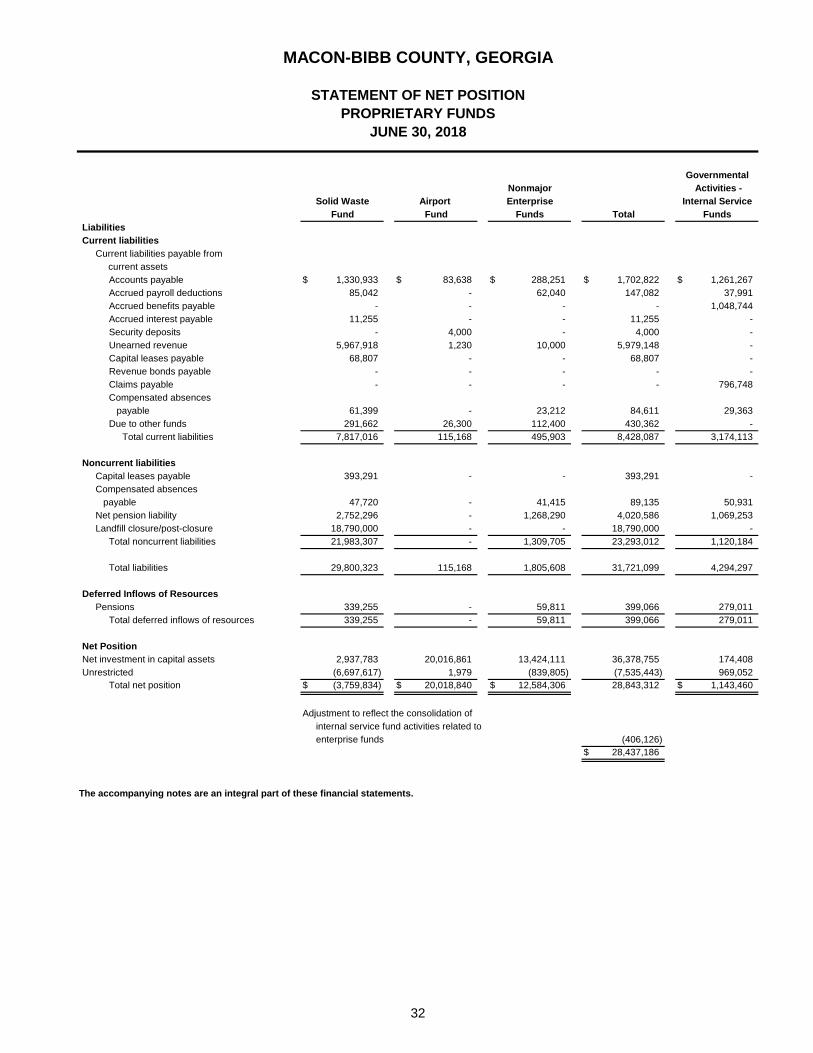
32
GovernmentalNonmajor Activities -
Solid Waste Airport Enterprise Internal ServiceFund Fund Funds Total Funds
LiabilitiesCurrent liabilities
Current liabilities payable from current assets
Accounts payable $ 1,330,933 $ 83,638 $ 288,251 $ 1,702,822 $ 1,261,267 Accrued payroll deductions 85,042 - 62,040 147,082 37,991 Accrued benefits payable - - - - 1,048,744 Accrued interest payable 11,255 - - 11,255 - Security deposits - 4,000 - 4,000 - Unearned revenue 5,967,918 1,230 10,000 5,979,148 - Capital leases payable 68,807 - - 68,807 - Revenue bonds payable - - - - - Claims payable - - - - 796,748 Compensated absences payable 61,399 - 23,212 84,611 29,363 Due to other funds 291,662 26,300 112,400 430,362 -
Total current liabilities 7,817,016 115,168 495,903 8,428,087 3,174,113
Noncurrent liabilitiesCapital leases payable 393,291 - - 393,291 - Compensated absences payable 47,720 - 41,415 89,135 50,931 Net pension liability 2,752,296 - 1,268,290 4,020,586 1,069,253 Landfill closure/post-closure 18,790,000 - - 18,790,000 -
Total noncurrent liabilities 21,983,307 - 1,309,705 23,293,012 1,120,184
Total liabilities 29,800,323 115,168 1,805,608 31,721,099 4,294,297
Deferred Inflows of ResourcesPensions 339,255 - 59,811 399,066 279,011
Total deferred inflows of resources 339,255 - 59,811 399,066 279,011
Net PositionNet investment in capital assets 2,937,783 20,016,861 13,424,111 36,378,755 174,408 Unrestricted (6,697,617) 1,979 (839,805) (7,535,443) 969,052
Total net position $ (3,759,834) $ 20,018,840 $ 12,584,306 28,843,312 $ 1,143,460
Adjustment to reflect the consolidation of internal service fund activities related to enterprise funds (406,126)
$ 28,437,186
The accompanying notes are an integral part of these financial statements.
STATEMENT OF NET POSITION
MACON-BIBB COUNTY, GEORGIA
JUNE 30, 2018PROPRIETARY FUNDS

33
GovernmentalNonmajor Activities -
Solid Waste Airport Enterprise Internal ServiceFund Fund Funds Total Funds
Operating revenuesCharges for sales and services $ 13,325,284 $ 1,448,812 $ 1,147,448 $ 15,921,544 $ 1,610,339
Total operating revenues 13,325,284 1,448,812 1,147,448 15,921,544 19,733,930
Operating expensesAdministration and other costs 13,462,316 1,340,906 3,164,648 17,967,870 3,630,951 Depreciation 355,404 620,756 957,595 1,933,755 33,926 Amortization - 2,278 - 2,278 - Claims and judgments - - - - 16,454,041
Total operating expenses 13,817,720 1,963,940 4,122,243 19,903,903 20,118,918
Operating loss (492,436) (515,128) (2,974,795) (3,982,359) (384,988)
Nonoperating revenues (expenses)Intergovernmental revenue 2,175,791 - - 2,175,791 - Interest earned on investments 25,634 228 1,949 27,811 4,015 Landfill closure/post-closure costs (3,510,000) - - (3,510,000) - Interest expense (15,573) (28,655) - (44,228) (119)
Total nonoperating revenues (expenses) (1,324,148) (28,427) 1,949 (1,350,626) 3,896
Loss before contributions and transfers (1,816,584) (543,555) (2,972,846) (5,332,985) (381,092)
Capital contributions 973,409 - 1,199,535 2,172,944 -
Transfers in - 600,000 1,955,881 2,555,881 2,500,000 Total transfers - 600,000 1,955,881 2,555,881 2,500,000
Change in net position (843,175) 56,445 182,570 (604,160) 2,118,908
Net position, beginning of year (2,916,659) 19,962,395 12,401,736 (975,448)
Net position, end of year $ (3,759,834) $ 20,018,840 $ 12,584,306 $ 1,143,460
Adjustment to reflect the consolidation ofinternal service fund activities related toenterprise funds. (102,078)
$ (706,238)
The accompanying notes are an integral part of these financial statements.
MACON-BIBB COUNTY, GEORGIA
FOR THE FISCAL YEAR ENDED JUNE 30, 2018PROPRIETARY FUNDS
STATEMENT OF REVENUES, EXPENSES AND CHANGES IN FUND NET POSITION

34
GovernmentalNonmajor Activities -
Solid Waste Airport Enterprise Internal ServiceFund Fund Funds Total Funds
CASH FLOWS FROM OPERATING ACTIVITIES
Receipts from customers $ 18,001,607 $ 1,422,783 $ 1,136,672 $ 20,561,062 $ 1,616,584 Receipts from other funds - - - - 16,912,917 Payments for claims and services - - - - (18,489,069) Payments to employees (2,672,287) - (1,213,102) (3,885,389) (1,058,872) Payments to suppliers (12,083,305) (1,312,904) (1,970,757) (15,366,966) (632,008)
Net cash provided by (used in) operating activities 3,246,015 109,879 (2,047,187) 1,308,707 (1,650,448)
CASH FLOWS FROM NONCAPITAL FINANCING ACTIVITIES Transfers from other funds - 600,000 1,955,881 2,555,881 2,500,000 Change in due to/from other funds (3,215,221) (22,700) 170,400 (3,067,521) -
Net cash provided by (used in) noncapitalfinancing activities (3,215,221) 577,300 2,126,281 (511,640) 2,500,000
CASH FLOWS FROM CAPITAL AND RELATED FINANCING ACTIVITIES Purchase of capital assets - - (40,190) (40,190) - Principal payments on capital leases (101,937) - - (101,937) (15,227) Principal payments on bonds payable - (645,001) - (645,001) - Interest payments on bonds/leases (17,520) (35,935) - (53,455) (259)
Net cash used in capital and relatedfinancing activities (119,457) (680,936) (40,190) (840,583) (15,486)
CASH FLOWS FROM INVESTING ACTIVITIES Purchases of investments (9,235) - - (9,235) - Interest received 25,634 228 1,949 27,811 4,015
Net cash provided by investing activities 16,399 228 1,949 18,576 4,015
Net increase (decrease) in cash and cash equivalents (72,264) 6,471 40,853 (24,940) 838,081
Cash and cash equivalents, beginning of year 421,455 49,319 432,208 902,982 300,667
Cash and cash equivalents, end of year $ 349,191 $ 55,790 $ 473,061 $ 878,042 $ 1,138,748
(Continued)
MACON-BIBB COUNTY, GEORGIA
FOR THE FISCAL YEAR ENDED JUNE 30, 2018PROPRIETARY FUNDS
STATEMENT OF CASH FLOWS

35
GovernmentalNonmajor Activities -
Solid Waste Airport Enterprise Internal ServiceFund Fund Funds Total Funds
Reconciliation of operating loss to net cash provided by (used in)
operating activities:Operating income (loss) $ (492,436) $ (515,128) $ (2,974,795) $ (3,982,359) $ (384,988)
Adjustments to reconcile operating loss to net cash provided by (used in) operating activities:
Depreciation and amortization expense 355,404 623,034 957,595 1,936,033 33,926 Decrease (increase) in accounts receivable (1,291,595) (23,856) (10,776) (1,326,227) 147,827 Increase in due from other governments - - - - (52,256) Increase in due from other funds - - - - (1,300,000) (Increase) decrease in prepaid expenses - (404) 7,083 6,679 - Increase (decrease) in accounts and retainage payable (495,011) 28,406 (168,555) (635,160) 462,872 Increase in accrued payroll deductions (109,833) - 19,180 (90,653) 29,210
Increase in accrued benefits payable 6,446 - 6,873 13,319 - Decrease in claims payable - - - - (523,678) Increase (decrease) in net pension liability (694,878) - 113,708 (581,170) (63,361) Increase (decrease) in unearned revenue 5,967,918 (2,173) 2,500 5,968,245 -
Net cash provided by (used in) operating activities $ 3,246,015 $ 109,879 $ (2,047,187) $ 1,308,707 $ (1,650,448)
Schedule of Non-cash Capital and Related Financing ActivitiesChange in landfill closure/ post-closure liability $ 3,510,000 $ - $ - $ 3,510,000 $ - Contributions of capital assets from other funds 973,409 - 1,199,535 2,172,944 -
Total $ 4,483,409 $ - $ 1,199,535 $ 5,682,944 $ -
The accompanying notes are an integral part of these financial statements.
MACON-BIBB COUNTY, GEORGIA
STATEMENT OF CASH FLOWSPROPRIETARY FUNDS
FOR THE FISCAL YEAR ENDED JUNE 30, 2018

36
Benefit Agency
AssetsCash and cash equivalents $ 19,693,932 $ 5,774,035Investments:
Short-term investments 5,060,000 - Corporate bonds 45,837,865 - Common stock 38,260,490 - U.S. Treasury bills and government bonds 38,276,839 - Asset backed securities 45,205,560 - Mutual funds 240,308,275 - Fixed rate securities 3,285,030 -
Taxes receivable - 10,082,670 Accounts receivable 618,582 - Intergovernmental accounts receivable 66,967 - Accrued interest receivable 715,658 - Due from brokers for unsettled trades 671,985 - Note receivable - 1,320
Total assets 438,001,183 15,858,025
LiabilitiesAccounts payable 540,049 - Due to brokers for unsettled trades 1,019,920 - Due to other governments - 11,849,405 Due to others - 4,008,620
Total liabilities 1,559,969 15,858,025
Net PositionRestricted for:
Pension benefits 432,672,710 - Other post-employment benefits 3,768,504 -
Total net position $ 436,441,214 $ -
The accompanying notes are an integral part of these financial statements.
MACON-BIBB COUNTY, GEORGIA
Funds
Employee
Trust Funds
STATEMENT OF FIDUCIARY NET POSITIONFIDUCIARY FUNDS
JUNE 30, 2018

37
Benefit
Additions:Contributions - employer $ 16,272,167 Contributions - retirees 999,769
17,271,936
Investment income:Net appreciation in fair value of plan investments 19,437,718 Interest earned on investments 3,660,986 Dividends 6,275,707 Other investment earnings 3,513
29,377,924
Less investment expense:Trustee fees and commissions 783,662
Net investment income 28,594,262
Total additions 45,866,198
Deductions:Benefits paid retirees 40,396,802 Administrative expense 975,374
Total deductions 41,372,176
Change in net position 4,494,022
Net PositionBeginning of year 431,947,192
End of year $ 436,441,214
The accompanying notes are an integral part of these financial statements.
FIDUCIARY FUNDSSTATEMENT OF CHANGES IN FIDUCIARY NET POSITION
Trust Funds
Employee
FOR THE FISCAL YEAR ENDED JUNE 30, 2018
MACON-BIBB COUNTY, GEORGIA

NOTES TO FINANCIAL STATEMENTS

MACON-BIBB COUNTY, GEORGIA
NOTES TO FINANCIAL STATEMENTS FOR THE FISCAL YEAR ENDED JUNE 30, 2018
38
NOTE 1. SUMMARY OF SIGNIFICANT ACCOUNTING POLICIES
A. The Reporting Entity
On April 20, 2012, Act 625 was signed into law by the Governor of Georgia to create and incorporate a new consolidated government under the name of Macon-Bibb County (the “County”), subject to the approval by the voters of both the City of Macon and Bibb County, Georgia. The referendum was held on July 31, 2012, and the Act was approved by both the voters of the City of Macon and Bibb County. The consolidation was effective January 1, 2014. The new government consolidated the governments of the City of Macon, Georgia and Bibb County, Georgia. The accompanying financial statements present the County and its component units, entities for which the County is considered to be financially accountable. The component unit's column in the government-wide financial statements includes the financial data for the County's discretely presented component units as reflected in their most recent audited financial statements. This is reported in a separate column in the government-wide financial statements to emphasize that the component units are legally separate from the County.
Macon-Bibb County Industrial Authority The Macon-Bibb County Industrial Authority (the “Authority”) is charged with promoting and expanding industry and trade within Macon-Bibb County. The Authority is governed by a six member board consisting of the Mayor of Macon-Bibb County, four Macon-Bibb County appointees and one appointment by the other appointed members. The Authority receives appropriations from the County, with the County paying 100% of the annual budget request. An annual budget request must be submitted to Macon-Bibb County for approval of the appropriation amount, with an annual audit required to monitor performance. The Authority issues separate financial statements with a June 30 fiscal year end. A complete copy of these statements may be obtained from the Macon-Bibb County Industrial Authority, 439 Mulberry St., Macon, Georgia 31201. Middle Georgia Regional Library The Middle Georgia Regional Library (the “Library”) provides complete library services with the main facility in Macon-Bibb County, branch libraries located in the six surrounding counties, and a bookmobile service. The Library is governed by a Board of Trustees appointed by the County. The County contributes significant funding to the Library and exercises control over expenditures. An annual budget must be submitted for approval, with an annual audit required to monitor performance. The Library issues separate financial statements with a June 30 fiscal year-end. A complete copy of these statements may be obtained from the Middle Georgia Regional Library, 1180 Washington Avenue, Macon, Georgia 31201.

NOTES TO FINANCIAL STATEMENTS
39
NOTE 1. SUMMARY OF SIGNIFICANT ACCOUNTING POLICIES (CONTINUED)
A. The Reporting Entity (Continued)
Macon-Bibb County Board of Health
The governing board of the Macon-Bibb County Board of Health (the “Board of Health”) consists of seven members appointed by the County. The County, by virtue of its appointments, controls a majority of the governing body positions. The County contributes significant funding to the Board of Health. An annual budget must be submitted for approval, with annual audits required to monitor performance. The Board of Health issues separate financial statements with a June 30 fiscal year-end. A complete copy of these statements may be obtained from the Macon-Bibb County Board of Health, 171 Emery Highway, Macon, Georgia 31217.
Macon-Bibb County Convention and Visitors Bureau
The Macon-Bibb County Convention and Visitors Bureau (the “CVB”) is a nonprofit 501 (c)(6) organization, organized and existing under the laws of the State of Georgia, whose purpose is to promote tourism and conventions in the Macon-Bibb County area. The Mayor of Macon-Bibb County is a member of the Board of Directors. Through contract with the County, the CVB receives hotel/motel tax proceeds. The CVB is required to submit a detailed budget to the County reflecting performance against budget. Any unexpended hotel/motel tax funds are required to be returned to the County at termination of the contract. The CVB issues separate financial statements with a June 30 fiscal year-end. A complete copy of these statements may be obtained from the Macon-Bibb County Convention and Visitors Bureau, 450 Martin Luther King, Jr. Blvd., Macon, Georgia 31201. Macon-Bibb County Planning and Zoning Commission
The Macon-Bibb County Planning and Zoning Commission (the “Commission”) is responsible for community planning, establishing and enforcing zoning regulations, and administration of certain grant programs. The Mayor and County Commissioners appoint members to the Board of the Commission. The County provides significant funding for the operating costs of the Commission. Excess revenue over expenditures or excess working capital is returned to the County. The Commission submits annual budget requests to the County for approval and reports on performance against budget with the submission of an annual audit. The Commission issues separate financial statements with a June 30 fiscal year-end. A complete copy of these statements may be obtained from the Macon-Bibb County Planning and Zoning Commission, 682 Cherry Street, Suite 100, Macon, Georgia 31201.

NOTES TO FINANCIAL STATEMENTS
40
NOTE 1. SUMMARY OF SIGNIFICANT ACCOUNTING POLICIES (CONTINUED)
A. The Reporting Entity (Continued)
Development Authority of Bibb County
The governing board of the Development Authority of Bibb County (the “Development Authority”) consists of seven members appointed by the County. Macon-Bibb County, by virtue of its appointments, controls a majority of the governing body positions. If the Development Authority is dissolved, all assets and debts and rights and obligations of the Development Authority shall devolve to the County. Annual audits are required to monitor performance. Complete financial statements may be obtained from the Development Authority of Macon-Bibb County, 305 Coliseum Drive, Macon, Georgia 31202. Macon-Bibb County Urban Development Authority
The Macon-Bibb County Urban Development Authority (the “Urban Development Authority”) is responsible for the revitalization and redevelopment of the downtown areas of Macon-Bibb County. The County Commissioners nominate board members. The Urban Development Authority submits annual budget requests to the County for approval. Annual audits are required to monitor performance. Complete financial statements may be obtained from the Macon-Bibb County Urban Development Authority, P.O. Box 169, Macon, Georgia 31298.
Macon-Bibb County Land Bank Authority
The Macon-Bibb County Land Bank Authority (the “Land Bank Authority”) is a nonprofit organization, whose purpose is to allow Macon-Bibb County to provide housing, new industry and jobs for the citizens of the Middle Georgia area by effectively utilizing property previously in a non-revenue generating, non-tax producing status. The County Commissioners appoint four members of the Land Bank Authority Board, and participate in the operating costs of the Land Bank Authority. The Land Bank Authority submits annual budget requests to the County for approval of appropriation. Annual audits must be submitted to the County. Complete financial statements may be obtained from the Macon-Bibb County Land Bank Authority, P.O. Box 4298, Macon, Georgia 31208. Macon-Bibb County Transit Authority
The governing board of the Macon-Bibb County Transit Authority (the “Transit Authority”) consists of five members. The Mayor and County Commissioners nominate five individuals to serve as board members. Initial and final approval of a board member is made by the Mayor and County Commissioners. The County, by virtue of its appointments, controls a majority of the governing body positions. The Transit Authority and Macon-Bibb County have entered into an agreement under which the County provides support to the Transit Authority from the annual tax digest. The Transit Authority submits an annual operating budget each year to the County. Annual audits must also be submitted to the County. Complete financial statements may be obtained from the Macon-Bibb County Transit Authority, 200 Cherry Street, Macon, Georgia 31202.

NOTES TO FINANCIAL STATEMENTS
41
NOTE 1. SUMMARY OF SIGNIFICANT ACCOUNTING POLICIES (CONTINUED)
A. The Reporting Entity (Continued)
Under Georgia law, the County, in conjunction with other cities and counties in the middle Georgia area, is a member of the Middle Georgia Regional Commission (the “MGRC”) and is required to pay annual dues thereto. During the fiscal year ended June 30, 2018, the County paid $198,588 in such dues. Membership in the MGRC is required by the Official Code of Georgia Annotated (O.C.G.A.) Section 50-8-34 which provides for the organizational structure of the MGRC in Georgia. The MGRC Board membership includes the chief elected official of each county and municipality of the area. O.C.G.A. 50-8-39.1 provides that the member governments are liable for any debts or obligations of a regional development center. Separate financial statements may be obtained from the Middle Georgia Regional Commission, 175-C Emery Highway, Macon, Georgia 31217.
B. Government-wide and Fund Financial Statements
The government-wide financial statements (i.e., the statement of net position and the statement of activities) report information on all of the nonfiduciary activities of the primary government and its component units. For the most part, the effect of interfund activity has been removed from these statements. Governmental activities, which normally are supported by taxes and intergovernmental revenues, are reported separately from business-type activities, which rely to a significant extent on fees and charges for support. Likewise, the primary government is reported separately from certain legally separate component units for which the primary government is financially accountable. The statement of activities demonstrates the degree to which the direct expenses of a given function or segment are offset by program revenues. Direct expenses are those that are clearly identifiable with a specific function or segment. Program revenues include: 1) charges to customers or applicants who purchase, use, or directly benefit from goods, services, or privileges provided by a given function or segment, and 2) grants and contributions that are restricted to meeting the operational or capital requirements of a particular function or segment. Taxes and other items not properly included among program revenues are reported instead as general revenues. Separate financial statements are provided for governmental funds, proprietary funds, and fiduciary funds, even though the latter are excluded from the government-wide financial statements. Major individual governmental funds and major individual enterprise funds are reported as separate columns in the fund financial statements.

NOTES TO FINANCIAL STATEMENTS
42
NOTE 1. SUMMARY OF SIGNIFICANT ACCOUNTING POLICIES (CONTINUED)
C. Measurement Focus, Basis of Accounting and Financial Statement Presentation
The government-wide financial statements are reported using the economic resources
measurement focus and the accrual basis of accounting, as are the proprietary fund and the fiduciary fund financial statements, although the agency funds have no measurement focus. Revenues are recorded when earned and expenses are recorded when a liability is incurred, regardless of the timing of the related cash flows. Property taxes are recognized as revenues in the year for which they are levied. Grants and similar items are recognized as revenue as soon as all eligibility requirements imposed by the provider have been met. Governmental fund financial statements are reported using the current financial resources
measurement focus and the modified accrual basis of accounting. Revenues are recognized as soon as they are both measurable and available. Revenues are considered to be available when they are collectible within the current period or soon enough thereafter to pay liabilities of the current period. For this purpose, the County considers revenues to be available if they are collected within 30 days of the end of the current fiscal period for property taxes and 60 days for most other revenues. Expenditures generally are recorded when a liability is incurred, as under accrual accounting. However, debt service expenditures, as well as expenditures related to compensated absences and claims and judgments, are recorded only when payment is due. General capital asset acquisitions are reported as expenditures in governmental funds. Issuance of long-term debt and acquisitions under capital leases are reported as other financing sources. Property taxes, sales taxes, franchise taxes, and licenses associated with the current fiscal period are all considered to be susceptible to accrual and so have been recognized as revenues of the current fiscal period. Entitlements are recorded as revenues when all eligibility requirements are met, including any time requirements, and the amount is received during the period or within the availability period for this revenue source. Expenditure driven grants are recognized as revenue when the qualifying expenditures have been incurred and all other eligibility requirements have been met, and the amount is received during the period or within the availability period for this revenue source. All other revenue items are considered to be measurable and available only when cash is received by the County. The County reports the following major governmental funds:
The General Fund is the County’s primary operating fund. It accounts for all financial resources of the general government, except those required to be accounted for in another fund. The SPLOST 2012 Fund City is used to account for the expenditures on the former City of Macon projects to be paid from the 1-cent special purpose local option sales tax approved by the voters of the former City of Macon on November 8, 2011.

NOTES TO FINANCIAL STATEMENTS
43
NOTE 1. SUMMARY OF SIGNIFICANT ACCOUNTING POLICIES (CONTINUED)
C. Measurement Focus, Basis of Accounting and Financial Statement Presentation
(Continued)
The SPLOST 2012 Fund County is used to account for the expenditures on the former Bibb County projects to be paid from the 1-cent special purpose local option sales tax approved by the voters of Bibb County on November 8, 2011. The SPLOST 2018 Fund is used to account for the expenditures on projects to be paid from the 1-cent special purpose local option sales tax approved by the voters of Bibb County on November 8, 2016.
The County reports the following major proprietary funds:
The Solid Waste Fund accounts for the operations and activities of the landfill and activities associated with solid waste pickup. The Airport Fund accounts for the activities of a municipal airport in Macon-Bibb County.
Additionally, the County reports the following fund types:
The internal service funds are used to account for the financing of goods or services provided by one department or agency to other departments or agencies of the government and to other governmental units, on a cost reimbursement basis. The following activities are reported in internal service funds: maintenance of group health and maintenance of the motor-vehicle fleet. The employee benefit trust funds account for the activities of the Employee Pension Trust Fund, the General Employees’ Pension Trust Fund, the Fire and Police Pension Trust Fund and Other Post-Employment Benefits Trust Fund, which accumulates resources for pension and other post-employment benefit payments to qualified employees of the County. The agency funds are used to account for the collection and disbursement of monies by the County on behalf of other governments and individuals, such as cash bonds, traffic fines, support payments, and property taxes.
As a general rule, the effect of interfund activity has been eliminated from the government-wide financial statements. However, interfund services provided and used are not eliminated in the process of consolidation.

NOTES TO FINANCIAL STATEMENTS
44
NOTE 1. SUMMARY OF SIGNIFICANT ACCOUNTING POLICIES (CONTINUED)
C. Measurement Focus, Basis of Accounting and Financial Statement Presentation
(Continued)
Amounts reported as program revenues include: 1) charges to customers or applicants for goods, services, or privileges provided, 2) operating grants and contributions, and 3) capital grants and contributions. Internally dedicated resources are reported as general revenues rather than as program revenues. Likewise, general revenues include all taxes. Proprietary funds distinguish operating revenues and expenses from nonoperating items. Operating revenues and expenses generally result from providing services and producing and delivering goods in connection with a proprietary fund’s principal ongoing operations. The principal operating revenues of the enterprise funds and of the County’s internal service funds are charges to customers for sales and services provided. Operating expenses for the enterprise funds and internal service funds include the cost of sales and services, administrative expenses, and depreciation on capital assets. All revenues and expenses not meeting this definition are reported as nonoperating revenues and expenses. When both restricted and unrestricted resources are available for use, it is the County’s policy to use restricted resources first, then unrestricted resources as they are needed.
D. Deposits and Investments
The County’s cash and cash equivalents are considered to be cash on hand, demand deposits, and short-term investments with original maturities of three months or less from the date of acquisition. The local government investment pool, “Georgia Fund 1,” created by O.C.G.A. 36-83-8, is a stable asset value investment pool, which follows Standard & Poor’s criteria for AAAf rated money market funds and is regulated by the Georgia Office of the State Treasurer. The pool is not registered with the SEC as an investment company. The pool’s primary objectives are safety of capital, investment income, liquidity and diversification while maintaining principal ($1 per share value). The asset value is calculated weekly to ensure stability. The pool distributes earnings (net of management fees) on a monthly basis and determines participant’s shares sold and redeemed based on $1 per share. The pool also adjusts the value of its investments to fair market value as of year-end and the County’s investment in the Georgia Fund 1 is reported at fair value. The County considers amounts held in Georgia Fund 1 as investments for financial statement presentation. The County’s nonparticipating interest-earning investment contracts are recorded at cost. The remaining investments are recorded at fair value. Increases or decreases in the fair value during the year are recognized as a component of investment income.

NOTES TO FINANCIAL STATEMENTS
45
NOTE 1. SUMMARY OF SIGNIFICANT ACCOUNTING POLICIES (CONTINUED)
D. Deposits and Investments (Continued)
In accordance with authorized investment laws, the County’s employee benefit trusts invest in various asset-backed securities, such as mortgage-backed securities. These securities represent an ownership interest in a pool of residential mortgage loans, the interest in which is, in most cases, issued and guaranteed by an agency or instrumentality of the U.S. government. These securities are reported at fair value in the balance sheet.
E. Receivables
“Due from other governments” represents funds to be received from other local governments, state grant-in-aid, state contracts, or federal funds. No allowance is deemed necessary for these receivables. Activity between funds that are representative of lending/borrowing arrangements outstanding at the end of the fiscal year are referred to as either “due to/from other funds” (i.e., the current portion of interfund loans) or “advances to/from other funds” (i.e., the noncurrent portion of interfund loans). All other outstanding balances between funds are reported as “due to/from other funds.” Any residual balances outstanding between the governmental activities and the business-type activities are reported in the government-wide financial statements as “internal balances.” All trade and property tax receivables have been reduced to their estimated net realizable value, and are shown net of an allowance for uncollectible accounts. Estimated uncollectible accounts are based upon historical experience rates.
F. Inventory and Prepaid Items
Inventories are valued at cost using the first-in/first-out (FIFO) method and consist of certain supplies which are recorded as assets at the time of purchase. The cost of such inventories is recorded as expenditures/expenses when consumed rather than when purchased. Inventories of other expendable supplies are not considered material and the cost of such items is recorded as expenditures/expenses when purchased. Certain payments to vendors reflect costs applicable to future accounting periods and are recorded as prepaid items in both the government-wide and fund financial statements. The cost of prepaid items is recorded as expenditure/expense when consumed rather than when purchased.

NOTES TO FINANCIAL STATEMENTS
46
NOTE 1. SUMMARY OF SIGNIFICANT ACCOUNTING POLICIES (CONTINUED)
G. Capital Assets
Capital assets include property, plant, equipment, and infrastructure assets (e.g., roads, bridges, sidewalks, and similar items) and are reported in the applicable governmental or business-type activities columns in the government-wide financial statements. Capital assets are defined by the County as assets with an estimated useful life in excess of one year and costs exceeding the following:
$25,000 for furniture, fixtures and equipment $75,000 for infrastructure $5,000 for capital assets purchased with federal grant funds All land and vehicles are capitalized, regardless of cost
As the County constructs or acquires capital assets each period, including infrastructure assets, they are capitalized and reported at historical cost. Donated capital assets are recorded at estimated acquisition value. In the case of the initial capitalization of general infrastructure items (i.e., those reported by governmental activities), the County chose to include all such items regardless of their acquisition date. The County was able to estimate the historical cost for the initial reporting of these assets through backtrending (i.e., estimating the current replacement cost of the infrastructure to be capitalized and using an appropriate price-level index to deflate the cost to the acquisition year or estimated acquisition year). Normal maintenance and repairs, which are essentially amounts spent in relation to capital assets that do not increase the capacity or efficiency of the item or increase its estimated useful life, are expensed as incurred. Major outlays for capital assets and major improvements are capitalized as projects are constructed. Interest incurred during the construction period of capital assets of the business-type activities is included as part of the capitalized value of the assets constructed. During the fiscal year ended June 30, 2018, interest expense incurred by the County’s business-type activities was $44,228. Of this amount, none was applicable to construction of capital assets.

NOTES TO FINANCIAL STATEMENTS
47
NOTE 1. SUMMARY OF SIGNIFICANT ACCOUNTING POLICIES (CONTINUED)
G. Capital Assets (Continued)
Land and construction in progress are not depreciated. The other property, plant, equipment, and infrastructure of the primary government are depreciated using the straight-line method over the following estimated useful lives: Land improvements 10 - 30 yearsDam improvements 15 - 20 yearsBuildings 20 - 50 yearsBuilding improvements 7 - 30 yearsMachinery, equipment, and furniture and fixtures 5 - 20 yearsVehicles 5 - 15 yearsInfrastructure 20 - 60 years
In accordance with generally accepted accounting principles, depreciation is not provided for on the earthen dam reported in the Tobesofkee Recreation Fund. The earthen dam has no determinable depreciable life.
H. Compensated Absences
The County’s policy permits employees to accumulate earned but unused vacation benefits, which are eligible for payment upon separation from government service. The liability for such leave is reported as incurred in the government-wide, proprietary and fiduciary fund financial statements. A liability for these amounts is reported in governmental funds only if they have matured, for example, as a result of employee resignations and retirements. The liability for compensated absences includes salary-related benefits, where applicable. There is no liability for unpaid accumulated sick leave. Accumulated sick leave lapses when employees leave the employ of the County and, upon separation from service, no monetary obligation exists. I. Long-Term Obligations
In the government-wide financial statements and proprietary fund types in the fund financial statements, long-term debt and other long-term obligations are reported as liabilities in the applicable governmental activities, business-type activities, or proprietary fund type statement of net position. Bond premiums and discounts are deferred and amortized over the life of the bonds using the effective interest method. Bonds payable are reported net of the applicable bond premium or discount.

NOTES TO FINANCIAL STATEMENTS
48
NOTE 1. SUMMARY OF SIGNIFICANT ACCOUNTING POLICIES (CONTINUED)
I. Long-Term Obligations (Continued)
In the fund financial statements, governmental fund types recognize bond premiums, and discounts, as well as bond issuance costs, during the current period. The face amount of debt issued and premiums received on debt issuances are reported as other financing sources while discounts on debt issuances are reported as other financing uses. Issuance costs, whether or not withheld from the actual debt proceeds received, are reported as debt service expenditures. J. Deferred Outflows/Inflows of Resources
In addition to assets, the statement of net position will sometimes report a separate section for deferred outflows of resources. This separate financial statement element represents a consumption of net position that applies to a future period(s) and so will not be recognized as an outflow of resources (expense/expenditure) until then. In addition to liabilities, the statement of net position and the governmental funds balance sheet will sometimes report a separate section for deferred inflows of resources. This separate financial statement element, deferred inflows of resources, represents an acquisition of fund balance that applies to future period(s) and so will not be recognized as an inflow of resources (revenue) until that time. The County has only one item which arises under the modified accrual basis of accounting that qualifies for reporting in this category. Accordingly, the item, unavailable revenue, is reported only in the governmental funds balance sheet. The governmental funds report unavailable revenues from five sources: taxes, housing and development loans, grants, special assessments and other. These amounts are deferred and recognized as an inflow of resources in the period that the amounts become available. In addition, the County has one item under the full-accrual basis of accounting that qualifies for reporting in this category. One item is an effective hedge that is reported in the government-wide statement of net position. The effective hedge results from the change in market value of a swap agreement related to the certificates of participation. The amount is deferred and will mature on June 1, 2028, at the same time as the certificates of participation.
NOTES TO FINANCIAL STATEMENTS
49
NOTE 1. SUMMARY OF SIGNIFICANT ACCOUNTING POLICIES (CONTINUED)
J. Deferred Outflows/Inflows of Resources (Continued)
The County also has deferred inflows and outflows related to the recording of changes in its net pension and OPEB liabilities. Certain changes in the net pension liability and net OPEB liability are recognized as expense over time instead of all being recognized in the year of occurrence. Experience gains and losses result from periodic studies by the County’s actuaries which adjust the net pension liability and net OPEB liability for actual experiences for certain trend information that was previously assumed, for example the assumed dates of retirement of plan members. These experience gains or losses are recorded as deferred outflows of resources or deferred inflows of resources and are amortized into expense over the expected remaining service lives of plan members. Changes in actuarial assumptions which adjust the net pension liability and net OPEB liability are also recorded as deferred outflows of resources or deferred inflows of resources and are amortized into expense over the expected remaining service lives of plan members. The difference between projected investment return on investments and actual return on those investments is also deferred and amortized against expense over a five-year period. Contributions made by the County to the pension plans before year-end but subsequent to the measurement date of the County’s net pension liability are reported as deferred outflows of resources. K. Fund Equity
Fund equity at the governmental fund financial reporting level is classified as fund balance. Fund equity for all other reporting is classified as net position. Fund Balance
Generally, fund balance represents the difference between the assets and liabilities under the current financial resources measurement focus of accounting. In the fund financial statements, governmental funds report fund balance classifications that comprise a hierarchy based primarily on the extent to which the County is bound to honor constraints on the specific purposes for which amounts in those funds can be spent. Fund balances are classified as follows:
Nonspendable: Fund balances are reported as nonspendable when amounts cannot be spent because they are either (a) not in spendable form (i.e., items that are not expected to be converted to cash) or (b) legally or contractually required to be maintained intact. Restricted: Fund balances are reported as restricted when there are limitations imposed on their use either through enabling legislation adopted by the County or through external restrictions imposed by creditors, grantors or laws or regulations of other governments.

NOTES TO FINANCIAL STATEMENTS
50
NOTE 1. SUMMARY OF SIGNIFICANT ACCOUNTING POLICIES (CONTINUED)
K. Fund Equity (Continued)
Fund Balance (Continued)
Committed: Fund balances are reported as committed when they can be used only for specific purposes pursuant to constraints imposed by formal action of the County Board of Commissioners through the adoption of a resolution prior to the end of the fiscal year. Once adopted, the limitation imposed remains in place until a similar action is taken to remove or revise the limitation. Only the Board of Commissioners may modify or rescind the commitment.
Assigned: Fund balances are reported as assigned when amounts are constrained by the County’s intent to be used for specific purposes, but are neither restricted nor committed. Through resolution, the Board of Commissioners has authorized the County’s Finance Director to assign fund balances. The Board of Commissioners may also assign fund balance as it does when appropriating fund balance to cover a gap between estimated revenue and appropriations in the subsequent year’s appropriated budget. Unlike commitments, assignments generally only exist temporarily. An additional action does not normally have to be taken for the removal of an assignment. Unassigned: Fund balances are reported as unassigned as the residual amount when the balances do not meet any of the above criteria. Positive unassigned fund balance may be reported only in the General Fund. Negative unassigned fund balances may be reported in all governmental funds.
Net Position
Net position represents the difference between assets and liabilities in reporting which utilizes the economic resources measurement focus. Net investment in capital assets consists of capital assets, net of accumulated depreciation, reduced by the outstanding balances of any borrowing used (i.e., the amount that the County has spent) for the acquisition, construction or improvement of those assets. Net position is reported as restricted using the same definition as used for restricted fund balance as described in the section above. The residual amount of equity not classified as net investment in capital assets or net position restricted is reported as net position unrestricted.

NOTES TO FINANCIAL STATEMENTS
51
NOTE 1. SUMMARY OF SIGNIFICANT ACCOUNTING POLICIES (CONTINUED)
K. Fund Equity (Continued)
Flow Assumptions – Fund Balance
Sometimes the government will fund outlays for a particular purpose from both restricted and unrestricted resources (the total of committed, assigned, and unassigned fund balance). In order to calculate the amounts to report as restricted, committed, assigned, and unassigned fund balance in the governmental fund financial statements, a flow assumption must be made about the order in which the resources are considered to be applied. It is the County’s policy to consider restricted fund balance to have been depleted before using any of the components of unrestricted fund balance. Further, when the components of unrestricted fund balance can be used for the same purpose, committed fund balance is depleted first, followed by assigned fund balance. Unassigned fund balance is applied last.
Sometimes the government will fund outlays for a particular purpose from both restricted and unrestricted resources. In order to calculate the amounts to report as restricted-net position and unrestricted-net position in the government-wide and proprietary fund financial statements, a flow assumption must be made about the order in which the resources are considered to be applied. It is the County’s policy to consider restricted-net position to have been depleted before unrestricted-net position is applied.
L. Management Estimates
The preparation of financial statements in conformity with accounting principles generally accepted in the United States of America requires management to make estimates and assumptions that affect the reported amounts of assets and liabilities, the disclosure of contingent assets and liabilities at the date of the financial statements, and the reported amounts of revenues and expenses during the reporting period. Actual results could differ from those estimates.
M. OPEB
For purposes of measuring the net OPEB liability, deferred outflows of resource and deferred inflows of resources related to OPEB, and OPEB expense, information about the fiduciary net position of the County’s Post-employment Healthcare Benefit Plan (PHCB Plan) and additions to/deductions from the PHCB Plan’s fiduciary net position have been determined on the same basis as they are reported by the PHCB Plan. For this purpose, benefits payments are recognized when due and payable in accordance with the benefit terms. Investments are reported at fair value.
N. Pensions
For purposes of measuring the net pension liability, deferred outflows of resource and deferred inflows of resources related to pensions, and pension expense, information about the fiduciary net position of the County’s pension plans and additions to/deductions from the plans’ fiduciary net position have been determined on the same basis as they are reported by the respective plans. For this purpose, benefits payments are recognized when due and payable in accordance with the benefit terms. Investments are reported at fair value.

NOTES TO FINANCIAL STATEMENTS
52
NOTE 2. BUDGETS AND BUDGETARY ACCOUNTING
Budget Process
The County prepares a separately issued budget report. The annual budget document is the financial plan for the operation of Macon-Bibb County. The budget process exists for the purpose of providing a professional management approach to the establishment of priorities and the implementation of work programs while providing an orderly means for control and evaluation of the financial posture of the County. The department and agency heads begin budget preparation in February. The County's Budget and Strategic Planning Office conducts budget hearings with all departments and agencies. The County’s Budget and Strategic Planning Office then formulates and remits the budget to the Mayor. After a review by the Mayor, the budget is presented to the Board of Commissioners. After review by the Board of Commissioners and a public hearing, a final budget is approved when the budget resolution is adopted. Budgetary Basis of Accounting
Annual budgets are adopted on a basis consistent with generally accepted accounting principles. An annual operating budget is prepared for the general, special revenue and debt service funds. The appropriated budget is prepared by fund, function and department. The legal level of budgetary control is the department level. The Assistant to the County Manager for Budget and Strategic Planning is delegated the authority to transfer funds up to $10,000 from one budget line item to another within a department, provided the line items are within the same budget category and department. Transfers from one budget category to another cannot be made without approval of the appropriate committee. No increase in the overall budget can be made without the approval of the Board of Commissioners and amendment to the budget. Appropriations in all budgeted funds lapse at the end of the fiscal year even if they have related encumbrances. Encumbrances are commitments related to unperformed (executory) contracts for goods or services (i.e., purchase orders, contracts, and commitments). Encumbrance accounting is utilized to the extent necessary to assure effective budgetary control and accountability and to facilitate effective cash planning and control. While all appropriations and encumbrances lapse at year-end, valid outstanding encumbrances (those for which performance under the executor contract is expected in the next year) are re-appropriated and become part of the subsequent year’s budget.

NOTES TO FINANCIAL STATEMENTS
53
NOTE 2. BUDGETS AND BUDGETARY ACCOUNTING (CONTINUED)
Capital Improvements Budget
Major capital facilities and improvements, which are accounted for by the County within the capital projects funds, are appropriated on a project-length basis. The budget is prepared based upon architectural and engineering estimates and other factors. Appropriations covering capital projects are normally approved by the Board of Commissioners at the time the annual operating budgets are approved. The Assistant to the County Manager for Budget and Strategic Planning is delegated the authority, upon the direction of and approval by unanimous vote of the buildings and properties committee, to transfer sums from one project to another. No increase in the overall capital projects budget can be made without the approval of the Board of Commissioners and amendments to the budget. Appropriations for a specific project do not lapse until completion of the project. During the fiscal year ended June 30, 2018, the County’s expenditures for capital improvement projects were within the authorization provided in the budget. Deficit Fund Equity
For the period ended June 30, 2018, the following funds had deficit fund balances/net positions:
Fund DeficitSpecial Revenue Funds:
Sponsored Program $ 2,226ECD ESG Fund 1,960
Capital Project Funds:2014 TAD Renaissance 123,8622014 TAD Bibb Mill 76,359
Proprietary Funds:Solid Waste Fund 3,759,834
Internal Service Funds:Vehicle Maintenance 832,162
The deficit in the Sponsored Programs and ECD ESG Funds will be eliminated through recognition of unearned revenue or deferred inflows of resources in future periods. The deficits in the 2014 TAD Renaissance and 2014 TAD Bibb Mill Funds will be eliminated by transfers from the General Fund in future years. The deficits in the Solid Waste Fund and the Vehicle Maintenance Fund was created due to the each share of the net pension liability required to be recognized under Governmental Accounting Standards Board (GASB) Statement No. 68. The deficit in the Vehicle Maintenance Fund will be eliminated through inter-departmental charges within the County.

NOTES TO FINANCIAL STATEMENTS
54
NOTE 2. BUDGETS AND BUDGETARY ACCOUNTING (CONTINUED)
Excess of Expenditures over Appropriations
For the year ended June 30, 2018, expenditures exceeded budget in the following department or function as follows:
Excess
General Fund:General government
Tax assessor $ 40,901
These over expenditures were funded by unassigned fund balance of the General Fund.
NOTE 3. DEPOSITS AND INVESTMENTS
Credit Risk. It is the policy of Macon-Bibb County to invest public funds in accordance with state and local statutes. State statutes authorize the County to invest in obligations of the State of Georgia or other states; obligations issued by the U.S. government; obligations fully insured or guaranteed by the U.S. government or by a government agency of the United States; obligations of any corporation of the U.S. government; prime bankers’ acceptances; the local government investment pool established by state law; repurchase agreements; and obligations of other political subdivisions of the State of Georgia. The reporting of investments in accordance with GASB Statement No. 31 resulted in an unrealized gain of $15,936 netted with interest income in the General Fund. Interest Rate Risk. In accordance with its investment policy, the County manages its exposure to declines in fair values by diversifying its use of investment instruments to avoid unreasonable risks inherent in over investing in specific instruments, individual institutions, or maturities.
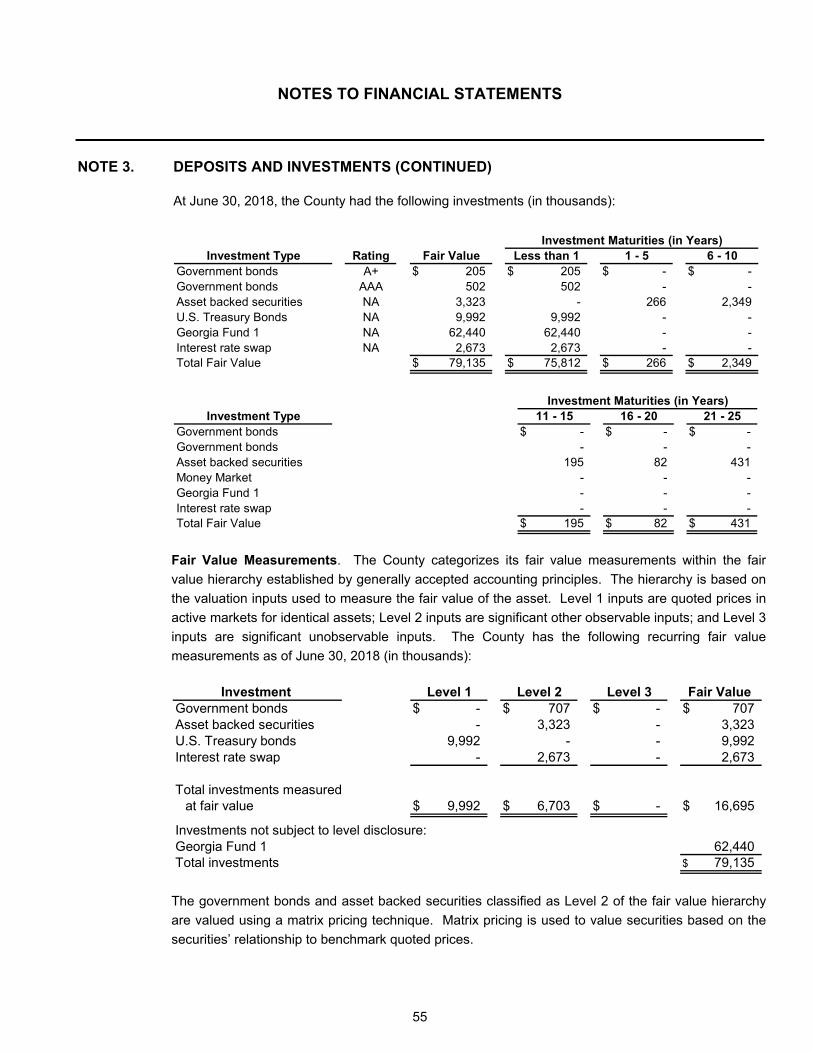
NOTES TO FINANCIAL STATEMENTS
55
NOTE 3. DEPOSITS AND INVESTMENTS (CONTINUED)
At June 30, 2018, the County had the following investments (in thousands):
Investment Maturities (in Years)Investment Type Rating Fair Value Less than 1 1 - 5 6 - 10
Government bonds A+ $ 205 $ 205 $ - $ - Government bonds AAA 502 502 - - Asset backed securities NA 3,323 - 266 2,349 U.S. Treasury Bonds NA 9,992 9,992 - - Georgia Fund 1 NA 62,440 62,440 - - Interest rate swap NA 2,673 2,673 - - Total Fair Value $ 79,135 $ 75,812 $ 266 $ 2,349
Investment Type 11 - 15 16 - 20Government bonds $ - $ - $ - Government bonds - - - Asset backed securities 195 82 431 Money Market - - - Georgia Fund 1 - - - Interest rate swap - - - Total Fair Value $ 195 $ 82 $ 431
21 - 25Investment Maturities (in Years)
Fair Value Measurements. The County categorizes its fair value measurements within the fair value hierarchy established by generally accepted accounting principles. The hierarchy is based on the valuation inputs used to measure the fair value of the asset. Level 1 inputs are quoted prices in active markets for identical assets; Level 2 inputs are significant other observable inputs; and Level 3 inputs are significant unobservable inputs. The County has the following recurring fair value measurements as of June 30, 2018 (in thousands):
Investment Level 1 Level 2 Level 3 Fair Value Government bonds $ - $ 707 $ - $ 707 Asset backed securities - 3,323 - 3,323 U.S. Treasury bonds 9,992 - - 9,992 Interest rate swap - 2,673 - 2,673
Total investments measuredat fair value $ 9,992 $ 6,703 $ - $ 16,695
Investments not subject to level disclosure:Georgia Fund 1 62,440 Total investments $ 79,135
The government bonds and asset backed securities classified as Level 2 of the fair value hierarchy are valued using a matrix pricing technique. Matrix pricing is used to value securities based on the securities’ relationship to benchmark quoted prices.

NOTES TO FINANCIAL STATEMENTS
56
NOTE 3. DEPOSITS AND INVESTMENTS (CONTINUED)
Fair Value Measurements (Continued). The interest rate swap agreement is classified as an other asset as more fully described in Note 8. The fair value of the interest rate swap agreement classified as Level 2 of the fair value hierarchy is valued using an option-adjusted discounted cash flow model.
Custodial Credit Risk – Deposits. Custodial credit risk for deposits is the risk that, in the event of the failure of a depository financial institution, the County will not be able to recover deposits or will not be able to recover collateral securities that are in the possession of an outside party. State statutes require all deposits and investments (other than federal or state government instruments) to be collateralized by depository insurance, obligations of the U.S. government, or bonds of public authorities, counties, or municipalities. As of June 30, 2018, the County had no uncollateralized deposits. Custodial Credit Risk – Investments. Custodial credit risk for investments is the risk that, in the event of the failure of the counterparty, the County will not be able to recover the value of its investments or collateral securities that are in the possession of an outside party. State statutes require all investments (other than federal or state government instruments) to be collateralized by depository insurance, obligations of the U.S. government, or bonds of public authorities, counties, or municipalities. Macon-Bibb County Employee Pension Plan The Plan’s policy in regard to investments, including the allocation of invested assets, is established and may be amended by the Employees’ Pension Plan Board, subject to the Board of Commissioners’ approval. The Plan is authorized to invest in U.S. government obligations; U.S. government agency (or other corporation of the U.S. government) obligations; obligations fully insured or guaranteed by the U.S. government or a U.S. government agency; obligations of the State of Georgia or other states; collateralized mortgage obligations; asset and mortgage-backed securities; obligations of other counties, municipal corporations and political subdivisions of the State of Georgia or other states; negotiable certificates of deposit issued by any bank or trust company organized under the laws of any state of the United States of America; prime bankers’ acceptances; repurchase agreements; and pooled investment programs sponsored by the State of Georgia for the investment of local government funds. Additionally, the Plan is authorized to invest in common stocks, money market instruments, and corporate bonds and debentures, which are not in default as to principal and interest. The Plan investment policy adopts the following asset allocation mix to achieve the lowest level of risk for the Plan: Domestic equity securities 18%, fixed income investments 77%, and cash equivalents up to 5% of total asset mix.

NOTES TO FINANCIAL STATEMENTS
57
NOTE 3. DEPOSITS AND INVESTMENTS (CONTINUED)
Macon-Bibb County Employee Pension Plan (Continued) At June 30, 2018, the Plan had the following investments (in thousands):
Investment Maturities (in Years)Investment Type Rating Fair Value Less than 1 1 - 5 6 - 10 11 - 15
Common stock and ETFs NA $ 58,549 $ 58,549 $ - $ - $ - Corporate bonds A 2,947 - 2,441 346 - Corporate bonds A- 4,943 - 4,421 522 - Corporate bonds A+ 5,348 1,603 3,334 350 - Corporate bonds AA 397 27 - 81 - Corporate bonds AA- 297 - 158 50 - Corporate bonds AA+ 896 802 - - - Corporate bonds AAA 127 - - - - Corporate bonds BB+ 99 - - 99 - Corporate bonds BBB 1,400 - 552 734 30 Corporate bonds BBB- 331 - 77 179 10 Corporate bonds BBB+ 2,904 - 1,671 1,045 70 Government bonds A 137 - 137 - - Government bonds A+ 149 - 149 - - Government bonds AA 74 - 20 - - Government bonds AA- 48 - 48 - - Government bonds AA+ 3,228 - 1,361 273 - Government bonds AAA 1,934 - 1,107 - 81 Government bonds BB+ 30 - 30 - - Government bonds BBB 140 - 83 57 - Government bonds BBB- 60 - 60 - - Government bonds BBB+ 101 - 79 22 - Asset backed securities AA+ 1,701 - - - - Asset backed securities AAA 2,403 - 400 245 200 U.S. Treasury Notes AA+ 11,265 1,571 3,608 250 1,044 U.S. Treasury Notes AAA 5,678 - 1,567 4,111 - Georgia Fund 1 NA 3,060 3,060 - - - Total Fair Value $ 108,246 $ 65,612 $ 21,303 $ 8,364 $ 1,435

NOTES TO FINANCIAL STATEMENTS
58
NOTE 3. DEPOSITS AND INVESTMENTS (CONTINUED)
Macon-Bibb County Employee Pension Plan (Continued)
Investment Type 16 - 20 21 - 25 26 - 30 31 - 35 36 - 40Common stock and ETFs $ - $ - $ - $ - $ - Corporate bonds 72 88 - - - Corporate bonds - - - - - Corporate bonds 61 - - - - Corporate bonds - - 64 148 77 Corporate bonds - - - 38 51 Corporate bonds - 94 - - - Corporate bonds 75 52 - - - Corporate bonds - - - - - Corporate bonds - - 84 - - Corporate bonds 38 - 27 - - Corporate bonds 70 48 - - - Government bonds - - - - - Government bonds - - - - - Government bonds - 54 - - - Government bonds - - - - - Government bonds - 796 - 386 412 Government bonds 77 88 552 - 29 Government bonds - - - - - Government bonds - - - - - Government bonds - - - - - Government bonds - - - - - Asset backed securities 1,262 341 - - 98 Asset backed securities - 132 1,145 134 147 U.S. Treasury Notes 1,140 - 3,652 - - U.S. Treasury Notes - - - - - Georgia Fund 1 - - - - - Total Fair Value $ 2,795 $ 1,693 $ 5,524 $ 706 $ 814
Investment Maturities (in Years)
Credit Risk. It is the Plan’s policy to limit investments to either mutual fund equities or fixed income bonds. Domestic bonds are limited to those with ratings that meet or exceed investment grade as defined by Moody’s, S&P or Fitch. U.S. government Treasuries and Agency bonds are not classified by credit quality. Mutual funds invested in equities are also not classified by credit quality.
Concentration. On June 30, 2018, the Plan did not have any debt or equity investments in any organization, other than those issued by the U.S. government, which represented greater than 5% of plan fiduciary net position.

NOTES TO FINANCIAL STATEMENTS
59
NOTE 3. DEPOSITS AND INVESTMENTS (CONTINUED) Macon-Bibb County Employee Pension Plan (Continued)
Fair Value Measurements. The Plan has the following recurring fair value measurements, broken into the fair value hierarchy, as of June 30, 2018:
Investment Level 1 Level 2 Level 3 Fair Value Asset backed securities $ - $ 4,103 $ - $ 4,103 Common stock and ETFs 58,550 - - 58,550 Corporate bonds - 20,382 - 20,382 Government bonds - 5,207 - 5,207 U.S. Treasury Notes 16,944 - - 16,944
Total investments measured at fair value $ 75,494 $ 29,692 $ - 105,186
Investments not subject to level disclosure:
Georgia Fund 1 3,060 Total investments $ 108,246
Debt and equity securities classified in Level 1 of the fair value hierarchy are valued using prices quoted in active markets for those securities. Debt securities classified in Level 2 of the fair value hierarchy are valued using a matrix pricing technique. Matrix pricing is used to value securities based on the securities’ relationship to benchmark quoted prices. Rate of Return. For the year ended June 30, 2018, the annual money-weighted rate of return on Plan investments, net of Plan expenses, was 5.15%. The money-weighted rate of return expresses investment performance, net of investment expenses, adjusted for the changing amounts actually invested. Custodial Credit Risk – Deposits. Custodial credit risk for deposits is the risk that in the event of a bank failure, the Plan may not be able to recover its deposits.

NOTES TO FINANCIAL STATEMENTS
60
NOTE 3. DEPOSITS AND INVESTMENTS (CONTINUED)
Division A of the Macon-Bibb County Pension and Retirement Systems (former General
Employees Plan of the City of Macon) The Plan’s policy in regard to investments, including the allocation of invested assets, is established and may be amended by the Employees’ Pension Plan Board, subject to the Board of Commissioners’ approval. The Plan is authorized to invest in U.S. government obligations; U.S. government agency (or other corporation of the U.S. government) obligations; obligations fully insured or guaranteed by the U.S. government or a U.S. government agency; obligations of the State of Georgia or other states; collateralized mortgage obligations; asset and mortgage-backed securities; obligations of other counties, municipal corporations and political subdivisions of the State of Georgia or other states; negotiable certificates of deposit issued by any bank or trust company organized under the laws of any state of the United States of America; prime bankers’ acceptances; repurchase agreements; and pooled investment programs sponsored by the State of Georgia for the investment of local government funds. Additionally, the Plan is authorized to invest in common stocks, money market instruments, and corporate bonds and debentures, which are not in default as to principal and interest. The Plan investment policy adopts the following asset allocation mix to achieve the lowest level of risk for the Plan: Domestic equity securities 74%, fixed income investments 21%, and cash equivalents up to 5% of total asset mix. At June 30, 2018, the Plan had the following investments (in thousands):
Investment Maturities (in Years)Investment Type Rating Fair Value Less than 1 1 - 5 6 - 10 11 - 15
Common stock and ETFs NA $ 58,453 $ 58,453 $ - $ - $ - Corporate bonds A1 2,033 656 1,260 - - Corporate bonds A2 1,360 - 1,159 - 98 Corporate bonds A3 2,341 161 1,465 517 - Corporate bonds AA1 309 161 148 - - Corporate bonds AA2 584 143 441 - - Corporate bonds AA3 145 - 145 - - Corporate bonds AAA 1,269 - 1,163 - - Corporate bonds BAA1 2,064 290 1,048 726 - Corporate bonds BAA2 980 104 674 - - Corporate bonds BAA3 432 - 432 - - Government bonds AA 312 - 312 - - Government bonds AA2 205 205 - - - Government bonds AA3 507 251 256 - - Government bonds AAA 664 130 364 105 65 Government bonds NR 4,421 - 82 507 738 U.S. Treasury notes AAA 2,563 188 687 1,012 - Georgia Fund 1 NA 2,000 2,000 - - - Total Fair Value $ 80,642 $ 62,742 $ 9,636 $ 2,867 $ 901

NOTES TO FINANCIAL STATEMENTS
61
NOTE 3. DEPOSITS AND INVESTMENTS (CONTINUED)
Division A of the Macon-Bibb County Pension and Retirement Systems (former General
Employees Plan of the City of Macon) (Continued)
Investment Type 21 - 25 26 - 30
Common stock and ETFs $ - $ - Corporate bonds - 117 Corporate bonds 103 - Corporate bonds 198 - Corporate bonds - - Corporate bonds - - Corporate bonds - - Corporate bonds - 106 Corporate bonds - - Corporate bonds 102 100 Corporate bonds - - Government bonds - - Government bonds - - Government bonds - - Government bonds - - Government bonds 143 2,951 U.S. Treasury notes 466 210 U.S. Treasury notes - - Total Fair Value $ 1,012 $ 3,484
Credit Risk. It is the Plan’s policy to limit investments to either mutual fund equities or fixed income bonds. Domestic bonds are limited to those with ratings that meet or exceed investment grade as defined by Moody’s, S&P or Fitch. U.S. government Treasuries and Agency bonds are not classified by credit quality. Mutual funds invested in equities are also not classified by credit quality.
Concentration. On June 30, 2018, the Plan did not have any debt or equity investments in any organization, other than those issued by the U.S. government, which represented greater than 5% of plan fiduciary net position.

NOTES TO FINANCIAL STATEMENTS
62
NOTE 3. DEPOSITS AND INVESTMENTS (CONTINUED)
Division A of the Macon-Bibb County Pension and Retirement Systems (former General
Employees Plan of the City of Macon) (Continued)
Fair Value Measurements. The Plan has the following recurring fair value measurements, broken into the fair value hierarchy, as of June 30, 2018:
Investment Level 1 Level 2 Level 3 Fair Value U.S. Treasury $ 2,563 $ - $ - $ 2,563 Common stock and ETFs 58,453 - - 58,453 Corporate bonds - 11,518 - 11,518 Government bonds - 6,108 - 6,108
Total investments measured at fair value $ 61,016 $ 17,626 $ - $ 78,642
Investments not subject to level disclosure:Georgia Fund 1 2,000 Total investments $ 80,642
Debt and equity securities classified in Level 1 of the fair value hierarchy are valued using prices quoted in active markets for those securities. Debt securities classified in Level 2 of the fair value hierarchy are valued using a matrix pricing technique. Matrix pricing is used to value securities based on the securities’ relationship to benchmark quoted prices. Rate of Return. For the year ended June 30, 2018, the annual money-weighted rate of return on Plan investments, net of Plan expenses, was 5.43%. The money-weighted rate of return expresses investment performance, net of investment expenses, adjusted for the changing amounts actually invested. Custodial Credit Risk – Deposits. Custodial credit risk for deposits is the risk that in the event of a bank failure, the Plan may not be able to recover its deposits. Macon-Bibb County Fire and Police Employees’ Retirement System
The Plan’s policy in regard to investments, including the allocation of invested assets, is established and may be amended by the Employees’ Pension Plan Board, subject to the Board of Commissioners’ approval. The Plan is authorized to invest in U.S. government obligations; U.S. government agency (or other corporation of the U.S. government) obligations; obligations fully insured or guaranteed by the U.S. government or a U.S. government agency; obligations of the State of Georgia or other states; collateralized mortgage obligations; asset and mortgage-backed securities; obligations of other counties, municipal corporations and political subdivisions of the State of Georgia or other states; negotiable certificates of deposit issued by any bank or trust company organized under the laws of any state of the United States of America; prime bankers’ acceptances; repurchase agreements; and pooled investment programs sponsored by the State of Georgia for the investment of local government funds. Additionally, the Plan is authorized to invest in common stocks, money market instruments, and corporate bonds and debentures, which are not in default as to principal and interest.

NOTES TO FINANCIAL STATEMENTS
63
NOTE 3. DEPOSITS AND INVESTMENTS (CONTINUED)
Macon-Bibb County Fire and Police Employees’ Retirement System (Continued)
The Plan investment policy adopts the following asset allocation mix to achieve the lowest level of risk for the Plan: Domestic equity securities 81%, fixed income investments 12%, and cash equivalents and other assets up to 7% of total asset mix. At June 30, 2018, the Plan had the following investments (in thousands):
Investment Maturities (in Years)Investment Type Rating Fair Value Less than 1 1 - 5 6 - 10 11 - 15
Mutual funds NA $ 161,566 $ 161,566 $ - $ - $ - Corporate bonds A - - - - - Corporate bonds A+ 1,281 - 648 600 - Corporate bonds A- 2,950 - 1,618 548 - Corporate bonds AA- 285 - - - - Corporate bonds BB 324 - - - - Corporate bonds BB+ 45 - - - - Corporate bonds BBB 2,761 - 245 1,384 37 Corporate bonds BBB- 5,094 - 205 4,119 - Corporate bonds BBB+ 1,647 40 - 683 - Government bonds AAA 11,989 - 46 89 903 Fixed income securities A- 63 - - - - - - Fixed income securities BB 236 - 236 - - - - Fixed income securities BBB 1,211 - 611 - 283 - - Fixed income securities BBB+ 1,081 - 352 - - - - Asset backed securities A 2,227 - 1,132 760 - Asset backed securities A- 898 - - - - Asset backed securities AAA 5,088 - - - 384 Asset backed securities A3 439 - - - - Asset backed securities Aa2 302 - 302 - - Asset backed securities Aa3 466 - - 466 - Asset backed securities BB 202 - - - - Asset backed securities BB+ 327 - - - - Asset backed securities BBB 1,137 - 417 210 111 Asset backed securities BBB- 760 - - - 309 Asset backed securities BBB+ 187 - - 187 - Asset backed securities Ba2 611 - - - - Asset backed securities Baa1 689 - - 289 - Asset backed securities Baa2 1,092 - - 1,092 - Asset backed securities Baa3 366 - - 201 - Asset backed securities NR 5,718 - - 880 - U.S. Treasury notes AA+ 7,617 363 5,196 869 - U.S. Treasury notes AAA 8,039 682 1,484 3,049 752 Total Fair Value $ 226,698 $ 162,651 $ 12,492 $ 15,709 $ 2,496
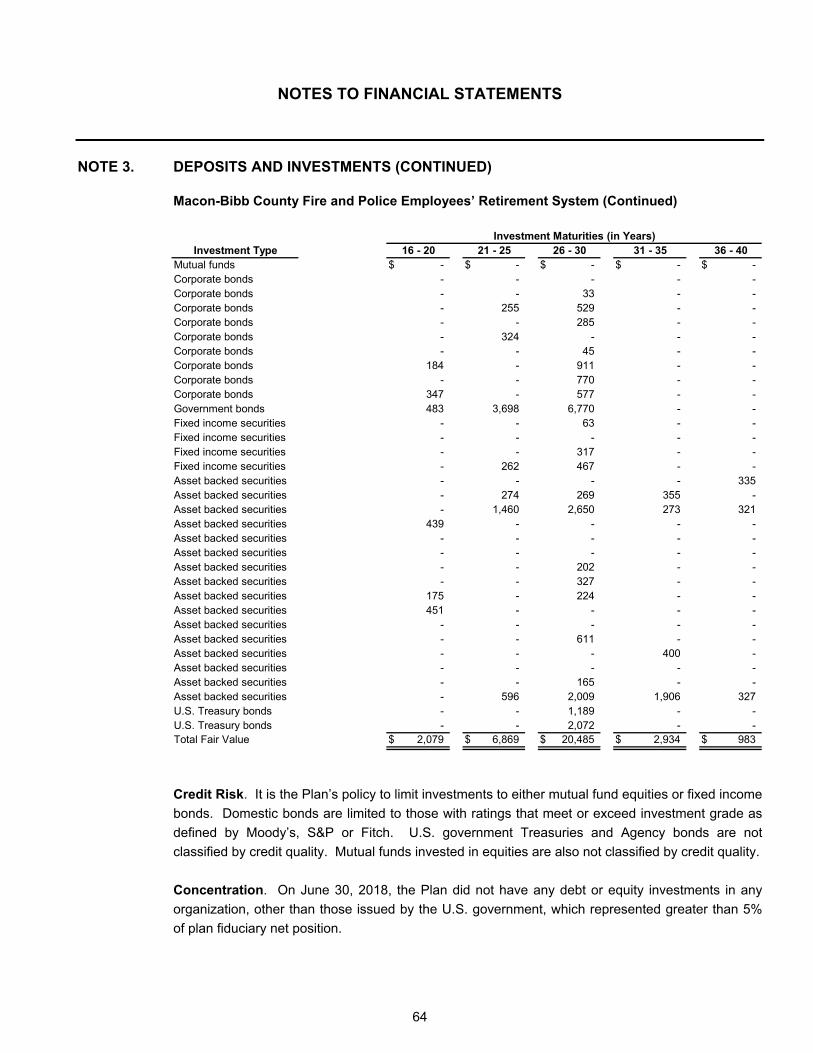
NOTES TO FINANCIAL STATEMENTS
64
NOTE 3. DEPOSITS AND INVESTMENTS (CONTINUED)
Macon-Bibb County Fire and Police Employees’ Retirement System (Continued)
Investment Maturities (in Years)
Investment Type 16 - 20 21 - 25 26 - 30 31 - 35 36 - 40Mutual funds $ - $ - $ - $ - $ - Corporate bonds - - - - - Corporate bonds - - 33 - - Corporate bonds - 255 529 - - Corporate bonds - - 285 - - Corporate bonds - 324 - - - Corporate bonds - - 45 - - Corporate bonds 184 - 911 - - Corporate bonds - - 770 - - Corporate bonds 347 - 577 - - Government bonds 483 3,698 6,770 - - Fixed income securities - - 63 - - Fixed income securities - - - - - Fixed income securities - - 317 - - Fixed income securities - 262 467 - - Asset backed securities - - - - 335 Asset backed securities - 274 269 355 - Asset backed securities - 1,460 2,650 273 321 Asset backed securities 439 - - - - Asset backed securities - - - - - Asset backed securities - - - - - Asset backed securities - - 202 - - Asset backed securities - - 327 - - Asset backed securities 175 - 224 - - Asset backed securities 451 - - - - Asset backed securities - - - - - Asset backed securities - - 611 - - Asset backed securities - - - 400 - Asset backed securities - - - - - Asset backed securities - - 165 - - Asset backed securities - 596 2,009 1,906 327 U.S. Treasury bonds - - 1,189 - - U.S. Treasury bonds - - 2,072 - - Total Fair Value $ 2,079 $ 6,869 $ 20,485 $ 2,934 $ 983
Credit Risk. It is the Plan’s policy to limit investments to either mutual fund equities or fixed income bonds. Domestic bonds are limited to those with ratings that meet or exceed investment grade as defined by Moody’s, S&P or Fitch. U.S. government Treasuries and Agency bonds are not classified by credit quality. Mutual funds invested in equities are also not classified by credit quality. Concentration. On June 30, 2018, the Plan did not have any debt or equity investments in any organization, other than those issued by the U.S. government, which represented greater than 5% of plan fiduciary net position.

NOTES TO FINANCIAL STATEMENTS
65
NOTE 3. DEPOSITS AND INVESTMENTS (CONTINUED)
Macon-Bibb County Fire and Police Employees’ Retirement System (Continued)
Fair Value Measurements. The Plan has the following recurring fair value measurements, broken into the fair value hierarchy, as of June 30, 2018:
Investment Level 1 Level 2 Level 3 Fair Value
Mutual funds $ 161,566 $ - $ - $ 161,566 Corporate bonds - 16,973 - 16,973 Government bonds - 11,991 - 11,991 U.S. Treasury notes 15,657 - - 15,657 Asset backed securities - 20,511 - 20,511
Total investments measured at fair value $ 177,223 $ 49,475 $ - $ 226,698
Debt and equity securities classified in Level 1 of the fair value hierarchy are valued using prices quoted in active markets for those securities. Debt securities classified in Level 2 of the fair value hierarchy are valued using a matrix pricing technique. Matrix pricing is used to value securities based on the securities’ relationship to benchmark quoted prices. Rate of Return. For the year ended June 30, 2018, the annual money-weighted rate of return on Plan investments, net of Plan expenses, was 8.56%. The money-weighted rate of return expresses investment performance, net of investment expenses, adjusted for the changing amounts actually invested. Custodial Credit Risk – Deposits. Custodial credit risk for deposits is the risk that in the event of a bank failure, the Plan may not be able to recover its deposits.

NOTES TO FINANCIAL STATEMENTS
66
NOTE 3. DEPOSITS AND INVESTMENTS (CONTINUED)
Macon-Bibb County Other Post-employment Benefit Plan
The Plan’s policy in regard to investments, including the allocation of invested assets, is established and may be amended by the Board of Commissioners. The Plan is authorized to invest in U.S. government obligations; U.S. government agency (or other corporation of the U.S. government) obligations; obligations fully insured or guaranteed by the U.S. government or a U.S. government agency; obligations of the State of Georgia or other states; collateralized mortgage obligations; asset and mortgage-backed securities; obligations of other counties, municipal corporations and political subdivisions of the State of Georgia or other states; negotiable certificates of deposit issued by any bank or trust company organized under the laws of any state of the United States of America; prime bankers’ acceptances; repurchase agreements; and pooled investment programs sponsored by the State of Georgia for the investment of local government funds. Additionally, the Plan is authorized to invest in common stocks, money market instruments, and corporate bonds and debentures, which are not in default as to principal and interest. See also Note 11: Post-Employment Health Care Benefits. At June 30, 2018, the Plan had the following investments (in thousands):
Investment Maturities (in Years)Investment Type Rating Fair Value Less than 1 1 - 5 6 - 10
Corporate bonds A1 $ 57 $ - $ 19 $ 38 Corporate bonds A2 44 - 44 - Corporate bonds A3 20 - - 20 Corporate bonds AA1 19 - 19 - Corporate bonds AA2 44 - 44 - Corporate bonds AAA 44 - 24 20 Corporate bonds BAA2 19 - 19 - Government bonds A1 63 - 30 33 Government bonds AA 36 - - 36 Government bonds AA1 31 - 31 - Government bonds AA2 62 - 62 - Government bonds AA3 30 - 30 - Government bonds AAA 106 - 78 28 Asset backed securities NR 72 - 31 41 Total Fair Value $ 647 $ - $ 431 $ 216

NOTES TO FINANCIAL STATEMENTS
67
NOTE 3. DEPOSITS AND INVESTMENTS (CONTINUED)
Macon-Bibb County Other Post-employment Benefit Plan (Continued)
Credit Risk. It is the Plan’s policy to limit investments to either mutual fund equities or fixed income bonds. Domestic bonds are limited to those with ratings that meet or exceed investment grade as defined by Moody’s, S&P or Fitch. U.S. government Treasuries and Agency bonds are not classified by credit quality. Mutual funds invested in equities are also not classified by credit quality.
Concentration. On June 30, 2018, the Plan did not have any debt or equity investments in any organization, other than those issued by the U.S. government, which represented greater than 5% of plan fiduciary net position.
Fair Value Measurements. The Plan has the following recurring fair value measurements, broken into the fair value hierarchy, as of June 30, 2018:
Investment Level 1 Level 2 Level 3 Fair Value
Asset backed securities $ - $ 72 $ - $ 72 Corporate bonds - 247 - 247 Government bonds - 328 - 328
Total investments measured at fair value $ - $ 647 $ - $ 647
Debt and equity securities classified in Level 1 of the fair value hierarchy are valued using prices quoted in active markets for those securities. Debt securities classified in Level 2 of the fair value hierarchy are valued using a matrix pricing technique. Matrix pricing is used to value securities based on the securities’ relationship to benchmark quoted prices. Rate of Return. For the year ended June 30, 2018, the annual money-weighted rate of return on Plan investments, net of Plan expenses, was approximately 3.92%. The money-weighted rate of return expresses investment performance, net of investment expenses, adjusted for the changing amounts actually invested. Custodial Credit Risk – Deposits. Custodial credit risk for deposits is the risk that in the event of a bank failure, the Plan may not be able to recover its deposits.

NOTES TO FINANCIAL STATEMENTS
68
NOTE 4. TAX REVENUE
Property Tax State law requires that property taxes be based on assessed value, which is 40% of market value. All real and personal property (including motor vehicles) are valued as of January 1 of each year and must be returned for tax purposes by March 1. With the exception of motor vehicles and the property of public utilities, which are valued by the State Revenue Department, all assessments are made by the Board of Tax Assessors of Macon-Bibb County. This board has five members appointed by the Macon-Bibb County Board of Commissioners for staggered six-year terms. Upon completion of all assessments and tax returns, the information is turned over to the Macon-Bibb County Tax Commissioner for compilation of the tax digest. The completed tax digest must be submitted to the State Revenue Commissioner for approval. The State Revenue Commissioner must ascertain that real property on the tax digest has been assessed at the state mandated 40% of fair market value. The State Revenue Commissioner has the option to withhold certain state funding if the mandated 40% level is not reached. The Macon-Bibb County Tax Commissioner distributes tax notices and collects tax payments. Motor vehicle taxes are due based upon the birthday of the owner. Property taxes are usually billed in August of each year. Real and personal property taxes may be paid in two installments – the first payment is due 30 days following the mailing of the bills and the final payment is due 60 days following the mailing of the bills. Tax executions are issued for delinquent taxes approximately 90 days following the due date of the second installment. The property tax calendar for the most recent digest is as follows:
Real/PersonalProperty Motor
(Excluding Vehicles) Vehicles
Assessment date January 1, 2017 January 1Levy date August 18, 2017 January 1Due date and collection date October 16, 2017 Staggered
and November 15, 2017Tax execution date/lien date May 18, 2018 N/A
Hotel/Motel Excise Tax
A summary of the hotel/motel excise tax expenditures and receipts for the year ended June 30, 2018, is as follows:
Expenditure by Purpose Amount Tax Receipts Percentage
Culture and recreation $ 4,203,930 $ 4,203,930 100 %

NOTES TO FINANCIAL STATEMENTS
69
NOTE 5. OTHER RECEIVABLES
All trade and property tax receivables have been reduced to their estimated net realizable value, and are shown net of an allowance for uncollectible accounts. Estimated uncollectible accounts are based upon historical experience rates. Receivables as of the period end for the County’s individual major funds, and nonmajor, and internal service in the aggregate are as follows:
SPLOST NonmajorGeneral Solid Waste Airport
Fund Fund Fund Fund FundsReceivables:Taxes $ 9,818,476 $ - $ - $ - $ 397,755 Special assessments 7,547 - - - - Accounts 1,276,972 11,148,097 52,739 1,355 910,129 Accrued interest 16,742 - - - - Gross receivable 11,119,737 11,148,097 52,739 1,355 1,307,884 Less: allowance for
uncollectibles (4,856,062) (3,326,705) (8,240) - - Net total receivables $ 6,263,675 $ 7,821,392 $ 44,499 $ 1,355 $ 1,307,884
2018 and Other
NOTE 6. DUE FROM OTHER GOVERNMENTS
The principal amounts due from other governments represent: (a) federal government - grant program reimbursements, and (b) state government - project reimbursements. No allowance is deemed necessary for these receivables. Amounts receivable from other governments as of period end for the County's individual major funds and non-major funds in the aggregate are as follows:
SPLOST NonmajorGeneral 2012 Fund SPLOST Solid Waste and Other
Fund City 2018 Fund Funds
Federal $ 343,089 $ - $ - $ 2,175,791 $ 646,035 State 2,750,277 255,804 2,827,806 - 918,629 Other 189,528 - - - 80,209 Net receivables $ 3,282,894 $ 255,804 $ 2,827,806 $ 2,175,791 $ 1,644,873

NOTES TO FINANCIAL STATEMENTS
70
NOTE 7. CAPITAL ASSETS
Capital asset activity for the primary government for the fiscal year ended June 30, 2018, was as follows: Internal service funds predominately serve the governmental funds. Accordingly, capital assets for the internal service funds are included as part of the below totals for governmental activities. At year-end, internal service fund capital assets with a net book value of $174,408 are included in the amounts below.
Beginning Ending Balance Increases Decreases Transfers Balance
Governmental activitiesCapital assets, not
being depreciated:Land $ 50,189,531 $ 600,761 $ (138,652) $ - $ 50,651,640 Construction in progress 58,087,573 19,389,107 - (30,973,378) 46,503,302
Total capital assets, not being depreciated 108,277,104 19,989,868 (138,652) (30,973,378) 97,154,942
Capital assets, being depreciated:Buildings 139,997,412 - (4,116,378) 5,499,525 141,380,559 Building improvements 19,922,044 640,485 - 13,639,191 34,201,720 Land improvements 14,162,947 640,009 - 2,723,706 17,526,662 Machinery and equipment 28,651,304 1,000,181 (895,878) 279,079 29,034,686 Vehicles 45,793,645 391,800 (874,222) (19,758) 45,291,465 Furnitures and fixtures 41,585 - - - 41,585 Infrastructure 435,607,206 - - 8,831,877 444,439,083
Total capital assets, being depreciated 684,176,143 2,672,475 (5,886,478) 30,953,620 711,915,760
Less accumulateddepreciation for:Buildings (69,726,647) (3,159,039) 3,071,946 - (69,813,740) Building improvements (10,834,865) (1,530,128) - - (12,364,993) Land improvements (3,391,005) (1,348,943) - - (4,739,948) Machinery and equipment (16,275,353) (2,281,154) 895,878 - (17,660,629) Vehicles (36,784,978) (2,164,298) 852,464 19,758 (38,077,054) Furnitures and fixtures (41,586) - - - (41,586) Infrastructure (342,436,363) (5,735,943) - - (348,172,306)
Total accumulated depreciation (479,490,797) (16,219,505) 4,820,288 19,758 (490,870,256) Total capital assets, being
depreciated, net 204,685,346 (13,547,030) (1,066,190) 30,973,378 221,045,504
Governmental activities capital assets, net $ 312,962,450 $ 6,442,838 $ (1,204,842) $ - $ 318,200,446

NOTES TO FINANCIAL STATEMENTS
71
NOTE 7. CAPITAL ASSETS (CONTINUED)
Beginning Ending Balance Increases Decreases Transfers Balance
Business-type activitiesCapital assets, not
being depreciated:Land $ 7,639,561 $ - $ - $ - $ 7,639,561 Earthen Dam 2,625,294 - - - 2,625,294 Construction in progress 89,346 451,618 - (243,691) 297,273
Total capital assets, notbeing depreciated 10,354,201 451,618 - (243,691) 10,562,128
Capital assets, being depreciated:Land improvements 8,783,074 - - - 8,783,074 Dam improvements 1,944,834 139,170 - - 2,084,004 Buildings 25,697,163 444,031 - - 26,141,194 Building improvements 941,458 - - - 941,458 Infrastructure 7,197,161 - - - 7,197,161 Machinery and equipment 3,056,955 516,544 (124,300) 243,691 3,692,890 Vehicles 8,584,068 661,771 (351,029) 19,758 8,914,568 Furnitures and fixtures 2,313,079 - - - 2,313,079
Total capital assets, being depreciated 58,517,792 1,761,516 (475,329) 263,449 60,067,428
Less accumulateddepreciation for:Land improvements (2,475,651) (268,718) - - (2,744,369) Dam improvements (1,311,340) (62,229) - - (1,373,569) Buildings (13,994,915) (680,416) - - (14,675,331) Building improvements (554,159) (56,955) - - (611,114) Infrastructure (2,039,723) (275,285) - - (2,315,008) Machinery and equipment (2,837,686) (156,881) 124,300 - (2,870,267) Vehicles (7,283,757) (249,644) 351,029 (19,758) (7,202,130) Furnitures and fixtures (1,813,288) (183,627) - - (1,996,915)
Total accumulated depreciation (32,310,519) (1,933,755) 475,329 (19,758) (33,788,703) Total capital assets, being
depreciated, net 26,207,273 (172,239) - 243,691 26,278,725
Business-type activitiescapital assets, net $ 36,561,474 $ 279,379 $ - $ - $ 36,840,853

NOTES TO FINANCIAL STATEMENTS
72
NOTE 7. CAPITAL ASSETS (CONTINUED)
Depreciation expense was charged to functions/programs of the primary government as follows: Governmental activities:
General government $ 2,988,135 Judicial 199,307 Public safety 4,831,704 Public works 6,245,309 Health and welfare 95,559 Culture and recreation 1,820,843 Housing and development 4,722 Internal service funds 33,926
Total depreciation expense - governmental activities $ 16,219,505
Business-type activities:Tobesofkee Recreation Fund $ 197,449 Solid Waste Fund 355,404 Airport Fund 620,756 Coliseum Fund 711,475 Mulberry Street Parking Garage Fund 8,791 Bowden Golf Course Fund 39,880
Total depreciation expense - business-type activities $ 1,933,755

NOTES TO FINANCIAL STATEMENTS
73
NOTE 8. LONG-TERM DEBT
A. General Obligation Bonds
The County periodically issues general obligation bonds to provide funds for the acquisition and construction of major capital facilities. General obligation bonds are direct obligations and pledge the full faith and credit of the government. The general obligation bonds outstanding at period end are as follows: Governmental activities:Payable from SPLOST 2012 Fund County
$ 4,175,000
Payable from SPLOST 2012 Fund City
3,700,000
Payable from 2018 SPLOST Fund
35,000,000
Payable from 2017 Tax Allocation Refunding and Improvement Bond
3,174,278
Total General Obligation Bonds - governmental activities $ 46,049,278
$20,000,000 2012 Bibb County General Obligation Sales Tax Bonds due inannual principal installments of $275,000 to $4,175,000 beginning December1, 2013. Interest at 2.0% to 4.0% to be paid each June 1 and December 1,commencing December 1, 2012.
$18,000,000 Series 2012 General Obligation Bonds due in annual principalinstallments of $250,000 to $3,700,000 beginning December 1, 2013. Interestat 2.0% to 3.0% is to be paid each June 1 and December 1, commencingJune 1, 2012.
$4,950,000 2017 Bibb County Tax Allocation Refunding and ImprovementBond due in annual principal installments of $265,000 to $405,000 beginningDecember 1, 2018. Bond funds are available to be drawn down as needed notto exceed the issue amount. Interest at 2.72% to be paid annually onDecember 1, commencing December 1, 2032.
$35,000,000 2017 Bibb County General Obligation Sales Tax Bonds due inannual principal installments of $2,875,000 to $4,290,000 beginningDecember 1, 2018. Interest at 2.0% to 5.0% to be paid each June 1 andDecember 1, commencing December 1, 2017.

NOTES TO FINANCIAL STATEMENTS
74
NOTE 8. LONG-TERM DEBT (CONTINUED)
A. General Obligation Bonds (Continued)
Proceeds from the Bibb County Series 2012 (General Obligation Sales Tax Bonds) were used to provide funds for various capital outlay projects included in the special 1% sales and use tax referendum approved by Bibb County voters in November 2011.
Proceeds from the Series 2012 General Obligation Bonds were used to finance the costs of acquiring, constructing, and equipping certain capital outlay projects of the former City of Macon included in the special 1% sales and use tax referendum approved by City of Macon voters in 2011.
Proceeds from the Series 2018 (General Obligation Sales Tax Bonds) were used to provide funds for various capital outlay projects included in the special 1% sales and use tax referendum approved by Bibb County voters in November 2016.
Proceeds from the Macon-Bibb County Tax Allocation Refunding and Improvement Series 2017 were used to refund the outstanding Series 2014 Bond and to pay for the improvements within the Second Street TAD-2 project. The economic loss (the difference between the present value of the debt service payments on the old and the new debt) was $144,861. The County is contractually obligated to make the necessary payment of principal and interest on this issue.
Annual debt service to maturity requirements for governmental activity general obligation bonds (excluding unamortized bond premium of $5,348,454) are as follows:
Fiscal Total DebtYear Service Principal Interest2019 $ 12,839,085 $ 11,015,000 $ 1,824,085 2020 4,781,692 3,205,000 1,576,692 2021 4,774,519 3,355,000 1,419,519 2022 4,774,142 3,520,000 1,254,142 2023 4,786,218 3,690,000 1,096,218
2024-2028 23,798,573 21,135,000 2,663,573 2029-2033 131,047 129,278 1,769
$ 55,885,276 $ 46,049,278 $ 9,835,998

NOTES TO FINANCIAL STATEMENTS
75
NOTE 8. LONG-TERM DEBT (CONTINUED)
B. Revenue Bonds
The County also issues bonds where the County pledges income derived from the acquired or constructed assets to pay debt service. Revenue bonds outstanding at period-end are as follows: Governmental activities:Payable from General Fund
$ 8,250,000
4,330,000
1,995,000
7,845,000
12,190,000
6,240,000
(Continued)
$8,250,000 Series 2015 Macon-Bibb County Industrial Authority RefundingRevenue Bond Issue (Bass Pro and Sofkee Park Project) due in annualprincipal installments of $565,000 to $1,055,000 commencing December 1,2019. Interest at 1.65% to 4.0% to be paid semi-annually on June 1 andDecember 1, commencing December 1, 2015.
$11,175,000 2010 Macon-Bibb County Urban Development Authority BondIssue (Revenue Refunding) due in annual principal installments of $310,000to $1,130,000 commencing October 1, 2011. Interest at 2.0% to 3.0% to bepaid each April 1 and October 1.
$3,225,000 2013B Macon-Bibb County Urban Development Authority BondIssue (Public Projects) due in annual principal installments of $605,000 to$690,000 commencing June 1, 2018. Interest at 3.0% to 4.0% to be paideach June 1 and December 1.
$10,945,000 Series 2007 Hotel Revenue Bond issue due in annual principalinstallments of $285,000 to $580,000 commencing October 1, 2010. Interestat 4.0% to 4.625% to be paid each October 1 and April 1.
$12,190,000 2015A Macon-Bibb County Urban Development AuthorityTaxable Refunding and Improvement Revenue Bonds due in annual principalinstallments of $225,000 to $985,000 commencing December 1, 2019.Interest is variable to be paid each June 1 and December 1, commencingDecember 1, 2015.
$6,240,000 2015B Macon-Bibb County Urban Development AuthorityRefunding and Improvement Revenue Bonds due in annual principalinstallments of $85,000 to $600,000 commencing December 1, 2019. Interestis variable to be paid each June 1 and December 1, commencing December1, 2015.

NOTES TO FINANCIAL STATEMENTS
76
NOTE 8. LONG-TERM DEBT (CONTINUED)
B. Revenue Bonds (Continued)
Governmental activities:Payable from General Fund (Continued)
$ 3,985,910
2,000,000
14,965,000
3,285,000
Total Revenue Bonds - governmental activities $ 65,085,910
$4,430,431 2016A Macon-Bibb County Urban Development Authority TaxableRevenue Bonds (Urban Development Concepts, LLC Project) due in annualprincipal installments of $217,668 to $388,248 commencing December 1,2016. Interest at 4.22% to be paid each June 1 and December 1,commencing June 1, 2016.
$2,000,000 2016B Macon-Bibb County Urban Development Authority TaxableRevenue Bonds (Urban Development Concepts, LLC Project). Bond funds areavailable to be drawn down as needed not to exceed the issue amount. Alloutstanding principal is due December 1, 2018. Interest at 3.45% onoutstanding draws is due each June 1 and December 1, commencing June 1,2016.
$14,965,000 2017A Macon-Bibb County Urban Development Authority TaxExempt Refunding Revenue Bonds due in annual principal installments of$800,000 to $2,105,000 commencing December 1, 2021. Interest at 3.00% to5.00% to be paid each June 1 and December 1, commencing December 1,2017.
$3,285,000 2017B Macon-Bibb County Urban Development Authority TaxableRefunding Revenue Bonds Bonds due in annual principal installments of$190,000 to $1,090,000 commencing December 1, 2018. Interest at 2.00% to3.00% to be paid each June 1 and December 1, commencing December 1,
The $8,250,000 Series 2015 Macon-Bibb County Industrial Authority Refunding Revenue Bond Issue (Bass Pro and Sofkee Park Projects) was used to restructure the Series 2009 Macon-Bibb County Industrial Authority Revenue Bond Issue (Bass Pro and Sofkee Park Project). The County is contractually obligated to make the necessary payment of principal and interest on this issue. The $1,210,000 2002B Macon-Bibb County Urban Development Authority Bond Issues were used to finance improvements to the Department of Family and Children Services facilities, redeem a 1992 Bond Issue, and finance expenses for acquisition and construction of park improvements. The County is contractually obligated to make the necessary payment of principal and interest on this issue. The $6,240,000 Series 2009 Macon-Bibb County Urban Development Authority Revenue Bond Issue (Public Projects) was used to finance renovations to the Bibb County courthouse and reimburse costs for the acquisition of land and to pay architectural and other fees and expenses related to the location and development of a new Justice Center. The County is contractually obligated to make the necessary payment of principal and interest on this issue.

NOTES TO FINANCIAL STATEMENTS
77
NOTE 8. LONG-TERM DEBT (CONTINUED)
B. Revenue Bonds (Continued)
The $11,175,000 Series 2010 Macon-Bibb County Urban Development Authority Revenue Bond Issue (Revenue Refunding) was used to refund and redeem Macon-Bibb County Urban Development Authority Bond Issues Series 1993, Series 1996 and Series 2000. The County is contractually obligated to make the necessary payment of principal and interest on this issue. The $10,000,000 Series 2013A and $3,225,000 Series 2013B Macon-Bibb County Urban Development Authority Revenue Bond Issue (Public Projects) were used to finance the costs of the acquisition of land and the construction and equipping of certain capital outlay projects of the County and the Macon-Bibb County Urban Development Authority. The County is contractually obligated to make the necessary payment of principal and interest on these issues. The $7,860,000 Series 2002A and $4,165,000 Series 2002B Macon-Bibb County Urban Development Authority Revenue Bond Issue (City Projects) were used to aid in redevelopment projects within the central business district of Macon, Georgia. The County is contractually obligated to make the necessary payment of principal and interest on these issues. The $10,945,000 Series 2007 Hotel Revenue Bond Issue was used to aid in construction of a new hotel and convention center within the City of Macon. The County is contractually obligated to make the necessary payment of principal and interest on this issue. The $12,190,000 2015A Macon-Bibb County Urban Development Authority Taxable Refunding and Improvement Revenue Bonds were issued to advance refund certain maturities of the Macon-Bibb County Urban Development Authority’s outstanding Series 2007 and Series 2013B Revenue Bonds, pay the costs of general county blight removal and pay the costs of issuance of the Series 2015A Bonds. The County is contractually obligated to make the necessary payment of principal and interest on this issue. The $6,240,000 2015B Macon-Bibb County Urban Development Authority Refunding and Improvement Revenue Bonds were issued to advance refund certain maturities of the Macon-Bibb County Urban Development Authority’s outstanding Series 2013A Revenue Bonds, to pay the costs of construction and equipping of public infrastructure, including sidewalks, lighting and paving within Macon-Bibb County and to pay the costs of issuance of the Series 2015B Bonds. The County is contractually obligated to make the necessary payment of principal and interest on this issue. The $4,430,431 2016A and $2,000,000 2016B Macon-Bibb County Urban Development Authority Taxable Revenue Bonds were issued to provide funds to finance all or a portion of the costs of refunding the Development Authority of Bibb County Revenue Bonds (Urban Development Concepts, LLC) Series 2012, fund certain Authority projects, pay interest on the Series 2016 Bonds, fund the debt service reserve fund and pay the cost of issuance. The County is contractually obligated to make the necessary payments of principal and interest on these issues.

NOTES TO FINANCIAL STATEMENTS
78
NOTE 8. LONG-TERM DEBT (CONTINUED)
B. Revenue Bonds (Continued)
The $14,965,000 2017A and $3,285,000 2017B Macon-Bibb County Urban Development Authority Revenue Bonds were issued to provide funds to finance the costs of refunding the Macon-Bibb County Urban Development Authority of Bibb County Revenue Bonds Series 2002B, Series 2009, and Series 2013A and pay the cost of issuance. The economic gain (the difference between the present value of the debt service payments on the old and the new debt) was $1,195,731. The County is contractually obligated to make the necessary payments of principal and interest on these issues. Annual debt service requirements to maturity for governmental activity revenue bonds (excluding unamortized bond premiums and discounts totaling $3,388,442) are as follows:
Fiscal Total DebtYear Service Principal Interest2019 $ 6,638,868 $ 4,136,427 $ 2,502,441 2020 6,659,190 4,281,404 2,377,786 2021 6,809,375 4,561,802 2,247,573 2022 6,797,693 4,712,639 2,085,054 2023 6,032,294 4,128,933 1,903,361
2024-2028 25,597,391 18,616,487 6,980,904 2029-2033 18,143,055 14,703,218 3,439,837 2034-2038 9,450,951 8,360,000 1,090,951
2039 1,616,678 1,585,000 31,678 $ 87,745,495 $ 65,085,910 $ 22,659,585
C. Certificates of Participation In June 1998, the County entered into a lease pool agreement with the Georgia Municipal Association (the “Association”). The funding of the lease pool was provided by the issuance of $150,126,000 Certificates of Participation by the Association. The Association passed the net proceeds through to the participating governments with the County's participation totaling $13,452,000. The lease pool agreement with the Association provides that the County owns their portion of the assets invested by the pool and is responsible for the payment of their portion of the principal and interest of the Certificates of Participation. The principal is due in a lump sum payment on June 1, 2028. Interest is payable at a rate of 4.75% each year. The County draws from the investment to lease equipment from the Association. The lease pool agreement requires the County to make lease pool payments back into its investment account to fund the principal and interest requirements of the 1998 Georgia Municipal Association Certificates of Participation.

NOTES TO FINANCIAL STATEMENTS
79
NOTE 8. LONG-TERM DEBT (CONTINUED)
C. Certificates of Participation (Continued)
As part of the issuance of the Certificates of Participation, the County entered into an interest rate swap agreement (the “Swap Agreement”). Under the Swap Agreement, the County is required to pay: (1) a semi-annual (and beginning July 1, 2003, a monthly) floating rate of interest based on the Securities Industry and Financial Markets Association (SIFMA) Municipal Swap Index (plus a 31 basis points spread) to, or on behalf of, the Swap Counterparty (the “Swap Payment”); and the Swap Counterparty will pay to, or on behalf of, the County a semi-annual payment based on a rate equal to the fixed rate on the Certificates of Participation (4.75%) times a notional amount specified in the Swap Agreement, but generally equal to the outstanding unpaid principal portion of such contract, less the amount originally deposited in the Reserve Fund relating to the contract, and (2) a one-time Swap Premium to be paid on the effective date of the Swap Agreement. The semi-annual payments from the Swap Counterparty with respect to the County are structured, and expected, to be sufficient to make all interest payments due under the contract, and related distributions of interest on the Certificates. Monthly interest payments between the County, the holders of the Certificates of Participation, and the Swap Counterparty can be made in net settlement form as part of this agreement. Under the Swap Agreement, the County’s obligation to pay floating payments to the Swap Counterparty in any calendar year may not exceed an amount equal to the SIFMA Municipal Swap Index plus 5% to be determined on the first business day of December in the preceding year. This agreement matures on June 1, 2028, at the same time of the Certificates of Participation. This derivative qualifies as a fair market hedge. In the unlikely event that the Swap Counterparty becomes insolvent, or fails to make payments as specified in the Swap Agreement, the County would be exposed to credit risk in the amount of the Swap’s fair value. To minimize this risk, the County executed this agreement with counterparties of appropriate credit strength, with the counterparty being rated Aa1 by Moody’s. At June 30, 2018, the floating rate being paid by the County is 0.33% and the market value of this agreement is $2,673,640, a decrease of $1,009,070 from the market value at June 30, 2017. The market value of the hedge was determined using settlement prices at the end of the day on June 30, 2018 based on the derivative contract. This market value is reported as an asset in the statement of net position. As this derivative is an effective hedge, qualifying for hedge accounting, the inflow from the hedge (any change in fair value from inception until fiscal period end) is deferred and reported as deferred inflows in the statement of net position. The hedge derivative instrument referenced above is the County’s sole derivative instrument and is recorded as part of governmental activities on the Statement of Net Position.

NOTES TO FINANCIAL STATEMENTS
80
NOTE 8. LONG-TERM DEBT (CONTINUED)
C. Certificates of Participation (Continued)
Annual debt service requirements to maturity for the Certificates of Participation are as follows:
Fiscal Total DebtYear Service Principal Interest2019 $ 638,970 $ - $ 638,970 2020 638,970 - 638,970 2021 638,970 - 638,970 2022 638,970 - 638,970 2023 638,970 - 638,970
2024-2028 16,327,365 13,452,000 2,875,365 $ 19,522,215 $ 13,452,000 $ 6,070,215
D. Capital Leases
The County has obtained several leases through a local financial institution to finance the acquisition of various equipment. The leasing arrangement is structured in a way that requires the County to first expend the money for purchase of the assets. The lease proceeds are then remitted to the County by the financial institution and the lease agreement begins. The following is a schedule of future minimum lease payments for the financial institution leases together with the present value of net minimum lease payments as of June 30, 2018, (governmental activities; Solid Waste Management Fund - proprietary funds):
GovernmentalActivities
2019 286,544$ 2020 290,2802021 150,9352022 150,9352023 100,552Total minimum lease payments 979,246Less amount representing interest (65,302)Present value of future minimum lease payments 913,944$

NOTES TO FINANCIAL STATEMENTS
81
NOTE 8. LONG-TERM DEBT (CONTINUED)
D. Capital Leases (Continued)
Business-type Activities
2019 83,624$ 2020 83,5942021 332,595Total minimum lease payments 499,813Less amount representing interest (37,715)Present value of future minimum lease payments 462,098$
The following is an analysis of leased assets under capital lease purchased with lease proceeds as of June 30, 2018, and amortization of these assets is included in the depreciation expense recorded in the respective governmental and business-type activities:
Governmental Business-typeActivities Activities
Vehicles $ 1,589,668 $ 593,378 Less: Accumulated depreciation (618,126) (89,007)
$ 971,542 $ 504,371
Machinery and equipment $ 469,667 $ - Less: Accumulated depreciation (46,967) -
$ 422,700 $ -

NOTES TO FINANCIAL STATEMENTS
82
NOTE 8. LONG-TERM DEBT (CONTINUED)
E. Closure/Post-closure Care Costs
The County owns and operates a landfill site located in Macon-Bibb County, Georgia. State and federal laws will require the County to close the landfill once its capacity is reached and to monitor and maintain the site for 30 subsequent years. The County recognizes a prorated portion of the closure and post-closure care costs in each operating period even though actual payouts will not occur until the landfill is closed. The amount recognized each year to date is based on the landfill capacity used as of the balance sheet date. As of June 30, 2018, the City has determined that it has used approximately 4,302,052 cubic yards out of a total available capacity of approximately 4,700,000 cubic yards which approximates 92% capacity used. Further, estimated costs of closure and post-closure care costs as determined at June 30, 2018, amount to approximately $19,850,000. Based on the above facts and estimated amounts, the City has recorded a liability of $18,790,000 which represents the amount of costs reported to date based on 92% of landfill capacity used to date as of June 30, 2018. The estimated costs of closure and post-closure care are subject to changes such as the effects of inflation, revision of laws and other variables. The estimated remaining life of the landfill is approximately 4.7 years.
F. Note Payable – Due to Component Unit
During fiscal year 2017, the County entered into an intergovernmental agreement with the Macon-Bibb County Urban Development Authority (MBCUDA) related to the renovations of a facility owned by the County. Under the terms of the agreement, the MBCUDA would oversee the project and secure outside financing to fund the construction costs. At the end of construction, the County would pay the debt service on the loan secured by the MBCUDA along with a 5% administrative fee. Payments, including the administrative fee are $16,034 per month and due and payable through fiscal year 2026. The total amount owed as of June 30, 2018 was $1,288,954.
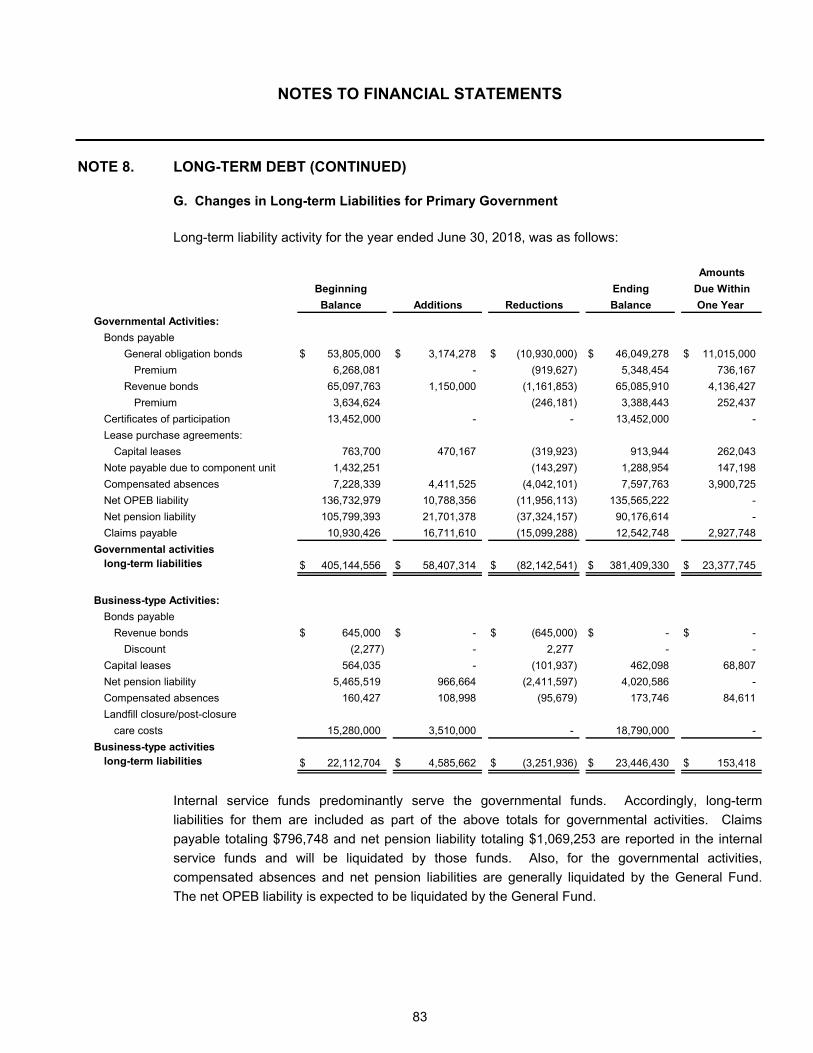
NOTES TO FINANCIAL STATEMENTS
83
NOTE 8. LONG-TERM DEBT (CONTINUED)
G. Changes in Long-term Liabilities for Primary Government
Long-term liability activity for the year ended June 30, 2018, was as follows:
Amounts
Beginning Ending Due Within
Balance Additions Reductions Balance One Year
Governmental Activities:
Bonds payableGeneral obligation bonds $ 53,805,000 $ 3,174,278 $ (10,930,000) $ 46,049,278 $ 11,015,000
Premium 6,268,081 - (919,627) 5,348,454 736,167 Revenue bonds 65,097,763 1,150,000 (1,161,853) 65,085,910 4,136,427
Premium 3,634,624 (246,181) 3,388,443 252,437 Certificates of participation 13,452,000 - - 13,452,000 - Lease purchase agreements:
Capital leases 763,700 470,167 (319,923) 913,944 262,043Note payable due to component unit 1,432,251 (143,297) 1,288,954 147,198Compensated absences 7,228,339 4,411,525 (4,042,101) 7,597,763 3,900,725 Net OPEB liability 136,732,979 10,788,356 (11,956,113) 135,565,222 - Net pension liability 105,799,393 21,701,378 (37,324,157) 90,176,614 - Claims payable 10,930,426 16,711,610 (15,099,288) 12,542,748 2,927,748
Governmental activities long-term liabilities $ 405,144,556 $ 58,407,314 $ (82,142,541) $ 381,409,330 $ 23,377,745
Business-type Activities:
Bonds payableRevenue bonds $ 645,000 $ - $ (645,000) $ - $ -
Discount (2,277) - 2,277 - - Capital leases 564,035 - (101,937) 462,098 68,807Net pension liability 5,465,519 966,664 (2,411,597) 4,020,586 - Compensated absences 160,427 108,998 (95,679) 173,746 84,611 Landfill closure/post-closure
care costs 15,280,000 3,510,000 - 18,790,000 - Business-type activities
long-term liabilities $ 22,112,704 $ 4,585,662 $ (3,251,936) $ 23,446,430 $ 153,418
Internal service funds predominantly serve the governmental funds. Accordingly, long-term liabilities for them are included as part of the above totals for governmental activities. Claims payable totaling $796,748 and net pension liability totaling $1,069,253 are reported in the internal service funds and will be liquidated by those funds. Also, for the governmental activities, compensated absences and net pension liabilities are generally liquidated by the General Fund. The net OPEB liability is expected to be liquidated by the General Fund.

NOTES TO FINANCIAL STATEMENTS
84
NOTE 9. INTERFUND RECEIVABLES, PAYABLES AND TRANSFERS
Interfund receivable and payable balances as of June 30, 2018, are as follows:
General SPLOST Solid Waste Airport Nonmajor NonmajorDue To Fund 2018 Fund Fund Governmental Enterprise Total
General Fund $ - $ 3,008,000 $ - $ 26,300 $ 849,364 $ 90,800 $ 3,974,464Solid Waste Fund 3,090,000 - - - - - 3,090,000 Nonmajor Governmental 6,344,000 - 291,662 - - 21,600 6,657,262 Nonmajor Enterprise 280,000 - - - - - 280,000 Internal Service 3,500,000 - - - - - 3,500,000
$ 13,214,000 $ 3,008,000 $ 291,662 $ 26,300 $ 849,364 $ 112,400 $ 17,501,726
Due From
The outstanding balances between funds result mainly from the time lag between the dates that: (1) interfund goods and services are provided or reimbursable expenditures occur, (2) transactions are recorded in the accounting system, and (3) payments between funds are made. These balances normally clear within one to two months. Any amounts payable to a governmental fund that relates to working capital loans that are deemed to be entirely collectible which are not scheduled to be collected in the subsequent year are considered to be advances. Advances as of June 30, 2018, are as follows:
Advances Receivable Fund Advances Payable Fund Amount
Solid Waste General $ 8,000,000

NOTES TO FINANCIAL STATEMENTS
85
NOTE 9. INTERFUND RECEIVABLES, PAYABLES AND TRANSFERS (CONTINUED)
Interfund transfers for the fiscal year ended June 30, 2018, consisted of the following:
SPLOST NonmajorTransfer To 2018 Governmental Total
General Fund $ - $ - $ 283,262 $ 283,262Airport 600,000 - - 600,000Nonmajor Governmental 1,922,214 1,645,724 139,400 3,707,338Nonmajor Enterprise 848,507 - 1,107,374 1,955,881Internal Service 2,500,000 - - 2,500,000
$ 5,870,721 $ 1,645,724 $ 1,530,036 $ 9,046,481
Transfer FromGeneral
Fund
Transfers are used to: (1) move revenues from the fund that statute or budget requires to collect them to the fund that the statute or budget requires to expend them, and (2) use unrestricted revenues collected in the General Fund to finance various programs accounted for in other funds in accordance with budgetary authorizations.
NOTE 10. FUND EQUITY
Fund Balance Restricted fund balance represents amounts subject to externally enforceable limitations on use. The most significant amounts reported include the following:
Amounts legally restricted for debt service by the terms of the original debt instruments. Amounts restricted for capital outlay by state law and by debt instruments.
Committed fund balance represents amounts that can be used only for the specific purposes determined by the Macon-Bibb County Board of Commissioners.
The budget resolution commits the resources of the Law Enforcement Commissary Fund to Macon-Bibb County Law Enforcement.

NOTES TO FINANCIAL STATEMENTS
86
NOTE 11. POST-EMPLOYMENT HEALTH CARE BENEFITS
As of June 30, 2018, Macon-Bibb County administers a single-employer, defined benefit, other post-employment benefit plans (OPEB). The single plan for the County is the Macon-Bibb County Government Health Care Plan. The plan does not issue a separate stand-alone report and is not included in the report of another entity. Plan assets may be used only for the payment of benefits to the members of the plan, in accordance with the terms of the plan. A. Plan Description
In accordance with a resolution, Macon-Bibb County provides certain post-employment benefits for retired employees. Substantially all full-time employees, of the former Bibb County, Georgia, employed prior to May 1, 2011, become eligible for the benefits if they reach normal retirement age while working for the County. Substantially all full-time employees, of the former City of Macon, Georgia, employed prior to January 1, 2014, become eligible for the benefits if they reach normal retirement age while working for the County. The Plan provides health care and life insurance benefits to plan members and their beneficiaries. Life insurance is provided at the rate of two times the employee’s ending salary up to a maximum death benefit of $100,000. The benefit is reduced to 65% upon reaching age 65, to 45% upon reaching age 70, to 30% upon reaching age 75, and to 20% upon reaching age 80. The Macon-Bibb County Board of Commissioners is authorized to establish and amend all Plan provisions.
B. Membership
Membership data as of June 30, 2017, the date of the latest actuarial valuation:
Active participants 1,065 Retired participants and beneficiaries currently receiving benefits 1,279
Total 2,344
C. Contributions The contribution requirements of plan members and the County are established and may be amended by the Board. Retired plan members and beneficiaries currently receiving benefits are required to contribute specified amounts toward the cost of insurance premiums. Plan member contributions are based upon coverage elections. Retiree health coverage is $200-$239 per month; family coverage is an additional $320-$390 per month. Retiree life insurance premiums for the fiscal year ended June 30, 2018, were paid from the OPEB Trust Fund.

NOTES TO FINANCIAL STATEMENTS
87
NOTE 11. POST-EMPLOYMENT HEALTH CARE BENEFITS (CONTINUED)
D. Net OPEB Liability of the County
Effective July 1, 2017, the County implemented the provisions of GASB Statement No. 75, Accounting and Financial Reporting for Postemployment Benefits Other Than Pensions, which significantly changed the County’s accounting for OPEB amounts. The information disclosed below is presented in accordance with this new standard. The County’s net OPEB liability was measured as of June 30, 2018, and the total OPEB liability used to calculate the net OPEB liability was determined by an actuarial valuation as of June 30, 2017 with the actuary using standard techniques to roll forward the liability to the measurement date.
Actuarial assumptions. The total OPEB liability was determined by an actuarial valuation as of June 30, 2017, and was rolled forward to June 30, 2018, utilizing update procedures by the actuary incorporating the actuarial assumptions. The following actuarial assumptions were utilized and applied to all periods included in the measurement, unless otherwise specified: Discount Rate 3.89%Long-term expected rate of return
on OPEB investments 4.00%, net of investment expense, including inflationHealthcare Cost Trend Rate 7.50% for 2017 decreasing to an ultimate rate of
5.00% by 2023 (Pre-Medicare)2.00% for all future years (Medicare)
Inflation rate 4.00%Salary increases 4.25%, including inflation
Mortality rates were based on the 1994 Group Annuity mortality table for County employees and the RP-2000 mortality table for City employees, with various adjustments.
Investments. As of the most recent adoption of the current long-term rate of return by the Plan, the current asset allocation and best estimates of geometric real rates of return of each major asset class, as provided by the Plan’s investment consultant, are summarized in the following table.
Current ExpectedAsset Class Allocation Rate of Return
Corporate Bonds 6.04% 3.00%U.S. Treasury Bills
and Government Bonds 6.01% 5.00%Asset Backed Securities 3.62% 4.00%Money Funds 38.51% 0.75%Cash and cash equivalents 45.69% 1.25%Accrued interest 0.13% 1.00%
100.00%
Long-Term
See also Note 3: Deposits and Investments.

NOTES TO FINANCIAL STATEMENTS
88
NOTE 11. POST-EMPLOYMENT HEALTH CARE BENEFITS (CONTINUED)
D. Net OPEB Liability of the County (Continued) Several factors should be considered in evaluating the long-term rate of return assumption, including long-term historical data, estimates inherent in current market data, and a log-normal distribution analysis in which best-estimate ranges of expected future real rates of return (expected return, net of investment expense and inflation) are developed by the investment consultant for each major asset class. These ranges should be combined to produce the long-term expected rate of return by weighting the expected future real rates of return by the target asset allocation percentage and then adding expected inflation. The capital market assumptions developed by the investment consultant may cover a shorter investment horizon and may not be useful in setting the long-term rate of return for funding OPEB plans which are likely to cover a longer timeframe. The assumption is intended to be a long-term assumption and is not expected to change absent a significant change in the asset allocation, a change in the inflation assumption, or a fundamental change in the market that alters expected returns in future years. Discount Rate. The discount rate used to measure the TOL as of the measurement date was 3.89%. The projection of cash flows used to determine the discount rate was performed in accordance with GASB 74. The projection’s basis was an actuarial valuation performed as of June 30, 2017. In addition to the actuarial methods and assumptions of the June 30, 2017 actuarial valuation, the following actuarial methods and assumptions were used in the projection of cash flows: (1) Active employees do not explicitly contribute to the Plan, (2) the understanding is that the County intends to pay all benefits until the Plan’s fiduciary net position is exhausted, which the County anticipates will occur in the fiscal year ending June 30, 2019, (3) projected assets do not include future employer contributions, and (4) cash flows occur mid-year. The components of the net OPEB liability of the County at June 30, 2018, were as follows:
Balances at 6/30/17 $ 146,783,028 $ 10,050,049 $ 136,732,979Changes for the year:Interest 5,119,539 - 5,119,539 Service costs 5,243,741 - 5,243,741 Demographic experience (8,740,061) - (8,740,061) Assumption changes (3,068,521) - (3,068,521) Contributions - employer - - - Net investment income - 147,531 (147,531) Benefit payments (6,004,000) (6,004,000) - Administrative expenses - (425,076) 425,076 Net changes (7,449,302) (6,281,545) (1,167,757) Balances at 6/30/18 $ 139,333,726 $ 3,768,504 $ 135,565,222
Liability Net Position Liability(a) (b) (a) - (b)
Total OPEB Plan Fiduciary Net OPEB

NOTES TO FINANCIAL STATEMENTS
89
NOTE 11. POST-EMPLOYMENT HEALTH CARE BENEFITS (CONTINUED)
D. Net OPEB Liability of the County (Continued) The required schedule of changes in the County’s net OPEB liability and related ratios immediately following the notes to the financial statements presents multi-year trend information about whether the value of plan assets is increasing or decreasing over time relative to the total OPEB liability. Based on these assumptions, the Plan’s fiduciary net position is projected to be depleted in 2019 and, as a result, the Municipal Bond Index Rate was used in the determination of the SEIR for the Prior Measurement Date and current Measurement Date. As a result of the change to the Municipal Bond Index Rate, there was a change in the discount rate from 3.56% at the Prior Measurement Date to 3.89% at the Measurement Date.
Sensitivity of the Net OPEB Liability to Changes in the Discount Rate. The following table presents the Net OPEB liability of the Plan, calculated using the discount rate of 3.89%, as well as what the Plan’s Net OPEB liablity would be if it were calculated using a Discount Rate that is 1-percentage-point lower (2.89%) or 1-percentage-point higher (4.86%) than the current rate:
Current 1% Decrease Discount Rate 1% Increase
(2.89%) (3.89%) (4.89%)
Net OPEB Liability $ 149,604,108 $ 135,565,222 $ 123,313,870
Sensitivity of the net OPEB liability to changes in the healthcare cost trend rates. The following table presents the net OPEB liability of the County, as well as what the County’s net OPEB liability would be if it were to calculate healthcare cost trend rates that are 1-percentage-point lower or 1-percentage-point higher than the current healthcare cost trend rates:
Current Healthcare Trend Rates 1% Increase
Net OPEB Liability $ 123,743,282 $ 135,565,222 $ 149,544,044
1% Decrease
Actuarial valuations involve estimates of the value of reported amounts and assumptions about the probability of events far into the future, and actuarially determined amounts are subject to continual revisions as results are compared to past expectations and new estimates are made about the future. Actuarial calculations reflect a long-term perspective. Calculations are based on the substantive plan in effect as of June 30, 2018 and the current sharing pattern of costs between employer and inactive employees.

NOTES TO FINANCIAL STATEMENTS
90
NOTE 11. POST-EMPLOYMENT HEALTH CARE BENEFITS (CONTINUED)
D. Net OPEB Liability of the County (Continued)
OPEB Expense and Deferred Outflows of Resources and Deferred Inflows of Resources Related to OPEB For the year ended June 30, 2018, the County recognized OPEB expense of $7,643,455. At June 30, 2018, the County reported deferred outflows of resources and deferred inflows of resources related to OPEB from the following sources:
Deferred Deferred Outflows of Inflows of Resources Resources
Net difference between projected and actual earnings on pension plan investments $ 212,327 $ -
Changes in assumptions - (2,344,813)
Experience differences - (6,678,726)
Total $ 212,327 $ (9,023,539)
Amounts reported as deferred outflows of resources and deferred inflows of resources related to OPEB will be recognized in OPEB expense as follows:
Year ending June 30, 2019 $ (2,731,961) 2020 (2,731,961) 2021 (2,731,961) 2022 (615,329)
$ (8,811,212)
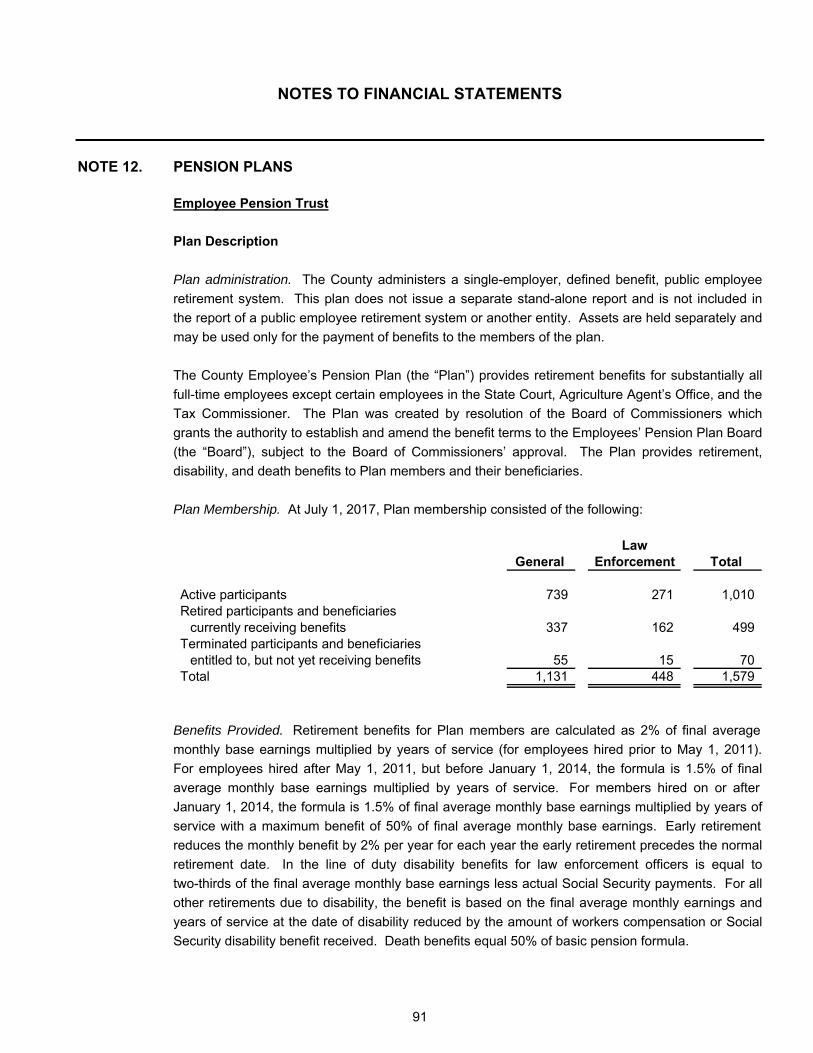
NOTES TO FINANCIAL STATEMENTS
91
NOTE 12. PENSION PLANS
Employee Pension Trust
Plan Description
Plan administration. The County administers a single-employer, defined benefit, public employee retirement system. This plan does not issue a separate stand-alone report and is not included in the report of a public employee retirement system or another entity. Assets are held separately and may be used only for the payment of benefits to the members of the plan.
The County Employee’s Pension Plan (the “Plan”) provides retirement benefits for substantially all full-time employees except certain employees in the State Court, Agriculture Agent’s Office, and the Tax Commissioner. The Plan was created by resolution of the Board of Commissioners which grants the authority to establish and amend the benefit terms to the Employees’ Pension Plan Board (the “Board”), subject to the Board of Commissioners’ approval. The Plan provides retirement, disability, and death benefits to Plan members and their beneficiaries.
Plan Membership. At July 1, 2017, Plan membership consisted of the following:
LawGeneral Enforcement Total
Active participants 739 271 1,010 Retired participants and beneficiaries
currently receiving benefits 337 162 499 Terminated participants and beneficiaries
entitled to, but not yet receiving benefits 55 15 70 Total 1,131 448 1,579
Benefits Provided. Retirement benefits for Plan members are calculated as 2% of final average monthly base earnings multiplied by years of service (for employees hired prior to May 1, 2011). For employees hired after May 1, 2011, but before January 1, 2014, the formula is 1.5% of final average monthly base earnings multiplied by years of service. For members hired on or after January 1, 2014, the formula is 1.5% of final average monthly base earnings multiplied by years of service with a maximum benefit of 50% of final average monthly base earnings. Early retirement reduces the monthly benefit by 2% per year for each year the early retirement precedes the normal retirement date. In the line of duty disability benefits for law enforcement officers is equal to two-thirds of the final average monthly base earnings less actual Social Security payments. For all other retirements due to disability, the benefit is based on the final average monthly earnings and years of service at the date of disability reduced by the amount of workers compensation or Social Security disability benefit received. Death benefits equal 50% of basic pension formula.

NOTES TO FINANCIAL STATEMENTS
92
NOTE 12. PENSION PLANS (CONTINUED)
Employee Pension Trust (Continued)
Plan Description (Continued)
Benefit terms provide for annual cost-of-living adjustments to each member’s retirement allowance as of each January 1 at least one year after retirement, if approved by the Macon-Bibb County Board of Commissioners. Contributions. A resolution by the Board of Commissioners grants the authority to establish and amend the contribution requirements of the County to the Pension Plan Board, subject to the Board of Commissioners’ approval. The Pension Plan Board establishes rates based on an actuarially determined rate recommended by an independent actuary. The actuarially determined rate is the estimated amount necessary to finance the cost of benefits earned by Plan members during the year, with an additional amount to finance any unfunded accrued liability. The County is required to contribute the difference between the actuarially determined rate and the contribution rate of plan members. For the year ended June 30, 2018, the County’s contribution rate was 18.40% of annual payroll. Plan members do not make contributions. County contributions to the Plan were $7,231 (in thousands) for the year ended June 30, 2018. Net Pension Liability of the County
The County’s net pension liability was measured as of July 1, 2017, and the total pension liability used to calculate the net pension liability was determined by an actuarial valuation as of that date.
Actuarial Assumptions. The total pension liability in the July 1, 2017, actuarial valuation was determined using the following actuarial assumptions, applied to all periods included in the measurement:
Inflation 4.0%
Salary increases 4.25%, including inflation
Investment rate of return 7.5%, net of pension planinvestment expense, including inflation
Mortality rates were based on the 1994 Group Annuity Mortality Table set forward two years for the period after service retirement and for dependent beneficiaries as well as for deaths in active service. The RP-2000 Disability Mortality Table set forward three years is used for the period after disability retirement. The actuarial assumptions used in the July 1, 2017, valuation were based on the results of an actuarial experience study for the five-year period ended June 30, 2008.

NOTES TO FINANCIAL STATEMENTS
93
NOTE 12. PENSION PLANS (CONTINUED)
Employee Pension Trust (Continued)
Net Pension Liability of the County (Continued)
The long-term expected rate of return on Plan investments was determined using a building-block method in which best-estimate ranges of expected future real rates of return (expected returns, net of Plan investment expenses and inflation) are developed for each major asset class. These ranges are combined to produce the long-term expected rate of return by weighting the expected future real rates of return by the target asset allocation percentage and by adding expected inflation. Best estimates of arithmetic real rates of return for each major asset class included in the pension plan’s target asset allocation as of June 30, 2018, are 7.5% per year. Discount Rate. The discount rate used to measure the total pension liability was 7.50%. The projection of cash flows used to determine the discount rate assumed that County contributions will be made at rates equal to the actuarially determined contribution rates. Based on those assumptions, the pension Plan’s fiduciary net position was projected to be available to make projected future benefit payments of current Plan members until 2115 to determine the total pension liability. Based on the assumptions used in the most recent actuarial valuation, the Plan’s fiduciary net position was projected to be available to make all projected future benefit payments of current plan members. Therefore, the long-term expected rate of return on pension plan investments was applied to all periods of projected benefit payments to determine the total pension liability and a municipal bond rate was not used in determining the discount rate. Changes in the Net Pension Liability. The changes in the components of the net pension liability of the County for the year ended June 30, 2018, were as follows (in thousands):
Balances at 6/30/17 $ 181,019 $ 109,459 $ 71,560Changes for the year:Interest 13,116 - 13,116 Service costs 2,607 - 2,607 Benefit changes - - - Demographic experience (269) - (269) Contributions - employer - 6,299 (6,299) Net investment income - 11,367 (11,367) Benefit payments (12,269) (12,269) - Administrative expenses - (43) 43 Net changes 3,185 5,354 (2,169) Balances at 6/30/18 $ 184,204 $ 114,813 $ 69,391
The Plan's fiduciary net position as a percentage of the total pension liability 62.33%
Net Pension(Asset) Liability
(a) - (b)(a)Liability
Total Pension Plan FiduciaryNet Position
(b)

NOTES TO FINANCIAL STATEMENTS
94
NOTE 12. PENSION PLANS (CONTINUED)
Employee Pension Trust (Continued)
Net Pension Liability of the County (Continued)
The net pension liability is recorded on the Statement of Net Position of the primary government and participating component units as follows (in thousands):
Primary Government $ 68,766 Macon-Bibb County Planning and Zoning 521 Macon-Bibb County Industrial Authority 104
$ 69,391
The required schedule of changes in the County’s net pension liability and related ratios immediately following the notes to the financial statements presents multi-year trend information about whether the value of plan assets is increasing or decreasing over time relative to the total pension liability.
Sensitivity of the Net Pension Liability to Changes in the Discount Rate. The following presents the net pension liability of the County, calculated using the discount rate of 7.50%, as well as what the County’s net pension liability would be if it were calculated using a discount rate that is 1-percentage-point lower (6.50%) or 1-percentage-point higher (8.50%) than the current rate (in thousands):
Current 1% Decrease Discount Rate 1% Increase
(6.50%) (7.50%) (8.50%)
Net pension liability $ 89,234 $ 69,391 $ 52,596
Actuarial valuations involve estimates of the value of reported amounts and assumptions about the probability of events far into the future, and actuarially determined amounts are subject to continual revision as results are compared to past expectations and new estimates are made about the future. Actuarial calculations reflect long-term perspective. Calculations are based on the substantive plan in effect as of July 1, 2017, and the current sharing pattern of costs between employer and employee.

NOTES TO FINANCIAL STATEMENTS
95
NOTE 12. PENSION PLANS (CONTINUED)
Employee Pension Trust (Continued)
Pension Expense and Deferred Outflows of Resources and Deferred Inflows of Resources
Related to Pensions
For the year ended June 30, 2018, the County recognized pension expense of $7,613 (in thousands). At June 30, 2018, the County reported deferred outflows of resources and deferred inflows of resources related to the pension plan from the following sources:
Deferred Deferred Outflows of Inflows of Resources Resources
Net difference between projected and actual earnings on pension plan investments $ 1,035 $ -
Differences between expected and actual experience 283 357
Contibutions subsequent to the measurement date 7,231 -
Total $ 8,549 $ 357
Amounts are allocated as follows:
Primary Government $ 8,470 $ 354 Macon-Bibb County Planning and Zoning 66 2 Macon-Bibb County Industrial Authority 13 1
$ 8,549 $ 357
County contributions subsequent to the measurement date of $7,231 (in thousands) are reported as deferred outflows of resources and will be recognized as a reduction of the net pension liability in the year ending June 30, 2019. Amounts reported as deferred outflows and inflows of resources related to pensions will be recognized in pension expense as follows:
Year ending June 30, 2019 $ (169) 2020 1,220 2021 642 2022 (728) 2023 (4)
$ 961

NOTES TO FINANCIAL STATEMENTS
96
NOTE 12. PENSION PLANS (CONTINUED)
General Employees’ Pension Plan (Former City of Macon)
Plan Description
Plan Administration. The General Employees’ Pension Plan was administered by the former City of Macon, Georgia. Upon consolidation of the City of Macon, Georgia and Bibb County, Georgia on January 1, 2014, this plan was frozen to new entrants. The General Employees’ Pension Plan – a single-employer defined benefit pension plan – provides retirement benefits for substantially all full-time employees of the former City of Macon, Georgia other than former City of Macon, Georgia sworn fire and police officers. The Plan was created by resolution of the former City of Macon, Georgia City Council which granted the authority to establish and amend the benefit terms to the Pension Plan Board (the “Board”), subject to City Council approval. Upon consolidation on January 1, 2014, the authority, with respect to the Plan, of the former City of Macon City Council was assumed by the Macon-Bibb County Board of Commissioners. The Plan provides retirement, disability, and death benefits to plan members and their beneficiaries. Plan Membership. At July 1, 2016, Plan membership consisted of the following:
Active participants 256 Retired participants and beneficiaries
currently receiving benefits 513 Terminated participants and beneficiaries
entitled to, but not yet receiving benefits 276 Total 1,045
Benefits Provided. The Plan provides retirement, disability, and death benefits. Retirement benefits for plan members are calculated as the greater of: (i) 2% of the average monthly earnings times service minus 1.50% of primary Social Security benefit times up to 33 1/3 years of service, or (ii) 1.52% of average monthly earnings up to $1,250 times service plus 1.90% of average monthly earnings above $1,250 times service (for employees as of June 30, 1984). For employees hired after June 30, 1984, the formula is 1.52% of average monthly earnings up to $1,250 times service plus 1.90% of average monthly earnings above $1,250 times service. Disability benefits are determined as the greater of: (i) 50% of average monthly earnings minus 50% of Social Security disability benefits plus 0.50% of average monthly earnings for each completed year of service in excess of five years, or (ii) basic pension formula. The disability pension requires five years of service. Death benefits equal 50% of basic pension formula. Benefit terms provide for annual cost-of-living adjustments to each member’s retirement allowance as of each January 1 at least one year after retirement, unless suspended by the Macon-Bibb County Board of Commissioners.

NOTES TO FINANCIAL STATEMENTS
97
NOTE 12. PENSION PLANS (CONTINUED)
General Employees’ Pension Plan (Former City of Macon) (Continued)
Plan Description (Continued)
A resolution by the Board of Commissioners grants the authority to establish and amend the contribution requirements of the County to the Pension Plan Board, subject to the Board of Commissioners’ approval. The Board establishes rates based on an actuarially determined rate recommended by an independent actuary. The actuarially determined rate is the estimated amount necessary to finance the cost of benefits earned by plan members during the year, with an additional amount to finance any unfunded accrued liability. The County is required to contribute the difference between the actuarially determined rate and the contribution rate of plan members. For the year ended June 30, 2018, the County’s contribution rate was 40.79% of annual payroll. Plan members do not make contributions. County contributions to the Plan were $4,202 (in thousands) for the year ended June 30, 2018.
Net Pension Liability of the County
The County’s net pension liability was measured as of July 1, 2017, and the total pension liability used to calculate the net pension liability was determined by an actuarial valuation as of that date.
Actuarial Assumptions. The total pension liability in the July 1, 2017, actuarial valuation was determined using the following actuarial assumptions, applied to all periods included in the measurement:
Inflation 3.00%
Salary increases 3.00%
Investment rate of return 7.85%, including inflation
Mortality rates were based on the gender-distinct rates set forth in the RP-2000 Mortality Table, projected to 2007 by scale AA, as published by the Internal Revenue Service (IRS) for purposes of Internal Revenue Code (IRC) section 430. Future generational improvements in mortality have not been reflected.

NOTES TO FINANCIAL STATEMENTS
98
NOTE 12. PENSION PLANS (CONTINUED)
General Employees’ Pension Plan (Former City of Macon) (Continued)
Net Pension Liability of the County (Continued)
The long-term expected rate of return on Plan investments was determined using a building-block method in which best-estimate ranges of expected future real rates of return (expected returns, net of Plan investment expenses and inflation) are developed for each major asset class. These ranges are combined to produce the long-term expected rate of return by weighting the expected future real rates of return by the target asset allocation percentage and by adding expected inflation. Best estimates of arithmetic real rates of return for each major asset class included in the pension plan’s target asset allocation as of June 30, 2018, are: Equity Securities – 6.00% and Fixed Income Securities – 2.00%.
Discount Rate. The discount rate used to measure the total pension liability was 7.54%. The projection of cash flows used to determine the discount rate assumed that County contributions will be made at rates equal to the actuarially determined contribution rates. Based on those assumptions, the pension Plan’s fiduciary net position was projected to be available to make projected future benefit payments of current Plan members until 2105 to determine the total pension liability. Based on the assumptions used in the most recent actuarial valuation, the Plan’s fiduciary net position was projected to be available to make all projected future benefit payments of current plan members. Therefore, the long-term expected rate of return on pension plan investments was applied to all periods of projected benefit payments to determine the total pension liability and a municipal bond rate was not used in determining the discount rate. Changes in the Net Pension Liability. The changes in the components of the net pension liability of the County for the year ended June 30, 2018, were as follows (in thousands):
Balances at 6/30/17 $ 99,457 $ 75,678 $ 23,779Changes for the year:Interest 7,345 5,641 1,704 Service costs 1,153 - 1,153 Demographic experience (1,479) - (1,479) Assumption changes - 3,088 (3,088) Contributions - employer - 4,746 (4,746) Net investment income - - - Benefit payments (6,461) (6,461) - Administrative expenses - (32) 32 Other changes - - - Net changes 558 6,982 (6,424) Balances at 6/30/18 $ 100,015 $ 82,660 $ 17,355
The Plan's fiduciary net position as a percentage of the total pension liability 82.65%
(a)Liability
Total Pension Plan FiduciaryNet Position
Net Pension(Asset) Liability
(a) - (b)(b)

NOTES TO FINANCIAL STATEMENTS
99
NOTE 12. PENSION PLANS (CONTINUED)
General Employees’ Pension Plan (Former City of Macon) (Continued)
Net Pension Liability of the County (Continued)
The net pension liability is recorded on the Statement of Net Position of the primary government and participating component units as follows (in thousands):
Primary Government $ 16,083 Macon-Bibb County Planning and Zoning 1,272
$ 17,355
The required schedule of changes in the County’s net pension liability and related ratios immediately following the notes to the financial statements presents multi-year trend information about whether the value of Plan assets is increasing or decreasing over time relative to the total pension liability.
Sensitivity of the Net Pension Liability to Changes in the Discount Rate. The following presents the net pension liability of the County, calculated using the discount rate of 7.54%, as well as what the County’s net pension liability would be if it were calculated using a discount rate that is 1-percentage-point lower (6.54%) or 1-percentage-point higher (8.54%) than the current rate (in thousands):
Current 1% Decrease Discount Rate 1% Increase
(6.54%) (7.54%) (8.54%)
Net pension liability $ 27,742 $ 17,355 $ 8,548
Actuarial valuations involve estimates of the value of reported amounts and assumptions about the probability of events far into the future, and actuarially determined amounts are subject to continual revision as results are compared to past expectations and new estimates are made about the future. Actuarial calculations reflect long-term perspective. Calculations are based on the substantive plan in effect as of July 1, 2017, and the current sharing pattern of costs between employer and employee.

NOTES TO FINANCIAL STATEMENTS
100
NOTE 12. PENSION PLANS (CONTINUED)
General Employees’ Pension Plan (Former City of Macon) (Continued)
Pension Expense and Deferred Outflows of Resources and Deferred Inflows of Resources Related to Pensions
For the year ended June 30, 2018, the County recognized pension expense of $2,372 (in thousands). At June 30, 2018, the County reported deferred outflows of resources and deferred inflows of resources related to the pension plan from the following sources:
Deferred Deferred Outflows of Inflows of Resources Resources
Net difference between projected and actual earnings on pension plan investments $ 4,315 $ 3,363
Demographic changes 1,186 1,977
Experience differences 721 -
Contributions subsequent to the measurement date 4,202 -
Total $ 10,424 $ 5,340
Amounts are allocated as follows:
Primary Government $ 9,660 $ 4,948 Macon-Bibb County Planning and Zoning 764 392
$ 10,424 $ 5,340
County contributions subsequent to the measurement date of $4,202 (in thousands) are reported as deferred outflows of resources and will be recognized as a reduction of the net pension liability in the year ending June 30, 2019. Amounts reported as deferred inflows of resources related to pensions will be recognized in pension expense as follows:
Year ending June 30, 2019 $ (379) 2020 1,183 2021 534 2022 (456)
$ 882

NOTES TO FINANCIAL STATEMENTS
101
NOTE 12. PENSION PLANS (CONTINUED)
Fire and Police Pension Plan (Former City of Macon)
Plan Description
Plan Administration. The Fire and Police Pension Plan was administered by the former City of Macon, Georgia. Upon consolidation of the City of Macon, Georgia and Bibb County, Georgia on January 1, 2014, this plan was frozen to new entrants.
The Fire and Police Pension Plan – a single-employer defined benefit pension plan – provides retirement benefits for substantially all full-time sworn police and fire officers of the former City of Macon, Georgia. The Plan was created by resolution of the former City of Macon, Georgia City Council which granted the authority to establish and amend the benefit terms to the Pension Plan Board (the “Board”), subject to City Council approval. Upon consolidation on January 1, 2014, the authority, with respect to the Plan, of the City of Macon City Council was assumed by the Macon-Bibb County Board of Commissioners. The Plan provides retirement, disability, and death benefits to Plan members and their beneficiaries.
Plan Membership. At July 1, 2017, Plan membership consisted of the following:
Active participants 442 Retired participants and beneficiaries
currently receiving benefits 562 Terminated participants and beneficiaries
entitled to, but not yet receiving benefits 269 Total 1,273
The Plan provides retirement, disability, and death benefits. Retirement benefits for Plan members are calculated as 2.00% of average monthly earnings times up to 35 years of service; minimum normal retirement benefit is $500 per month. Retirement benefit is reduced by 2.50% for each year by which the participant’s early retirement age precedes 50. Disability benefits are determined as 40%, 45%, 50%, 55%, 60%, or 65% of the basic pension formula for 15, 16, 17, 18, 19, or 20 to 25 years of service, respectively. Death benefits are 50% of the basic pension formula immediately for life to the spouse, plus 15% (for one minor child), 20% (for two minor children), or 25% (for three or more minor children) for married employees who die in the line of duty; 50% of basic pension formula (for one minor child), plus 5% (for two minor children), or 10% (for three or more minor children) for unmarried employees who die in the line of duty; 50% of the non-service-connected disability pension payable immediately for life to the spouse, plus 15% (for one minor child), 20% (for two minor children), or 25% (for three or more minor children) for married employees who die other than in the line of duty and who have earned at least 15 years of service; 50% of the non-service-connected disability pension (for one minor child), plus 5% (for two minor children), or 10% (for three or more minor children) for unmarried employees who die other than in the line of duty and who have earned at least 15 years of service.

NOTES TO FINANCIAL STATEMENTS
102
NOTE 12. PENSION PLANS (CONTINUED)
Fire and Police Pension Plan (Former City of Macon) (Continued)
Plan Description (Continued)
Benefit terms provide for annual cost-of-living adjustments to each member’s retirement allowance as of each January 1 at least one year after retirement, unless suspended by the Macon-Bibb County Board of Commissioners.
A resolution by the Board of Commissioners grants the authority to establish and amend the contribution requirements of the County to the Pension Plan Board, subject to the Board of Commissioners’ approval. The Board establishes rates based on an actuarially determined rate recommended by an independent actuary. The actuarially determined rate is the estimated amount necessary to finance the cost of benefits earned by plan members during the year, with an additional amount to finance any unfunded accrued liability. The County is required to contribute the difference between the actuarially determined rate and the contribution rate of plan members. For the year ended June 30, 2018, the County’s contribution rate was 26.33% of annual payroll. Plan members do not make contributions. County contributions to the Plan were $4,839 (in thousands) for the year ended June 30, 2018.
Net Pension Liability of the County
The County’s net pension liability was measured as of July 1, 2017, and the total pension liability used to calculate the net pension liability was determined by an actuarial valuation as of that date.
Actuarial Assumptions. The total pension liability in the July 1, 2017, actuarial valuation was determined using the following actuarial assumptions, applied to all periods included in the measurement:
Inflation 3.00%
Salary increases 3.00%
Investment rate of return 7.54%, including inflation
Mortality rates were based on the gender-distinct rates set forth in the RP-2000 Mortality Table, projected to 2015 by scale AA, as published by the Internal Revenue Service (IRS) for purposes of Internal Revenue Code (IRC) section 430. Future generational improvements in mortality have not been reflected.

NOTES TO FINANCIAL STATEMENTS
103
NOTE 12. PENSION PLANS (CONTINUED)
Fire and Police Pension Plan (Former City of Macon) (Continued)
Net Pension Liability of the County (Continued)
The long-term expected rate of return on Plan investments was determined using a building-block method in which best-estimate ranges of expected future real rates of return (expected returns, net of Plan investment expenses and inflation) are developed for each major asset class. These ranges are combined to produce the long-term expected rate of return by weighting the expected future real rates of return by the target asset allocation percentage and by adding expected inflation. Best estimates of arithmetic real rates of return for each major asset class included in the pension plan’s target asset allocation as of June 30, 2018, are: Equity Securities – 6.00% and Fixed Income Securities – 2.00%.
Discount Rate. The discount rate used to measure the total pension liability was 7.54%. The projection of cash flows used to determine the discount rate assumed that County contributions will be made at rates equal to the actuarially determined contribution rates. Based on those assumptions, the pension Plan’s fiduciary net position was projected to be available to make projected future benefit payments of current Plan members until 2115 to determine the total pension liability. Based on the assumptions used in the most recent actuarial valuation, the Plan’s fiduciary net position was projected to be available to make all projected future benefit payments of current plan members. Therefore, the long-term expected rate of return on pension plan investments was applied to all periods of projected benefit payments to determine the total pension liability and a municipal bond rate was not used in determining the discount rate. Changes in the Net Pension Liability. The changes in the components of the net pension liability of the County for the year ended June 30, 2018, were as follows (in thousands):
Balances at 6/30/17 $ 228,228 $ 210,159 $ 18,069Changes for the year:Interest 16,898 15,443 1,455 Service costs 2,855 - 2,855 Demographic experience (8) - (8) Assumption changes - - - Contributions - employer - 3,471 (3,471) Net investment income - 9,712 (9,712) Benefit payments (14,201) (14,201) - Administrative expenses - (161) 161 Net changes 5,544 14,264 (8,720) Balances at 6/30/18 $ 233,772 $ 224,423 $ 9,349
The Plan's fiduciary net position as a percentage of the total pension liability 96.00%
Net Pension(Asset) Liability
(a) - (b)(a)
Total PensionLiability
(b)Net Position
Plan Fiduciary

NOTES TO FINANCIAL STATEMENTS
104
NOTE 12. PENSION PLANS (CONTINUED)
Fire and Police Pension Plan (Former City of Macon) (Continued)
Net Pension Liability of the County (Continued)
The required schedule of changes in the net pension liability and related ratios immediately following the notes to the financial statements presents multi-year trend information about whether the value of Plan assets is increasing or decreasing over time relative to the total pension liability.
Sensitivity of the Net Pension Liability to Changes in the Discount Rate. The following presents the net pension liability of the County, calculated using the discount rate of 7.54%, as well as what the County’s net pension liability would be if it were calculated using a discount rate that is 1-percentage-point lower (6.54%) or 1-percentage-point higher (8.54%) than the current rate (in thousands):
Current 1% Decrease Discount Rate 1% Increase
(6.54%) (7.54%) (8.54%)
Net pension liability $ 36,621 $ 9,349 $ (13,387)
Actuarial valuations involve estimates of the value of reported amounts and assumptions about the probability of events far into the future, and actuarially determined amounts are subject to continual revision as results are compared to past expectations and new estimates are made about the future. Actuarial calculations reflect long-term perspective. Calculations are based on the substantive plan in effect as of July 1, 2017, and the current sharing pattern of costs between employer and employee.

NOTES TO FINANCIAL STATEMENTS
105
NOTE 12. PENSION PLANS (CONTINUED)
Fire and Police Pension Plan (Former City of Macon) (Continued)
Pension Expense and Deferred Outflows of Resources and Deferred Inflows of Resources
Related to Pensions
For the year ended June 30, 2018, the County recognized pension expense of $2,543 (in thousands). At June 30, 2018, the County reported deferred outflows of resources and deferred inflows of resources related to the pension plan from the following sources:
Deferred Deferred Outflows of Inflows of Resources Resources
Net difference between projected and actual earnings on pension plan investments $ 11,049 $ 11,625
Changes in assumptions 1,861 -
Demographic experience 3,598 9,963
Contributions subsequent to the measurement date 4,839 -
Total $ 21,347 $ 21,588
County contributions subsequent to the measurement date of $4,839 (in thousands) are reported as deferred outflows of resources and will be recognized as a reduction of the net pension liability in the year ending June 30, 2019. Amounts reported as deferred inflows of resources related to pensions will be recognized in pension expense as follows:
Year ending June 30, 2019 $ (1,929) 2020 1,927 2021 (72) 2022 (2,423) 2023 (478) Thereafter (2,105)
$ (5,080)

NOTES TO FINANCIAL STATEMENTS
106
NOTE 12. PENSION PLANS (CONTINUED)
Aggregate Amounts
The aggregate assets, liabilities, net position and expenses related to each pension plan established by the County as of June 30, 2018, is as follows (in thousands):
Employee Fire and GeneralPension Police Employees'
Trust Pension Pension Total
Plan assets $ 84,046 $ 223,674 $ 116,149 $ 423,869 Plan liabilities 2 91 1,103 1,196 Plan net position $ 84,044 $ 223,583 $ 115,046 $ 422,673
Plan expenses $ 12,745 $ 14,441 $ 6,758 $ 33,944
The aggregate net pension liability, deferred outflows of resources, and deferred inflows of resources related to each pension plan established by the County as of June 30, 2018, is as follows (in thousands):
Employee Pension Trust $ 69,391 $ 8,549 $ 357 General Employees Pension Trust 17,355 10,424 5,340 Fire and Police Pension Trust 9,349 21,347 21,588
$ 96,095 $ 40,320 $ 27,285
Reported in:Primary Government $ 94,197 $ 39,477 $ 26,890 Component Units 1,898 843 395
$ 96,095 $ 40,320 27,285
DeferredInflows ofResources
Net PensionLiability
DeferredOutflows ofResources
NOTE 13. RISK MANAGEMENT
The County is exposed to various risks of loss related to torts; thefts of, damage to, and destruction of assets; errors and omissions; injuries to employees; natural disasters; and losses resulting from providing accident and health benefits to employees, retirees, and their dependents. The County purchases commercial insurance for most types of risk. For these risks, settlements have not exceeded coverage.
$

NOTES TO FINANCIAL STATEMENTS
107
NOTE 13. RISK MANAGEMENT (CONTINUED)
The County established an internal service fund for group health insurance which is funded by charges to the County’s other funds. Liabilities of the fund are reported when it is probable that a loss has occurred and the amount of the loss can be reasonably estimated. Liabilities include an amount for claims that have been incurred but not reported (IBNRs). The result of the process to estimate the claims liability is not an exact amount as it depends on many complex factors, such as inflation, changes in legal doctrines, and damage awards. Accordingly, claims are re-evaluated periodically to consider the effects of inflation, recent claim settlement trends (including frequency and amount of payouts), and other economic and social factors. The estimate of the claims liability also includes amounts for incremental claim adjustment expense related to specific claims and other claim adjustment expenses regardless of whether allocated to specific claims. Estimated recoveries, for example from salvage or subrogation, are another component of the claims liability estimate. The County has entered into a self-funded group insurance plan with major medical coverage. The County currently utilizes Blue Cross Blue Shield as the Third Party Administrator. A stop loss carrier is in place to cover claims in excess of $250,000. Management continues to monitor the performance of this fund to ensure that premiums charged to the funds and agencies of the County are adequate. Changes in the respective claims liability amount for the fiscal years ended June 30, 2018 and June 30, 2017, were: Fiscal year ended June 30, 2018
Claim ClaimsBeginning Estimates Paid Ending
Workers' Compensation $ 9,610,000 $ 4,311,848 $ 2,175,848 $ 11,746,000
Group Health $ 1,320,426 $ 12,399,762 $ 12,923,440 $ 796,748
Fiscal year ended June 30, 2017Claims Claim
Beginning Estimates Payments Ending
Workers' Compensation $ 8,364,000 $ 3,542,346 $ 2,296,346 $ 9,610,000
Group Health $ 833,408 $ 11,721,100 $ 11,234,082 $ 1,320,426

NOTES TO FINANCIAL STATEMENTS
108
NOTE 14. COMMITMENTS AND CONTINGENCIES
A. Construction Commitments
The County has active construction projects as of June 30, 2018. The projects include street construction, building renovations, and construction of a new Juvenile Justice Facility and a new fire station. As of June 30, 2018, the County has contractual commitments on uncompleted construction contracts of approximately $13,694,000.
The remaining commitment amounts were encumbered at the end of the fiscal year. The encumbrances and related appropriation lapse at the end of the year, but are re-appropriated and become part of the subsequent year’s budget because performance under the executor contract is expected in the next year.
B. Litigation
Macon-Bibb County, Georgia is a defendant in numerous lawsuits and legal proceedings. County management and legal counsel is of the opinion that ultimate disposition of the lawsuits and legal proceedings will likely not have a material adverse effect, if any, on the financial condition of the County.
C. Grant Funds
Amounts received or receivable from grantor agencies are subject to audit and adjustment by grantor agencies, principally the Federal government. Any disallowed claims, including amounts already collected, may constitute a liability of the applicable funds. The amount, if any, of expenditures which may be disallowed by the grantor cannot be determined at this time although the County expects such amounts, if any, to be immaterial.
D. Contracts with Macon-Bibb County Industrial Authority
Macon-Bibb County entered into a contract with the Macon-Bibb County Industrial Authority to provide $350,000 annually for 20 years, with payments beginning October 31, 2008. The funds are to be used for the purpose of land acquisition, infrastructure development, transaction costs, and other industrial development services.

NOTES TO FINANCIAL STATEMENTS
109
NOTE 15. TAX ABATEMENTS
State statutes control the creation and operation of Development Authorities under O.C.G.A. 36-62. The PILOT Restriction Act defined in O.C.G.A. 36-80-16 provides an Authority permission to issue revenue bonds for capital projects for private companies and arrange for payments in lieu of taxes so long as each of the local governments that have property tax levying authority in the area in which such capital project is located consents by ordinance or resolution. Macon-Bibb County participates in agreements with the Macon-Bibb County Industrial Authority and the Macon-Bibb County Urban Development Authority to provide tax abatements to foster economic development. The agreements provide for the real property and equipment of the projects to be acquired with bond proceeds titled in the name of the Authority applicable, and the Authority leases the projects back to the companies. The Authority pays no property tax on its real or personal property. To compensate local jurisdictions for the taxes that would have otherwise been paid during the term of the leases, the projects provide a PILOT (payment in lieu of tax). In order to qualify, certain eligibility requirements must be met and are based on the economic development goals of each project. Generally, a project will create employment opportunities, promote trade and commerce in the County, and increase the tax base. If a company fails to meet the criteria established in the agreement, recovery payments may apply. The total amount of taxes abated for the County for the tax year 2016 (fiscal year 2017) was $5,762,140.
NOTE 16. RESTATEMENT
The County has determined that a restatement to the July 1, 2017 beginning net position was required to recognize the change in accounting principle for implementation of GASB Statement No. 75, Accounting and Financial Reporting for Post-employment Benefits Other Than Pensions,
which establishes new accounting and financial reporting requirements for governments whose employees are provided with OPEB. This adjustment resulted in a change to the beginning net position of the Governmental Activities as follows:
Governmental
Activities
Net position, June 30, 2017, as previously reported $ 109,993,187 Net OPEB obligation, June 30, 2017 57,412,900 Net OPEB liability, June 30, 2017 (136,732,979) Net position, June 30, 2017, restated $ 30,673,108

NOTES TO FINANCIAL STATEMENTS
110
NOTE 16. RESTATEMENT (CONTINUED)
Component Unit – Macon-Bibb County Board of Health
During 2018, the Board adopted new accounting guidance, GASB Statement No. 75, Accounting
and Financial Reporting for Post-employment Benefit Plans other than Pension Plans. GASB Statement No. 75 requires that the proportionate share of the net OPEB liability be recorded as of the Board’s measurement date of June 30, 2017. The effect of this adjustment is as follows:
Governmental
Activities
Net position, June 30, 2017, as previously reported $ 554,104 Implementation of GASB 75 for OPEB (3,154,418) Net position, June 30, 2017, restated $ (2,600,314)
Component Unit – Middle Georgia Regional Library
During 2018, the Library implemented new accounting guidance, GASB Statement No. 75, Accounting and Financial Reporting for Post-employment Benefit Plans other than Pension Plans –
an amendment of GASB Statements No. 45, Accounting and Financial Reporting by Employers for
Post-employment Benefits Other Than Pensions, as amended, and No. 57, OPEB Measurements
by Agent Employers and Agent Multiple-Employers Plans, for OPEB, as of July 1, 2017.
Governmental
Activities
Net position, June 30, 2017, as previously stated $ (966,181) Implementation of GASB 75 for OPEB (371,939) Net position, June 30, 2017, restated $ (1,338,120)

REQUIRED SUPPLEMENTARY INFORMATION

111
MACON-BIBB COUNTY, GEORGIA
REQUIRED SUPPLEMENTARY INFORMATION EMPLOYEE PENSION PLAN
JUNE 30, 2018
2018 2017 2016 2015Total pension liability
Service cost 2,607$ 2,244$ 2,250$ 2,093$ Interest on total pension liability 13,116 11,443 10,616 10,382 Benefit changes - 20,948 8,258 - Demographic experience (269) (239) 739 - Benefit payments and refunds (12,269) (11,911) (9,760) (8,937) Net change in total pension liability 3,185 22,485 12,103 3,538
Total pension liability - beginning 181,019 158,534 146,431 142,893 Total pension liability - ending (a) 184,204$ 181,019$ 158,534$ 146,431$
Plan fiduciary net positionContributions - employer 6,299$ 5,828$ 5,393$ 5,168$ Net investment income 11,367 1,265 6,027 14,553 Benefit payments and refunds (12,269) (11,911) (9,760) (8,937) Administrative expenses (43) (42) (37) (17) Net change in Plan fiduciary net position 5,354 (4,860) 1,623 10,767
Plan fiduciary net position - beginning 109,459 114,319 112,696 101,929 Plan fiduciary net position - ending (b) 114,813$ 109,459$ 114,319$ 112,696$
Net pension liability - ending (a) - (b) 69,391$ 71,560$ 44,215$ 33,735$
Plan fiduciary net position as a percentageof the total pension liability 62.33% 60.47% 72.11% 76.96%
Covered-employee payroll 38,440$ 34,655$ 33,574$ 31,127$
Net pension liability as a percentage of covered-employee payroll 180.52% 206.49% 131.69% 108.38%
Notes to the Schedule The schedule will present 10 years of information once it is accumulated. Numbers presented in thousands.
SCHEDULE OF CHANGES IN THE NET PENSION LIABILITY AND RELATED RATIOS

112
MACON-BIBB COUNTY, GEORGIA
REQUIRED SUPPLEMENTARY INFORMATION EMPLOYEE PENSION PLAN
JUNE 30, 2018
2018 2017 2016 2015 2014
Actuarially determined contribution $ 7,231 $ 6,299 $ 5,828 $ 5,393 $ 5,168 Contributions in relation to the actuarially
determined contribution 7,231 6,299 5,828 5,393 5,168 Contribution deficiency (excess) $ - $ - $ - $ - $ -
Covered-employee payroll $ 39,298 $ 38,440 $ 34,655 $ 33,574 $ 31,127
Contributions as a percentage of covered-employee payroll 18.40% 16.39% 16.82% 16.06% 16.60%
Notes to the Schedule Valuation Date July 1, 2017Cost Method Entry Age NormalActuarial Asset Valuation Method Five-year smoothed marketAssumed Rate of Return on Investments 7.50%Projected Salary Increases 4.25%Amortization Method Level percent of pay, openRemaining Amortization Period 18 years
The schedule will present 10 years of information once it is accumulated. Numbers presented are in thousands.
SCHEDULE OF CONTRIBUTIONS
2018 2017 2016 2015
Annual money-weighted rate of return, net ofinvestment expenses for the pension plan 5.15% 9.38% 3.10% 7.50%
Note to the Schedule The schedule will present 10 years of information once it is accumulated.
SCHEDULE OF PENSION INVESTMENT RETURNS

113
MACON-BIBB COUNTY, GEORGIA
REQUIRED SUPPLEMENTARY INFORMATION GENERAL EMPLOYEES’ PENSION PLAN
JUNE 30, 2018
SCHEDULE OF CHANGES IN THE NET PENSION LIABILITY AND RELATED RATIOS
2018 2017 2016 2015Total pension liability
Service cost 1,153$ 771$ 1,550$ 1,604$ Interest on total pension liability 7,345 6,684 6,539 6,415 Demographic experience (1,479) 1,869 (824) (1,990) Assumption changes - 4,799 1,362 - Benefit payments and refunds (6,461) (6,172) (4,500) (4,164) Other changes - - - - Net change in total pension liability 558 7,951 4,127 1,865
Total pension liability - beginning 99,457 91,506 87,379 85,514 Total pension liability - ending (a) 100,015$ 99,457$ 91,506$ 87,379$
Plan fiduciary net positionContributions - employer 4,746$ 3,306$ 3,547$ 3,712$ Net investment income 8,729 734 2,477 9,533 Benefit payments and refunds (6,461) (6,172) (4,557) (4,366) Administrative expenses (32) (40) (22) (137) Net change in plan fiduciary net position 6,982 (2,172) 1,445 8,742
Plan fiduciary net position - beginning 75,678 77,850 76,405 67,663 Plan fiduciary net position - ending (b) 82,660$ 75,678$ 77,850$ 76,405$
Net pension liability - ending (a) - (b) 17,355$ 23,779$ 13,656$ 10,974$
Plan fiduciary net position as a percentageof the total pension liability 82.65% 76.09% 85.08% 87.44%
Covered-employee payroll 11,482$ 8,952$ 16,852$ 17,377$
Net pension liability as a percentageof covered-employee payroll 151.15% 265.64% 81.03% 63.15%
Notes to the Schedule The schedule will present 10 years of information once it is accumulated. Numbers presented in thousands.

114
MACON-BIBB COUNTY, GEORGIA
REQUIRED SUPPLEMENTARY INFORMATION GENERAL EMPLOYEES’ PENSION PLAN
JUNE 30, 2018
2018 2017 2016 2015 2014
Actuarially determined contribution $ 4,202 $ 4,746 $ 3,305 $ 3,547 $ 3,712 Contributions in relation to the actuarially
determined contribution 4,202 4,746 3,305 3,547 3,712 Contribution deficiency (excess) $ - $ - $ - $ - $ -
Covered-employee payroll $ 10,302 $ 11,482 $ 8,952 $ 16,852 $ 17,377
Contributions as a percentage of covered-employee payroll 40.79% 41.33% 36.92% 21.05% 21.36%
Notes to the Schedule July 1, 2016Valuation Date AggregateCost Method Five-year smoothed marketActuarial Asset Valuation Method 7.54%Assumed Rate of Return on Investments 3.00%Projected Salary Increases 1.50%Cost-of-living Adjustment Level percentage, openAmortization Method 30 yearsRemaining Amortization Period
The schedule will present 10 years of information once it is accumulated. Numbers presented are in thousands.
SCHEDULE OF CONTRIBUTIONS
SCHEDULE OF PENSION INVESTMENT RETURNS
2018 2017 2016 2015
Annual money-weighted rate of return, net of investment expenses for the pension plan 5.43% 8.66% 3.62% 4.54%
Note to the Schedule The schedule will present 10 years of information once it is accumulated.

115
MACON-BIBB COUNTY, GEORGIA
REQUIRED SUPPLEMENTARY INFORMATION FIRE AND POLICE PENSION PLAN
JUNE 30, 2018
2018 2017 2016 2015Total pension liability
Service cost 2,855$ 2,298$ 3,195$ 3,462$ Interest on total pension liability 16,898 15,410 15,239 15,260 Demographic experience (8) 4,254 (4,939) (8,598) Assumption changes - 10,497 2,407 - Benefit payments and refunds (14,201) (13,767) (10,347) (9,941) Net change in total pension liability 5,544 18,692 5,555 183
Total pension liability - beginning 228,228 209,536 203,981 203,798 Total pension liability - ending (a) 233,772$ 228,228$ 209,536$ 203,981$
Plan fiduciary net positionContributions - employer 3,471$ 1,370$ 3,746$ 4,234$ Net investment income 25,155 4,251 6,265 33,487 Benefit payments and refunds (14,201) (13,767) (10,450) (10,062) Administrative expenses (161) (89) (86) (153) Net change in plan fiduciary net position 14,264 (8,235) (525) 27,506
Plan fiduciary net position - beginning 210,159 218,394 218,919 191,413 Plan fiduciary net position - ending (b) 224,423$ 210,159$ 218,394$ 218,919$
Net pension (asset) liability - ending (a) - (b) 9,349$ 18,069$ (8,858)$ (14,938)$
Plan fiduciary net position as a percentageof the total pension asset 96.00% 92.08% 104.23% 107.32%
Covered-employee payroll 20,037$ 16,957$ 25,174$ 26,250$
Net pension liability as a percentage of covered-employee payroll 46.66% 106.56% -35.19% -56.91%
Notes to the Schedule The schedule will present 10 years of information once it is accumulated. Numbers presented in thousands.
SCHEDULE OF CHANGES IN THE NET PENSION LIABILITY AND RELATED RATIOS

116
MACON-BIBB COUNTY, GEORGIA
REQUIRED SUPPLEMENTARY INFORMATION FIRE AND POLICE PENSION PLAN
JUNE 30, 2018
2018 2017 2016 2015 2014
Actuarially determined contribution $ 4,839 $ 3,471 $ 3,461 $ 3,746 $ 4,234 Contributions in relation to the actuarially
determined contribution 4,839 3,471 3,461 3,746 4,234 Contribution deficiency (excess) $ - $ - $ - $ - $ -
Covered-employee payroll $ 18,379 $ 20,037 $ 16,957 $ 25,174 $ 26,250
Contributions as a percentage of covered-employee payroll 26.33% 17.32% 20.41% 14.88% 16.13%
Notes to the Schedule Valuation Date July 1, 2016Cost Method AggregateActuarial Asset Valuation Method Five-year smoothed marketAssumed Rate of Return on Investments 7.54%Projected Salary Increases 3.00%Cost-of-living Adjustment 1.50%Amortization Method Level percentage, openRemaining Amortization Period 30 years
The schedule will present 10 years of information once it is accumulated. Numbers presented are in thousands.
SCHEDULE OF CONTRIBUTIONS
SCHEDULE OF PENSION INVESTMENT RETURNS
2018 2017 2016 2015
Annual money-weighted rate of return, net of investment expenses for the pension plan 8.56% 12.33% 2.25% 4.54%
Note to the Schedule The schedule will present 10 years of information once it is accumulated.

117
MACON-BIBB COUNTY, GEORGIA
REQUIRED SUPPLEMENTARY INFORMATION OTHER POST-EMPLOYMENT BENEFIT PLAN
JUNE 30, 2018
Total OPEB liability
Service cost at end of year $ 5,243,741 $ 5,583,280 Interest on total OPEB liability 5,119,539 4,452,776 Assumption changes (11,808,582) (7,980,677) Benefit payments and refunds (6,004,000) (6,410,238) Net change in total OPEB liability (7,449,302) (4,354,859)
Total pension liability - beginning 146,783,028 151,137,887 Total pension liability - ending (a) $ 139,333,726 $ 146,783,028
Plan fiduciary net position
Contributions - employer $ - $ - Net investment income 147,531 1,038,668 Benefit payments and refunds (6,004,000) (6,410,238) Administrative expenses (425,076) (1,586) Net change in plan fiduciary net position (6,281,545) (5,373,156)
Plan fiduciary net position - beginning 10,050,049 15,423,205 Plan fiduciary net position - ending (b) $ 3,768,504 $ 10,050,049
Net OPEB liability - ending (a) - (b) $ 135,565,222 $ 136,732,979
Plan fiduciary net position as a percentage of the total OPEB liability 2.70% 6.85%
Covered-employee payroll $ 44,607,804 $ 44,008,350
Net OPEB liability as a percentage of covered-employee payroll 303.90% 290.87%
Notes to the Schedule The schedule will present 10 years of information once it is accumulated. Numbers presented in thousands.
2017
SCHEDULE OF CHANGES IN THE NET OPEB LIABILITY AND RELATED RATIOS
2018

118
MACON-BIBB COUNTY, GEORGIA
REQUIRED SUPPLEMENTARY INFORMATION OTHER POST-EMPLOYMENT BENEFIT PLAN
JUNE 30, 2018
Actuarially determined contribution $ 12,223,519 $ 9,529,161 $ 9,529,161 Contributions in relation to the
actuarially determined contribution - - (1,849,708) Annual contribution deficiency $ 12,223,519 $ 9,529,161 $ 7,679,453
Covered-employee payroll $ 44,607,804 $ 44,607,804 $ 47,008,350
Contributions as a percentage of covered-employee payroll 0.00% 0.00% 3.93%
Notes to the Schedule Valuation Date July 1, 2015Cost Method Projected Unit CreditActuarial Asset Valuation Method Market Value of AssetsAssumed Rate of Return on Investments 6.00%Amortization Method Level dollar, closedRemaining Amortization Period 26 yearsHealthcare Trend Rates:Pre-Medicare 7.50% to 5.00%Medicare 5.00%
The schedule will present 10 years of information once it is accumulated.
2017 2016
SCHEDULE OF CONTRIBUTIONS
2018
2018 2017Annual money-weighted rate of return, net of investment
expenses for the pension plan 3.92% 7.06%
Note to the Schedule The schedule will present 10 years of information once it is accumulated.
SCHEDULE OF OPEB INVESTMENT RETURNS
NONMAJOR GOVERNMENTAL FUNDS

Special Revenue Funds
The Emergency 911 Fund is used to account for the operations and activities of the emergency telephone system. The Hotel/Motel Tax Fund accounts for hotel/motel tax funds received. The resources are restricted by state law and County code for tourism and tourism product development. The Grants Fund is used to account for the various federal and state grant programs administered by Macon-Bibb County. The Special Street Light District Fund accounts for the collection of charges from street light districts. The resources are restricted by County Code to provide for expenditures in the special districts of Macon-Bibb County. The Middle Georgia Education Corridor BID accounts for taxes levied and collected within Middle Georgia Education Corridor Business Improvement District. The resources are restricted for improvements within the Business Improvement District. The Law Enforcement Commissary Fund accounts for certain funds collected at the Macon-Bibb County Law Enforcement Center commissary. The resources are committed by County resolution for Macon-Bibb County law enforcement expenditures. The Law Enforcement Confiscation Fund accounts for condemned funds received that are restricted by state law for law enforcement expenditures. The Drug Abuse Treatment and Education Fund accounts for certain fines received from the various courts of Macon-Bibb County. The resources are restricted by state law for drug abuse treatment and educational purposes. The Alternative Dispute Resolution Fund accounts for certain fines received from various courts of Macon-Bibb County and other participating counties in the Middle Georgia area. The resources are restricted by state law for programs that resolve disputes by methods other than litigation. The Crime Victims Assistance Fund accounts for certain fines received from various courts in Macon-Bibb County. The resources are restricted by state law for assistance to victims of crime. The Juvenile Court Supervision Fund accounts for certain fees received from the Juvenile Court of Macon-Bibb County. The resources are restricted by state law for alternative juvenile programs. The Law Library Fund accounts for certain fees received from the various courts of Macon-Bibb County. The resources are restricted by state law for the support of a centralized law library. The District Attorney RICO Fund accounts for funds received by the District Attorney’s office related to RICO activity cases and matters. The Sponsored Program Fund accounts for special programs funded through grant revenue, intergovernmental contracts and transfers from other funds. The resources are restricted by the grantors. The Macon-Bibb County Jail Fund accounts for certain fees received from the various courts of Macon-Bibb County. The resources are restricted by state law for expenditures of the Macon-Bibb County Law Enforcement Center.

Special Revenue Funds (Continued)
The DFACS MIL Fund accounts for certain payments received from the Macon-Bibb County Department of Family and Children Services. The resources are restricted by contract with the Georgia Department of Human Resources for maintenance, operations and capital outlay at the DFACS public facility building. The ECD CDBG Fund is used to account for the Community Development Block Grant program. The ECD HOME Grant Fund is used to account for the Home Investment Partnership grant program. The ECD ESG Fund is used to account for the Emergency Solutions grant program. The Downtown Macon BID is used for taxes levied and collected within Downtown Macon Business Improvement District. The resources are restricted for improvements within the Business Improvement District.
Capital Projects Funds
The Capital Improvements Fund accounts for the purchase or construction of major capital facilities within the County. The Ocmulgee Greenway Trail Fund accounts for expenditures for the development of Gateway Park. The 2013 MBCUDA Project Fund accounts for expenditures to be funded with proceeds from the Macon-Bibb County Urban Development Authority, Series 2013 Revenue Bonds. The 2015 MBCUDA Project Fund accounts for expenditures to be funded with proceeds from the Macon-Bibb County Urban Development Authority, Series 2015 Revenue Bonds. The 2014 TAD Second Street Fund accounts for bond proceeds and expenditures for certain improvements within the Second Street tax allocation district. The 2014 TAD Renaissance Fund accounts for bond proceeds and expenditures for certain improvements within the Renaissance tax allocation district. The 2014 TAD Bibb Mill Fund accounts for bond proceeds and expenditures for certain improvements within Bibb Mill Center tax allocation district.
Debt Service Funds
The General Debt Service Fund accounts for accumulation of resources for the payment of general long-term debt principal and interest of the County.

119
Special Middle Georgia Emergency Hotel/ Street Education Law Law
911 Motel Grants Light Corridor Enforcement EnforcementFund Tax Fund District BID Commissary Confiscation
ASSETSCash and cash equivalents $ 4,161 $ 350,371 $ 159 $ 96,513 $ 8,097 $ 1,153,151 $ 734,115 Investments - - - - - 484,697 195,250 Receivables, net of allowance
Taxes - 382,861 - - 7,592 - - Accounts 392,995 - - - - - -
Due from other governments - - 1,311,570 - - - - Due from other funds - - 1,729,000 - - - - Prepaid items - - - - - - - Long-term receivable, net of allowance - - - - - - -
Total assets $ 397,156 $ 733,232 $ 3,040,729 $ 96,513 $ 15,689 $ 1,637,848 $ 929,365
LIABILITIESAccounts payable $ 25,125 $ 524,232 746,796 $ 96,513 $ - $ 6,858 $ 257 Retainage payable - - 17,861 - - - - Accrued payroll deductions 107,781 - 20,608 - - - - Due to other governments - - - - - - 7,367 Due to other funds 260,000 209,000 - - - - - Unearned revenues - - 31,163 - - - -
Total liabilities 392,906 733,232 816,428 96,513 - 6,858 7,624
DEFERRED INFLOWS OF RESOURCESUnavailable revenue - taxes - - - - 7,592 - - Unavailable revenue - housing and development loans - - - - - - - Unavailable revenue - grants - - 411,559 - - - -
Total deferred inflows of resources - - 411,559 - 7,592 - -
FUND BALANCES (DEFICIT)Nonspendable:
Prepaid items - - - - - - - Long-term receivable - - - - - - -
Restricted for:Debt service - - - - - - - Grant programs 1,812,742 - - - Capital outlay - - - - - - - Public safety 4,250 - - - - - 921,741 Victim assistance - - - - - - - Court programs - - - - - - - Community development - - - - 8,097 - -
Committed:Law enforcement - - - - - 1,630,990 -
Assigned:Capital outlay - - - - - - -
Unassigned (deficit) - - - - - - -
Total fund balances (deficit) 4,250 - 1,812,742 - 8,097 1,630,990 921,741
Total liabilities, deferred inflows ofresources and fund balances $ 397,156 $ 733,232 $ 3,040,729 $ 96,513 $ 15,689 $ 1,637,848 $ 929,365
NONMAJOR GOVERNMENTAL FUNDSCOMBINING BALANCE SHEET
MACON-BIBB COUNTY, GEORGIA
JUNE 30, 2018
Special Revenue Funds

120
Drug AbuseTreatment Alternative Crime Juvenile District
and Victims Court Law AttorneyEducation Resolution Assistance Supervision Library RICO Programs
$ 84,469 $ 174,685 $ 14,425 $ 11,423 $ 26,232 $ 1,739,421 $ 8,586 $ 180,321 - 252,975 31,081 - - - - 29,686
- - - - - - - - - 19,348 - - - 119,954 - - - - - - - - 80,209 - - - - - - - 400,000 - - - - - - - - - - - - - - - -
$ 84,469 $ 447,008 $ 45,506 $ 11,423 $ 26,232 $ 1,859,375 $ 488,795 $ 210,007
$ 6,852 $ 2,384 $ - $ - $ 380 $ 53,022 $ 3,953 $ - - - - - - - - - - 5,948 - - - - 8,478 - - - - - - - - - - - - - 16,500 - - - - - - - - - 474,703 -
6,852 8,332 - - 16,880 53,022 487,134 -
- - - - - - - -
- - - - - - - - - - - - - - 3,887 -
- - - - - - 3,887 -
- - - - - - - - - - - - - - - -
- - - - - - - - - - - - - - - - - - - - - - - - - - - - - - - 210,007 - - 45,506 - - - - -
77,617 438,676 - 11,423 9,352 1,806,353 - - - - - - - - - -
- - - - - - - -
- - - - - - - - - - - - - - (2,226) -
77,617 438,676 45,506 11,423 9,352 1,806,353 (2,226) 210,007
$ 84,469 $ 447,008 $ 45,506 $ 11,423 $ 26,232 $ 1,859,375 $ 488,795 $ 210,007 (Continued)
FundCounty JailSponsored Dispute
Special Revenue Funds (Continued)
Macon-Bibb

121
ECD HOME Downtown TotalGrant Macon SpecialFund BID Revenue
ASSETSCash and cash equivalents $ 640,635 $ 1,226,218 $ 365,048 $ 60 $ 1,793 $ 6,819,883 Investments 1,542,235 - - - - 2,535,924 Receivables, net of allowance
Taxes - - - - 6,618 397,071 Accounts - 26,929 31,691 - - 590,917
Due from other governments - 181,933 31,306 39,855 - 1,644,873 Due from other funds - - - - - 2,129,000 Prepaid items - 3,409 602 - - 4,011 Long-term receivable, net of allowance - 403,091 1,088,330 - - 1,491,421
Total assets $ 2,182,870 $ 1,841,580 $ 1,516,977 $ 39,915 $ 8,411 $ 15,613,100
LIABILITIESAccounts payable $ 80,588 $ 128,042 $ 306,995 $ 36,395 $ - $ 2,018,392 Retainage payable - - - - - 17,861 Accrued payroll deductions - 29,135 - - 171,950 Due to other governments - 2,323 9,703 - - 19,393 Due to other funds - 66,758 10,886 3,500 - 566,644 Unearned revenues - - - - - 505,866
Total liabilities 80,588 226,258 327,584 39,895 - 3,300,106
DEFERRED INFLOWS OF RESOURCESUnavailable revenue - taxes - - - - 5,846 13,438 Unavailable revenue - housing and development loans - 403,091 1,088,330 - - 1,491,421 Unavailable revenue - grants - 86,821 29,696 1,980 - 533,943
Total deferred inflows of resources - 489,912 1,118,026 1,980 5,846 2,038,802
FUND BALANCES (DEFICIT)Nonspendable:
Prepaid items - 3,409 602 - - 4,011 Long-term receivable - - - - - -
Restricted for:Debt service - - - - - - Grant programs - - - - - 1,812,742 Capital outlay 2,102,282 - - - - 2,102,282 Public safety - - - - - 1,135,998 Victim assistance - - - - - 45,506 Court programs - - - - - 2,343,421 Community development - 1,122,001 70,765 - 2,565 1,203,428
Committed:Law enforcement - - - - - 1,630,990
Assigned:Capital outlay - - - - - -
Unassigned (deficit) - - - (1,960) - (4,186)
Total fund balances (deficit) 2,102,282 1,125,410 71,367 (1,960) 2,565 10,274,192
Total liabilities, deferred inflows ofresources and fund balances $ 2,182,870 $ 1,841,580 $ 1,516,977 $ 39,915 $ 8,411 $ 15,613,100
NONMAJOR GOVERNMENTAL FUNDSCOMBINING BALANCE SHEET
MACON-BIBB COUNTY, GEORGIA
ECD ESGFund
DFACS ECD CDBGFundMIL
Special Revenue Funds (Continued)
JUNE 30, 2018

122
Capital Projects Funds
Ocmulgee 2013 2015 2014 2014 2014 Total General TotalCapital Greenway MBCUDA MBCUDA TAD TAD TAD Capital Debt Nonmajor
Improvements Trail Project Project Second Street Renaissance Bibb Mill Projects Service Funds
$ 36,485 $ 40,746 $ 61 $ 261 $ 1,350,971 $ 43,595 $ - $ 1,472,119 $ 11 $ 8,292,013 - 6,049 673,727 4,070,879 357,635 - - 5,108,290 10,952,264 18,596,478
- - - - 684 - - 684 - 397,755 - - - - - - - - - 590,917 - - - - - - - - - 1,644,873
3,950,955 - - - - - - 3,950,955 577,307 6,657,262 - - - - - - - - - 4,011
900,000 - - - - - - 900,000 - 2,391,421
$ 4,887,440 $ 46,795 $ 673,788 $ 4,071,140 $ 1,709,290 $ 43,595 $ - $ 11,432,048 $ 11,529,582 $ 38,574,730
$ 398,737 $ - $ 49,815 $ 397,392 $ 97,390 $ 43,596 $ - $ 986,930 $ - $ 3,005,322 - - - 10,821 - - 10,821 - 28,682
- - - - - - - - - 171,950 - - - - - - - - - 19,393 - - 2,500 80,000 - 123,861 76,359 282,720 - 849,364 - - - - - - - - - 505,866
398,737 - 52,315 477,392 108,211 167,457 76,359 1,280,471 - 4,580,577
- - - - - - - - - 13,438
- - - - - - - - - 1,491,421 - - - - - - - - - 533,943
- - - - - - - - - 2,038,802
- - - - - - - - - 4,011 900,000 - - - - - - 900,000 - 900,000
- - - - - - - - 11,529,582 11,529,582 - - - - - - - - - 1,812,742
3,550,551 - 621,473 3,593,748 1,601,079 - - 9,366,851 - 11,469,133 - - - - - - - - - 1,135,998 - - - - - - - - - 45,506 - - - - - - - - - 2,343,421 - - - - - - - - - 1,203,428
- - - - - - - - - 1,630,990
38,152 46,795 - - - - - 84,947 - 84,947 - - - - - (123,862) (76,359) (200,221) - (204,407)
4,488,703 46,795 621,473 3,593,748 1,601,079 (123,862) (76,359) 10,151,577 11,529,582 31,955,351
$ 4,887,440 $ 46,795 $ 673,788 $ 4,071,140 $ 1,709,290 $ 43,595 $ - $ 11,432,048 $ 11,529,582 $ 38,574,730
FundDebt Service

123
Special Middle Georgia Emergency Hotel/ Street Education Law Law
911 Motel Grants Light Corridor Enforcement EnforcementFund Tax Fund District BID Commissary Confiscation
REVENUESTaxes:
Property $ - $ - $ - $ - $ 334,850 $ - $ - Hotel/Motel - 4,203,930 - - - - -
Intergovernmental - - 8,108,178 - - - - Charges for services 2,706,963 - - 7,680 - 596,684 - Fines and forfeitures - - - - - - 138,385 Interest earned on investments 291 64 10,680 222 168 10,581 5,969 Rent - - - - - - - Other revenue - - - - - - -
Total revenues 2,707,254 4,203,994 8,118,858 7,902 335,018 607,265 144,354
EXPENDITURES Current
General government - - 5,250,643 - - - - Judicial - - 90,879 - - - - Public safety 3,328,254 - 206,274 - - 11,756 127,786 Public works - - 1,877,029 817,183 - - - Housing and development - - - - 333,927 - - Health and welfare - - - - - - - Culture and recreation - 3,007,285 - - - - -
Capital outlay - - 1,053,593 - - 73,682 - Debt service
Principal - - - - - - - Interest - - - - - - - Bond issuance costs - - - - - - -
Total expenditures 3,328,254 3,007,285 8,478,418 817,183 333,927 85,438 127,786
Excess (deficiency) of revenuesover (under) expenditures (621,000) 1,196,709 (359,560) (809,281) 1,091 521,827 16,568
OTHER FINANCING SOURCES (USES)
Proceeds from sale of property - - - - - - - Issuance of capital lease - - - - - - - Transfers in 621,999 - 66,445 854,666 - - - Transfers out - (1,196,709) - (50,000) - - - Issuance of bonds - - - - - - -
Total other financing sources (uses) 621,999 (1,196,709) 66,445 804,666 - - -
Net change in fund balances 999 - (293,115) (4,615) 1,091 521,827 16,568
FUND BALANCES (DEFICIT),beginning of year 3,251 - 2,105,857 4,615 7,006 1,109,163 905,173
FUND BALANCES (DEFICIT),end of year $ 4,250 $ - $ 1,812,742 $ - $ 8,097 $ 1,630,990 $ 921,741
NONMAJOR GOVERNMENTAL FUNDSFOR THE FISCAL YEAR ENDED JUNE 30, 2018
MACON-BIBB COUNTY, GEORGIA
COMBINING STATEMENT OF REVENUES, EXPENDITURES ANDCHANGES IN FUND BALANCES
Special Revenue Funds

124
Drug AbuseTreatment Alternative Crime Juvenile District
and Victims Court Attorney County JailEducation Resolution Assistance Supervision Library RICO Programs Fund
$ - $ - $ - $ - $ - $ - $ - $ - - - - - - - - - - - - - - - 21,360 - - - - - - - - -
121,142 262,454 65,178 2,168 29,994 2,398,585 - 132,842 363 4,077 611 102 62 7,932 1,620 1,121
- 3,600 - - - - - - - 560 - - - - 131,285 -
121,505 270,691 65,789 2,270 30,056 2,406,517 154,265 133,963
- - - - - - 180,705 - 73,359 201,410 2,664 - 26,039 1,279,496 19,938 -
- - - - - - 1,000 158 - - - - - - 3,995 - - - - - - - - - - - - - - - - - - - - - - - - - - - - - - - 8,000 -
- - - - - - - - - - - - - - - - - - - - - - -
73,359 201,410 2,664 - 26,039 1,279,496 213,638 158
48,146 69,281 63,125 2,270 4,017 1,127,021 (59,373) 133,805
- - - - - - - - - - - - - - - - - - - - - - 62,427 -
(15,129) - (54,575) - - - - (100,000) - - - - - - - -
(15,129) - (54,575) - - - 62,427 (100,000)
33,017 69,281 8,550 2,270 4,017 1,127,021 3,054 33,805
44,600 369,395 36,956 9,153 5,335 679,332 (5,280) 176,202
$ 77,617 $ 438,676 $ 45,506 $ 11,423 $ 9,352 $ 1,806,353 $ (2,226) $ 210,007
Special Revenue Funds (Continued)
Dispute Law SponsoredMacon-Bibb

125
Downtown TotalDFACS ECD CDBG Grant ECD ESG Macon Special
Fund Fund Fund BID RevenueREVENUES
Taxes:Property $ - $ - $ - $ - $ 343,122 $ 677,972 Hotel/Motel - - - - - 4,203,930
Intergovernmental - 1,172,120 662,983 164,414 - 10,129,055 Charges for services - - - - - 3,311,327 Fines and forfeitures - - - - - 3,150,748 Interest earned on investments 22,664 18,439 35,556 19 - 120,541 Rent 466,078 - - - - 469,678 Other revenue - 208,128 195,495 - - 535,468
Total revenues 488,742 1,398,687 894,034 164,433 343,122 22,598,719
EXPENDITURES Current
General government - - - - - 5,431,348 Judicial - - - - - 1,693,785 Public safety - - - - - 3,675,228 Public works - - - - - 2,698,207 Housing and development - 1,325,719 1,114,624 164,414 340,557 3,279,241 Health and welfare 457,676 - - - - 457,676 Culture and recreation - - - - - 3,007,285
Capital outlay - - - - - 1,135,275 Debt service
Principal - - - - - - Interest - - - - - - Bond issuance costs - - - - - -
Total expenditures 457,676 1,325,719 1,114,624 164,414 340,557 21,378,045
Excess (deficiency) of revenuesover (under) expenditures 31,066 72,968 (220,590) 19 2,565 1,220,674
OTHER FINANCING SOURCES (USES)
Proceeds from sale of propertyIssuance of capital leaseTransfers in - - 73,000 - - 1,678,537 Transfers out - - - - - (1,416,413) Issuance of bonds - - - - - -
Total other financing sources (uses) - - 73,000 - - 262,124
Net change in fund balances 31,066 72,968 (147,590) 19 2,565 1,482,798
FUND BALANCES (DEFICIT),beginning of year 2,071,216 1,052,442 218,957 (1,979) - 8,791,394
FUND BALANCES (DEFICIT),end of year $ 2,102,282 $ 1,125,410 $ 71,367 $ (1,960) $ 2,565 $ 10,274,192
NONMAJOR GOVERNMENTAL FUNDSFOR THE FISCAL YEAR ENDED JUNE 30, 2018
MACON-BIBB COUNTY, GEORGIA
COMBINING STATEMENT OF REVENUES, EXPENDITURES ANDCHANGES IN FUND BALANCES
Special Revenue Funds (Continued)
MIL
ECD HOME

126
Debt ServiceFund
Ocmulgee 2013 2015 2014 2014 2014 Total General TotalCapital Greenway MBCUDA MBCUDA TAD TAD TAD Capital Debt Nonmajor
Improvements Trail Project Project Second Street Renaissance Bibb Mill Projects Service Funds
-$ -$ -$ -$ 448,498$ -$ -$ 448,498$ -$ 1,126,470$ - - - - - - - - - 4,203,930 - - - - - - - - 447,477 10,576,532 - - - - - - - - - 3,311,327 - - - - - - - - - 3,150,748
13,200 270 10,220 75,290 5,738 - 43 104,761 745,508 970,810 20,913 - - - - - - 20,913 - 490,591 24,366 - - - - - - 24,366 - 559,834 58,479 270 10,220 75,290 454,236 - 43 598,538 1,192,985 24,390,242
- - - - - - - - - 5,431,348 - - - - - - - - - 1,693,785 - - - - - - - - - 3,675,228 - - - - - - - - - 2,698,207 - - - - - - - - - 3,279,241 - - - - - - - - - 457,676 - - - - - - - - - 3,007,285
2,341,710 - 435,412 3,932,558 108,209 46,582 - 6,864,471 - 7,999,746
- - - - 3,000,000 50,000 250,000 3,300,000 226,853 3,526,853 - - - - 73,667 550 2,750 76,967 906,159 983,126 - - - - 140,528 - - 140,528 500 141,028
2,341,710 - 435,412 3,932,558 3,322,404 97,132 252,750 10,381,966 1,133,512 32,893,523
(2,283,231) 270 (425,192) (3,857,268) (2,868,168) (97,132) (252,707) (9,783,428) 59,473 (8,503,281)
4,800,000 - - 204,382 - - - 5,004,382 - 5,004,382 470,167 - - - - - - 470,167 - 470,167 222,955 - - - - - - 222,955 1,805,846 3,707,338
- - - - - (26,730) (13,938) (40,668) (72,955) (1,530,036) 1,150,000 - - - 3,174,278 - - 4,324,278 - 4,324,278
6,643,122 - - 204,382 3,174,278 (26,730) (13,938) 9,981,114 1,732,891 11,976,129
4,359,891 270 (425,192) (3,652,886) 306,110 (123,862) (266,645) 197,686 1,792,364 3,472,848
128,812 46,525 1,046,665 7,246,634 1,294,969 - 190,286 9,953,891 9,737,218 28,482,503
4,488,703$ 46,795$ 621,473$ 3,593,748$ 1,601,079$ (123,862)$ (76,359)$ 10,151,577$ 11,529,582$ 31,955,351$
Capital Projects Funds

127
SCHEDULE OF REVENUES, EXPENDITURES AND CHANGES IN FUND BALANCESBUDGET AND ACTUALEMERGENCY 911 FUND
FOR THE FISCAL YEAR ENDED JUNE 30, 2018
Final VarianceBudget
AmountsREVENUES
Charges for services $ 2,880,000 $ 2,706,963 $ (173,037) Interest earned on investments - 291 291
Total revenues 2,880,000 2,707,254 (172,746)
EXPENDITURES Current:
Public safety 3,413,795 3,328,254 85,541 Debt service:
Principal 16,000 - 16,000 Interest 3,000 - 3,000
Total expenditures 3,432,795 3,328,254 104,541
Deficiency of revenues under expenditures (552,795) (621,000) (68,205)
OTHER FINANCING SOURCESTransfers in 500,000 621,999 121,999 Proceeds from long-term debt - - -
Total other financing sources 500,000 621,999 121,999
Net change in fund balances (52,795) 999 53,794
FUND BALANCES, beginning of year 3,251 3,251 -
FUND BALANCES, end of year $ (49,544) $ 4,250 $ 53,794
MACON-BIBB COUNTY, GEORGIA
withActual Final Budget

128
SCHEDULE OF REVENUES, EXPENDITURES AND CHANGES IN FUND BALANCESBUDGET AND ACTUAL
MACON-BIBB COUNTY, GEORGIA
HOTEL/MOTEL TAX FUNDFOR THE FISCAL YEAR ENDED JUNE 30, 2018
Final VarianceBudget
AmountsREVENUES
Hotel/motel taxes $ 4,203,931 $ 4,203,930 $ (1) Interest earned on investments 63 64 1
Total revenues 4,203,994 4,203,994 -
EXPENDITURES Current:
Culture and recreation 3,007,285 3,007,285 - Total expenditures 3,007,285 3,007,285 -
Excess of revenues over expenditures 1,196,709 1,196,709 -
OTHER FINANCING USESTransfers out (1,196,709) (1,196,709) -
Total other financing uses (1,196,709) (1,196,709) -
Net change in fund balances - - -
FUND BALANCES, beginning of year - - -
FUND BALANCES, end of year $ - $ - $ -
withActual Final Budget

129
SCHEDULE OF REVENUES, EXPENDITURES AND CHANGES IN FUND BALANCESBUDGET AND ACTUAL
MACON-BIBB COUNTY, GEORGIA
GRANTS FUNDFOR THE FISCAL YEAR ENDED JUNE 30, 2018
Final VarianceBudget
AmountsREVENUES
Intergovernmental $ 31,903,417 $ 8,108,178 $ (23,795,239) Other revenue 151,848 - (151,848) Interest earned on investments - 10,680 10,680
Total revenues 32,055,265 8,118,858 (23,936,407)
EXPENDITURES Current:
General government 24,394,641 5,250,643 19,143,998 Public safety 520,490 206,274 314,216 Public works 1,877,029 1,877,029 - Judicial 242,998 90,879 152,119
Capital outlay 5,542,328 1,053,593 4,488,735 Total expenditures 32,577,486 8,478,418 24,099,068
Deficiency of revenues under expenditures (522,221) (359,560) 162,661
OTHER FINANCING SOURCESTransfers in 146,241 66,445 (79,796)
Total other financing sources 146,241 66,445 (79,796)
Net change in fund balances (375,980) (293,115) 82,865
FUND BALANCES, beginning of year 2,105,857 2,105,857 -
FUND BALANCES, end of year $ 1,729,877 $ 1,812,742 $ 82,865
Actual Final Budgetwith

130
SCHEDULE OF REVENUES, EXPENDITURES AND CHANGES IN FUND BALANCESBUDGET AND ACTUAL
MACON-BIBB COUNTY, GEORGIA
SPECIAL STREET LIGHT DISTRICT FUNDFOR THE FISCAL YEAR ENDED JUNE 30, 2018
Final VarianceBudget
AmountsREVENUES
Charges for services $ - $ 7,680 $ 7,680 Interest earned on investments - 222 222
Total revenues - 7,902 7,902
EXPENDITURES Current:
Public works 817,184 817,183 1 Total expenditures 817,184 817,183 1
Excess (deficiency) of revenues over (under) expenditures (817,184) (809,281) 7,903
OTHER FINANCING SOURCES (USES)Transfers in 500,000 854,666 354,666 Transfers out (50,000) (50,000) -
Total other financing sources 450,000 804,666 354,666
Net change in fund balances (367,184) (4,615) 362,569
FUND BALANCES, beginning of year 4,615 4,615 -
FUND BALANCES, end of year $ (362,569) $ - $ 362,569
withActual Final Budget

131
SCHEDULE OF REVENUES, EXPENDITURES AND CHANGES IN FUND BALANCESBUDGET AND ACTUAL
MACON-BIBB COUNTY, GEORGIA
MIDDLE GEORGIA EDUCATION CORRIDOR BID FUNDFOR THE FISCAL YEAR ENDED JUNE 30, 2018
Final VarianceBudget
AmountsREVENUES
Property taxes $ 333,927 $ 334,850 $ 923 Interest earned on investments - 168 168
Total revenues 333,927 335,018 1,091
EXPENDITURES Current:
Housing and development 333,927 333,927 - Total expenditures 333,927 333,927 -
Net change in fund balances - 1,091 1,091
FUND BALANCES, beginning of year 7,006 7,006 -
FUND BALANCES, end of year $ 7,006 $ 8,097 $ 1,091
Final Budgetwith
Actual

132
SCHEDULE OF REVENUES, EXPENDITURES AND CHANGES IN FUND BALANCESBUDGET AND ACTUAL
MACON-BIBB COUNTY, GEORGIA
LAW ENFORCEMENT COMMISSARY FUNDFOR THE FISCAL YEAR ENDED JUNE 30, 2018
Final VarianceBudget
AmountsREVENUES
Charges for services $ 356,500 $ 596,684 $ 240,184 Interest earned on investments 1,200 10,581 9,381
Total revenues 357,700 607,265 249,565
EXPENDITURES Current:
Public safety 31,000 11,756 19,244 Capital outlay 373,388 73,682 299,706 Total expenditures 404,388 85,438 318,950
Net change in fund balances (46,688) 521,827 568,515
FUND BALANCES, beginning of year 1,109,163 1,109,163 -
FUND BALANCES, end of year $ 1,062,475 $ 1,630,990 $ 568,515
withActual Final Budget

133
SCHEDULE OF REVENUES, EXPENDITURES AND CHANGES IN FUND BALANCESBUDGET AND ACTUAL
MACON-BIBB COUNTY, GEORGIA
LAW ENFORCEMENT CONFISCATION FUNDFOR THE FISCAL YEAR ENDED JUNE 30, 2018
Final VarianceBudget
AmountsREVENUES
Fines and forfeitures $ 50,000 $ 138,385 $ 88,385 Interest earned on investments 300 5,969 5,669
Total revenues 50,300 144,354 94,054
EXPENDITURES Current:
Public safety 163,763 127,786 35,977 Total expenditures 163,763 127,786 35,977
Excess (deficiency) of revenues over (under) expenditures (113,463) 16,568 130,031
OTHER FINANCING USESTransfers out - - -
Total other financing uses - - -
Net change in fund balances (113,463) 16,568 130,031
FUND BALANCES, beginning of year 905,173 905,173 -
FUND BALANCES, end of year $ 791,710 $ 921,741 $ 130,031
Final BudgetActualwith

134
SCHEDULE OF REVENUES, EXPENDITURES AND CHANGES IN FUND BALANCESBUDGET AND ACTUAL
MACON-BIBB COUNTY, GEORGIA
DRUG ABUSE TREATMENT AND EDUCATION FUNDFOR THE FISCAL YEAR ENDED JUNE 30, 2018
Final VarianceBudget
AmountsREVENUES
Intergovernmental $ 114,932 $ - $ (114,932) Fines and forfeitures 105,000 121,142 16,142 Interest earned on investments - 363 363
Total revenues 219,932 121,505 (98,427)
EXPENDITURES Current:
Judicial 224,266 73,359 150,907 Total expenditures 224,266 73,359 150,907
Excess (deficiency) of revenues over (under) expenditures (4,334) 48,146 52,480
OTHER FINANCING USESTransfers out (17,666) (15,129) 2,537
Total other financing uses (17,666) (15,129) 2,537
Net change in fund balances (22,000) 33,017 55,017
FUND BALANCES, beginning of year 44,600 44,600 -
FUND BALANCES, end of year $ 22,600 $ 77,617 $ 55,017
Actual Final Budgetwith

135
SCHEDULE OF REVENUES, EXPENDITURES AND CHANGES IN FUND BALANCESBUDGET AND ACTUAL
MACON-BIBB COUNTY, GEORGIA
ALTERNATIVE DISPUTE RESOLUTION FUNDFOR THE FISCAL YEAR ENDED JUNE 30, 2018
Final VarianceBudget
AmountsREVENUES
Fines and forfeitures $ 198,750 $ 262,454 $ 63,704 Interest earned on investments - 4,077 4,077 Rent 4,000 3,600 (400) Other revenue - 560 560
Total revenues 202,750 270,691 67,941
EXPENDITURES Current:
Judicial 216,578 201,410 15,168 Total expenditures 216,578 201,410 15,168
Net change in fund balances (13,828) 69,281 83,109
FUND BALANCES, beginning of year 369,395 369,395 -
FUND BALANCES, end of year $ 355,567 $ 438,676 $ 83,109
withActual Final Budget

136
SCHEDULE OF REVENUES, EXPENDITURES AND CHANGES IN FUND BALANCESBUDGET AND ACTUAL
MACON-BIBB COUNTY, GEORGIA
CRIME VICTIMS ASSISTANCE FUNDFOR THE FISCAL YEAR ENDED JUNE 30, 2018
Final VarianceBudget
AmountsREVENUES
Fines and forfeitures $ 82,049 $ 65,178 $ (16,871) Interest earned on investments - 611 611
Total revenues 82,049 65,789 (16,260)
EXPENDITURES Current:
Judicial 17,838 2,664 15,174 Total expenditures 17,838 2,664 15,174
Excess of revenues over expenditures 64,211 63,125 (1,086)
OTHER FINANCING USESTransfers out (64,211) (54,575) 9,636
Total other financing uses (64,211) (54,575) 9,636
Net change in fund balances - 8,550 8,550
FUND BALANCES, beginning of year 36,956 36,956 -
FUND BALANCES, end of year $ 36,956 $ 45,506 $ 8,550
Final Budgetwith
Actual

137
SCHEDULE OF REVENUES, EXPENDITURES AND CHANGES IN FUND BALANCESBUDGET AND ACTUAL
MACON-BIBB COUNTY, GEORGIA
JUVENILE COURT SUPERVISION FUNDFOR THE FISCAL YEAR ENDED JUNE 30, 2018
Final VarianceBudget
AmountsREVENUES
Fines and forfeitures $ - $ 2,168 $ 2,168 Interest earned on investments - 102 102
Total revenues - 2,270 2,270
Net change in fund balances - 2,270 2,270
FUND BALANCES, beginning of year 9,153 9,153 -
FUND BALANCES, end of year $ 9,153 $ 11,423 $ 2,270
Final Budgetwith
Actual

138
SCHEDULE OF REVENUES, EXPENDITURES AND CHANGES IN FUND BALANCESBUDGET AND ACTUAL
MACON-BIBB COUNTY, GEORGIA
LAW LIBRARY FUNDFOR THE FISCAL YEAR ENDED JUNE 30, 2018
Final VarianceBudget
AmountsREVENUES
Fines and forfeitures $ 26,039 $ 29,994 $ 3,955 Interest earned on investments - 62 62
Total revenues 26,039 30,056 4,017
EXPENDITURES Current:
Judicial 26,039 26,039 - Total expenditures 26,039 26,039 -
Net change in fund balances - 4,017 4,017
FUND BALANCES, beginning of year 5,335 5,335 -
FUND BALANCES, end of year $ 5,335 $ 9,352 $ 4,017
Actual Final Budgetwith
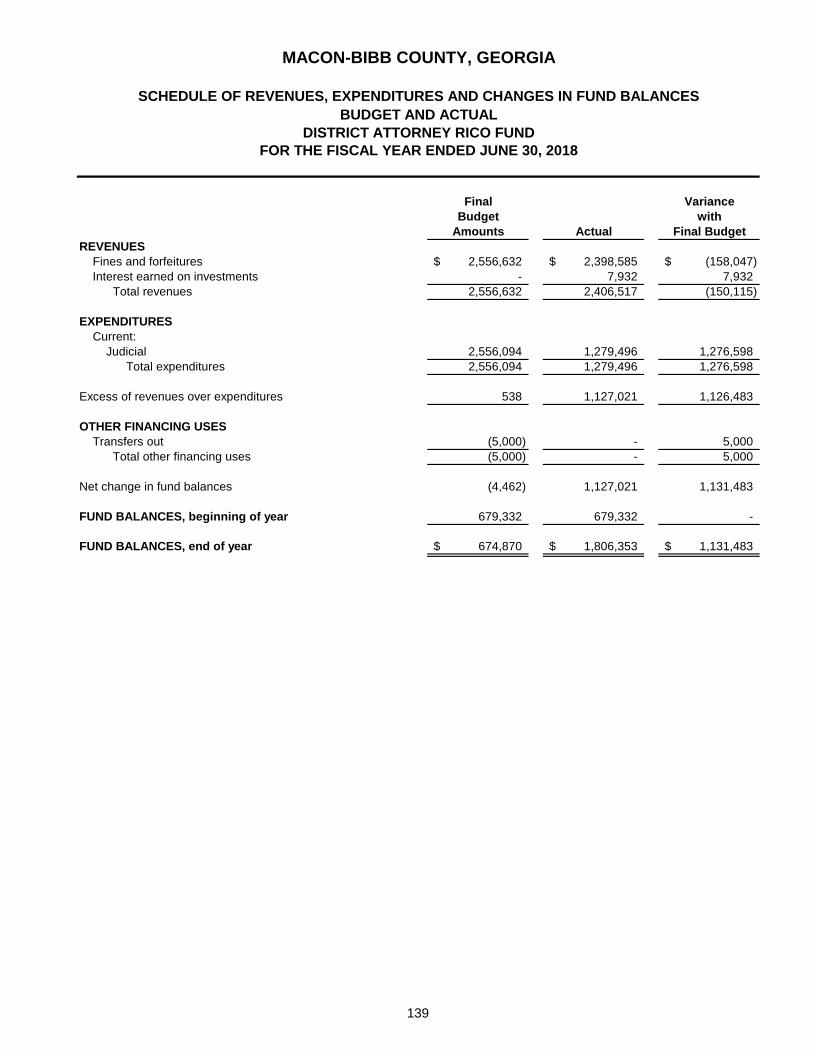
139
SCHEDULE OF REVENUES, EXPENDITURES AND CHANGES IN FUND BALANCESBUDGET AND ACTUAL
MACON-BIBB COUNTY, GEORGIA
DISTRICT ATTORNEY RICO FUNDFOR THE FISCAL YEAR ENDED JUNE 30, 2018
Final VarianceBudget
AmountsREVENUES
Fines and forfeitures $ 2,556,632 $ 2,398,585 $ (158,047) Interest earned on investments - 7,932 7,932
Total revenues 2,556,632 2,406,517 (150,115)
EXPENDITURES Current:
Judicial 2,556,094 1,279,496 1,276,598 Total expenditures 2,556,094 1,279,496 1,276,598
Excess of revenues over expenditures 538 1,127,021 1,126,483
OTHER FINANCING USESTransfers out (5,000) - 5,000
Total other financing uses (5,000) - 5,000
Net change in fund balances (4,462) 1,127,021 1,131,483
FUND BALANCES, beginning of year 679,332 679,332 -
FUND BALANCES, end of year $ 674,870 $ 1,806,353 $ 1,131,483
Final Budgetwith
Actual

140
SCHEDULE OF REVENUES, EXPENDITURES AND CHANGES IN FUND BALANCESBUDGET AND ACTUAL
MACON-BIBB COUNTY, GEORGIA
SPONSORED PROGRAMS FUNDFOR THE FISCAL YEAR ENDED JUNE 30, 2018
Final VarianceBudget
AmountsREVENUES
Intergovernmental $ 390,676 $ 21,360 $ (369,316) Interest earned on investments - 1,620 1,620 Other revenue 449,068 131,285 (317,783)
Total revenues 839,744 154,265 (685,479)
EXPENDITURES Current:
General government 528,083 180,705 347,378 Judicial 29,816 19,938 9,878 Public safety 30,609 1,000 29,609 Public works 127,511 3,995 123,516 Housing and development 25,000 - 25,000 Health and welfare - - - Culture and recreation 29,168 - 29,168 Capital outlay 150,100 8,000 142,100
Total expenditures 920,287 213,638 706,649
Excess (deficiency) of revenues over (under) expenditures (80,543) (59,373) 21,170
OTHER FINANCING SOURCESTransfers in 75,000 62,427 (12,573)
Total other financing sources 75,000 62,427 (12,573)
Net change in fund balances (5,543) 3,054 8,597
FUND BALANCES (DEFICITS), beginning of year (5,280) (5,280) -
FUND BALANCES (DEFICITS), end of year $ (10,823) $ (2,226) $ 8,597
withActual Final Budget

141
SCHEDULE OF REVENUES, EXPENDITURES AND CHANGES IN FUND BALANCESBUDGET AND ACTUAL
MACON-BIBB COUNTY, GEORGIA
MACON-BIBB COUNTY JAIL FUNDFOR THE FISCAL YEAR ENDED JUNE 30, 2018
Final VarianceBudget
AmountsREVENUES
Fines and forfeitures $ 132,158 $ 132,842 $ 684 Interest earned on investments - 1,121 1,121
Total revenues 132,158 133,963 1,805
EXPENDITURES Current:
Public safety 158 158 - Total expenditures 158 158 -
Excess of revenues over expenditures 132,000 133,805 1,805
OTHER FINANCING USESTransfers out (132,000) (100,000) 32,000
Total other financing uses (132,000) (100,000) 32,000
Net change in fund balances - 33,805 33,805
FUND BALANCES, beginning of year 176,202 176,202 -
FUND BALANCES, end of year $ 176,202 $ 210,007 $ 33,805
withActual Final Budget

142
SCHEDULE OF REVENUES, EXPENDITURES AND CHANGES IN FUND BALANCESBUDGET AND ACTUAL
MACON-BIBB COUNTY, GEORGIA
DFACS MIL FUNDFOR THE FISCAL YEAR ENDED JUNE 30, 2018
Final VarianceBudget
AmountsREVENUES
Interest earned on investments $ - $ 22,664 $ 22,664 Rent 332,035 466,078 134,043
Total revenues 332,035 488,742 156,707
EXPENDITURES Current:
Health and welfare 545,356 457,676 87,680 Total expenditures 545,356 457,676 87,680
Net change in fund balances (213,321) 31,066 244,387
FUND BALANCES, beginning of year 2,071,216 2,071,216 -
FUND BALANCES, end of year $ 1,857,895 $ 2,102,282 $ 244,387
Actual Final Budgetwith

143
SCHEDULE OF REVENUES, EXPENDITURES AND CHANGES IN FUND BALANCESBUDGET AND ACTUAL
MACON-BIBB COUNTY, GEORGIA
ECD CDBG FUNDFOR THE FISCAL YEAR ENDED JUNE 30, 2018
Final VarianceBudget
AmountsREVENUES
Intergovernmental $ 1,440,698 $ 1,172,120 $ (268,578) Interest earned on investments - 18,439 18,439 Other revenue 125,000 208,128 83,128
Total revenues 1,565,698 1,398,687 (167,011)
EXPENDITURES Current:
Housing and development 2,206,802 1,325,719 881,083 Total expenditures 2,206,802 1,325,719 881,083
Net change in fund balances (641,104) 72,968 714,072
FUND BALANCES, beginning of year 1,052,442 1,052,442 -
FUND BALANCES, end of year $ 411,338 $ 1,125,410 $ 714,072
withActual Final Budget

144
SCHEDULE OF REVENUES, EXPENDITURES AND CHANGES IN FUND BALANCESBUDGET AND ACTUAL
MACON-BIBB COUNTY, GEORGIA
ECD HOME GRANT FUNDFOR THE FISCAL YEAR ENDED JUNE 30, 2018
Final VarianceBudget
AmountsREVENUES
Intergovernmental $ 584,088 $ 662,983 $ 78,895 Interest earned on investments - 35,556 35,556 Other revenue 125,000 195,495 70,495
Total revenues 709,088 894,034 184,946
EXPENDITURES Current:
Housing and development 1,114,833 1,114,624 209 Total expenditures 1,114,833 1,114,624 209
Excess (deficiency) of revenues over (under) expenditures (405,745) (220,590) 185,155
OTHER FINANCING SOURCESTransfers in - 73,000 73,000
Total other financing sources - 73,000 73,000
Net change in fund balances (405,745) (147,590) 258,155
FUND BALANCES, beginning of year 218,957 218,957 -
FUND BALANCES, end of year $ (186,788) $ 71,367 $ 258,155
Actual Final Budgetwith

145
SCHEDULE OF REVENUES, EXPENDITURES AND CHANGES IN FUND BALANCESBUDGET AND ACTUAL
MACON-BIBB COUNTY, GEORGIA
ECD ESG FUNDFOR THE FISCAL YEAR ENDED JUNE 30, 2018
Final VarianceBudget
AmountsREVENUES
Intergovernmental $ 164,617 $ 164,414 $ (203) Interest earned on investments - 19 19
Total revenues 164,617 164,433 (184)
EXPENDITURES Current:
Housing and development 164,617 164,414 203 Total expenditures 164,617 164,414 203
Net change in fund balances - 19 19
FUND BALANCES (DEFICIT), beginning of year (1,979) (1,979) -
FUND BALANCES (DEFICIT), end of year $ (1,979) $ (1,960) $ 19
withActual Final Budget
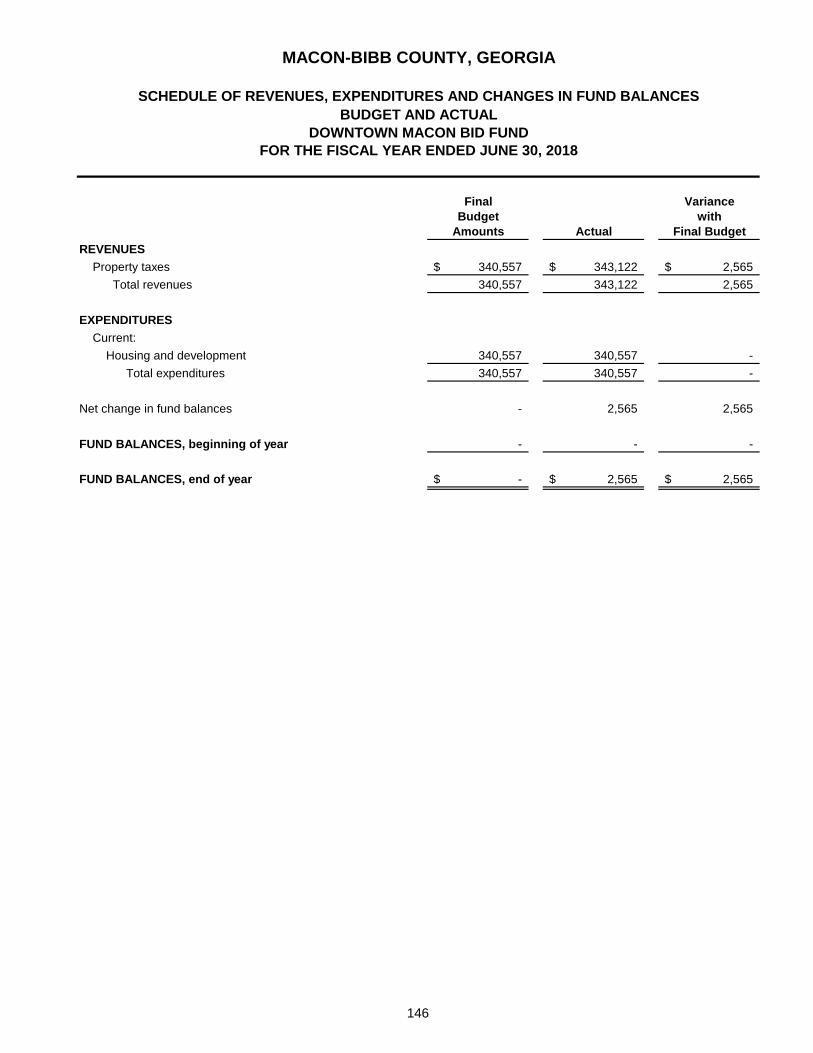
146
SCHEDULE OF REVENUES, EXPENDITURES AND CHANGES IN FUND BALANCESBUDGET AND ACTUAL
MACON-BIBB COUNTY, GEORGIA
DOWNTOWN MACON BID FUNDFOR THE FISCAL YEAR ENDED JUNE 30, 2018
REVENUESProperty taxes $ 340,557 $ 343,122 $ 2,565
Total revenues 340,557 343,122 2,565
EXPENDITURES Current:
Housing and development 340,557 340,557 - Total expenditures 340,557 340,557 -
Net change in fund balances - 2,565 2,565
FUND BALANCES, beginning of year - - -
FUND BALANCES, end of year $ - $ 2,565 $ 2,565
FinalBudget
Amounts
Variancewith
Actual Final Budget

147
SCHEDULE OF REVENUES, EXPENDITURES AND CHANGES IN FUND BALANCESBUDGET AND ACTUAL
MACON-BIBB COUNTY, GEORGIA
DEBT SERVICE FUNDFOR THE FISCAL YEAR ENDED JUNE 30, 2018
Final VarianceBudget
AmountsREVENUES
Intergovernmental $ 440,736 $ 447,477 $ 6,741 Interest earned on investments 115,000 745,508 630,508
Total revenues 555,736 1,192,985 637,249
EXPENDITURES Debt service:
Principal 1,211,841 226,853 984,988 Interest and fees 906,160 906,159 1 Bond issuance costs 500 500 -
Total expenditures 2,118,501 1,133,512 984,989
Excess (deficiency) of revenues over (under) expenditures (1,562,765) 59,473 1,622,238
OTHER FINANCING SOURCES (USES)Transfers in 1,562,765 1,805,846 243,081 Transfers out (126,317) (72,955) 53,362
Total other financing sources (uses) 1,436,448 1,732,891 296,443
Net change in fund balances (126,317) 1,792,364 1,918,681
FUND BALANCES, beginning of year 9,737,218 9,737,218 -
FUND BALANCES, end of year $ 9,610,901 $ 11,529,582 $ 1,918,681
Actual Final Budgetwith

Nonmajor Enterprise Funds
The Tobesofkee Recreation Fund accounts for the operations and maintenance of a recreation facility on Lake Tobesofkee in Macon-Bibb County. All activities necessary to provide such services are accounted for in this fund. The Coliseum Fund accounts for the activities of the Macon Coliseum and the Macon Auditorium. The Mulberry Street Parking Garage Fund is used to account for the activities of the downtown parking garage. The Bowden Golf Course Fund is used to account for the operations and maintenance of a municipal golf course in Macon-Bibb County.

148
Mulberry StreetTobesofkee Parking Bowden Recreation Coliseum Garage Golf Course
Fund Fund Fund Fund TotalAssetsCurrent assets
$ 366,905 $ 3,638 $ 9,169 $ 93,349 $ 473,061
11,464 - 20,744 - 32,208 - 280,000 - - 280,000
378,369 283,638 29,913 93,349 785,269
Cash and cash equivalents Receivables, net of allowance
for uncollectible accounts Due from other funds
Total current assets
Capital assetsLand 418,891 72,260 - 773,621 1,264,772 Construction in progress - - - 297,273 297,273 Earthen dam 2,625,294 - - - 2,625,294 Land improvements 1,905,664 712,299 - - 2,617,963 Dam improvements 2,084,004 - - - 2,084,004 Buildings 724,554 13,095,194 175,830 1,086,379 15,081,957 Building improvements 941,458 - - - 941,458 Machinery, equipment and furniture 409,791 3,937,469 - 181,141 4,528,401 Vehicles 224,247 141,756 - 204,533 570,536 Infrastructure and roads 356,307 - - - 356,307
9,690,210 17,958,978 175,830 2,542,947 30,367,965 Less accumulated depreciation (4,775,869) (10,862,239) (87,915) (1,217,831) (16,943,854)
4,914,341 7,096,739 87,915 1,325,116 13,424,111
Total noncurrent assets 4,914,341 7,096,739 87,915 1,325,116 13,424,111
Total assets 5,292,710 7,380,377 117,828 1,418,465 14,209,380
Deferred Outflows of ResourcesPensions 138,809 - - 101,536 240,345
Total deferred outflows of resources 138,809 - - 101,536 240,345
LiabilitiesCurrent liabilities
Current liabilities payable from current assetsAccounts payable 62,728 189,141 9,111 27,271 288,251 Accrued payroll deductions 41,169 - - 20,871 62,040 Due to other funds 21,600 - 20,800 70,000 112,400 Unearned revenue 10,000 - - - 10,000 Compensated absences payable 12,742 - - 10,470 23,212
Total current liabilities 148,239 189,141 29,911 128,612 495,903
Noncurrent liabilitiesCompensated absences payable 36,321 - - 5,094 41,415 Net pension liability 851,880 - - 416,410 1,268,290
Total noncurrent liabilities 888,201 - - 421,504 1,309,705
Total liabilities 1,036,440 189,141 29,911 550,116 1,805,608
Deferred inflows of resourcesPensions 25,838 - - 33,973 59,811
Total deferred inflows of resources 25,838 - - 33,973 59,811
Net PositionInvestment in capital assets 4,914,341 7,096,739 87,915 1,325,116 13,424,111 Unrestricted (545,100) 94,497 2 (389,204) (839,805)
Total net position 4,369,241 7,191,236 87,917 935,912 12,584,306
MACON-BIBB COUNTY, GEORGIA
JUNE 30, 2018NONMAJOR ENTERPRISE FUNDS
COMBINING STATEMENT OF NET POSITION

149
Mulberry StreetTobesofkee Parking Bowden Recreation Coliseum Garage Golf Course
Fund Fund Fund Fund TotalOperating revenues
Charges for sales and services $ 776,607 $ - $ 135,828 $ 235,013 $ 1,147,448 Total operating revenues 776,607 - 135,828 235,013 1,147,448
Operating expensesAdministration 1,335,168 996,532 147,372 685,576 3,164,648 Depreciation 197,449 711,475 8,791 39,880 957,595
Total operating expenses 1,532,617 1,708,007 156,163 725,456 4,122,243
Operating loss (756,010) (1,708,007) (20,335) (490,443) (2,974,795)
Nonoperating revenues Interest earned on investments 1,109 593 1 246 1,949
Total nonoperating revenues 1,109 593 1 246 1,949
Loss before transfers and contributions (754,901) (1,707,414) (20,334) (490,197) (2,972,846)
Capital contribution 139,170 763,092 - 297,273 1,199,535
Transfers in 550,261 996,529 9,091 400,000 1,955,881
Change in net position (65,470) 52,207 (11,243) 207,076 182,570
Net position, beginning of year 4,434,711 7,139,029 99,160 728,836 12,401,736
Net position, end of year $ 4,369,241 $ 7,191,236 $ 87,917 $ 935,912 $ 12,584,306
FOR THE FISCAL YEAR ENDED JUNE 30, 2018NONMAJOR ENTERPRISE FUNDS
COMBINING STATEMENT OF REVENUES, EXPENSES AND CHANGES IN FUND NET POSITION
MACON-BIBB COUNTY, GEORGIA

150
Mulberry StreetTobesofkee Parking Bowden Recreation Coliseum Garage Golf Course
Fund Fund Fund Fund TotalCASH FLOWS FROM OPERATING
ACTIVITIESReceipts from customers $ 780,547 $ - $ 119,816 $ 236,309 $ 1,136,672 Payments to employees (820,773) - - (392,329) (1,213,102) Payments to suppliers (410,865) (1,193,293) (143,567) (223,032) (1,970,757)
Net cash used in operating activities (451,091) (1,193,293) (23,751) (379,052) (2,047,187)
CASH FLOWS FROM NONCAPITAL FINANCING ACTIVITIES Transfers from other funds 550,261 996,529 9,091 400,000 1,955,881 Change in due to/from other funds (5,400) 120,000 20,800 35,000 170,400
Net cash provided by noncapitalfinancing activities 544,861 1,116,529 29,891 435,000 2,126,281
CASH FLOWS FROM CAPITAL ANDRELATED FINANCING ACTIVITIES
Purchase of capital assets (40,190) - - - (40,190)
Net cash used in capital and related financing activities (40,190) - - - (40,190)
CASH FLOWS FROM INVESTING ACTIVITIES Interest on investments 1,109 593 1 246 1,949
Net cash provided by investing activities 1,109 593 1 246 1,949
Net increase (decrease) in cash and cash equivalents 54,689 (76,171) 6,141 56,194 40,853
Cash and cash equivalents, beginning of year 312,216 79,809 3,028 37,155 432,208
Cash and cash equivalents, end of year $ 366,905 $ 3,638 $ 9,169 $ 93,349 $ 473,061
Reconciliation of operating loss to netcash used in operating activities:Operating loss $ (756,010) $ (1,708,007) $ (20,335) $ (490,443) $ (2,974,795) Adjustments to reconcile operating
loss to net cash used in operating activities:Depreciation expense 197,449 711,475 8,791 39,880 957,595 (Increase) decrease in accounts receivable 3,940 - (16,012) 1,296 (10,776) Decrease in prepaid expenses 7,083 - - - 7,083 Increase (decrease) in accounts and retainage payable 18,776 (196,761) 3,805 5,625 (168,555) Increase in accrued payroll deductions 9,360 - - 9,820 19,180 Increase in accrued benefits payable 4,323 - - 2,550 6,873 Increase in unearned revenue 2,500 - - - 2,500 Increase in net pension liability 61,488 - - 52,220 113,708
Net cash used in operating activities $ (451,091) $ (1,193,293) $ (23,751) $ (379,052) $ (2,047,187)
Schedule of Non-cash Capital and Related Financing Activities Contributions of capital assets from other funds $ 139,170 $ 763,092 $ - $ 297,273 $ 1,199,535
FOR THE FISCAL YEAR ENDED JUNE 30, 2018NONMAJOR ENTERPRISE FUNDS
COMBINING STATEMENT OF CASH FLOWS
MACON-BIBB COUNTY, GEORGIA

Internal Service Funds
The Vehicle Maintenance Fund accounts for servicing of certain personal property of Macon-Bibb County primarily related to transportation equipment. The Group Insurance Fund accounts for the self-funded group insurance plan for the benefit of the employees of Macon-Bibb County, Georgia.

151
COMBINING STATEMENT OF NET POSITION INTERNAL SERVICE FUNDS
Vehicle GroupMaintenance Insurance
Fund Fund TotalAssetsCurrent assets
Cash and cash equivalents $ 411,022 $ 727,726 $ 1,138,748 Receivables, net of allowance
accounts 1,228 285,776 287,004 Due from other governments - 53,227 53,227 Due from other funds - 3,500,000 3,500,000
Total current assets 412,250 4,566,729 4,978,979
Noncurrent assetsCapital assets
Land 80,132 - 80,132 Buildings 808,943 - 808,943 Machinery, equipment and furniture 266,262 - 266,262 Vehicles 60,485 - 60,485
1,215,822 - 1,215,822 Less accumulated depreciation (1,041,414) - (1,041,414) Total noncurrent assets 174,408 - 174,408
Total assets 586,658 4,566,729 5,153,387
Deferred Outflows of ResourcesPensions 563,381 - 563,381
Total deferred outflows of resources 563,381 - 563,381
LiabilitiesCurrent liabilities
Accounts payable 515,652 745,615 1,261,267 Accrued payroll deductions 37,991 - 37,991 Accrued benefits payable - 1,048,744 1,048,744 Claims payable - 796,748 796,748 Compensated absences payable 29,363 - 29,363
Total current liabilities 583,006 2,591,107 3,174,113
Noncurrent liabilitiesNet pension liability 1,069,253 - 1,069,253 Compensated absences payable 50,931 - 50,931
Total noncurrent liabilities 1,120,184 - 1,120,184
Total liabilities 1,703,190 2,591,107 4,294,297
Deferred Inflows of ResourcesPensions 279,011 - 279,011
Total deferred inflows of resources 279,011 - 279,011
Net PositionInvestment in capital assets 174,408 - 174,408 Unrestricted (1,006,570) 1,975,622 969,052
Total net position (deficit) $ (832,162) $ 1,975,622 $ 1,143,460
MACON-BIBB COUNTY, GEORGIA
JUNE 30, 2018

152
MACON-BIBB COUNTY, GEORGIA
COMBINING STATEMENT OF REVENUES, EXPENSES AND CHANGES IN FUND NET POSITION
INTERNAL SERVICE FUNDSFOR THE FISCAL YEAR ENDED JUNE 30, 2017
Vehicle GroupMaintenance Insurance
Fund Fund Total
Operating revenuesInsurance premiums $ - $ 18,123,591 $ 18,123,591 Charges for sales and services 1,610,339 - 1,610,339
Total operating revenues 1,610,339 18,123,591 19,733,930
Operating expensesClaims and judgments - 16,454,041 16,454,041 Administration and other costs 1,926,016 1,704,935 3,630,951 Depreciation 33,926 - 33,926
Total operating expenses 1,959,942 18,158,976 20,118,918
Operating loss (349,603) (35,385) (384,988)
Nonoperating revenues (expenses)Interest earned on investments 14 4,001 4,015 Interest expense (119) - (119)
Total nonoperating revenues (expenses) (105) 4,001 3,896
Loss before transfers (349,708) (31,384) (381,092)
Transfers in 500,000 2,000,000 2,500,000
Change in net position 150,292 1,968,616 2,118,908
Net position (deficit), beginning of year (982,454) 7,006 (975,448)
Net position (deficit), end of year $ (832,162) $ 1,975,622 $ 1,143,460

153
MACON-BIBB COUNTY, GEORGIA
COMBINING STATEMENT OF CASH FLOWS INTERNAL SERVICE FUNDS
FOR THE FISCAL YEAR ENDED JUNE 30, 2017
Vehicle GroupMaintenance Insurance
Fund Fund Total
Cash flows from operating activitiesReceipts from customers $ 1,616,584 $ - $ 1,616,584 Receipts from other funds - 16,912,917 16,912,917 Payments to employees (1,058,872) - (1,058,872) Payments to suppliers (632,008) - (632,008) Payments for claims and services - (18,489,069) (18,489,069)
Net cash used in operating activities (74,296) (1,576,152) (1,650,448)
Cash flows from noncapital financing activitiesTransfers from other funds 500,000 2,000,000 2,500,000
Net cash provided by noncapital financing activities 500,000 2,000,000 2,500,000
Cash flows from capital and related financing activitiesPrincipal paid on capital leases (15,227) - (15,227) Interest paid (259) - (259)
Net cash used in capital and related financing activities (15,486) - (15,486)
Cash flows from investing activitiesInterest on investments 14 4,001 4,015
Net cash provided by investing activities 14 4,001 4,015
Net increase in cash and cash equivalents 410,232 427,849 838,081
Cash and cash equivalents, beginning of year 790 299,877 300,667
Cash and cash equivalents, end of year $ 411,022 $ 727,726 $ 1,138,748
Reconciliation of operating loss to net cash used in operating activities: Operating loss $ (349,603) $ (35,385) $ (384,988) Adjustments to reconcile operating loss
to net cash used in operating activities:Depreciation expense 33,926 - 33,926 Decrease in accounts receivable 6,245 141,582 147,827 Increase in due from other governments - (52,256) (52,256) Increase in due from other funds - (1,300,000) (1,300,000) Decrease in claims payable - (523,678) (523,678) Increase in accounts payable 295,737 167,135 462,872 Increase in accrued liabilities 2,760 26,450 29,210 Decrease in net pension liability (63,361) - (63,361)
Net cash used in operating activities $ (74,296) $ (1,576,152) $ (1,650,448)

Employee Benefit Trust Funds
The General Employees’ Pension Trust Fund is used to account for the pension plan assets, liabilities, additions and deductions relative to eligible employees and retired personnel of the former City of Macon serving outside of the public safety functions of fire and police.
The Fire and Police Pension Trust Fund is used to account for the pension plan assets, liabilities, additions and deductions relative to eligible employees and retired personnel of the former City of Macon serving in the public safety functions of fire and police.
The Employee Pension Trust Fund accounts for a single employer public employee retirement system administered by Macon-Bibb County, Georgia for all eligible employees of the County.
The Other Post-Employment Benefits Trust Fund accounts for the accumulation of resources for other post-employment benefit payments to qualified employees of the County.
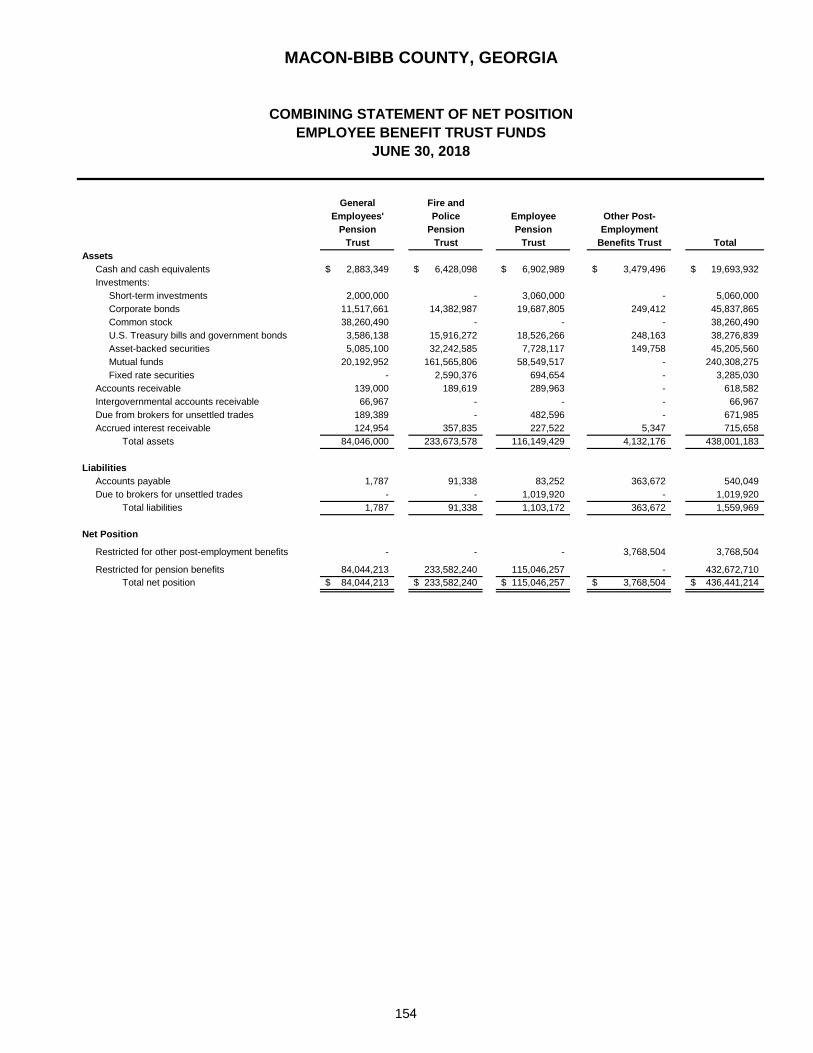
General Fire andEmployees' Police Employee Other Post-
Pension Pension Pension EmploymentTrust Trust Trust Benefits Trust Total
AssetsCash and cash equivalents 2,883,349$ 6,428,098$ 6,902,989$ 3,479,496$ 19,693,932$ Investments:
Short-term investments 2,000,000 - 3,060,000 - 5,060,000 Corporate bonds 11,517,661 14,382,987 19,687,805 249,412 45,837,865 Common stock 38,260,490 - - - 38,260,490 U.S. Treasury bills and government bonds 3,586,138 15,916,272 18,526,266 248,163 38,276,839 Asset-backed securities 5,085,100 32,242,585 7,728,117 149,758 45,205,560 Mutual funds 20,192,952 161,565,806 58,549,517 - 240,308,275 Fixed rate securities - 2,590,376 694,654 - 3,285,030
Accounts receivable 139,000 189,619 289,963 - 618,582 Intergovernmental accounts receivable 66,967 - - - 66,967 Due from brokers for unsettled trades 189,389 - 482,596 - 671,985 Accrued interest receivable 124,954 357,835 227,522 5,347 715,658
Total assets 84,046,000 233,673,578 116,149,429 4,132,176 438,001,183
LiabilitiesAccounts payable 1,787 91,338 83,252 363,672 540,049 Due to brokers for unsettled trades - - 1,019,920 - 1,019,920
Total liabilities 1,787 91,338 1,103,172 363,672 1,559,969
Net Position
Restricted for other post-employment benefits - - - 3,768,504 3,768,504
Restricted for pension benefits 84,044,213 233,582,240 115,046,257 - 432,672,710 Total net position 84,044,213$ 233,582,240$ 115,046,257$ 3,768,504$ 436,441,214$
MACON-BIBB COUNTY, GEORGIA
JUNE 30, 2018EMPLOYEE BENEFIT TRUST FUNDS
COMBINING STATEMENT OF NET POSITION
154
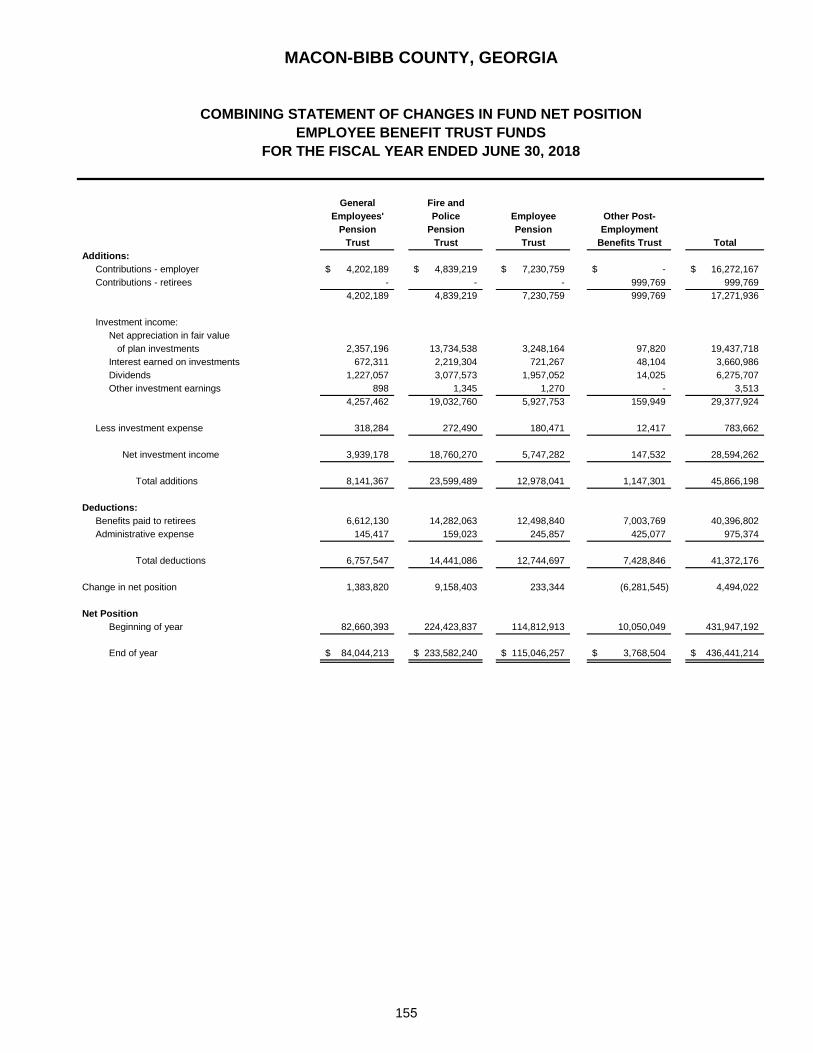
General Fire andEmployees' Police Employee Other Post-
Pension Pension Pension EmploymentTrust Trust Trust Benefits Trust Total
Additions:Contributions - employer 4,202,189$ 4,839,219$ 7,230,759$ -$ 16,272,167$ Contributions - retirees - - - 999,769 999,769
4,202,189 4,839,219 7,230,759 999,769 17,271,936
Investment income:Net appreciation in fair value of plan investments 2,357,196 13,734,538 3,248,164 97,820 19,437,718 Interest earned on investments 672,311 2,219,304 721,267 48,104 3,660,986 Dividends 1,227,057 3,077,573 1,957,052 14,025 6,275,707 Other investment earnings 898 1,345 1,270 - 3,513
4,257,462 19,032,760 5,927,753 159,949 29,377,924
Less investment expense 318,284 272,490 180,471 12,417 783,662
Net investment income 3,939,178 18,760,270 5,747,282 147,532 28,594,262
Total additions 8,141,367 23,599,489 12,978,041 1,147,301 45,866,198
Deductions:Benefits paid to retirees 6,612,130 14,282,063 12,498,840 7,003,769 40,396,802 Administrative expense 145,417 159,023 245,857 425,077 975,374
Total deductions 6,757,547 14,441,086 12,744,697 7,428,846 41,372,176
Change in net position 1,383,820 9,158,403 233,344 (6,281,545) 4,494,022
Net PositionBeginning of year 82,660,393 224,423,837 114,812,913 10,050,049 431,947,192
End of year 84,044,213$ 233,582,240$ 115,046,257$ 3,768,504$ 436,441,214$
MACON-BIBB COUNTY, GEORGIA
FOR THE FISCAL YEAR ENDED JUNE 30, 2018EMPLOYEE BENEFIT TRUST FUNDS
COMBINING STATEMENT OF CHANGES IN FUND NET POSITION
155

Agency Funds
The Tax Commissioner Fund accounts for the billing, collection, and remittances of taxes to the County, Board of Education, and State of Georgia.
The Juvenile Court Fund accounts for the collection and payments of fines and forfeitures as directed by the Juvenile Court.
The Probate Court Fund accounts for the collection and payment of funds held for minors as directed by the Probate Court. It also accounts for the collection and payment of various licenses.
The Civil Court Fund accounts for the collection and payment of various fees and fines as directed by the Civil Court.
The Clerk of Superior Court accounts for the collection and payments of various fees and fines as directed by the Superior Court.
The State Probation Fund accounts for the collection of fines and forfeitures as directed by the State Court.
The State Court Fund accounts for the collection of charges for court costs, filings, and settlements, as well as the subsequent remittance to the applicable parties.
The Superior Court Receiver Fund accounts for the collection and payment of monies as directed by order of the Superior Court.
The Sheriff’s Office Fund accounts for the collection of fines, costs, and bond forfeitures, and the subsequent remittances to the applicable parties.

156
MACON-BIBB COUNTY, GEORGIA
COMBINING STATEMENT OF ASSETS AND LIABILITIESAGENCY FUNDS
JUNE 30, 2018
Tax Juvenile Probate CivilCommissioner Court Court Court
AssetsCash $ 2,401,139 $ 5,095 $ 88,924 $ 171,225 Taxes receivable 10,082,670 - - - Due from other governments - - - -
Total assets $ 12,483,809 $ 5,095 $ 88,924 $ 171,225
LiabilitiesDue to other governments $ 11,849,405 $ - $ - $ - Due to others 634,404 5,095 88,924 171,225
Total liabilities $ 12,483,809 $ 5,095 $ 88,924 $ 171,225

157
Clerk of State State Superior CourtSuperior Court Probation Court Receiver
$ 1,168,987 $ 88,600 $ 113,165 $ 86,279 $ 1,650,621 $ 5,774,035 - - - - - 10,082,670 - - - - 1,320 1,320
$ 1,168,987 $ 88,600 $ 113,165 $ 86,279 $ 1,651,941 $ 15,858,025
$ - $ - $ - $ - $ - $ 11,849,405 1,168,987 88,600 113,165 86,279 1,651,941 4,008,620
$ 1,168,987 $ 88,600 $ 113,165 $ 86,279 $ 1,651,941 $ 15,858,025
TotalSheriff's
Office

158
Balance BalanceJuly 1, 2017 Increases Decreases June 30, 2018
Tax Commissioner
AssetsCash $ 2,265,205 $ 98,535,319 $ 98,399,385 $ 2,401,139 Taxes receivable 9,815,301 76,141,286 75,873,917 10,082,670
Total assets $ 12,080,506 $ 174,676,605 $ 174,273,302 $ 12,483,809
LiabilitiesDue to other governments $ 11,756,278 $ 174,366,429 $ 174,273,302 $ 11,849,405 Due to others 324,228 310,176 - 634,404
Total liabilities $ 12,080,506 $ 174,676,605 $ 174,273,302 $ 12,483,809
Juvenile Court
AssetsCash on hand and in bank $ 3,818 $ 4,136 $ 2,859 $ 5,095
Total assets $ 3,818 $ 4,136 $ 2,859 $ 5,095
LiabilitiesDue to others $ 3,818 $ 4,136 $ 2,859 $ 5,095
Total liabilities $ 3,818 $ 4,136 $ 2,859 $ 5,095
Probate Court
AssetsCash on hand and in bank $ 85,168 $ 75,833 $ 72,077 $ 88,924
Total assets $ 85,168 $ 75,833 $ 72,077 $ 88,924
LiabilitiesDue to others $ 85,168 $ 75,833 $ 72,077 $ 88,924
Total liabilities $ 85,168 $ 75,833 $ 72,077 $ 88,924
FOR THE FISCAL YEAR ENDED JUNE 30, 2018AGENCY FUNDS
COMBINING STATEMENT OF CHANGES IN ASSETS AND LIABILITIES
MACON-BIBB COUNTY, GEORGIA

159
Balance BalanceJuly 1, 2017 Increases Decreases June 30, 2018
Civil Court
AssetsCash on hand and in bank $ 148,942 $ 1,161,831 $ 1,139,548 $ 171,225
Total assets $ 148,942 $ 1,161,831 $ 1,139,548 $ 171,225
LiabilitiesDue to others $ 148,942 $ 1,161,831 $ 1,139,548 $ 171,225
Total liabilities $ 148,942 $ 1,161,831 $ 1,139,548 $ 171,225
Clerk of Superior Court
AssetsCash on hand and in bank $ 1,107,790 $ 1,791,061 $ 1,729,864 $ 1,168,987
Total assets $ 1,107,790 $ 1,791,061 $ 1,729,864 $ 1,168,987
LiabilitiesDue to others $ 1,107,790 $ 1,791,061 $ 1,729,864 $ 1,168,987
Total liabilities $ 1,107,790 $ 1,791,061 $ 1,729,864 $ 1,168,987
State Probation
AssetsCash on hand and in bank $ 102,965 $ 977,412 $ 991,777 $ 88,600
Total assets $ 102,965 $ 977,412 $ 991,777 $ 88,600
LiabilitiesDue to others $ 102,965 $ 977,412 $ 991,777 $ 88,600
Total liabilities $ 102,965 $ 977,412 $ 991,777 $ 88,600
COMBINING STATEMENT OF CHANGES IN ASSETS AND LIABILITIESAGENCY FUNDS
FOR THE FISCAL YEAR ENDED JUNE 30, 2018
MACON-BIBB COUNTY, GEORGIA

160
Balance BalanceJuly 1, 2017 Increases Decreases June 30, 2018
State Court
AssetsCash on hand and in bank $ 60,099 $ 3,231,536 $ 3,178,470 $ 113,165
Total assets $ 60,099 $ 3,231,536 $ 3,178,470 $ 113,165
LiabilitiesDue to others $ 60,099 $ 3,231,536 $ 3,178,470 $ 113,165
Total liabilities $ 60,099 $ 3,231,536 $ 3,178,470 $ 113,165
Superior Court Receiver
AssetsCash on hand and in bank $ 105,833 $ 1,970,380 $ 1,989,934 $ 86,279
Total assets $ 105,833 $ 1,970,380 $ 1,989,934 $ 86,279
LiabilitiesDue to others $ 105,833 $ 1,970,380 $ 1,989,934 $ 86,279
Total liabilities $ 105,833 $ 1,970,380 $ 1,989,934 $ 86,279
Sheriff's Office
AssetsCash on hand and in bank $ 1,393,649 $ 1,624,671 $ 1,367,699 $ 1,650,621 Due from other governments 3,740 - 2,420 1,320
Total assets $ 1,397,389 $ 1,624,671 $ 1,370,119 $ 1,651,941
LiabilitiesDue to others $ 1,397,389 $ 1,624,671 $ 1,370,119 $ 1,651,941
Total liabilities $ 1,397,389 $ 1,624,671 $ 1,370,119 $ 1,651,941
AGENCY FUNDSCOMBINING STATEMENT OF CHANGES IN ASSETS AND LIABILITIES
FOR THE FISCAL YEAR ENDED JUNE 30, 2018
MACON-BIBB COUNTY, GEORGIA

Component Units
The Macon-Bibb County Industrial Authority is charged with promoting and expanding industry and trade within Macon-Bibb County The Middle Georgia Regional Library provides complete library services throughout seven branches within Macon-Bibb County as well as six surrounding counties. The Macon-Bibb County Board of Health provides public health services to the citizens of Macon-Bibb County. The Macon-Bibb County Convention and Visitors Bureau promotes tourism and conventions in Macon-Bibb County. The Macon-Bibb County Planning and Zoning Commission is responsible for community planning, establishing and enforcing zoning regulations, and administration of certain grant programs. The Development Authority of Bibb County promotes development within Macon-Bibb County The Macon-Bibb County Urban Development Authority is responsible for the revitalization and redevelopment of the downtown areas of Macon-Bibb County. The Macon-Bibb County Land Bank Authority allows Macon-Bibb County to provide housing, new industry and jobs for the citizens of Middle Georgia area by effectively utilizing property previously in non-revenue generating, non-tax producing status. The Macon-Bibb County Transit Authority provides transit services within the Middle Georgia area.

161
Macon-Bibb Middle Macon-Bibb Macon-Bibb Macon-BibbCounty Georgia County County County Urban
Industrial Regional Transit Board of DevelopmentAuthority Library Authority Health Authority
AssetsCash and cash equivalents 5,231,613$ 897,032$ 364,091$ 4,145,962$ 3,448,317$ Investments - 883,770 156,640 - 147,083 Receivables, net of allowance
Accounts receivable 124,241 15,136 1,599,320 - 6,100 Accrued interest - - - - - Lease receivable - - - - 1,235,382 Loan receivable - - - - 1,639,156
Due from other governments - - - 12,382 - Due from primary government - - - - 1,288,954 Inventory - - 162,532 - - Option purchase/sale 60,000 - - - - Prepaid items - 25,427 287,533 - 112,523 Deferred charges - - - - Proportionate share of net OPEB asset - 173,042 - Restricted assets, cash and cash equivalents - - - - - Capital assets - nondepreciable 35,303,253 - 390,831 - 6,407,846 Capital assets - depreciable, net of -
accumulated depreciation 6,250,701 289,513 11,665,146 277,792 700,524 Total assets 46,969,808 2,110,878 14,626,093 4,609,178 14,985,885
Deferred outflows of resourcesPensions 12,873 429,141 1,374,911 524,990 - OPEB - - 346,545 -
Total deferred outflows of resources 12,873 429,141 1,374,911 871,535 -
Liabilities and net positionLiabilities
Accounts payable 484,862 38,951 292,930 214,889 513,283 Accrued liabilities 204,391 58,445 183,581 - - Unearned revenue 332,430 - - - 5,674 Line of credit 1,476,313 - 1,081,705 - - Environmental remidiation 300,000 - - - - Outstanding checks in excess of bank balance - - 440,403 - 74,759 Deposits - - 69,475 - - Noncurrent liabilities
Due within one yearCompensated absences 8,077 50,495 83,130 136,700 - Notes payable - - 52,400 - 442,364 Bonds payable 1,407,000 - - - -
Due in more than one yearCompensated absences - 33,663 - 58,586 - Net pension liability 104,494 2,501,211 5,496,535 3,135,026 - Net OPEB liability - 587,511 - 2,902,790 - Notes payable - - 42,715 - 2,772,419 Bonds payable 20,547,000 - - - -
Total liabilities 24,864,567 3,270,276 7,742,874 6,447,991 3,808,499
Deferred inflows of resourcesPensions 538 265,190 181,942 45,489 - Straight-line lease liability - - - - - OPEB - - - 470,094 -
Total deferred outflows of resources 538 265,190 181,942 515,583 -
Net positionNet investment in capital assets 18,009,706 289,513 12,055,977 277,792 6,415,164 Restricted for:
Capital projects 1,675,663 - - - - Culture and recreation - 47,645 - - - Program loans - - - - 1,692,196 Debt service 36,661 - - - 74,759 Prior year program income - - - 2,054,334 - Other purposes - - - - 507,640
Unrestricted 2,395,546 (1,332,605) (3,979,789) (3,814,987) 2,487,627 Total net position 22,117,576$ (995,447)$ 8,076,188$ (1,482,861)$ 11,177,386$
MACON-BIBB COUNTY, GEORGIA
JUNE 30, 2018DISCRETELY PRESENTED COMPONENT UNITS
COMBINING STATEMENT OF NET POSITION

162
Macon-Bibb Macon-Bibb Macon-BibbCounty County Planning Development County Land Total
Convention and & Zoning Authority of Bank ComponentVisitors Bureau Commission Bibb County Authority Units
1,808,768$ 415,932$ 46,793$ 772,779$ 17,131,287$ - - 76,247 - 1,263,740
395,685 - - 268,828 2,409,310 - - 107 - 107 - - - - 1,235,382 - - - - 1,639,156 - 118,624 - - 131,006 - - - - 1,288,954 - - - 998,500 1,161,032 - - - - 60,000
49,524 20,257 - - 495,264 - - - - -
- - 173,042
- - - - - 15,842 - - - 42,117,772
2,152,053 160,633 - 386 21,496,748 4,421,872 715,446 123,147 2,040,493 90,602,800
- 879,158 - - 3,221,073 346,545
- 879,158 - - 3,567,618
80,004 106,511 - 10,967 1,742,397 12,511 43,867 - 17,299 520,094
- - - - 338,104 - - - - 2,558,018 - - - - 300,000 - - - - 515,162 - 500 - - 69,975
- - - - 278,402 - - - - 494,764 - - - - 1,407,000
4,876 58,233 - - 155,358 - 1,793,235 - - 13,030,501 - - - - 3,490,301 - - - - 2,815,134 - - - - 20,547,000
97,391 2,002,346 - 28,266 48,262,210
- 394,138 - - 887,297 - 31,854 - - 31,854
- - - 470,094 - 425,992 - - 1,389,245
- 160,633 - 386 37,209,171
- - - - 1,675,663 - - - - 47,645 - - - - 1,692,196 - - - - 111,420 - - - - 2,054,334 - - - - 507,640
4,324,481 (994,367) 123,147 2,011,841 1,220,894 4,324,481$ (833,734)$ 123,147$ 2,012,227$ 44,518,963$

163
Operating CapitalCharges for Grants and Grants and
Functions/Programs Expenses Services Contributions ContributionsComponent units:
Macon-Bibb County Industrial Authority 11,196,054$ 1,945,902$ 279,350$ 3,257,808$ Middle Georgia Regional Library 4,087,506 124,114 4,127,425 - Macon-Bibb County Transit Authority 8,604,531 1,456,379 2,816,015 512,968 Macon-Bibb County Board of Health 4,264,543 2,164,975 3,190,198 - Macon-Bibb County Urban Development Authority 2,106,506 282,423 447,281 1,628,090 Macon-Bibb County Convention and Visitors Bureau 1,955,248 43,853 2,294,362 - Macon-Bibb County Planning and Zoning Commission 1,878,747 582,883 355,910 - Development Authority of Bibb County 17,509 - - - Macon-Bibb County Land Bank Authority 686,339 - 452,595 -
Total component units 34,796,983$ 6,600,529$ 13,963,136$ 5,398,866$
General revenues:Payments from Macon-Bibb CountyPayments in lieu of taxesInsurance reimbursementsGrants and contributions, not restricted to specific programsGain on sale of propertyInvestment earningsMiscellaneous revenue
Total general revenuesChange in net position
Net position, beginning of year, as restatedNet position, end of year
Program Revenues
MACON-BIBB COUNTY, GEORGIA
COMBINING STATEMENT OF ACTIVITIES DISCRETELY PRESENTED COMPONENT UNITS FOR THE FISCAL YEAR ENDED JUNE 30, 2018

164
Macon-Bibb Middle Macon-Bibb Macon-Bibb Macon-Bibb Macon-Bibb Macon-Bibb Macon-BibbCounty Georgia County County County Urban County County Planning Development County Land Total
Industrial Regional Transit Board Development Convention and & Zoning Authority of Bank ComponentAuthority Library Authority of Health Authority Visitors Bureau Commission Bibb County Authority Units
(5,712,994)$ -$ -$ -$ -$ -$ -$ -$ -$ (5,712,994)$ - 164,033 - - - - - - - 164,033 - - (3,819,169) - - - - - - (3,819,169) - - - 1,090,630 - - - - - 1,090,630 - - - - 251,288 - - - - 251,288 - - - - - 382,967 - - - 382,967 - - - - - - (939,954) - - (939,954) - - - - - - - (17,509) - (17,509) - - - - - - - - (233,744) (233,744)
(5,712,994) 164,033 (3,819,169) 1,090,630 251,288 382,967 (939,954) (17,509) (233,744) (8,834,452)
526,000 - 2,319,548 - - - 900,000 - 267,000 4,012,548 784,518 - - - - - - - - 784,518
- - - - - - - - - - - 99,972 - - - - - - - 99,972
339,077 - - - 433,799 - 3,934 - - 776,810 46,580 34,410 - 19,211 4,533 4,035 117 1,043 127 110,056 9,752 44,258 35,808 7,612 31,750 3 50 - 121,132 250,365
1,705,927 178,640 2,355,356 26,823 470,082 4,038 904,101 1,043 388,259 6,034,269 (4,007,067) 342,673 (1,463,813) 1,117,453 721,370 387,005 (35,853) (16,466) 154,515 (2,800,183) 26,124,643 (1,338,120) 9,540,001 (2,600,314) 10,456,016 3,937,476 (797,881) 139,613 1,857,712 47,319,146 22,117,576$ (995,447)$ 8,076,188$ (1,482,861)$ 11,177,386$ 4,324,481$ (833,734)$ 123,147$ 2,012,227$ 44,518,963$
Net (Expenses) Revenues and Changes in Net Position

165
OriginalEstimated Amended Prior Year Current Year Cumulative
Description Cost Budget Expenditures Expenditures ExpendituresCOUNTY PROJECTSGENERAL GOVERNMENT
Project Administration -$ 556,683$ 565,028$ 105,505$ 670,533$ Courthouse/County Building Improvements 5,000,000 5,343,445 5,330,744 22,216 5,352,960 Total General Government 5,000,000 5,900,128 5,895,772 127,721 6,023,493
JUDICIALJuvenile Justice Center 7,000,000 7,092,150 7,007,366 - 7,007,366Total Judicial 7,000,000 7,092,150 7,007,366 - 7,007,366
PUBLIC SAFETYAnimal Welfare Center 3,000,000 3,409,677 3,370,084 - 3,370,084Sheriff Vehicles and Equipment 2,500,000 2,500,000 2,463,676 1,807 2,465,483Fire Stations (3) 12,000,000 11,263,708 8,006,103 1,964,964 9,971,067Total Public Safety 17,500,000 17,173,385 13,839,863 1,966,771 15,806,634
PUBLIC WORKS INFRASTRUCTUREStorm Drainage 7,000,000 7,000,000 2,862,293 684,825 3,547,118Street Resurface and Repair 5,000,000 5,000,000 3,090,743 535,860 3,626,603Total Public Safety 12,000,000 12,000,000 5,953,036 1,220,685 7,173,721
RECREATIONRecreation 38,950,000 39,235,761 31,559,945 7,295,276 38,855,221Total Recreation 38,950,000 39,235,761 31,559,945 7,295,276 38,855,221
ECONOMIC DEVELOPMENTAcquisition of Property for BRAC 6,000,000 6,000,000 6,000,000 - 6,000,000Acquisition of Land and Improvements 5,900,000 5,900,000 5,900,000 - 5,900,000Total Economic Development 11,900,000 11,900,000 11,900,000 - 11,900,000
CAPITAL OUTLAYLeased Equipment 3,325,170 3,325,170 3,378,167 - 3,378,167Total Capital Outlay 3,325,170 3,325,170 3,378,167 - 3,378,167
PREVIOUSLY INCURRED DEBTMBUCDA 2002A 7,525,000 7,525,000 7,525,000 - 7,525,000MBUCDA 2002B 960,000 960,000 290,000 - 290,000MBUCDA 2006 4,050,000 4,050,000 4,050,000 - 4,050,000MBUCDA 2009 6,005,000 6,005,000 1,565,000 - 1,565,000MBUCDA 2010 10,045,000 10,045,000 4,780,000 935,000 5,715,000Interest 2,089,830 2,089,830 3,089,902 329,565 3,419,467Total Current Debt 30,674,830 30,674,830 21,299,902 1,264,565 22,564,467
Total County Project Expenditures 126,350,000 127,301,424 100,834,051 11,875,018 112,709,069
FORMER CITY OF MACON 63,650,000 63,650,000 17,669,759 - 17,669,759
Total Expenditures of Special Purpose LocalOption Sales Tax Proceeds - 2012 Issue 190,000,000$ 190,951,424$ 118,503,810$ 11,875,018$ 130,378,828$
OTHER EXPENDITURESInvestment Management Fees -$ -$ 64,316$ 640$ 64,956$ Series 2012 SPLOST Bonds - Principal - - 11,825,000 4,000,000 15,825,000Series 2012 SPLOST Bonds - Interest - - 2,915,346 236,500 3,151,846Series 2012 SPLOST Bonds - Issuance Costs - - 289,025 - 289,025Total Other Expenditures - - 15,093,687 4,237,140 19,330,827
Total Expenditures 190,000,000$ 190,951,424$ 133,597,497$ 16,112,158$ 149,709,655$
MACON-BIBB COUNTY, GEORGIA
FOR THE FISCAL YEAR ENDED JUNE 30, 2018SPECIAL PURPOSE LOCAL OPTION SALES TAX PROCEEDS - 2012 ISSUE (COUNTY)
SCHEDULE OF EXPENDITURES OF

166
OriginalEstimated Amended Prior Year Current Year Cumulative
Description Cost Budget Expenditures Expenditures ExpendituresCITY OF MACON PROJECTSECONOMIC DEVELOPMENT
Second Street Downtown Corridor 8,000,000$ 7,288,000$ 7,245,133$ 218$ 7,245,351$ Total Economic Development 8,000,000 7,288,000 7,245,133 218 7,245,351
PUBLIC SAFETYEmergency Communications System 8,000,000 8,122,681 8,100,133 - 8,100,133Total Public Safety 8,000,000 8,122,681 8,100,133 - 8,100,133
PUBLIC WORKS INFRASTRUCTUREStorm Water Management and Drainage 7,000,000 7,000,000 4,755,327 871,687 5,627,014Total Public Works Infrastructure 7,000,000 7,000,000 4,755,327 871,687 5,627,014
CULTURE AND RECREATIONMacon Centreplex 5,000,000 5,000,000 4,727,206 221,997 4,949,203Total Culture and Recreation 5,000,000 5,000,000 4,727,206 221,997 4,949,203
PUBLIC WORKS INFRASTRUCTUREStreet Resurface and Repair 5,000,000 7,439,076 7,039,631 118,307 7,157,938Total Public Works Infrastructure 5,000,000 7,439,076 7,039,631 118,307 7,157,938
CULTURE AND RECREATIONFort Hawkins 750,000 750,000 750,000 - 750,000Rose Hill Cemetery 300,000 300,000 299,999 - 299,999Bowden Golf Course 600,000 625,393 620,909 - 620,909Harriett Tubman Museum 2,500,000 2,500,000 2,500,000 - 2,500,000Total Culture and Recreation 4,150,000 4,175,393 4,170,908 - 4,170,908
PUBLIC SAFETYPublic Safety Vehicles and Equipment 2,500,000 2,538,269 2,333,641 56,667 2,390,308Total Public Safety 2,500,000 2,538,269 2,333,641 56,667 2,390,308
PUBLIC SAFETYGMA Lease Equipment 4,000,000 4,000,000 3,999,999 - 3,999,999Public Safety and Other Equipment 6,000,000 5,813,657 4,365,950 692,250 5,058,200Total Public Safety 10,000,000 9,813,657 8,365,949 692,250 9,058,199
PREVIOUSLY INCURRED DEBT 14,000,000 14,000,000 8,161,282 501,920 8,663,202Total Current Debt 14,000,000 14,000,000 8,161,282 501,920 8,663,202
Total City Project Expenditures 63,650,000 65,377,076 54,899,210 2,463,046 57,362,256
Total Expenditures of Special Purpose LocalOption Sales Tax Proceeds - 2012 Issue 63,650,000$ 65,377,076$ 54,899,210$ 2,463,046$ 57,362,256$
OTHER EXPENDITURESInvestment Management Fees -$ -$ 25,437$ -$ 25,437$ Series 2012 SPLOST Bonds - Principal - - 10,670,000 3,630,000 14,300,000Series 2012 SPLOST Bonds - Interest - - 2,238,417 165,450 2,403,867Series 2012 SPLOST Bonds - Issuance and fees - - 211,416 - 211,416Total Other Expenditures - - 13,145,270 3,795,450 16,940,720
Total Expenditures 63,650,000$ 65,377,076$ 68,044,480$ 6,258,496$ 74,302,976$
MACON-BIBB COUNTY, GEORGIA
FOR THE FISCAL YEAR ENDED JUNE 30, 2018SPECIAL PURPOSE LOCAL OPTION SALES TAX PROCEEDS - 2012 ISSUE (CITY)
SCHEDULE OF EXPENDITURES OF
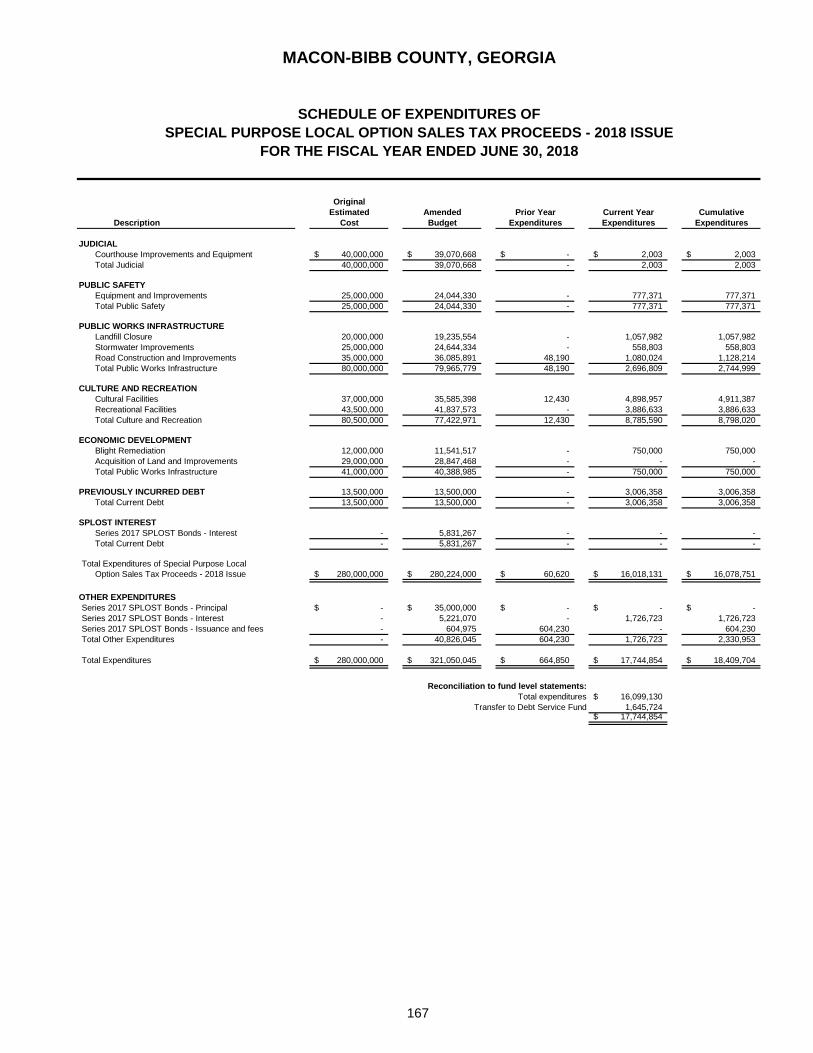
167
OriginalEstimated Amended Prior Year Current Year Cumulative
Description Cost Budget Expenditures Expenditures Expenditures
JUDICIALCourthouse Improvements and Equipment 40,000,000$ 39,070,668$ -$ 2,003$ 2,003$ Total Judicial 40,000,000 39,070,668 - 2,003 2,003
PUBLIC SAFETYEquipment and Improvements 25,000,000 24,044,330 - 777,371 777,371 Total Public Safety 25,000,000 24,044,330 - 777,371 777,371
PUBLIC WORKS INFRASTRUCTURELandfill Closure 20,000,000 19,235,554 - 1,057,982 1,057,982 Stormwater Improvements 25,000,000 24,644,334 - 558,803 558,803 Road Construction and Improvements 35,000,000 36,085,891 48,190 1,080,024 1,128,214 Total Public Works Infrastructure 80,000,000 79,965,779 48,190 2,696,809 2,744,999
CULTURE AND RECREATIONCultural Facilities 37,000,000 35,585,398 12,430 4,898,957 4,911,387Recreational Facilities 43,500,000 41,837,573 - 3,886,633 3,886,633Total Culture and Recreation 80,500,000 77,422,971 12,430 8,785,590 8,798,020
ECONOMIC DEVELOPMENTBlight Remediation 12,000,000 11,541,517 - 750,000 750,000 Acquisition of Land and Improvements 29,000,000 28,847,468 - - - Total Public Works Infrastructure 41,000,000 40,388,985 - 750,000 750,000
PREVIOUSLY INCURRED DEBT 13,500,000 13,500,000 - 3,006,358 3,006,358 Total Current Debt 13,500,000 13,500,000 - 3,006,358 3,006,358
SPLOST INTERESTSeries 2017 SPLOST Bonds - Interest - 5,831,267 - - - Total Current Debt - 5,831,267 - - -
Total Expenditures of Special Purpose LocalOption Sales Tax Proceeds - 2018 Issue 280,000,000$ 280,224,000$ 60,620$ 16,018,131$ 16,078,751$
OTHER EXPENDITURESSeries 2017 SPLOST Bonds - Principal -$ 35,000,000$ -$ -$ -$ Series 2017 SPLOST Bonds - Interest - 5,221,070 - 1,726,723 1,726,723 Series 2017 SPLOST Bonds - Issuance and fees - 604,975 604,230 - 604,230Total Other Expenditures - 40,826,045 604,230 1,726,723 2,330,953
Total Expenditures 280,000,000$ 321,050,045$ 664,850$ 17,744,854$ 18,409,704$
16,099,130$ 1,645,724
17,744,854$
Reconciliation to fund level statements:Total expenditures
Transfer to Debt Service Fund
MACON-BIBB COUNTY, GEORGIA
FOR THE FISCAL YEAR ENDED JUNE 30, 2018SPECIAL PURPOSE LOCAL OPTION SALES TAX PROCEEDS - 2018 ISSUE
SCHEDULE OF EXPENDITURES OF

STATISTICAL SECTION
This part of Macon-Bibb County, Georgia's comprehensive annual financial report presents detailed information as a context for understanding what the information in the financial statements, note disclosures, required supplementary information, and supplementary information says about Macon-Bibb County, Georgia's overall financial health.
Contents Page
Financial Trends ..................................................................................................................................... 168 – 174
These schedules contain trend information to help the reader understand how Macon-Bibb County,
Georgia's financial performance and well-being have changed over time.
Revenue Capacity ................................................................................................................................... 175 – 179
These schedules contain information to help the reader assess Macon-Bibb County, Georgia's most
significant local revenue sources.
Debt Capacity .......................................................................................................................................... 180 – 184
These schedules present information to help the reader assess the affordability of Macon-Bibb
County, Georgia's current levels of outstanding debt and Macon-Bibb County, Georgia's ability to
issue additional debt in the future.
Demographic and Economic Information ............................................................................................ 185 – 187
These schedules offer demographic and economic indicators to help the reader understand the
environment within which Macon-Bibb County, Georgia's financial activities take place.
Operating Information ........................................................................................................................ 188 and 189
These schedules contain service and infrastructure data to help the reader understand how the
information in the Macon-Bibb County, Georgia's financial report relates to the services Macon-Bibb
County, Georgia provides and the activities it performs.
Sources: Unless otherwise noted, the information in these schedules is derived from Macon-Bibb County, Georgia's financial reports for the relevant year.

168
2015 2016 2017 2018Governmental Activities
Net investment in capital assets 229,739,351$ 240,455,488$ 254,832,779$ 255,168,651$ Restricted 59,518,723 55,242,942 82,056,773 76,257,948 Unrestricted (119,388,180) (138,002,802) (226,896,365) (297,657,503)
Total Governmental Activities Net Position 169,869,894 157,695,628 109,993,187 33,769,096
Business-Type ActivitiesNet investment in capital assets 34,182,571 34,743,304 35,354,716 36,378,755 Unrestricted (6,054,994) (7,797,427) (6,211,292) (7,941,569)
Total Business-Type Activities Net Position 28,127,577 26,945,877 29,143,424 28,437,186
Primary GovernmentNet investment in capital assets 263,921,922 275,198,792 290,187,495 291,547,406 Restricted 59,518,723 55,242,942 82,056,773 76,257,948 Unrestricted (125,443,174) (145,800,229) (233,107,657) (305,599,072)
Total Primary Government Net Position 197,997,471$ 184,641,505$ 139,136,611$ 62,206,282$
NOTES:
The FY 2018 decrease in governmental activities restricted net position is largely due to a decrease in amounts restricted for capital projectsdue to expenditures in the SPLOST 2018 Fund, with expenditures totaling $17.7 million.
The FY 2018 decrease in governmental activities unrestricted net position is largely due to the implementation of GASB 75 requiring priorperiod recognition of $79 million for net OPEB liability.
The FY 2018 decrease in business-type activities net position is primarily due to an increase in landfill post-closure liability of $3.5 million.
Macon-Bibb County was consolidated effective January 1, 2014. Information is presented for 2015, 2016, 2017 and 2018, which representthe first four full fiscal years of the new government.
MACON-BIBB COUNTY, GEORGIA
NET POSITION BY COMPONENTLAST FOUR FISCAL YEARS
(ACCRUAL BASIS OF ACCOUNTING)(TABLE 1)
The FY 2017 increase in governmental restricted net position is primarily due to activity in the SPLOST 2018 Fund. Commissionersapproved issuance of $35 million general obligation sales tax bonds to provide funding for projects prior to collection of the new penny tax tobegin in 2018.
The FY 2017 decrease in governmental activities unrestricted net position is largely due to a net increase in net pension liability of $61million and an increase in OPEB benefit obligation of $8.7 million.
The FY 2017 increase in business-type activities net position is primarily due to a decrease in landfill post-closure liability of $2 million.
The FY 2016 and FY 2017 increases in governmental activities net investment in capital assets are largely due to the extensive projectsunderway funded by the 2012 special purpose local option sales tax.
The FY 2016 decrease in governmental activities restricted net position also reflects activity from the SPLOST County and City funds, with acombined decrease of $2 million. Other significant decreases in funds restricted for capital outlay included projects funded by the 2013MBCUDA Fund $2.7 million and TAD Second Street Corridor $2 million. These decreases were partially offset by an increase of $2 million infunds restricted for debt service of the GMA leasepool.
The FY 2016 decrease in business-type activities unrestricted net position is primarily due to losses in the Solid Waste Enterprise Fund. Feechanges initiated in FY 2016 should provide additional revenues in future years.

169
2015 2016 2017 2018EXPENSESGovernmental Activities
General government 30,290,662$ 28,173,095$ 35,261,988$ 28,854,100$ Judicial 17,939,814 17,735,112 22,274,374 20,254,786 Public safety 82,165,905 86,814,275 109,749,053 90,520,341 Public works 27,718,103 19,851,117 17,605,752 19,088,846 Housing and development 11,119,647 17,105,837 18,254,975 13,790,513 Health and welfare 6,553,586 8,973,917 9,940,194 9,311,368 Culture and recreation 7,484,518 12,155,930 13,033,320 14,767,434 Interest on long-term debt 4,193,869 3,922,637 4,825,637 4,386,818 Total Governmental Activities 187,466,104 194,731,920 230,945,293 200,974,206
Business-type ActivitiesTobesofkee Recreation 1,462,022 1,226,623 1,593,442 1,536,576 Solid Waste 10,979,235 13,475,185 11,249,729 17,434,748 Airport 1,780,602 1,910,706 1,884,643 1,997,072 Coliseum 1,818,188 2,258,386 1,830,691 1,708,007 Mulberry Street Parking Garage 167,369 166,553 179,604 156,163 Bowden Golf Course 561,994 611,970 720,558 727,643 Total Business-type Activities 16,769,410 19,649,423 17,458,667 23,560,209
Total Primary Government 204,235,514$ 214,381,343$ 248,403,960$ 224,534,415$
PROGRAM REVENUESGovernmental Activities
Charges for servicesGeneral government 7,296,716$ 7,341,607$ 8,361,216$ 8,512,227$ Judicial 2,421,653 2,468,449 2,510,199 2,363,504 Public safety 7,429,349 7,079,630 7,189,645 8,490,549 Other activities 2,729,242 2,786,994 2,386,687 2,344,343
Operating grants and contributions 4,819,639 4,895,989 8,248,564 13,254,664 Capital grants and contributions 8,537,724 5,440,451 3,698,632 964,893 Total Governmental Activities 33,234,323 30,013,120 32,394,943 35,930,180
Business-type ActivitiesCharges for services
Tobesofkee Recreation 675,966 747,247 758,906 776,607 Solid Waste 10,346,591 11,426,332 12,614,083 13,325,284 Airport 1,342,899 1,387,065 1,496,416 1,448,812 Coliseum 1,930 - - - Mulberry Street Parking Garage 149,499 140,622 153,991 135,828 Bowden Golf Course 319,983 283,949 303,849 235,013
Operating grants and contributions - 572,445 165,534 2,175,791 Total Business-type Activities 12,836,868 14,557,660 15,492,779 18,097,335
Total Primary Government 46,071,191$ 44,570,780$ 47,887,722$ 54,027,515$
MACON-BIBB COUNTY, GEORGIA
CHANGES IN NET POSITIONLAST FOUR FISCAL YEARS
(ACCRUAL BASIS OF ACCOUNTING)(TABLE 2)

170
2015 2016 2017 2018
NET PROGRAM (EXPENSE)/REVENUEGovernmental Activities (154,231,781)$ (164,718,800)$ (198,550,350)$ (165,044,026)$ Business-type Activities (3,932,542) (5,091,763) (1,965,888) (5,462,874) Total Primary Government Net Expense (158,164,323)$ (169,810,563)$ (200,516,238)$ (170,506,900)$
GENERAL REVENUES AND OTHERCHANGES IN NET ASSETS
Governmental ActivitiesTaxes
Property taxes 72,581,356$ 64,982,880$ 64,562,099$ 77,683,519$ Sales taxes 59,498,490 58,947,467 57,766,448 62,032,480 Other taxes 29,506,623 31,152,134 31,325,754 31,813,177
Investment earnings - 1,247,563 1,221,953 1,267,461 Other revenues 40,315 121,029 128,424 72,202 Transfers (4,234,838) (3,906,539) (4,156,769) (4,728,825) Total Governmental Activities 157,391,946 152,544,534 150,847,909 168,140,014
Business-type ActivitiesInvestment earnings 2,312 3,524 6,666 27,811 Transfers 4,234,838 3,906,539 4,156,769 4,728,825 Total Business-type Activities 4,237,150 3,910,063 4,163,435 4,756,636
Total Primary Government 161,629,096$ 156,454,597$ 155,011,344$ 172,896,650$
CHANGE IN NET POSITIONGovernmental Activities 3,160,165$ (12,174,266)$ (47,702,441)$ 3,095,988$ Business-type Activities 304,608 (1,181,700) 2,197,547 (706,238)
Total Primary Government 3,464,773$ (13,355,966)$ (45,504,894)$ 2,389,750$
NOTES:
The FY 2018 increase in business-type activities expenses was primarily due to an increase in landfill post-closure liability of $3.5 million.
The FY 2018 increase in governmental activities operating grants was primarily due to an Alternate Essential Air Service Program grant received with FY 2018 revenues totaling $4 million.
The FY 2018 increase in business-type activities operating grants was primarily due to reimbursements from the Federal EmergencyManagement Agency for debris monitoring and removal incurred during Hurricane Irma.
The increase in Housing and Development expenses in FY 2016 was partially due to a project coordinated with Macon-Bibb County UrbanDevelopment Authority representing $5.1 million.
The FY 2016 increase in Solid Waste expenses is primarily due to adding the prior City of Macon incorporated area collection to an externalcontractor.
The FY 2017 increased obligations for pension and post-employment benefit obligations caused increases in all Governmental Activitiesfunctions, excluding interest on long-term debt.
The FY 2017 decrease in business-type activities expenses was primarily due to a decrease in landfill post-closure liability of $2 million.
Macon-Bibb County was consolidated effective January 1, 2014. Information is presented for 2015, 2016, 2017, and 2018, which representthe first four full fiscal years of the new government.
The FY 2016 decrease in capital grants was primarily due to the completion of a large Department of Transportation Grant, which reported$4.4 million in FY 2015 and final revenue of $368,300 in FY 2016.
The FY 2016 decrease in property tax was due to the elimination of the millage on the prior City of Macon Tax District. The District was taxed9.7 mills in FY 2014, 4.85 in FY 2015, and eliminated completely in FY 2016.

171
2015 2016 2017 2018
Property Tax 72,581,356$ 64,982,880$ 64,562,099$ 77,683,519$ Sales Tax 59,498,490 58,947,467 57,766,448 62,032,480 Franchise Tax 11,513,962 12,203,273 11,783,849 11,590,866 Insurance Premium Tax 8,083,743 8,960,555 9,706,147 10,335,611 Hotel/Motel Tax 3,476,773 3,710,022 3,977,945 4,203,930 Alcoholic Beverage Tax 2,471,363 2,491,447 2,551,557 2,476,942 Intangible Tax 798,925 881,455 764,353 780,664 Other Taxes 3,161,857 2,905,382 2,541,903 2,425,164
Total Taxes 161,586,469$ 155,082,481$ 153,654,301$ 171,529,176$
NOTES:
The increase in property tax in FY 2018 was due to a 3 mill increase, raising the millage from 14.652 to 17.652.
The decrease in property tax in FY 2016 was due to the elimination of the millage on the prior City of Macon Tax District. TheDistrict was taxed 9.7 mills in FY 2014, 4.85 in FY 2015, and eliminated completely in FY 2016.
MACON-BIBB COUNTY, GEORGIA
GOVERNMENTAL ACTIVITIES TAX REVENUES BY SOURCELAST FOUR FISCAL YEARS
(ACCRUAL BASIS OF ACCOUNTING)(TABLE 3)
Macon-Bibb County was consolidated effective January 1, 2014. Information is presented for 2015, 2016, 2017, and 2018,which represent the first four full fiscal years of the new government.

172
2015 2016 2017 2018General Fund
Nonspendable 256,576$ 354,583$ 475,679$ 102,318$ Assigned 23,400,166 19,072,132 6,778,548 5,357,746 Unassigned 4,303,352 322,006 509,279 -
Total General Fund 27,960,094 19,748,721 7,763,506 5,460,064
All Other Governmental FundsNonspendable, reported in
Special revenue funds - 6,897 7,085 4,011 Capital projects funds - - - 900,000
Restricted, reported inSpecial revenue funds 6,167,496 7,082,488 7,682,405 8,643,377 Debt service funds 6,259,001 8,316,257 9,737,218 11,529,582 Capital projects funds 47,092,226 39,844,197 64,637,150 56,084,989
Committed, reported inSpecial revenue funds 496,137 727,126 1,109,163 1,630,990
Assigned, reported inCapital projects funds 1,334,423 178,790 175,337 84,947
Unassigned, reported inSpecial revenue funds (68,362) (4,011) (7,259) (4,186) Capital projects funds (321,276) - - (200,221)
Total All Other Governmental Funds 60,959,645 56,151,744 83,341,099 78,673,489
Total Governmental FundsNonspendable 256,576 361,480 482,764 1,006,329 Restricted 59,518,723 55,242,942 82,056,773 76,257,948 Committed 496,137 727,126 1,109,163 1,630,990 Assigned 24,734,589 19,250,922 6,953,885 5,442,693 Unassigned 3,913,714 317,995 502,020 (204,407)
Total Governmental Funds 88,919,739$ 75,900,465$ 91,104,605$ 84,133,553$
NOTES:
The FY 2018 increase in nonspendable fund balance in the Capital Projects Fund was due to the sale of property in FY 2018 that included a long-term note receivable of $900,000.
The FY 2018 increase in restricted for debt service was the result of an increase in the Debt Service Fund of $1.8 million, primarily due to GMAleasepool activity.
The FY 2018 decrease in restricted capital projects funds was due to ongoing project activity. The significant decreases included SPLOST 2018Fund decrease of $11.2 million and 2015 MBCUDA Fund $3.7 million.
The FY 2016 decrease in assigned and unassigned fund balance of the General Fund was the result of the FY 2016 decrease in fund balancetotaling $8.2 million.
The FY 2016 decrease in assigned fund balance of the General Fund was primarily the result of a decrease in funds assigned for working capital of$12 million.
The FY 2017 increase in restricted for capital projects was primarily due to the issuance of $35 million general obligation sales tax bonds in theSPLOST 2018 Fund.
Macon-Bibb County was consolidated effective January 1, 2014. Information is presented for 2015, 2016, 2017, and 2018, which represent the firstfour full fiscal years of the new government.
The FY 2016 increase in restricted for debt service was the result of an increase in the Debt Service Fund of $2.1 million, primarily due to GMAleasepool activity.
The FY 2016 decrease in restricted capital projects funds was due to ongoing project activity. The significant decreases included SPLOST 2012Funds combined decrease of $1.9 million, 2013 MBCUDA Fund $2.7 million, TAD Second Street $2 million.
MACON-BIBB COUNTY, GEORGIA
FUND BALANCES OF GOVERNMENTAL FUNDSLAST FOUR FISCAL YEARS
(MODIFIED ACCRUAL BASIS OF ACCOUNTING)(TABLE 4)

173
2015 2016 2017 2018REVENUESTaxes 161,536,844$ 155,326,001$ 153,513,588$ 171,354,362$ Licenses and permits 3,396,582 3,899,670 3,847,875 4,401,263 Intergovernmental 11,773,221 10,758,048 11,651,010 12,410,451 Charges for services 10,065,709 10,239,724 10,138,181 9,971,313 Fines 3,612,550 3,304,000 3,436,030 4,798,681 Investment earnings 1,096,101 1,328,652 1,306,940 1,892,091 Rentals 2,432,603 2,075,171 2,179,712 2,228,397 Other Revenues 986,160 936,279 2,436,636 966,202 Total Revenues 194,899,770 187,867,545 188,509,972 208,022,760
EXPENDITURESGeneral government 27,062,314 28,019,278 27,415,672 32,737,005 Judicial 17,936,060 18,266,302 19,195,708 19,251,579 Public safety 77,107,765 73,451,368 75,803,421 80,678,826 Public works 8,657,232 6,010,551 6,806,070 8,973,923 Housing and development 7,534,483 8,946,654 8,258,620 7,675,170 Health and welfare 8,940,605 9,013,169 9,844,635 9,215,809 Culture and recreation 10,799,500 9,858,326 9,863,094 9,964,278 Capital outlay 32,873,837 35,741,477 39,159,836 33,583,737 Debt service principal 14,789,766 10,031,056 27,740,766 12,539,846 Debt service interest and fees 3,618,095 4,263,064 4,224,742 5,468,503 Debt service issuance costs 857,710 196,975 1,067,285 141,028 Total Expenditures 210,177,367 203,798,220 229,379,849 220,229,704
Deficiency of Revenues Under Expenditures (15,277,597) (15,930,675) (40,869,877) (12,206,944)
OTHER FINANCING SOURCES (USES)Transfers in 6,492,004 4,723,884 4,773,033 3,990,600 Transfers out (8,530,051) (7,481,105) (7,998,429) (9,046,481) Payments to escrow agent (12,322,814) - (3,234,200) - Issuance of bonds and leases 29,980,000 5,280,431 53,250,000 4,794,445 Premium on bonds 438,537 - 9,019,819 - Discount on bonds (29,827) - - - Insurance recoveries 40,315 121,029 128,424 72,202 Sale of capital assets 168,045 267,162 135,370 5,425,126 Total Other Financing Sources (Uses) 16,236,209 2,911,401 56,074,017 5,235,892
Net Change in Fund Balances 958,612$ (13,019,274)$ 15,204,140$ (6,971,052)$
MACON-BIBB COUNTY, GEORGIA
CHANGES IN FUND BALANCES OF GOVERNMENTAL FUNDSLAST FOUR FISCAL YEARS
(MODIFIED ACCRUAL BASIS OF ACCOUNTING)(TABLE 5)

174
2015 2016 2017 2018
Debt Service as a Percentageof Noncapital Expenditures 10.05% 7.91% 16.09% 9.12%
NOTES:
The FY 2016 decrease in property tax in FY 2016 was due to the elimination of the millage on the prior City of Macon TaxDistrict. The District was taxed 9.7 mills in FY 2014, 4.85 in FY 2015, and eliminated completely in FY 2016.
Debt service principal increased in FY 2017, primarily due to the refunding of certain series of debt including MBCUDA 2002A,2009, and 2013A.
FY 2017 included the issuance of $35 million general obligation sales tax bonds and $18.25 million in refunding bonds, whichresulted in increases in issuance costs and other financing sources.
Payments to escrow agent increased in FY 2017 with the advance refunding of MBCUDA Series 2002B prior City of Macondebt and MBCUDA Series 2002B prior Bibb County debt.
FY 2015 included the issuance of $29,980,000 bonds to partially advance refund certain series of 2007 and 2013 MBCUDAbonds and provide $14 million for projects. FY 2016 included the issuance of $5.3 million in MBCUDA bonds for development
Several departments had decreases in personnel and benefits in FY 2016 due to the retirement incentive program initiated inFY 2015. Public safety expenditures in General Fund decreased $3.7 million, with approximately $2.8 million due to salary andbenefit decreases.
Debt service principal decreased in FY 2016, primarily due to the advance refunding of certain series of 2007 and 2013MBCUDA bonds with proceeds from 2015 MBCUDA bonds.
The FY 2018 increase in taxes was primarily the result of a 3 mill increase, raising the millage from 14.652 to 17.652.
Macon-Bibb County was consolidated effective January 1, 2014. Information is presented for 2015, 2016, 2017 and 2018,which represent the first four full fiscal years of the new government.

175
2015 2016 2017 2018
Property Tax 72,531,731$ 65,226,400$ 64,421,386$ 77,508,705$ Sales Tax 59,498,490 58,947,467 57,766,448 62,032,480 Hotel/Motel Tax 3,476,773 3,710,022 3,977,945 4,203,930 Alcoholic Beverage Tax 2,471,363 2,491,447 2,551,557 2,476,942 Intangible Tax 798,925 881,455 764,353 780,664 Real Estate Transfer Tax 226,800 242,711 247,479 210,985 Franchise Taxes 11,513,962 12,203,273 11,783,849 11,590,866 Financial gross receipts tax 434,314 412,110 388,439 366,832 Payment in lieu of taxes 441,241 364,457 497,671 406,302 Insurance Premium Tax 8,083,743 8,960,555 9,706,147 10,335,611 Interest and penalties 2,059,502 1,886,104 1,408,314 1,441,045
Total Taxes 161,536,844$ 155,326,001$ 153,513,588$ 171,354,362$
NOTES:
The increase in property tax in FY 2018 was due to a 3 mill increase, raising the millage from 14.652 to 17.652.
MACON-BIBB COUNTY, GEORGIA
GENERAL GOVERNMENTAL TAX REVENUES BY SOURCELAST FOUR FISCAL YEARS
(MODIFIED ACCRUAL BASIS OF ACCOUNTING)(TABLE 6)
Macon-Bibb County was consolidated effective January 1, 2014. Information is presented for 2015, 2016, 2017, and 2018,which represent the first four full fiscal years of the new government.
The decrease in property tax in FY 2016 was due to the elimination of the millage on the prior City of Macon Tax District. TheDistrict was taxed 9.7 mills in FY 2014, 4.85 in FY 2015, and eliminated completely in FY 2016.

176
2015 2016 2017 2018Assessed Value
Residential Property 2,096,647,260$ 2,034,777,589$ 2,023,324,452$ 2,008,937,892$ Commercial Property 1,455,905,068 1,475,420,757 1,514,467,545 1,572,253,004 Industrial Property 360,473,200 385,341,214 401,927,651 457,218,675
Other Real/Personal PropetyHistorical 9,412,483 14,577,374 17,305,299 23,058,638 Agricultural 64,396,178 64,134,589 63,169,203 63,591,907 Preferential 49,776 49,776 49,776 49,776 Conservation Use 24,990,800 25,488,194 25,903,826 26,243,711 Forest Land Conservation Use 2,141,157 2,141,157 2,276,199 2,276,199
Motor Vehicle Property 301,551,920 210,348,700 158,458,740 118,018,850 Utility 145,053,995 149,150,102 155,467,852 158,275,575 Heavy Equipment 32,769 54,393 114,445 150,857 Mobile Home 7,048,057 6,781,313 6,227,174 5,894,454 Timber 115,580 441,200 467,495 374,813 Total Property 4,467,818,243 4,368,706,358 4,369,159,657 4,436,344,351
Less Exemptions 362,673,941 368,931,436 372,127,060 396,142,076
Total Taxable PropertyAssessed Value 4,105,144,302$ 3,999,774,922$ 3,997,032,597$ 4,040,202,275$
Actual Value 11,169,372,238$ 10,921,104,095$ 10,922,197,900$ 11,090,298,658$
Total Direct Tax Rate 16.7940 14.6520 14.6520 17.6520
SOURCE:Macon-Bibb County Tax Commissioner's OfficeGeorgia Department of Revenue
NOTES:
Tax rates are per $1,000 of assessed value.
The County assesses property at the rate of 40% of estimated actual value, with the exception of timber, which is assessed at100%.
MACON-BIBB COUNTY, GEORGIA
ASSESSED VALUE AND ESTIMATED ACTUAL VALUE OF TAXABLE PROPERTYLAST FOUR FISCAL YEARS
(TABLE 7)
Macon-Bibb County was consolidated effective January 1, 2014. Information is presented for 2015, 2016, 2017, and 2018,which represent the first four full fiscal years of the new government.

177
2015 2016 2017 2018
Macon-Bibb County Direct RatesGeneral 16.7940 14.6520 14.6520 17.6520 Total Direct Rate 16.7940 14.6520 14.6520 17.6520
Bibb County School District 17.9450 17.9450 19.9450 19.8140
Total Direct and Overlapping Rates 34.7390 32.5970 34.5970 37.4660
SOURCE:Macon-Bibb County Tax Commissioner's Office.
NOTES:
Tax rates are per $1,000 of assessed value.
Macon-Bibb County Millage Rates General 14.6520 14.6520 14.6520 17.6520 Macon City District 4.8500 - - - Total Millage Rate 19.5020 14.6520 14.6520 17.6520
The Direct Rate is calculated differently than the separate, individual tax rates. The individual millage rates for Macon-BibbCounty are as follows:
MACON-BIBB COUNTY, GEORGIA
DIRECT AND OVERLAPPING PROPERTY TAX RATESLAST FOUR FISCAL YEARS
(TABLE 8)
Macon-Bibb County was consolidated effective January 1, 2014. Information is presented for 2015, 2016, 2017 and 2018,which represent the first four full fiscal years of the new government.

178
Percentage Percentageof Total of Total
Taxable Taxable Taxable TaxableAssessed Assessed Assessed Assessed
Taxpayer Value Rank Value Value Rank Value
Graphic Packaging International, Inc. 85,101,849$ 1 2.11% 60,598,573$ 2 1.48%
Georgia Power Company 73,091,512 2 1.81% 61,974,413 1 1.51%
Norfolk Southern Combined Railroad 43,021,340 3 1.06% 23,489,250 6 0.57%
Coliseum Medical Centers 36,853,666 4 0.91% 34,076,991 4 0.83%
YKK (USA), Inc. 32,288,578 5 0.80% 44,325,040 3 1.08%
Shoppes at River Crossing LLC 25,813,174 6 0.64% 18,383,728 9 0.45%
Walmart 21,306,364 7 0.53% 21,997,917 7 0.54%
Armstrong World Industries, Inc. 24,035,956 8 0.59% 24,476,886 5 0.60%
DDRTC Eisenhower Crossing LLC 18,832,640 9 0.47% 0.00%
Atlanta Gas Light Co 17,064,076 10 0.42% 0.00%
Bellsouth (AT&T) Telecommunications - 0.00% 18,512,323 8 0.45%
Verizon Wireless East LP - 16,874,097 10 0.41%
Total 377,409,155$ 9.34% 324,709,218$ 7.92%
SOURCE:Macon-Bibb County Tax Commissioner's Office
NOTES:
Fiscal Year 2018 Fiscal Year 2015
MACON-BIBB COUNTY, GEORGIA
PRINCIPAL PROPERTY TAXPAYERSCURRENT YEAR AND FISCAL YEAR 2015
(TABLE 9)
Macon-Bibb County was consolidated effective January 1, 2014. Information is presented for 2015 and 2018, which represent the currentand first full fiscal year of the new government.

179
2015 2016 2017 2018Taxes Levied for the Fiscal Year
Original Levy 68,941,928$ 58,606,893$ 58,566,864$ 71,320,433$ Adjustments 826,320 899,536 948,749 639,573
Total Adjusted Levy 69,768,248$ 59,506,429$ 59,515,613$ 71,960,006$
Collected within the Fiscal Year of the LevyAmount 64,923,290$ 56,228,082$ 56,529,410$ 68,552,065$ Percentage of Original Levy 94.17% 95.94% 96.52% 96.12%
Percentage of Adjusted Levy 93.06% 94.49% 94.98% 95.26%
Collections in Subsequent Years 1,911,817$ 1,426,172$ 856,147$ -$
Total Collections to DateAmount 66,835,107$ 57,654,254$ 57,385,557$ 68,552,065$ Percentage of Adjusted Levy 95.80% 96.89% 96.42% 95.26%
SOURCE:Macon-Bibb County Tax Commissioner's Office
NOTES:
The information presented in this schedule relates to the County's property tax levies, and does not include those it collects onbehalf of other governments.
MACON-BIBB COUNTY, GEORGIA
PROPERTY TAX LEVIES AND COLLECTIONSLAST FOUR FISCAL YEARS
(TABLE 10)
Macon-Bibb County was consolidated effective January 1, 2014. Information is presented for 2015, 2016, 2017 and 2018,which represent the first four full fiscal years of the new government.

180
2015 2016 2017 2018Governmental Activities
General Obligation BondsBonds 33,650,000$ 26,315,000$ 53,805,000$ 46,049,278$ Premium/(Discount) 1,341,107 886,832 6,268,081 5,348,454
Revenue BondsBonds 66,345,000 69,690,431 65,097,763 65,085,910 Premium/(Discount) 559,373 510,354 3,634,624 3,388,443
Certificates of Participation 13,452,000 13,452,000 13,452,000 13,452,000 Capital Leases 2,064,696 1,288,918 763,700 913,944 Note Payable - Due to component unit - - 1,432,251 1,288,954 Total 117,412,176 112,143,535 144,453,419 135,526,983
Business-Type ActivitiesRevenue Bonds 1,850,000 1,265,000 645,000 -
Discount (8,353) (5,315) (2,277) - Capital Leases 603,501 830,282 564,035 462,128 Notes Payable 111,002 - - - Total 2,556,150 2,089,967 1,206,758 462,128
Total Primary Government 119,968,326$ 114,233,502$ 145,660,177$ 135,989,111$
Personal Income (in thousands) 5,690,229$ 5,899,611$ 6,008,761$ 6,119,162$ Percentage of Personal Income 2.11% 1.94% 2.42% 2.22%
Population 153,918 153,721 152,760 152,862 Per Capita 779 743 954 890
SOURCE:Bureau of Economic Analysis for Population, Personal Income & Per Capita Personal income
NOTES:
Details regarding Macon-Bibb County's debt can be found in the notes to the financial statements.
These ratios are calculated using personal income and population for the prior calendar year.
The FY 2017 increase in general obligation bonds reflects the issuance of $35 million in general obligation sales tax bonds.
Macon-Bibb County was consolidated effective January 1, 2014. Information is presented for 2015, 2016, 2017 and 2018,which represent the first four full fiscal years of the new government.
MACON-BIBB COUNTY, GEORGIA
RATIOS OF OUTSTANDING DEBT BY TYPELAST FOUR FISCAL YEARS
(TABLE 11)

181
2015 2016 2017 2018
General Obligation BondsBonds 33,650,000$ 26,315,000$ 53,805,000$ 46,049,277$ Premium/(Discount) 1,341,107 886,832 6,268,081 5,348,453
Less Amounts Available in Capital Projects FundsRestricted for principal payments (7,836,875) (7,919,547) (9,692,909) (11,862,528)
Total 27,154,232$ 19,282,285$ 50,380,172$ 39,535,202$
Percentage of Estimated Actual Taxable Value of Property 0.24% 0.18% 0.46% 0.36%
Per Capita 176 125 329 259
NOTES:
Details regarding Macon-Bibb County's debt can be found in the notes to the financial statements.
See the Schedule of Demographic and Economic Statistics for personal income and population data.
See the Schedule of Assessed Value and Estimated Actual Value of Taxable Property for property value data.
MACON-BIBB COUNTY, GEORGIA
RATIOS OF GENERAL BONDED DEBT OUTSTANDINGLAST FOUR FISCAL YEARS
(TABLE 12)
Macon-Bibb County was consolidated effective January 1, 2014. Information is presented for 2015, 2016, 2017 and 2018,which represent the first four full fiscal years of the new government.

182
EstimatedEstimated Share of
Debt Percentage Direct andOutstanding Applicable Overlapping Debt
General Obligation DebtSeries 2012 Special Purpose Local Option Sales Tax Bonds - County 4,175,000$ 100% 4,175,000.00$ Unamortized premium 123,086 100% 123,086 Series 2012 Special Purpose Local Option Sales Tax Bonds - City 3,700,000 100% 3,700,000 Unamortized premium 30,477 100% 30,477 Series 2017 Special Purpose Local Option Sales Tax Bonds 35,000,000 100% 35,000,000 Series 2017 SPLOST Unamortized premium 5,194,890 100% 5,194,890 Series 2014 Tax Allocation District Bonds Second Street 3,174,277 100% 3,174,277 Total Direct General Obligation Debt 51,397,730 100% 51,397,730
Contractual Obligation DebtMacon-Bibb County Industrial Authority Revenue Bonds
Series 2015 Revenue Refunding Bass Pro & Sofkee Park 8,250,000 100% 8,250,000 Series 2015 Revenue Refunding unamortized premium 327,968 100% 327,968
Macon-Bibb County Urban Development Authority Revenue BondsSeries 2007 Hotel Project 7,845,000 100% 7,845,000 Series 2010 Revenue Refunding 4,330,000 100% 4,330,000 Series 2010 Revenue Refunding unamortized premium 44,862 100% 44,862 Series 2013B Public Projects 1,995,000 100% 1,995,000 Series 2013B Public Projects unamortized premium 24,108 100% 24,108 Series 2015A Revenue Bonds 12,190,000 100% 12,190,000 Series 2015B Revenue Bonds 6,240,000 100% 6,240,000 Series 2016A Revenue Bonds 3,985,910 100% 3,985,910 Series 2016B Revenue Bonds 2,000,000 100% 2,000,000 Series 2017A Revenue Refunding Bonds 14,965,000 100% 14,965,000 Series 2017A Revenue Refunding Bonds unamortized premium 2,954,299 100% 2,954,299 Series 2017B Revenue Refunding Bonds 3,285,000 100% 3,285,000 Series 2017B Revenue Refunding Bonds unamortized premium 34,018 100% 34,018
Certificates of Participation 13,452,000 100% 13,452,000 Capital Lease 917,681 100% 917,681 MBCUDA Promissory Note 1,288,954 100% 1,288,954 Total Direct Contractual Obligation Debt 84,129,800 100% 84,129,800
Overlapping DebtMacon-Bibb School District Contractual Obligation Debt 2,512,238 100% 2,512,238 Total Overlapping Debt 2,512,238 100% 2,512,238 Total Direct and Overlapping Debt 138,039,768$ 100% 138,039,768$
SOURCES:Macon-Bibb County Finance DepartmentMacon-Bibb School District information provided by Macon-Bibb County School District.
NOTES:
DIRECT AND OVERLAPPING GOVERNMENTAL ACTIVITIES DEBTJUNE 30, 2018
(TABLE 13)
Overlapping governments are those that coincide, at least in part, with the geographic boundaries of the County. This schedule estimates theportion of the outstanding debt of those overlapping governments that is borne by the residents and businesses of Macon-Bibb County. Thisprocess recognizes that, when considering the government's ability to issue and repay long-term debt, the entire debt burden borne by theresidents and businesses should be taken into account. However, this does not imply that every taxpayer is a resident and, therefore,responsible for repaying the debt of each overlapping government.
MACON-BIBB COUNTY, GEORGIA

183
2015 2016 2017 2018
LEGAL DEBT MARGINDebt limit 446,781,824$ 436,870,636$ 436,915,966$ 443,634,435$ Total net debt applicable 25,813,125 18,395,453 44,112,091 34,186,749 Legal debt margin 420,968,699$ 418,475,183$ 392,803,875$ 409,447,686$
Total net debt applicable to the limitas a percentage of debt limit 5.78% 4.21% 10.10% 7.71%
LEGAL DEBT MARGIN CALCULATIONAssessed value 4,105,144,302$ 3,999,774,922$ 3,997,032,597$ 4,040,202,275$ Add back: Exempt property 362,673,941 368,931,436 372,127,060 396,142,076 Total assessed value 4,467,818,243 4,368,706,358 4,369,159,657 4,436,344,351
Debt limit(10% of total assessed value) 446,781,824 436,870,636 436,915,966 443,634,435
Debt applicable to limitGeneral obligation bonds 30,350,000 23,015,000 50,505,000 42,875,000 Tax allocation bonds 3,300,000 3,300,000 3,300,000 3,174,277 Less amount set aside for
repayment of generalobligation debt (7,836,875) (7,919,547) (9,692,909) (11,862,528)
Total net debt applicable to limit 25,813,125 18,395,453 44,112,091 34,186,749
Legal debt margin 420,968,699$ 418,475,183$ 392,803,875$ 409,447,686$
NOTES:
The legal debt margin is the difference between the debt limit and the government's net general obligation debt outstanding applicable to thelimit, and represents the government's legal borrowing authority.
MACON-BIBB COUNTY, GEORGIA
LEGAL DEBT MARGIN INFORMATIONLAST FOUR FISCAL YEARS
(TABLE 14)
Macon-Bibb County was consolidated effective January 1, 2014. Information is presented for 2015, 2016, 2017 and 2018, which representthe first four full fiscal years of the new government.
Under State of Georgia law, the government's outstanding general obligation debt should not exceed 10% of total assessed property value.

184
2015 2016 2017 2018Series 1993 MBCIDA Airport ImprovementSeries 2002 MBCIDA Airport ImprovementAvailable Revenue
Operating Revenue 1,342,899$ 1,387,065$ 1,496,416$ 1,448,812$ Expenses (1,144,913) (1,265,274) (1,229,289) (1,340,147) Net Available Revenue 197,986$ 121,791$ 267,127$ 108,665$
Debt ServiceDebt Service Principal 555,001$ 585,000$ 620,000$ -$ Debt Service Interest 133,725 102,895 70,400 - Total Debt Service 688,726$ 687,895$ 690,400$ -$
Coverage 28.7% 17.7% 38.7% N/A
NOTES:
Details regarding the County's outstanding debt can be found in the notes to the financial statements.
Operating expenses do not include interest, depreciation, or amortizaion costs.
Pledged revenue consists of airline lease and charges for services. Pledged revenue funds the payment of debt service. TheGeneral Fund provides annual transfers to fund expenses in excess of funds available after payment of debt service.
MACON-BIBB COUNTY, GEORGIA
PLEDGED REVENUE COVERAGELAST FOUR FISCAL YEARS
(TABLE 15)
Macon-Bibb County was consolidated effective January 1, 2014. Information is presented for 2015, 2016, 2017 and 2018,which represent the first four full fiscal years of the new government.

185
2015 2016 2017 2018
Population (1) 152,422 154,057 153,205 152,862
Personal Income (in thousands) (1) 5,710,667$ 5,896,275$ 5,950,607$ 6,119,162$
Per CapitaPersonal Income (1) 37,466$ 38,273$ 38,841$ 40,031$
Unemployment Rate (2) 8.0% 6.70% 5.90% 5.40%
SOURCES:(1) Bureau of Economic Analysis. Figures are for prior calendar year.
(2)
NOTE:Macon-Bibb County was consolidated effective January 1, 2014. Information is presented for 2015, 2016, 2017, and 2018,which represent the first four full fiscal years of the new government.
MACON-BIBB COUNTY, GEORGIA
DEMOGRAPHIC AND ECONOMIC STATISTICSLAST FOUR FISCAL YEARS
(TABLE 16)
U.S. Department of Labor Local Area Unemployment Statistics figures are for prior calendar year.

186
Percentage PercentageEmployees of Total County Employees of Total County
Employer (1) Rank Employment (1) Rank Employment
GEICO 6,200 1 5.61% 5,690 1 5.10%Navicent Health of Central Georgia 6,000 2 5.43% 4,600 2 4.13%Macon-Bibb County Board of Education 4,500 3 4.07% 3,700 3 3.32%Coliseum Health Systems 1,200 4 1.09% 2,103 4 1.89%Macon-Bibb County, Georgia 1,400 5 1.26%Mercer University 1,001 5 0.91% 937 6 0.84%Walmart Super Stores 740 7 0.66%YKK (USA), Inc. 695 6 0.63% 600 8 0.54%United States Postal Service 600 7 0.54% 600 9 0.54%Graphic Packaging International 525 8 0.48%Georgia Farm Bureau 500 9 0.45%Tractor Supply 450 10 0.41%RICOH USA/Ikon 575 10 0.52%Kumho Tire, Ga 414 11 0.37%
Totals 22,085 19.99% 20,945 18.79%
Average number of employees (2) 110,490 111,496
SOURCES:(1) Macon-Bibb County Industrial Authority(2) Bureau of Economic Analysis
NOTE:Macon-Bibb County was consolidated effective January 1, 2014. Information is presented for 2015, 2016, 2017 and 2018, which representthe first four full fiscal years of the new government.
MACON-BIBB COUNTY, GEORGIA
PRINCIPAL EMPLOYERSCURRENT YEAR AND FISCAL YEAR 2015
(TABLE 17)
Fiscal Year 2018 Fiscal Year 2015

187
Function 2015 2016 2017 2018
General Government 267 212 257 238Judicial 197 179 212 210Public Safety 1,221 1,075 1,135 1,117Public Works 214 163 152 135Culture and Recreation 139 111 147 204Housing and Development 49 46 51 42Total 2,087 1,786 1,954 1,946
SOURCE:Macon-Bibb County Budget Document
NOTES:
The County initiated a retirement incentive program in FY 2015; over 230 employees retired in FY 2015 and FY 2016 as part ofthis program.
MACON-BIBB COUNTY, GEORGIA
FULL-TIME EQUIVALENT COUNTY GOVERNMENT EMPLOYEES BY FUNCTIONLAST FOUR FISCAL YEARS
(TABLE 18)
Macon-Bibb County was consolidated effective January 1, 2014. Information is presented for 2015, 2016, 2017 and 2018,which represent the first four full fiscal years of the new government.

188
Function/Program 2015 2016 2017 2018
Governmental activitiesJudicial
District Attorney cases filed 3,200 2,840 3,000 3,100 State Court cases filed 1,438 1,600 1,500 1,393 Probate Court caseload 4,857 4,857 4,857 5,276 Juvenile Court complaints and actions 1,793 1,972 2,169 1,261 Municipal Court tickets processed 15,415 14,596 18,000 14,895
Public SaftyFire emergency calls answered NA NA 47,042 49,000 Animal welfare impounded animals 2,243 4,313 3,805 4,363
Housing and Development Master Gardener volunteers estimated value 79,426$ 83,085$ 88,169$ 93,309$
Business-type activitiesTobesofkee Fund
Recreation individual admissions 84,640 90,000 90,000 90,000 Solid Waste Fund
Contract sanitation collection residential units 20,523 46,825 46,416 46,585 Airport Fund
Annual aircraft operations 19,692 20,000 20,000 18,500 Bowden Golf Course Fund
Weekend Green Fees and Carts for 18 Holes 27$ 25$ 25$ 28$
SOURCE:Macon-Bibb County Budget Document.
NOTES:
MACON-BIBB COUNTY, GEORGIA
OPERATING INDICATORS BY FUNCTION/PROGRAMLAST FOUR FISCAL YEARS
(TABLE 19)
Macon-Bibb County was consolidated effective January 1, 2014. Information is presented for 2015, 2016, 2017 and 2018,which represent the first four full fiscal years of the new government.

189
Function 2015 2016 2017 2018
Public SafetySheriff correction facility capacity 966 966 966 966Sheriff work release center capacity 204 204 204 204Fire stations 19 21 21 21
Public WorksCounty roads - mileage (1) 1,132 1,130 1,130 1,130
Culture and Recreation Number of parks and recreation centers 128 128 128 128
Solid WasteLandfill total estimated annual tons disposed 72,261 42,573 33,907 33,652
AirportAirports 2 2 2 2Public property acres 1,600 1,600 1,600 1,600
Bowden Golf CourseYards of golf course 6,570 6,570 6,570 6,570
CentreplexAuditorium Capacity 2,700 2,700 2,700 2,700Coliseum Capacity 9,000 9,000 9,252 9,252
TobesofkeeRecreation area acres 1,800 1,800 1,800 1,800
SOURCES:Macon-Bibb County Finance Department and individual county departments, unless otherwise noted.
(1)
NOTE:Macon-Bibb County was consolidated effective January 1, 2014. Information is presented for 2015, 2016, 2017 and 2018,which represent the first four full fiscal years of the new government.
MACON-BIBB COUNTY, GEORGIA
CAPITAL ASSET STATISTICS BY FUNCTIONLAST FOUR FISCAL YEARS
(TABLE 20)
Source - Georgia Department of Transportation - Georgia's Roadway Mileage and Characteristics Reports. Information isfor County roads only.

COMPLIANCE SECTION

300 MULBERRY STREET, SUITE 300 • POST OFFICE BOX 1877 • MACON, GEORGIA 31202-1877 • 478-464-8000 • FAX 478-464-8051 • www.mjcpa.com MEMBERS OF THE AMERICAN INSTITUTE OF CERTIFIED PUBLIC ACCOUNTANTS
INDEPENDENT AUDITOR'S REPORT ON INTERNAL CONTROL OVER FINANCIAL REPORTING AND ON COMPLIANCE AND OTHER MATTERS
BASED ON AN AUDIT OF FINANCIAL STATEMENTS PERFORMED IN ACCORDANCE WITH GOVERNMENT AUDITING STANDARDS
To the Board of Commissioners of Macon-Bibb County, Georgia Macon, Georgia
We have audited, in accordance with auditing standards generally accepted in the United States of America and the standards applicable to financial audits contained in Government Auditing Standards issued by the Comptroller General of the United States, the financial statements of the governmental activities, the business-type activities, the aggregate discretely presented component units, each major fund, and the aggregate remaining fund information of Macon-Bibb County, Georgia (the “County”), as of and for the year ended June 30, 2018, and the related notes to the financial statements, which collectively comprise the County’s basic financial statements and have issued our report thereon dated December 31, 2018. Our report includes a reference to the change in accounting principle resulting from the implementation of Government Accounting Standards Board (GASB) Statement No. 75, Accounting and Financial Reporting for Post-Employment Benefits Other than Pensions. Our report also includes a reference to other auditors. Other auditors audited the component unit financial statements of the Macon-Bibb County Industrial Authority, the Middle Georgia Regional Library, the Macon-Bibb County Board of Health, the Macon-Bibb County Urban Development Authority, the Macon-Bibb County Convention and Visitors Bureau, the Macon-Bibb County Planning and Zoning Commission, and the Development Authority of Bibb County as described in our report on the County’s financial statements. This report does not include the results of the other auditors’ testing of internal control over financial reporting or compliance and other matters that are reported on separately by those auditors.
Internal Control Over Financial Reporting
In planning and performing our audit, we considered Macon-Bibb County, Georgia’s internal control over financial reporting (internal control) to determine the audit procedures that are appropriate in the circumstances for the purpose of expressing our opinions on the financial statements, but not for the purpose of expressing an opinion on the effectiveness of Macon-Bibb County, Georgia’s internal control. Accordingly, we do not express an opinion on the effectiveness of Macon-Bibb County, Georgia’s internal control.
191
A deficiency in internal control exists when the design or operation of a control does not allow management or employees, in the normal course of performing their assigned functions, to prevent, or detect and correct misstatements on a timely basis. A material weakness is a deficiency, or a combination of deficiencies, in internal control, such that there is a reasonable possibility that a material misstatement of the entity's financial statements will not be prevented, or detected and corrected on a timely basis. A significant deficiency is a deficiency, or a combination of deficiencies, in internal control that is less severe than a material weakness, yet important enough to merit attention by those charged with governance.
Our consideration of internal control was for the limited purpose described in the first paragraph of this section and was not designed to identify all deficiencies in internal control that might be material weaknesses or significant deficiencies. Given these limitations, during our audit we did not identify any deficiencies in internal control that we consider to be material weaknesses. However, material weaknesses may exist that have not been identified.
Compliance and Other Matters
As part of obtaining reasonable assurance about whether Macon-Bibb County, Georgia's financial statements are free from material misstatement, we performed tests of its compliance with certain provisions of laws, regulations, contracts and grant agreements, noncompliance with which could have a direct and material effect on the determination of financial statement amounts. However, providing an opinion on compliance with those provisions was not an objective of our audit and, accordingly, we do not express such an opinion. The results of our tests disclosed no instances of noncompliance or other matters that are required to be reported under Government
Auditing Standards.
Purpose of this Report
The purpose of this report is solely to describe the scope of our testing of internal control and compliance and the results of that testing, and not to provide an opinion on the effectiveness of the entity’s internal control or on compliance. This report is an integral part of an audit performed in accordance with Government Auditing Standards in considering the entity’s internal control and compliance. Accordingly, this communication is not suitable for any other purpose.
Macon, Georgia December 31, 2018

300 MULBERRY STREET, SUITE 300 • POST OFFICE BOX 1877 • MACON, GEORGIA 31202-1877 • 478-464-8000 • FAX 478-464-8051 • www.mjcpa.com MEMBERS OF THE AMERICAN INSTITUTE OF CERTIFIED PUBLIC ACCOUNTANTS
INDEPENDENT AUDITOR’S REPORT ON COMPLIANCE FOR EACH MAJOR FEDERAL PROGRAM AND ON INTERNAL CONTROL OVER COMPLIANCE
REQUIRED BY THE UNIFORM GUIDANCE
To the Board of Commissioners of
Macon-Bibb County, Georgia
Macon, Georgia
Report on Compliance for Each Major Federal Program
We have audited Macon-Bibb County, Georgia’s (the “County”) compliance with the types of compliance requirements described in the OMB Compliance Supplement that could have a direct and material effect on each of the County’s major federal programs for the year ended June 30, 2018. The County’s major federal programs are identified in the summary of auditor's results section of the accompanying schedule of findings and questioned costs. The County’s basic financial statements include the operations of the Macon-Bibb County Transit Authority as of June 30, 2018, which received $3,056,879 in federal awards which are not included in the schedule of expenditures of federal awards of the County for the year ended June 30, 2018. Our audit, described below, did not include the operations of the Macon-Bibb County Transit Authority. The results of the Macon-Bibb County Transit Authority’s audit in accordance with the Uniform Guidance is included in the separately issued financial statements of the Macon-Bibb County Transit Authority. Management’s Responsibility
Management is responsible for compliance with the federal statutes, regulations, and the terms and conditions of its federal awards. Auditor’s Responsibility
Our responsibility is to express an opinion on compliance for each of the County’s major federal programs based on our audit of the types of compliance requirements referred to above. We conducted our audit of compliance in accordance with auditing standards generally accepted in the United States of America; the standards applicable to financial audits contained in Government Auditing Standards, issued by the Comptroller General of the United States; and the audit requirements of Title 2 U.S. Code of Federal Regulations Part 200, Uniform Administrative
Requirements, Cost Principles, and Audit Requirements for Federal Awards (Uniform Guidance). Those standards and the Uniform Guidance require that we plan and perform the audit to obtain reasonable assurance about whether noncompliance with the types of compliance requirements referred to above that could have a direct and material effect on a major federal program occurred. An audit includes examining, on a test basis, evidence about the County’s compliance with those requirements and performing such other procedures as we considered necessary in the circumstances.

193
We believe that our audit provides a reasonable basis for our opinion on compliance for each major federal program. However, our audit does not provide a legal determination of the County’s compliance.
Basis for Qualified Opinion on Payments for Essential Air Service
As described in the accompanying schedule of findings and questioned costs, the County did not comply with the requirements regarding reporting for the Payments for Essential Air Services Program as described in finding number 2018-001. Compliance with such requirements is necessary, in our opinion, for the County to comply with the requirements applicable to that program.
Qualified Opinion on Payments for Essential Air Services
In our opinion, except for the noncompliance described in the Basis for Qualified Opinion paragraph, the County complied, in all material respects, with the types of compliance requirements referred to above that could have a direct and material effect on the Payments for Essential Air Services Program for the year ended June 30, 2018.
Unmodified Opinion on Each of the Other Major Federal Programs
In our opinion, the County complied, in all material respects, with the types of compliance requirements referred to above that could have a direct and material effect on each of its other major federal programs identified in the summary of auditor’s results section of the accompanying schedule of findings and questioned costs for the year ended June 30, 2018.
Other Matters
The County’s response to the noncompliance finding identified in our audit is described in the accompanying schedule of findings and questioned costs. The County’s response was not subjected to the auditing procedures applied in the audit of compliance and, accordingly, we express no opinion on the response.

194
Report on Internal Control Over Compliance
Management of the County is responsible for establishing and maintaining effective internal control over compliance with the types of compliance requirements referred to above. In planning and performing our audit of compliance, we considered the County’s internal control over compliance with the types of requirements that could have a direct and material effect on each major federal program to determine the auditing procedures that are appropriate in the circumstances for the purpose of expressing an opinion on compliance for each major federal program, and to test and report on internal control over compliance in accordance with the Uniform Guidance, but not for the purpose of expressing an opinion on the effectiveness of internal control over compliance. Accordingly, we do not express an opinion on the effectiveness of the County’s internal control over compliance.
Our consideration of internal control over compliance was for the limited purpose described in the preceding paragraph and was not designed to identify all deficiencies in internal control over compliance that might be material weaknesses or significant deficiencies and, therefore, material weaknesses or significant deficiencies may exist that have not been identified. However, as discussed below, we identified a certain deficiency in internal control over compliance that we consider to be a material weakness.
A deficiency in internal control over compliance exists when the design or operation of a control over compliance does not allow management or employees, in the normal course of performing their assigned functions, to prevent, or detect and correct, noncompliance with a type of compliance requirement of a federal program on a timely basis. A material weakness in internal control over compliance is a deficiency, or a combination of deficiencies, in internal control over compliance, such that there is a reasonable possibility that material noncompliance with a type of compliance requirement of a federal program will not be prevented, or detected and corrected, on a timely basis. A significant deficiency in internal control over compliance is a deficiency, or a combination of deficiencies, in internal control over compliance with a type of compliance requirement of a federal program that is less severe than a material weakness in internal control over compliance, yet important enough to merit attention by those charged with governance. We consider the deficiencies in internal control over compliance described in the accompanying schedule of findings and questioned costs as item 2018-001 to be a material weakness.
The County’s response to the internal control over compliance finding identified in our audit is described in the accompanying schedule of findings and questioned costs. The County’s response was not subjected to the auditing procedures applied in the audit of compliance and, accordingly, we express no opinion on the response.
195
The purpose of this report on internal control over compliance is solely to describe the scope of our testing of internal control over compliance and the results of that testing based on the requirements of the Uniform Guidance. Accordingly, this report is not suitable for any other purpose.
Macon, Georgia December 31, 2018

196
Federal Grant PassedCFDA Identification Total Through to
Number Number Expenditures Subrecipients
U.S. Department of Housing and Urban Development
Community Development Block Grant Program 14.218 B14-MC-13-0005, B15-MC-13-0005, B16-MC-13-0005, B17-MC-13-0005 1,290,572$ 349,665$
Home Investment Partnership Program 14.239 M10-MC-13-0202, M11-MC-13-0202, M12-MC-13-0202, M14-MC-13-0202, M15-MC-13-0202, M16-MC-13-0202, M17-MC-13-0202 1,041,624 1,041,624
Emergency Solutions Program 14.231 E-15-MC-13-0005, E-16-MC-13-0005 164,414 154,100
(Passed through the Georgia Department of Community Affairs)Neighborhood Stabilization Program 14.264 08-NS-5066 35,146 -
Total U.S. Department of Housing and Urban Development 2,531,756$ 1,545,389$
U.S. Department of Transportation
Payments for Essential Air Services 20.901 DOT-OST-2007-28671 4,124,308$ -$
(Passed through Georgia Department of Transportation) Transportation Enhancement Project
Ocmulgee Trail Grant 20.205 CSTEE-0008-00-(986) 512,745 -
(Passed through Governor's Office of Highway Safety)Highway Safety Cluster
H.E.A.T. Grant 20.600 GA-2017-402PT-104 13,376 - H.E.A.T. Grant 20.600 GA-2018-402PT-093 19,884 - Pedestrian Safety 20.616 GA-2018-405h FHX-166 13,538 -
Total Highway Safety Cluster 46,798 -
Total U.S. Department of Transportation 4,683,851$ -$
U.S. Department of Homeland Security(Passed through Georgia Emergency Management Agency)
Homeland Security Grant ProgramGEMA 16 K-9 97.067 EMW-2016-SS-00007-S01-SHO16-063 817$ -$ GEMA 16 GSAR 97.067 EMW-2016-SS-00007-S01SHO16-010 1,488 - GEMA 17 GSAR 97.067 EMW-2017-SS-00015-S01SHO17-021 28,736 - GEMA 17 HAZMAT 97.067 EMW-2017-SS-00015-S01SHO17-043 7,976 - GEMA 17 K9 97.067 EMW-2017-SS-00015-S01SHO17-049 223 - GEMA 17 EOD 97.067 EMW-2017-SS-00015-S01SHO17-003 24,882 -
Total Homeland Security Grant Program 64,122 -
Emergency Management Performance Grants 97.042 OEM 17-011 PPA 29,359 -
Flood Mitigation Assistance Program 97.029 FMA-PJ-04-GA-2014-004 174,975 -
Disaster Grants - Public Assistance 97.036 FEMA-4338-DR-GA 2,355,038 -
Total U.S. Department of Homeland Security 2,623,494$ -$
(Continued)
FOR THE FISCAL YEAR ENDED JUNE 30, 2018SCHEDULE OF EXPENDITURES OF FEDERAL AWARDS
MACON-BIBB COUNTY, GEORGIA
Federal Grantor/Pass-throughGrantor/Program Title

197
Federal Grant PassedCFDA Identification Total Through to
Number Number Expenditures Subrecipients
U.S. Department of Justice
Justice Assistance Grant (JAG) ProgramJAG Prevention and Education 2014 16.738 2014-DJ-BX-0935 8,039$ -$ JAG 2016 16.738 2016-DJ-BX-0394 2,128
Total Justice Assistance Grant (JAG) Program 10,167 -
Victim Witness Assistance ProgramVictim Witness Assistance - DA 17 16.576 C14-8-109 - C16-8-001 21,728 - Victims Witness Assistance - SG 17 16.576 C14-8-109 - C16-8-001 35,068 - Victim Witness Assistance - DA 18 16.576 C16-8-207 - C15-8-392 74,141 - Victim Witness Assistance - DA Comp Advocate 18 16.576 C15-8-374 26,100 Victims Witness Assistance - SG 18 16.576 C16-8-207 - C15-8-392 97,174 - 2017 S.T.O.P VAWA 16.576 W71-8-044 6,989
Total Victim Witness Assistance Program 261,200 -
Justice and Mental Health Collaborative 16.745 2016-MO-BX-0021 25,409 -
Veterans Court 16.609 Q15-8-007 21,856 -
Total U.S. Department of Justice 318,632$ -$
U.S. Environmental Protection Agency
Brownsfield Assessment & Clean-up ProgramBrownsfield Assessment 66.818 00D32515 165,209$ -$
Total Expenditures of Federal Awards 10,322,942$ 1,545,389$
Federal Grantor/Pass-throughGrantor/Program Title
FOR THE FISCAL YEAR ENDED JUNE 30, 2018SCHEDULE OF EXPENDITURES OF FEDERAL AWARDS
MACON-BIBB COUNTY, GEORGIA

198
MACON-BIBB COUNTY, GEORGIA
NOTES TO SCHEDULE OF EXPENDITURES OF FEDERAL AWARDS
NOTE 1. BASIS OF PREPARATION
The accompanying schedule of expenditures of federal awards includes the federal grant activity of Macon-Bibb County, Georgia (the “County”), and is presented on the modified accrual basis of accounting.
The information in this schedule is presented in accordance with the requirements of Title 2 U.S. Code of Federal Regulations (CFR) Part 200, Uniform Administrative Requirements, Cost
Principles, and Audit Requirements for Federal Awards. Therefore, some amounts presented in the schedule may differ from amounts presented in, or used in the preparation of, the basic financial statements.
NOTE 2. DE MINIMIS INDIRECT COST RATE
The County chose not to use the 10% de minimis cost rate for the year ended June 30, 2018.
NOTE 3. NON-CASH AWARDS
The County did not receive non-cash federal awards during the year ended June 30, 2018.
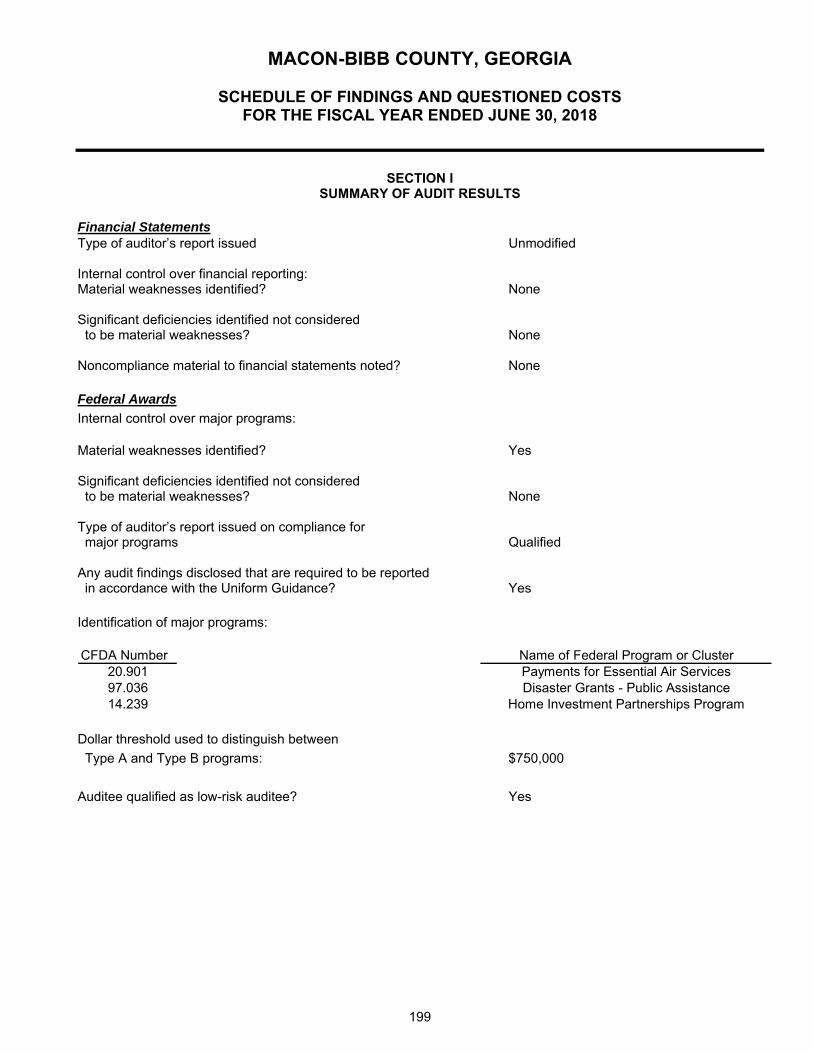
199
MACON-BIBB COUNTY, GEORGIA
SCHEDULE OF FINDINGS AND QUESTIONED COSTS FOR THE FISCAL YEAR ENDED JUNE 30, 2018
SECTION I
SUMMARY OF AUDIT RESULTS
Financial Statements Type of auditor’s report issued Unmodified Internal control over financial reporting: Material weaknesses identified? None Significant deficiencies identified not considered to be material weaknesses? None Noncompliance material to financial statements noted? None Federal Awards
Internal control over major programs:
Material weaknesses identified? Yes Significant deficiencies identified not considered to be material weaknesses? None Type of auditor’s report issued on compliance for major programs Qualified Any audit findings disclosed that are required to be reported in accordance with the Uniform Guidance? Yes
Identification of major programs:
CFDA Number Name of Federal Program or Cluster20.901 Payments for Essential Air Services97.036 Disaster Grants - Public Assistance14.239 Home Investment Partnerships Program
Dollar threshold used to distinguish between Type A and Type B programs: $750,000 Auditee qualified as low-risk auditee? Yes

200
MACON-BIBB COUNTY, GEORGIA
SCHEDULE OF FINDINGS AND QUESTIONED COSTS FOR THE FISCAL YEAR ENDED JUNE 30, 2018
SECTION II
FINANCIAL STATEMENT FINDINGS AND RESPONSES None reported.
SECTION III
FEDERAL AWARDS FINDINGS AND QUESTIONED COSTS SA 2018-001 Alternate Essential Air Service Required Reports (Reporting)
Federal Program Information:
CFDA No. 20.901
Alternate Essential Air Service
U.S. Department of Transportation
Grant No. G-17-0004
Criteria: As a recipient of Federal awards, the County is charged with the responsibility of reporting certain required information concerning the operations of the subsidized flights, as outlined in the grant agreement with the Department of Transportation. Condition: During our testing, we noted reports required by the grant agreement were not submitted to the Department of Transportation. Cause: Management oversight. Effects or possible effects: Without proper reporting, the County may be in violation of the grant agreement. Questioned Costs: None. Recommendation: We recommend the County take appropriate measures to ensure that reporting for all federal awards is done correctly and in a timely manner and that all appropriate staff are trained and aware of reporting requirements. We also recommend management submit the required reports that are currently past due. Views of Responsible Officials and Planned Corrective Action: We concur with the finding. We will take appropriate measures to submit the reports currently in arrears and implement procedures to ensure timely and accurate reporting in the future.

201
MACON-BIBB COUNTY, GEORGIA
SCHEDULE OF PRIOR YEAR FINDINGS FOR THE FISCAL YEAR ENDED JUNE 30, 2018
None reported.

202
Macon-Bibb County Finance Office 700 Poplar Street
Room 307 Macon, Georgia 31201
Christy W. Iuliucci Phone: (478) 751-7240 Kimberly T. Roberts Finance Director Fax: (478) 751-7252 Assistant Finance Director
MACON-BIBB COUNTY, GEORGIA
MANAGEMENT’S CORRECTIVE ACTION PLAN FOR THE FISCAL YEAR ENDED JUNE 30, 2018
2018-001. CFDA #20.901 Payments for Essential Air Services
Department’s Response: Management concurs with the finding. Airport personnel have been collecting and recording monthly data reports as required by the grant. However, airport personnel failed to submit compiled monthly data reports in a quarterly submission. Airport personnel have submitted all delinquent quarterly reports and will monitor and timely submit future quarterly reports identified in the Grant Agreement. Name of the Contact Person Responsible for Corrective Action Plan: Erick D’Leon, Airport Manager Corrective Action Plan: Airport personnel have submitted all delinquent quarterly reports and have developed procedures to ensure timely submission of future quarterly reports identified in the Grant Agreement. Anticipated Completion Date: Fiscal year 2019