02 4thjoelarry pile wall program.ppt - marshall.edu · the goal user friendly windows interface...
TRANSCRIPT
NEW PILE WALL PROGRAMNEW PILE WALL PROGRAMJoe Carte
Larry Douglas

OverviewOverview• Beta Phase
Th G l• The Goal• Brief History• Some Theory & Demonstration• Surveying and MappingSurveying and Mapping• Drilling and Sampling
W t C B i• Worst Case Basis• Example• Screen Shots of Program

The GoalUser Friendly
Windows InterfaceSoil Parameters Directly from Blow Count and Rock Mass Rating (RMR)Rock Mass Rating (RMR)
Potentially Save Money Nobody Wants Thisy yPile LengthUses Plastic Modulus
LRFD CompliantUses Factored Load and Factored Resistance

Material’s DOS ProgramMaterial s DOS Program
HP10x57 (S=58.8)

District 6’s Spread SheetDistrict 6 s Spread Sheet

Dr George Hall’s ProgramDr. George Hall s Program
S=39.4
HP10X42 (S=43.4)

Dr Ashour’s ProgramDr. Ashour s Program
Plastic Modulus Z=48.3

Some TheorySome Theory
• Limit-Equilibrium Stability AnalysisLimit Equilibrium Stability Analysis
• Strain Wedge Model
• Structural Analysis
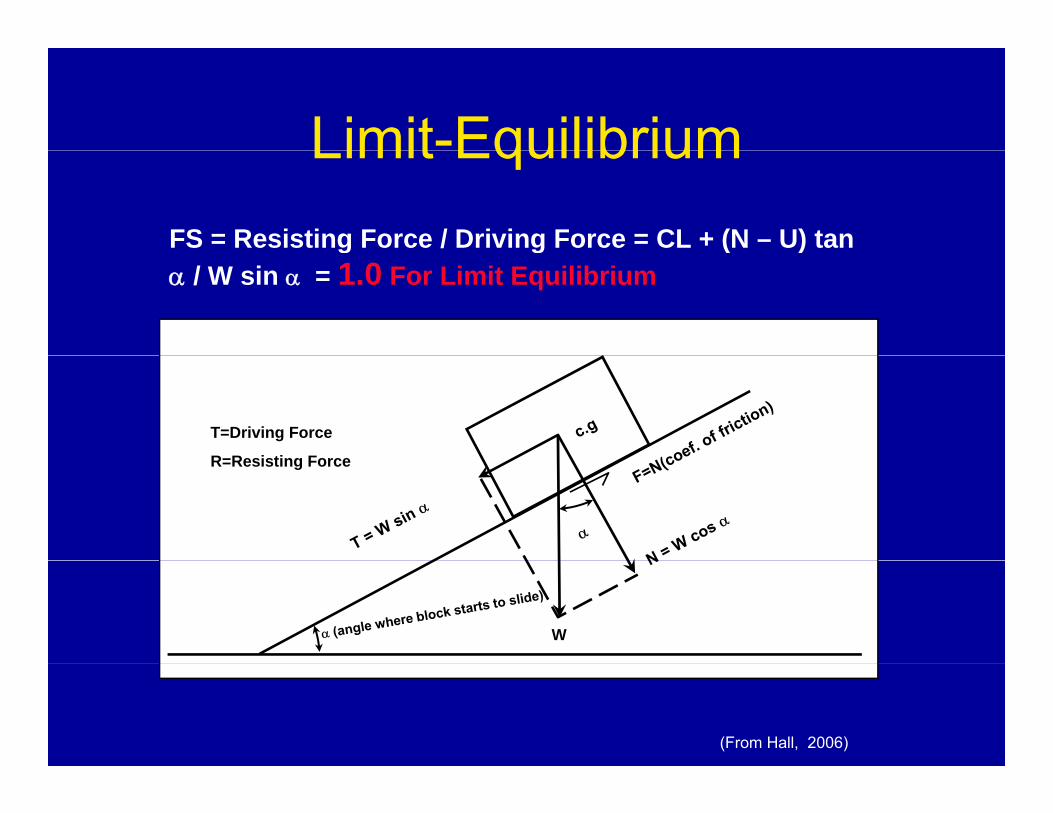
Limit-EquilibriumLimit EquilibriumFS = Resisting Force / Driving Force = CL + (N – U) tan g g ( )α / W sin α = 1.0 For Limit Equilibrium
T=Driving Force
R R i ti FR=Resisting Force
W
(From Hall, 2006)

Limit-EquilibriumLimit Equilibrium
• Back Analysis = Large Scale Lab Test ofBack Analysis = Large Scale Lab Test of Failure Surface
Original Geometry
Existing Geometry
Original Geometry and Ground Water at Failure ≈ Peak Phi (φp)Existing Geometry
and Ground Water ≈ Residual Phi (φr)
(φ )

Basic Strain Wedge in Uniform soilBasic Strain Wedge in Uniform soil
Loading from Slide
x
Pτ
Resistance from Soil/Rock Below Failure Surface
Pile Width (D)Slice of Wedge at Depth x
(From Ashour, 1998)
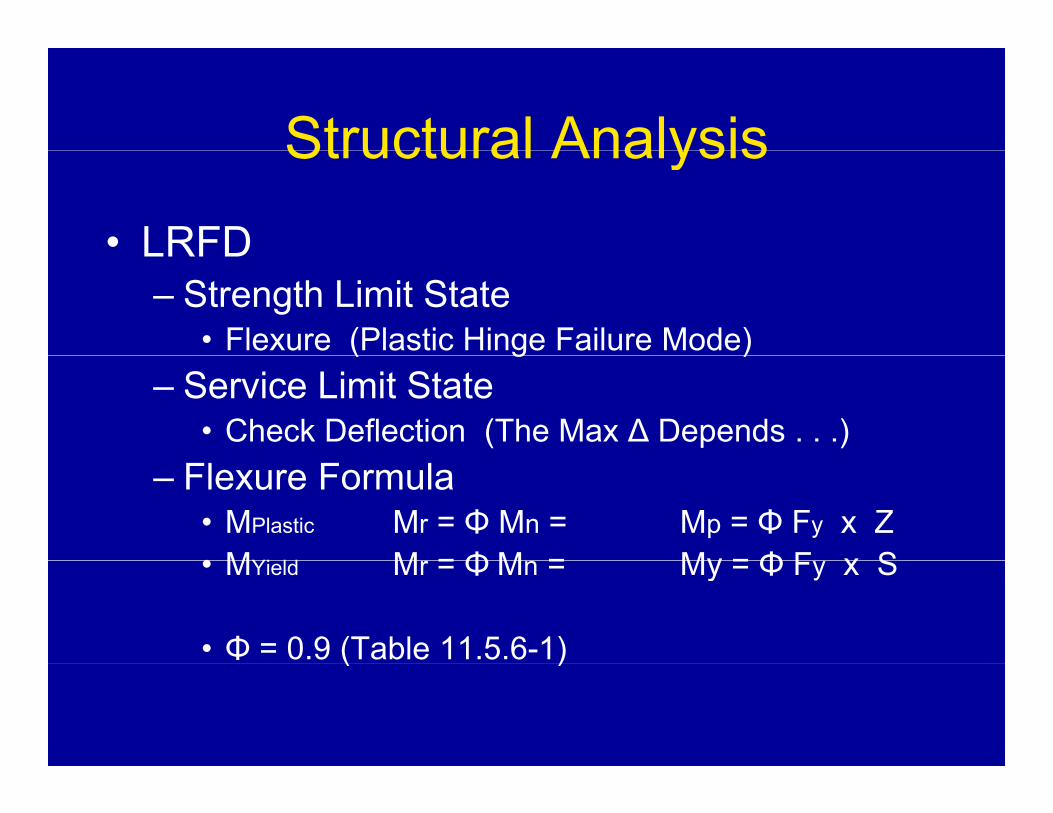
Structural AnalysisStructural Analysis
• LRFDLRFD– Strength Limit State
• Flexure (Plastic Hinge Failure Mode)( g )– Service Limit State
• Check Deflection (The Max Δ Depends . . .)– Flexure Formula
• MPlastic Mr = Φ Mn = Mp = Φ Fy x Z• MYi ld M = Φ M = My = Φ F x S• MYield Mr = Φ Mn = My = Φ Fy x S
• Φ = 0.9 (Table 11.5.6-1)( )

Design ApproachesDesign Approaches
Just Move the Road
CutOriginal
Sl S f
Fill
Slope Surface

Design ApproachesDesign Approaches

Design ApproachesDesign Approaches

Slide AnalysisSlide Analysis• First
• Determine Geometry of Slide Mass• Soil Strength Parameters• Water Level
• Utilize the Stability Analysis• Back calculationac ca cu at o• Obtain a Factor of Safety of 1.0• Determine Pile Size and LengthDetermine Pile Size and Length

Surveying and MappingSurveying and Mapping• Must have a field survey y
• A minimum • “Worst Case”
Cross Section• 20-ft beyond
• Entire Slide Area• Entire Slide Area• 20-ft beyond
• Visible WaterVisible Water • Drainage• Other FactorsOther Factors

Simple SurveySimple Survey
• Abney Level and TapeAbney Level and Tape

Complete Survey CrewComplete Survey Crew

Example of Good Survey

Required InformationRequired Information
• Depth to RockDepth to Rock• Depth to Water Table
• Water Level (Keep in Mind Climatic Conditions)Water Level (Keep in Mind Climatic Conditions)
• Soil Moisture• Depth to Slip SurfaceDepth to Slip Surface
• Moisture• Soil StiffnessSoil Stiffness• Inclinometers
• Commercial• Home-made

InclinometersInclinometers
• Slip PlaneSlip Plane

Drilling and SamplingDrilling and Sampling
• Estimate Soil/Rock ParametersEstimate Soil/Rock Parameters• N-Values• Cathead v Auto Hammer• Cathead v. Auto Hammer
• 60% efficiency for rope and cathead hammers • 80% efficiency for the auto hammer80% efficiency for the auto hammer
• Core Samples• RMR DataRMR Data
– Log Joint Spacing and Condition

Boring Logs• N ValuesN Values• Water Level• Soil Change• Rock Depth• Soil Moisture
RQD• RQD
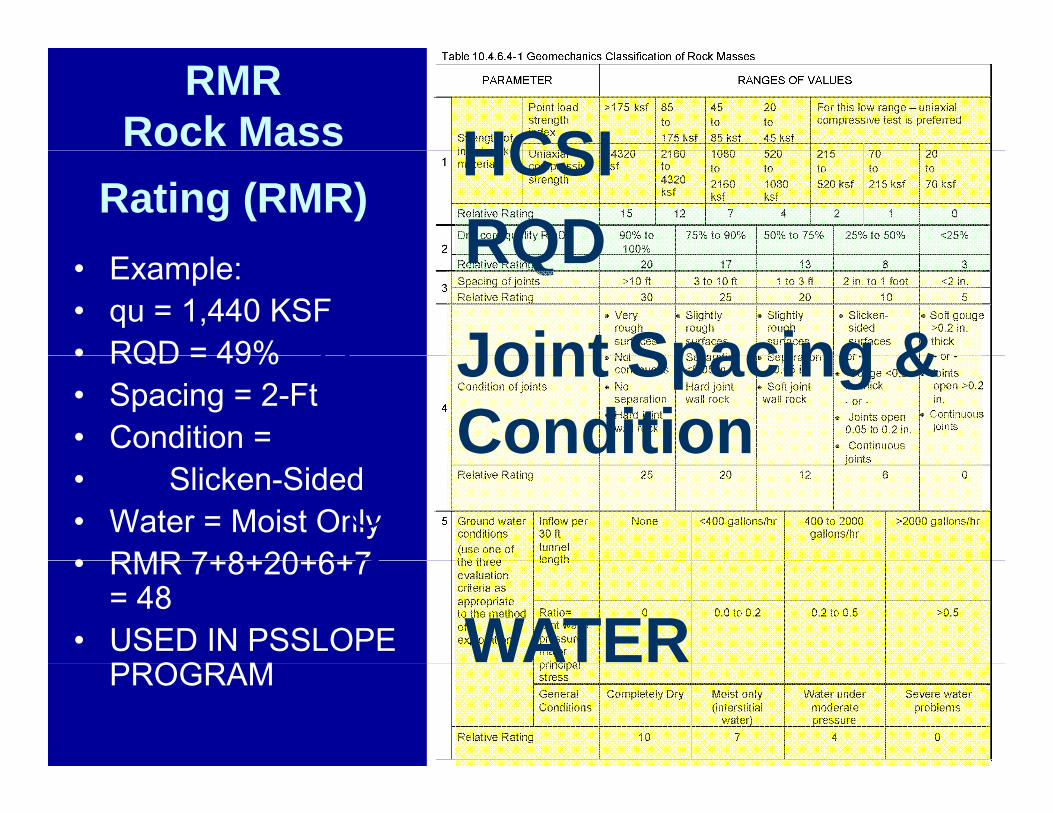
RMRRock Mass HCSI
Rating (RMR)HCSIRQD• Example:
• qu = 1,440 KSF • RQD = 49%
RQD
Joint Spacing &• RQD = 49%• Spacing = 2-Ft• Condition =
Joint Spacing &Condition
• Slicken-Sided• Water = Moist Only • RMR 7+8+20+6+7• RMR 7+8+20+6+7
= 48• USED IN PSSLOPE
PROGRAMWATER
PROGRAM

Gravel, loose
Shaley Clay, ms, moist
Shaley Clay, s, slightly moist
Clayey Shale (Possible Weathered Shale), vs, dry
Arenaceous Shale, H
•BOH 461.2-ft

Soil and Rock B d iBoundaries

Point Coordinates

Line NumbersLine Numbers

Line NumbersLine Numbers
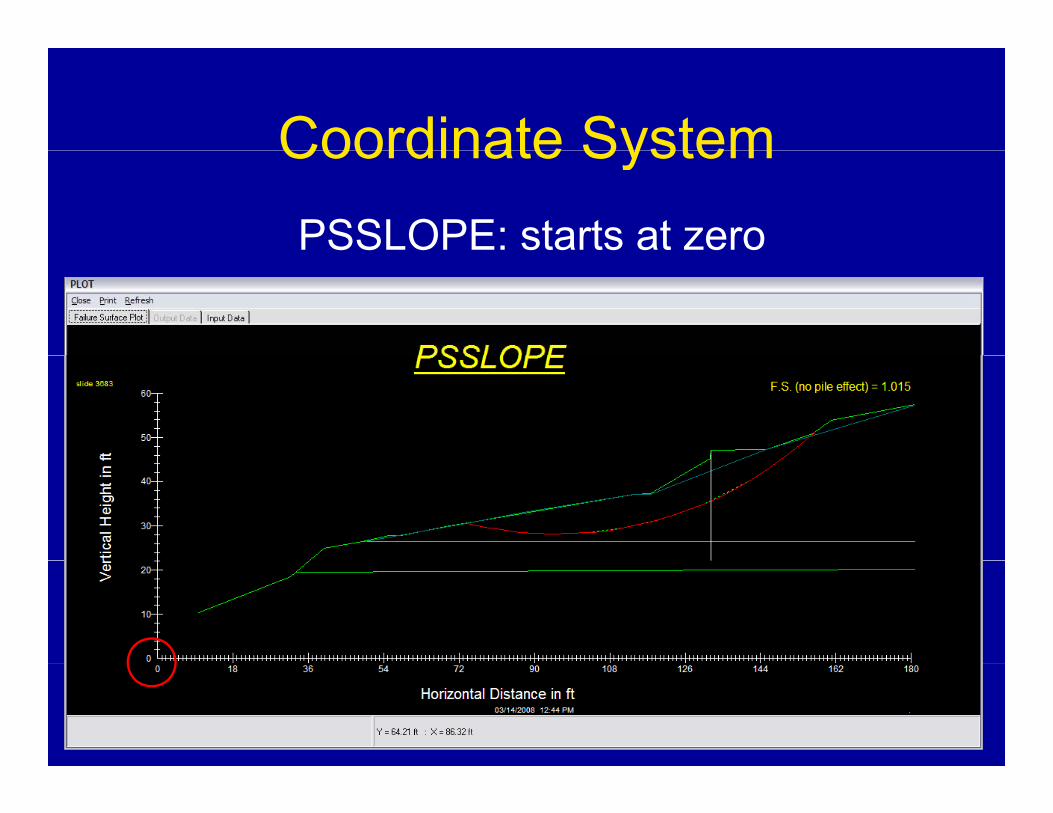
Coordinate SystemCoordinate SystemPSSLOPE: starts at zero
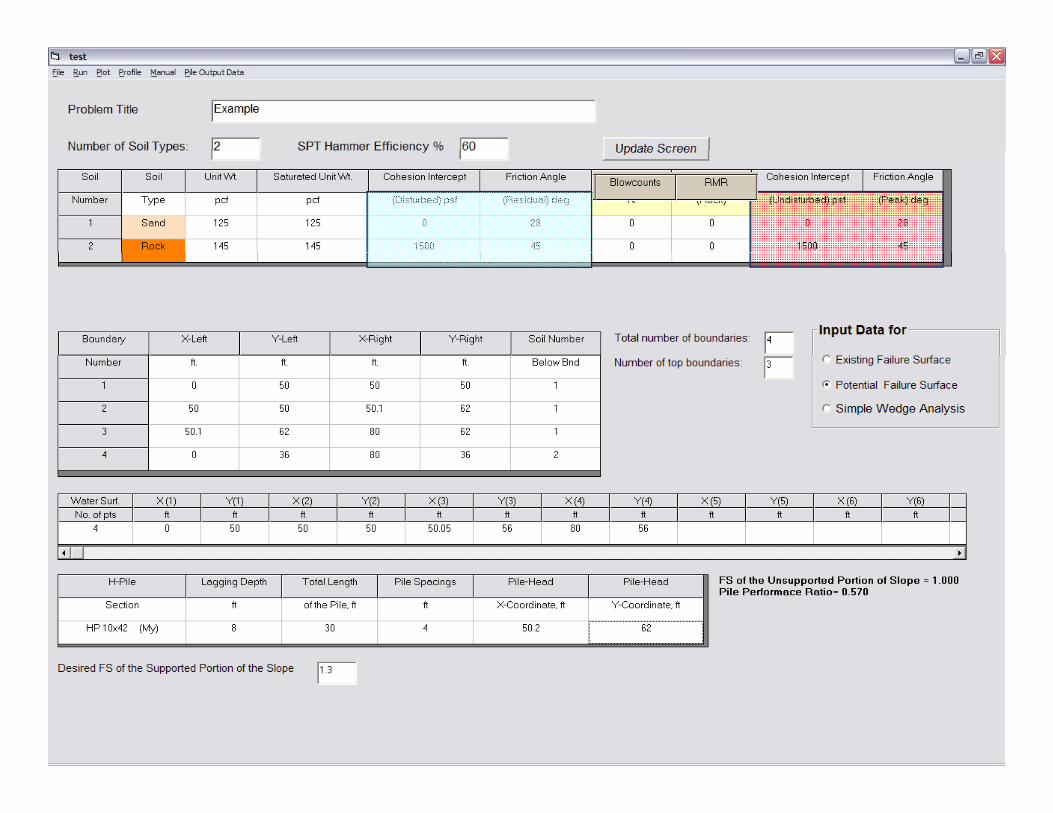

Layers and Soil Type D iDocumentation

Failure Points

Failure Points

Failure Plane

Failure Plane
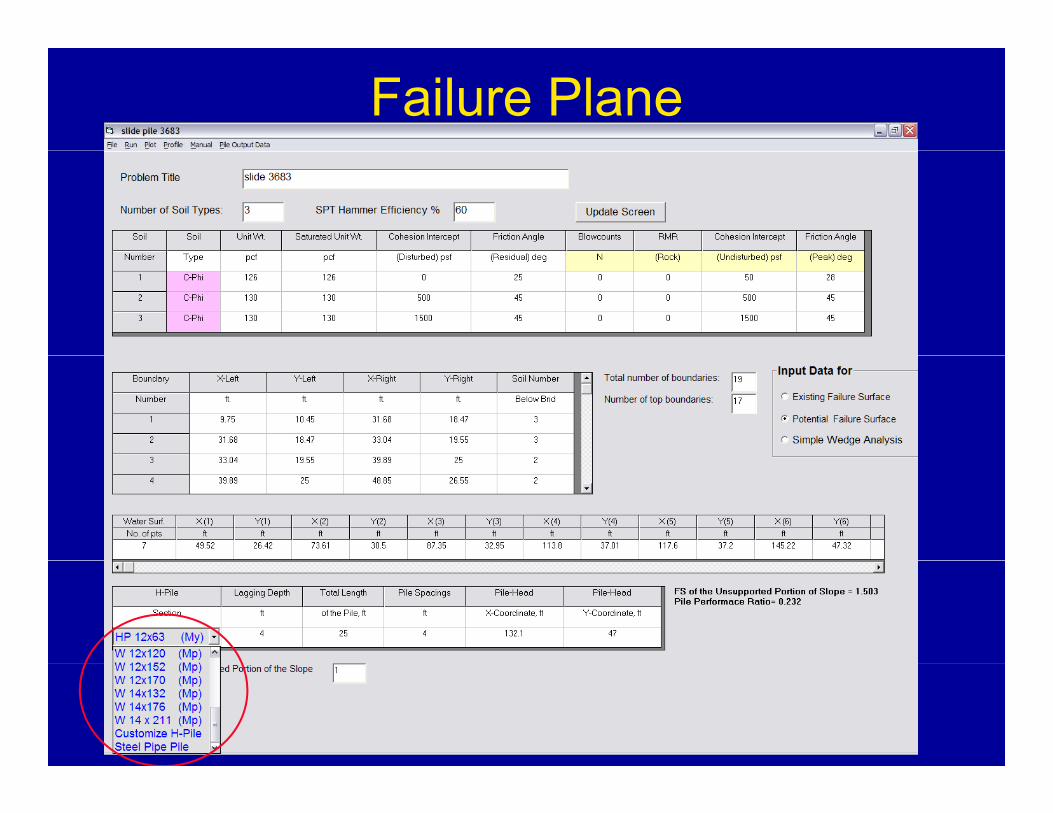
Failure Plane

Desired FOS
1.3


Simple Wedge Function