02 02 pcie 2.0 link layer test concepts final
TRANSCRIPT
Measuring local council performance – Working Paper, September 2007 . www.krevi.dk
Measuring Local Council Performance
Working Paper – September 2007
Lessons from Comprehensive
Performance Assessment in
England
Measuring local council performance – Working Paper, September 2007 . www.krevi.dk
2
KREVI
This paper describes negative as well as positive effects of the English CPA-system for measuring local council performance. The purpose is to provide in-sights that can qualify work and thought on the so-called national indicators in Denmark. Review of an extensive but probably not exhaustive literature on the subject leads to the conclusion that CPA has had important negative effects and that many of the effects are acknowledged by central government. Avoiding these negative effects will be an important challenge in both England and Den-mark. The paper has been authored by senior consultant Peter Holdt-Olesen, consultant Lone Bjørn Madsen and student assistant Katrine Nøhr. We have re-ceived helpful comments from Christian Bason, Innovation Manager at MindLab, Olaf Rieper, Director of Research at the Danish Institute of Governmental Re-search (AKF), and Hanne Foss Hansen, Professor in public administration and or-ganization at the department of political science, University of Copenhagen. KREVI is alone responsible for the final paper. KREVI, September 17, 2007 Tim Jeppesen Director
Olof Palmes Allé 13 8200 Århus N www.krevi.dk [email protected] T: 7226 9970 F: 7226 9980 ISBN. 978-87-92258-00-7 (elektronisk version) Graphic design: Designit
Measuring local council performance – Working Paper, September 2007 . www.krevi.dk
3
TABLE OF CONTENTS
ABSTRACT .................................................................................................................................................4
1 BACKGROUND.......................................................................................................................................5
2 PURPOSE ..............................................................................................................................................6
3 A NOTE ON THE STRUCTURE OF BRITISH LOCAL GOVERNMENT..........................................................7
4 THE USE OF PERFORMANCE INDICATORS IN THE UK – A BRIEF OVERVIEW.......................................8
4.1 THE AUDIT COMMISSION ....................................................................................................................................... 8
4.2 BEST VALUE PERFORMANCE INDICATORS............................................................................................................. 8
4.3 LOCAL PUBLIC SERVICE AGREEMENTS AND LOCAL AREA AGREEMENTS............................................................... 8
4.4 COMPREHENSIVE PERFORMANCE ASSESSMENT.................................................................................................. 9
5 THE CPA FRAMEWORK........................................................................................................................10
5.1 THE INTRODUCTION OF CPA ................................................................................................................................ 10
5.2 BUILT-IN INCENTIVES ......................................................................................................................................... 10
5.3 THE CONTENT OF CPA ......................................................................................................................................... 11
6 EFFECTS OF THE CPA FRAMEWORK...................................................................................................15
6.1 VIEWS OF THE AUDIT COMMISSION ..................................................................................................................... 15
6.2 NEGATIVE EFFECTS OF CPA................................................................................................................................. 15
6.3 NO POSITIVE EFFECTS? ...................................................................................................................................... 20
7 TRANSITION FROM CPA TO COMPREHENSIVE AREA ASSESSMENT...................................................22
8 CONCLUDING REMARKS.....................................................................................................................25
8.1 DRIVING IMPROVEMENT OR PROMOTING ACCOUNTABILITY?.............................................................................. 25
8.2 OUTCOMES, OUTPUTS AND PROCESSES.............................................................................................................. 27
8.3 VALUE FOR MONEY?........................................................................................................................................... 27
APPENDIX 1: DETERMINING OVERALL CPA CATEGORIES......................................................................28
REFERENCES..........................................................................................................................................29

Measuring local council performance – Working Paper, September 2007 . www.krevi.dk
4
ABSTRACT Standardized performance measurement across local authorities is a recent develop-ment in Denmark but of much older date in England. In order to provide insights that can qualify work and thought on the so-called national indicators in Denmark, KREVI has reviewed an extensive but probably not exhaustive literature on the English CPA-system for measuring local council performance. This literature mainly highlights negative effects of CPA. We can not conclude that the effects of CPA have mainly been negative, but we can say that there have been important negative effects and that many of the effects are acknowledged by central government. Avoiding these negative effects will be an important challenge in both England and Denmark.

Measuring local council performance – Working Paper, September 2007 . www.krevi.dk
5
1 BACKGROUND Measuring and documenting the performance of the public sector has been on the agenda for several years in Denmark as well as in most other countries. Increasingly, public bodies are focusing on the results that their activity has for citizens.
At the local level most Danish municipalities measure the results of their activity, but the methods and scope of performance measurement vary from one organization to the other. The most recent development is a move towards more standardized per-formance measurement across municipalities. An important element of this move is the mutual agreement between central government and Local Government Denmark (LGDK - interest group and member authority of Danish municipalities) to develop a set of so-called national performance indicators. Twenty-three indicators related to care for elderly people have already been developed, and further work is underway in the area of social care for children. The new indicators are ‘national’ in the sense that all municipalities will be scored on each indicator. In this way they provide local authorities with a means of setting benchmarks and targets for service improvement, local electors with a basis for judg-ing the comparative performance of their council, and central government with a mechanism for monitoring and regulating local government. The development of national performance indicators is presented by both central gov-ernment and LGDK as a means of preserving and extending local freedoms in the plan-ning and delivery of public services. Increased and improved performance documenta-tion is exchanged for local liberties, so to speak.

Measuring local council performance – Working Paper, September 2007 . www.krevi.dk
6
2 PURPOSE
Whereas the move towards standardized performance measurement across local au-thorities is a recent development in Denmark, it is of much older date in other coun-tries. One example is the United Kingdom, where national performance indicators have been used since 1993. Since 2002 these indicators have formed part of a wider per-formance assessment scheme for British local authorities called Comprehensive Per-formance Assessment (CPA).
The purpose of this paper is to present the overall content of CPA and to discuss its ef-fects. Our aim is to provide insights that can qualify work and thought on national indi-cators in Denmark. The paper draws exclusively on literature already published on CPA - academic articles as well as reports from the Audit Commission, the organization responsible for carrying out CPA. That is, we do not produce and analyze primary data, but instead try to sum-marize existing data and analyses.
Measuring local council performance – Working Paper, September 2007 . www.krevi.dk
7
3 A NOTE ON THE STRUCTURE OF BRITISH LOCAL GOVERNMENT From the 1970s to the 1990s Britain had a two-tier model of local services provision whereby county and district councils assumed split responsibility for services. In the 1990s the view of central government was that this two-tier model was inefficient and confusing, and that the county councils were too remote from those they served. The government therefore decided that county councils should be abolished and their functions transferred to district councils, with some of the smaller districts being merged. In Scotland and Wales this is exactly what happened. In England, however, there was a process of local consultation which led to the single tier model being im-plemented in some places but rejected in others. Where single tier councils were im-plemented, they were called unitary authorities.
The resulting structure is anything but clear. England now has 114 unitary councils, 34 county councils and 238 district councils. Unitary authorities are responsible for the complete range of services, from education and social welfare to environmental pro-tection, housing, and leisure. In the two-tier system, in turn, county councils provide education, welfare and environmental protection, and district councils provide hous-ing, waste collection and leisure (Haubrich and McLean, 2006b, pp. 272-273).
British local authorities are responsible for about a quarter of all public spending in the UK. About a quarter of this spending is financed through local taxation, and three quar-ters through transfer payments from central government (McLean et al, 2007, p. 111).
Compared to Denmark, the UK has more central government inspection of local activi-ties. There are a total of 11 main inspectorates covering education, social care and other areas. Monitoring local government in England alone costs 2.5 billion pounds, which includes an estimated 700 million pounds for the existing service inspector-ates, but excludes the cost accruing to local authorities themselves. This cost of audit-ing local government amounts to 2.1 percent of the expenditure audited (Haubrich and McLean 2006b, p. 272). The CPA framework is only used for English local authorities. Wales and Scotland have opted for different assessment frameworks, which will not be discussed in this paper (the UK government does not oversee local government in Wales and Scotland, where it is the responsibility of the devolved administrations in each country). In England, CPA was initially introduced for unitary and county councils only. I 2005 a tailored framework for district councils was also implemented, but the focus here will be exclu-sively on the framework for unitary and county councils.

Measuring local council performance – Working Paper, September 2007 . www.krevi.dk
8
4 THE USE OF PERFORMANCE INDICATORS IN THE UK – A BRIEF OVERVIEW In the UK, performance indicators are used in several co-existing frameworks. Some of the more important ones are described shortly in this chapter, so as to put CPA into its proper context.
4.1 The Audit Commission
Indicators in the UK are collected and published by the Audit Commission, an inde-pendent body created in 1983 to perform the task of checking not only that public money is spent for authorized purposes, but also that the investment is done effec-tively and efficiently. With its 2500 employees, the Audit Commission today is the regulatory arm of central government in relation to local government (Haubrich & McLean, 2006b, p. 274).
4.2 Best Value Performance Indicators
The Local Government Act 1999 introduced the duty of best value, which requires local authorities to seek to achieve continuous improvement by considering the efficiency, effectiveness and economy of their service delivery. From 2000 the Audit Commis-sion’s indicators were consequently renamed Best Value Performance Indicators, as they indicate whether local authorities are achieving best value and improving per-formance (Department for Communities and Local Government, 2007c). With the change of name, the number of indicators was reduced from 195 to 105 (Boyne, 2002, p. 22). The best value measures of performance are set by central government departments against key service delivery areas. The data is collected and audited annually by the Audit Commission. There are currently a total of 90 Best Value Performance Indicators. National targets, called performance standards exist for three indicators only. For all other indicators local authorities have to set local targets themselves. The duty of Best Value is to achieve continuous improvement, so where councils are setting their tar-gets, they should aim to improve their performance year on year, and set a target that reflects an increase in performance. Each local authority is obliged to publish their Best Value Performance Indicators in an annual Best Value Performance Plan.
4.3 Local Public Service Agreements and Local Area Agreements
The use of Best Value Performance Indicators is complemented by the use of volun-tary Local Public Service Agreements in which local authorities negotiate challenging targets with central government. These include twelve targets for specific improve-ments in performance, which can run across the full range of local services. Financial rewards, paid directly by the government, are associated with the achievement of these targets. Almost all local authorities have elected to negotiate a Local Public Ser-vice Agreement. In 2004 Local Area Agreements were introduced. They are obligatory three year agreements that set out the priorities for a local area agreed between Central Govern-ment and the local area, represented by the local authority/authorities and other key partners. Agreements focus on a collection of goals across a range of services which can relate to either national or local priorities. Performance targets and performance indicators are a central part of both Local Public Service Agreements and Local Area Agreements.
Measuring local council performance – Working Paper, September 2007 . www.krevi.dk
9
4.4 Comprehensive Performance Assessment
In a Local Government White Paper issued in December 2001 (Strong Local Leader-
ship – Quality Public Services) central government set out its commitment to assess the overall performance levels of local authorities via a Comprehensive Performance Assessment process. The CPA process, which has been undertaken by the Audit Commission since 2002, measures local authority performance against Best Value performance levels and other performance targets, inspection and audit reports, a cor-porate governance assessment and self-assessments by the local authority. Perform-ance indicators are thus only one of many elements in the CPA process. The end result is a categorization of local authorities into 5 classes: 0 to 4 stars, with 4 stars being the best performing category. New ratings are produced every year. Best Value Performance Indicators are used in CPA, along with multiple other perform-ance indicators, but still exist in their own right. Local authorities still have to set tar-gets for each indicator and publish results on an annual basis in their Best Value Per-formance Plan. Local Public Service Agreements and Local Area Agreements also co-exist with CPA. As the most recent ambitious and overarching attempt at performance assessment, CPA is the natural focus of most scholars, and of ours as well.
Measuring local council performance – Working Paper, September 2007 . www.krevi.dk
10
5 THE CPA FRAMEWORK
5.1 The introduction of CPA
The stated aim of CPA was to shift ‘focus to the assured delivery of outcomes through a national framework of standards and accountability, and away from controls over in-puts, processes and local decisions’. The new performance framework was therefore accompanied by what central government presented as ‘a substantial package of de-regulation’ (Department for Transport, Local Government and the Regions, 2001, p. 10).
Information from comprehensive performance assessment was expected to lead to:
• targeting of support and inspection resources according to councils’ strengths, weaknesses and needs;
• clear and concise public information about councils’ performance • targeting of additional freedoms to councils with the capacity and track re-
cord to make best use of them for their communities; • easier identification of poor performance and earlier action by councils and
others to tackle it; • better informed negotiations on Local Public Service Agreements (Depart-
ment for Transport, Local Government and the Regions, 2001, p. 24).
CPA was intended to draw together and summarize information from a long list of exist-ing performance assessments in the form of audit reports, service inspections and performance indicator data. The end result would be a ‘balanced scorecard compiled by the Audit Commission with assistance from other inspectorates and bodies with an assessment role’ (Department for Transport, Local Government and the Regions, 2001, p. 27). The development of CPA did not mean the abolition of existing inspec-tions. Thus, each authority’s performance on key services would still be identified separately using the appropriate inspectorates’ assessments.
In line with central government’s commitment to Best Value, local councils were ex-pected to progress up the performance spectrum. Successive comprehensive per-formance assessments would show which councils were making such progress. They would also show if any councils were standing still or sliding down the performance spectrum.
5.2 Built-in incentives
As mentioned above, special freedoms are rewarded to councils with a good CPA per-formance record. These incentives include:
• the elimination of “ring-fencing” from most governmental grants to the local authority, which allows the latter to spend money on those areas it (rather than central government) deems most appropriate;
• a three-year exemption from subsequent audit inspections (termed ‘inspec-tion holiday’);
• an exemption from having a “cap” imposed on the authority’s planned ex-penditure and the level of council tax it is allowed to raise from its taxpayers; and
• the freedom not to have to submit detailed service plans to central govern-ment for approval. These rewards are collectively known as ‘earned auton-omy’ (Haubrich & McLean, 2006b, p. 275).
Conversely, poor performing councils can expect a comprehensive programme of tighter and more frequent inspections, which can go as far as the imposition of exter-
Measuring local council performance – Working Paper, September 2007 . www.krevi.dk
11
nal monitoring boards that will meet at three-monthly intervals and scrutinize the au-thority’s progress on a continuous basis (McLean et al, 2007, p. 111).
5.3 The content of CPA
The CPA framework pulls together a range of information to reach an overall judgement on a councils’ performance. As of 2007 the framework has four main components:
• A service assessment; • A use of resources assessment; • A corporate assessment; and • A direction of travel assessment
The three first components are scored individually, after which the scores are brought together by the Audit Commission in order to categorize councils according to their overall performance. Councils are categorized into 5 classes: 0 to 4 stars, with 4 stars being the best performing category. New ratings are produced every year
The direction of travel assessment is reported alongside the CPA category to indicate the progress being made towards achieving improvement. Four labels are used: Im-proving strongly; improving well; improving adequately; not improving adequately or not improving. In Audit Commission reports on council performance the two types of categorizations are reported alongside each other. For instance councils can be reported as “improving well and demonstrating 3 start performance” or “not improving adequately and dem-onstrating 1 star performance”. The four basic elements in CPA are explained below.
Service assessment
The annual service assessments assess councils’ services using national perform-ance information, including Best Value Performance Indicators, combined with inspec-tion judgements where they exist. Existing information from other inspectorates is used in the process. Six service areas are scored individually:
• Children and young people; • Social care (adults); • Housing; • Environment; • Culture; and • Benefits.
The assessment score (1-4) for each service is determined by combining a score for the performance indicator set with a score for any relevant service inspections.
PERFORMANCE INDICATOR SCORE
Performance indicators are brought together from a range of sources. Best Value Per-formance Indicators form an important part of this indicator set, but many more indica-tors are used.
In order to distinguish between the relative levels of performance, the result for each indicator is compared against pre-determined thresholds. Two thresholds are used for each indicator – a lower and an upper threshold. Where there are national standards or
Measuring local council performance – Working Paper, September 2007 . www.krevi.dk
12
targets that have been determined or endorsed by central government, achievement or progress towards the standard or target is used to set the thresholds. In other cases the default thresholds are linked to the lower and upper quartiles.
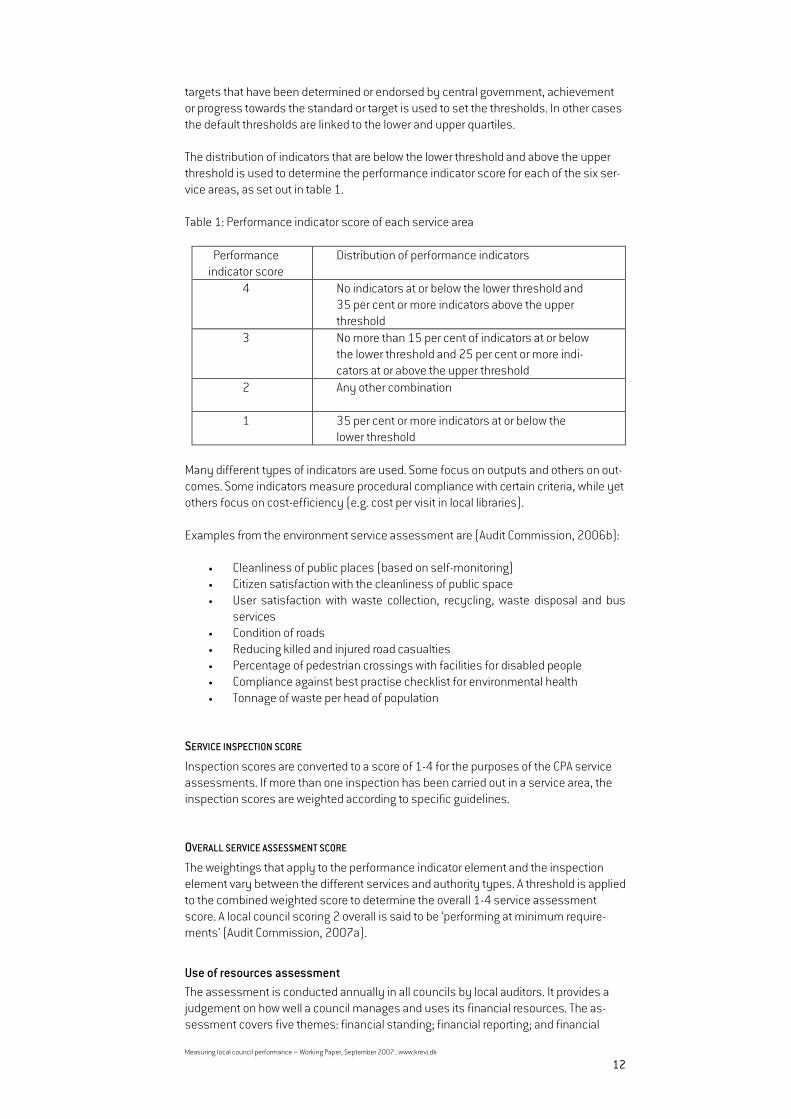
The distribution of indicators that are below the lower threshold and above the upper threshold is used to determine the performance indicator score for each of the six ser-vice areas, as set out in table 1.
Table 1: Performance indicator score of each service area
Performance indicator score
Distribution of performance indicators
4 No indicators at or below the lower threshold and 35 per cent or more indicators above the upper threshold
3 No more than 15 per cent of indicators at or below the lower threshold and 25 per cent or more indi-cators at or above the upper threshold
2
Any other combination
1
35 per cent or more indicators at or below the lower threshold
Many different types of indicators are used. Some focus on outputs and others on out-comes. Some indicators measure procedural compliance with certain criteria, while yet others focus on cost-efficiency (e.g. cost per visit in local libraries). Examples from the environment service assessment are (Audit Commission, 2006b):
• Cleanliness of public places (based on self-monitoring) • Citizen satisfaction with the cleanliness of public space • User satisfaction with waste collection, recycling, waste disposal and bus
services • Condition of roads • Reducing killed and injured road casualties • Percentage of pedestrian crossings with facilities for disabled people • Compliance against best practise checklist for environmental health • Tonnage of waste per head of population
SERVICE INSPECTION SCORE
Inspection scores are converted to a score of 1-4 for the purposes of the CPA service assessments. If more than one inspection has been carried out in a service area, the inspection scores are weighted according to specific guidelines.
OVERALL SERVICE ASSESSMENT SCORE
The weightings that apply to the performance indicator element and the inspection element vary between the different services and authority types. A threshold is applied to the combined weighted score to determine the overall 1-4 service assessment score. A local council scoring 2 overall is said to be ‘performing at minimum require-ments’ (Audit Commission, 2007a).
Use of resources assessment
The assessment is conducted annually in all councils by local auditors. It provides a judgement on how well a council manages and uses its financial resources. The as-sessment covers five themes: financial standing; financial reporting; and financial

Measuring local council performance – Working Paper, September 2007 . www.krevi.dk
13
management as well as a view on the internal control mechanisms and value for money. It includes a self-assessment by the councils of their performance in achiev-ing value for money. The self-assessments provide the opportunity for councils to ex-plain the rationale behind local decision making and prioritisation. Judgements are made for each theme on a 1-4 scale and the scores are then com-bined, using a set of rules, to produce an overall use of resources score.
Corporate assessment
Each council will have a corporate assessment over a three year period. The corporate assessment focuses on the importance of a sound corporate ‘engine’ to drive good services. It measures how effectively the council is working corporately, and with its partners, to improve services and deliver improved outcomes for local people. The as-sessment is carried out by an inspection team consisting of six people, including Audit Commission officers, a peer officer and a peer councillor. The following themes are covered in the assessment: the councils’ ambition for the community; its prioritisation; its capacity; its performance management; and its achievement.
Direction of travel assessment
The direction of travel assessment is an annual judgement which provides information on whether a council is complying with its duty of making arrangements to secure con-tinuous improvement (the duty of best value). It is carried out by an Audit Commission officer and indicates how likely the council is to improve in the near future. It seeks to answer the following questions:
• What evidence is there of the council improving outcomes? • How much progress is being made to implement improvement plans to sus-
tain future improvement?
The starting point for the direction of travel assessment is a self-assessment by the council. The information and evidence it provides help to inform the judgement made by the Audit Commission officer.
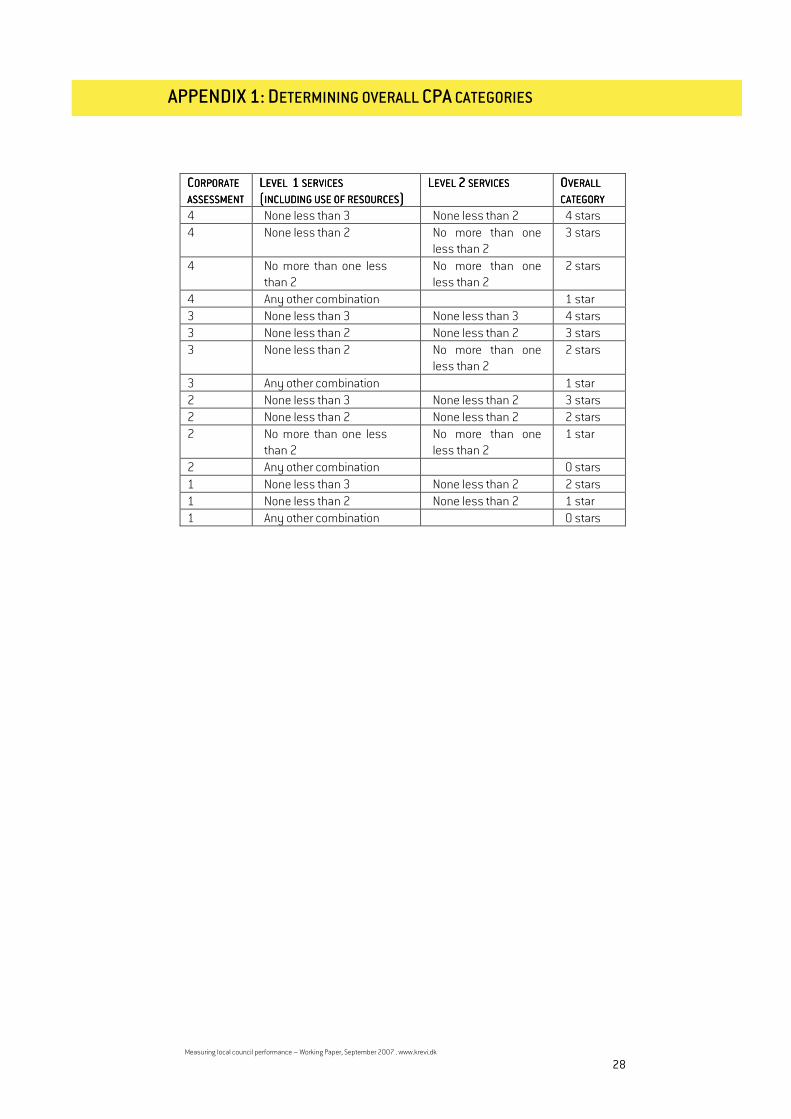
Determining overall CPA categories
The overall CPA score is arrived at by applying a complex set of rules to the service as-sessment scores for the six service areas, the use of resources assessment score and the corporate assessment score. The rules table for categorisation is shown in appen-dix 1. Of the six service areas, two are given special weight in calculating the overall CPA score. These so-called level 1 services are ‘children and young people’ and ‘social care (adults)’. The CPA framework is depicted graphically in figure 1 below.
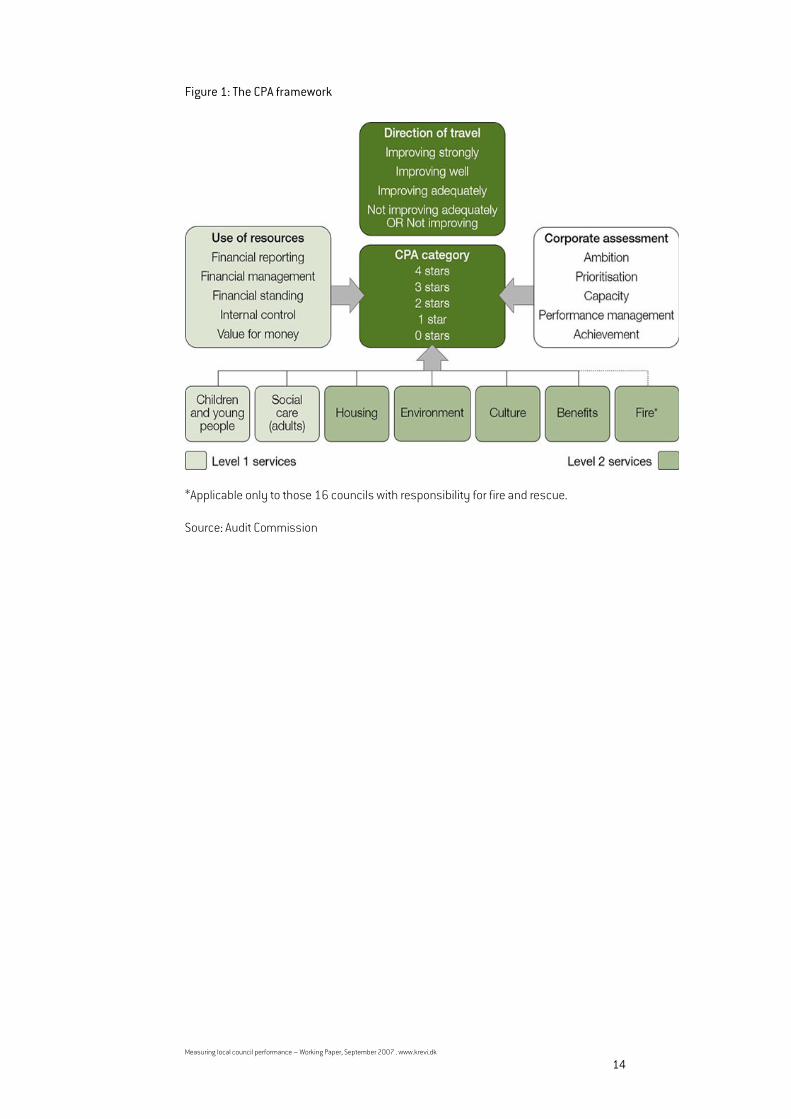
Measuring local council performance – Working Paper, September 2007 . www.krevi.dk
14
Figure 1: The CPA framework
*Applicable only to those 16 councils with responsibility for fire and rescue. Source: Audit Commission
Measuring local council performance – Working Paper, September 2007 . www.krevi.dk
15
6 EFFECTS OF THE CPA FRAMEWORK When analyzing the effects of the CPA framework, we draw on three sources of infor-mation: Reports from the Audit Commission, academic articles, and user judgements from the English local councils, as expressed in consultation responses, qualitative in-terviews with academic writers etc.
6.1 Views of the Audit Commission
The Audit Commission has published many reports on CPA, most of which are available on the organization’s website. We have not, however, encountered any Audit Commis-sion evaluation of the CPA and its positive and negative effects. All the encountered re-ports are rather descriptive; they describe the system as it is or as it will be after im-plementation of proposed changes. Changes are typically presented as refinements or optimizations of the framework, and little time is spent on any problems that the changes might be addressing. It is clear, however, that the Audit Commission considers CPA an overall success. Back in 2002 the chair of the Commission went as far as considering the first round of CPA ‘a phenomenal success’ (Wilson, 2004, p. 65). The following quotations illustrate the way the Commission presents the merits of CPA in its reports.
‘Over the last three years, council services have improved significantly, and CPA is acknowledged to be one of the catalysts for this’ (Audit Commission, 2005b, p. 2). ‘[CPA] is an effective tool for categorising councils because it assesses per-formance from various perspectives in a consistent and comparable way. CPA has had, and continues to have, a significant impact on local govern-ment’ (Audit Commission, 2005b, p. 5).
Looking for other sources of information on the effects of CPA, we have encountered several articles, mostly academic, all of which hold a rather critical view on CPA. Some of the articles are partly based on interviews with local council officers and audit com-mission officers. Further information on local viewpoints has been obtained from an Audit Commission summary of consultation responses from local councils (2005a) and from surveys carried out for the Local Government Association (LGA).
6.2 Negative effects of CPA
The academic articles and local council consultation responses focus primarily on negative effects of CPA. Most points of criticism relate to the alleged poor validity of the performance measures used in CPA. Negative behavioural effects of this poor validity are also highlighted.
Poor indicators of performance
Several performance indicators are considered poor measures of local council per-formance by both academic writers and many local councils. That is, the measures are criticized for not measuring what they are intended to measure. For example, the indicator ‘Number of visits to the library’ is said to say little about the authority’s performance if the library’s stated mission is to provide as much informa-tion as possible via the Internet. Similarly, the indicator ‘Number of hostels for the homeless’ is of only limited value if it is the authority’s stated mission to have no hos-tels at all (but instead provide the homeless with proper temporary accommodation) (Haubrich & McLean, 2006b, p. 277). This presumes, of course, that temporary ac-commodation is professionally deemed a solution on par with hostels.
Measuring local council performance – Working Paper, September 2007 . www.krevi.dk
16
In consultation responses, councils often suggest alternatives to Audit Commission indicators. Within each service area, typically more than 50 per cent of councils want to see other indicators included (Audit Commission, 2005a).
Measuring local constraints rather than local performance
A general criticism directed at the performance indicators used in CPA is that they do not take into account the effects of various background factors that a local authority can neither control nor be blamed or praised for, such as demographic, socio-economic and geographic characteristics and resource constraints. Several studies have found significant statistical correlations between indices of deprivation and local authorities’ scores on individual performance indicators as well as their overall CPA scores (for an overview of these studies, see Haubrich & McLean, 2006a). Instead of measuring differences in performance, CPA scores might partly reflect differences in levels of deprivation among local councils. McLean et al (2007, pp. 115-116) point out that one specific CPA performance indica-tor is actually used for measuring an authority’s level of deprivation when allocating central government grants to local authorities. This indicator is ‘percentage of pupils in the authority doing well in key stages 2, 3 and 4’ (A key stage is a stage of the educa-tion system in the UK setting the educational knowledge expected of students at vari-ous ages. Key stages 2, 3 and 4 cover pupils aged between 7 and 16 years). Deprived areas receive larger central grants due to higher estimated spending needs. A contradictory incentive mechanism thus emerges to which authorities are exposed: Ei-ther they can choose to improve the authority’s schools obtaining a higher CPA score but a lower deprivation score. This would result in greater ‘earned autonomy’ of decid-ing how best to spend central grants, but also in a lower total grant. Or they can let the schools deteriorate, obtaining a higher grant (due to a higher deprivation score) but less autonomy to spend it (due to a lower CPA score). In the face of the criticism concerning socio-economic and other background factors, the Audit Commission initially maintained that it was not any harder (or easier) for an authority in a deprived area to score highly in CPA than for an authority in a prosperous area (McLean et al, 2007, p. 116). But in 2005 the Commission began adjusting a small number of its performance indicators for levels of deprivation. In subsequent consultation responses, a majority of local councils found that the Commission did not go far enough in this respect and that more indicators should be adjusted for depriva-tion (Audit Commission, 2005a). In its most recent annual performance report, the Commission states that it is under-taking research to examine the impact of local factors on councils’ performance. This research will, according to the Commission, help to inform the future approach to per-formance information (Audit Commission, 2007a, p. 48). It would thus seem that the Commission is increasingly addressing the criticisms concerning local constraints on council performance.
Mixed views on inspections as an assessment tool
As described in section 6.3, the service assessment part of CPA consists of a service inspection score in addition to the performance indicator score. And the corporate as-sessment and use of resources assessment also rely on inspection activities. Views on inspections as an assessment tool are mixed among local authorities. An important strand of criticism relates to the costs associated with inspection activi-ties. Not least the costs in local authorities, some of which have received visits from seven different inspectorates and auditors within a six-month period, according to Haubrich & McLean (2006, p. 276). A survey on the impact of inspection regimes,
Measuring local council performance – Working Paper, September 2007 . www.krevi.dk
17
conducted for LGA in 2004, found that during the financial year 2003/2004 preparing and undertaking inspections and audits in a council took on average 597 staff days. In the same survey 63 per cent of councils agreed that the cost of inspection massively outweighed the benefits gained. In other words, that the inspection regime did not de-liver value for money. 80 per cent of councils felt that inspection and audit regimes were not well co-ordinated (LGA 2005). Perhaps in order to accommodate this criticism, in 2005 the Audit Commission imple-mented some changes in CPA with the aim of reducing inspection activities. Corporate assessments would now be better coordinated with other inspections, and the inspec-tion element of the service assessment would have its weighting reduced vis a vis the performance indicator element, reflecting a reduced number of inspections, but also a desire to put greater focus on actual outcomes (Audit Commission, 2005c). This change received general acceptance from councils in consultation responses, but there was recognition and concern expressed by many about the limitations of the new approach. Concerns raised included that:
• the approach would fail to provide a rounded picture of council performance; • an assessment based entirely on performance indicators might be a tick-box
exercise, rather than a thorough assessment of service delivery; • an assessment based entirely on performance indicator data might fail to
adequately take account of local context/conditions; and • a system based entirely on performance indicators might rely too heavily on
imperfect, un-audited, data (Audit Commission 2005a).
The concerns raised show that many councils find that inspections add important qualitative elements to the assessment framework. On the other hand, some councils are sceptical of the many value judgements involved in determining inspection scores. Scores are often given for attributes that are very difficult to measure, including ‘ambi-tion’ and ‘prioritisation’, and some councils feel that inspectors’ preconceptions of the council affect their judgements on council performance (Haubrich & McLean, 2006b, p. 278). Moreover, an LGA survey from 2003 showed that over half of local council chief executives felt that the assessment process in the first round of CPA was harmed by an insufficient number of qualified inspectors (LGA, 2003, p. 4).
Arbitrary and simplified overall scores
The overall CPA score is, of course, no more valid than its different components. But the many rule based categorizations that lead to the overall score are criticized independ-ently for being as arbitrary as the individual indicator thresholds. Furthermore, the rules that lead to the overall scores are considered so complex that the scores become almost impossible to interpret for the citizen. On a more general level, many writers are sceptical of the belief that the quality of a di-verse range of services provided by large and complex organizations can be accurately reduced to a single star rating. Following a detailed investigation of local authority per-formance indicators, Boyne concludes that ‘performance is not driven by the general characteristics of local councils, but by the circumstances, organization or ethos of specific service departments. It is therefore inappropriate to categorize councils into ‘high performing’ and ‘low performing’ groups across all services’ (quoted in Wilson, 2004, p. 66). In a similar vein, Haubrich & McLean point out that many good ideas can be learned from badly performing authorities (in overall CPA terms). They find several examples of councils that enjoy ‘beacon status’ for their performance on areas such as race rela-tions or business planning processes, but receive low overall CPA scores. They con-clude that CPA scores do not appear ‘to capture how progressive an authority is or to
Measuring local council performance – Working Paper, September 2007 . www.krevi.dk
18
what extent it is a ‘learning organization’, characteristics deemed crucial for many pol-icy makers’ (Haubrich & McLean, 2006, p. 278).
Empirical inconsistencies
The validity of overall CPA scores is further challenged by two empirical inconsisten-cies. The first one concerns a lack of consistency between the two main measures in CPA, the measure of current overall performance and the measure of likelihood to im-prove in the near future (presently termed ‘Direction of travel’ but until 2005 ‘Ability to improve’). Thus, Haubrich and McLean (2006b) do not find any significant correlation between the ability-to-improve score in 2002 and the absolute changes observed in CPA scores between 2002 and 2003 and between 2002 and 2004, respectively. In other words, the ability to improve score is a poor predictor of subsequent actual im-provement, as measured in the overall CPA scores. This raises questions about the va-lidity of both measures. The tendency (a very weak one) is actually for councils with low ability-to-improve scores in 2002 to improve the most in subsequent years. The second inconsistency stems from the Audit Commission’s most recent annual performance report. On the one hand local councils continue to improve their overall CPA scores (this has been a general trend from the onset of CPA). Seventy-nine per cent of councils thus achieve 3 or 4 star performance, a 9 per cent improvement from 2005, and for the first time since CPA began in 2002, no councils are in the bottom CPA category (Audit Commission, 2007a). A basket of Best Value Performance Indicators, designed to give a balanced picture of performance over time, also shows councils have improved by 15.1 per cent between 2000/01 and 2004/05, and that the worst performers have improved faster than the rest (Department for Communities and Local Government, 2007a, p. 115). On the other hand, the Audit Commission performance report finds that overall citizen satisfaction with local councils has continued to decline. In 2000/01 satisfaction with councils was 61 per cent falling to 53 per cent in 2003/04 and 51 per cent in 2006/07. In 2006/07 only 20 per cent of residents felt that the way their council was running things had improved in the last three years. The Audit Commission does not comment on this inconsistency, but one possible explanation is that the general im-provement in CPA scores does not reflect actual improvements in council performance. Other explanations are possible, though (e.g. rising public expectations), and it should be noted that satisfaction with many individual service areas is actually improving (Audit Commission, 2007a, p. 47).
Negative behavioural effects
Academic writers also stress some general behavioural problems associated with per-formance metrics. It is pointed out that all performance indicators, and especially bad ones, are subject to strategic behaviour or ‘gaming’. While targets are achieved, this may simply be the result of learning to play the game rather than addressing the needs of the task in hand. For instance targets can be achieved at the cost of signifi-cant but unmeasured aspects of performance. Gaming of this kind was detected by McLean et al (2007) with an output indicator that is used to measure the extent to which an authority succeeds in promoting its leisure facilities to the public, namely the ‘number of swims per square foot of pool area’. The effort can be gamed in either of two ways:
• Closing all of an authority’s pools except one, which the die-hard swimmers would eventually have to be content with
• Allocating pool slots to members of swim clubs (whose lane-swimming dis-cipline allows for greater usage of each lane), at the expense of swimming lessons or general sessions for the public (which would require considerably more pool space per activity).

Measuring local council performance – Working Paper, September 2007 . www.krevi.dk
19
In both cases, the public would experience some deterioration in service quality, which should be reflected accordingly in the metric measuring this performance. Yet in both cases the performance indicator actually used would go up. Wilson (2004, p. 64) speaks of ‘targetology’ when a narrow focus on specific targets adversely affects other aspects of service delivery. A different form of gaming is so-called ‘threshold effects’. Threshold effects refer to the effects of targets on the distribution of performance, putting pressure on those per-forming below the target level to do better, but also providing a perverse incentive for those doing better than the target to allow their performance to deteriorate to the threshold, and more generally to crowd performance towards the target. McLean et al (2007) found evidence that some councils give priority to ‘quick win’ ac-tivities. These are measures that make the council move up a category on a particular indicator without incurring too much effort. This approach is, according to McLean et al, possible because the CPA regime stipulates for many indicators not only a numerical value of performance to be achieved but also the types and format of documentation that need to be produced or processes to be shown in place. Improving the ranking therefore becomes possible by simple (sometimes one-off) administrative adjust-ments, without improving the underlying performance. McLean et al speak of ‘proce-dural compliance’ when councils go through the motions of producing the documents and data necessary to satisfy the procedural requirements for attaining a higher score on a specific indicator, without actually improving the quality of the underlying service. Charles Goodhart, former chief economist of the Bank of England, has summed up the problems with targets and gaming in a famous one-liner: ‘When a measure becomes a target, it ceases to be a good measure’ (Haubrich & McLean, 2006b, p. 277).
Increased focus on processes rather than outcomes
In line with the observations on ‘quick win’ activities and procedural compliance, Hau-brich & McLean (2006, p. 277) find that CPA has led to a refocus on organizational structure, systems, and processes, apparently at the expense of a focus on outcomes and user satisfaction. This finding is quite contrary to the stated aims of CPA, which are to increase focus on outcomes and user satisfaction at the expense of a focus on sys-tems and processes.
Dead-weight rather than springboard
The Audit Commission has stated that it intends CPA ‘to act as a springboard for … an improved quality of life for local people’. Wilson (2004, pp. 65-66) fears that the overall labels of CPA will instead act as a dead-weight, inhibiting an authority’s improvement prospects and influencing external perceptions of the council and the locality. Accord-ing to Wilson, a poor rating might have adverse effects on ‘employee morale, recruit-ment and retention and perhaps the perceptions of business and the public on the ‘quality’ of the authority and the locality as a place in which to live, work and do busi-ness’. Broadbent (2003, p. 7) adds that the provision of information to the citizen might not necessarily lead to pressure for good services but simply to anxiety with lit-tle possibility of action. Perhaps the dead-weight fears regarding public ratings are exaggerated, though, owing to the fact that the general public does not seem to know even the overall rating of their local council. According to The Guardian (December 15, 2004), barely 5% of the elec-torate spontaneously recalls the CPA outcome for their authority.
Measuring local council performance – Working Paper, September 2007 . www.krevi.dk
20
Minimal room for local priorities and few local freedoms
Many councils find that CPA leaves minimal room for local priorities. It is argued that the setting of lower and upper thresholds for performance indicators pushes councils to give priority to activities they would not otherwise have emphasized, given their lo-cal characteristics and needs (Audit Commission, 2005a, 4). The setting of many indicator thresholds on the basis of lower and upper quartiles is furthermore criticized for being arbitrary and unfair to councils. Thus, a general im-provement in all councils will not change the number of councils scoring below mini-mum or acceptable standards (Audit Commission 2005a: 5). Many councils are also disappointed with the amount of deregulation and local free-doms associated with CPA. According to some, the initial aim of ‘earned autonomy’ has slipped off the agenda, for when authorities succeed in improving their performance ratings, no greater autonomy or lighter touch inspections have allegedly been granted in return. Some councils attribute this to the fact that the assessment results are not only influenced by an authority’s ‘real’ service performance, but also by the views that central government officials and auditors have formed over many years prior to any of the recent CPA exercises (Haubrich & McLean, 2006b, p. 278).
6.3 No positive effects?
Many negative effects of CPA have been highlighted in the previous section. Are there no positive effects then? The Audit Commission obviously believes so, but we have not found any documents where its generalized positive statements are explained in more detail. This problem might be addressed via future interviews with Audit Commission officers. Interviews with central government politicians might also be relevant, as they are important stakeholders in relation to CPA, together with local councils. For the present, we have been limited to available written material on the effects of CPA, and both academic articles and consultation responses from councils focus mostly on negative effects. However, some positive effects are mentioned. Based on extensive interviews with local council and Audit Commission officers, Hau-brich and McLean (2006b, pp. 276-277) find that CPA has helped in sorting out some very poorly performing authorities through the setting of ‘bottom line’ minimum stan-dards, in-depth guidance, additional monitoring boards for failing authorities, and peer-counselling. The measures are regarded by interviewees as necessary steps to get these authorities to a state they would otherwise not have reached. The same authors find that the publication of assessment results has increased the pressure of accountability on local councils. They further state that not only top man-agers, but also more junior and frontline members of staff, have been motivated by CPA, as they identify with the CPA ratings their employer achieves. Despite much scepticism among local councils, it is also worth noting some more posi-tive tones. A survey of local authority chief executives and leaders, conducted for LGA after the first round of CPA, found that around three quarters of chief executives agreed that the CPA assessment was a fruitful process for their authority (LGA, 2003). In a similar survey a year later, a majority of councils stated that they would go through the process again, given a choice in the matter. In the same study, around two thirds of chief executives and leaders felt their CPA score accurately reflected the performance of the council. In comparison, 55 per cent of councils were placed in the top two per-formance categories at the time. Interestingly, the higher the CPA score received, the more likely it was that councils believed the score to be accurate (LGA, 2004).
In both surveys, chief executives saw the self-assessment elements of CPA as by far the most constructive components of CPA. In line with this point of view, local councils

Measuring local council performance – Working Paper, September 2007 . www.krevi.dk
21
have repeatedly called for a stronger reliance on self-assessments in the assessment framework.
Measuring local council performance – Working Paper, September 2007 . www.krevi.dk
22
7 TRANSITION FROM CPA TO COMPREHENSIVE AREA ASSESSMENT
In October 2006 the British central government published a Local Government White Paper titled Strong and Prosperous Communities. The White Paper sets out proposals for a new performance framework for local councils to replace CPA from April 2009. The new framework will be known as Comprehensive Area Assessment (CAA). The exact future content of CAA is still rather vaguely defined, but the overall intentions of central government are described below.
Area focus rather than authority focus
CAA is intended to focus on outcomes secured by local authorities working alone or in partnership in areas – as opposed to the focus on local authority delivery in CPA. CAA will thus focus on place rather than the individual bodies responsible for local services. It will therefore need to reflect the contribution of all local authorities (i.e. districts and counties in two tier areas) and other local partners, as well as the effectiveness of local partnership working arrangements in meeting the needs of local communities and citi-zens.
A clearer focus on outcomes
A strong outcome focus has been the intention from the onset of CPA, and changes implemented in 2005 were intended to strengthen the focus on outcomes rather than processes. With CAA, the stated intention is once again to secure more focus on out-comes and less on processes.
More local targets
CAA includes a move towards more local targets, which is aimed at making CAA relevant to the quality of life of local people. According to the Audit Commission, ‘CAA will focus on what matters herehereherehere, and to whomto whomto whomto whom. It will challenge how local public service priorities have been set alongside national ones and whether they are rooted in a genuine un-derstanding of diverse local needs’ (Audit Commission, 2007b, p. 22). A clear set of government priorities will be defined with a single set of around 200 na-tional indicators. This is a significant reduction in the number of performance indica-tors, since at present there are between 600 and 1200 indicators against which areas must report to central Government (Department for Communities and Local Govern-ment, 2007a, p. 122). Performance against the national indicator set will be reported for each locality, but specific, local improvement targets are only set for a limited num-ber of indicators (up to 35). The local improvement targets are agreed for each local area in the Local Area Agreement, which may also include additional locally important targets that are outside of the national indicator set. In addition to local targets, all Lo-cal Area Agreements will contain 18 statutory education or early years targets.
More constructive and forward-looking
CAA is planned to contain a forward-looking assessment of risk and not rely solely on judgements of past performance. In the words of the Audit Commission, ‘the risk as-sessment would not say: ‘you are performing badly’, but ‘these are the risks you are running, and these are the potential impacts of not addressing them’’ (Audit Commis-sion, 2007b, p. 22). It is believed that this process of assessment will be a stronger mechanism for driving improvement and supporting innovation. The annual risk assessments of local areas replace the CPA star ratings of local authori-ties.
Measuring local council performance – Working Paper, September 2007 . www.krevi.dk
23
Less inspection - more self-assessment
The British Government has committed to a one-third reduction in the cost of public service inspection by 2008. Reflecting this commitment, eleven existing public sector inspectorates will become four by April 2008. And the new assessment framework will contain less inspection, thus reducing the burdens on the inspected. This presumes, according to central government, that local authorities and their part-ners improve local accountability for outcomes and services, including through trans-parent reporting of expectations and performance. LGA has committed to develop best practise models for self-assessment and peer challenge for local partnerships, and these will be important inputs in the annual risk assessments. Inspection activity will be targeted primarily on the basis of the risk assessment, with the Audit Commission operating as a ‘gatekeeper’ for all inspection activity affecting local authorities. There will be few programmes of automatic rolling inspection beyond March 2009. The Audit Commission’s new gatekeeper role reflects a desire to secure more coordi-nated inspection activity. As central government points out, ‘the cross-cutting nature of CAA judgements will require even greater levels of joint working between inspector-ates, as will the need to have appropriate joint inspection methodologies in place’ (De-partment for Communities and Local Government, 2007b, p. 6).
Stronger engagement with citizens
CAA entails a reduction in the amount of top-down control from central government. The intention is to compensate for this via more powerful ‘bottom-up’ pressures to drive improvements in services. Increased accountability to citizens and communities is pursued by adding to the best value duty so that authorities must secure the par-ticipation of citizens in their activities (Audit Commission 2007b, p. 23). According to the Local Government White Paper, the future assessment framework should have a greater focus on citizen experience and perspectives, including those of the most vulnerable who may not otherwise be as vocal as other citizens. And the re-sults of audit, assessment and inspection should be more publicly accessible so that they can support citizens to play a more empowered role locally (Department for Communities and Local Government, 2007b, p. 4).
More up-to-date judgements
CAA is meant to provide more timely judgements than the current inspection and as-sessment regimes, i.e. judgements based on as recent evidence and information as possible. According to central government, this is key to enhancing the value of the judgements to users, local partners and Government. CAA should therefore utilise real-time information where it is available and sufficiently robust, and should not be re-stricted to considering the last full financial year for which information is available (De-partment for Communities and Local Government, 2007b, p. 5).
Overall motivation for the proposed changes
In its Local Government White Paper, central government states that the overall inten-tion of the proposed changes is ‘to give citizens and communities a bigger say; to en-able local partners to respond more flexibly to local needs; and to reduce the amount of top-down control from central government. (…) if we are to continue to improve, we now need to give local authorities and their partners more freedom and powers to meet the needs of their citizens and communities – and enable citizens and communities themselves to play their part’ (Department for Communities and Local Government, 2007a, p. 7).

Measuring local council performance – Working Paper, September 2007 . www.krevi.dk
24
The following statement from Steve Bundred, Chief Executive of the Audit Commission, describes similar motivations for the introduction of CAA: [Beyond 2008] ‘there is a need to provide greater incentives for improvement through a more varied approach recognizing the different starting points of different local authorities and that local gov-ernment is not just about the delivery of services’ (Bundred, 2006, p. 187). Many of the proposed changes address points of criticism described in the previous chapter. This is true for the move towards more local targets, the introduction of for-ward-looking risk-assessments with increased emphasis on self-assessments, and the abolition of overall star ratings. It is also true for the ambitions to secure a clearer focus on outcomes and to reduce the inspection burdens on local councils, though these ambitions are not new to central government and the Audit Commission.
Measuring local council performance – Working Paper, September 2007 . www.krevi.dk
25
8 CONCLUDING REMARKS
8.1 Driving improvement or promoting accountability?
In Britain, as well as in Denmark, the two main purposes of national performance as-sessments of local authorities seem to be:
1. Driving improvement: National performance assessments provide local au-thorities with a means of setting benchmarks and targets for service im-provement; and
2. Promoting accountability: National performance assessments provide local citizens with a basis for judging the comparative performance of their council, and central government with a mechanism for monitoring and regulating lo-cal government.
The English CPA framework is a very ambitious, top-down approach to measuring local council performance. It should be clear that its merits are under debate, and the cur-rent plans for CAA point towards a more varied and flexible approach in the future. The English example suggests that there might be a trade-off between the two main purposes of national performance assessments. National indicators and public ratings might be important accountability tools for local citizens and central government, but they might not be efficient tools for driving improvement in local authorities, at least in the present English form. The limitations of CPA as a driver for improvement are for a great part rooted in validity problems. If indicators and overall measures are not conceived as valid measures of council performance, two improvement problems occur. Firstly, the measures simply may have no motivational effect on council employees, since they are regarded as poor measures of performance. Secondly, even if council employees are in fact moti-vated by attaining high performance scores, such scores can be achieved through ‘gaming’, without actual improvement in performance. National indicators and overall performance measures will of course also be problematic tools for promoting account-ability, if their validity can be questioned. In the English case, one of the most discussed validity problems relates to the effects of varying local background conditions. If so-called performance measures are per-ceived more as measures of deprivation, for instance, it clearly reduces the legitimacy of the assessment framework. This is especially so if, as in England, indicators are used to create national rankings and to judge councils in relation to fixed national standards. Even if accepted as valid measures of performance, national indicators might not be strong drivers of improvement, simply because they are externally imposed on coun-cils. This might reduce the sense of local ownership that is important for driving im-provements. A final possible impediment to improvement, when using an ambitious, top-down ap-proach like CPA, is Wilson’s ‘dead-weight’ effect, i.e. the negative effect that overall la-bels can have on an authority’s improvement prospects by influencing external per-ceptions of the council and the locality. As described in chapter 7, the current plans in England are to replace CPA with a more varied and flexible approach. The overall aim is to provide greater incentives for im-provement in local councils, and this aim will be pursued partly through greater em-phasis on self-assessments. In this respect, important inspiration seems to have been drawn from Wales and Scotland. Both countries currently employ local council as-
Measuring local council performance – Working Paper, September 2007 . www.krevi.dk
26
sessment regimes that rely heavily on self-assessments and do not produce league tables of indicators or composite ratings. Self-assessments have been emphasized by English local councils as by far the most constructive component of CPA and seem to offer more local ownership and buy-in and stronger incentives for improvement. They also provide greater flexibility to tailor the assessment to local circumstances. The new CAA framework might thus actually be a stronger driver for improvement than CPA, while also giving more local freedoms and leaving more room for local priorities. However, the benefits of CAA will probably come at a cost. As McLean et al (2007, p. 114) point out, a strong reliance on self-assessments lead to heterogeneity in as-sessment priorities, assessment methods and assessment reporting, which eventu-ally makes the assessment results no longer comparable across the inspected units. Accountability to local citizens and central government is therefore not promoted as ef-ficiently as with national indicators and overall ratings. In interviews with Welsh local authorities, Haubrich & McLean (2006, p. 291) actually found that many expressed great interest to introduce at least to some extent more prescriptive ‘English style’ elements into the Welsh regime, as these would allow for more explicit comparisons to be made between authorities’ performance (no stakeholders in Scotland voiced a simi-lar desire). Furthermore, validity problems are not restricted to national indicators and overall per-formance scores. Judging on the basis of existing self-assessment elements in CPA, Haubrich and McLean (2006: 292) find that ‘with the current methodology, the self-assessed ratings and scores lose their validity as indicators of the underlying author-ity attributes of performance and/or ability to improve’. So there might be a trade-off between the two main purposes of national performance assessments, promoting accountability and driving improvement: One is perhaps achieved at the expense of the other. Accountability is best promoted through a top-down framework based on national indicators and standardized public ratings (assum-ing valid measures of performance, of course), while a more flexible approach based on self-assessments is a stronger driver for improvement. It is important to note, though, that the future CAA framework aspires to deliver on both accounts. It will contain both a strong reliance on self-assessments and 200 national indicators on which performance for all local councils will be reported. The more flexible framework will thus maintain important elements of comparability. Time will tell how CAA fares in regard to driving improvement and promoting accountability at the same time. Turning to the Danish national indicators, their standardized nature would seem to make them more apt for promoting accountability in relation to citizens and central government than for driving improvement in local services. It should be stressed, how-ever, that the current Danish approach has much fewer top-down features than the English CPA framework. For instance, no national targets will apparently be set for the indicators, nor will overall rankings will be produced. This might improve local motiva-tion, reduce gaming and make the Danish national indicators a stronger driver of im-provement than the current CPA regime. The relevance of ‘dead-weight’ fears is also minimized by the absence of overall ratings. The Danish approach will, however, face the problems of limited local ownership and buy-in that are often associated with externally imposed measures and frameworks. If these problems are to be overcome, it is essential that the new indicators are per-ceived as valid measures of performance. For this to be the case, English experience shows that indicators must be developed with explicit regard to the effects of local
Measuring local council performance – Working Paper, September 2007 . www.krevi.dk
27
background conditions. Active involvement of councils in the development of indica-tors could also prove crucial for local motivation.
8.2 Outcomes, outputs and processes
English experience shows that measuring outcomes and effects of public intervention is no easy task. The British Government and the Audit Commission have repeatedly stated their ambition to focus on outcomes and effects rather than processes and out-puts, but still rely partly on measures which must be characterized as measures of processes and outputs rather than outcomes. Two examples from the list of environ-ment service indicators are ‘Compliance against best practise checklist for environ-mental health’ and ‘Percentage of pedestrian crossings with facilities for disabled peo-ple’. The first one is clearly a measure of processes, while the second is an output measure. The distinction between output and outcome measures is admittedly a difficult one. One important distinction is that outputs can most often be readily bought while out-comes can not. An increase in the percentage of pedestrian crossings with facilities for disabled people is quite easily achieved with the necessary spending, whereas an in-crease in the general traffic safety of disabled people is not. Output measures where good performance can be readily bought pose at least two problems: Firstly, they raise questions of validity. Things that can be readily bought do not seem to be good indicators of council performance, and ‘poor’ councils will tend to score systematically lower than ‘rich’ councils on such indicators. Secondly, output in-dicators might lead to rising public expenditure, as councils strive to attain higher per-formance scores. In sum, while good outcome measures are hard to find, it is impor-tant that they be found. English local authorities have complained that CPA has led to a refocus on organiza-tional structure, systems, and processes rather than a focus on outcomes. This might only in part be due to the specific design of CPA. An effective focus on outcomes re-quires systematic documentation, and often work routines have to follow certain guidelines for the right data to be produced. There is not necessarily a clear dichotomy between outcome focus and focus on processes - a focus on outcomes naturally en-tails a certain amount of focus on processes.
8.3 Value for money?
We have argued that it might be difficult to attain the two main purposes of perform-ance measurement at the same time. Attaining one, accountability or improvement, might not be bad at all, but the English case shows that the costs associated can be quite high. These costs must be weighted against the benefits when deciding which assessment framework to follow. Value for money is essential, not only for local public services, but also for national performance assessments. For now it seems that the Danish approach will at least be much less expensive than its English counterpart. But it is still too early to judge whether its benefits will be big enough to secure value for money.
Measuring local council performance – Working Paper, September 2007 . www.krevi.dk
28
APPENDIX 1: DETERMINING OVERALL CPA CATEGORIES
CCCCORPORATE ORPORATE ORPORATE ORPORATE
ASSESSMENTASSESSMENTASSESSMENTASSESSMENT LLLLEVEL EVEL EVEL EVEL 1111 SERVICES SERVICES SERVICES SERVICES
((((INCLUDING USE OF RESINCLUDING USE OF RESINCLUDING USE OF RESINCLUDING USE OF RESOURCESOURCESOURCESOURCES)))) LLLLEVEL EVEL EVEL EVEL 2222 SERVICES SERVICES SERVICES SERVICES OOOOVERALL VERALL VERALL VERALL
CATEGORYCATEGORYCATEGORYCATEGORY 4 None less than 3 None less than 2 4 stars 4 None less than 2 No more than one
less than 2 3 stars
4 No more than one less than 2
No more than one less than 2
2 stars
4 Any other combination 1 star 3 None less than 3 None less than 3 4 stars 3 None less than 2 None less than 2 3 stars 3 None less than 2 No more than one
less than 2 2 stars
3 Any other combination 1 star 2 None less than 3 None less than 2 3 stars 2 None less than 2 None less than 2 2 stars 2 No more than one less
than 2 No more than one less than 2
1 star
2 Any other combination 0 stars 1 None less than 3 None less than 2 2 stars 1 None less than 2 None less than 2 1 star 1 Any other combination 0 stars
Measuring local council performance – Working Paper, September 2007 . www.krevi.dk
29
REFERENCES Audit Commission (2007a), CPA – The Harder Test 2006 – Scores and analysis of per-formance in single tier and county councils, London: Audit Commission. Audit Commission (2007b), The evolution of regulation – Comprehensive Area As-sessment and the changing face of public service improvement, London: Audit Com-mission. Audit Commission (2007c), The transition from CPA to CAA – Including consultation on CPA – the harder test framework proposals for 2007, London: Audit Commission. Audit Commission (2006a), CPA – The Harder Test framework for 2006, London: Audit Commission. Audit Commission (2006b), CPA – The Harder Test 2006 – Guide to service assess-ments for single tier and county councils, London: Audit Commission. Audit Commission (2005a), Service assessment framework – Analysis of consultation responses: summary report, London: Audit Commission. Audit Commission (2005b), CPA - The harder test – Single tier and county councils’ framework for 2005, London: Audit Commission. Audit Commission (2005c), Service assessment framework – Technical Guide to CPA 2005 for single tier and county councils, London: Audit Commission. Boyne, G. (2002), Concepts and Indicators of Local Authority Performance: An Evalua-tion of the Statutory Frameworks in England and Wales. Public Money and Manage-ment, 22, April – June, pp. 17-24. Broadbent, J. (2003), Comprehensive Performance Assessment: The crock of gold at the end of the performance rainbow? Public Money & Management, 23, 1, pp. 5-8. Bundred, S. (2006), The Future of Regulation in the Public Sector. Public Money and Management, 26, 3, pp. 181-188. Department for Communities and Local Government (2007a), Strong and prosperous communities, Local Government White Paper. Department for Communities and Local Government (2007b), Developing and imple-menting the new comprehensive area assessment and associated inspection ar-rangements. Department for Communities and Local Government (2007c), FAQ on Best Value Per-formance Indicators (www.bvpi.gov.uk). Department for Transport, Local Government and the Regions (2001), Strong Local Leadership – Quality Public Services, Local Government White Paper, The Guardian (2004), Inspecting the inspectors, December 15, 2004. Haubrich, D. & McLean, I. (2006a), Assessing Public Service Performance in Local Au-thorities Through CPA – A Research note on Deprivation, National Institute Economic Review, 197, pp. 93 – 105.

Measuring local council performance – Working Paper, September 2007 . www.krevi.dk
30
Haubrich, D. & McLean, I. (2006b), Evaluating the Performance of Local Government – A Comparison of the assessment regimes in England, Scotland and Wales, Policy Stud-ies, 27, 4, pp. 271 – 293. LGA – Local Government Association (2005), inspection – time well spent? – a survey on the impact of inspection and audit regimes, executive summary. LGA – Local Government Association (2004), improving from within – A survey of dis-trict councils views on CPA, executive summary. LGA – Local Government Association (2003), freedom to improve? – evaluating the first round of the Comprehensive Performance Assessment, summary of LGA research report 45. McLean, I., Haubrich, D. & Gutiérrez-Romero, R. (2007), The Perils and Pitfalls of Per-formance Measurement: The CPA Regime for Local Authorities in England, Public Money & Management, 27, pp. 111 – 117. Wilson, J. (2004), Comprehensive Performance Assessment – Springboard or Dead-Weight? Public Money & Management, 24, 1, pp. 63 – 68.
Further reading:
Andrews, R. et al (2005), External Constraints on Local Service Standards: The Case of Comprehensive Performance Assessment in English Local Government. Public Admini-
stration, Vol. 83, No. 3, pp 639 – 656. Andrews, A. (2004), Analysing Deprivation and Local Authority Performance: The Impli-cations for CPA. Public Money and Management, 24, 1, pp. 19 – 26. Audit Commission (2006), Briefing on the Audit Commission’s Comprehensive Per-
formance Assessment Frameworks, London, Audit Commission. Bregn, Kirsten (2006), Resultatmåling i den offentlige sektor. Nordisk Administrativt
Tidsskrift, No. 2, pp 159 – 173. Dahler-Larsen, P. (2007), Constitutive Effects of Performance Indicator Systems. Ad-
vances in Program Evaluation (ed. R.E. Stake). Vol. 10, pp. 17 – 35. Palmer, G. & Kenway, P. (2004), Comprehensive Performance Assessment and Depri-
vation – A Review by the New Policy Institute Commissioned by the Audit Commission. New Policy Institute.