0.1µm particle counting technology and applications optical particle counting technologies have...
TRANSCRIPT
www.golighthouse.com Presentation Name Here
1
0.1µm Particle Counting Technology and Applications
www.golighthouse.com Presentation Name Here
2
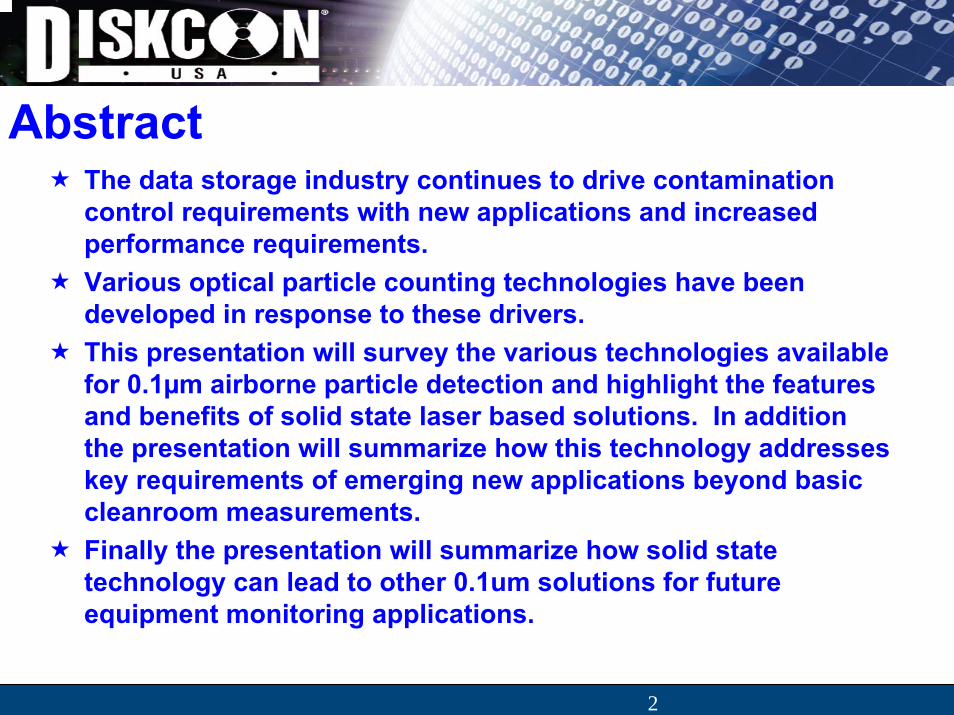
AbstractThe data storage industry continues to drive contamination control requirements with new applications and increased performance requirements. Various optical particle counting technologies have been developed in response to these drivers. This presentation will survey the various technologies availablefor 0.1µm airborne particle detection and highlight the features and benefits of solid state laser based solutions. In addition the presentation will summarize how this technology addresses key requirements of emerging new applications beyond basic cleanroom measurements. Finally the presentation will summarize how solid state technology can lead to other 0.1um solutions for future equipment monitoring applications.
www.golighthouse.com Presentation Name Here
3
OutlineHigh Sensitivity Particle Counting Technology
Scatter Theory
ISO 21501-4 Specifications
ISO 21501-4 Calibration And Test Procedures
Performance Considerations (Precision & Noise)Technology Solutions
Helium Neon Laser Based Technology
Diode Pumped Solid State (DPSS) Laser Technology
Laser Diode Technology
Detection TechnologyApplications
Semiconductor Applications
Data Storage ApplicationsFuture TechnologySummary

www.golighthouse.com Presentation Name Here
High Sensitivity Particle Counting Technology

www.golighthouse.com Presentation Name Here
5
Two Particle Detection Methods
1) Light Extinction (Light Blocking)
Attenuation of light signal.Measurement of particles >1.0 micron
2) Light ScatteringRedirected light energy (scattering).Measurement of particles >0.05 micron
Particle Counting Technology

www.golighthouse.com Presentation Name Here
6
Light Interaction with a ParticleReflection
Diffraction
RefractionAbsorption
InternalScattering

www.golighthouse.com Presentation Name Here
7
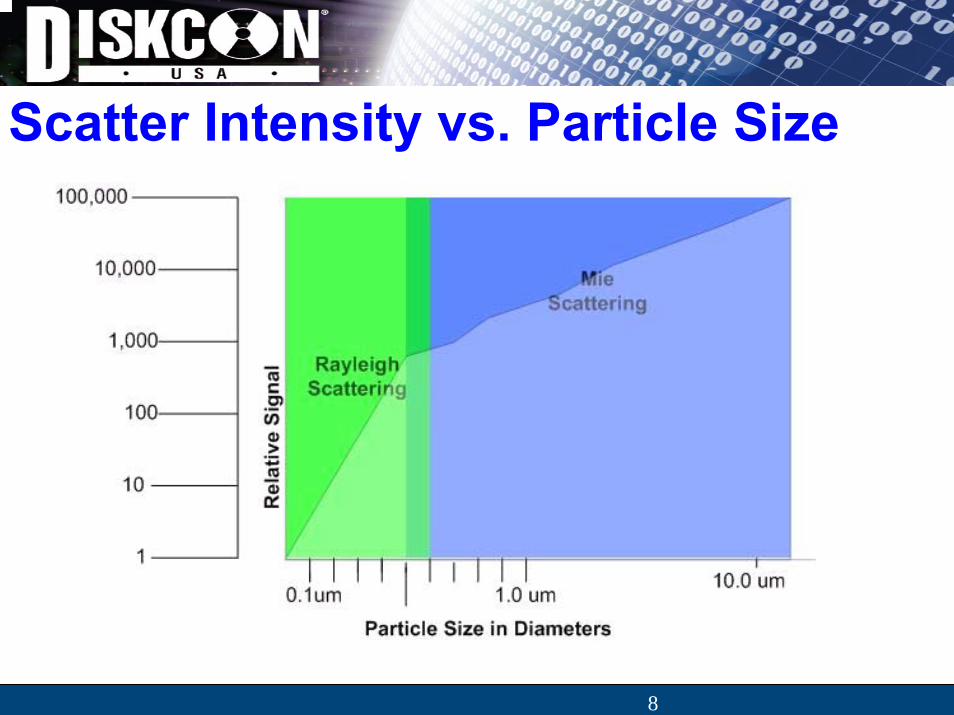
Types of Light ScatteringMie
Scattering of electromagnetic waves by particles approximately the same size as (or slightly larger than) the wavelength of interest.
RayleighScattering of light due to particles with sizes much less than the wavelength of scattered light.
Visible light wavelength: 400-700nm
www.golighthouse.com Presentation Name Here
8
Scatter Intensity vs. Particle Size

www.golighthouse.com Presentation Name Here
9
Types of Light Scattering
Mie scattering
Examples of Mie scattering
CloudsFog
Direction of Incident Light

www.golighthouse.com Presentation Name Here
10
Types of Light ScatteringRayleigh scatteringExample of Rayleigh
blue sky
I = intensity of light scattered
d = diameter of the Particle
λ = wavelength of light
I∝ d6
λ4
Direction of Incident Light

www.golighthouse.com Presentation Name Here
11
There are three basic elements in all particle counting systems:
1) The SensorThe Sensor is the device that detects particles using light scattering or blocking techniques
2) The Sample Delivery SystemThe fluid sample is delivered to the sensor by some method
3) The Counting ElectronicsThe particle counts are processed
Particle Counter Components
www.golighthouse.com Presentation Name Here
12
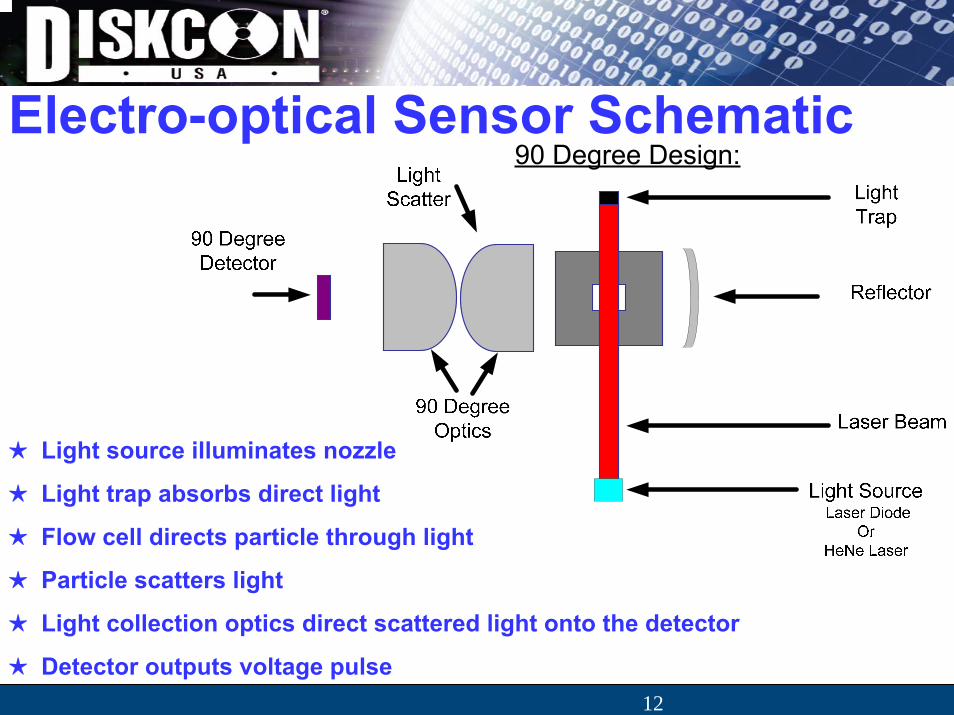
Electro-optical Sensor Schematic
★ Light source illuminates nozzle
★ Light trap absorbs direct light
★ Flow cell directs particle through light
★ Particle scatters light
★ Light collection optics direct scattered light onto the detector
★ Detector outputs voltage pulse
www.golighthouse.com Presentation Name Here
13
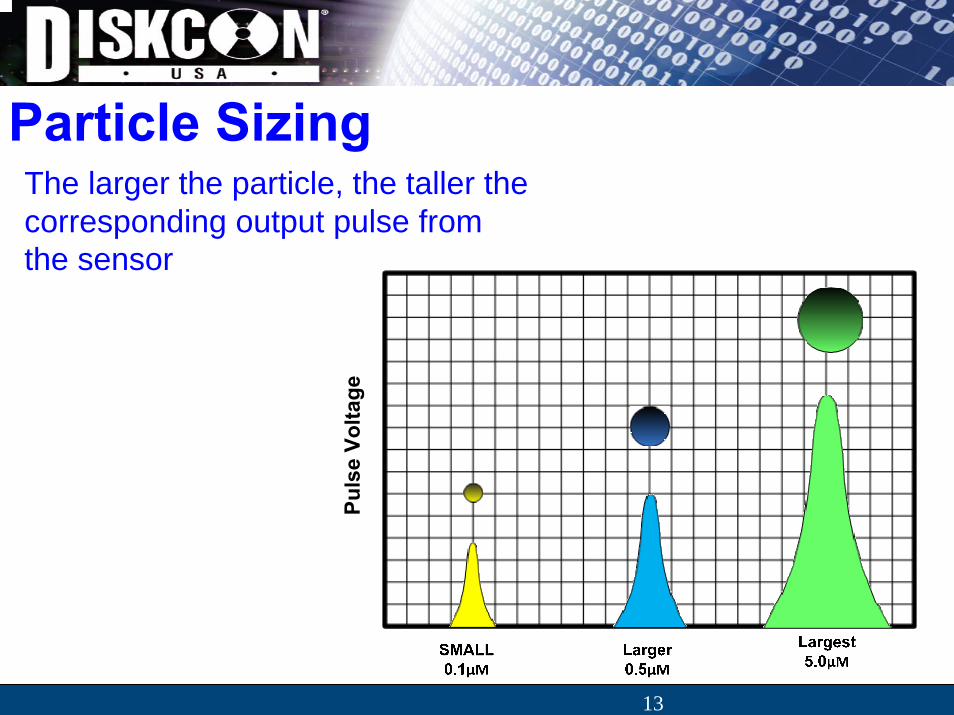
The larger the particle, the taller the corresponding output pulse from the sensor
Particle Sizing
Puls
e Vo
ltage

www.golighthouse.com Presentation Name Here
14
Counting Electronics
Digital signals to counting circuitry
Analog Signal in
+V
+V
+V
CH1
CH2
CH3
CH. 1
CH. 3
CH. 2
Threshold Circuit
This circuit is duplicated from
one to 8 Channels depending on the model of particle
counter.
www.golighthouse.com Presentation Name Here
15
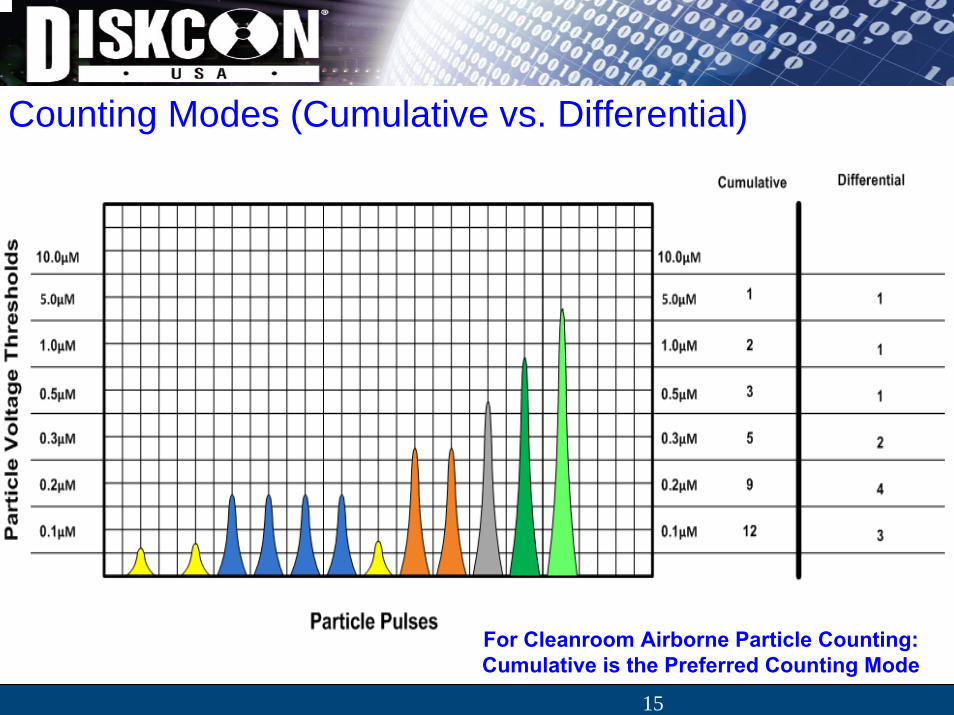
Counting Modes (Cumulative vs. Differential)
For Cleanroom Airborne Particle Counting: Cumulative is the Preferred Counting Mode

www.golighthouse.com Presentation Name Here
16
View VolumeView volume is defined by the amount of the flow stream illuminated by the laser
Full stream (volumetric)sensors have a view volume of near 100%
Partial Stream (In-situ) sensors have a very smallview volume
Full StreamParticle Counter
Partial StreamParticle Counter
www.golighthouse.com Presentation Name Here
17
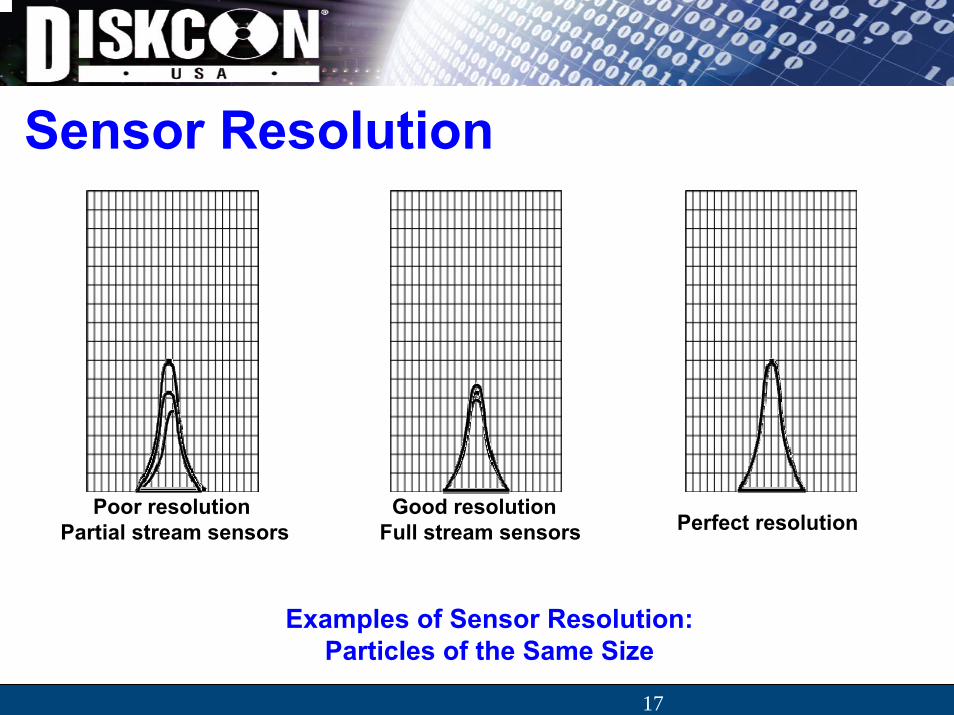
Poor resolutionPartial stream sensors
Good resolution Full stream sensors Perfect resolution
Sensor Resolution
Examples of Sensor Resolution:Particles of the Same Size

www.golighthouse.com Presentation Name Here
18
Light scattered by a single particle in a specific direction in relation to the original direction has a unique signature which relates to thesize, shape and material of the particle.
As size is dominant the light intensity collected by the receiving opticsof an instrument can be calibrated to the diameter of a sphere of a reference material, typically Polystyrene Latex.
There is a dependency of the scattered signal on particle shape andmaterial. However, it is a common practice to report particle sizeinformation in equivalent Polystyrene Latex sphere diameters.
Sizing
Assumptions in Particle Counting:
1. All Particles are Spherical in Nature
2. All Particles have the Same Refractive Index of Polystyrene Latex
www.golighthouse.com Presentation Name Here
19
ISO-21501-4, Light Scattering airborne particle counter for clean spaces
ISO 21501-4 Is Methods and Specifications
Size CalibrationSize VerificationCounting EfficiencySize resolutionFalse Count RateMaximum ConcentrationFlow RateSample TimeResponse RateCalibration IntervalTest Report

www.golighthouse.com Presentation Name Here
20
APC’s count one particle at a time as it passes through the flow cell. The light is scattered and the pulse is measured in the form of an analog signal. The signal amplitude (peak height) collected in the Photo Diode determines the size of the particle.
Size Calibration - Single Particle Counter

www.golighthouse.com Presentation Name Here
21
Size Calibration – Relating Voltage to Size
Rel
ativ
e Si
gnal

www.golighthouse.com Presentation Name Here
22
Size Calibration – How we calibrate
Particles are sized one at a timeThe signal amplitude (peak height) determines the size of the particle.The PHA determines the peak height of each pulse and over the sample time builds a distribution of peak height voltages for further analysis
PHA Distribution
Y -
Den
sity
X - Voltage
Median

www.golighthouse.com Presentation Name Here
23
“When calibrating an APC with calibration particles of known size, the median voltage (or internal PHA channel), corresponds to the particle size”
Note: Pulse Height Analyzer
2 Methods to measure Pulse Height permitted by ISO 21501:1. External Pulse Height Analyzer or MCA2. Internal Pulse Height Analyzer

www.golighthouse.com Presentation Name Here
24
Oscilloscope Showing Particles Signal
Larger Particles
Minimal Noise
Same Particle Size
Same Signal

www.golighthouse.com Presentation Name Here
25
ISO 21501-4 Size Calibration - The MCA creates a distribution or histogram and we determine the median or half count voltage of the distribution
0.2µm = 50.12mV

www.golighthouse.com Presentation Name Here
26
ISO 21501-4 Size Verification
The Error in the detectable minimum particle size and other sizes specified by the Mfg. of an APC shall be <=±10%Error Percent = Calculated Particle size minus reported size range (µm) over the reported size range (µm) times 100%
Size Verification0.2µm
0.5µm
2.0µm
Particles
MC
A

www.golighthouse.com Presentation Name Here
27
Counting EfficiencyISO 21501-4 Counting
Efficiency
Ratio of the measured result of APC to that of a reference instrument using the same sample
A Golden Standard is required to compare to the instrument being calibrated
Efficiency is described as (50 ± 20)% for the minimum detectable size and (100 ±10)% with a size from 1.5 to 2 times larger than the smallest particle channel size

www.golighthouse.com Presentation Name Here
28
ISO 21501-4 Size ResolutionThe size resolution shall be ≤ 10% for calibration particles of a size specified by the manufacturer
Size ResolutionD
ensi
ty
Voltage
100%
61%
Y
X
VL VU
VM
Mass Distribution of PSLsLower Side ResolutionUpper Side ResolutionLower VMedian VUpper V
VL
VM
VU
2
3
2 3

www.golighthouse.com Presentation Name Here
29
ISO 21501-4 False Count RateThe false count rate is determined by putting a zero count filter on the instrumentThe data should be processed using the Poisson distribution with a 95% upper confidence limitThe false count rate is expressed in Particles/Cubic MeterThere is no specification after all its only with 95% confidence…
False Count Rate

www.golighthouse.com Presentation Name Here
30
ISO 21501-4 Maximum ConcentrationThe maximum measurable particle number concentration is determined by the manufacturer based on a calculated coincidence loss <= 10%
Mfg./Design VariablesCoincidence LossElectrical Processing Time
Maximum concentration

www.golighthouse.com Presentation Name Here
31
ISO 21501-4 Sampling Flow RateMust be within +- 5% if there is a flow control system
Flow Rate

www.golighthouse.com Presentation Name Here
32
ISO 21501-4 Sample TimeThe sample time has a manufacturers preset value and should be ≤ ±1%
Sample Time

www.golighthouse.com Presentation Name Here
33
ISO 21501-4 Response RateShould be <= 0.5%. Evaluates the clean up capability of the instrument
Response Rate

www.golighthouse.com Presentation Name Here
34
ISO 21501-4 Calibration IntervalAt least once per year
Calibration Interval

www.golighthouse.com Presentation Name Here
35
ISO 21501-4 Test ReportThe test report should include:
Date of calibration;Calibration particle sizes;Flow rate;Size resolution; Counting efficiency;Voltage limit (or channel of an internal pulse height Analyzer)
Test Report
Size Resolution and Counting Efficiency are now required for annual calibration

www.golighthouse.com Presentation Name Here
36
Particle Counter PrecisionParticle counters have a measurement uncertainty due to the time of arrival process of particles (Poisson)
Precision of the reported number of counts is related to the number of observed events in a sample time
The standard deviation of the measurement is equal to the square root of the number of counts
The higher the sample volume of the instrument the higher the precision

www.golighthouse.com Presentation Name Here
37
Particle Counter Precision (Examples)
Increasing the number of particle events in a sample improves the precision
Particle Data with an average of 10 Events Per Sample, Peak Variation almost 100%
02468
101214161820
1 36 71 106 141 176 211 246 281 316 351 386
Sample
Parti
cle
Even
ts
Particle Data, Mean = 10Events
Normalized Particle Data with Different Effective Sample Volumes And Or Times
00.20.40.60.8
11.21.41.61.8
2
1 39 77 115 153 191 229 267 305 343 381
Sample
Cou
nts/
Lite
r
Normalized Data - 10Events/SampleNormalized Data, 1000Events/Sample
Particle Data with an average of 1000 Events Per Sample, Peak Variation less than 10%
800
850
900
950
1000
1050
1100
1 41 81 121 161 201 241 281 321 361
Sample
Part
icle
Eve
nts
Particle Data, Mean = 1000Events

www.golighthouse.com Presentation Name Here
38
Typical Particle Distribution(log log scale)
Typical particle distributions follow an inverse 3rd power law, with more particles at smaller sizes
Typical Particle Concentrations In Water
1
10
100
1000
0.01 0.1 1
Particle Size (Microns)
Num
ber o
f Par
ticle
s

www.golighthouse.com Presentation Name Here
39
Zero Count Level Defines Particle Counter Accuracy at Low Concentrations
Zero count level specifies the number of false counts per time interval from the particle counter
The level is dictated by the gamma count rate of the sensor
Cosmic gamma rays are energetic particles originating from spacethat impinge on Earth's atmosphere. The term "ray" is a misnomer, as cosmic particles arrive randomly one at a time, not in the form of a ray or beam of particles.
The gamma count rate is a function of the photodetector type, size, geometry and materials
Gamma ray false counts are RANDOM (not steady state) events/errors governed by poisson statistics (see air and liquid particle counting standards like JIS B9921 and ISO 21501 for more detail)
The lower the cosmic ray false count rate of the instrument the more accurate the measurement on a today’s DI Water System

www.golighthouse.com Presentation Name Here
40
1 Count Per Minute False Count EffectsUPW Data Simulation
(Average = 66 Counts/Liter) Cosmic Ray Errors Create Substantial Systematic Errors and
Random Errors
0
100
200
300
400
500
600
1 20 39 58 77 96 115 134 153 172 191
Sample (150 ml)
Cou
nts/
Lite
r
UPW Particles (Mean = 66Counts/Liter)UPW Particles + Cosmic RayError (Before Compensation)
ITRS Target Limit
High cosmic ray pulse noise causes systematic and random measurement errors above the ITRS target particle control limit

www.golighthouse.com Presentation Name Here
Technology Solutions
41

www.golighthouse.com Presentation Name Here
42
Gas Laser Design (Active Cavity HeNe Particle Counter Design)

www.golighthouse.com Presentation Name Here
HeNe Particle Counters are running out of Gas
★ HeNe Designs from the Last Century
★ Collimated Beam Translates to Lower Concentration Limits
★ The Glass Design of the HeNe Tube is Sensitive to Vibration and Breakage
★ Brewster & AR Windows Make this Design Susceptible to Contamination Requiring Frequent Cleaning & Maintenance
HeNe Gas Leaks over time, affecting Laser Life and Increased Operational Cost.
43

www.golighthouse.com Presentation Name Here
44
DPSS Laser
Short Wavelength Can Be An Advantage to the Technology

www.golighthouse.com Presentation Name Here
45
Laser Diode
p-Type GaAlAs
n-Type GaAlAs
n-Type GaAs
LASER BEAM

www.golighthouse.com Presentation Name Here
46
Laser Diode Technology
High Reliability Laser Diode
Focused Laser Beam to increase the concentration limit
Dual multi-element detectors with coincidence detection

www.golighthouse.com Presentation Name Here
47
High Reliability Laser DiodeHigh Efficiency Laser Diode based on advanced passivation technology of the laser facet
20% more efficient than standard laser diode technology equates to better reliability and lower power requirements

www.golighthouse.com Presentation Name Here
48
Laser Diode Illumination
Laser Diode Technology permits focusing of the laser beam in the direction of flow to reduce the transit time of the particle through the laser thereby increasing the
concentration limit 10X
High Power Laser Diode
Collimating lens
Focusing LensFlow Path

www.golighthouse.com Presentation Name Here
49
Laser Diode Sensor

www.golighthouse.com Presentation Name Here
50
Advanced Detector Array Detector, Improves Optical Signal to Noise

www.golighthouse.com Presentation Name Here
51
Dual Detectors
Dual Multi-element detector improves signal to noise, and eliminates cosmic ray pulse noise with coincidence detection

www.golighthouse.com Presentation Name Here
52
Remote Laser Diode Particle Counter

www.golighthouse.com Presentation Name Here
53
Universal Portable Laser Diode Particle Counter
★Laser Diode Design
★0.1µM to 1.0µM Size Channels
★Concentration Limits of >500,000 Particles / Ft3
@ 5% Coincidence Error
★This Design offers Cleanroom TestingFrom ISO 1 to ISO 9 Class CleanroomsSuitable for ALL types of Cleanrooms

www.golighthouse.com Presentation Name Here
Applications
54

www.golighthouse.com Presentation Name Here
55
Semiconductor Applications

www.golighthouse.com Presentation Name Here
56
FOUP
Equipment Front End Module
Remote APC Application - Process Equipment Front End

www.golighthouse.com Presentation Name Here
57
Monitoring System Application

www.golighthouse.com Presentation Name Here
58
Manifolds Applications:Universal ManifoldFacility Monitoring
Mini Manifold Tool QualificationStocker MonitoringMinienvironment Monitoring

www.golighthouse.com Presentation Name Here
59
Mini-Manifold: Applications
★ Minienvironment Monitoring
★ Isolator Monitoring

www.golighthouse.com Presentation Name Here
60
Portable Air Particle Counter: Applications
★ Cleanroom Testing★ Cleanroom Certification★ Cleanroom Audits★ Tool and Equipment Certification★ Contamination Identification★ Cleanroom Monitoring★ Filter Testing★ Laminar Flow Bench Testing★ Isolator and Minienvironment
Testing

www.golighthouse.com Presentation Name Here
61
Gas Sampling SystemRequirements:
PortableBattery PoweredNo Wasted Gas1 CFM Flow Rate (Faster Sampling)Fast Cleanup TimesLower Initial InvestmentLower Running CostAuto Flow Rate Compensation ensures accurate measurementGases Sampled: Argon, Nitrogen, Carbon Dioxide, Helium, CDA, Neon, Xenon

www.golighthouse.com Presentation Name Here
62
Portable Tool Qualification System

www.golighthouse.com Presentation Name Here
63
FOUP
Equipment Front End Module
Process Equipment Front End

www.golighthouse.com Presentation Name Here
64
Partitioning Data

www.golighthouse.com Presentation Name Here
65
Data Storage ApplicationsTypical Monitoring Parameters:
Cleanroom Particle Levels Insitu Process Monitoring of ParticlesDrive Level Particle CountsProcess Cleaning ToolsParts Cleaning EquipmentPart Cleanliness TestingEquipment Process Environmental Monitoring

www.golighthouse.com Presentation Name Here
66
Future 0.1 CFM Laser Diode Technology
Reduced Footprint
Lower Cost

www.golighthouse.com Presentation Name Here
67
SummaryVarious Technologies are Available for Monitoring at 0.1 micron
Solid State Particle Counting Technology, Which is the Dominate Technology in >0.1 micron, has now Been Extended to 0.1 micron
Remote Solid State Particle Counters are now Available at 0.1 micron for Advanced Applications
The Industry can Anticipate Cost Effective 0.1 micron, 0.1 CFM Particle Counters in the Near Future