*012-16575* educational spectrophotometer accessory kit ... · hilig grating glass side faces light...
TRANSCRIPT

Instruct ion Manual012-06575D
�
Educational Spectrophotometer Accessory Kit and Systems
OS-8537, OS-8539, and OS-8450
*012-16575*
OS-8537 Educational Spectrophotometer Accessory Kit


Educat ional Spectrophotometer Table of Contents
i
Quick Start . . . . . . . . . . . . . . . . . . . . . . . . . . . . . . . . . . . . . . . . . . . . . . . . . . . . . . . . . . . . 1
Introduction . . . . . . . . . . . . . . . . . . . . . . . . . . . . . . . . . . . . . . . . . . . . . . . . . . . . . . . . . . . 3
Description . . . . . . . . . . . . . . . . . . . . . . . . . . . . . . . . . . . . . . . . . . . . . . . . . . . . . . . . . . . . 5
Set Up
Mounting the Rotary Motion Sensor . . . . . . . . . . . . . . . . . . . . . . . . . . . . . . . . . . . . . . . . 6
Mounting the Degree Plate and Light Sensor Arm . . . . . . . . . . . . . . . . . . . . . . . . . . . . . 7
More Information About the Degree Plate . . . . . . . . . . . . . . . . . . . . . . . . . . . . . . . . . . . . 8
Mounting the Aperture Bracket Light Sensor Mount and Light Sensor . . . . . . . . . . . . . . 9
Mounting the Grating Mount . . . . . . . . . . . . . . . . . . . . . . . . . . . . . . . . . . . . . . . . . . . . . 10
Mounting the Spectrophotometer Base on the Optics Bench . . . . . . . . . . . . . . . . . . . . 10
Rod Stand Mounting Clamps. . . . . . . . . . . . . . . . . . . . . . . . . . . . . . . . . . . . . . . . . . . . . 10
Mounting and Adjusting the Collimating Slits and Lens . . . . . . . . . . . . . . . . . . . . . . . . . 10
Positioning the Collimating Slits and Lens . . . . . . . . . . . . . . . . . . . . . . . . . . . . . . . . . . . 11
Mounting the Grating . . . . . . . . . . . . . . . . . . . . . . . . . . . . . . . . . . . . . . . . . . . . . . . . . . . 12
Mounting and Positioning the Focusing Lens . . . . . . . . . . . . . . . . . . . . . . . . . . . . . . . . 12
Procedures
Turning the Degree Plate. . . . . . . . . . . . . . . . . . . . . . . . . . . . . . . . . . . . . . . . . . . . . . . . 13
Masking the Light Source or the Spectrophotometer. . . . . . . . . . . . . . . . . . . . . . . . . . . 13
Using the Data Collection Program . . . . . . . . . . . . . . . . . . . . . . . . . . . . . . . . . . . . . . . . 13
General Information About the Light Sensor . . . . . . . . . . . . . . . . . . . . . . . . . . . . . . . . . 14
General Information About Slit Widths. . . . . . . . . . . . . . . . . . . . . . . . . . . . . . . . . . . . . . 14
Scanning a Spectrum. . . . . . . . . . . . . . . . . . . . . . . . . . . . . . . . . . . . . . . . . . . . . . . . . . . 14
Calibrating the Grating . . . . . . . . . . . . . . . . . . . . . . . . . . . . . . . . . . . . . . . . . . . . . . . . . . 15
Angular Resolution. . . . . . . . . . . . . . . . . . . . . . . . . . . . . . . . . . . . . . . . . . . . . . . . . . . . . 15
Cuvettes. . . . . . . . . . . . . . . . . . . . . . . . . . . . . . . . . . . . . . . . . . . . . . . . . . . . . . . . . . . . . 16
Other Information. . . . . . . . . . . . . . . . . . . . . . . . . . . . . . . . . . . . . . . . . . . . . . . . . . . . . . 16
Activity 1: Emission Spectrum . . . . . . . . . . . . . . . . . . . . . . . . . . . . . . . . . . . . . . . . . . . . 17
Activity 2: Absorption (Dark Line) Spectrum . . . . . . . . . . . . . . . . . . . . . . . . . . . . . . . . . 21
Teacher’s Guide. . . . . . . . . . . . . . . . . . . . . . . . . . . . . . . . . . . . . . . . . . . . . . . . . . . . . . . 25
Technical Support . . . . . . . . . . . . . . . . . . . . . . . . . . . . . . . . . . . . . . . . . . . . . . . . . . . . . 29

Educat ional Spectrophotometer Table of Contents
ii

� 1
OS-8537, 8539, and 8450 Quick Start
012-06575D
Quick StartThe following pages give an overview of the Spectrophotometer equipment setup.
Step One: Prepare the Rotary Motion Sensor by removing the thumbscrew and three-step pulley. Use the included hex key to remove the rod clamp.
Step Two: Prepare the Spectrophotometer Base by removing the two small thumbscrews and Pinion and by rotating the hinge away from the Base.
Step Three: Attach the Rotary Motion Sensor to the Base hinge with the two small thumbscrews and attach the Pinion to the Rotary Motion Sensor shaft.
Step Four: Put the Degree Plate/Light Sensor Arm on the Base. Attach the Grating Mount, Light Sensor Mount, and Light Sensor. Position the Focusing Lens.
Step Five: Put the Spectrophotometer Base onto one end of the Optics Bench.
thumbscrew
three-step pulley
Rotary Motion Sensor
Quick Start 1: Prepare Rotary Motion Sensor
rod clamp
hex key
Spectrophotometer Base
Quick Start 2: Prepare the Hinge
Remove the thumbscrews.
Rotate the hinge.
Remove the Pinion
Spectrophotometer Base
Put the Pinion on the shaft.
Use the thumbscrews to attach the sensor.
hinge
Rotary Motion Sensor
Quick Start 3: Attach the Sensor and Pinion
Quick Start 4: Degree Plate & Light Sensor Arm, Grating Mount, Focusing Lens, Light Sensor Mount, and Light Sensor
Degree Plate
Focusing LensGrating
Mount
Light Sensor
Arm
threaded post
wing nut
lock washer
Light Sensor Mount with Aperture Disk and Bracket
Light Sensor

Educat ional Spectrophotometer Quick Start
�2 012-06575D
Step Six: Mount the Collimating Slits and Collimating Lens onto the Optics Bench. Set up a light source. Adjust the Collimating Slits and Collimating Lens to collimate the light beam.
Step Seven: Attach the Grating to the mount so the glass side of the Grating faces the light source.
CAUTION: Avoid touching the Grating surface.
Step Eight: Set up the experiment in the data col-lection program.
1. For ScienceWorkshop Sensors, select the Light Sensor for Analog Channel A. Select the Rotary Motion Sensor for Digital Channels 1 and 2. Set the Rotary Motion Sensor to high resolution (1440 Divisions/Rotation). For PASPORT Sensors, plug the Light Sensor and Rotary Motion Sensor into the PASPORT Ports on the interface.
2. Create a calculation for “Actual Angle” based on the Angular Position data from the Rotary Motion Sensor and the ratio of the radius of the Degree Plate to the radius of the small post on the Pinion (typically, a 60 to 1 ratio).
3. Select a Graph display. Set the vertical axis to Light Intensity and the horizontal axis to your calculation of “Actual Angle”.
4. Set the sampling rate to 20 Hz.
Step Nine: Scan the Spectrum
1. Mask or hood the light source if necessary.
2. Move the Light Sensor Arm so the Light Sensor is beyond the edge of the first order spectral pattern.
3. Start recording data. Slowly and continuously scan the spectrum. Scan the first order spectrum on one side of the central ray, through the central ray, and through the first order spectrum on the other side.
Step Ten: Analyze Your Data
GRATING MOUNTFOR USE WITH
OS-8537SPECTROPHOTOMETER
Optics Bench square nutthumbscrew
Quick Start 5: Put Base onto Optics Bench
T-slot
Base
Hinge
GAIN
10100
1
Collimating Lens
Collimating Slits
Quick Start 6: Setup for Collimation
Degree Plate
light ray
HILIG
H
Grating
glass side faces light source
Quick Start 7: Attach the Grating
GAIN
10100
1
Scan slowly and continuously in one direction.
central ray (“zeroth order”)
first order spectral lines
first order spectral lines
Grating
Quick Start 9: Scan the Spectrum
light source

�
OS-8537, 8539, and 8450 Int roduct ion
3012-06575D
IntroductionAbout This Manual
This manual describes the PASCO OS-8537 Educational Spectrophotometer Accessory Kit and two Educational Spectrophotometer Systems designed for the Accessory Kit: OS-8450 PASPORT Educa-tional Spectrophotometer System and OS-8539 Educational Spectrophotometer System.
Components of the Kit
The OS-8537 Educational Spectrophotometer Accessory Kit (see Figure 1a) includes the following items:
(*The pinion shown in Figure 1a can be mounted on a post on the Spectrophotometer Base when not in use.)
The OS-8537 Accessory Kit is designed to work with PASCO optics components, PASCO sensors, and a PASCO Interface and Data Collection Software. See www.pasco.com for more information.
Recommended Items for use with the Spectrophotometer Accessory Kit:
Spectrophotometer Base Collimating Slits Grating (~600 lines per mm)
Grating Holder Rod Stand Mounting Brackets (2) Collimating Lens
Focusing Lens Degree Plate with Light Sensor Arm Cuvettes (2)
Basic Optics System (OS-8515) PASCO High Sensitivity Light Sensor (PS-2179 or CI-6604)
Aperture Bracket (OS-8534) PASCO Rotary Motion Sensor (PS-21‘20A or CI-6538)
PASCO Universal Interface PASCO Capstone Software
Spectrophotometer Base
GratingGrating Holder
Collimating Slits Collimating LensPinion*
Cuvettes (2) Focusing Lens
Rod Mounting Clamps (2)
Light Sensor Arm
Degree Plate
Figure 1a: Educational Spectrophometer Accessory Kit

�
Educat ional Spectrophotometer Introduct ion
4 012-06575D
Components of the Systems
OS-8450 PASPORT Educational Spectrophotometer System
The OS-8450 PASPORT Educational Spectrophotometer System includes the items in the Spectropho-tometer Accessory Kit plus the following:
:
Optics Bench (60 cm) PASPORT Rotary Motion Sensor (PS-2120A)
PASPORT High Sensitivity Light Sensor (PS-2179) Aperture Bracket (OS-8534)
Optics Bench (60 cm)
PASPORT Rotary Motion Sensor
Thumbscrew
Post
Aperture Bracket Holder
Aperture Bracket
PASPORT High Sensitivity Light Sensor
PASPORT Sensor Extension Cable
Figure 1b: Additional Components of the PASPORT Educational Spectrophotometer System

�
OS-8537, 8539, and 8450 Descr ipt ion
5012-06575D
OS-9539 Educational Spectrophotometer System
The OS-8539 Educational Spectrophotometer System includes the items in the Spectrophotometer Accessory Kit plus the following
:
Recommended Equipment for use with the Kit and the Systems:
DescriptionThe Spectrophotometer allows you to view and measure the spectral pattern (spectrum) produced by a light source. The Collimating Slits and Collimating Lens produce a narrow beam of parallel light rays. The Grating disperses the beam of light into a spectrum with different colors at different angles but with all of the light of a given color in a parallel beam. The Focusing Lens focuses these parallel beams of color into spectral lines (see Fig. 2). The narrow slit on the Aperture Disk (part of the Aperture Bracket) allows light of a single color to enter the High Sensitivity Light Sensor.
Optics Bench (60 cm) Rotary Motion Sensor (CI-6538)
High Sensitivity Light Sensor (CI-6604) Aperture Bracket (OS-8534)
Light Source (such as SE-9466 Mercury Spectral Tube) Rod, 45 cm (ME-8736) (2)
Spectral Tube Power Supply and Mount (SE-9460) Large Rod Stand (ME-8735) (2)
Rotary Motion Sensor
Aperture Bracket
DIN-to-DIN cable
High Sensitivity Light Sensor
Optics Bench (60 cm) Aperture Bracket Holder
Figure 1c: Additional Components of the Educational Spectrophotometer System
thumbscrew
post
Light Source
Collimating Slit
Collimating Lens Diffraction Grating
Focusing Lens
spectral lineFigure 2: Grating Spectrometer

�
Educat ional Spectrophotometer Set Up
6 012-06575D
The High Sensitivity Light Sensor (included with the Spectrophotometer System) measures the intensity of the light while the Rotary Motion Sensor (included with the Spectrophotometer System) measures the angle to which the light is diffracted by the Grating.
You can find the wavelength of each color of light using the measured angle and the Grating spacing “d”.
m = d sin , m = 0, 1, 2…
where d is the distance between the rulings on the Grating, m is the order of the particular principal maximum, is the angle of the diffracted light, and is the wavelength.
The Grating disperses the beam of light into a first order spectrum and higher order spectra. The higher order spectra are broader and less bright than the first order spectra, and may overlap.
The Grating is blazed, so one side of the spectrum is much brighter than the other.
Set UpThis part of the manual describes how to set up the Spectrophotometer System (see Fig. 3). .
Mounting the Rotary Motion Sensor
This describes how to mount the Rotary Motion Sensor to the hinge on the Spectrophotometer Base.The top of the Spectrophotometer Base has a short threaded post for centering the circular Degree Plate and for secur-ing the Grating Holder. It also has a magnetic pad for holding the Degree Plate, and a triangular shaped index marker. One side of the base has a post upon which the Pinion can be stored when it is not in use. The other side has a spring-loaded hinge and two small thumbscrews for mounting the Rotary Motion Sensor (included in the Spectrophotometer System). On both sides of the base are large thumbscrews and square nuts used for mounting the Spectrophotometer Base on the Optics Bench (see Fig. 4)
GAIN
10100
1
Figure 3: Spectrophotometer System (top view)
Collimating Slit
Collimating LensDiffraction Grating
Grating GolderLight Sensor
Arm
Focusing Lens
Aperture Disk
High Sensitivity Light Sensor
PinionRotary Motion Sensor
Degree Plate
Light Source
Optics Bench
Figure 4: Spectrophotometer Base (top view)
Hinge
Large Thrumbscrew
Small Thrumbscrews
Magnetic Pad Pinion
Index
Threaded Post

�
OS-8537, 8539, and 8450 Set Up
7012-06575D
The Rotary Motion Sensor has a three step pulley attached to its shaft with a small thumbscrew. The sensor also has a rod clamp attached at one end.
First, remove the small thumbscrew and three step pulley from the Rotary Motion Sensor shaft. Then, use the included hex key to remove the rod clamp from the Rotary Motion Sensor (see Fig. 5).
Remove the two small thumbscrews from the threaded storage holes on the side of the Spectrophotometer Base and set them aside for the moment. Remove the Pinion from the storage post on the opposite side of the Spectrophotometer Base and set the Pinion aside for a moment (see Fig. 6).
Rotate the hinge away from the side of the base until the hinge is almost perpendicular to the base.
Use the two small thumbscrews to fasten the Rotary Motion Sensor to the lower set of holes on the inside of the hinge (see Fig. 7).
Place the Pinion all the way onto the Rotary Motion Sensor shaft and tighten the Pinion on the shaft by turning the small thumbscrew on the side of the Pinion (see Fig. 7).
Connect the Rotary Motion Sensor to the PASCO interface.
Mounting the Degree Plate and Light Sensor Arm
The Degree Plate and Light Sensor Arm are shipped as a unit. The Light Sensor Arm is attached to the circular Degree Plate with two small thumbscrews. The hole in the center of the Degree Plate fits over the short threaded post on the top of the Spectrophotometer Base.
Hold the Rotary Motion Sensor slightly away from the base so the small diameter post on top of the Pinion is not in the way of the edge of the Degree Plate. Position the hole in the plate over the short threaded post on the top of the base. Place the Degree Plate onto the Spectrophotometer Base. Let the small diameter post on the top of the Pinion rest against the edge of the Degree Plate (see Fig. 8). Note: In order for the Rotary Motion Sensor to turn consistently as the Degree Plate is rotated, the pinion must be tight against the Degree Plate. To make this happen, loosen the thumbscrews that are holding the Rotary Motion Sensor, push
Figure 5: Prepare Rotary Motion Sensor
Thumbscrew
Three-step Pulley
Rotary Motion Sensor
Rod Clamp
Hex Key
Spectrophotometer Base
Remove the pinion
Rotate the hinge
Figure 6: Prepare the HingeRemove the thumbscrews
Put the pinion on the shaft
Use the thumbscrews to
attach the sensor
Hinge
Figure 7: Attach the Sensor and Pinion

�
Educat ional Spectrophotometer Set Up
8 012-06575D
on the hinged plate to move the Rotary Motion Sensor away from the Degree Plate, and then Push the Rotary Motion Sensor toward the hinge as far as the thumbscrews will allow. Tighten the thumbscrews and then let go of the hinged plate. Now the pinion should be pressed against the Degree Plate.
Calibrating the Degree Plate
The ratio between the radius of the Degree Plate and the radius of the small post on the top of the Pinion is designed to be 60 to 1. In other words, the Pinion rotates 60 times for one rotation of the Degree Plate.
This assumed ratio of 60 to 1 is included in a calculation for the actual angular displacement of the Degree Plate as it turns during the measurement of a spectrum (see “Using the data collection program” in the Procedure section).
Using the exact ratio of the Degree Plate to the small Pinion post can slightly improve the accuracy of measurement. To determine the exact ratio of the Degree Plate to the small Pinion post, do the following to calibrate the Degree Plate:
1. Remove the Light Sensor Arm from the Degree Plate by unscrewing the two small thumbscrews. (You can store the thumbscrews in the empty threaded holes on the Light Sensor Arm.) Turn the Degree Plate so the zero degree mark is exactly aligned with the index mark on the arm that extends from the Spectrophotometer Base.
2. Start the data collection program. (See the software’s Help system or User’s Guide for more information.)
3. In the program, select “Rotary Motion Sensor” to be connected to the PASCO interface. Set the resolution of the ScienceWorkshop (“CI”) Rotary Motion Sensor to 1440 Divisions/Rotation. The PASPORT Rotary Motion Sensor resolution is preset to 4000 Divisions/Rotation.
4. In the data collection program, use the built-in Calculator to create a calculation. Base the calculation on the “Angular Position” measurement from the Rotary Motion Sensor. In the calculation, divide “Angular Position” by 2where is approximately 3.1416… Label your calculation “Ratio of Radii” (see Fig. 9).
5. In the program, select a Graph display and set it to show the calculation “Ratio of Radii” on its vertical axis.
6. Start recording data. Turn the Degree Plate in one direction slowly and continuously for exactly one complete rotation. Stop recording data.
Figure 8: Degree Plate onto Base
Let the post on top of the pinion rest against the edge of the Degree Plate.
Rotary Motion Sensor
Light Sensor Arm
Degree Plate
Figure 9: Calculation of Ratio of Radii
NOTE: The calculator in your program may differ in appearance. Refer to your User’s Guide.

�
OS-8537, 8539, and 8450 Set Up
9012-06575D
7. In the Graph display, use the built-in Statistics tools to find the maximum value of the “Ratio of Radii” (i.e., the maximum of y - see Fig. 10). This value is the exact ratio of the Degree Plate radius to the small Pinion post radius. (Note: This value should be close to 60.) Record the actual ratio.
Ratio of Radii = _______
8. Replace the Light Sensor Arm on the Degree Plate and fasten it to the plate with the two small thumbscrews.
Mounting the Aperture Bracket Light Sensor Mount and Light Sensor
The Aperture Bracket has two main parts: the Light Sensor Mount and the Holder. (The Holder and thumbscrew are not used and can be put aside.) An Aperture Disk and Aperture Screen) are attached to the front of the Light Sensor Mount.
The Light Sensor Mount has two holes: one hole in the center of the mount and a second hole at the rear of the mount. The end of the Light Sensor Arm has three holes: two holes along the centerline of the arm and one hole to the side of the centerline. Line up the center hole of the Light Sensor Mount with the centerline hole in the Light Sensor Arm that is closest to the Degree Plate.
Line up the High Sensitivity Light Sensor so the threaded hole in its base is above the center hole of the Light Sensor Mount. Use the threaded post (included with the Aperture Bracket fasten the High Sensitivity Light Sensor and Light Sensor Mount to the Light Sensor Arm (Fig. 11).
Rotate the Aperture Disk on the front of the Light Sensor Mount so that the narrowest slit is in line with the opening to the sensor.
Connect the High Sensitivity Light Sensor to the PASCO interface.
Mounting the Grating Holder
The threaded rod on the bottom of the Grating Holder has a lock washer and a wing nut. Remove the lock washer and wing nut from the threaded rod, and screw the threaded rod into the short threaded post in the center of the Degree Plate. Do not screw the Grating Holder all the way down onto the Light Sensor Arm. The Grating Holder must be slightly above the Light Sensor Arm so the Degree Plate can move.
Use the Light Sensor Arm to rotate the Degree Plate until the zero line on the Degree Plate is aligned with the index mark on the Spectrophotometer Base Turn the Grating Holder so it is aligned
NOTE: The Graph display in your program may differ in appearance. Refer to your User’s Guide.
Figure 10: Sample Degree Plate Calibration Data
HIGH SENSITIVITYLIGHT SENSOR
CI-6604
Figure 11: Sensor and Aperture Bracket onto Light Sensor Arm
Aperture Bracket Light Sensor Mount
Light Sensor Arm
High Sensitivity Light Sensor
Threaded post
Align the zero line on the Degree Plate with
the index mark.
Zero line
Fasten the Holder with the lock washer
and wing nut
Line up the edge of the Grating Holder with the zero line.
Figure 12: Mount the Grating Holder

�
Educat ional Spectrophotometer Set Up
10 012-06575D
with the zero line on the Degree Plate and the label side of the Grating Holder faces away from the sensor on the Light Sensor Arm.
Put the lock washer and wing nut back onto the threaded rod and tighten the wing nut until the Grating Holder remains in place when the Degree Plate is rotated in either direction (Fig. 12).
Mounting the Spectrophotometer Base on the Optics Bench
You can mount the components of the Spectrophotometer on the 1.2 meter Optics Bench that is part of the OS-8515 Basic Optics System, or the 0.6 meter (60 cm) Optics Bench that is included with the OS-8539 Spectrophotometer System. The Spectrophotometer Base mounts into the T-slots on the sides of the Optics Bench and the Collimating Slits and Collimating Lens snap into the center of the Optics Bench.
To mount the Spectrophotometer Base on the Optics Bench, loosen the thumbscrew on each side of the Base so the square nuts can slip into the T-slots on the sides of the Optics Bench. Insert the square nuts into the slots and slide the Base along the bench until it is about 20 cm from the end (Fig 13). Tighten the thumbscrews to hold the Base firmly on the bench.
Rod Stand Mounting Clamps
You can adjust the height or angle of the Optics Bench using the Rod Stand Mounting Clamps and two rods and bases (not included). Each clamp has a thumbscrew and a square nut at one end, and a second thumbscrew at the other end. The thumbscrew with the square nut holds the clamp onto the bench, and the other thumbscrew holds the clamp onto a rod. The clamp has grooves on one side that match the lower lip of the optics bench.
To mount the clamp on the bench, loosen the square nut and then slide the square nut into the T-slot at the end of the optics bench. Line up one of the grooves in the clamp with the lower lip of the optics bench. Tighten the thumbscrew (Fig. 14).
To mount the clamp on a support rod, loosen the other thumbscrew. Put the support rod though the hole, and then tighten the thumbscrew (Fig 15).
Mounting and Adjusting the Collimating Slits and Lens
The Collimating Slits consist of two parts: the Collimating Slits Plate and the Collimating Slits Holder. The slits are in a piece of metal that is attached to a moveable slide. The slide is held on the Collimating Slits Plate with a small thumbscrew and two permanently attached socket screws. The Collimating Slits Plate is attached to the Collimating Slits Holder with two brass thumbscrews. Loosen the small thumbscrew in the Collimating Slits Plate in order to move the slits slide back and forth. The narrow slot in the Collimating Slits Plate lets light through one slit at a time. The top half of the Collimating Slits Plate helps to prevent extra light from being measured.
Figure 13: Base onto Optics Bench (end view)
Spectrophotometer Base
Optics Bench Square nut
Thumbscrew
T-Slot
Figure 14: Mounting Clamp onto Optics Bench
Top view
Put support rod here.
Slide groove onto lip.
End view
Figure 15: Mounting Clamp onto Rod
Optics BenchRod

�
OS-8537, 8539, and 8450 Set Up
11012-06575D
Snap the Collimating Slits Holder into the Optics Bench near the end of the bench that is closest to the light source you are using. To move the holder, grasp the holder at the base and push in on the locking clip on one side of the holder (Fig. 16). Slide the holder along the center section of the bench while squeezing the clip. Release the clip to lock the holder firmly in position.
Snap the Collimating Lens Holder into the Optics Bench between the Collimating Slits Holder and the Spectrophotometer Base. Position the Collimating Lens Holder about 10 cm from the Collimating Slits Holder.
Positioning the Collimating Slits and Lens
The focal length of the Collimating Lens is about 10 cm so the lens should be positioned about 10 cm from the slits. Use the following procedure to position the lens more precisely.
Set up a light source so that light from the source passes through one of the slits on the Collimating Slits and then through the Collimating Lens. Rotate the Light Sensor Arm so the Aperture Bracket and Light Sensor are out of the way and the beam of light can shine onto a distant vertical surface such as a wall (Fig. 17).
Adjust the distance between the Collimating Slits and the Collimating Lens so that the beam of light is neither converging nor diverging (i.e., light rays are parallel). The beam of light should stay about the same width all the way to the distant vertical surface. Hold a piece of paper in the light beam’s path at various distances along the beam’s path. Check to see that the light beam’s width is about the same at each point along its path. Note that the light may not be in focus during this process.
If the light beam is not perfectly vertical, loosen the small thumbscrew that holds the Collimating Slits slide and adjust the slide, or loosen the brass thumbscrews that hold the Collimating Slits Plate onto the holder and adjust the plate until the collimated beam is vertical. Remember to tighten the thumbscrews after you make the adjustment.
The distances between the light source and the Collimating Slits and between the Collimating Slits and the rest of the Spectrophotometer are not critical. However, the closer the light source, the brighter the spectrum.
Figure 16: Locking Clip
Collimating Slits
Optics Bench
Locking clip
GAIN
10100
1
Figure 17: Collimation Setup
Light source
Collimating Slits
Collimating Lens
Light ray path
�
Educat ional Spectrophotometer Set Up
12 012-06575D
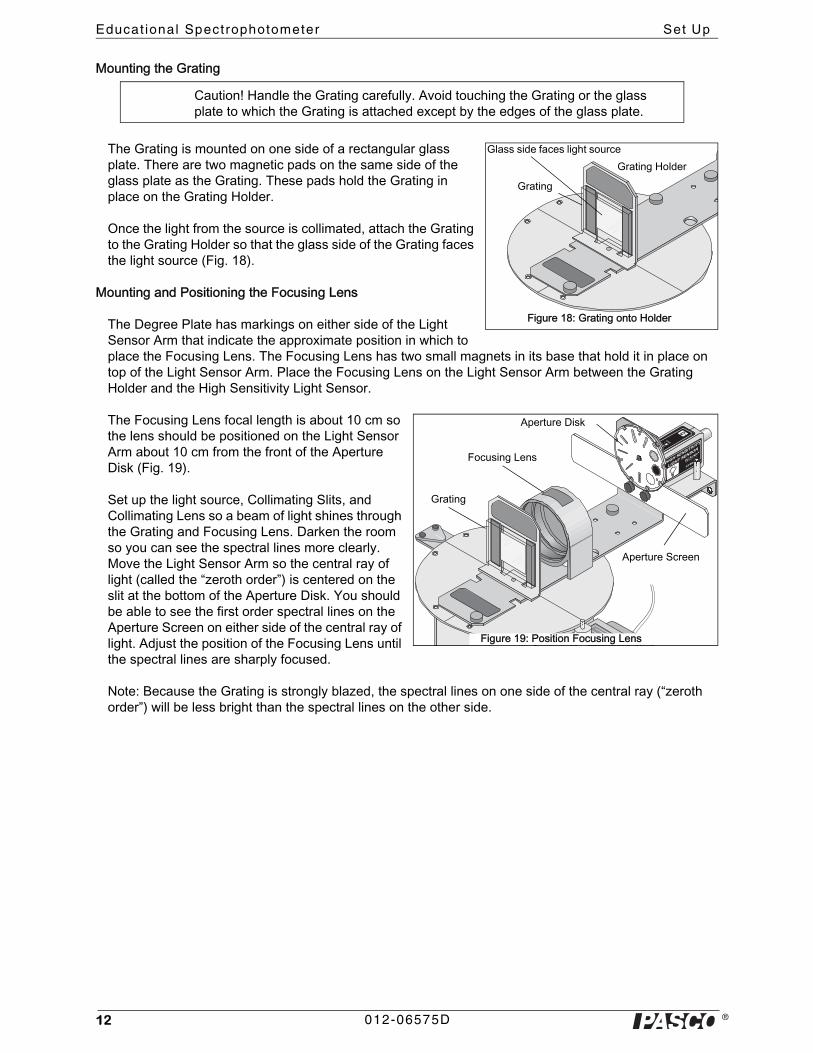
Mounting the Grating
The Grating is mounted on one side of a rectangular glass plate. There are two magnetic pads on the same side of the glass plate as the Grating. These pads hold the Grating in place on the Grating Holder.
Once the light from the source is collimated, attach the Grating to the Grating Holder so that the glass side of the Grating faces the light source (Fig. 18).
Mounting and Positioning the Focusing Lens
The Degree Plate has markings on either side of the Light Sensor Arm that indicate the approximate position in which to place the Focusing Lens. The Focusing Lens has two small magnets in its base that hold it in place on top of the Light Sensor Arm. Place the Focusing Lens on the Light Sensor Arm between the Grating Holder and the High Sensitivity Light Sensor.
The Focusing Lens focal length is about 10 cm so the lens should be positioned on the Light Sensor Arm about 10 cm from the front of the Aperture Disk (Fig. 19).
Set up the light source, Collimating Slits, and Collimating Lens so a beam of light shines through the Grating and Focusing Lens. Darken the room so you can see the spectral lines more clearly. Move the Light Sensor Arm so the central ray of light (called the “zeroth order”) is centered on the slit at the bottom of the Aperture Disk. You should be able to see the first order spectral lines on the Aperture Screen on either side of the central ray of light. Adjust the position of the Focusing Lens until the spectral lines are sharply focused.
Note: Because the Grating is strongly blazed, the spectral lines on one side of the central ray (“zeroth order”) will be less bright than the spectral lines on the other side.
Caution! Handle the Grating carefully. Avoid touching the Grating or the glass plate to which the Grating is attached except by the edges of the glass plate.
Glass side faces light sourceGrating Holder
Grating
Figure 18: Grating onto Holder
101
100
GAIN
HIGH SENSITIVITY
LIGHT SENSOR
CI-6604
Figure 19: Position Focusing Lens
Grating
Focusing Lens
Aperture Screen
Aperture Disk

�
OS-8537, 8539, and 8450 Procedures
13012-06575D
ProceduresGrounding
1. If you use an AC powered spectral light source, plug the power cord for the light source into a different outlet than the outlet used for your PASCO interface and computer.
2. For a very dim light source you may need to use the 100 GAIN setting on the High Sensitivity Light Sensor and the 100x sensitivity setting in the data collection program. If so, connect a wire from the Spectrophotometer Base to an earth ground in order to reduce electrical “noise”. You can use one of the small thumbscrews from the Light Sensor Arm to connect a ground wire (not included) to the threaded hole on the side of the Spectrophotometer Base opposite to the Rotary Motion Sensor.
Turning the Degree Plate
The spring in the hinge on the Spectrophotometer Base is strong enough to keep the Pinion in contact with the edge of the Degree Plate as you move the Light Sensor Arm to turn the plate. If the small diameter post on the Pinion slips rather than turns, make sure that the thumbscrews that hold the Rotary Motion Sensor onto the hinge are tight. You may need to loosen the screws and then push the Rotary Motion Sensor so it is as close to the Base as possible before re-tightening the screws.
Masking the Light Source or the Spectrophotometer
When using a bright spectral light source such as the PASCO Low Pressure Sodium Light Source, cover the source with an opaque cloth hood to block out ambient light. Cover the light source opening with a mask that has a 0.5 to 1.0 cm wide rectangular slot in it to reduce ghost images. Use clothespins or binder clips to attach the edge of the cloth hood to the plate on the Collimating Slits (Fig. 20).
When measuring solar spectra, put an opaque cloth hood over the entire Spectrophotometer so that the only opening to the sunlight is the Collimating Slit. Use clothespins or binder clips to attach the edge of the cloth hood to the plate on the Collimating Slits. Use one hand to hold up the center of the cloth hood (Fig. 21).
Using the Data Collection Program
Note: See the data collection software’s User’s Guide for detailed information about using the program.
1. Start the program. For ScienceWorkshop sensors, select the Light Sensor to be connected to Analog Channel A and select the Rotary Motion Sensor to be connected to Digital Channels 1 and 2. Set the Rotary Motion Sensor so it can record 1440 divisions per rotation.
2. For PASPORT sensors, plug the Light Sensor and the Rotary Motion Sensor into PASPORT ports.
3. In the program, select a Graph display and set it to show “Light Intensity (% max)” on its vertical axis.
Figure 20: Mask the Light Source
Opaque cloth
��������
���� �������
������������������������
Figure 21: Mask the Spectrophotometer
Opaque cloth
SunlightBinder clips

�
Educat ional Spectrophotometer Procedures
14 012-06575D
4. Use the Calculator in the program to create a calculation of the actual angular position of the Degree Plate. If the small post on the top of the Pinion is in contact with the edge of the Degree Plate, the Angular Position of the Rotary Motion Sensor must be divided by the ratio of the radius of the Degree Plate and the radius of the small post on the Pinion*. The ratio is approximately 60 to 1. If the Ratio of Radii you determined was not 60, use the value you found. If the larger diameter section at the bottom of the Pinion is used, the Angular Position of the Rotary Motion Sensor must be divided by 15* (see Fig. 22 for an example from Capstone).
5. Change the Graph display to show your calculation of Actual Angle on its horizontal axis.
(*See “Calibrating the Degree Plate” earlier in the Set Up section for more information on measuring the ratio of the radius of the Degree Plate and the radius of the Pinion.)
General Information About the Light Sensors
The ScienceWorkshop High Sensitivity Light Sensor has a GAIN (amplification) select switch on the top with three settings (1, 10 and 100). When you measure a spectrum, start with the lowest GAIN setting to measure the brightest lines. Then switch to the next setting and re-scan the spectrum to measure the dimmer lines. Then re-scan again at the highest GAIN setting to measure the dimmest lines.
It may also be possible to amplify the signal (increase the sensitivity) from the Light Sensor using the data collection program. For example, in Capstone, the normal sensitivity setting is “Low (1x)”. The other settings are “Medium (10x)” and “High (100x)”.
In general, you will record better data if you increase the GAIN setting on the Light Sensor before you increase the sensitivity setting in the data collection program.
The PASPORT High Sensitivity Light Sensor has three sensitivity buttons: 0 to 1 (Candle), 0 to 100 (Light Bulb), and 0 to 10000 (Sun). Most spectra experiments require the 0 to 1 (Candle) setting.
General Information About Slit Widths
There are five slits on the Collimating Slits slide and six slits on the Aperture Disk. You can select wider slits in order to increase the amount of light that passes through the Grating and into the Light Sensor, but this will make a wider spectral pattern and decrease the accuracy of your measurements.
Scanning a Spectrum
To scan a spectrum, use the threaded post under the Light Sensor to move the Light Sensor Arm so the Light Sensor is beyond the far end of the first order spectral lines, but not in front of any of the spectral lines in the second order.
In the data collection program, begin recording data. Then, scan the spectrum continuously but slowly in one direction by pushing on the threaded post to rotate the Degree Plate. Scan all the way through the first order spectral lines on one side of the central ray (“zeroth order”), through the central ray, and all the way through the first order spectral lines on the other side of the central ray (Fig. 23).
Figure 22: Create a Calculation
����
��
���
�
Figure 23: Scan the Spectrum
First order spectral lines
Scan slowly and continuously in one direction.
Light Source
Central ray (“zeroth order”)

�
OS-8537, 8539, and 8450 Procedures
15012-06575D
The angle of a particular line in the spectral pattern is one-half of the difference of the angle between the chosen spectral line in the first order on one side of the central ray and the matching spectral line in the first order on the other side of the central ray. Use the built-in analysis tools in the data collection program’s Graph display to find the angle between the two matching spectral lines. The angle, , is one-half of the angle between the two lines. Use m = d sin (and let the order, m, be 1) to calculate the wavelength of the chosen spectral line.
If a dim spectral line only appears on one side of the central ray (“zeroth order”), calculate where the central ray is using a brighter spectral line that is visible on both sides of the central ray. Then determine the angle from the central ray to the dim line to find the angle, , for that spectral line (Fig. 24).
Calibrating the Grating
The number of grating lines on the Grating is approximately 600 lines per millimeter. This translates to a Grating line spacing of d = 1666 nm (1.666…x10-6 m).
To find the exact Grating line spacing, use a sodium lamp to calibrate the Grating. The average wavelength, , of the yellow sodium doublet is 589.3 nm. Solving m = d sin for the line spacing, d, assuming m = 1 (for the first order) gives
d = /sin
where is the known wavelength of the sodium doublet. To determine the angle, , find the difference in angle between the two first order yellow lines and divide by two.
Using the calibrated Grating line spacing, d, the wavelength of any spectral line in any other spectrum can be more accurately determined using m = d sin where the order, m, is 0,1,2,…
Angular Resolution
When the Rotary Motion Sensor is fastened to the lower set of holes on the hinge on the Spectrophotometer Base (as described earlier), the small diameter post of the Pinion will make contact with the edge of the Degree Plate. The shaft of the Rotary Motion Sensor will rotate approximately 60 times for every rotation of the Degree Plate (or 360°). One rotation of the Rotary Motion Sensor shaft represents approximately 6° of angular displacement of the Degree Plate. The maximum resolution of
Central ray (“zeroth order”)
For example, measure the difference in angle between these two lines. One half of the difference is the angle to use for calculating the wavelength.
Figure 24: Measure the Angles for both First Order Spectral Patterns

�
Educat ional Spectrophotometer Procedures
16 012-06575D
the ScienceWorkshop Rotary Motion Sensor is 1440 divisions per rotation. Since one rotation is 6°, the angular resolution is 6° divided by 1440, or one quarter of a minute (0.25’) or fifteen seconds of arc. This translates to a wavelength resolution of 0.12 nanometers (nm), given a grating line spacing of approximately 1666 nm for the Diffraction Grating included with the Spectrophotometer. For the PASPORT Rotary Motion Sensor, there are 4000 divisions per rotation, which yields a resolution of 0.04 nm
If the Rotary Motion Sensor is fastened to the upper set of holes on the hinge, the larger diameter part of the Pinion will make contact with the edge of the Degree Plate. The shaft of the sensor will rotate 15 times for every rotation of the Degree Plate. The maximum angular resolution for the ScienceWorkshop sensor is one minute or sixty seconds of arc. This translates to a wavelength resolution of 0.48 nm, given a grating line spacing of approximately 1666 nm.
Cuvettes
The Educational Spectrophotometer Accessory Kit includes two plastic cuvettes. These flat sided containers can hold about five milliliters (mL) of liquid. You can use the Spectrophotometer and a cuvette to measure a substance’s characteristic pattern of absorption and transmission.
To set up the Spectrophotometer and cuvette for measuring an absorption spectrum, do the following:
1. Unscrew the threaded post that holds the Light Sensor and Light Sensor Mount onto the Light Sensor Arm.
2. Move the Light Sensor back so its threaded hole is lined up with the rear centerline hole on the Light Sensor Mount. Use the threaded post to reattach the Light Sensor and Light Sensor Mount to the Light Sensor Arm.
3. Place the empty cuvette in front of the opening to the Light Sensor between the sensor and the backside of the Aperture Disk. Make sure that the cuvette is turned so that the smooth sides are in line with the Light Sensor (Fig. 25).
4. Scan the spectrum from an incandescent light source (such as a bulb powered by a regulated DC power supply).
5. Fill the cuvette with the liquid to be tested and then rescan the spectrum of the incandescent light that is transmitted through the liquid.
Other Information
The data collection program interprets the starting position of the Rotary Motion Sensor as the “zero” angular (or linear) position. For some measurements it may be important to put a mark or stop on the edge of the Degree Plate for reference so you can begin each trial of measurement from the same position. The Degree Plate has several threaded holes near its outer edge. You can put one of the small thumbscrews that are stored on the Light Sensor Arm into one of these threaded holes to use as a reference point for beginning or ending a scan.
HIGH SENSITIVITYLIGHT SENSOR
CI-6604
CuvetteAperture disk
Figure 25: Cuvette with Light Sensor

�
OS-8537, 8539 and 8450 Act iv i ty 1: Emission (Br ight L ine) Spectrum
17012-06575D
Activity 1: Emission (Bright Line) Spectrum
EQUIPMENT NEEDED
Introduction
The purpose of this activity is to determine the wavelengths of the colors in the spectrum of a mercury vapor light.
Theory
An incandescent source such as a hot solid metal filament produces a continuous spectrum of wavelengths. Light produced by an electric discharge in a rarefied gas of a single element contains a limited number of discrete wavelengths - an emission or “bright line” spectrum. The pattern of colors in an emission spectrum is characteristic of the element. The individual colors appear in the shape of “bright lines” because the light that is separated into the spectrum usually passes through a narrow slit illuminated by the light source.
A grating is a piece of transparent material on which has been ruled a large number of equally spaced parallel lines. The distance between the lines is called the grating line spacing, d.
Light that strikes the transparent material is diffracted by the parallel lines. The diffracted light passes through the grating at all angles relative to the original light path. If diffracted light rays from adjacent lines on the grating interfere and are in phase, an image of the light source can be formed. Light rays from adjacent lines will be in phase if the rays differ in path length by an integral number of wavelengths of the light. The first place that an image can be formed is where the path length between two adjacent light rays differs by one wavelength, . However, the difference in path length for two adjacent light rays also depends on the grating line spacing, d, and the angle, , at which the two light rays were diffracted by the grating.
The relationship between the wavelength of the light, , the grating line spacing, d, and diffraction angle, , is as follows:
= d sin
In the diagram (Fig. 1.1), the path length for Ray A is one wavelength longer than the path length of Ray B.
Spectrophotometer System (OS-8539 ScienceWorkshop or OS-8450 PASPORT)
or
Spectrophotometer Kit (OS-8537) High Sensitivity Light Sensor (PS-2176 or CI-6604)
Rotary Motion Sensor (PS-2120 or CI-6538) Basic Optics Bench (part of OS-8515)
Aperture Bracket (OS-8534) Rod, 45 cm (ME-8736) (2)
Mercury Spectral Tube and Power Supply Large Rod Stand (ME-8735) (2)
PASCO Interface (see www.pasco.com) Data collection software (see www.pasco.com)
Grating
Figure 1.1: Ray diagram for first order diffraction pattern
Ray B
Ray Alight rays
d = grating line spacing
path difference = = d sin
= angle of diffraction

�
Educat ional Spectrophotometer Act iv i ty 1: Emission (Br ight L ine) Spectrum
18 012-06575D
Procedure
In this activity, the High Sensitivity Light Sensor measures the relative intensity of colors of light in an emission spectrum produced by light from a mercury vapor light source passing through a grating. The Rotary Motion Sensor measures the angle, , of each band or “bright line” of color.
The data collection program records and displays the light intensity and the angle. You can use the program’s built-in data analysis tools to find the angle for each color, and then you can determine the wavelength, , of each color.
Equipment Setup
1. Set up the Spectrophotometer next to a mercury vapor light source as shown (Fig. 1.2). If needed, use the Rod Stand Mounting Clamps, two rods, and two bases to raise the Spectrophotometer to the same level as the opening to the light source. (Refer to the Introduction for more information.)
2. If the light source has a large opening, mask the opening so it transmits a narrow (0.5 to 1.0 cm) beam to the Collimating Slits. Put a cloth hood over the light source and attach the edge of the hood to the plate on the Collimating Slits.
3. Turn on the light source. Once it is warmed up, adjust the light source, Collimating Slits, Collimating Lens, and Focusing Lens so clear images of the central ray and the first order spectral lines appear on the Aperture Disk and Aperture Screen in front of the High Sensitivity Light Sensor. Turn the Aperture Disk so the smallest slit on the disk is in line with the central ray.
4. Connect the PASCO interface to the computer, and turn on the interface. Start the data collection software.
5. For ScienceWorkshop, connect the High Sensitivity Light Sensor cable to Analog Channel A and connect the Rotary Motion Sensor cable to Digital Channels 1 and 2. For PASPORT connect the High Sensitivity Light Sensor and the Rotary Motion Sensor to PASPORT ports.
Experiment Setup
Select the Sensors, Set the Sample Rate, and Create a Calculation
Refer to the User’s Guide for your version of data collection software for detailed information on selecting sensors, changing the sample rate, and creating a calculation.
1. For ScienceWorkshop sensors, in the program, select the Rotary Motion Sensor and connect it to Digital Channels 1 and 2 and select the Light Sensor and connect it to Analog Channel A. PASPORT sensors automatically identify themselves when plugged in.
2. In the program, set up the ScienceWorkshop Rotary Motion Sensor for high resolution (1440 Divisions per Rotation) and set the sample rate to 20 Hz, or 20 measurements per second. The PASPORT Rotary Motion Sensor is always on 4000 Divisions per Rotation.
��������
���� �������
������������������������
Light source
Cloth hood Collimating Slits
Collimating Lens
Grating
Rotary Motion Sensor
Focusing Lens
Light Sensor
Base
RodBench
Figure 1.2: Equipment Setup

�
OS-8537, 8539 and 8450 Act iv i ty 1: Emission (Br ight L ine) Spectrum
19012-06575D
3. In the data collection program, use the Calculator to create a calculation of Actual Angle based on the Angle measurement made by the Rotary Motion Sensor and the ratio of the radius of the Spectrophotometer’s Degree Plate to the radius of the small post on the Pinion (Fig. 1.3). (Refer to the Set Up section for more information.)
Select the Display
Refer to the User’s Guide for your version of the PASCO data collection software for detailed information on displays.
1. Select a Graph display.
2. Set the axes of the Graph display so Light Intensity is on the vertical axis and Actual Angle is on the horizontal axis.
Prepare to Record Data
Refer to the User’s Guide for your version of the PASCO data collection software for detailed information on monitoring and recording data.
1. Darken the room. Examine the spectrum closely. Determine which of the two first order spectral patterns is brightest. In the Data Table, list the colors you see in order starting with the color that appears farthest from the central ray.
2. Use the Light Sensor Arm on the Spectrophotometer to turn the Degree Plate until the light sensor is beyond the last line in the brightest first order spectral pattern.
Record Data
1. Run One: Set the GAIN select switch on top of the ScienceWorkshop High Sensitivity Light Sensor to 100 and set the Gain in the Light Sensor Properties to 1X, or press the 0 to 10000 (Sun) button on the PASPORT sensor.
2. Start recording data.
3. Push on the threaded post under the light sensor to slowly and continuously scan the spectrum in one direction. Scan all the way through the first order spectral lines on one side of the central ray, through the central ray itself, and all the way through the first order spectral lines on the other side of the central ray (Fig. 1.4).
4. Stop recording data.
5. Run Two: For ScienceWorkshop, set the Gain in the Light Sensor Properties to 10X, or press the 0 to 100 (Light Bulb) button on the PASPORT sensor. Put the light sensor back at its starting point. Repeat the data collection procedure.
6. Run Three: For ScienceWorkshop, set the Gain in the Light Sensor Properties to 100X, or press the 0 to 1 (Candle) button on the PASPORT sensor. Put the light sensor back at its starting point. Repeat the data collection procedure.
Figure 1.3: Create a Calculation
Figure 1.3: Create a Calculation
GAIN
10100
1
Grating
First order spectral lines
Light Sensor
Scan slowly and continuously in one direction.
Figure 1.4: Scan the Spectrum

�
Educat ional Spectrophotometer Act iv i ty 1: Emission (Br ight L ine) Spectrum
20 012-06575D
Analyze the DataRefer to the User’s Guide for your version of the PASCO data collection software for detailed information on using the software for data analysis.
1. Use the Graph display to examine the plot of Light Intensity versus Actual Angle for the first run of data (Run One).
2. Use the built-in analysis tools to determine the angle of the first line in the spectral pattern, and the angle of the matching line in the first order spectral pattern on the other side of the central ray.
3. Determine the difference in angle between the two lines and use one-half of the difference as the angle, , to determine the wavelength, , of that color. (If you did not calibrate the Diffraction Grating, assume d = 1666 nm.)
4. Repeat the process for the other colors in the first order spectral pattern.
5. Examine the plot of Light Intensity versus Actual Angular Position for your other two runs of data (Run Two and Run Three). Look for other lines in the spectral pattern that may be too dim to record when the light sensor was set to Gain = 1X for ScienceWorkshop or 0 to 10000 (Sun) for PASPORT.
Data Table
Record your data here:
Color 1 2 d sin
Conclusion
Compare your values for the wavelengths of color in the mercury vapor light spectrum to the accepted values for wavelengths.
Extensions
Repeat the process for a different gaseous element, such as hydrogen or helium.

�
OS-8537, 8539 and 8450 Act iv i ty 2: Absorpt ion (Dark L ine) Spectrum
21012-06575D
Activity 2: Absorption (Dark Line) Spectrum
EQUIPMENT NEEDED
Introduction
The purpose of this activity is to determine the wavelengths of the colors absorbed by a liquid sample.
Theory
One of the most important applications of spectrophotometers is to identify substances by their absorption spectra. For example, it is possible to identify tiny amounts of sodium dissolved in a complicated liquid (such as beer) because sodium has a unique absorption spectrum.
An incandescent source such as a hot solid metal filament produces a continuous spectrum of wavelengths. A substance placed in the path of light from a continuous spectrum source will absorb certain colors from the continuous spectrum. The individual colors that are absorbed appear as gaps or “dark lines” in the otherwise continuous spectrum (Fig. 2.1).
Procedure
In this activity, the High Sensitivity Light Sensor measures the relative intensity of colors of light in an continuous spectrum produced by an incandescent light. Then, the sensor measures the relative intensity of colors of light in an absorption spectrum produced when light from the incandescent source passes through a liquid sample. The Rotary Motion Sensor measures the angle, , of each part of the continuous spectrum and then the absorption spectrum.
The data collection program records and displays the light intensity and the angle. You can use the program’s built-in data analysis tools to find the angle for each “gap” or dark line in the absorption spectrum, and then you can determine the wavelength, .
Spectrophotometer System (OS-8539 ScienceWorkshop or OS-8450 PASPORT)
or
Spectrophotometer Kit (OS-8537) High Sensitivity Light Sensor (PS-2176 or CI-6604)
Rotary Motion Sensor (PS-2120 or CI-6538) Basic Optics Bench (part of OS-8515)
Aperture Bracket (OS-8534)
and
Incandescent Light Source, DC, regulated Large Rod Stand (ME-8735) (2)
Rod, 45 cm (ME-8736) (2) Colored Liquid Sample (about 5 mL)
PASCO Interface Data collection software
light ray
light ray
Grating
Cuvette (empty)
Cuvette with sample
continuous spectrum
absorption spectrum
Figure 2.1: Absorption Spectrum

�
Educat ional Spectrophotometer Act iv i ty 2: Absorpt ion (Dark L ine) Spectrum
22 012-06575D
Equipment Setup
1. Set up the Spectrophotometer next to a DC powered incandescent light source as shown. Move the High Sensitivity Light Sensor to the second position on the Light Sensor Arm so there is room for a cuvette between the back of the Aperture Disk and the opening to the sensor. (Refer to the Set Up section for more information.)
2. Put an empty cuvette in front of the High Sensitivity Light Sensor between the sensor and the back of the Aperture Disk. Make sure that the smooth sides of the cuvette are in line with the opening to the sensor (Fig. 2.2).
3. If the light source has a large opening, mask the opening so it transmits a narrow (0.5 to 1.0 cm) beam to the Collimating Slits. Adjust the Collimating Slits slide so the number 2 slit is in line with the light source. Put a cloth hood over the light source and attach the edge of the hood to the plate on the Collimating Slits.
4. Turn on the light source. Once it is warmed up, adjust the light source, Collimating Slits, Collimating Lens, and Focusing Lens so clear images of the central ray and the first order spectral pattern appear on the Aperture Disk and Aperture Screen. Turn the Aperture Disk so the second smallest slit on the disk is in line with the central ray.
5. Connect the PASCO interface to the computer, turn on the interface. Start the data collection software.
6. For ScienceWorkshop, connect the High Sensitivity Light Sensor cable to Analog Channel A and connect the Rotary Motion Sensor cable to Digital Channels 1 and 2. For PASPORT connect the High Sensitivity Light Sensor and the Rotary Motion Sensor to PASPORT ports.
Experiment Setup
Select the Sensors, Set the Sample Rate, and Create a Calculation
Refer to the User’s Guide for your version of the data collection software for detailed information on selecting sensors, changing the sample rate and sensitivity, and creating a calculation.
1. For ScienceWorkshop sensors, in the program, select the Rotary Motion Sensor and connect it to Digital Channels 1 and 2 and select the Light Sensor and connect it to Analog Channel A. PASPORT sensors automatically identify themselves when plugged in.
2. In the program, set up the ScienceWorkshop Rotary Motion Sensor for high resolution (1440 Divisions per Rotation) and set the sample rate to 20 Hz, or 20 measurements per second. The PASPORT Rotary Motion Sensor is always on 4000 Divisions per Rotation.
3. In the program for the ScienceWorkshop High Sensitivity Light Sensor, set the Gain in the soft-ware program sensor Properties to 10x. For the PASPORT sensor, there is no gain setting.
4. Use the Calculator to create a calculation of Actual Angle based on the Angle measurement made by the Rotary Motion Sensor and the ratio of the radius of the Spectrophotometer’s Degree Plate to the radius of the small post on the Pinion. (Refer to the Introduction for more information.)
Select the Display
Refer to the User’s Guide for your version of the data collection software for detailed information on displays.
CI-6604A
PASCOscientific
HIGH SENSITIVITY LIGHT SENSOR
CuvetteLight Source binder clips
Figure 2.2: Equipment Setup for Absorption Spectrum

�
OS-8537, 8539 and 8450 Act iv i ty 2: Absorpt ion (Dark L ine) Spectrum
23012-06575D
1. Select a Graph display.
2. Set the axes of the Graph display so Light Intensity is on the vertical axis and Actual Angle is on the horizontal axis.
Prepare to Record Data
Refer to the User’s Guide for your version of the data collection software for detailed information on displays.
1. Darken the room. Examine the spectrum closely. Determine which of the two first order spectral patterns is brightest.
2. Use the Light Sensor Arm on the Spectrophotometer to turn the Degree Plate until the light sensor is beyond the last color in the brightest first order spectral pattern.
Record Data - Empty Cuvette
1. For the Science Workshop sensor, set the GAIN select switch on top of the High Sensitivity Light Sensor to 10. For the PASPORT sensor, press the 0 to 100 (Light Bulb) button.
2. Start recording data.
3. Push on the threaded post under the light sensor to slowly and continuously scan the spectrum in one direction. Scan all the way through the first order spectral pattern on one side of the central ray, through the central ray itself, and all the way through the first order spectral pattern on the other side of the central ray.
4. Stop recording data.
Record Data - Cuvette with Liquid Sample
1. Remove the cuvette and fill it three-quarters full with the liquid sample you are testing. Cap the cuvette and replace it in front of the sensor.
2. Start recording data.
3. Push on the threaded post under the light sensor to slowly and continuously scan the spectrum in one direction. Scan all the way through the first order spectral pattern on one side of the central ray, through the central ray itself, and all the way through the first order spectral pattern on the other side of the central ray.
4. Stop recording data.
Analyze the DataRefer to the User’s Guide for your version of the data collection software for detailed information on displays.
1. Use the Graph display to compare the plot of Light Intensity versus Actual Angular Position for the first run of data (empty cuvette) to the plot of Light Intensity versus Actual Angular Position for the second run of data (cuvette plus liquid sample).
2. Use the built-in analysis tools of the program to find the angle of the first gap or “dark line” in the absorption spectrum of the liquid sample. Find the angle of the corresponding gap or line in the first order on the other side of the central ray.
3. Determine the difference between the angles and use one-half of the difference as the angle, , to determine the wavelength, , of that gap or dark line. (If you did not calibrate the Diffraction Grating, assume d = 1666 nm.)

�
Educat ional Spectrophotometer Act iv i ty 2: Absorpt ion (Dark L ine) Spectrum
24 012-06575D
= d sin
4. Repeat the process for the other gaps (if any) in the first order spectral pattern.
Data Table
Record your data here:
“Dark Line” 1 2 d sin
Questions
1. What color corresponds to the wavelength for each “dark line” in your absorption spectrum?
2. How does the color or colors that are absorbed out of the continuous spectrum compare to the naked eye color of your liquid sample?
Extensions
Repeat the process for a different liquid sample, such as chlorophyll extracted from a spinach leaf.

�
OS-8537, 8539 and 8450 Teacher ’s Guide
25012-06575D
Teacher’s Guide
Activity 1: Emission (Bright Line) Spectrum
Notes
1. A mercury vapor light source may take up to 20 minutes to warm up, so it is a good idea to turn it on as soon as possible.
2. Suggestions for calibrating the Degree Plate with the small post of the Pinion and for calibrating the Grating are given in the Set Up section of the manual.
3. Depending on which way the Degree Plate is turned, the Angular Position data from the Science-Workshop Rotary Motion Sensor may go in the negative direction rather than the positive direction along the horizontal axis of the Graph display. If this occurs, switch the two plugs on the end of the sensor’s cable.
Sample Data
Five of the seven lines of color for mercury vapor are shown in the example. The blue-green line is more prominent on both sides of the central ray when the GAIN select switch on the High Sensitivity Sensor is set to 100.
Data TableColor 1 2 d sin
yellow 0.7808 0.0692 0.7116 0.3558 580.0 nm
green 0.7613 0.0887 0.6726 0.3363 549.0 nm
blue-green 0.3016 494.8 nm
blue 0.6908 0.1578 0.5330 0.2665 438.0 nm
violet 0.6712 0.1773 0.4939 0.2469 407.1 nm
Conclusion
Compare your values for the wavelengths of color in the mercury vapor light spectrum to the accepted values for wavelengths.
Color yellow 2 yellow 1 green blue-greenblue violet 2 violet 1 579.0 577.0 546.1 491.6 435.8 407.8 404.7
Extensions
Repeat the process for a different gaseous element, such as hydrogen or helium.

�
Educat ional Spectrophotometer Teacher ’s Guide
26 012-06575D
Figure TG-1: Example of Mercury Spectrum
central ray
yellow
green
blue-green
blue
violet
Figure TG-2: Example of Hydrogen Spectrum with Approximate Wavelengths on Horizontal Axis

�
OS-8537, 8539 and 8450 Teacher ’s Guide (Cont inued)
27012-06575D
Teacher’s Guide (Continued)
Activity 2: Absorption (Dark Line) Spectrum
Notes
1. The light source from the PASCO Introductory Optics System or the light source from the PASCO Basic Optics System can be used as the incandescent source.
2. The liquid sample should be dilute enough to see through.
3. Suggestions for calibrating the Degree Plate with the small post of the Pinion and for calibrating the Grating are given in the Set Up section of the manual.
4. Depending on which way the Degree Plate is turned, the Angular Position data from the Science-Workshop Rotary Motion Sensor may go in the negative direction rather than the positive direction along the horizontal axis of the Graph display. If this occurs, switch the two plugs on the end of the sensor’s cable.
Questions
1. What color corresponds to the wavelength for each “dark line” in your absorption spectrum?
Answers will vary.
2. How does the color or colors that are absorbed out of the continuous spectrum compare to the naked eye color of your liquid sample?
Answers will vary
Extensions
Repeat the process for a different liquid sample, such as chlorophyll extracted from a spinach leaf.
Sample Data
Figure TG-3: Example of Absorption Spectrum for Food Coloring
Figure TG-4: Example of Absorption Spectrum for a Green Leaf
continuous spectrum
continuous spectrum
absorption spectrum
absorption spectrum

�
Educat ional Spectrophotometer Teacher ’s Guide (Cont inued)
28 012-06575D
Figure TG-5: Example of Absorption Spectrum for a Copper Sulfate Solution
Figure TG-6: Example of Absorption Spectrum for Cologne
continuous spectrum
continuous spectrum
absorption spectrum
absorption spectrum

� 29
OS-8537, 8539 and 8450 Technical Support
012-06575D
Technical Support
Feedback
If you have any comments about the product or manual, please let us know. If you have any suggestions on alternate experiments or find a problem in the manual, please tell us. PASCO appreciates all customer feedback. Your input helps us evaluate and improve our product.
To Contact PASCO
For technical support, contact us at
Limited WarrantyFor a description of the product warranty, see the PASCO catalog.
CopyrightThis PASCO scientific Instruction Manual is copyrighted with all rights reserved. Permission is granted to non-profit educational institutions for reproduction of any part of this manual, providing the reproductions are used only in their laboratories and classrooms, and are not sold for profit. Reproduction under any other circumstances, without the written consent of PASCO scientific, is prohibited.
TrademarksPASCO and PASCO scientific are trademarks or registered trademarks of PASCO scientific, in the United States and/or in other countries. All other brands, products, or service names are or may be trademarks or service marks of, and are used to identify, products or services of, their respective owners. For more information visit www.pasco.com/legal.
Product End of Life Disposal Instructions:This electronic product is subject to disposal and recycling regulations that vary by country and region. It is your responsibility to recycle your electronic equipment per your local environmental laws and regulations to ensure that it will be recycled in a manner that protects human health and the environment. To find out where you can drop off your waste equipment for recycling, please contact your local waste recycle/disposal service, or the place where you purchased the product.
The European Union WEEE (Waste Electronic and Electrical Equipment) symbol (to the right) and on the product or its packaging indicates that this product must not be disposed of in a standard waste container.
Contacting Technical Support
Before you contact the PASCO Technical Support staff, it would be helpful to prepare the following information:
• If your problem is with the PASCO apparatus, note:
• Name and model number (usually listed on the label);
• Approximate age of apparatus;
• A detailed description of the problem/sequence of events (in case you can’t call PASCO right away, you won’t lose valuable data);
• If possible, have the apparatus within reach when calling to facilitate description of individual parts.
• If your problem is computer or software related, please note:
• Title and version of the software.
• Type of computer (make, model, speed).
• Type of external cables and peripheral devices.
• Have the manual at hand to discuss your questions.
Address: PASCO scientific10101 Foothills Blvd.Roseville, CA 95747-7100
Phone: 916-462-8384 (worldwide)800-772-8700 (U.S.)
Web: www.pasco.comEmail: [email protected]

�
Educat ional Spectrophotometer Technical Support
30 012-06575D