00 iß - defense technical information · pdf filetests were begun at cbc, port hueneme,...
TRANSCRIPT

• ■■■^iflwu-.wr-' ■■ •
1
00 iß
Technical Report
«SäSS^
ANALYSIS OF PREVENTIVE MAINTENANCE POLICIES
FOR NAVY TRANSPORTATION EQUIPMENT
June 1971
mmmm sponw^by
NAVAL FACILITIES ENGINEERING COMMAND
\m NAVAL CIVIL ENGINEERING LABORATORY
Port Hueneme, California
Approved for public relww; distribution unlimitad.
o2c
Reproduced by
NATIONAL TECHNICAL INFORMATION SERVICE
Springfield, V» 22ISI *\

vr"r***vp'/"rr-™-wj*.'wijjBWf 7'n^n,i',.uj.'.'mJII||IT^JII]B )yiJiiiB.'"lllfJV*glflHHJ.ti>«>|..H".W|tf.ii|."-'ILI ^.I. '■'f.■-'«"\w^)mfHHJH^üluff■■ f'ü".
>
Unclassified SriTiirily Clanifiolion
DOCUMENT CONTROL DATA R&D (Srcurily clmktilication of title, body of nbxtrnrt und indemI»I* ttnnatmtion ntUKi 6c tnterrd when the oversll report is cluhmilitd)
ORICtNATING AC Tl VI TV (CofporSf mulhot)
Naval Civil Engineering Laboratory Port Hueneme, California 93043
2a. RCrONTSCCURITV CLASSIFICATION
Unclassified
3. REPORT TITLE
ANALYSIS OF PREVENTIVE MAINTENANCE POLICIES FOR NAVY TRANSPORTATION EQUIPMENT
4. OE5C«rPTiv€ uorti (Typ* ol r»port mnd incluii»» d»i*»)
Final; 1 July 1966-30 June 1970 S- AUTHOROI f^r*'mm«, middl» Initlmt, /««r nan«;
A. Jokubaitis
• RCPOUT OATK
June 1971 M- CONTRACT OR GRANT NO-
». PROIC T «o YF 38.534.007.01.002
7«. TOTAL NO. OF PAGES
41 7b. NO Or RCFS
••. ORIGIN
TR-732
»6. OTHCR REPORT NOfll (Any other numbmr» Ihmt mmy fc« a«lf#iad thi» rmpoft)
10. DltTRIRUTION STATEMENT
Approved for public release; distribution unlimited.
It SUPPLEMENTARV NOTES 12. SPONSORING MILITARY ACTIVITY
Naval Facilities Engineering Command Washington, D. C. 20390
t3 ABSTRACT
^ Four equipment maintenance policies are compared in terms of total operating cost, reliability, and operational reaefness of vehicles and related transportation equipment. The four policies compared are/
Scheduled preventive maintenance service,
Limited preventive maintenance service
3. Breakdown maintenance service, . \
'%. Manufacturer's prescribed preventive maintenance -
A digital computer program was used to expedite the analysis and provide cost and performance data. P«Mh^ 12 vehicle clasps analyzed to determine effectiveness of the four maintenance policiest the results indicate the manufacturer's prescribed preventive maintenance policy was the most cBs^effective approach.
Changing from the scheduled preventive maintenance policy now used to the manufacturer's prescribed preventive maintenance on the 50,820 vehicles currently in use by the Navy (in catego- ries 91 through 96) would result in a cost savings of $5.9 million per year.
DD.,r,..1473 S/N 0101-807.6801
(PAGE 1) Unclassified
Security ClssBification

Unclassified Security Cliltificilion
K CV WORDS
Vehicles
Preventive maintenance
Scheduled policy
Limited policy
Breakdown policy
Manufacturer's policy
Cost-effective analysis
VEHMT computer program
ROLE WT
DD :Z?.AA73 '^CK. (PAGE 2)
Unclassified Security Clatiificalion

■ ■ ■ ■ .-.-.•
... ,..^...-v.
ANALYSIS OF PREVENTIVE MAINTENANCE POLICIES FOR NAVY TRANSPORTATION EQUIPMENT
Technical Report R-732
YF 38.534.007.01.002
by
A. Jokubaitis
ABSTRACT
Four equipment maintenance policies are compared in terms of total ooerating cost, reliability, and operational readiness of vehicles and related transportation equipment. The four policies compared are:
1. Scheduled preventive maintenance service
2. Limited preventive maintenance service
3. Breakdown maintenance service
4. Manufacturer's prescribed preventive maintenance
A digital computer program was used to expedite the analysis and provide cos. and performance data. For the 12 vehicle classes analyzed to determine effectiveness of the four maintenance policies, the results indicate the manu- facturer's prescribed preventive maintenanco policy was the most cost-effective approach.
Changing from the scheduled preventive maintenance policy now used to the manufacturer's prescribed preventive maintenance on the 50,820 vehicles currently in use by the Navy (in categories 91 through 96) would result in a cost savings of $5.9 million per year.
IMCESSIOIH* _ toT, WHITE IECTIM r. |U5F SECTIO« Dl
IMAIWOUIICE» US
IjWTinMTMHI
„n. | AMU. »y »K'*1
Approved for public release; distribution unlimited.
Copies available at the National Technical Information Service (NTIS), Sills Building. 5285 Port Royal Road. Springfield, Va. 22151

CONTENTS page
INTRODUCTION 1
DATA REQUIREMENTS 3
Identification Codes 3
Equipment Classes 4
MEASURES OF EFFECTIVENESS 5
Reliability 5
Frequency of Preventive Maintenance 8
Maintenance Cost 8
Availability 11
RESULTS 12
FINDINGS 16
RECOMMENDATIONS 17
APPENDIX—Tabulated Results of Navy Transportation Equipment Study 18
in

»»ml tuBiwWW
INTRODUCTION
This study comparing the effectiveness of four vehicle maintenance policies was begun in July 1966. The collection of data and analysis of results were continued for 4 yean, during which time the following engineering per- sonnel at NCEL were responsible for the coordination of the program:
1966-1967 W. L. Richardson
1968-1969 B. C. Witherspoon
1969-1970 R. E. Bergman
1 he final phase of this project, which included drafting of this report, was coordinated by A. Jokubaitis.
The analysis described in this report was begun in 1966 for the Naval Facilities Engineering Command (NAVFAC)—then the Bureau of Yards and Docks. The goal of this study was to determine the optimum equipment maintenance policy, based on a determination of total operating cost, relia- bility, and operational readiness of Naval construction equipment. For a number of years, the current system of preventive maintenance has been the common and accepted practice used by some elements of industry and the military in the maintenance of mechanical equipment. In general, preventive maintenance consists of (1) periodic scheduled inspections of certain mechan- ical components likely to fail or wear out and (2) the performance of necessary service or repair operations where inspection indicates the requirement. It is recognized that preventive maintenance reduces vehicle downtime and increases, to some degree, equipment reliability.
Because preventive maintenance also tends to invite a degree of over- maintenance unless it is rigidly controlled, consideration was given to using a policy of controlled breakdown maintenance, where equipment failure is less critical. Breakdown maintenance policy consists of a completely "hands off" policy; repairs are not conducted until the vehicle is inoperable or unsafe for operation. A question requiring conclusive resolution which has been consid- ered in this study is whether the reduced maintenance costs resulting from such a system would be offset by higher capital costs due to increased down- time or high operating cost due to the disruptive effect.
■ ■ ■ - i

To answer the above question, the Naval Civil Engineering Laboratory (NCEL), under NAVFAC sponsorship, established a test program to examine the relative merits of preventive and breakdown maintenance policies and to determine which policy is the most cost effective. Preventive maintenance was further subdivided to allow for a finer distinction of policy, and the following four policies were evaluated to determine the optimum approach:
Policy 1—Scheduled Preventive Maintenance Service
This concept (currently in effect) incorporates a system of periodic scheduled inspections of certain mechanical components and accessories that are likely to fail, wear out, or require adjustments. Service or repair opera- tions are performed when inspection indicates the need.*
Policy 2—Limited Preventive Maintenance Service
This concept is limited to chassis lubrication (except units equipped with seal systems which are Governed by the manufacturer's prescribed service intervals) and oil and filter changes at 2,000 and 4,000 miles, respectively. It includes no mechanical inspection—mechanical inspections, repairs, or adjust- ments are made only when parts fail or when the driver or operator reports a malfunction.
Policy 3—Breakdown Maintenance Service
This no-maintenance approach is a "hands off policy. Under this concept the mere fact that a driver or operator reports a malfunction or deficiency does not in itself justify repair unless it is determined by the inspector that the complaint is valid and safe operation of the vehicle is in jeopardy.
Policy 4—Manufacturer's Prescribed Prevenscive Maintenance Service
This concept is governed by the manufacturer's prescribed service.
Tests were begun at CBC, Port Hueneme, California, during November 1966. Vehicles were divided into 12 classes and were further subdivided into the four maintenance policy groups for comparison. Data were collected
Department of the Navy, Bureau of Yards and Docks. NAVDOCKS P-300: Management of transportation equipment. Washington, D. C, June 1964.
■.—*»•„....,

■ »yriyiiwry tt. -w jv" t^-^f ^r,•^1r<;^nTTww^WV^TT~~^^■',
»»Vi'P'WiWfrr'. fttp^vn^f— wa ~
between November 1966 and May 1970, resulting in 12,000 units of maintenance data which were processed through a specially designed com- puter program called VEHMT.* The results from this comparison are the subject of this report.
DATA REQUIREMENTS
All data, regardless of the type of vehicle concerned, were initially recorded on the shop repair order, NAVFAC 1120-TF-1. This form pro- vided a means of identifying:
the vehicle and the maintenance policy to which it is assigned
date and time in and out of the shop
labor time
delay time
vehicle mileage at entry into shop
types of repair accomplished
labor cost (by repair classification)
parts used and their cost
shop release time, if any
inspector and supervisor
Identification Codes
The types of repair and the labor charges were classified by the following numbering system:
Code Component Code Component
6 lube 16 clutch 9 accessories 17 drive train
10 engine 18 brakes 11 ignition system 19 steering 12 electrical system 20 wheels and tires 13 fuel system 21 hydraulic 14 cooling system 22 battery 16 exhaust system
* The program listing for program VEHMT, which is in FORTRAN IV for the IBM 7094 computer, is available from NCEL. Inquiries should be addressed to Commanding Officer, Naval Civil Engineering Laboratory, Port Hueneme, California 93043, Attention: Code L64.
■

■ ■ ■ ■ .■
.. ■■ ■
All events (that is, cases In which a vehicle comes into the repair shop and a repair order is prepared) were classified according to the work required as follows:
scheduled maintenance
repair of interim failure*
repair of vehicles necessitated by accident
Equipment Classes
The maintenance study described in this report covers 376 equipment units. They were divided into 12 vehicle or equipment classes to provide for more meaningful data comparison. The 376 items were also subdivided, within each equipment class, into separate maintenance policies, as shown in Table 1.
Table 1. Equipment Classes
Equipment Class
Description
No. of Units for— Total Units Policy
1 Policy
2 Policy
3 Policy
4
31
48
51
57
65
82
91
92
93
94
95
96
portable air compressor
tractor (wheeled)
trailer-mounted generators (10 to 600 kw)
sweeper (street)
railway locomotive
truck-mounted crane cruiser
bus (37 passenger)
sedan
carry-all or station wagon
light truck (1/4 through 1 ton)
medium truck (1-1/2 through 2-1/2 tons)
heavy truck (over 2-1/2 tons)
5
2
6
1
1
1
4
3
5
54
6
6
5
3
7
1
1
1
4
6
3
55
7
6
5
1
b
1
0
1
4
5
3
54
5
6
5
1
5
1
0
1
6
5
2
54
6
7
20
7
23
4
2
4
18
19
13
217
24
25
Total 94 99 90 93 376
Interim failure is any nonaccident failure requiring repair wnich is not incorporated in a scheduled maintenance action.
4
.

jN-^y^r^-"-^-- ■-■■'
MEASURES OF EFFECTIVENESS
As stated in the Introduction, the purpose of the testing and analysis conducted during this study was to determine which of the four maintenance policies under examination is the most cost effective. There are numerous ways to measure cost effectiveness, all dependent on conditions which are imposed upon the equipment and their mode of operation. Originally, this study was initiated with the intention of collecting cost data directly attrib- utable to maintenance required. In other words, cost criteria were computed directly from expenditures of labor and materials. It was determined early in the testing that direct cost alone, however, is not a realistic determinant of the relative merits of the policies under study. For this reason, the addi- tional factors of reliability, availability, and frequency of preventive maintenance were introduced into the measure of effectiveness and were computed for all the vehicle classes and maintenance policies under analysis. To simplify comparison of the four policies, a measure of vehicle quality has been established which combines these three factors and shows what effect the degree of maintenance has on the vehicle operating capability.
In this study, effectiveness of the maintenance policies is defined in terms of the resulting vehicle reliability. Consequently, cost effectiveness is measured in terms of maintenance cost (interim and scheduled) against the resulting increase in vehicle reliability. In addition, the relative ranking of each maintenance policy is determined in terms of reliability, maintenance cost, and unavailability. These are tabulated, and a decision as to the most desirable policy can be made from a comparison of the three factors. Finally, for purposes of readily visible comparison, the three factors have been com- bined into an arbitrary measure of effectiveness (E), which is defined as:
_ (relative unavailability)(relative maintenance cost) relative reliability
This measure of effectiveness was established as an evaluation measure solely for application in this particular analysis to show the degree of improve- ment the four policies have in relation to each Other and in relation to maintenance policy 1 (scheduled preventive maintenance), which is currently in effect. It should not be generalized to apply in all cases.
Reliability
Reliability is defined as the probability that a vehicle will satisfactorily operate a specified number of miles or a specified time without a stoppage. Estimates of reliability were obtained through application of the Weibull dis- tribution, which has the following characteristics:

• ■
Probability density function is
f(x) = ll!llexpMt/tj)B] n*
where TJ represents the characteristic life. The cumulative distribution function is
F(x) - 1 - exp[-{t/Tj)B]
The reliability function may be expressed in terms of either time or miles. If time is used
R(t) - 1 - F(t) - expHt/r?)8]
where t is time to failure. If miles are used
R(m) = 1 - F{m) = exp[-(m/r/}B]
where m is miles to failure. The resulting reliability curves were plotted for vehicle classes 91
through 96 as a function of miles, as shown in Figure 1. Equipment in classes 31 through 82 did not have odometers; consequently, their reliability was cal- culated in terms of time. Results from classes 31 through 82 lacked credibility due to the nature of the equipment (see Table 1) and the difficulty of con- trolling data input. Therefore, the results obtained in the report are based primarily on test data obtained from vehicle classes 91 through 96.
The reliability curves do not provide, in themselves, a readily apparent means of determining the superior maintenance policy. Due to a difference in the shape of the curve, one policy may be superior at a certain mileage and become the poorest as mileage increases. This problem is overcome by deter- mining the areas under the curves; these areas represent the reliability of the component in that interval. Areas under the curves from m = 0 to m = 6,000 were calculated by computer, and the results are shown in the Appendix, Table Al. Relative measures of reliability, as influenced by maintenance policy, are also illustrated in Table A-1. These reliability values were obtained by determining the smallest area under the reliability curve within each vehi- cle class and dividing each other area (associated with vehicles of the same class) by the smallest reliability. These numerical relative values are inter- preted as follows: For vehicle class 91 (buses), vehicles of policy 4 are the

...
most reliable with a relative ranking of 1.562. vehicles of policy 1 follow with a ranking of 1.098, then come vehicles of policy 2 with a ranking of 1.089, and vehicles of policy 3 are the most unreliable with a rank of 1.0. By adding the areas under the reliability curves and taking a weighted average according to the number of vehicles involved, a relative ranking of maintenance policies as regards reliability, independent of vehicle class, is obtainable. This has been done, and the results are listed in Table 2.
Table 2. Relative Reliabilities for All Vehicle Classes (Criterion: Miles Traveled)
(Largest value indicates greatest reliability.)
Maintenance Policy Relative Reliability
1 scheduled preventive maintenance
2 limited preventive maintenance
3 breakdown maintenance
manufacturer's prescribed preventive maintenance
1.112 |
1.000 1
1.026 |
1.311 j
2,000 3,000 Miles, M
4,000 5,000
Figure 1. Probability of no interim failure versus miles for vehicle class 95.
■
Frequency of Preventive Maintenance
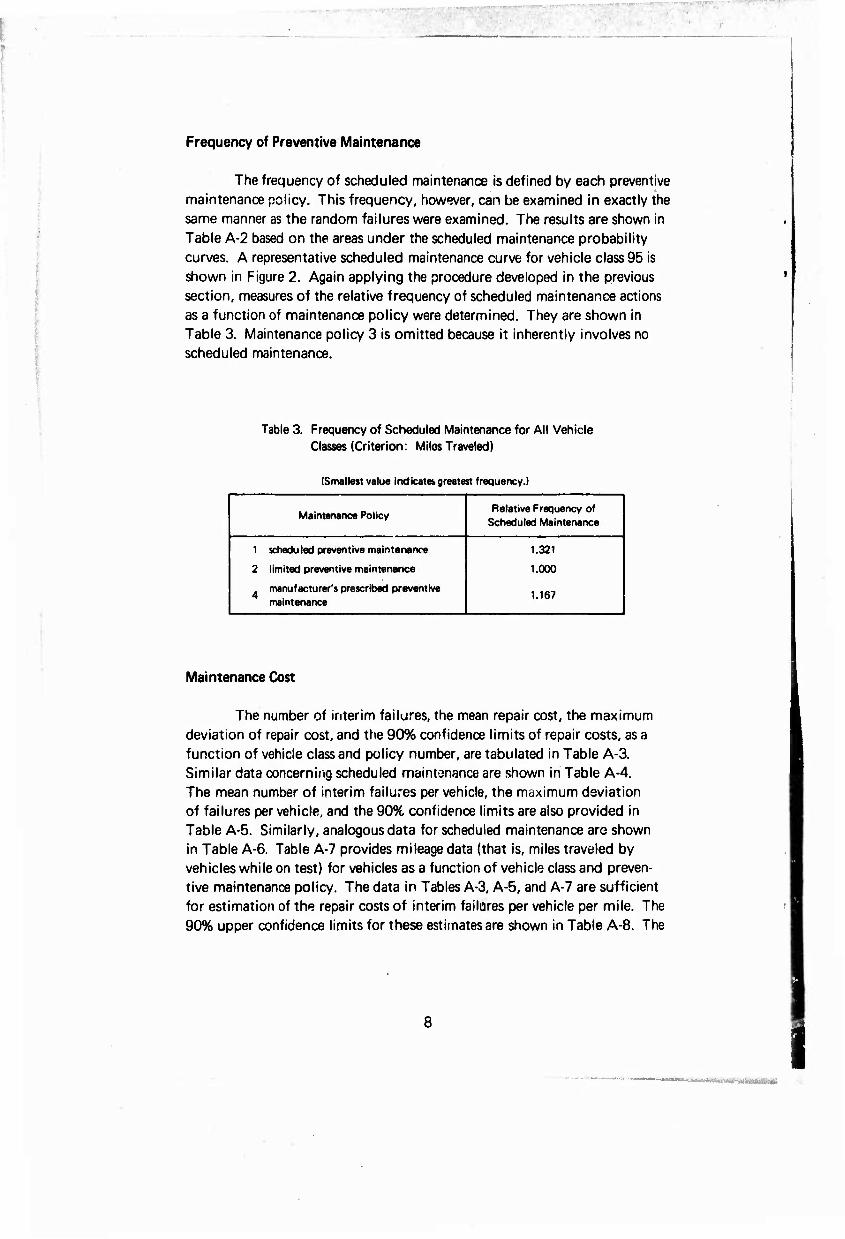
The frequency of scheduled maintenance is defined by each preventive maintenance policy. This frequency, however, can be examined in exactly the same manner as the random failures were examined. The results are shown in Table A-2 based on the areas under the scheduled maintenance probability curves. A representative scheduled maintenance curve for vehicle class 95 is shown in Figure 2. Again applying the procedure developed in the previous section, measures of the relative frequency of scheduled maintenance actions as a function of maintenance policy were determined. They are shown in Table 3. Maintenance policy 3 is omitted because it inherently involves no scheduled maintenance.
Table 3. Frequency of Scheduled Maintenance for All Vehicle Classes (Criterion: Miles Traveled)
(Smallest value indicates greatest frequency.)
Maintenance Policy Relative Frequency of
Scheduled Maintenance
1 scheduled preventive maintenance
2 limited preventive maintenance
manufacturer's prescribed preventive maintenance
1.321
1.000
1.167
Maintenance Cost
The number of interim failures, the mean repair cost, the maximum deviation of repair cost, and the 90% confidence limits of repair costs, as a function of vehicle class and policy number, are tabulated in Table A-3. Similar data concerning scheduled maintanance are shown in Table A-4. The mean number of interim failures per vehicle, the maximum deviation of failures per vehicle, and the 90% confidence limits are also provided in Table A-5. Similarly, analogous data for scheduled maintenance are shown in Table A-6. Table A-7 provides mileage data (that is, miles traveled by vehicles while on test) for vehicles as a function of vehicle class and preven- tive maintenance policy. The data in Tables A-3, A-5, and A-7 are sufficient for estimation of the repair costs of interim failures per vehicle per mile. The 90% upper confidence limits for these estimates are shown in Table A-8. The

._.,.-.,„r „._---,.-
number of vehicles per policy and the number of events are taken into consideration so that equal weighting is given each vehicle and each failure. Therefore, it is reasonable to compare these numerical cost values as values of merit of the different vehicle classes and maintenance policies as a func- tion of interim failure repair costs. In a similar manner, the data of Tables A-4, A-6, and A-7 provide a means of estimating the cost of scheduled main- tenance action per vehicle per mile and are summarized in Table A-9. As with the cost estimates for interim failure repair, these estimates of costs of scheduled maintenance take into account both the number of scheduled maintenance actions and the number of vehicles assigned. Therefore, these are reiativeHJadicators of the scheduled maintenance action cost as a function of vehiclAftJpwid policy number. ^ W1*
Ptfa^tJebles A-8 and A-9 provide a means of detenoipifig'the least costly maintenance policy for each independent vehicle class witlCregaÄ to scheduled maintenance and interim failure repair cost. A relative rrteartjre of cost has also been obtained by selecting the smallest cost per vehicle per mile within each vehicle class and dividing this number into each cost per vehicle per mile of each other vehicle in that class. This has been done for both preventive maintenance and interim failure cost. The results are shown in Table A-10.
1,000 2,000 Miles, M
3,000 4,000 5,000
Figure 2. Probability of no scheduled maintenance actions versus miles for vehicle class 95.

Table A-11 shows the total maintenance cost per vehicle per mile as a function of vehicle class and maintenance policy. Relative cost values are obtained as described previously. Through inspection of these relative cost values it is possible to identify, within each vehicle class, the least costly preventive maintenance policy.
Table A-12 shows the sum of maintenance cost per vehicle per mile over all vehicle classes as a function of maintenance policy. Computation of relative cost values revealed that maintenance policy 3 (that is, the break- down policy) is least costly. However, these data are taken from the shop repair orders for interim repairs only and do not include the cost of putting some vehicles of policy 3 back into operation at the end of ttojludy. Esti- mates r«ceMtf ••m the maintenance shop indicate that $lMJHv4ll be required to4£||r vehicles under policy 3 before they can bmätfcreiurned to dufe fie total maintenance cost under policy 3 based ontnemean costs in TaMi A-3 is $21,819.37. An additional $15,000 would increase the total cost by 68%. To effectively evaluate the four policies, the relative mainte- nance cost for policy 3 is increased by 68%, and the result is shown in Table A-12. This is considered a more realistic indication of the relative maintenance cost of policy 3, since it takes into account the need to keep vehicles operational.
The adjusted section of Table A-12 shows that for every dollar spent on vehicles of policy 2, $1.87 is spent on vehicles of policy 1, $1.05 spent for policy 4, and $1.39 spent for policy 3. The derivation of these values takes into account the number of vehicles assigned to each maintenance policy, the degree of utility of these vehicles during the test, the number of failures, and the number of scheduled maintenance actions occurring. In other words, these relative values are weighted to account for the differences in sample size; therefore, they are reasonable relative indicators of mainte- nance cost.
One fact should be mentioned at this point. The purpose of scheduled or preventive maintenance is to reduce interim breakdowns (that is, random failure) and to extend the useful life of the vehicle. The expected life of a vehicle of class 94 (light truck) under preventive maintenance has been found to be about 6 years or 72,000 miles. Class 94 vehicles assigned to policy 3 (the breakdown policy) have traveled an average of 17,700 miles during this test; this is less than i/4 of the expected life. The data show quite conclu- sively that vehicles of policy 3 have a greater frequency of interim failures as test time increases and that the cost per repair of interim failure increases with time. Even though the degree to which this will occur is not known, the trend is clearly evident from the data obtained thus far.
10

^,mH'-¥W"iimmi >»IIIII<W '''*' |.|H«|I» i «-
—.F I 'T ..m II.I,III,I»PIIHH.«
Availability
Confidence interval estimates of time loss per vehicle for repair of interim failures and time loss per vehicle for performance of scheduled main- tenance, along with the supporting data from which these confidence intervals were computed, are shown in Table A-13. Similarly, confidence interval esti- mates of labor time per vehicle for repair of interim failures and labor time per vehicle for scheduled maintenance are shown in Table A-14. Table A-15 illustrates the approximate total time loss per vehicle due to maintenance actions (both interim and scheduled maintenance). Table A-16 shows the approximate total labor hours per vehicle required for maintenance.
A relative measure of the influence of maintenance policy upon labor time is obtainable by identifying the smallest upper confidence limit estimate of labor time within each vehicle class and dividing this number into each upper confidence limit estimate for vehicles within that class. When the same proce- dure is followed to obtain a relative indicator of the influence of maintenance policy upon shop time, the results show that for every hour of labor time per vehicle on policy 4, vehicles of policy 3 require 2.065 hours labor, those of policy 2 require 1.702 hours labor, and those of policy 1 require 1.469 hours labor. Shop time in reality represents vehicle unavailability as a function of either scheduled maintenance o-- interim maintenance and maintenance policy number.
The data in Table A-11 are summed to arrive at comparative unavail- ability values for the four maintenance policies. The results are shown in Table 4.
Table 4. Relative Unavailability, Based on Maximum Up-Time Requirement
(Largest value Indicates greatest unavailability.)
Maintenance Policy Relative
Unavailability
1 scheduled preventive maintenance
2 limited preventive maintenance
3 breakdown maintenance
manufacturer's prescribed preventive maintenance
2.37
1.00
1.55
1.02
11

" :^--"-^ -■-."':»-^w^^'.^.i.;i.l'^".>' ^■r~*^'-'Trv~tw}^puw.'iwV.A'''-'Wli*'^^T*i'T™*^'-'-u)w '-'^
These data show that for every hour of unavailability of a vehicle of maintenance policy 2, a vehicle on maintenance policy 3 is unavailable 1.55 hours, a vehicle on policy 1 is unavailable 2.37 hours, and a vehicle on policy 4 is unavailable 1.02 hours. These estimates are realistic relative measures because each vehicle and each repair is weighted equally.
Availability as considered here is estimated under the assumption that vehicles are required constantly. If this is not the case and vehicles are required only during a part of each day, scheduled maintenance actions could be performed when the vehicle is not needed. Repair of interim fail- ures (breakdowns), on the other hand, must be accomplished when they occur, and they cannot occur unless the vehicle is in operation. For this reason, relative unavailabilities, computed the same as discussed above with the exception that shop time for scheduled maintenance is omitted, are again estimated. These estimates of relative unavailability as a function of maintenance policy are shown in Table 5.
Table 5. Relative Unavailability, Based on a Limited Up-Time Requirement
(Largest value indicates greatest unavailability.)
Maintenance Policy Relative
Unavailability
1 scheduled preventive maintenance
| 2 limited preventive maintenance
3 breakdown maintenance
manufacturer's prescribed preventive maintenance
1.000 |
1.148
2.649
1.293 \
The relative unavailabilities shown here do not include an estimate of time which will be required to make some vehicles of policy 3 operational again. This could be predicted accurately only if the program were to con- tinue and time for repair were recorded.
RESULTS
Four maintenance policies were analyzed during the course of this study to compare cost effectiveness. Relative measures of reliability, main- tenance cost, and availability have been developed and presented individually. These are summarized in Table 6.
12

Table 6. Summary of Measures of rteliability, Maintenance Cost, and Unavailability
Maintenance Policy
Relative Reliability"
Relative Maintenance
Cost*
Relative Unavailability
Assuming Maximum Up-Time
Requirement
Assuming Less Than Maximum Up-Time
Requirement
Col(l) Col (2) Col (3) Col (4)
scheduled preventivu maintenance
2 limited preventive maintenance
3 breakdown maintenance
manufacturer's prescribed preventive maintenance
1.112
1.000
1.026
1.311
1.870
1.000
1.390
1.050
^.370
1.000
1.550
1.020
1.000
1.148
2.649
1.293
b Smallest value indicates least desirable ranking. Smallest value indicates most desirable ranking.
Two measures of unavailability have been developed to demonstrate the influence that vehicle use has on the comparison of effectiveness. Column 3 of the table, which assumes that vehicles are required on a 24-hour basis, includes scheduled maintenance as a detriment to vehicle availability. Column 4 does not include scheduled maintenance, 3nd unavailability is based solely on unexpected maintenance (interim failures), since it is assumed that sched- uled maintenance could be programed at times when vehicle down-time would not interfere with transportation needs.
In general, the study results show that maintenance policy 4, which is the manufacturer's suggested policy, is the most cost effective. The data in Table 6 show that policy 4 provides the highest degree of reliability at a mea- ger maintenance expense, and with little down-time required. In other words, it is the one policy of the four which does not have a serious drawback that detracts from its overall effectiveness. Maintenance policy 1, on the other hand, has an extremely high preventive maintenance cost as its primary draw- back. Policies 2 and 3 result in lower vehicle reliabilities. In addition, policy 3 (the breakdown policy) possesses a high degree of relative unavailability. This unavailability would tend to grow rapidly, and the reliability would decrease if tests were to continue, since the results are based on equipment
13
.'

which was operated for only 1/4 of its total life cycle. Vehicles under maintenance policy 3 had an accelerating rate of breakdowns as accumu- lated mileage increased.
Whatever the utility of a vehicle, it is desirable to have a maintenance policy which yields maximum reliability and availability at minimum cost. If all three factors are considered to be of equal weight for comparison purposes, the following relationship can be used to compare the relative effectiveness (E) of the four maintenance policies:
_ _ (relative unavailability)(relative maintenance cost) relative reliability
This relationship is an arbitrary, dimensionless value of merit. It is merely a means of combining the three effectiveness factors (reliability, maintenance cost, and unavailability) into one value of merit to provide a relative ranking of the four maintenance policies. Applying this relationship to the data (assuming maximum up-time requirement) yields the values shown in Table 7.
Table 7. Relative Effectiveness (E) of Four Maintenance Policies, Based on Maximum Use
(Smallest E value represents most effective policy.)
Maintenance Policy E Value
1 scheduled preventive maintenance
2 limited preventive maintenance
3 breakdown maintenance
manufacturer s prescribed preventive maintenance
3.985
1.000
2.099
0.816
If it is assumed that vehicles are required at less than maximum up-time, the effectiveness factors are as noted in Table 8.
Comparison of Tables 7 and 8 brings out one interesting feature of the breakdown policy versus preventive maintenance policy. Table 8, based on the assumption that repair time can be scheduled as needed without hin- dering operations, shows that a "breakdown" policy is extremely undesirable. In Table 7, which assumes that vehicles are required constantly (such as in combat operations), the breakdown policy becomes more desirable than a
14

■
high degree of preventive maintenance. In either case, however, both policies are not as desirable as a limited amount of preventive maintenance, such as that prescribed by the manufacturer's recommended policy.
Table 8. Relative Effectiveness (E) of Four Maintenance Policies, Based on Limited Use
(Smallest E value represents most effective policy.)
Maintenance Policy E Value
1 scheduled preventive maintenance
2 limited preventive maintenance
3 breakdown maintenance
. manufacturer's prescribed preventive 4
maintenance
1.681
1.148
3.588
1.035
Whatever the means of comparison, the results of this study prove that for the equipment analyzed in this study, it is not desirable to adopt a maintenance policy which goes to extremes with regard to preventive maintenance. Too much preventive maintenance results in a high relative maintenance cost, while a policy of no preventive maintenance results in low reliability and a high unavailability factor. The optimum approach provides a moderate degree of maintenance, as exemplified by policy 4, the manufacturer's recommended policy.
Table A-17 lists the total number of vehicles currently in use by the Navy in each of the vehicle classes (91 through 96) analyzed in this study. In addition, the repair costs for each vehicle experienced during the 3-year duration of this study are recorded. Comparison of the total 3-year repair costs of maintenance policies 1 and 4 yields the results shown in Table 9.
Table 9 shows a difference of $17.7 million in maintenance costs between policies 1 and 4 for a three-year period. A change from preventive maintenance (policy 1) currently in effect at Naval facilities to manufac- turer's prescribed maintenance (policy 4) would result in savings of $5.9 million per year on vehicle classes 91 through 96, alone. Even greater savings could result from review of policies on equipment in other vehicle classes if this resulted in reducing the amount of preventive maintenance performed on them.
15

■■
Table 9. Vehicle Fleet Maintenance Cost for a 3-Year Period Under Maintenance Policies 1 and 4
j Vehicle Vehicle Fleet Maintenance Cost,
Policy 1 ($ Million)
Vehicle Fleet j Maintenance Cost,
Policy 4 ($ Million) ! Class Description
91
92
93
94
95
96
bus
sedan
carry-all or station
wagon
light truck (1/4 to 1 ton)
medium truck (1-1/2 to 2-1/2 tons)
heavy truck (over 2-1/2 tons)
18.3
4.5
3.0
427.5
5.9
39.2
9.0
5.4 |
4.1 I
434.9 |
4.2 1
23.1 1
Total 498.40 480.70 i
FINDINGS
1. Regardless of the equipment availability requirements, policy 4 (manufacturer's prescribed preventive maintenance) results in the highest relative reliability with the smallest downtime and maintenance cost and has been found to be the most cost effective.
2. In spite of the fact that policy 1 (scheduled preventive maintenance) requires the greatest expenditures for maintenance of the four policies compared, it does not produce the greatest equipment reliability.
3. Policy 2 (limited preventive maintenance) has the lowest maintenance cost, but it also results in the lowest vehicle reliability.
4. Policy 3 (breakdown maintenance 'jervice) is not a satisfactory policy because of attendant low reliability and availability and the high cost of ultimately restoring inoperable equipment to service.
16
^w^MirriiriiMi-iMiiit.rntini TY '^^imBffifjfflW^

T>-V>7«™-' - ■ ■'■ '■ --wwipt 'i^n^f^'^'ryfwmiffTWV^r.rr'^*^^^' v^nr^wwr-™
tKnH<mtm*»tauL u j«fci.»"i -
RECOMMENDATIONS
Based on the results of this study, it is recommended that:
1. Policy 3 (breakdown maintenance) not be adopted for Navy vehicular equipment because of ultimately high costs and low reliability.
2. The preventive maintenance policies currently in effect (described in NAVDOCKS P-300 Management of Transportation Equipment) be revised to require that manufacturer's recommended or prescribed maintenance procedures be followed.
3. A survey of all NAVFAC vehicle repair facilities be conducted to analyze repair data and determine effectiveness of their maintenance policies.
4. Recommendations be made on improving maintenance procedures and facilities to reduce operating costs.
17

Appendix
TABULATED RESULTS OF NAVY TRANSPORTATION EQUIPMENT STUDY

w,,ffi,)^ip..,Wjai:,.pWW>^^
Table A-1. Relative Vehicle Reliability as a Function of Preventive Maintenance Policy and Vehicle Class (Criterion: Miles Traveled)
Vehicle Maintenance
Policy" Areas Under the Curve*
Relative Reliability*7
Class Description
. 1 1,094.6 1.098
91 bus 2 1,086.2 1.089 3 997.5 1.000
-' 4 1,556.9 1.562
1 2,040.8 1.919
92 sedan 2 3
1,063.7 2,004.3
1.000 1.884
4 2,509.0 2.359
93 carry-all
or station
1 2 3
1,512.2 1,601.2 1,526.3
1.000 1.059 1.009
4 2,043.8 1.352
1 1,049.8 1.136
94 light truck
(1/4 to 1 ton) 2 3
980.8 923.7
1.062 1.000
4 1.197.8 1.297
1 626.4 1.000
95 medium truck 2 749.5 1.197
(1-1/2 to 2-1/2 tons) 3 1,022.1 1.632 4 787.5 1.257
1 591.1 2.332
96 heavy truck
(over 2-1/2 tons) 2 | 3
334.5 253.5
1.319 1.000
4 602.5 2.377
a Policy 1—scheduled preventive maintenance Policy 2—limited preventive maintenance Policy 3—breakdown maintenance Policy 4—manufacturer's prescribed preventive maintenance
b Represents probability of vehicle failure versus miles: from m = 0 to m = 6,000
c Largest value indicates greatest reliability
19

;
Table A-2. Relative Frequency of Scheduled Maintenance Actions as a Function of Maintenance Policy and Vehicle Class (Criterion: Miles Traveled)
Vehicle Maintenance
Policy" Areas Under the Curve*
Relative | Frequency
of Scheduled Maintenance' 1 Class Description
1 3,205.1 1.444 I
91 bus 2 2,984.5 1.344 j 4 2,219.8 1.000 j
1 3,499.5 1.329 \ 92 sedan 2 2,632.3 1.000 j
4 4,933.6 1.874
carry-all 1 3,134.2 1.000 } 93 or station 2 3,443.8 1.099 |
wagon 4 4,611.9 1.471 1
94 light truck
(1/4 to 1 ton)
1 2 4
3,442.9 2,368.6 2,880.8
1.454 1.000 | 1.216 |
1 95 medium truck (1-1/2 to 2-1/2 tons)
1 2 4
2,359.8 2,128.7 2,356.6
1.109 j 1.000 1.107 S
96 heavy truck
(over 2-1/2 tons)
1 2 4
2,880.8 2,991.2 2,394.4
1.203 | 1.249 1.000
" Policy 1—scheduled preventive maintenance Policy 2—limited preventive maintenance Policy 3—breakdown maintenance Policy 4—manufacturer's prescribed preventive maintenance
b Represents probability of no scheduled maintenance action versus miles: from m = 0 to m = 6,000
c Smallest value indicates greatest frequency.
20
«mmmm

,»., ....■w..»l-ll.ifWlJ,IWI|IIW) wnm'w ' ■"' ' '■ ' 'wm'*'!*11*-91-^' '■
.i5_
I« I
t: *- «ä
O 0) 11 ^ = 5,2 (O co
ml
8 h s .s
s
u '£ v >
<J
ronS 3jn«S »«r9w Sir>in<- ^r ri •-■ cd d * w (d —' in fi <-* «-' CM" CM"
to t- T-
CN Ifl
(0 (o r> o " N oo ■ K tri PW (Nr^oor~ oSSno
«■-0)0
ttfS vin'-co oo in gi Q <pinr»Q o co in oi CM <o co in
i».' Q' d o< cd oj id r>- >* CN iß ^ tf ^ (C to odd od ri cri od »r
— CO — CN ^nt-e»)'^• o^n— TJ m en a oifiNf» o) oo m m f>»l>.^0) OOOr^O) COCMf^'- ^-OOCNtO Mftor^ 0>«OlO
in (O rt <o oi r-' ts." ri r « I«. i-f-CNCN «-CM*
'-■ <d t-" ol d 0> CN <N CO Si
«JlßdlO OJCNOiPJ ts >- M (o m n in
<D on r^ m (a g> r- a 5 — <o<o öiono rot^«>- COMCNOO r* to at tn «0)9(0 VCMNCO Moovr^ CONN« »- M <- »- S" SO E d cJ 9' d d d K in 00 <«< rj ^ pj c«< d K —' pi K v" K COPJP) i-t-CSCM t-»-rslN — — — — .- ^ (M^^^
^ 5 fJ 8 ft CN in * 9!P5«^ oSI83 §^SS SSSS - • - - ^ (^i,_ ^ r- r^ r» rv
•-CNIPJ* -(NP)<1- — tNP)9 — MP)9- ■-tSP)* "-CMCOTT
D J3
_ C « .2
sir o o
Jt o O "
f o §5
E (N
■3 2
IS
§5!
n
CM O)
CO O) 0)
10 0) g
> c a
i a
I I •- CN
o o o ü
Ö Ö Ö Ö a. a. a. a.
21

i §u § x a 5 y
r« •- cs in <o m gooW
M * (v CM (O t^ « *' d
n rv co O) oq * CM pj <-•
8 CM CM t>» oo
00 00 (*■'
3 (Q m w 35 (O in co p-i
2&S n d in CM •- —
in r>. CM g> 5 0) in ^; p» o oq in r»- rf3 P» !ß P"- •-' ^ M CM m M
pi a in •- co <D to 0) in oo in oo S" cd d CM CO CM
n CM <- CM
^ ^t 0) 3 •- t oo in •- co o en
^ *' ^ a s° s
10 „ >- c
2 P o. s oc <
0)
ills
If
u
>
U
Sin in co oo
£58 So i- in 3 p-
O) •- M in oi «5 in cd in cd ci m r- fi ht
S8S M- CM 04 rv CM <D
O 0) <- ■- 1^ 0)
o> to in 00 (O 1^ CM r-- d t- CM CM P« ■- CM
8 3CN tO T 00 --tOC» 0 10 5 OO tOCM>- 005O> 0)«-M
3 CM r-- TT to (6 d to d d <-■ d ^■«MCN «N •- CM « CM«-«
8o CM g> 3 r^ O) o) CO
in to d M ^ CM CN •- P- t- CM
to in CSt QOQI^ P^COCO CON CMCO<- «--r^
CN CO IN o n in j-
■-CN* «-CNf r-CM^l- r-CN^t .-CMt —CN*
ill 8 S i
«2
O) ^
c ^ 2 Ü . 3 CN
IS
O) CM CO 5 s
0) u
11 5 I
c I <u a
Ilia
1 SI, hi o o o o
Q. O. 0. O.
11 a E
I
22

puminw'..■■'.■: ujiwuypuji, JI , .i:».jimmmmiimsmwr^^vtipmmrmi' > .ijiuimiiuuuuw
**!**•**?
s o
> V 0-
LL
12 te in <r ir) ^r oo in en o ?58S18 >- oo in oo >- S iv rv CM in o oo 01 CN CD 00
Lim
i of
re
s
-.-oor^ r<. ia 3) <- n CM iv oo |v CM CM CM
D ^ 5 § S ? J^ ^ ^ ^RiSS in in <d in (Si od od ^ ä S 3 8 -, 5 D Ä
fkte
na
Nu
mb
m F
ail
Veh
ic
c it C S;
ö«|5 1 « io<-inM csoo'-o oo O) 1- in oo CM ^ r- « in CM a d d <-' d CM •-■ CM- CO
IV CM CM in
§ ^ " § oo <o •- a> CMr^cso) (d (v- r>: ^ ri M in Tt
<N m CJ> ^• to rJ ri od
p O) r~; -^ rv »r rv' oi
-1 M CM C1 .-
ir?P a
IV Sj f"; O q in M- 00
o n CM oo iv (D 00 iv S ^ S C <B •- n 0)
CO O) 0> CO ^r in co iv
imi
tic
be
i er
ii - £ ^ <o O iv ^. in •- •- rv co 05 oo 1 N «- W a 3 -S! ^ cs in r>- (D t (M 00
g S E c ' 5 > ■-■ oi P» t' (Ö (a oo' (d (D d iri r» C (M CM d rv' in T' in od rv' o) (b
i2|£l Ll — — CM >-
F 4~ a
iili .a ■£ 8S8co 8888 Q n <0 Q o n 35 o in in <- in
'» in oo iv <P (v o o © in o o 00 — Q t
CN IV ö ^
« -i a - > ScNffico O^-^lK oq n to in iv ^ 0) M <t in o rv 5 e s » SSj^i^S l,5a5-'2 p»' oi od P> CM- ri pj ri iv <» iri iv cd in d d
! 3 - U. »— ^ »— T- r- ^^ »- T- ^ CM ^
1 Z
h -CMtO^t «-CMCO* •- CM m ^■ •- CM O fl- ■- CM CO * <- CM CO * l c o 1 '5 "■
5
2 — 1 c g _ c «I o p |^
in
«1 a
1 Q
- 1 E 5
» CM
!£ m >
§ r- CM n a in <ü U 0> o> O) 0) O)
> ai *-« o r c IO c s
s a v
>
c '5 E c
0)
1
h-
> c a c i 1i a (i> c
3 a * D
|
■n
l 1 3 C m
bi .0 E ] 1
CM cl ^t > > > > U O .y .y O n 0 n a. a. 0. Q.
23
• :'^'t< tfhimiiHiMt

I
E 'S te 1 8 fe C O t 13 C <n U .t '5 3 • B C •= * .a z -6 c -2 "6 | s « « « t; > 2 G €"5 5 <
a k 11 2
>
•"(Mlfi r»COQ "-OICM *" h '". "", ^ • * W M ö cd r^ r^odö QO od o>
S^S 288 S85 <o i>- m o CM in <d «5 ^
RSS 28§ gJSS 51138 d oi in dM r-- C^ r-- K *' ^r *
— oo <o m a in d d d N "• '-■
* <r ^ in iri ad (0 CO 10
m "»" cJ d <" r«-* rJ
Q <o CM US tv (D CM «O •- oi »-• ri
828 9 co n cd rt rJ
8 8 8 8 8 8 CM CM in o •- O ID t" •-■ oi «d <d m o oo
II in iri
(8 !n 8 S 8 8 •- •- cd vi 'd n
<-CNt •-N^' "-CM^ •-CN'« --CM* "-{Mn
_ c •5.2 c
Ss1 ^ s
Is
c» M CO
O) m (3) $
(0 «^ c c
I i a) *;
(Q o
£ i
a 2
H M I I I
•- CM
c a K 11 11
h o o a. a. o o a. a.
24

" "TOfW— ■ -—»-Hl»"' ■■ ■■. ■ i i n-T.» vin m» ' i^.ipn^
Table A-7. 90% Confidence Limits for Miles Per Vehicle
Maximum Deviation of Mileage Per Vehicle
90% Confidence 1 Vehicle
Maintenance Policy"
Number of Vehicles Assigned
Mean Mileage
Per Vehicle
Limits of Mileage Per Vehicle
Class Description Upper Lower
1 4 44,637 15,192 57,132 32,142 1
I 91 bus 2 4 39.954 19,379 55,893 24,015 3 4 48,533 19,691 67,234 29,832 4 6 36,229 23,928 52,298 20,160
1 3 27,466 25,257 51,454 3,478
»2 sedan 2 6 16,861 9,166 23,017 10,705 3 5 35,934 27,085 55,860 16,008 4 4 38,599 29,032 62,478 14,720
93 carry-all or station
1 2
5 3
17,903 34,073
19,141 34,014
31,984 66.377
3,822 1,769
3 3 38,369 29,877 66.744 9,994 wagon
4 2 49,078 1,242 50.523 47,633
1 55 15,108 12,396 17,858 12,358
94 light truck
(1/4 to 1 ton) 2 3
58 54
15,171 14,246
10,744 9,450
17,492 16.361
12,850 12,131
4 56 17,369 12,682 20.157 14,581
1 6 5,929 6.228 10.112 1,746
95 medium truck
(1-1/2 to 2-1/2 tons) 2 3
7 5
4,881 6,328
3.393 2,967
6.991 8.511
2,771 4,145
4 5 11,276 9,679 18.397 4.155
1 7 13,559 9,840 19.677 7,441
96 heavy truck
(over 2-1/2 tons) 2 3
7 7
13,403 19,336
10.150 32,513
19.714 39.551
7,092 12,298
4 7 15,278 9,978 21.482 9,074
Policy 1—scheduled preventive maintenance Policy 2—limited preventive maintenance Policy 3—breakdown maintenance Policy 4—manufacturer's prescribed preventive maintenance
25

' ■
Table A-8. Interim Failure Repair Cost
Vehicle
Maintenance Policy"
Upper 90% Confidence Limits Mean
Mileage Per Vehicle
Repair Cost Per Vehicle Per Mile
at Approximately 90% Confidence
Level ($) Class Description
Cost to Repair Per Failure ($)
Number of Interim Failures
Per Vehicle
1 67.07 46.15 44,637 0.06934
91 bus 2 3
43.07 40.63
44.14 49.85
39,954 48,533
0.04758 0.04173
4 43.30 30.74 36,229 0.03674
1 18.74 14.78 27,466 0.01008
92 sedan 2 19.65 12.55 16,861 0.01463 3 26.21 17.59 35,934 0.01283 4 27.78 16.10 38,599 0.01159
carry-all or station
1 14.08 12.32 17,903 0.0U969
93 2 3
22.95 35.09
22.08 33.39
34,073 38,369
0.01487 0.03054
wagon 4 54.00 26.55 49,078 0.02921
1 14.96 15.11 15,108 0.01496
94 light truck
(1/4 to 1 ton) 2 3
14.15 16.37
15.88 16.75
15,171 14,246
0.01481 0.01925
4 15.30 15.78 17,369 0.01390
1 20.40 12.32 5,929 0.04239
95 medium truck 2 6.78 8.25 4,881 0.01146
(1-1/2 to 2-1/2 tons) 3 10.65 8.70 6,328 0.01464 4 18.49 11.88 11,276 0.01948
1 33.32 29.79 13,559 0.07321
96 heavy truck
(over 2-1/2 tons) 2 3
23.66 18.88
26.22 44.28
13,403 19,336
0.04629 0.04324
4 24.35 30.28 15,278 0.04326
' Policy 1—scheduled preventive maintenance Policy 2—limited preventive maintenance Policy 3—breakdown maintenance Policy 4—manufacturer's prescribed preventive maintenance
26

JJUDIPHHIW! »nwmn UlliiU nil l.,IHLI|lll|IH|l»»,Wi|jWl^jU..mH»].>.W'IP"*l I I .1 I.'""»!'!» <m
Table A-9. Scheduled Maintenance Action Cost
Vehicle
Maintenance Policy"
Upper 90% Confidence Limits
Mean Mileage
Per Vehicle
Scheduled Maintenance
Cost Per Vehicle Per
Mile at Approximately 90% Confidence
Level ($)
Class Description
Cost Per Scheduled
Maintenance Action ($)
Number of Scheduled
Maintenance Actions Per
Vehicle
91
92
93
94
95
96
bus
sedan
carry-all or station
wagon
light truck (1/4 to 1 ton)
medium truck (1-1/2 to 2-1/2 tons)
heavy truck (over 2-1/2 tons)
1 2 4
1 2 4
1 2 4
1 2 4
1 2 4
1 2 4
47.55 35.47 27.72
37.90 7.84
21.59
28.69 8.99
30.55
22.81 13.58 22.86
34.84 9.54
14.19
124.84 18.01 29.94
20.11 18.72 17.15
17.17 8.73
10.60
8.91 18.39 9.32
6.38 7.47 5.53
3.18 2.90 5.33
6.55 6.06 4.44
44,637 39,954 36,229
27,466 16,861 38,599
17,903 34,073 49,078
15,108 15,171 17,369
5.929 4,881
11,276
13,559 13,403 15,278
0.02142 0.01662 0.01312
0.02369 0.00406 0.00593
0.01428 0.00485 0.00580
0.00963 0.00669 0.00728
0.01869 0.00567 0.00671
0.06030 0.00814 0.00870
Policy 1—scheduled preventive maintenance Policy 2—limited preventive maintenance Policy 3—breakdown maintenance Policy 4—manufacturer's prescribed preventive maintenance
27

———————— i • , " • , '
Table A-10. Relative Scheduled and Interim Maintenance Cost as a Function of Maintenance Policy for Each Vehicle Class
(Computed using 90% upper confidence limits of cost per vehicle.)
Vehicle
Maintenance
Policy*
Relative Scheduled
Maintenance Cost Per Vehicle
Per Mile*
Relative Interim Failure Repair
Cost Per Vehicle Per Mile* Class Description
1 1.6326 1.8873
91 bus 2
3
1.2667 1.2950 1.1358
4 1.0000 1.0000
1 5.8350 1.0000
92 sedan 2 3
1.0000 1.4514
1.2728 4 1.4606 1.1498
93 carry-all or station
wagon
1 2 3 4
2.9443 1.0000
1.1959
1.0000 1.5346 3.1517 3.0144
1 1.4395 1.0763
94 light truck
(1/4to1 ton) 2 3
1.0000 1.0655 1.3849
4 1.0882 1.0000
1 12963 3.6990
95 medium truck
(1-1/2 to 2-1/2 tons) 2 3
1.0000 1.0000 1.2775
4 1.1834 1.6998
1 7.4079 1.6931
96 heavy truck
(over 2-1/2 tons) 2
3
1.0000 1.0705 1.0000
4 1.0688 1.1161
Policy 1—scheduled preventive maintenance Policy 2—limited preventive maintenance Policy 3—breakdown maintenance
Policy 4—manufacturer's prescribed preventive maintenance
' Smallest value indicates least cost
28
«««»»«Hu^jfc^ji^

"TJrtiw^r-.i"r-i-»viv^—T^VIT"-'- ' v'-
Table A-11. Relative Maintenance Cost (Both PreventVe and Interim) as a Function of Maintenance Policy for Each Independent Vehicle Class
(Computed using 90% upper confidence limits of cost per vehicle.)
Relative Vehicle
Maintenance Maintenance
Cost Per Vehicle Per Mile ($)
Maintenance \ Cost Per { Vehicle !
Per Mile* Class Description
Policy"
1 0.09076 2.1749
91 bus 2 0.06420 1.5385 3 0.04173 1.0000 4 0.04986 1.9482
1 0.03377 2.6321 |
92 sedan 2 0.01869 1.4567 j 3 0.01283 1.0000 1 4 0.01752 1.3655
93 carry-all or station
wagon
1 2 3 4
0.02397 0.01972 0.03054 0.03501
1.2155 1.0000 1.5487 1.7754 |
1 0.02459 1.2774 1
1 94 light truck 2 0 02150 1.1169 |
(1/4 to 1 ton) 3 0.01925 1.0000 4 0.02118 1.1003 j
1 0.06108 4.1721
1 95 medium truck 2 0.01713 1.1701 (1-1/2 to 2-1/2 tons) 3 0.01464 1.0000
4 0.02619 1.7889 |
1 0.13351 3.0877
96 heavy truck 2 0.05443 1.25R8
(over 2-1/2 tons) 3 0.04324 1.0000 4 0.05696 1.3173 1
Policy 1—scheduled preventive mair.tenance Policy 2—limited preventive maintenance Policy 3—breakdown maintenance Policy 4—manufacturer's prescribed preventive maintenance
' Smallest value indicates least cost
29
:<V'^äte»£()£MääftiuUtäiM

■.■■ ' •■'■- ■"^^^T»Y.^1 ■■• ■.■-<Ty«.'>?--«t.r'"i'i~>—!■«!,>■■* »K'-^v« ■■■'■ ■"■• ■
Table A-12. Relative Cost for Both Scheduled and Interim Maintenance as a Function of Maintenance Policy (All Vehicle Classes)
| Maintenance Polic/
Maintenance Cost Per Vehicle
Per Mile ($)
Relative Maintenance
Cost Per ' Vehicle |
Per Milefr
Basic Maintenance Cost Data
1 2 3 4
0.36768 0.19567 0.16223 0.20672
2.2664 I 1.2061 ! 1.0000 j 1.2742
Adjusted Maintenance Cost Datac 1
1 2 3 4
0.36768 0.19567 0.27254 0.20672
1.8790 { 1.0000 j 1.3928 j 1.0564 |
" Policy 1—scheduled preventive maintenance Policy 2—limited preventive maintenance Policy 3—breakdown maintenance Policy 4—manufacturer's prescribed preventive maintenance
b Smallest value indicates lowest cost c Basic cost data for policy 3 increased by 68% to cover cost
($15,000) of repairing inoperable vehicles at end of study
30
^amiamis.Aitdiie^ftföj

„wmmrv'ui w nmwf'sum'n < ■MtA"jm>nh.fi.uiimww»'*mW.'"'m-"- "■•■■.l ^^Biiiii'i «■nmu'ij:i'!iiM ivn,,!^,r~:*r<-mr--
Table A-13. Confidence Interval Estimates of Time Loss Per Vehicle Due to Repair c Failures and Time Loss Per Vehicle Due to Scheduled Maintenance
Vehicle
Maintenance Poliry"
Repairs Per Vehicle Shop Time
Per Repair (hr) Mean Shot
Per Veh
Class Description Mean
Number Maximum Deviation
Mean Time (hr)
! Maximum Deviation
(hr)
(hr)
Interim
1 36.500 11.733 46.0 100.6 1,679 2 35.250 9.287 58.4 139.6 2,058
91 bus 3 43.500 7.724 62.7 178.6 2,727 4 21.333 14.009 73.0 402.9 1,557
1 9.000 6.082 18.3 30.0 164
92 sedan 2 3
8.166 11.400
6.524 8.414
20.7 3?.5
49.7 54.3
218 370
4 10.500 6.806 11.1 24.0 116
93 carry-dll or station
1 2 3
7.800 12.333 18.666
6.140 10.263 15.502
17.7 31.8 53.1
54.7 77.4
137.2
- 138 392 991
wagon 4 17.500 7.778 37.9 147.0 663
1 12.745 10.667 19.2 61.8 244
94 light truck 2 13.155 12.176 23.2 63.6 302
(1/4 to 1 ton) 3 13.981 12.358 34.6 120.5 483 4 13.375 10.937 25.6 148.5 342
1 7.166 7.678 33.4 63.9 239
95 medium truck 2 4.857 5.459 28.6 80.5 138:
(1-1/2 to 2-1/2 tons) 3 5.600 4.219 38.3 91.7 214 4 7.600 5.813 18.2 40.1 138
1 18.428 18.274 46.6 94.0 856
96 heavy truck 2 15.571 17.135 38.1 86.5 593
(over 2-1/2 tons) 3 26.000 29.393 97.1 846.1 2,524 4 19.714 16.987 27.5 81.6 542
Scheduled
1 15.250 5.909 118.8 238.1 1.811 91 bus 2 14.250 5.439 49.7 123.1 70£'
4 11.500 8.408 33.2 62.3 381
1 9.000 8.660 385.8 1.676.1 3,472 92 sedan 2 6.166 3.816 16.7 31.9 10-
4 6.000 5 597 28.2 63.9 16?
carry-all 1 5.600 4.505 46.4 41.6 25' 93 or station 2 10.000 12.489 25.1 41.6 25-
wagon 4 8.500 0.70V 37.9 65.4 32:
31

Table A-13. Confidence Interval Estimates of Time Loss Per Vehicle Due to Repair of li Failures and Time Loss Per Vehicle Due to Scheduled Maintenance
Vehicle
Maintenance Policy"
Repairs 'er Vehicle Shop Time
Per Repair (hr) Mean ShopTii
Per Vehicle (hr)
1 Class Description Mean
Number Maximum Deviation
Mean Time (hr)
Maximum Deviation
(hr)
I Interim
1 36.500 11.733 46.0 100.6 1,679.0
91 bus 2 30.250 9.287 58.4 139.6 2,058.6 3 '43.500 7.724 62.7 178.6 2,727.5 4 21.333 14.009 73.0 402.9 1,557.3
1 9.000 6.082 18.3 30.0 164.7
92 sedan 2 8.166 6.524 26.7 49.7 218.0 3 11.400 8.414 32.5 54.3 370.5 4 10.500 6.806 11.1 24.0 116.6
93 carry-all
or station
1 2 3
7.800 12.333 18.666
6.140 10.263 15.502
17.7 31.8 53.1
54.7 77.4
137.2
138.1 392.2 991.2
wagon 4 17.500 7.778 37.9 147.0 663.3
1 12.745 10.667 19.2 61.8 244.7
94 light truck 2 13.155 12.176 23.2 68.6 302.9
(1/4 to 1 ton) 3 13.981 12.358 34.6 120.5 48a7 4 13.375 10.937 25.6 148.5 342.4
1 7.166 7.678 33.4 63.9 239.3
95 medium truck 2 4.857 5.459 28.6 80.5 138.9
(1-1/2 to 2-1/2 tons) 3 5.600 4.219 38.3 91.7 214.5 4 7.600 5.813 18.2 40.1 138.3
1 18.428 18.274 46.6 94.0 858.7
96 heavy truck 2 15.571 17.135 38.1 86.5 593.3
(over 2-1/2 tons) 3 26.000 29.393 97.1 846.1 2,524.6 4 19.714 16.987 27.5 81.6 542.1
Scheduled
1 15.250 5.909 118.8 238.1 1,811.7 91 bus 2 14.250 5.439 4D.7 123.1 708.2
4 11.500 8.408 33.2 62.3 381.8
1 9.000 8.660 385.8 1,676.1 3,472.2 92 sedan 2 6.166 3.816 16.7 31.9 103.0
4 6.000 5.597 28.2 63.9 169.2
carry-all 1 5.600 4.505 46.4 41.6 251.0 93 or station 2 10.000 12.489 25.1 41.6 251.0
wagon 4 8.500 0.707 37.9 ■
65.4 322.2
31

u..., ■ m'vmimifm n :*, ■».■■■ <>. w '»ww —■ ^«„mmmw^m«' wm»* MII «w. n - ..■■- -r-^.-.-
Table A-13. Confidence Interval Estimates of Time Loss Per Vehicle Due to Repair of Interim Failures and Time Loss Per Vehicle DUG to Scheduled Maintenance
Shop Time Per Repair (hr)
90% Confidence Interval
Maintenance Policv"
Repairs Per Vehicle Mean Shop Time
Per Vehicle (hr)
of Shop Time Per Vehicle (hr)
DO Mean
Number Maximum Deviation
Mean Time (hr)
Maximum Deviation
(hr) Lower Limit Upper Limit
Interim
1 36.500 11.733 46.0 100.6 1,679.0
1.105.7 2,252.4
2 35.250 9.287 58.4 139.6 2,058.6 1,301.8 2,815.5 3 43.500 7.724 62.7 178.6 2,727.5 1,698.3 3,756.8 4 21.333 14.009 73.0 402.9 1,557.3 159.7 2,954.9
1 9.000 0.082 18.3 30.0 164.7 44.0 285.4 2 8.166 6.524 26.7 49.7 218.0 81.8 354.2 3 11.400 8.414 32.5 54.3 370.5 176.1 564.9 4 10.500 6.806 11.1 24.0 116.6 33.5 199.8
i 1 7.800 6.140 17.7 54.7 138.1 0 279.0 i
2 12.333 10.263 31.8 77.4 392.2 46.0 738.4 n
3 18.666 15.502 53.1 137.2 991.2 247.7 1,734.7 4 17.500 7.778 37.9 147.0 663.3 0 1,460.4
1 12.745 10.667 19,2 61.8 244.7 183.1 306.3 k 2 13.155 12.176 23.2 68.6 3029 232.7 373.1 on) 3 13.981 12.358 34.6 120.5 4817 357.2 610.2
4 13.375 10.937 25.6 148.5 342.4 206.2 478.6
1 7.166 7.678 33.4 63.9 239.3 60.2 418.4 jck 2 4.857 5.459 28.6 80.5 138.9 0 293.3 I tons) 3 5.600 4.219 38.3 91.7 214.5 4.7 424.3
4 7.600 5.813 18.2 40.1 138.3 28.8 247.8
1 18.428 18.274 46.6 94.0 858.7 484.4 1,233.0 :k 2 15.571 17.135 38.1 86.5 593.3 278.2 9Ü8.4 ions) 3 26.000 29.393 97.1 846.1 2,524.6 0 5,555.3
4 19.714 16.987 27.5 81.6 542.1 251.4 832.8
Scheduled
1 15.250 5.909 118.8 238.1 1,811.7 899.1 2,794.3 2 14.250 5.439 49.7 123.1 708.2 267.1 1,149.3 4 11.500 8.408 33.2 62.3 381.8 184.8 578.8
1 9.000 8.660 385.8 1.676.1 3,472.2 0 9,302.0 2 6.166 3.816 16.7 31.9 103.0 32.6 173.4 4 6.000 5.597 28.2 63.9 169.2 0 351.0
1 5.600 4.505 46.4 41.6 251.0 32.0 470.0 T 2 10.000 12.489 25.1 41.6 251.0 32.0 470.0
4 8.500 0.707 37.9 65.4 322.2 89.7 554.7
continued
31

Table A-13. Continued
Vehicle
Maintenance Policy"
Repairs Per Vehicle Shop Time
Per Repair (hr) Mean Shop Time
Per Vehicle (hr)
(
Class Description Mean
Number Maximum Deviation
Mean Time (hr)
Maximum Deviation
(hr) Low
94
95
96
light truck (1/4 to 1 ton)
medium truck (1-1/2 to 2-1/2 tons)
heavy truck (over 2-1/2 tons)
1 2 4
1 2 4
1 2 4
5.400 5.948 4.875
1.666 1.857 3.000
4.428 4.000 3.000
4.428 7.027
2.250 1.676 3.162
3.408 3.316 2.309
61.4 45.8 ^5.3
146.4 62.5 35.5
150.3 47.0 40.7
101.4 115.3 93.3
195.5 65.2 42.6
185.2 42.7 58.2
331.6 272.4 217.4
243.9 116.1 106.5
664.5 188.0 122.1
< ■
Policy 1—scheduled preventive maintenance Policy 2—limited preventive maintenance Policy 3—breakdown maintenance Policy 4—manufacturer's prescribed preventive maintenance
32

•iimi.ipw.'uuii.mi '»m impivm« > ■, AWHI HLpillMpillM'W«I^WIIIi|..p.ii|ii|PI»;»iH!lnuiiyiTJ»
Table A-13. Continued
Shop Time Per Repair (hr)
90% Confidence Interval
Maintenance Policy"
Repairs Per Vehicle Mean Shop Time
Per Vehicle (hr)
of Shop Time Per Vehicle (hr)
Mean Number
Maximum Deviation
Mean Time (hr)
Maximum Deviation
(hr) Lower Limit Upper Limit
1 5.400 4.428 61,4 101.4 331.6 253.4 409.8 2 5.948 7.027 45.8 115.3 272.4 183.2 361.6 4 4.875 - 46.3 93.3 217.4 158.6 276.2
1 1.666 2.250 146.4 195.5 243.9 0 584.5 2 1.857 1.676 62.5 65.2 116.1 13.1 219.1 4 3.000 3.162 35.5 42.6 106.5 0 220.4
1 4.428 3.408 150.3 185.2 664.5 271.8 1,059.2 2 4.000 3.316 47.0 42.7 188.0 86.4 289.6 | 4 3.000 2.309 40.7 58.2 122.1 55.5 188.7 |
8 maintenance laintenance ance crib ad preventive maint änance
32
K-tA&tAi**: ■ tmt

Table A-14. Confidence Interval Estimates of Labor Time Per Vehicle for Repair of Interii Failure and Labor Time Per Vehicle for Scheduled Maintenance
Vehicle
Maintenance
Repairs Per Vehicle Labor Time
Per Repair (hr) Mean labor Time
Per Vehicle (hr)
Class Description
Policy" Mean
Number Maximum Deviation
Mean Time (hr)
Maximum Deviation
(hr)
j Interim
1 36.500 11.733 2.2 3.5 80.3
i 91 2 35.250 9.287 2.7 3.8 95.2
bus 3 43.500 7.724 2.7 4.1 117.5 4 21.33 14.009 2.3 4.9 49.1
1 9.000 6.082 1.7 1.8 15.3
92 2 8.166 6.524 1.9 2.3 15.5
sedan 3 11.400 8.414 2.2 2.8 25.1 4 10.500 6.806 2.1 3.3 22.1
carry-all or station
1 7.800 6.140 1.3 1.3 10.1
93 2 3
12.333 18.666
10.263 15.502
1.5 2.4
1.8 3.7
18.5 44.8
wagon 4 17.500 7.778 2.1 5.7 36.8
1 12.745 10.667 1.1 2.0 14.0
1 94 light truck 2 13.155 12.176 1.2 2.1 15.8
(1/4 to 1 ton) 3 13.981 12.358 1.5 2.8 21.0 4 13.375 10.937 1.2 1.9 16.1
1 7.166 7.678 2.3 4.2 16.5
| 95 medium truck 2 4.857 5.459 1.1 1.1 5.3
(1-1/2 to 2-1/2 tons 3 5.600 4.219 1.4 1.6 7.8 4 7.600 5.813 1.4 2.3 10.6
1 18.428 18.274 2.1 3.4 38.7
96 heavy truck 2 15.571 17.135 2.1 3.6 32.7
(over 2-1/2 tons) 3 26.000 29.393 2.2 a5 57.2 4 19.714 16.987 2.3 4.0 45.3
Scheduled
1 15.250 5.909 6.1 6.7 93.0 91 bus 2 14.250 5.439 2.9 3.9 41.3
4 11.500 8.408 3.4 4.5 39.1
1 9.000 8.660 4.7 6.0 42.3 92 sedan 2 6.166 3.816 1.2 1.1 7.4
4 6.000 5.597 3.1 3.0 18.6
carry-all 1 5.600 4.505 3.6 2.8 20.2 93 c station 2 10.000 12.489 1.3 2.3 13.0
wagon 4 8.500 0.707 4.2 4.9 35.7
33

ff ".-^^w-'rw
^-14. Confidence Interval Estimates of Labor Time Per Vehicle for Repair of Interim Failure and Labor Time Per Vehicle for Scheduled Maintenance
Labor Time Per Repair (hr)
90% Confidence Interval
tenance
Repairs Per Vehicle Mean Labor Time
Per Vehicle (hr)
of Labor Time Per Vehicle (hr)
licy" Mean
Number Maximum Deviation
Mean Time (hr)
Maximum Deviation
(hr) Lower Limit Upper Limit
1 nterim
1 36.500 11.733 2.2 3.5 80.3 59.4 101.2 2 35.250 9.287 2.7 a8 95.2 73.2 117.3 3 43.500 7.724 2.7 4.1 117.5 92.7 142.3 4 21.33 14.009 2.3 4.9 49.1 29.2 68.9
1 9.000 6.082 1.7 1.8 15.3 6.9 23.7 2 8.166 6.524 1.9 2.3 15.5 8.2 22.8 3 11.400 8.414 Z2 2.8 25.1 14.1 36.1 4 10.500 6.806 2.1 3.3 22.1 9.7 34.5
1 7.800 6.140 1.3 1.3 10.1 5.3 14.9 2 12.333 10.263 1.5 1.8 18.5 8.3 28.7 3 18.666 15.502 2.4 3.7 44.8 21.4 68.2 4 17.500 7.778 2.1 5.7 36.8 4.6 69.0
t 12.745 10.667 1.1 2.0 14.0 11.7 16.3 2 13.155 12.176 1.2 2.1 15.8 13.3 18.3 J 13.981 12.358 1.5 2.8 21.0 17.5 24.5 » 13.375 10.937 1.2 1.9 16.1 13.8 18.4
1 7.166 7.678 2.3 4.2 16.5 4.5 28.5 ; 4.857 5.459 1.1 1.1 5.3 2.1 8.5 ) 5.600 4.219 1." 1.6 7.8 3.2 12.4 I 7.600 5.813 1.4 2.3 10.6 3.8 17.4
18.428 18.274 2.1 3.4 38.7 24.1 53.3 : 15.571 17.135 2.1 3.6 32.7 18.7 47.2 i 26.000 29.393 2.2 a5 57.2 38.2 76.2
19.714 16.987 2.3 4.0 45.3 28.8 61.8
Scheduled
15.250 5.909 6.1 6.7 93.0 63.9 122.1 14.250 5.439 2.9 3.9 41.3 25.8 56.8 11.500 8.408 3.4 4.5 39.1 23.2 55.0
9.000 8.660 4.7 6.0 42.3 12.4 72.2 6.166 3.816 1.2 1.1 7.4 4.3 10.5 6.000 5.597 3.1 3.0 18.6 6.8 30.5
5.600 4.505 3.6 2.8 20.2 10.3 30.1 10.000 12.489 1.3 2.3 13.0 1.2 24.8 8.500 0.707 4.2 4.9 35.7 17.9 53.5
continued
33
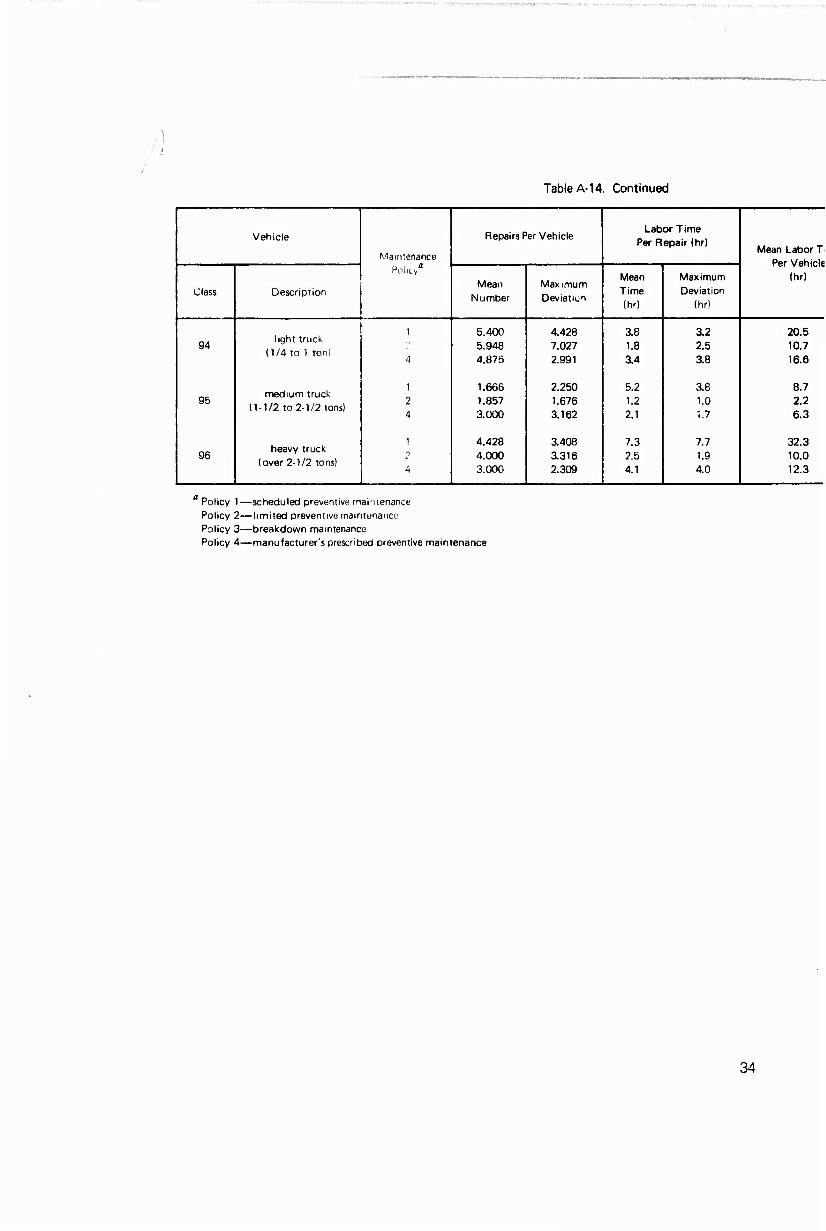
A
Table A-14. Continued
Vehicle
Maintenance Poky"
Repairs Per Vehicle Labor Time
Per Repair (hr) Mean Labor T
Per Vehicle (hr)
Class Description Mean
Number Maximum Deviaticn
Mean Time (hr)
Maximum Deviation
(hr)
94
95
96
light truck (1/4 to 1 ton)
medium truck (1-1/2 to 2-1/2 tons)
heavy truck (over 2-1/2 tons)
1
A
1
2 4
1 7
4
5.400 5.948 4.875
1.666 1.857 3.000
4.428 4.000 3.000
4.428 7.027 2.991
2.250 1.676 3.162
3.408 a316 2.309
3.8 1.8 3.4
5.2 1.2 2.1
7.3 2.5 4.1
3.2 2.5 3.8
3.8 1.0 1.7
7.7 1.9 4.0
20.5 10.7 16.6
8.7 2.2 6.3
32.3 10.0 12.3
Policy 1—scheduled preventive maintenance
Policy 2—limited preventive maintenance Policy 3—breakdown maintenance Policy 4—manufacturer's prescribed preventive maintenance
34

Piiin.iiiiiwf», .ni.iii,i.iiiii!)p.i^wiiiw.^"JWi,»iiw« •!f» •«'.'.■l|Jil^,P|BBI> IH^l) I »WMII^lf H «llr,l|,J,|l^ilJ|,fHyi|l.llllJl»!A
Table A-14. Continued
lintenance
Repairs Per Vehicle Labor Time
Per Repair (hr) Mean Labor Time
Per Vehicle (hr)
90% Confidence Interval of Labor Time
Per Vehicle (hr)
Policv" Mean
Number Maximum Deviation
Mean Time (hr)
Maximum Deviation
(hr) Lower Limit Upper Limit
1
4
1 2 4
1 2 4
5.400 5.948 4.875
1.666 1.857 3.000
4.428 4.000 3.000
4.428 7.027 2.991
2.250 1.676 3.162
3.408 a316 2.309
3.8 1.8 3.4
5.2 1.2 2.1
7.3 2.5 4.1
3.2 2.5 3.8
3.8 1.0 1.7
7.7 1.9 4.0
20.5 10.7 16.6
8.7 2.2 6.3
32.3 10.0 12.3
17.3 8.3
13.7
0 0.4 1.3
14.9 5.0 4.6
23.7 13.1 19.5
18.1 4.0
11.3
49.7 115.0 20.0
ince e
i/entive maintenance
34

. .
Table A-15. Total Time Loss Due to Maintenance Over 4-Year Study Period
Vehicle Maintenance
Policy"
Average Time Lost (hr) Per Vehicle for—
Approximate
Total Time Loss Per
Vehicle (hr) Class Description Scheduled
Maintenance Interim
Maintenance
1 1,811.7 1,679.0 3,490.7
91 bus 2 708.2 2,058.6 2,766.8
3 - 2,727.5 2,727.5 4 381.8 1,557.3 1,939.1
1 3,472.2 164.7 3,636.9
92 sedan 2
3
103.0 218.0 370.5
321.0 370.5
4 169.2 116.6 285.8
carry-all or station
1 259.8 138.1 397.9
93 2
3
251.0 392.2 991.2
643.2 991.2
wagon 4 322.2 663.3 985.5
1 331.6 244.7 576.3
94 light truck
(1/4 to 1 ton) 2
3
272.4 302.9 483.7
575.3 483.7
4 217.4 342.4 559.8
1 243.9 239.3 483.2
95 medium truck 2 116.1 138.9 255.0
(1-1/2 to 2-1/2 tons) 3 - 214.5 214.5
4 106.5 138.3 244.8
1 665.5 858.7 1,524.2
96 heavy truck
(over 2-1/2 tons) 2
3
188.0 593.3 2,524.6
781.3
2,524.6 4 122.1 542.1 664.2
fl Policy 1—scheduled preventive maintenance Policy 2—limited preventive maintenance Policy 3—breakdown maintenance Policy 4—manufacturer's prescribed preventive maintenance
35

<~^~'•■'—■■• I 1 ^JW-WT- j«,l,,pil||||]|]H,l|UIIKHP|li!l.l,i|i "*»üfH" (ifl9iws*fw^^ww??pp^yw
Table A-16. Labor Time Required for Maintenance
Vehicle Maintenance
Policy"
Average Labor Time (hr) Per Vehicle for—
ApproxiiTiate Total Labor
Time Per Vehicle (hr) Class Description Scheduled
Maintenance Interim
Maintenance
1 93.0 80.3 173.3
91 bus 2 3
41.3 95.2 117.5
136.5 117.5
4 39.1 49.1 88.2
1 42.3 15.3 57.6
92 sedan 2 3
7.4 15.5 18.6
22.9 25.1
4 18.6 22.1 40.7
93 carry-all
or station wagon
1 2 3 4
20.2 13.0
35.7
10.1 18.5 44.0 36.8
30.3 31.5 44.8 72.5
1 20.5 14.0 34.5
94 light truck 10.7 15.8 26.5
(1/4 to 1 ton) 3 - 21.0 21.0 4 16.6 16.1 32.7
1 8.7 16.5 26.2
95 medium truck 2 2.2 5.3 7.5
(M/2 to 2-1/2 tons) 3 — 7.8 77.8 4 6.3 10.6 16.9
1 32.3 38.7 71.0
96 heavy truck 2 10.0 32.7 42.7
(over 2-1/2 tons) 3 - 57.2 57.2 4 12.3 45.3 57.6
Policy 1—scheduled preventive maintenance Policy 2—limited preventive maintenance Policy 3—breakdown maintenance Policy 4—manufacturer's prescribed preventive maintenance
36
: >-«!aabt&KSüj$

Table A-17. Relative Unavailability as a Function of Vehicle Class and Maintenance Policy
(Computed at 90% confidence levels.)
j Vehicle Maintenance
Policy"
Relative Unavailability Because of—
1 Class Description Interim Maintenance
Scheduled Maintenance
| 91
I 92
1 93
j 94
| 95
96
bus
sedan
carry-all or station
wagon
light truck (1/4 to 1 ton)
medium truck (1-1/2 to 2-1/2 tons)
heavy truck (over 2-1/2 tons)
1 2 3 4
1 2 3 4
1 2 3 4
1 2 3 4
1 2 3 4
1 2 3 4
1.000 1.250 1.668 1.312
1.428 1.773 2.827 1.000
1.000 2.647 a218 5.234
1.000 1.218 1.992 1.563
1.688 1.184 1.712 1.000
1.481 1.091 6.671 1.000
4.828 1.986
1.000
53.64 1.000 1
2.024 j
1.000 1.162 |
1.372
' 1.484 1.309 j
1.000 |
2.668 1.000
1.006 |
5.613 j 1.535
i.ooo 1
Policy 1—scheduled preventive maintenance Policy 2—limited preventive maintenance Policy 3—breakdown maintenance Policy 4—manufacturer's prescribed preventive maintenance
37
■ ■■ . . ■ . ■

(i!W(W*P,(.iWi.ff.i™>pmJ»i'«-."'
■,'.■.■
^PP
Table A-18. Determination of Cost Savings Realised by Changing From Policy 1 to Pc
Vehicle Maintenance
Policy"
_
Number of Interim Failures
Mean Cost to Repair
Per Failure ($)
Total Interim Cost ($)
Number of Scheduled
Maintenance Actions
Mean Cost to Repair
Per Failure ($)
Total Scheaihud Cost 1$)
r
Class Description
1 146 59.76 8,724.96 61 44.06 2,687.66 91 bus
4 128 32.55 4,166.40 69 21.02 1,450.38
92 sedan 1 4
27 42
13.66 20.69
368.82 868.98
27 24
24.66 16.18
665.82 388.32
carry-all 1 39 10.44 407.16 28 20.81 582.68
■■ ■
93 or station wagon
4 35 28.66 1,003.10 17 20.99 356.83
94 light truck 1 701 13.32 9,337.32 297 20.90 6,207.30
(1/4 to 1 ton) 4 749 13.70 10,261.30 273 20.34 5,552.82 ■
95 medium truck 1 43 13.83 594.69 10 25.09 250.90
(M/2 to 2-1/2 tons! 4 38 11.61 441.18 15 10.92 163.80
96 heavy truck 1 129 2:1.18 2,990.22 31 73.99 2,293.69
(over 2-1/2 tons) 4 151 17.18 2,594.18 23 22.77 523.71
i
Policy 1—scheduled preventive maintenance Policy 2—limited preventive maintenance Policy 3—breakdown maintenance Policy 4—manufacturer's prescribed preventive maintenance
39
wM«*iB*BiitaMf^äi»ttwftrtpi«rtUiiia»i^(tf , -■

:rom Policy 1 tu Policy 4
ß
ost
air
e!$)
Total SchixJuied
Cost 1$)
Total
Repair Cost ($)
Per Vehicle
Number of
Vehicles in Navy
Use
Total 3-Year Fleet Repair
Cost (Million $)
I 2,687.66 11,412.62 1,604 18.3
' 1,450.38 5,616.78 9.0
i 665.82 1,034.64 4,341 4.5
1 388.32 1,257.30 5.4
582.68 989.84 2,995 3.0
1 356.83 1.359.93 4.1
) 6,207.30 15,544.62 27,504 427.5 1 5,552.82 15,814.12 434.9
1 250.90 845.59 6,939 5.9 163.80 604.98 4.2
2,293.69 5,283.91 7,437 39.2 ..i 523.71 3,117.89
50,820 l
23.1
* ■■ ■ .-■ I ■