0 update on the healthy start national evaluation secretary’s advisory committee on infant...
TRANSCRIPT

1
Update on the Healthy Start National Evaluation
Secretary’s Advisory Committee on Infant Mortality Meeting
January 24, 2008

2
Outline of Presentation
Evaluation Overview
Site visit methods and findings
Participant survey methods and findings
Use of performance measures
Lessons learned from the Healthy Start evaluation

3
Evaluation Overview The evaluation is a four-year effort
—Phase I was focused on the full universe of grantees
—Phase II is a more in-depth evaluation of a subset of grantees
The evaluation is of the national program not of individual grantee performance
Stakeholder inputs are critical to the evaluation effort

4
Participatory Evaluation Approach with Key Stakeholders
Continued input and feedback from a variety of stakeholders during Phases I and II
Healthy Start grantees—Input and feedback on findings from Phase I
—Information from all sites will be used in preparing the Phase II report (performance measures)
Healthy Start federal program staff
Healthy Start Panel (HSP)
SACIM

5
Evaluation Products
Phase 1
—Chartbook
—Benchmarks Paper
Phase 2
—Two papers submitted to MCH Journal

6
Presentations in 2007 Association of Maternal and Child Health
Programs
AcademyHealth
Healthy Start Grantee Meeting
2nd Preconception Summit
American Public Health Association (2 papers)
MCH Epidemiology

7
Phase II Evaluation Goals To obtain a more in-depth understanding of a
small group of grantee project models
To determine the methods that grantees are using to meet Healthy Start program objectives, with a particular focus on efforts that influence the system of care in the community
To learn about Healthy Start from the participant’s perspective
To reflect input and advice from HRSA, SACIM, and HSP

8
Phase II Evaluation Approach
Case studies with 8 grantees include two components:
Site visits with individual and group interviews
Survey of Healthy Start participants

9
Grantee Selection Criteria: First Stage Grantees must have completed the National Survey of
Healthy Start Programs
AND
They must have implemented all nine required components of the Healthy Start program
AND
They must track referrals to providers within and outside Healthy Start
AND
They must maintain electronic records to facilitate access to data for the participant survey

10
Grantee Selection Criteria: Second Stage
From the 26 eligible grantees, 8 were selected to reflect the following grantee characteristics:—Four U.S. census regions
—Mix of urban and rural sites
—Different funding levels
—Range in size, according to the number of live births in 2004
—At least one grantee had to be relatively close to the United States/Mexico border, if not considered an official Border grantee
—At least one site had to serve a predominantly indigenous population

11
Grantees Selected for Phase II Evaluation Fresno, California
Tallahassee, Florida
Des Moines, Iowa
East Baton Rouge, Louisiana
Worcester, Massachusetts
Las Cruces, New Mexico
Pittsburgh, Pennsylvania
Lac du Flambeau, Wisconsin
Subset not intended to be “nationally representative”

12
Site Visits

13
Goals of Site VisitsTo gain an understanding of how projects
are designed and implemented to improve perinatal outcomes
To determine which program features grantees associate with success
To explore how grantees implement culturally competent services/systems
14
Goals of Site VisitsTo understand how grantees obtain and
incorporate community voice
To ascertain grantees’ perceptions of their component strengths, accomplishments, and challenges
To assess the links between services, systems, and outcomes – test logic model

15
Site Visit Methods In-depth, individual interviews with project
director, case managers, local evaluator, clinicians, consortium members, and other stakeholders
Group interview with outreach/lay workers
Two exercises
—Relational mapping with project director
—Client flow graphing with case managers/outreach/lay workers
Document review

16
Individual Site Visit Reports Site summary reports completed for each project (Spring/Summer 2006)
Summary report contents:—Project history and background
—Detailed project description of components and major features
—Accomplishments and challenges
—Promising practices

17
Cross–site AnalysisProduced descriptive characteristics of 8
projects in 11 major topic areas
Examined self-reported accomplishments and challenges
Analyzed responses to mapping exercise with project directors

18
Findings Major topic areas
–9 required components plus cultural competence and community voice
–Grantee reported achievements
–Project Directors’ perception of most influential components
–Challenges
Cross-site conclusions

19
Outreach Findings Respondents identified outreach as one of the
cornerstones of their projects
Paraprofessionals play a critical role in conducting outreach
Multiple strategies are used including visits to hospitals and clinics, presentations at health fairs, neighborhood canvassing
Incentives such as tangible goods and transportation help retain participants

20
Case Management Findings Case management is the main link between
participants and needed supports and services
Includes a multidisciplinary approach using some combination of social workers, nurses, and paraprofessionals
Involves service planning that is participatory and flexible
Maternally-focused prenatally; infant-focused interconceptionally
Engage males informally, if no formal male case management is available

21
Health Education Findings Health education serves as a critical component, often
within outreach and case management responsibilities
Provided individually and in group settings
Offered at homes, clinics, and community settings
Delivered orally, in writing, and through videos
Range of topics covered prenatally and interconceptionally
Participants’ disinterest is greatest challenge

22
Depression Screening Findings Case management staff administer
Projects screen all participants except one project screens high-risk only
Frequency varies greatly, from a single postpartum screening to repeated pre- and postpartum screenings
Projects adapt screening practices to meet cultural needs:—Translate tool to different languages
—Read tool to participants
—Reword questions or phrases to eliminate misunderstanding
—Simplify existing tool

23
Interconceptional Care Findings Focus is on maintaining participants rather than
enlisting new enrollees
Home visits, incentives, and health education are the main retention strategies
Case management schedule is less frequent than during prenatal period
Health education topics are more focused on infant care and development

24
Consortium Findings Projects have very different models such as
—Separate community and consumer groups
—Single advisory body
—Task forces under a local health department
Members include social services, housing, civic groups, law enforcement, healthcare, and participants
Focus varies - from strategic planning to service enhancement and health policy changes to public relations and cultural sensitivity
Transportation, childcare, evening hours encourage participants involvement

25
Coordination/ Collaboration Findings Title V is primarily involved via consortium and joint
trainings
Collaboration with Title V includes:—Developing common health messages
—Sharing assessment protocols
—Sustainability planning
—Data sharing
Other frequently cited collaborations include MDs, hospitals, CHCs, WIC, Medicaid, and mental health providers

26
Local Health System Action Plan Findings
All projects have some form of LHSAP
Local public health agencies, consortia, local task forces, non-profit organizations, and Indian Health Services lead development of plans
Often build on other planning efforts in community
Project staff involvement is common

27
Sustainability Findings Projects use a combination of strategies to sustain
services, such as– Seeking supplemental State and foundation funding
—Transferring services to other local providers
—Working with partners to reduce service duplication
Consortium involvement is key to identifying funding opportunities and planning services
Reductions in outreach, case management, health education, and depression screening are concerns

28
Cultural Competence Findings Staff training on cultural competence is done at all
projects
Most projects have established relationships to help with cultural competence, for example:—Faith based organizations
—Traditional healers
—Ethnic associations
Bilingual staff, interpreters, and translated written materials are common efforts
Challenge is keeping up with changing demographics

29
Community/ Consumer Voice Findings Many projects have developed mechanisms for
consumer input, such as—Focus groups
—Involvement on consortium
Focus groups help identify community needs
Project’s noted several benefits of community input:—Increases understanding of health care and social challenges
—Advances recommendations for change
—Implements solutions to reduce infant mortality
—Contributes to discussion with public health officials

30
Grantee-reported Achievements
Both system and service-level
achievements were reported
System-level achievements (34) were more frequently reported than service-level achievements (24)
Improved birth outcomes, a long-term goal, was noted as frequently as intermediate outcomes (6 projects)

31
Grantee-reported Achievements
Service-level Highlights
Provision of enabling services (5 projects)—Transportation
—Child care
Earlier entry into prenatal care (5 projects)
Increased service use (4 projects)

32
Grantee-reported Achievements
System-level Highlights
Increased community awareness (6 projects)
Culturally diverse staff (6 projects)
Consumer Involvement (6 projects)
Coordinated systems/ services (6 projects)

33
Project Directors’ Perception of the Most Influential Components to Achievements
Service-level Components:
Outreach (5), case management (4), and health education (5)
“Outreach is the pillar of the program.”
“Case management is the life thread of our project.”
System-level Components:
Consortium (4)
“It’s important to have representation from the groups we’re targeting, to make sure we have stakeholders from different venues.”
34
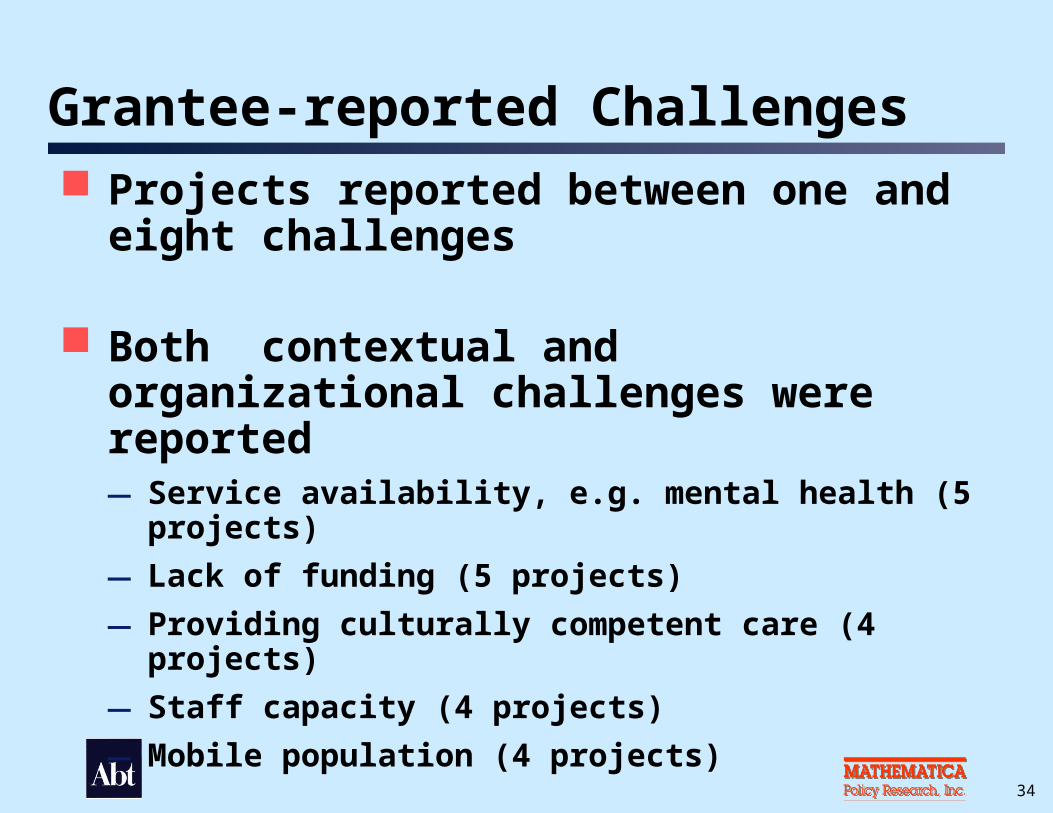
Grantee-reported Challenges Projects reported between one and eight
challenges
Both contextual and organizational challenges were reported —Service availability, e.g. mental health (5 projects)
—Lack of funding (5 projects)
—Providing culturally competent care (4 projects)
—Staff capacity (4 projects)
—Mobile population (4 projects)

35
Summary Conclusions from Site Visits Unique contextual and community issues influence
projects’ design, implementation, and successes
There is no single “magic bullet” for reducing disparities in birth outcomes
Service provision and systems development are both critical for successful Healthy Start projects
System-level achievements are more likely to be identified via qualitative data collection than surveys

36
Summary Conclusions from Site Visits The roles of individuals who conduct outreach, case
management and health education are interconnected, revealing these components work together
Consortium relies heavily on the involvement of multiple collaborations within the community
Sustainability efforts are less a priority than other areas
Acknowledging and working to achieve cultural competence, consumer involvement, or “community voice” are key to reducing disparities

37
Caveats Findings are based on respondents’
perceptions and interpretations
Findings were not verified by examining local evaluation data
Findings are not generalizable to other projects

38
Participant Survey

39
Survey Objectives Overall Goal
—Gain insight into implementation of Healthy Start from the participant perspective
Specific Aims—Develop Healthy Start participant profile (including
demographic characteristics, risk factors, health status)
—Describe services received during prenatal and interconceptional periods (including unmet need)
—Assess satisfaction with services
—Measure participant outcomes

40
Survey OverviewSurvey fielded October 2006 to January
2007
Interviews conducted using Computer Assisted Telephone Interviewing (CATI)
Interview took 30 minutes on average
Sample included Healthy Start participants with infants ages 6 to 12 months at time of interview

41
Survey OverviewGrantees provided enormous support in
helping to locate participants
Interviews conducted in English and Spanish—Interpreters available for other languages
$25 gift card mailed to survey respondents to thank them for their time

42
Survey Response646 completed cases across 8 sites (24 to
155 per site)
Overall survey response rate was 66%—More than 80% in 5 sites
—73 to 75% in 2 sites
—37% in 1 site (low response rate due to grantee requirement to obtain consent before releasing contact information)
Weights adjusted for non-response

43
Organization of ResultsDemographic characteristics
Health status and risk factors
Access to and utilization of services during prenatal and interconeptional periods
Satisfaction with Healthy Start services
Outcomes of Healthy Start participants

44
Analytic Strategy Developed national benchmark to place Healthy
Start results in context
Used the 2001-2002 round of the Early Childhood Longitudinal Survey (ECLS)
Restricted ECLS sample to be similar to the Healthy Start participant sample—Under 185% of the federal poverty level
—Child’s biological mother
—Age of infant 6 to 12 months at time of interview

45
Healthy Start Participant Characteristics

46
Race/Ethnicity
Healthy Start Participants (8 sites) Low-Income Mothers (ECLS)
SOURCES: 2006 Healthy Start Participant Survey; 2001-2002 Early Childhood Longitudinal Survey.
White12%
Hispanic36%
AI/AN12%
Black34%
API6% White
41%
Hispanic34%
AI/AN1%
Black22%
API2%

48
Age and Education
Mother’s ageMother’s age Mother’s educationMother’s education
SOURCES: 2006 Healthy Start Participant Survey; 2001-2002 Early Childhood Longitudinal Survey.
Healthy Start Participants (8 sites) Low-Income Mothers (ECLS)

50
Marital Status, Employment Status, Language, and Country of Birth
SOURCES: 2006 Healthy Start Participant Survey; 2001-2002 Early Childhood Longitudinal Survey.
Healthy Start Participants (8 sites) Low-Income Mothers (ECLS)

52
Health Status and Risk Factors of Healthy Start Participants

53
Self-Reported Health Status and Conditions
aIncludes those who were diagnosed during pregnancy.
a a
SOURCE: 2006 Healthy Start Participant Survey

55
Cigarette and Alcohol Use Before and During Pregnancy
Cigarette use Alcohol consumption
SOURCE: 2006 Healthy Start Participant Survey

57
Utilization of Healthy Start Services
58
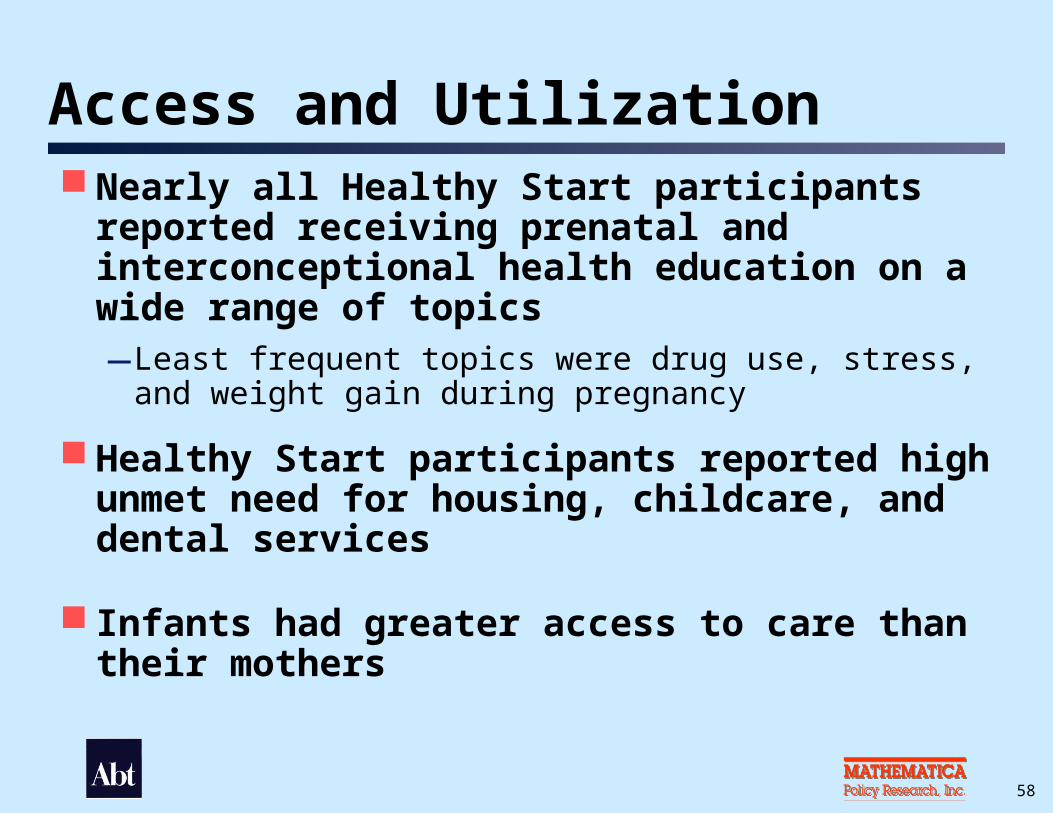
Access and Utilization Nearly all Healthy Start participants reported
receiving prenatal and interconceptional health education on a wide range of topics—Least frequent topics were drug use, stress, and weight gain
during pregnancy
Healthy Start participants reported high unmet need for housing, childcare, and dental services
Infants had greater access to care than their mothers

59
Selected Health Education Topics
SOURCE: 2006 Healthy Start Participant Survey
3 topics reported most often 3 topics reported least often

61
Unmet Need for Selected Health Care Services
SOURCE: 2006 Healthy Start Participant Survey
Percent
Making prenatal care appointments
Making checkupappointments for child
Making dentalappointments for self
Managing diseases
Getting help toquit smoking
Making checkupappointments for self
Finding provider thatspoke same language

63
Unmet Need for Other Selected Services
SOURCE: 2006 Healthy Start Participant Survey
Percent
Obtainingtransportation
Applying for public assistance
Finding childcare
Obtaining housing
Getting help with a crisis
Obtaining food
Applying for health insurance
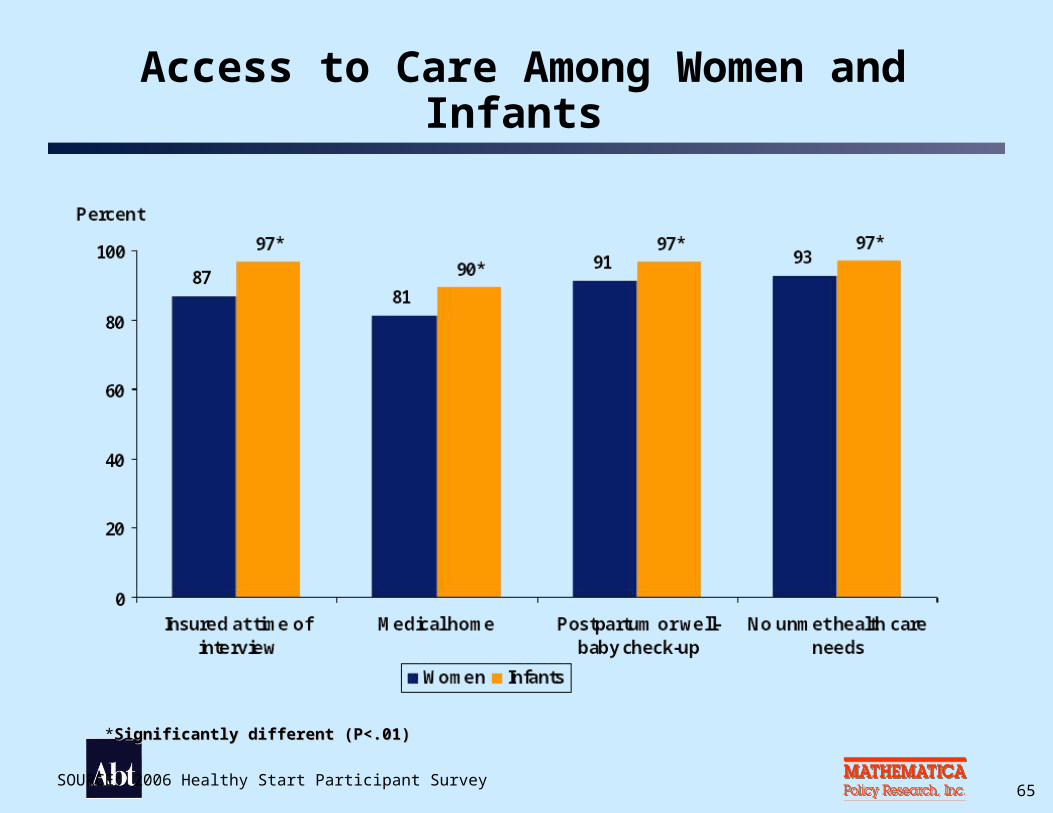
65SOURCE: 2006 Healthy Start Participant Survey
Access to Care Among Women and Infants
*Significantly different (P<.01)Significantly different (P<.01)

67
Interconceptional Care83% reported having a birth control or
family planning method (among those not pregnant at time of survey)
63% reported that they received advice about how long to wait before their next pregnancy
32% reported multivitamin use at least once a week
68
Satisfaction with Healthy Start Services

69
Satisfaction with Healthy Start Services
SOURCE: 2006 Healthy Start Participant Survey
Percent
96
98
93
96
96
71
Perinatal Outcomes of Healthy Start Participants

72
Analytic Strategy Compared Healthy Start rates to those of low-income
mothers nationally based on age- and race-adjusted ECLS rates
For some measures, Healthy Start rates were disaggregated by race/ethnicity and compared to rates for low-income mothers based on the ECLS
Also compared rates to Healthy People 2010 goal, where possible
HP2010 Goal
73
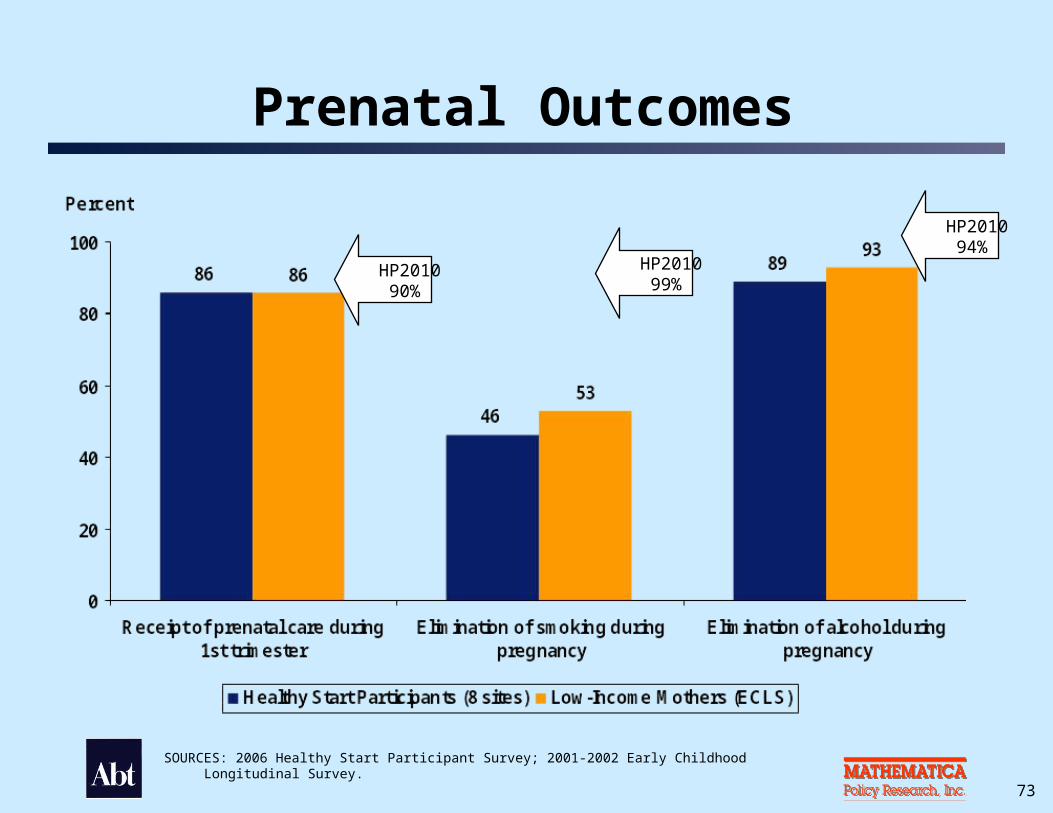
Prenatal Outcomes
SOURCES: 2006 Healthy Start Participant Survey; 2001-2002 Early Childhood Longitudinal Survey.
HP2010 90%
HP2010 99%
HP2010 94%

75
Birth Outcomes
SOURCES: 2006 Healthy Start Participant Survey; 2001-2002 Early Childhood Longitudinal Survey.
HP2010 5%
77
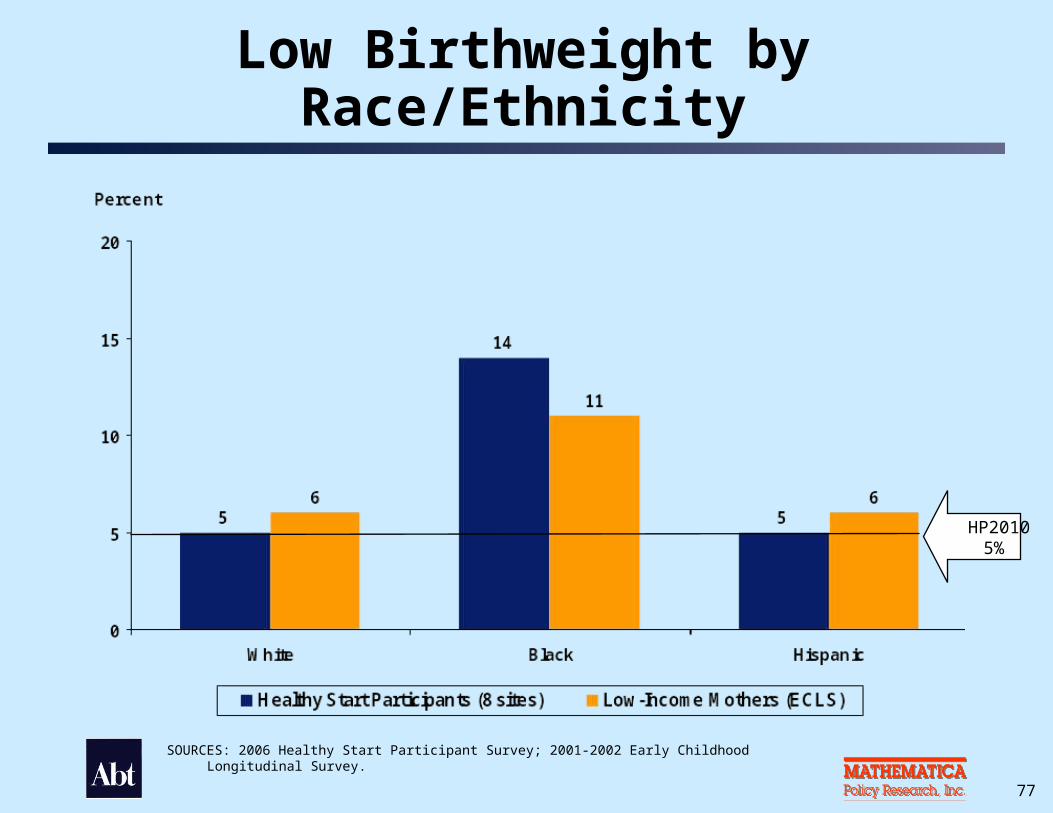
Low Birthweight by Race/Ethnicity
SOURCES: 2006 Healthy Start Participant Survey; 2001-2002 Early Childhood Longitudinal Survey.
HP2010 5%

79
Infant Health Outcomes
HP2010 75% HP2010
70%
SOURCES: 2006 Healthy Start Participant Survey; 2001-2002 Early Childhood Longitudinal Survey.

81
Infant Health Outcomes by Race/Ethnicity
Ever breastfed infant Infant sleep position on back
HP2010 75% HP2010
70%
SOURCES: 2006 Healthy Start Participant Survey; 2001-2002 Early Childhood Longitudinal Survey.

83
Summary of Key Findings

84
Access, Utilization, and Satisfaction Healthy Start participants received health
education on many topics (less frequent topics were drug use, stress, and weight gain during pregnancy)
Highest unmet need was for housing, childcare, and getting help with dental appointments
Infants had higher levels of access to care than their mothers
Satisfaction with the program was high for all measures

85
OutcomesCompared to a national population of low-
income mothers, Healthy Start participants in 8 sites were more likely to:
—Breastfeed their infant
—Put their infant to sleep on his/her back
Compared to a national population of low-income mothers, Healthy Start participants had similar rates of low birthweight

86
CaveatsThese are not causal relationships
Differences may represent selection into the program rather than the impact of the program
We cannot say what would have happened in the absence of Healthy Start
87
Performance Measures Used by Healthy Start
88
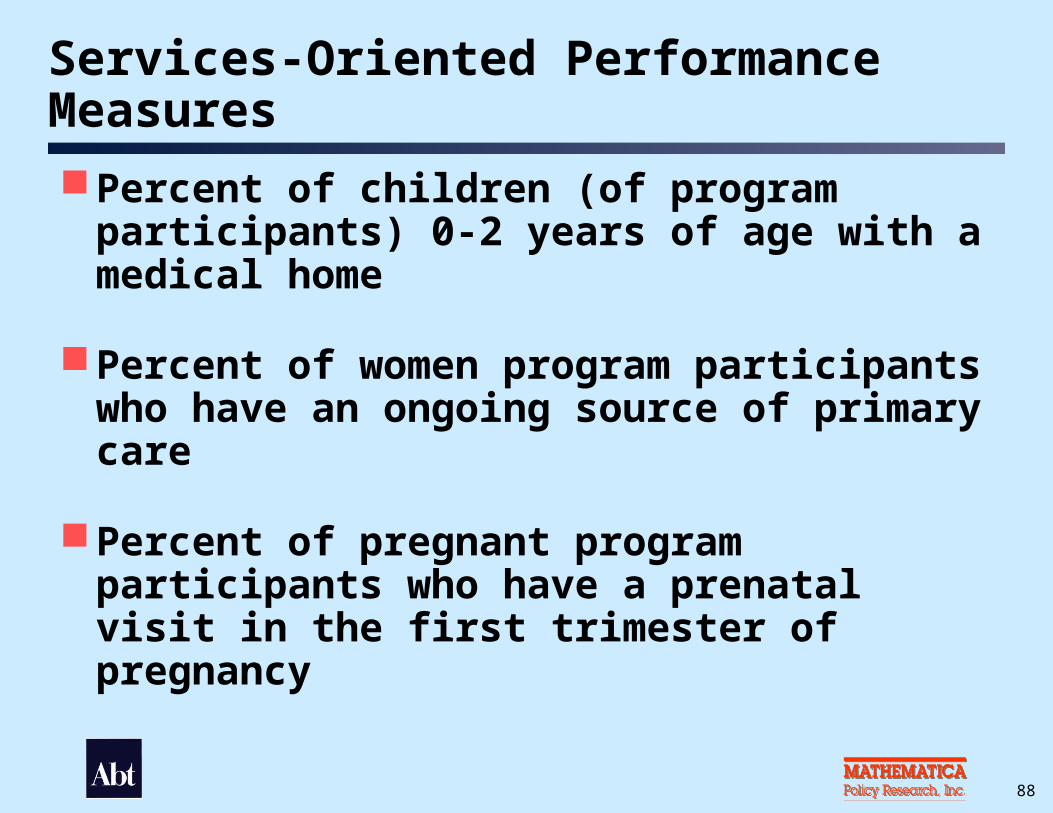
Services-Oriented Performance Measures
Percent of children (of program participants) 0-2 years of age with a medical home
Percent of women program participants who have an ongoing source of primary care
Percent of pregnant program participants who have a prenatal visit in the first trimester of pregnancy
89
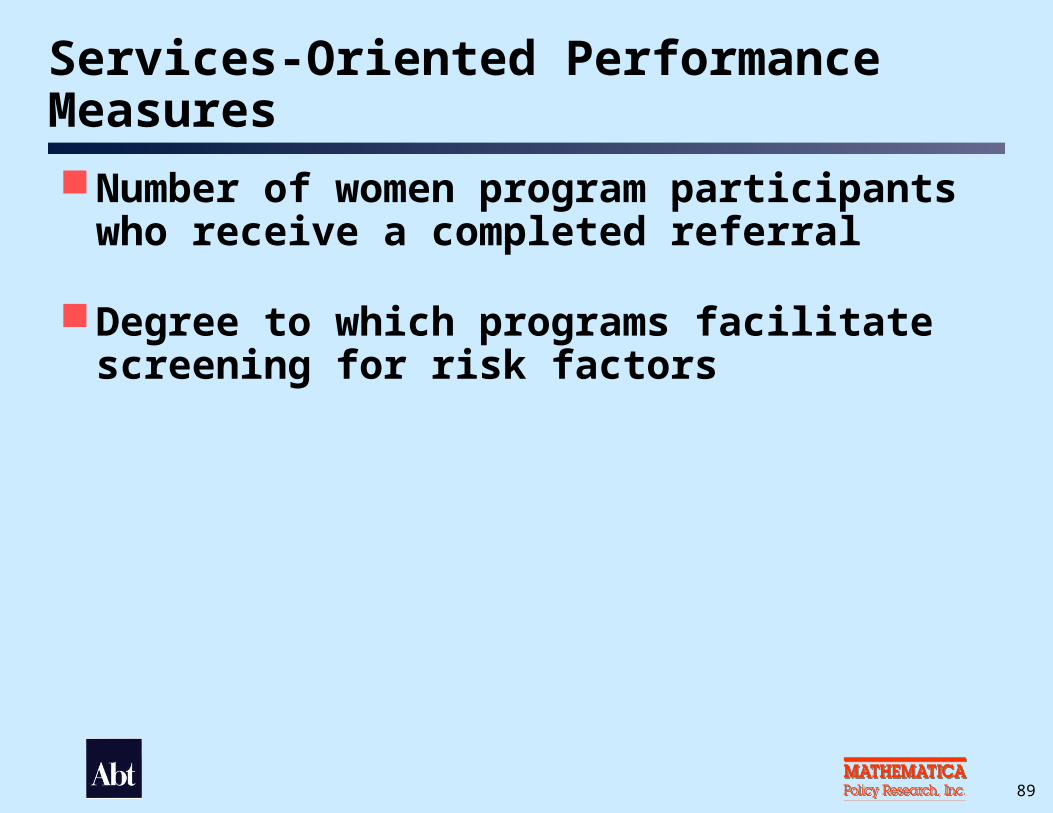
Services-Oriented Performance Measures
Number of women program participants who receive a completed referral
Degree to which programs facilitate screening for risk factors
90
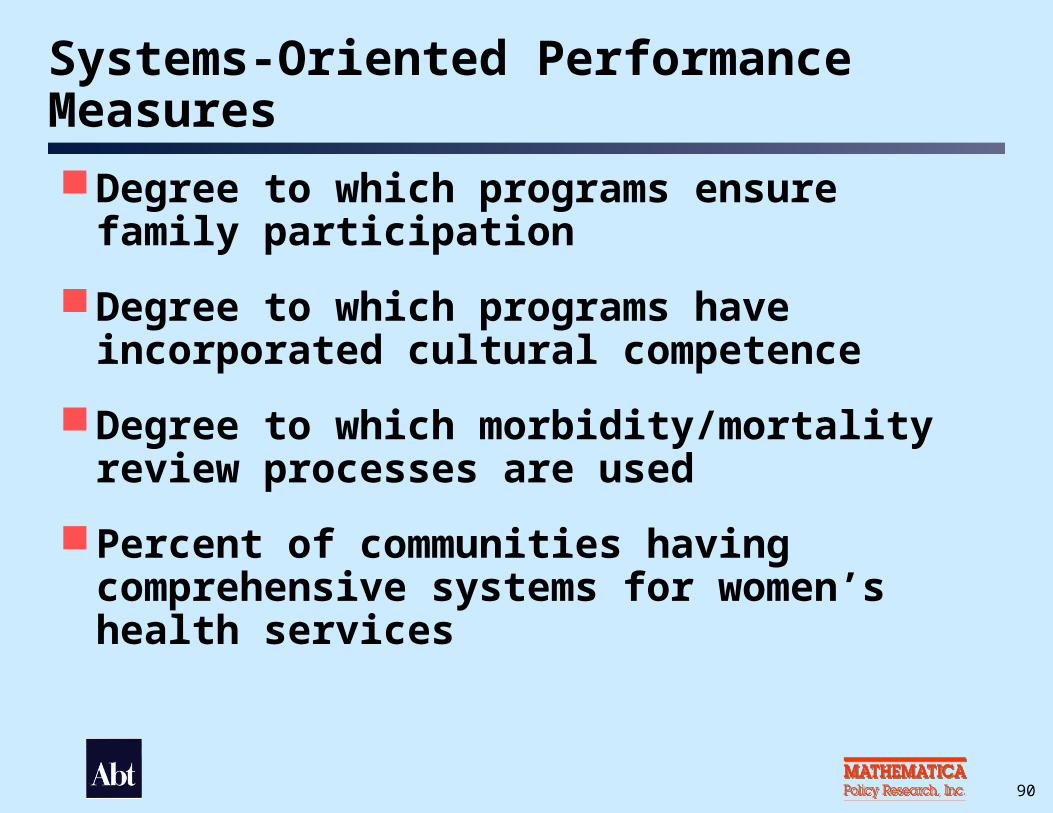
Systems-Oriented Performance Measures
Degree to which programs ensure family participation
Degree to which programs have incorporated cultural competence
Degree to which morbidity/mortality review processes are used
Percent of communities having comprehensive systems for women’s health services
91
Outcomes-Related Performance Measures
Percent of very low birth weight infants among all live births
Percent of live singleton births weighting <2500 grams among all live births to program participants

92
Outcomes-Related Performance Measures
Infant mortality rate per 1000 live births
Neonatal mortality rate per 1000 live births
Post-neonatal mortality rate per 1000 live births
Perinatal mortality rate per 1000 live births

93
Performance Measure ReportingNumber of 96 sites reporting measures—For 2003 (range = 0 to 71 grantees)
—For 2004 (range = 8 to 75 grantees)
—For 2005 (range = 56 to 85 grantees)
Longitudinal data not available to monitor improvements
Can only make one-time estimates

94
Summing Up Findings Across All Data Sources
Project Directors’ Survey
Site Visits
Participant Survey
Performance Measures
What are the lessons learned about Healthy Start?

95
Lessons Learned Both services and systems, as hypothesized in the
logic model, are important
There is no “magic bullet” for how to structure services or systems that works for all sites
Implementation of the program components needs to be tailored to the culture and resources in the community
Healthy Start fills important gaps for very vulnerable women and infants; Healthy Start is the “glue” and support for very vulnerable populations
Benchmarks Paper
96
Lessons Learned Services must be provided from many sectors
(health, social services, housing, food, etc.) to address “root causes” of health disparities
Two service components (outreach, case management) are interconnected and serve as the “heart” of all programs—Health education is an integral part of these two
components
Although all use multidisciplinary teams, there is no one model for delivery of services

97
Lessons Learned Healthy Start is the first national program to
emphasize the interconceptional period—Focus remains on the prenatal period in all sites
—Interconceptional focus in 8 projects is the infant
Developing systems of care is considered as important for achieving improved birth outcomes as are the individual services
Collaborations, especially through a consortium, are critical for success and ultimately, sustainability
98
Lessons Learned The consortium is the “glue” to creating a system
of care and a major way of promoting consumer involvement
Service integration with other partners, such as Title V, is important for developing sustainable systems
Consumer and/or community voice is a “hallmark” of Healthy Start and necessary for addressing cultural competence
Sustained consumer involvement needs support from individual projects