0 novo nordisk a/s global niche pharma with biotech expertise fall 2000
Post on 18-Dec-2015
218 views
TRANSCRIPT
1
Novo Nordisk A/SGlobal Niche Pharma with Biotech Expertise
Fall 2000

2
Demerger process update
Health CareHealth Care EnzymesEnzymes
Detailed historic Detailed historic financial datafinancial data
Demerger Document, Demerger Document,
October 2000October 2000
Demerger Document Demerger Document and Prospectus,and Prospectus,
October 2000October 2000
Road showsRoad shows Aug./Sept. 2000Aug./Sept. 2000 November 2000November 2000
Extraordinary Extraordinary Gen. MeetingGen. Meeting
November 13, 2000November 13, 2000
Pure Play Pure Play ListingListing
Nov./Dec. 2000Nov./Dec. 2000

3
Chief Chief ScienceScienceOfficerOfficer
MadsMadsKrogsgaardKrogsgaard
ThomsenThomsen
Novo Nordisk A/SExecutive Committee (post-demerger)
Chief of Chief of Staffs and Staffs and
QualityQuality
KåreKåreSchultzSchultz
Chief Chief FinancialFinancialOfficerOfficer
JesperJesperBrandgaardBrandgaard
Chief Chief OperatingOperating
OfficerOfficer
Lars Lars AlmblomAlmblom
JørgensenJørgensen
President & CEOPresident & CEOLars RebienLars Rebien
SørensenSørensen

4
CSOCSO S&QS&QCFOCFOCOOCOO
CEOCEO
Novo Nordisk A/SExecutive Committee (post-demerger)

5
A global niche pharma company
Leadership position in diabetes care
Strong market presence in haematology and growth disorders
World class pipeline in key therapeutic areas
Proven, genuine biotech expertise in R&D and access to ZymoGenetics
Drug delivery technology platform
Outstanding presence in Europe and Japan
US growth platform
Strong sales growth, significant cash flow generation, robust balance sheet.

6
Diabetes Carebusiness
Growth Disorders ZymoGenetics HRT
Novo Nordisk – Key drivers
Primary Primary growth growth driversdrivers
Secondary Secondary value value
driversdrivers
NovoSeven® business

7
Our ambition
• Continue to be the world’s leading diabetes care company
• Offer products and services in other areas where we can make a difference
• Grow our product pipeline through internal and external sourcing
• Build upon our biotechnology expertise and link with ZymoGenetics to harness the full potential of the genomics revolution
• Continue to improve financial performance.

8
USEuropeJapanROW
Worldwide presence
Regional sales distributionRegional sales distribution
19971997 HY 2000HY 2000

9
HeaHeallth Care half year 2000th Care half year 2000Turnover by therapyTurnover by therapy
% ofDKK million 2000 1999 total % chg.
Insulin and devices etc. 6,321 5,217 65% 21%NovoNorm®/Prandin™ 513 323 5% 59%
Diabetes Care, Total 6,834 5,540 70% 23%
NovoSeven® 1,034 561 11% 84%Growth Disorders 952 795 10% 20%
HRT 603 556 6% 8%
Other 246 222 3% 11%
Health Care, Total 9,669 7,674 100% 26%

10
Diabetes Care

11
% ofDKK million 2000 1999 total % chg.
Insulin and devices etc. 6,321 5,217 65% 21%NovoNorm®/Prandin™ 513 323 5% 59%
Diabetes Care, Total 6,834 5,540 70% 23%
NovoSeven® 1,034 561 11% 84%Growth Disorders 952 795 10% 20%
HRT 603 556 6% 8%
Other 246 222 3% 11%
Health Care, Total 9,669 7,674 100% 26%
HeaHeallth Care half year 2000th Care half year 2000Turnover by therapyTurnover by therapy

12
Insulin market overview
22%
7.7%
9.1%
10.1%
12.3%
2.5%
World
RoW
J apan
Europe
USA
Novo NordiskMarket share (‘00)
Market growth (‘00/’99)
59%
80%
63%
Source: IMS MAT Q1 2000 volumes. Industrialised world only.
45%

13
0
2000
4000
6000
8000
10000
12000
14000
16000
18000
20000
DKK milion
1995 1996 1997 1998 1999
Insulin sales growth outlookInsulin sales growth outlook
10% growth per year10% growth per yearExcluding pulmonaryExcluding pulmonary
What will
drive growth?
14
0
2000
4000
6000
8000
10000
12000
14000
16000
18000
20000
DKK million
1995 1996 1997 1998 1999
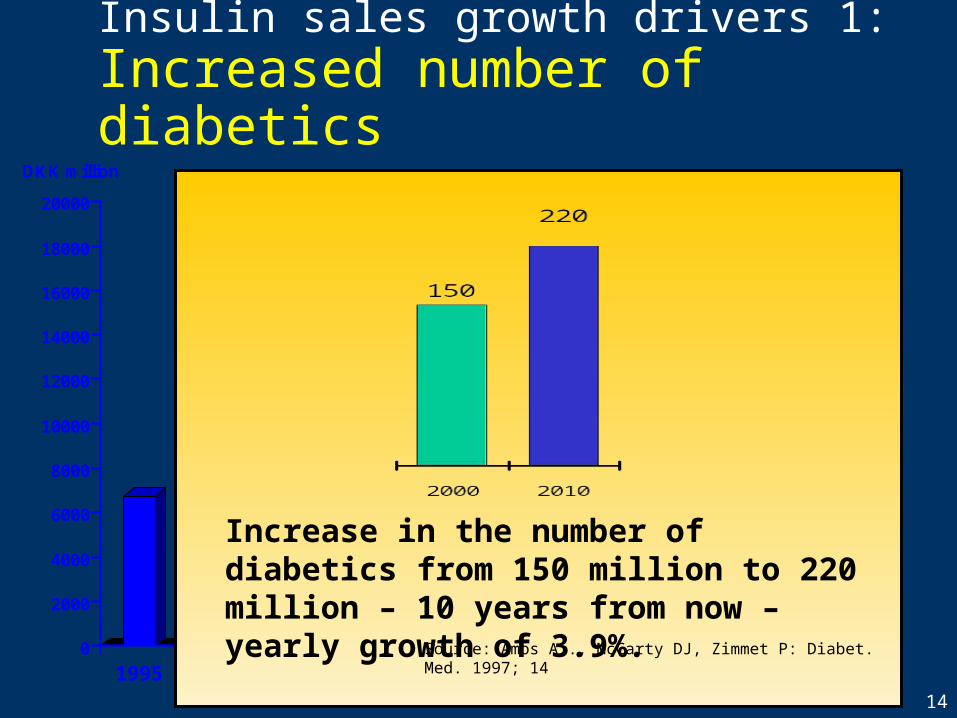
Insulin sales growth drivers 1:Increased number of diabetics
Increase in the number of diabetics from 150 million to 220 million – 10 years from now – yearly growth of 3.9%.
Source: Amos A.., McCarty DJ, Zimmet P: Diabet. Med. 1997; 14

15
0
2000
4000
6000
8000
10000
12000
14000
16000
18000
20000
DKK million
1995 1996 1997 1998 1999
Insulin sales growth drivers 2:Increased rate of diagnosis
Only about one third of diabetics are diagnosed
Increased rate of diagnosis leads to higher insulin sales.
50
150
0
25
50
75
100
125
150
175
# of diagnosed # of diabetics

16
0
2000
4000
6000
8000
10000
12000
14000
16000
18000
20000
DKK million
1995 1996 1997 1998 1999
Number of diabetics using medication: 25-30 million
More patients should move to the use of insulin.
Oral products Oral/insulin Insulin
66% 7% 27%
Insulin sales growth drivers 3:More patients should use insulin

17
0
2000
4000
6000
8000
10000
12000
14000
16000
18000
20000
DKK million
1995 1996 1997 1998 1999
The major land mark study, UKPDS*),prescribed:
Early intervention
Intensified therapy
Use products in combination
More patients on insulin.
*) UKPDS = UK Prospective Diabetes Study
Insulin sales growth drivers 4:More intensive therapy

18
0
2000
4000
6000
8000
10000
12000
14000
16000
18000
20000
DKK million
1995 1996 1997 1998 1999
Pen penetration for insulin administration
5.7%
46.2%
71.4%
79.1%
89.2%
0,0%
20,0%
40,0%
60,0%
80,0%
100,0%
Scandinavia Japan Europe RoW USA
Po
ten
tial
Source: IMS MAT Q1 2000 volumes, Industrial world only.
Insulin sales growth drivers 5:Increased product sophistication

19
0
2000
4000
6000
8000
10000
12000
14000
16000
18000
20000
DKK million
1995 1996 1997 1998 1999
The industry’s most comprehensive insulin device portfolio
One new device to be introduced per year.
Conventionalsyringes
Insulin pens
Electronic insulin dosers
Insulin sales growth drivers 5:Increased product sophistication

20
0
2000
4000
6000
8000
10000
12000
14000
16000
18000
20000
DKK million
1995 1996 1997 1998 1999
The industry’s most comprehensive portfolio of insulin analogues
Rapid acting insulin analogue launched in EU, approved in US
Basal insulin analogue in phase 3
Premixed insulin analogue approved in EU.
Insulin sales growth drivers 5:Increased product sophistication

21
The competitive scene
Insulin analogues
NVO LLY AVE
Rapid-acting Marketed Marketed Ph1/Ph2
Basal Ph3 Marketed
Premix, protracted Approved Marketed
Pulmonary insulin
NVO LLY AVE
Human short-acting Ph2 Ph2 Ph3
Insulin sophisticationInsulin sophistication
22
0
2000
4000
6000
8000
10000
12000
14000
16000
18000
20000
DKK million
1995 1996 1997 1998 1999
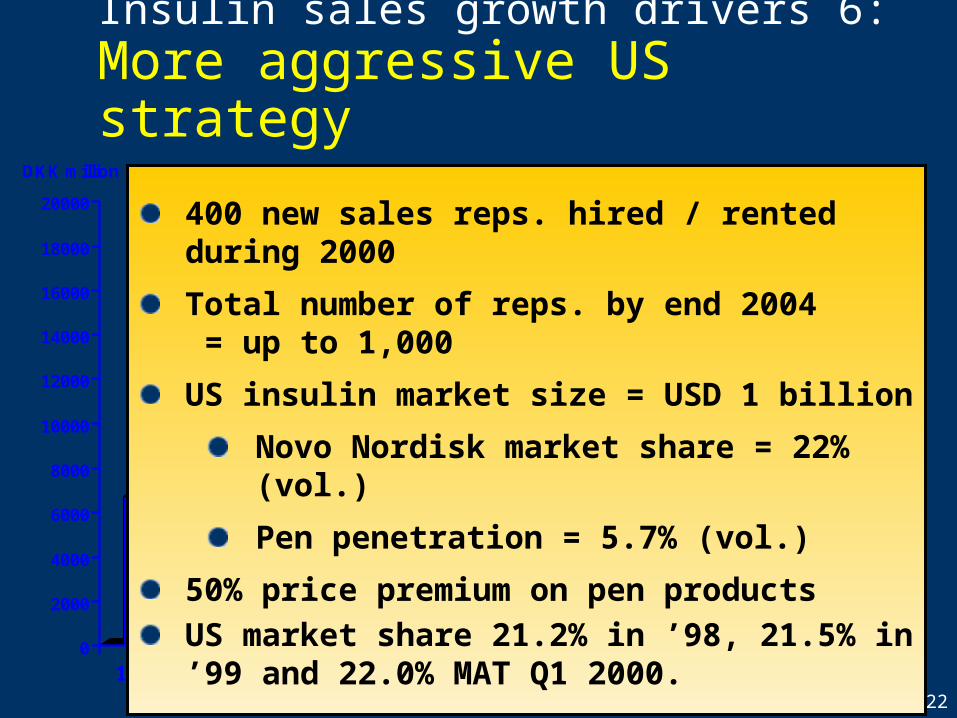
400 new sales reps. hired / rented during 2000
Total number of reps. by end 2004 = up to 1,000
US insulin market size = USD 1 billion
Novo Nordisk market share = 22% (vol.)
Pen penetration = 5.7% (vol.)
50% price premium on pen products
US market share 21.2% in ’98, 21.5% in ’99 and 22.0% MAT Q1 2000.
Insulin sales growth drivers 6:More aggressive US strategy

23
HeaHeallth Care half year 2000th Care half year 2000Turnover by therapyTurnover by therapy
% ofDKK million 2000 1999 total % chg.
Insulin and devices etc. 6,321 5,217 65% 21%NovoNorm®/Prandin™ 513 323 5% 59%
Diabetes Care, Total 6,834 5,540 70% 23%
NovoSeven® 1,034 561 11% 84%Growth Disorders 952 795 10% 20%
HRT 603 556 6% 8%
Other 246 222 3% 11%
Health Care, Total 9,669 7,674 100% 26%

24
0
100
200
300
400
500
600
700
800
900
1000
DKK million
1998 1999
NovoNormNovoNorm/Prandin/Prandin as gateway as gateway to oral diabetes marketto oral diabetes market
Oral diabetes market worldwide = $3 billion and growing ~ 20% yearly
Type 2 programmes:
NN2344: 1st generation sensitiser
NN622: Dual acting sensitiser working on glucose and lipids
NN4201: Reducing glucose output from the liver
NN2211: GLP-1 analogue.

25
Diabetes Care growth drivers
• Increased number of diabetics
• Higher diagnosis rate
• More patients should use insulin
• More intensive therapy
• Increased device penetration
• Conversion to analogues
• More aggressive US strategy
• New Type 2 products in pipeline.

26
Diabetes Care R&D
Muscle/Fat
- Insulin sensitisers
- Insulin- Insulin mimetics- PPAR - GLUT4- TNF - PTPase.
Gut- GLP-1.
ß-cell
- PGR - PCO- GLP-1.
Brain
- GLP-1.Liver
- Hepatic enzyme inh.- PPAR- Glukokinase - Glucagon antagonists
- Insulin- Insulin mimetics.

27
Development pipeline
Phase 1Phase 1 Phase 2Phase 2 Phase 3Phase 3 RegistrationRegistration
NN622(Dual acting insulin sensitiser)
NN2211(GLP-1)
NN1215 (LABI)
NN1998(AERx)
NN4201(Hepatic glucose regulator)
NN703(Growth hormone secretagogue)
NN304 (Basal analogue)
NovoRapid®®
(Rapid analogue)
NovoMix®®
(Premix analogue)
NN007 (up to 4 new within a year)
NN007(Liver)
NN2344(Insulin sensitiser)
NN5492(Infertility)

28
NovoSeven®®

29
NovoSeven®® strategy
• Develop NovoSeven®® to become the first general haemostatic agent
• Develop a range of new clinical indications, new products and new formulations
• Expansion of production and sales force capacity
• Price per mg to be kept unchanged
• Clinical Phase 2 trials on up to four new indications will be initiated within the next year.
29

30
HeaHeallth Care half year 2000th Care half year 2000Turnover by therapyTurnover by therapy
% ofDKK million 2000 1999 total % chg.
Insulin and devices etc. 6,321 5,217 65% 21%NovoNorm®/Prandin™ 513 323 5% 59%
Diabetes Care, Total 6,834 5,540 70% 23%
NovoSeven® 1,034 561 11% 84%Growth Disorders 952 795 10% 20%
HRT 603 556 6% 8%
Other 246 222 3% 11%
Health Care, Total 9,669 7,674 100% 26%

31
NovoSevenNovoSeven®® sales growth outlook sales growth outlook
0
500
1000
1500
2000
2500
3000
3500
4000
1995 1996 1997 1998 1999
DKK million
What will drive growth?

32
0
500
1000
1500
2000
2500
3000
3500
4000
1995 1996 1997 1998 1999
DKK million
NovoSevenNovoSeven®® sales growth drivers 1: sales growth drivers 1:
Existing haemophilia indicationExisting haemophilia indication
1999 sales = DKK 1.3 billion ~ USD 165 million
Peak sales potential = USD 300 million
Launch in Japan 11 May 2000NovoSeven®
Market segmentation for bleedings
Coagulation Factor Deficiency
Haemophilia with inhibitors

33
0
500
1000
1500
2000
2500
3000
3500
4000
1995 1996 1997 1998 1999
DKK million
NovoSevenNovoSeven®® sales growth drivers 2: sales growth drivers 2:
Liver indication in Phase 3Liver indication in Phase 3
Peak sales potential = USD 150-250 million
# of patients = 1.7 million liver patients with coagulopathy
# of spontaneous upper GI bleeds = 170,000
# of orthotopic liver transplantations = 8,000
# of other invasive procedures = 600,000
NovoSeven® Market segmentation for bleedings
Coagulation Factor Deficiency
Haemophilia with inhibitors
Liver disease
Expansion into liver segment
Liver transplantation programme ongoing
Further studies for liver patients to be initiated:
Upper GI bleeds Liver resection
Liver transplantation programme ongoing
Further studies for liver patients to be initiated:
Upper GI bleeds Liver resection

34
0
500
1000
1500
2000
2500
3000
3500
4000
1995 1996 1997 1998 1999
DKK million
A range of potential indications have been identified and analysed
Our strategy for expansion into the Platelet disorder and general general haemostasis area is now in place
NovoSeven® Market segmentation for bleedings
Coagulation Factor Deficiency
Platelet Disorder General Haemostasis
Haemophilia with inhibitors
Liver disease
NovoSevenNovoSeven®® sales growth drivers 3: sales growth drivers 3:
New expansion strategyNew expansion strategy

35
Development pipeline
Phase 1Phase 1 Phase 2Phase 2 Phase 3Phase 3 RegistrationRegistration
NN622(Dual acting insulin sensitiser)
NN2211(GLP-1)
NN1215 (LABI)
NN1998(AERx)
NN4201(Hepatic glucose regulator) NN703
(Growth hormone secretagogue)
NN304 (Basal analogue)
NovoRapid®®
(Rapid analogue)
NovoMix®®
(Premix analogue)
NN007 (up to 4 new within a year)
NN007(Liver)
NN2344(Insulin sensitiser)
NN5492(Infertility)

36
Coagulation FactorCoagulation FactorDeficiencyDeficiency
Platelet DisorderPlatelet Disorder General General HaemostasisHaemostasis
Single Single FactorFactor
MultipleMultipleFactorsFactors
SurgicalSurgicalbleedingbleeding
SpontaneousSpontaneousbleedingbleeding
Lack ofLack ofPlateletsPlatelets
DefectiveDefectivePlateletsPlatelets
NovoSeven
Market segmentation for bleedings
Haemophilia with inhibitors
Liver Disease Liver disease
Vitamin K-antagonists
Vitamin K-antagonistsReversal of oral anti-coagulant therapy
Estimated no. of potential targeted severe bleeding episodes per year: 600,000
Vitamin K-antagonistsReversal of oral anti-coagulant therapy
Estimated no. of potential targeted severe bleeding episodes per year: 600,000

37
Coagulation FactorCoagulation FactorDeficiencyDeficiency
Platelet DisorderPlatelet Disorder General General HaemostasisHaemostasis
Single Single FactorFactor
MultipleMultipleFactorsFactors
SurgicalSurgicalbleedingbleeding
SpontaneousSpontaneousbleedingbleeding
Lack ofLack ofPlateletsPlatelets
DefectiveDefectivePlateletsPlatelets
NovoSeven
Market segmentation for bleedings
Haemophilia with inhibitors
Liver Disease Liver disease
Vitamin K-antagonists
Bone marrow transplantation
Bone marrow transplantation
Estimated no. of potential targeted severe bleeding episodes per year: 13,000
Bone marrow transplantation
Estimated no. of potential targeted severe bleeding episodes per year: 13,000

38
Coagulation FactorCoagulation FactorDeficiencyDeficiency
Platelet DisorderPlatelet Disorder General General HaemostasisHaemostasis
Single Single FactorFactor
MultipleMultipleFactorsFactors
SurgicalSurgicalbleedingbleeding
SpontaneousSpontaneousbleedingbleeding
Lack ofLack ofPlateletsPlatelets
DefectiveDefectivePlateletsPlatelets
NovoSeven
Market segmentation for bleedings
Haemophilia with inhibitors
Liver Disease Liver disease Intra-cerebral bleeds
Vitamin K-antagonists
Bone marrow transplantation Intra-cerebral bleeds
20-30% of strokes are intra-cerebral bleeds
Estimated no. of potential targeted severe bleeding episodes per year: 200,000
Intra-cerebral bleeds20-30% of strokes are intra-cerebral bleeds
Estimated no. of potential targeted severe bleeding episodes per year: 200,000
39
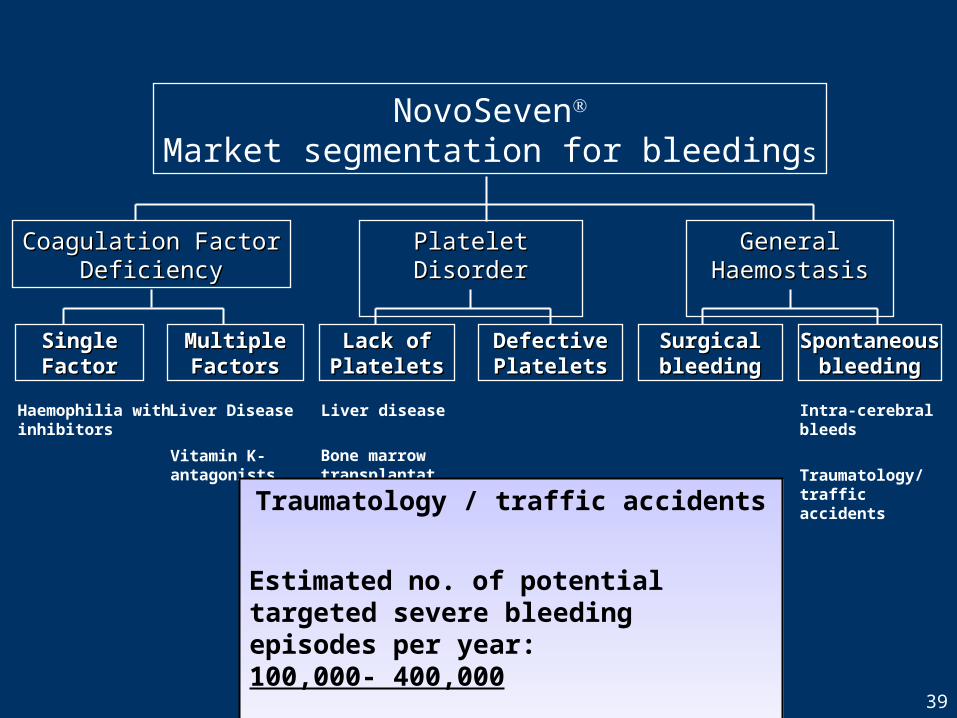
Coagulation FactorCoagulation FactorDeficiencyDeficiency
Platelet DisorderPlatelet Disorder General General HaemostasisHaemostasis
Single Single FactorFactor
MultipleMultipleFactorsFactors
SurgicalSurgicalbleedingbleeding
SpontaneousSpontaneousbleedingbleeding
Lack ofLack ofPlateletsPlatelets
DefectiveDefectivePlateletsPlatelets
NovoSeven
Market segmentation for bleedings
Haemophilia with inhibitors
Liver Disease Liver disease Intra-cerebral bleeds
Vitamin K-antagonists
Bone marrow transplantation Traumatology/
traffic accidentsTraumatology / traffic accidents
Estimated no. of potential targeted severe bleeding episodes per year: 100,000- 400,000
Traumatology / traffic accidents
Estimated no. of potential targeted severe bleeding episodes per year: 100,000- 400,000

40
Coagulation FactorCoagulation FactorDeficiencyDeficiency
Platelet DisorderPlatelet Disorder General General HaemostasisHaemostasis
Single Single FactorFactor
MultipleMultipleFactorsFactors
SurgicalSurgicalbleedingbleeding
SpontaneousSpontaneousbleedingbleeding
Lack ofLack ofPlateletsPlatelets
DefectiveDefectivePlateletsPlatelets
NovoSeven
Market segmentation for bleedings
Haemophilia with inhibitors
Liver Disease Liver disease Intra-cerebral bleeds
Traumatology/traffic accidents
Vitamin K-antagonists
Bone marrow transplantation
Hip replacements
Haemorrhagic dilution coagulopathy
Oozing after cardiac valve replacement
Colon Cancer surgery
Gunshot wounds
Upper gastro- intestinal
Glanzmann
Bernard-Souliers
41
0
5
10
15
20
'90 '91 '92 '93 '94 '95 '96 '97 '98 '990%
10%
20%
30%
40%
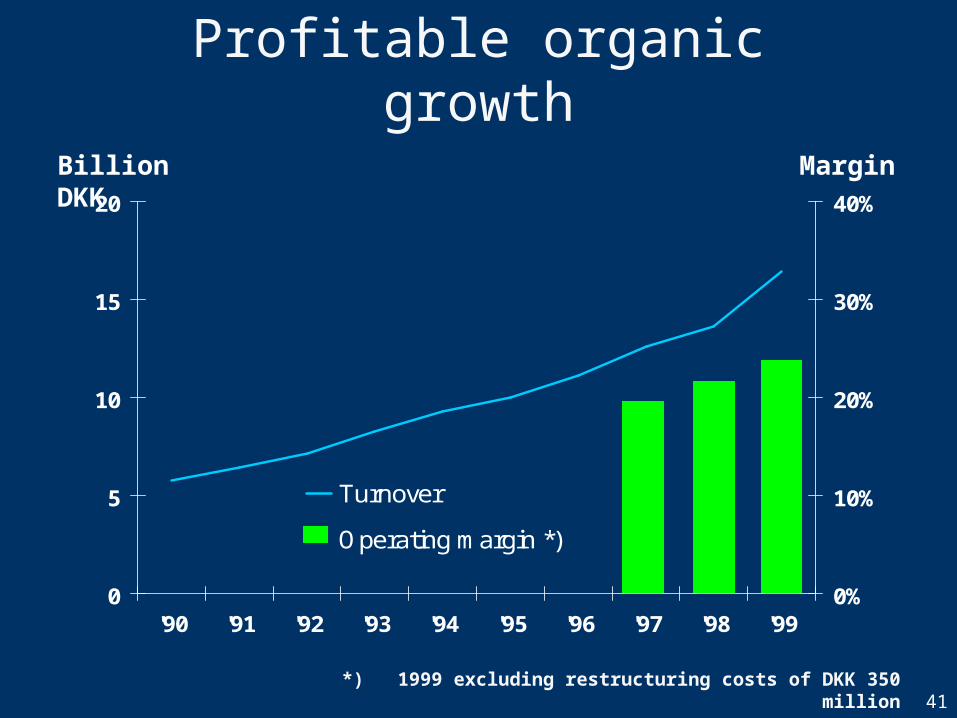
Turnover
Operating margin *)
Profitable organic growth
Billion DKK Margin
*) 1999 excluding restructuring costs of DKK 350 million
42
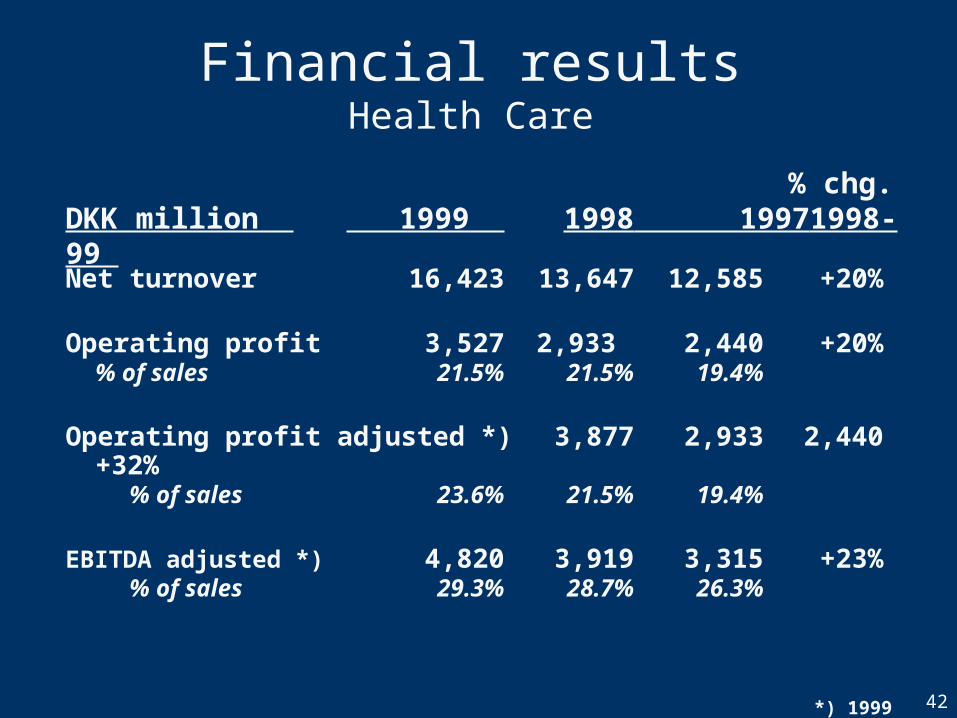
Financial resultsHealth Care
Net turnover 16,423 13,647 12,585 +20%
Operating profit 3,527 2,933 2,440 +20%% of sales 21.5% 21.5% 19.4%
Operating profit adjusted *) 3,877 2,933 2,440 +32% % of sales 23.6% 21.5% 19.4%
EBITDA adjusted *) 4,820 3,919 3,315 +23% % of sales 29.3% 28.7% 26.3%
*) 1999 excluding restructuring costs of DKK 350 million
% chg.DKK million 1999 1998 1997 1998-99

43
Financial results first half yearHealth Care
DKK million 2000 1999 % chg.
Net turnover 9,669 7,674 +26%
Operating profit 2,271 1,671 +36%% of sales 23.5% 21.8%
EBITDA 2,784 2,137 +30% % of sales 28.8% 27.8%

44
Balance sheetHealth Care
Capital expenditures 1,362 1,767 1,950 % of sales 8.3% 12.9% 15.5%
Fixed assets 10,284 9,870 9,244 % of sales 62.6% 72.3% 73.4%
Stocks and trade debtors 6,496 6,044 5,982 % of sales 39.6% 44.3% 47.5%
DKK million 1999 1998 1997
45
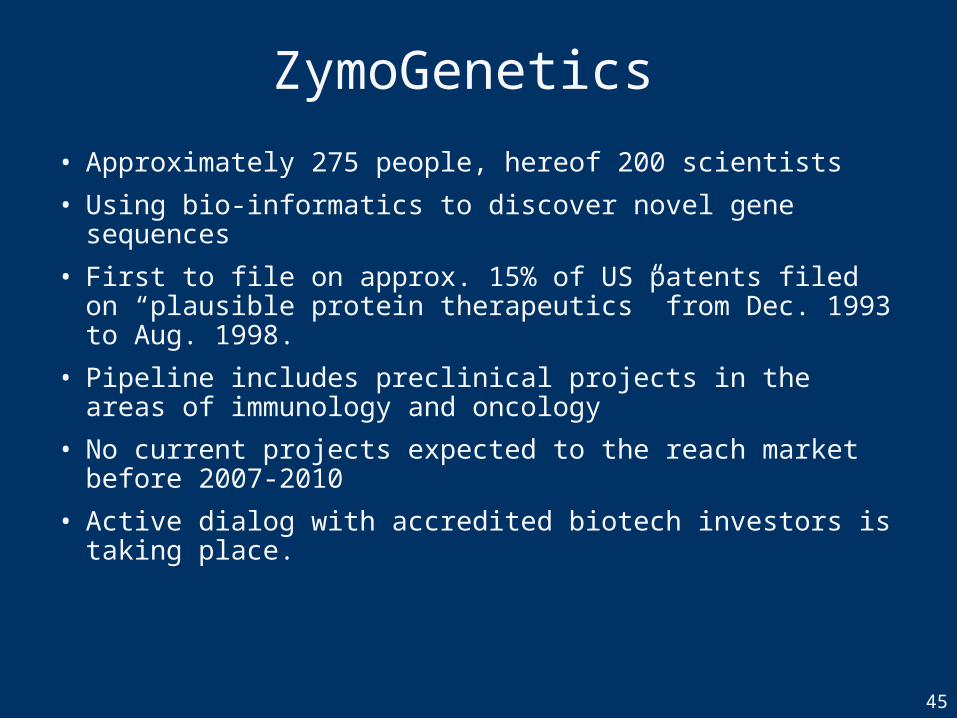
ZymoGenetics
• Approximately 275 people, hereof 200 scientists
• Using bio-informatics to discover novel gene sequences
• First to file on approx. 15% of US patents filed on “plausible protein therapeutics” from Dec. 1993 to Aug. 1998.
• Pipeline includes preclinical projects in the areas of immunology and oncology
• No current projects expected to the reach market before 2007-2010
• Active dialog with accredited biotech investors is taking place.

46
Environmentallysound
Socially responsible
Economically viable
Triple Bottom Line

47
Human Resources
• Performance culture– Transparent recognition and incentive scheme
– Performance linked stock option programme for >300 managers
– Development plans and bonus linked appraisal systems for most employees
– Preferred employer
• Customer focus– All employees to meet a person with diabetes this year
• Globalisation– Growth in number of employees mainly outside Denmark.

48
Global Niche Pharma company
with Biotech Expertise

49
NovoSeven® business
Peak sales potential for current indication = USD 300 million
Peak sales potential for liver indication (Phase 3) = USD 150 - 250 million
Strategy for entry into the Platelet Disorder & general General Haemostasis areas
Phase 2 studies on up to four new indications to be initiated
Patent protection until 2007-11.
Primary Primary growth growth driversdrivers
World leader
2/3 of business (insulin) growing >10%
Steady growth for 76 years
The most comprehensive insulin and insulin device portfolio in the industry – one new device per year
Expansion strategy in the US
Sensitiser and liver programmes
NN2211 (GLP-1 analogue).
Diabetes business
Secondary Secondary value value
driversdrivers Growth Disorders ZymoGenetics HRT
Novo Nordisk – Key driversNovo Nordisk – Key drivers

50
0%
20%
40%
60%
No major patent expirations
% of 1999 sales with patents expiring in 2000-2004
Source: Aros Securities Research and Novo Nordisk
51
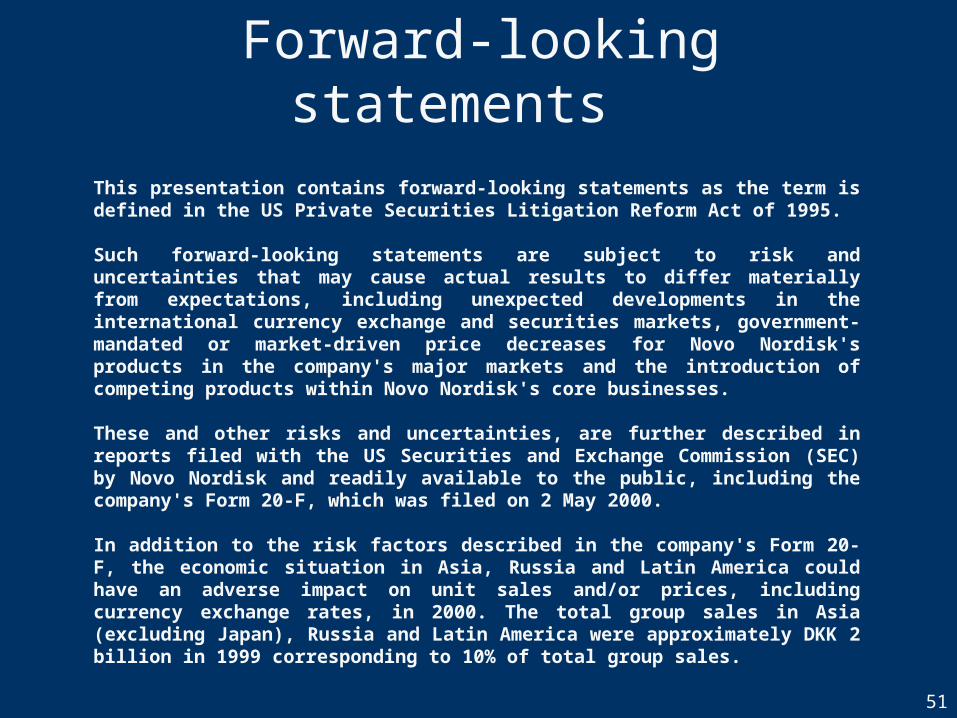
Forward-looking statements
This presentation contains forward-looking statements as the term is defined in the US Private Securities Litigation Reform Act of 1995.
Such forward-looking statements are subject to risk and uncertainties that may cause actual results to differ materially from expectations, including unexpected developments in the international currency exchange and securities markets, government-mandated or market-driven price decreases for Novo Nordisk's products in the company's major markets and the introduction of competing products within Novo Nordisk's core businesses.
These and other risks and uncertainties, are further described in reports filed with the US Securities and Exchange Commission (SEC) by Novo Nordisk and readily available to the public, including the company's Form 20-F, which was filed on 2 May 2000.
In addition to the risk factors described in the company's Form 20-F, the economic situation in Asia, Russia and Latin America could have an adverse impact on unit sales and/or prices, including currency exchange rates, in 2000. The total group sales in Asia (excluding Japan), Russia and Latin America were approximately DKK 2 billion in 1999 corresponding to 10% of total group sales.

52
Global Niche Pharma company
with Biotech Expertise

53
Appendix
54
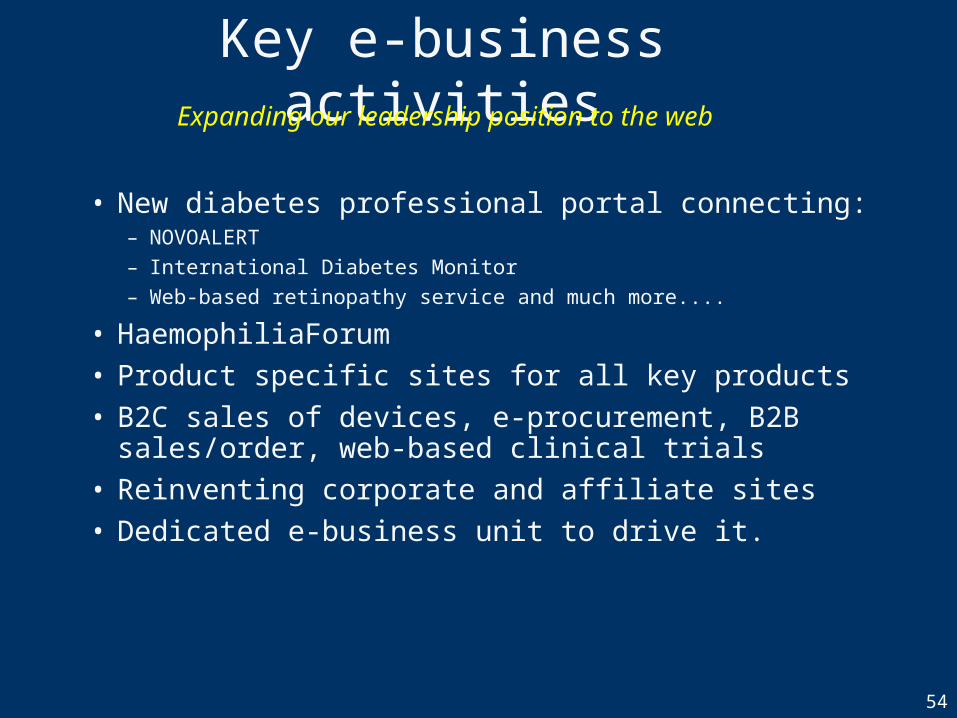
Key e-business activities
• New diabetes professional portal connecting:– NOVOALERT
– International Diabetes Monitor
– Web-based retinopathy service and much more....
• HaemophiliaForum
• Product specific sites for all key products
• B2C sales of devices, e-procurement, B2B sales/order, web-based clinical trials
• Reinventing corporate and affiliate sites
• Dedicated e-business unit to drive it.
Expanding our leadership position to the web

55
Information Interaction Transaction
Intranet +++ ++ +
Extranet ++ + +
Internet +++ ++
Networking in Novo Nordisk

56
Long acting / Basal Insulin
NPH/NPL HOE901 NN304
Number of injections 1 or 2 1 1 or 2
Soluble no yes yes
Mixable yes no yes
Neutral Ph yes no yes
Effect on HbA1c 1 1 1
Intra patient variability 1 >1 <1
Injection site reactions low higher low
Nocturnal Hypoglycaemia 1 1x NPH less less
2x NPH same
Overall rate of Hypoglycaemia 1 1 <1
IGF binding 1 6 <1
Mitogenicity 1 7.5 <1
(* Expected profile, but not proved yet
(*

57
Haemophilia with inhibitors
FVII deficiency
Haemophilia A
Haemophilia B
Liver Disease
Vit. K-antagonists
Hip replacements
Haemorrhagic dilution coagulopathy
Oozing after cardiac valve replacement
Colon Cancer surgery
Astrocytoma surgery
Meningeomas surgery
Spinal Orthopaedic surgery
Arteriovenous malformations
Radical prostatectomy
Liver disease
Bone marrow transplantation
Acute Myeloid leukaemia
Haemorrhagic Cystitis
Blast crisis in leucemia
Myelodysplastic Syndrome - HT
Invasive procedures in blood cancer
Intra-cerebral bleeds
Upper gastro intestinal
Traumatology/traffic accidents
Gunshot wounds
Coagulation FactorCoagulation FactorDeficiencyDeficiency
Platelet DisorderPlatelet Disorder General General HaemostasisHaemostasis
Single Single FactorFactor
MultipleMultipleFactorsFactors
SurgicalSurgicalbleedingbleeding
SpontaneousSpontaneousbleedingbleeding
Lack ofLack ofPlateletsPlatelets
DefectiveDefectivePlateletsPlatelets
NovoSeven
Market segmentation for bleedings
Glanzmann
Bernard-Souliers

58
The key impact of NovoSeven is through injury site selective Platelet activation to ensure high local
thrombin formation which secures a tight fibrin clot
In patients with haemophilia and inhibitors, NovoSeven establish coagulation through bypassing FVIII
(NovoSeven®)rFVIIa
Activation of Platelets without NovoSeven®
Tissue factor- only at site of injury
FXa
Platelet activation
Thrombin activation and burst
Local activation of Platelets & clot formation with NovoSeven®
59
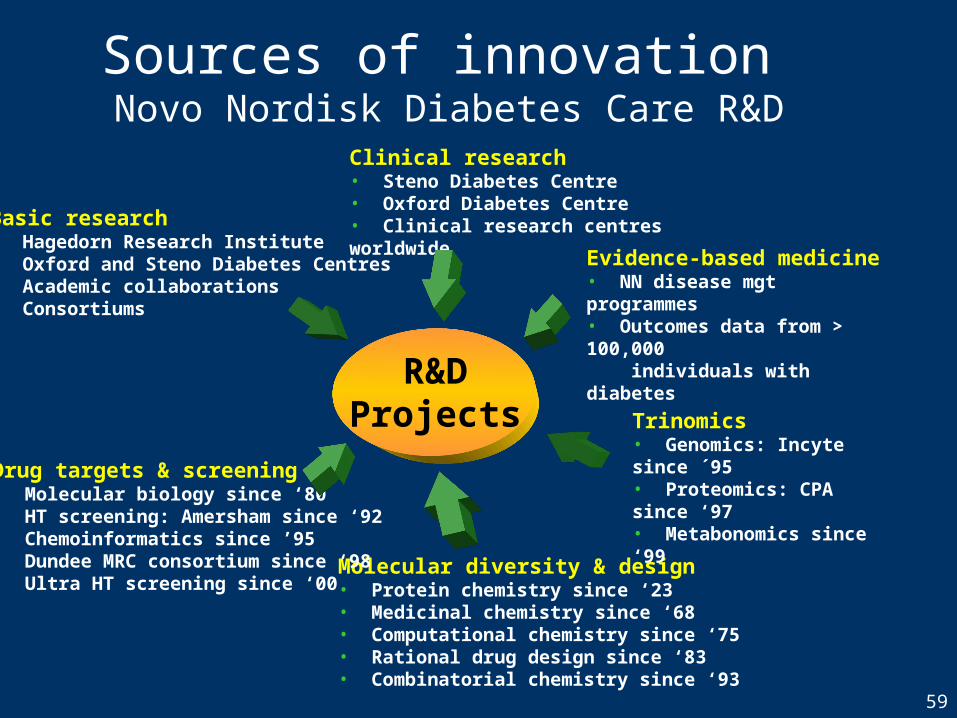
Sources of innovation Novo Nordisk Diabetes Care R&D
R&DProjects
Molecular diversity & design• Protein chemistry since ‘23• Medicinal chemistry since ‘68• Computational chemistry since ‘75• Rational drug design since ‘83• Combinatorial chemistry since ‘93
Trinomics• Genomics: Incyte since ´95• Proteomics: CPA since ‘97• Metabonomics since ‘99
Basic research• Hagedorn Research Institute• Oxford and Steno Diabetes Centres• Academic collaborations• Consortiums
Drug targets & screening• Molecular biology since ‘80• HT screening: Amersham since ‘92• Chemoinformatics since ’95• Dundee MRC consortium since ‘98• Ultra HT screening since ‘00
Clinical research• Steno Diabetes Centre• Oxford Diabetes Centre• Clinical research centres worldwide
Evidence-based medicine• NN disease mgt programmes• Outcomes data from > 100,000 individuals with diabetes

60
0
5
10
15
20
25
30
35
40
45
HGSZGI
GenentechGI
ScheringSKB
MillenniumImmunex
IncyteAmgen
First First Patent Patent Filing Dates on Plausible Filing Dates on Plausible Therapeutic Proteins: 12/93 to 8/98Therapeutic Proteins: 12/93 to 8/98
ZYMOGENETICS

61
ZymoGenetics-FibroGen Collaboration
• Research collaboration signed in July 2000
• Focused on advancing the safety and efficacy of tissue sealant products for wound management
• ZGI to pair its recombinant human thrombin with FibroGen’s recombinant human Type III collagen
• FibroGen is a private biotech company and leader in recombinant human collagen and gelatin biology.
62
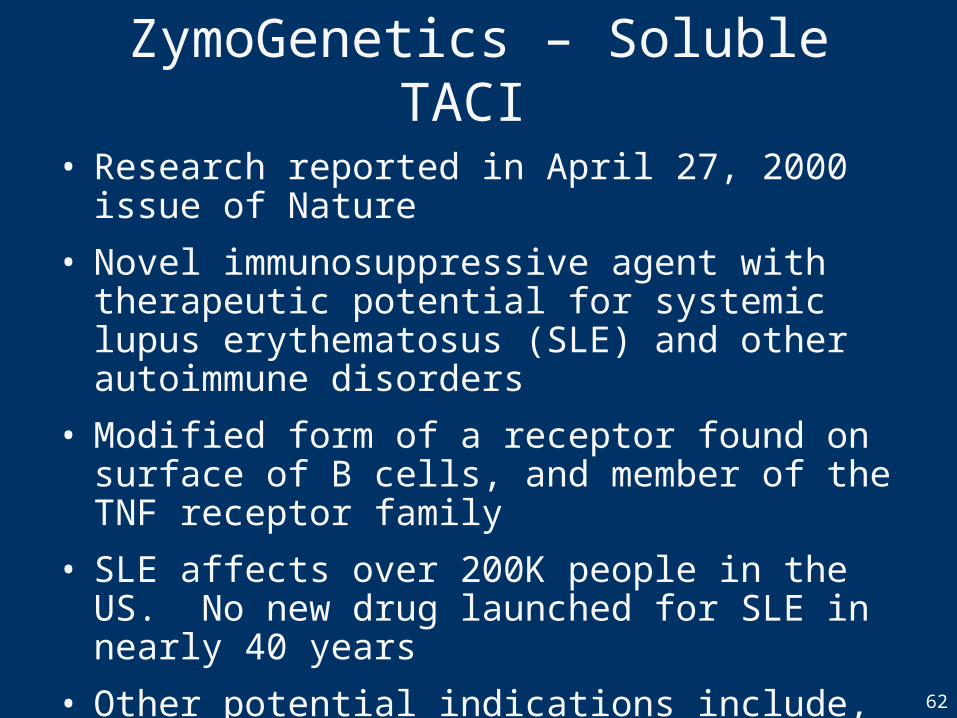
ZymoGenetics – Soluble TACI
• Research reported in April 27, 2000 issue of Nature
• Novel immunosuppressive agent with therapeutic potential for systemic lupus erythematosus (SLE) and other autoimmune disorders
• Modified form of a receptor found on surface of B cells, and member of the TNF receptor family
• SLE affects over 200K people in the US. No new drug launched for SLE in nearly 40 years
• Other potential indications include, inter alia, Myasthenia Gravis and Rheumatoid Arthritis.

63
Vision for Novo Nordisk
• The world’s leading diabetes care company– Our aspiration is to defeat diabetes by finding better methods of diabetes
prevention, detection and treatment– We will work actively to promote collaboration between all parties in the health
care system in order to achieve our common goals
• Offer products and services in other areas where we can make a difference
– Our research will lead to the discovery of new, innovative products also outside diabetes. We will develop and market such products ourselves whenever we can do it as well as or better than others
• Competitive business results– Our focus is our strength– We will stay independent and form alliances whenever they serve our
business purpose and the cause we stand for

64
Our marketing strategy Working together with patient
organisations and health authorities
Examples:• The Diabetes Foundation in Spain
• Accredited education courses for GPs in Scandinavia and the UK
• Web Cafe and Type 2 education programme in France
• Children education project in Poland
• www.diabetes.dk

65
Children Education ProjectPoland
Centrally developed education package
&
30 participants at the train-the-trainer
workshop
Managing 9000 children with diabetes
17 Workshops for239 paediatricians
and nurses

66
Triple Bottom Line
• To obtain trust and license to operate and innovate
• To attract and retain the most talented people
• To minimise risks and create possibilities
• To understand signs from stakeholders
• To be part of defining new legislation and requirements
• To meet rising demand from investors(e.g. Dow Jones/ Sustainable Group Index)
Why combine business, environment, and stakeholders?Why combine business, environment, and stakeholders?

67
Health Care Half Year 2000Turnover by geography
DKK million HY/00 HY/99 % of total %
change (HY/00)
EU 3,865 3,392 40 14
Japan 1,926 1,513 20 27
USA 1,681 1,081 17 56
Rest of World 2,197 1,688 23 30
Total 9,669 7,674 100 26

68
Group financial results Half Year 2000
Net turnover 12,016 9,856 22
Operating profit as reported 2,589 1,926 34Operating profit adjusted*) 2,259 1,592 42
Financial items (25) (150) -Profit before tax 2,564 1,776 44Net profit 1,615 1,146 41
Earnings per share (DKK) 23.04 15.98 44 Earnings per ADS**) (USD) 1.48 1.03 44
*) Excluding Seroxat® license income and one-off income in HY/00.
**) Translated for convenience at the end of HY/00 exchange rate of USD 1 = DKK 7.7895.
DKK million HY/00 HY/99 % change

69
Enzymes Business Half Year 2000 Financial results
Net turnover 2,367 2,182 8
Operating profit 318 255 25
Operating margin 13.4% 11.7%
DKK million HY/00 HY/99 % Change