0 lmars support for pipeline measurement performance paul blackwell office of the deputy assistant...
TRANSCRIPT

1
LMARS Support for Pipeline Measurement Performance
Paul Blackwell
Office of the Deputy Assistant Secretary of Defense for
Supply Chain Integration
March12, 2013
The Supply Chain Metrics Group

2
Supply Chain Metrics Group and Contributing Efforts
OSD Priorities for Pipeline Measurement
Supply Chain Metrics Center
Measurable Supply Chain Attributes
“DNA” Chart for each Metric
Upgrading Supply Chain Metrics Center
Way Ahead
Supply Chain Metrics Strategy
• Purpose: Integrate the metrics originating from several Department-level supply chain metrics efforts into a comprehensive set of metrics monitoring the health of the DoD supply chain.
• Objectives: • Establish a framework of enterprise metrics for managing
with measurements
• Develop definitions, secure data sources, and establish data collection procedures for selected metrics.
• Expand or enhance metrics as pipeline measurement improvements are incorporated
• Incorporate enterprise metrics into the OSD supply chain metrics center along with enhanced analytical and reporting capabilities.
Agenda

3
Supply Chain Metrics Group and Contributing Efforts
Validate the effectiveness of
measures
Standardize definitions,
measurements &computations
Ensure consistent approaches
Integrate into performance framework
Collaborate with related
metrics efforts
Enable new
measures
CWT
LRT
TDD Compliance
Supply Chain Metrics Group
• Comprehensive Inventory Management Improvement Plan
• Joint Supply Chain Architecture
• DPO Distribution Management (Distribution Performance Reviews)
• Pipeline Measurement
• Strategic Network Optimization
• Business Process Improvements
Ongoing Efforts
4
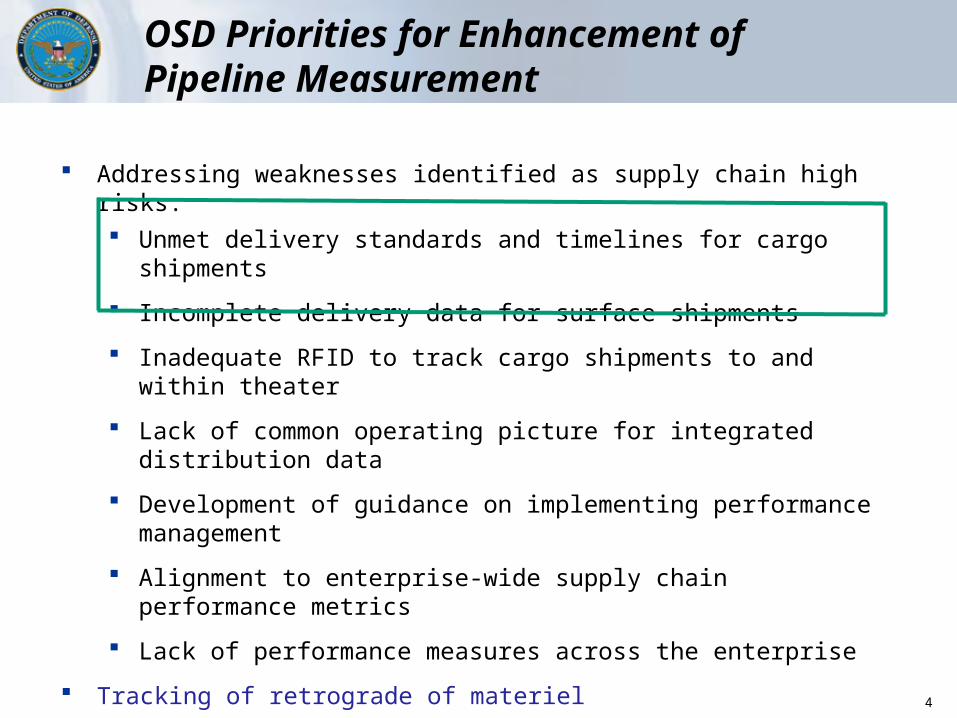
OSD Priorities for Enhancement of Pipeline Measurement
Addressing weaknesses identified as supply chain high risks: Unmet delivery standards and timelines for cargo shipments
Incomplete delivery data for surface shipments
Inadequate RFID to track cargo shipments to and within theater
Lack of common operating picture for integrated distribution data
Development of guidance on implementing performance management
Alignment to enterprise-wide supply chain performance metrics
Lack of performance measures across the enterprise
Tracking of retrograde of materiel
Retrograde Team Report– Sent to the Acting, USD(AT&L) on April 1, 2012
5
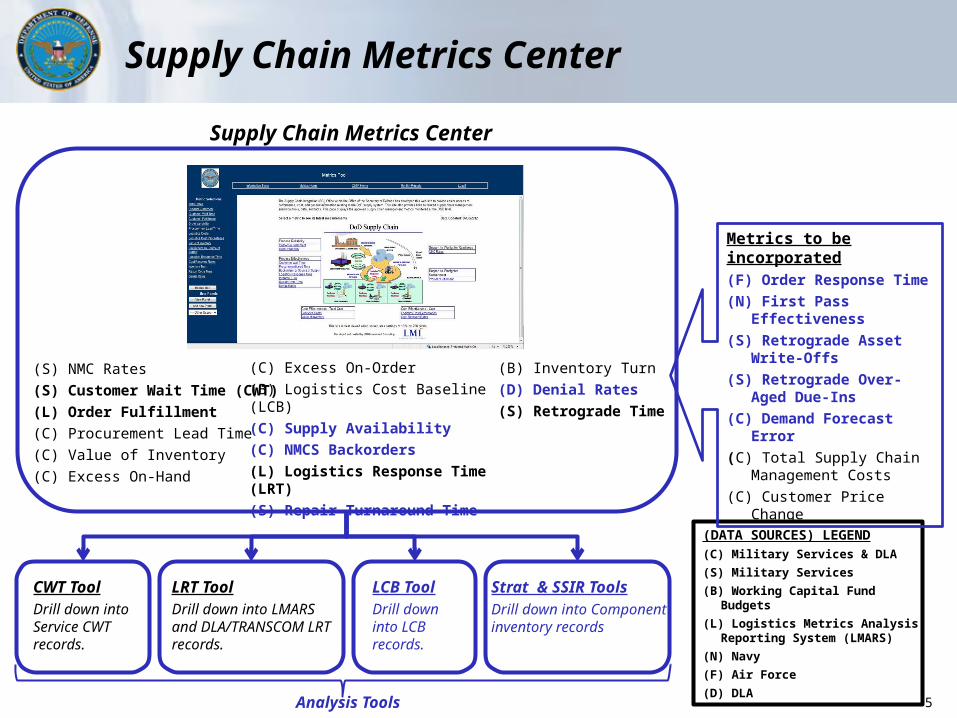
(S) NMC Rates
(S) Customer Wait Time (CWT)
(L) Order Fulfillment
(C) Procurement Lead Time
(C) Value of Inventory
(C) Excess On-Hand
CWT ToolDrill down into Service CWT records.
LRT ToolDrill down into LMARS and DLA/TRANSCOM LRT records.
LCB ToolDrill down into LCB records.
Strat & SSIR ToolsDrill down into Component inventory records
(DATA SOURCES) LEGEND
(C) Military Services & DLA
(S) Military Services
(B) Working Capital Fund Budgets
(L) Logistics Metrics Analysis Reporting System (LMARS)
(N) Navy
(F) Air Force
(D) DLA
(C) Excess On-Order
(B) Logistics Cost Baseline (LCB)
(C) Supply Availability
(C) NMCS Backorders
(L) Logistics Response Time (LRT)
(S) Repair Turnaround Time
(B) Inventory Turn
(D) Denial Rates
(S) Retrograde Time
Supply Chain Metrics Center
Supply Chain Metrics Center
Metrics to be incorporated(F) Order Response Time
(N) First Pass Effectiveness
(S) Retrograde Asset Write-Offs
(S) Retrograde Over-Aged Due-Ins
(C) Demand Forecast Error
(C) Total Supply Chain Management Costs
(C) Customer Price Change
Analysis Tools

6
Metrics StructureDoD Supply Chain Metrics by Measurable Attributes
Attribute/ Outcome
Definition Currently Collected Metrics Proposed Additional Metrics
Standard Not Standard Across DOD
Materiel Readiness
The ability of the supply chain to support weapon systems in undertaking and sustaining their assigned missions at planned peacetime and wartime utilization rates
• NMC Rates• NMCS Backorders
Responsiveness The ability of the supply chain to respond to customer materiel requests according to priority by providing the right support when it is needed and where needed
• Customer Wait Time (O Level)
• Logistics Response Time
• Response Time Effectiveness (e.g. Air Force Order Response Time, Navy First Pass Effectiveness)
Reliability The dependability and consistency of the supply chain providers in delivery of required material support at a time and destination specified by the customer
• Denial Rates• TDD Compliance
• Wholesale Perfect Order Fulfillment (DLA)
• Wholesale Supply Availability
Planning and Precision
The ability of the supply chain to accurately anticipate customer requirements and plan, coordinate and execute accordingly.
• Excess On-Hand• Excess On-Order
• Repair Turnaround Time (D Level)
• Retrograde Time• Procurement Lead
Time
• Demand Forecast Error /Bias
• Retrograde Over-Aged Due-Ins
• Lead Time Variance
Cost The amount of supply chain resources required to deliver a specific performance outcome
• Value of Secondary Item Inventory
• Inventory Segmentation (No Demand 5 or More
Years) ($)• Total Supply Chain Cost
(Log Cost Baseline)
• Total Supply Chain Management Costs
• Tiered Inventory Turns• Price Change• Retrograde Asset
Write-Offs

7
“DNA” Chart for Each Metric
DEFINITION IN
POLICY
Proposed definitions were drafted. Upon approval, definitions for CWTOM , CWT for performance budget reporting, CWT for depot maintenance, and order response time will be inserted into DoD 4140.01-M.
BUSINESS
RULES
Proposed business rule for computing mean CWTOM
excludes the 1% of the observations that represent the longest fulfillment times, which may be attributable to data errors and/or extraordinary circumstances.
DATASOURCE All Military Services data sources identified.
OSD DATA
REQUIREMENT
Military Services submit CWTOM records to SCI on a monthly basis and will discontinue submission of aggregate data to DLA Transaction Services for DD2829 report.
GOALS OR
OBJECTIVES
FY2012 performance goals: 15.5 days for Army, 15 days for Navy, and 7.5 days for Air Force.
DISPLAY Supply Chain Metrics Center is being changed to reflect military service year-to-date performance against goals as well as monthly performance.
CHALLENGES AND WAYAHEAD
• Revision of Marine Corps submission to consider orders filled locally –Marines are developing new specifications for collected CWTOM data.• Revision of Army submission to exclusively measure performance only against those orders from organizational maintenance – Army is reviewing use of data from maintenance systems to identify orders..
DEFINITION A measurement of the total elapsed time between submission of a customer order from organizational maintenance and receipt of that order by organizational maintenance.
SUPPLY CHAIN
ATTRIBUTEResponsiveness: Timely receipt of replacement parts by organizational maintenance is key to reducing the time to replace failed parts that are causing a not-mission-capable condition for weapon systems.
BUSINESS
VALUECustomer wait time for organizational maintenance (CWTOM):• indicates how responsive the DoD
supply chain is from an end user’s perspective
• links supply chain performance to the operational availability of weapon systems as the mean logistics delay time (MLDT) factor
CURRENT METRIC PERFORMANCE
• All Military Services are performing within goal• There were no negative trends or anomalies in this performance period.
Source: CWT Tool, outliers omitted.Note: Army and Marine Corps CWT includes all source of supply, Navy includes Navy source of supply, and Air Force includes Air Force source of supply.
Oct-11 Nov-11 Dec-11 Jan-12 Feb-12 Mar-12 Apr-12 May-12 Jun-12 Jul-12 Aug-12 Sep-12
Army 16.9 15.5 15.3 14.9 14.4 13.9 13.7 13.4 13.3
Navy 11.0 11.7 12.2 12.8 12.8 12.8 12.7 12.9
Air Force 6.1 5.8 5.8 5.7 5.8 5.7 5.8 5.8 5.8
Marine Corps 41.5 38.0 37.2 38.5 37.3 32.3 33.5
0
5
10
15
20
25
30
35
40
45Days
CWT – FY2012Military Service Cumulative Year to Date
Official definition for
metric
Relates metric to a
supply chain
attribute
Business value of the
metric
Proposed SC Metrics
Center display
Guidance & pending action
Computational rules
Identifies data
source(s)
Reporting procedures
Applicable goals
Viewing options
Customer Wait TimeOrganizational Maintenance (CWTOM)
A single information resource for all metrics related data

8
Logistics Response Time (LRT)
STATUS OF SCMG ACTIONS
COMPLETED PENDING WORKING
FUTURE
DEFINITION IN POLICY
Definition approved for insertion in draft DoD 4140.01-M.
BUSINESS RULES
The measurement of LRT is from the date the retail supply activity requisition is submitted to a DoD or designated commercial source of supply until the date the requisitioned materiel is received and posted in the materiel management system of the requisitioner.
DATA SOURCE
Logistics Metrics Analysis Reporting System (LMARS)
OSD DATA REQUIREMENT
DLA Transaction Services submits LMARS records to SCI on a monthly basis.
GOALS OR OBJECTIVES
TDD standards are used by supply chain providers to evaluate their performance in delivering ordered materiel and do not consider backorder time. However, no consensus exists on how to measure backorder time.
DISPLAY Current display shows Total Pipeline Times and CONUS Segment Times by source of supply, Geographic COCOM, and a myriad of other options.
CHALLENGES AND WAY AHEAD
• Analyzing alternatives for measuring backorder time and to evaluate LRT from a customer’s viewpoint versus a provider’s viewpoint. • Discussing how to handle new LMARS records resulting from BRAC-directed transfer of retail supply to DLA at maintenance depots.
DEFINITION
A measurement of the total elapsed time (in days) from customer requisition to receipt of materiel ordered from a DoD organic or commercial source of supply.
SUPPLY CHAIN ATTRIBUTE
Responsiveness: Timely receipt of materiel demanded from wholesale sources of supply to retail activities and end-use customers is key to DoD supply chain performance.
BUSINESS VALUE
This metric:• indicates how timely the wholesale echelon
of supply and distribution system is responding to their customers – the largest segment being retail activities
• links DoD supply chain performance to negotiated standards for responsiveness
(e.g., TDD Standards)
CURRENT METRIC PERFORMANCE
There were no negative trends or anomalies in this performance period.
CIMIP
8

9
TDD Compliance
STATUS OF SCMG ACTIONS
COMPLETED
PENDING
WORKING
FUTURE
DEFINITION IN POLICY
To be documented in emerging DoD 4140.01-M
BUSINESS RULES
U.S. TRANSCOM rules
DATA SOURCE
U. S. TRANSCOM Strategic Distribution Database
OSD DATA REQUIREMENT
Monthly submission of DPO JDDE Metric Executive Dashboard statistics
GOALS OR OBJECTIVES
85% of deliveries meet TDD standard
DISPLAY DPO JDDE Metric Executive DashboardCHALLENGES AND WAY AHEAD (U.S. TRANSCOM)
•Velocity-focused metric…must be balanced against other efficiency metrics•Efficiency improvements may reduce the velocity causing TDD compliance decrease•Future initiatives must be analyzed as they may alter future TDD Standards or compliance goals.
DEFINITION
The concept that, within a specified degree of probability, the logistics system is capable of delivering required materiel to the customer within a given period of time. As a metric, it measures the count and percentage of shipments that meet the time definite delivery (TDD) standards for a given combatant command and transportation mode. For this metric, backorder time is excluded.
SUPPLY CHAIN ATTRIBUTE
Reliability: The DoD TDD standards provide delivery performance target by combatant command, region within COCOM and transportation mode as dictated by the customer’s priority.
BUSINESS VALUE
This metrics quantifies the reliability of the DoD supply chain in meeting negotiated times when responding to customer requisitions.
CURRENT METRIC PERFORMANCE
Current global performance is below goal.

10
Customer Wait TimeOrganizational Maintenance (CWTOM)
STATUS OF SCMG ACTIONS
COMPLETED PENDING WORKING
FUTURE
DEFINITION IN POLICY
Definitions for CWTOM , CWT for performance budget reporting, and CWT for depot maintenance approved for insertion in draft DoD 4140.01-M.
BUSINESS RULES
Excludes the 1% of the observations that represent the longest fulfillment times, which may be attributable to data errors and/or extraordinary circumstances.
DATA SOURCE
All Military Services have established data sources except Marine Corps.
OSD DATA REQUIREMENT
Military Services submit CWTOM records to SCI on a monthly basis and will discontinue submission of aggregate data to DLA Transaction Services for DD2829 report.
GOALS OR OBJECTIVES
FY2013 performance goals are: 15 days for Army and Navy, and 7.5 days for Air Force.
DISPLAY In addition to current display capability, the Supply Chain Metrics Center is being changed to reflect military service year-to-date performance against goals as well as monthly performance. Additional recommendation made by Components.
CHALLENGES AND WAY AHEAD
Complete Marine effort to provide an accurate and complete process for collecting its CWT data.
DEFINITION
A measurement of the total elapsed time between submission of a customer order from organizational maintenance and receipt of that order by organizational maintenance.
SUPPLY CHAIN ATTRIBUTE
Responsiveness: Timely receipt of replacement parts by organizational maintenance is key to reducing the time to replace failed parts that are causing a not-mission-capable condition for weapon systems.
BUSINESS VALUE
Customer wait time for organizational maintenance (CWTOM):• indicates how responsive the DoD supply
chain is from an end user’s perspective• links supply chain performance to the
operational availability of weapon systems as the mean logistics delay time (MLDT) factor
CURRENT METRIC PERFORMANCE
Air Force is performing within their goal, while the Army and Navy are above their goal.
CIMIP

11
Inventory in PipelineOverview
DATA SOURCELMARS
BUSINESS RULES (DRAFT)
Inventory in Pipeline is calculated on a quarterly basis, using data from LMARS. The monthly reported value of items shipped (filtered by SOS, customer, Class IX, and IPG) is divided by 90 to get a daily average value of items shipped, and then multiplied by the average quarterly LRT.
DATA REPORTING ORGANIZATION
Logistics Metrics Analysis Reporting System (LMARS)
LEVEL OF DETAIL
Data filtered to include only Class IX, DLA sourced goods, excluding DVDs. LRT numbers are reported by CONUS/OCONUS and by Service.
ITEM POPULATION
LRT and inventory value numbers are reported by CONUS/OCONUS and by Service.
CALCULATIONMonthly reported value of items shipped is divided by 90, then multiplied by the average LRT for the respective month
REVIEW PERIOD October 2009-present
BASELINE FY10
CHALLENGES
• None
DEFINITIONMeasures the average value of inventory that has been shipped but not yet received by the customer
DEFINITION SOURCE
SNO Working Definition
SUPPLY CHAIN ATTRIBUTE
Investment Cost: The amount of supply chain resources required to deliver a specific performance outcome
BUSINESS VALUE
Average Inventory in Pipeline:• Allows SNO to estimate a monetary value to
apply to LRT measurements
Q1201
0
Q2201
0
Q3201
0
Q4201
0
Q1201
1
Q2201
1
Q3201
1
Q4201
1
Q1201
2
Q2201
2
Q3201
2
Q4201
2 $-
$20,000,000
$40,000,000
$60,000,000
$80,000,000
$100,000,000
$120,000,000
$140,000,000
$160,000,000
Average Inventory Value in Pipeline Across Services
USAF IPG1
USMC IPG1
Navy IPG1
Army IPG1

12
Metrics Center Upgrade
UPGRADING CENTER
A unified platform for:
• Enhanced metric reporting
• Greater spreadsheet integration
• Advanced and flexible data analysis
• Improved information displays & data visualization
• Streamlined user interface
• Simplified customization
• Reduced update cycle
13
Way Ahead
Update POA&M for responsiveness and reliability metrics as LMARS is enhanced with pipeline measurement improvements:
Expand or complete metrics
Update procedures for collecting and reporting measurements
Establish or revisit goals for metrics