xerox university mocroidlms...75-17,123 rao, pa1al
TRANSCRIPT

INFORMATION TO USERS
This material was produced from a microfilm copy of the original document. Whilethe most advanced technological means to photograph and reproduce this documenthave been used, the quality is heavily dependent upon the quality of the originalsubmitted.
The following explanation of techniques is provided to help you understandmarkings or patterns which may appear on this reproduction.
1. The sign or "target" for pages apparently lacking from the documentphotographed is "Missing Page(s)". If it was possible to obtain the missingpage(s) or section, they are spliced into the film along with adjacent pages.This may have necessitated cutting thru an image and duplicating adjacentpages to in:;ure you complete continuity.
2. When an image on the film is obliterated with a large round black mark, itis an indication that the photographer suspected that the copy may havemoved during exposure and thus cause a blurred image. You will find agood image of the page in the adjacent frame.
3. When a map, drawing or chart, etc., was part of the material beingphotographed the photographer followed a definite method in"sectioning" the material. It is customary to begin photoing at the upperleft hand corner of a large sheet and to continue photoing from left toright in equal sections with a small overlap. If necessary, sectioning iscontinued again - beginning below the first row and continuing IJn untilcomplete.
4. The majority of users indicate that the textual content is of greatest value,howeve\-, a somewhat higher quality reproduction could be made from"photographs" if essential to the understanding of the dissertation. Silverprints of "photographs" may be ordered at additional charge by writingthe Order Department, giving the catalog number, title, author andspecific pages you wish reproduced.
5. PLEASE NOTE: Some pages may have indistinct print. Filmed asreceived.
Xerox University MocroiDlms300 North Zeeb RoadAnn Arbor, Michigan 48106

75-17,123
RAO, Pa1al<Urthi Suresh Chandra, 1947-PORE..GEQ.\1ETRY EFFECTS ON SOLUTE DISPERSION INAGGREGATED SOILS AND EVALUATION OF A PREDICTIVEMODEL.
University of Hmvaii, Ph.D., 1974Agronomy
\
)(ero){ University Microfilms, Ann Arbor, Michigan 48106
-- _........ ---- _... - -_.. ... ... - ---~ ........ .-- -"'-_ .... -_ .. -~-----~ - .-_.-~---_.-

PORE-GEOMETRY EFFECTS ON SOLUTE DISPERSION IN
AGGREGATED SOILS AND EVALUATION OF A
PREDICTIVE MODEL
A DISSERTATION SUBMITTED TO THE GRADUATE DIVISION OF THEUNIVERSITY OF HAWAII IN PARTIAL FULFILLMENT
OF THE REQUIREMENTS FOR THE DEGREE OF
DOCTOR OF PHILOSOPHY
IN
AGRONOMY AND SOIL SCIENCE
DECEMBER 1974
By
Pa1akurthi Suresh Chandra Rao
Dissertation Committee:
Richard E. Green, ChairmanYoshinori I~nehiro
Goro UeharaSarnir A. E1-Swaify
Lajpat R. AhujaI-Pai Wu

iii
ACKNOWLEDGEMENT
The author is indebted to Dr. Kishore P. Goswami, Punjab
Agricultural University, Ludhiana, India and Dr. V. Balasubramanian,
Ahmad Ballou University, Zaria, Nigeria for helpful discussions
during the course of this study.

PORE-GEOMETRY EFFECTS ON SOLUTE DISPERSION IN
AGGREGATED SOILS AND EVALUATION OF A
PREDICTIVE MODEL
By Palakurthi Suresh Chandra Rao
A dissertation submitted to the Graduate Division of the University
of Hawaii in partial fulfillment of the requirements for the
degree of Doctor of Philosophy
ABSTRACT
Breakthrough curves (BTCs) obtained by miscible displacement of
either a solute zone (zonal) or a solute front (frontal) through a
saturated column were used to investigate the influence of pore
geometry and adsorption on solute dispersion in some Hawaiian aggregated
soils. A frontal BTC obtained from a tracer solution displacing
tracer-free solution in the column is defined as a Tracer-In BTC,
while the opposite technique yields the Tracer-Out BTC. Much more
rewarding interpretations of BTC data can be made by plotting the
mirror-image of the Tracer-Out BTC along with the Tracer-In BTC and
evaluating each curve independently.
A study of six principal characteristics of frontal BTCs were
found useful in understanding the behavior of the solute in the soil
column during displacement. These properties are: (i) shape, (ii)
location, (iii) area above the BTC, (iv) area under the ETC, (v)
relative locations of the Tracer-In and the Tracer-Out BTCs, and
(vi) slope. Equations for quantification of the fraction of soil
mass in equilibri.um with the solute (EQUIL) during the In displacement

v
and the fraction of the solute desorbed from the soil column (DESOR)
during the Out displacement are presented.
Qualitative and quantitative techniques developed were useful in
the analysis of BTC data obtained by miscible displacement of several
adsorbed solutes through saturated columns of several soils. Usefulness
and certain limitations of the techniqup.s proposed are also discussed.
A simple quantitative technique was employed to determine the
nonsolvent fraction of soil water that would be excluded from flow
processes in Hilo (Typic Hydrandept) and Wahiawa (Tropeptic Eustrustox)
subsoils. Data from equilibrium and miscible displacement studies
revealed that all of the soil water in Wahiawa subsoil participated in
solute transport, while about 10% of the native soil water in Hilo soil
was e][cluded from all solutes other than tritiated water.
Both zonal and frontal BTCs obtained by miscible displacement of
tritiated water through a saturated column of highly aggregated Molokai
(Typic Torrox) subsoil were utilized in the evaluation of a capillary
b~ndle model for prediction of solute dispersion in soils. The
predictive model is based on partitioning the soil into several pore
size increments, each with a characteristic pore-velocity and dispersion
coefficient. The solution of the differential equation, subject to
appropriate initial and boundary conditions, for each pore-size increment
is summed in a linear manner to yield the total solution. The pore-size
distributio~l of the Mo10kai soil column determined by both the methods
of miscible and iwmiscible fluids (denoted as MMF and MIF, respectively)
wer.e strikingly different. Pore-velocity distributions were computed
by trle Poiseuille equation from these pore-size distributions and used

vi
as input data in the capillary bundle model. The BTCs predicted either
by using a pore-velocity distribution from the ~W or by employing an
average pore-velocity to represent the whole soil approximated the
measured dispersion profiles well. Howev"er, when the pore-velocity
distribution from the MIF was used as input data in the model, the
predicted BTCs failed to describe the measured curves.
The assumption of independent flow in all capillaries was not met
in the experiments, and mixing between adjacent flow paths resulted
in much less dispersion than anticipated from the model. The measure
ment and mathematical description of accessibility and inter-connected
ness of pores appear to be essential for quantitative prediction of
the effects of pore geometry on solute dispersion in aggregated soils.

TABLE OF CONTENTS
ACKNOWLEDGEMENT • • •
DISSERTATION ABSTRACT
LIST OF TABLES
LIST OF FIGURES
PREFACE
iii
iv
x
xi
xvi
CHAPTER 1. TECHNIQUES FOR QUALITATIVE AND QUANTITATIVEAN.I\LYSIS OF BRFAKTRHOUGH CURVES FROM MISCIBLEDISPLACEMENT OF REACTIVE AND NONREACTIVESOLUTES IN SOILS: 1. DEVELOPMENT .•
ABSTRACT
INTRODUCTION
NONREACTIVE SOLUTES .
BTC Models • • •Effective Pore VolumeHoldback • • • •
REACTIVE SOLUTES
1
2
4
8
81213
16
BTC Models • • . • • • • • • • • •• 16Retardation Factors • • • • • 16Influence of Relative Rate of Adsorption • 21Influence of Hysteresis in Adsorption 22
CHAPTER 2. TECHNIQUES FOR QUALITATIVE AND QUANTITATIVEANALYSIS OF BREAKTlID.OUGH CURVES FROM MISCIBLEDISPLACEMENT OF REACTIVE AND NONREACTIVESOLUTES IN SOILS: 2. APPLICATION TO REACTIVESOLUTES • • • • • . • •. 38
ABSTRACT
INTRODUCTION
EXPERIMENTAL
Miscible DisplacementEquilibrium Adsorption and Desorption
Measurement . • • •Analysis of BTC Data • • • • • • • • • •
39
41
43
43
4345

RESULTS AND DISCUSSION • •
Adsorption HysteresisMiscible Displacement Studies •
CHAPTER 3. QUANTITATIVE EVAUJATION OF NONSOLVENT FRACTIONOF SOIL WATER IN CERTAIN HAWAIIAN HYDRANDEPTSAND OXISOLS • • • • • • • • • •
ABSTRACT • • • •
INTRODUCTION • •
MATERIALS A1'.l]) METHODS
Soils • • • • • •Column Preparation • • • •Solute Displacement ••••Tracers and Their Analyses • • • • • • • •Adsorption Measurement • • • • •Retardation Factors •
RESULTS AND DISCUSSION •
Hilo Subsoil DataWahiawa Subsoil DataSelected Published Data •
viii
47
4'754
71
72
74
78
787981818384
86
8695
100
CHAPTER 4. COMPARISON OF TWO DIFFERENT TECHNIQUES FORCOMPUTING EFFECTIVE PORE-SIZE DISTRIBUTIONOF AN AGGREGATED SOIL • • • • • • • • 103
ABSTRACT ••
INTRODUCTION
THEORY. • • •
Method of Immiscible FluidsMethod of Miscible Fluids •
MATERIALS AND METHODS
RESULTS
DISCUSSION
104
105
110
110112
115
117
127

CHA.PrER 5. EVALUATION OF A CAPILIARY BUNDLE MODEL FORPREDICTION OF DISPERSION OF NONREACTIVE SOLUTESIN HIGHLY AGGREGATED SOILS • • • • •
ABSTRACT ••
INTRODUCTION
THEORY •••
METHODOLOGY
ix
131
132
134
138
142
Miscible Displacement • 142Pore-Size and Pore-Velocity Distributions • 143Prediction of Breakthrough Curves 144
RESULTS AND DISCUSSION • • • • • 149
Pore-Velocity Distributions • .Measured and Predicted BTCs • •Other Predictive Models
149149159
GENERAL CONCLUSIONSCHA.PTER 6.
APPENDIX 1. A GUIDE TO CIASSIFlCATION OF BTCs . . . . . . .162
166
APPENDIX 2. LISTING OF COMPUTER PROGRAM PORADIUS
APPENDIX 3. DERIVATION OF APPROPRIATE EXPRESSIONS FORTERMS t and t FOR A SOIL COLUMNs 0
APPENDIX 4. LISTING OF COMPUTER PROGRAM TRANSPORT
APPENDIX 5. ANALYSIS OF DIFFUSION IN AGGREGATES
169
170
174
177
APPENDlX 6. DEVELOPMENT OF EXPRESSIONS FOR COLUMN RETARDATIONFACTORS FOR ADSORBER SOLUTES • • • • • 184
LITERATURE CITED • • • • • • • . • • • • 187

LIST OF TABLES
Table
2-1
2-2
2-3
3-1
3-2
3-3
Summary of equilibrium distribution coefficients(Kd) and associated column parameters (p,e s) usedin the c~putation of equilibrium retardation factorsfor two soil-solute systems • • • • • • • • •
Summary of BTC models applicable to the miscibledisplacement data from various soil-solute systemsexamined . . . . . . . . . . . . . . . . . .
Summary of the BTC parameters calculated frommiscible displacement of two adsorbed solutesthrough saturated columns of two Hawaiian soils •
Comparison of retardation factors computed usingequilibrium and miscible displacement techniques:Data for Hilo subsoil column • • • • • • ••
Comparison of retardation factors computed usingequilibrium and miscible displacement techniques:Data for Wahiawa subsoil column • • • • • • • • •
Calculated values of column retardation factors(V IV ) and holdback (H) from selected publishedmi~cigle displacement data • • • • • • • • • • •
53
62
63
92
99
101
4-1 Some major categories of methods available fordetermination of pore-size distribution of porousmedia • • • • . . . . . . . . . . . 106
4-2
5-1
5-2
5-3
Comparison of the mean pore-radius (~r) and thevariance (a~) for the effective pore-size densitydistributions estimated by two different techniques
Summary of parameters used in the prediction ofsolute dispersion in a Mololmi subsoil column bythe L-B capillary bundle model • • • • • • • • •
Pore-velocity distribution in a Mololmi columncalculated from a pore-size distribution measuredby the method of miscible fluids • • • • •
Pore-velocity distribution in a Molokai columncalculated from a pore-size distribution measuredby the method of immiscible fluids • • • • • • •
124
148
150
151

Figure
1-1
1-2
1-3
1-5
1-6
1-7
1-8
1-9
LIST OF FIGURES
Schematic representation of the advance of atracer front (A and C) and corresponding relativesolute concentration profiles within the soilcolumn (B and D) for nonreactive and adsorbedsolute • • • • • • • •
Flow-chart for a classification scheme for theBTCs from displacement of nonreactive solutesthrough soils. Summary of the system originallyproposed by Danckwerts (1953) and Nielsen andBiggar (1962). See also Figures 1-3 and 1-4 •••••
~qO basic BTC models for miscible displacementof nonreactive solutes through an ideal soil.(A) Piston Flow, and (B) Longitudinal dispersion
BTC models for miscible displacement of nonreactivesolutes in soils when some fraction of the soilwater is (A) completely excluded and (B) temporarily excluded from flow processes. Model IIAcurve is sho~qn in both cases as reference
Graphical representation of DanckYlert's (1953)concept of Holdback (IQ as an index of temporaryexclusion of a certain fraction of soil waterfrom flow processes • • • • • • • • • • • •
~o basic BTC models for miscible displacement ofreactive solute through soils. (A) Negative adsorption and (B) Positive adsorption. Model IIA BTCis repeated in both cases as a reference . • • • • • •
Normalized BTC for an adsorbed solute illustratingthe influence of the relative rate of adsorption(k ) on the slope of the BTC • • • • • • • • • • •
r
Tracer-In and Tracer-Out BTCs obtained fronl miscibledisplacement of 0.01~ CaS0
4with 0.01~ CaC12 through
a col1~n of Yolo loam. The BTC sho~qn is that forchloride (Original data of Nielsen and Biggar,1961) . . . . ., . . . . . . . . . .
A flow-chart for the BTC models for miscibledisplacement of rea~tive solutes through soils.Abbreviations ads and des refer to adsorption anddesorption, respectively • • • • •••••••••
6
9
10
11
14
17
23
27
29

. . .
Figure
1-10
1-11
1-12
2-1
2-2
2-3
2-lJ·
BTC models for mi.scible displacement of adsorbedsolutes through soils. (A) Adsorption ;>Desorption,(B) Adsorption=Desorption, and (C) Adsorption <:Desorption. BTC model IIA (curve 1) is repeatedas the case of no adsorption. Curve 2 is forTracer-In and curves 3 and 4 are for Tracer-Out.Note that CICo vs. V is plotted for Tracer-In,while l-C/Co is plotted for Tracer-Out • •
BTCs for miscible displacement of reactive solutewhich is adsorbed (Model IV) by the soil. ModelIIA BTC is the reference for no adsorption, whilethe two BTCs shown as dashed lines are for ModelIV. The shaded area represents the reduction incolumn retardation factor (equation 1-8) due todisequilibrium conditions in column • • • • • • • • •
Schematic representation of the calculation ofthe fraction of the solute that is desorbed(DESOR; equation 1-10) from the soil columnduring Tracer-Out displacement. Curve 1 is BTCfor Model IIA, curve 2 is Tracer-In for BTCModel IVA, and curve 3 is Tracer-Out BTC forModel IVA. The shaded area represents the increasein pore volumes due either to adsorption ordesorption . . . . . . . . .. . 0 • • • • • • • •
Freundlich adsorption isotherm for picloramadsorption on Hilo subsoil, with k=24.5 ~g/g,
and N=O.585. Non-reversibility of adsorption isshown by the hysteresis in the desorption loops
Relationship between the ratio of slopes ofadsorption and desorption isotherms (Naqs/Ndes)and the maximum adsorbed concentration (Smax)at which desorption was initiated. Actualisotherms are shown in Figure 2-1 • • • • •
Tracer-In and Tracer-Out BTCs obtained by miscibledisplacement of chloride through a saturatedcolumn of Hilo subsoil. Reference BTC for methanolis show" as a solid curve • • •• ••• • • • • •
Tracer-In and Tracer-Out BTCs obtained by miscibledisplacement of picloram herbicide through asaturated column of Hilo subsoil. Reference BTCfor metlmnol is shm~ as a solid curve • • •
xii
30
35
36
48
51
55
56

• 0 • •
Figure
2-5
2-6
2-7
2-8
2-9
3-1
3-2
3-3
3-4
Tracer-In and Tracer-Out BTCs obtained by miscibledisplacement of chloride through a saturatedcolumn of Wahiawa subsoil at an average porevelocity of 0.179 cm/min. Reference BTC formethanol is shown as a solid curve • • • • • •
Tracer-In and Tracer-Out BTCs obtained by miscibledisplacement of chloride through saturated columnof Wahiawa subsoil at an average pore-velocityof 0.08 cm/min. Reference BTC for methanol isshown as a solid curve • • • • • • • • • •
Breakthrough curves obtained from miscible displacement of chloride (OCCCO), atrazine herbicide(AAA6A) , and barium (OOODD) through saturatedcolumns of four different soils. Tracer-In BTCsare sho~vn as data points, while the correspondingTracer-Out BTCs are shown as solid curves. Datataken from Snelling et al. (1969) • • • • • •
Normalized BTCs for methanol, chloride and picloramobtained from Hilo subsoil column to facilitatethe comparison of the slopes the BTCs • • • • • • • •
Normalized BTCs for methanol and chloride from aWahiawa subsoil and that of chloride from Hilosubsoil to facilitate the comparison of the slopesof the BTCs • . • • • • • • • • • • • • •
A scheme for the. classification of soil waterbased on its nlobility and solvent properties.
Breakthrough curves for (A) tritiated water and(B) 14C-Methano1 obtained from a saturated columnof Hi10 subsoil at an average pore-velocity ofO. 134 cm/min • • • • • • • • • • • •
Breakthrough curves for (A) chloride and (B)picloram obtained from miscible displacementthrough a saturated column of Hi10 subsoilcolumn, at an average pore-velocity of 0.134 cm/min.The reference BTC of methanol is shown as a solidcurve in both cases • • • • • • • • • • • • • • •
Breakthrough curves for methanol, tritiated water,and chloride obtained from a saturated column ofWahiawa subsoil at an average pore-velocity ofO. 18 em/min . . . . . . . . . . . . . . . . . .
xiii
58
59
61
67
68
75
88
91
97

Figure
4-1
4-2
4-3
4-4
Soil moisture characteristic curve for a Mo10kaisubsoil coll~n. The vertical arrow drawn at atension of 100 cm water points the limit chosenfor Sr . " . . . . . . . . . . . . . 0 • • • • •
Breakthrough curve obtained by miscible displacement of tritiated water initially saturatinga Mo10kai subsoil column with distilled waterat an average pore-verocity (vo) of 0.153 cm/min.The histograms used in estimation of the recovery(R) are also shown • • • • • • • • • • • • • •
Recovery (R) of tritiated water from a Mo101misubsoil column by displacement with distilledwater. Normals and the corresponding R-interceptsof the tangents to tne recovery curve drawn atspecific points are also presented • • • • • • • •
Effective pore-size frequency distribution, S (r),curves for a Mo101~i subsoil column measured bythe methods of miscible and immiscible fluids
. .
. .
xiv
U.8
119
121
122
. .
4-5
4-6
5-1
5-2
Effective pore-size density distributions, s (r),for a Mo10kai subsoil column computed using ~quation(4-2). The histograms approximating the frequencydistributions are also shown • • • • • • • • • • • • •
Effective pore-size distributions of a Mo10kaisubsoil column measured by the methods of miscibleand immiscible fluids plotted against the normalizedradius (r/~r) to facilitate comparison • • • • • • • •
Measured (data points) and predicted (curves)effluent zonal BTCs for tritiated water displacement through a saturated column of Mo101mi subsoilat an average velocity of 0.157 cm/min. Predicteddistributions were obtained with an average porevelocity (curve 1), or pore-velocity distributionsfrom the MMF (curve 2) or the MIF (curve 3) asinputs in the L-B model • • • • • • • • • • •
Measured (data points) and predicted (curves)effluent frontal BTCs for tritiated water displacement through a saturated column of Molokaisubsoil at an average velocity of 0.153 em/min.Predicted distributions were obtained with anaverage pore-velocity (curve 1) or pore-velocitydistributions from the MMF (curve 2) or the MIF(curve 3) as inputs in the L-B model • • • • • •
123
126
152
155

Figure
AS-1
AS-2
A relationship between aggregate radius (R) andthe characteristic time for absorption (to)'See equation AS-6 • • • • • • • • • • • • • • • •
A relationship between intra-aggregate tortuosityfactor ('[2) and the characteristic absorptiontime (to)' See equation AS-7 • • • • • • • • • • • • •
xv
180
182

PREFACE
A study of solute transport processes in porous media is
essential in understanding such agricultural and industrial pllenomena
as efficient use of soil-applied fertilizers and pesticides, removal
of excess salts from the crop rooting zone in reclamation of saline
soils, salt water intrusion of coastal aquifers, seepage from
industrial waste heaps, recovery of oil and natural gas from wells,
and land disposal of urban refuse (sewage). It is with such broad
implications in mind that this study vms initiated.
Since it is impossible to describe the intricate geometry of the
porous medium in any exact mathematical form, the general recourse
has been to substitute an idealized and fictitious geometric model
for the real medium. Two major approaches are available in the
literature on modelling efforts. In the first, the medium is simulated
either by bundles of straight, parallel, and unconnected cylindrical
capillaries or by a r-omplex, raudom network of interconnected
capillaries of varying radii and length. The dispersion in these
capillaries is then described by the Taylor-Aris theory (Taylor,
1953; Aris, 1956). The second approach recognizes that the complexity
of the real porous medium cannot be truly described, and utilizes the
random walk theory developed by Schedegger (1957) by substituting a
fictitious continuum for the porous medium with no regard to its
geometric complexity. An exhaustive review of the literature on
solute dispersion theory and experimental investigations is not
deemed necessary here in view of the excellent reviews presented by
Perkins and Johnston (1963). Biggar and Nielsen (1967), Bear,

xvii
Zaslavsky, and Irmay (1968), Nunge and Gill (1969), Fried and
Combarnous (1972), Rose (1973) and Boast (1973). Very informative
presentations regarding the matrix properties of the porous mediR
in relation to their flow properties are also available in the
literature (Dullien, 1970, 1972; Greenkorn, 1972).
Childs and Collis-George (1950), Marshall (1958), and Millington
and Quirk (1960) have incorporated the concept of pore-interaction
into simple geometric models (such as bundles of capillaries) to
predict the permeability of porous media. Green and Corey (1971)
have successfully employed these pore-interaction models to predict
the hydraulic conductivity of several soils, including Some aggregated
Hawaiian soils, using a pore-size distribution measured by the soil
moisture characteristic curve. A possible extension of such geometric
models is to utilize the pore-size distribution in prediction of
solute dispersion in soils.
The influence of soil structure on water retention and infiltra
tion in aggregated soils of Hawaii has been the subject of many
previous investigations (Sharma, 1966; Tsuji, 1967; Sharma and
Uehara, 1968; Harada, 1970; Santo, 1974; Tsuji, Watanabe, and Sakai,
1974). Rapid release of water at low suctions and relatively high
water contents at higher suctions in measures of the soil moisture
characteristic of some aggregated soils of Hawaii have been attributed
to the presence of inter-aggregate and intra-aggregate voids,
respectively (Sharma and Uehara, 1968). Photomicrographic evidence
of the presence of such bimodal pore-size distribution in aggregated
Hawaiian soils was recently presented by Tsuji, Watanabe, and Sakai
(1974).

xviii
Cagauan (1969) was the first to study the effects of pore geometry
and adsorption on solute dispersion in several Hawaiian soils. Ik
estimated the dead-end porosity, defined to be comprised of pores
singly connected to conducting flow channels by a capillary and
bypassed during flow, to vary between 4 and 30 percent. Green, Rao,
and Corey (1972) evaluated the importance of pore-velocity distribution
and solute retention in intra-aggregate micropores on solute dispersion
in aggregated soils. They concluded that none of the soil water in
the two soils studied was excluded from solute transport; the
micropores behaved as a temporary diffusion sink/source for the
water-conducting macropore sequences. Balasubramanian et a1. (1973)
and Rao et a1. (1974) investigated solute transport in field soils
of a highly aggregated Oxiso1 and obtained results which could be
explained on the basis of the unique pore geometry of these structured
soils.
With this background information available, this study was
initiated to investigate the influence of soil pore geometry and
adsorption on solute dispersion in certain highly aggregated soils
of Hawaii. Subsoils were chosen in this study to take advantage of
the high stability of subsoil aggregates.
Miscible displacement techniques, pioneered by petroleum
engineers and introduced into soils literature by Nielsen and Biggar
(1961), were utilized in an evaluation of the influence of pore
geometry and adsorption/desorption on solute dispersion in certain
highly aggregated soils of Hawaii. Soils utilized in the study were
Hilo (Typic Hydrandept), Wahiawa (Tropeptic Eutrustox) and Molol~i
(Typic Torrox). lVhen additional confirmation wns r.ecessary, miscible

xix
displacement data from various published sources were also utilized.
3 M MTritiated water ( H
20) and C-methano1 ( CH
30H) served as the
reference nonreactive solutes, while pic10ram herbicide (4-amino-3,5,6-
trich1oropico1inic acid) and chloride were used as the adsorbed
solutes throughout this study.
Early in the study it was recognized that the shape, location,
and certain other measurable properties of the breakthrough curves
from miscible displacement of both. reactive and nonreactive solutes
through soils were very useful in gaining an insight into the gross
behavior of the solute within the soil column during its displacement.
Several qualitative and quantitative techniques were proposed for
analysis of miscible displacement data (Chapter 1) and were found
useful in evaluation of the experimental breakthrough curves for
reactive solutes (Chapter 2). A simple quantitative miscible
displacement technique was developed and tested for quantification
of the nonsolvent fraction of soil water that is excluded from
solute transport processes in soils (Chapter 3). The pore-size
distribution of the Molokai subsoil column was determined by a
commonly used technique and also by a unique method which has not
been used previously in soils research (Chapter 4). Pore-velocity
distributions computed from these pore-size distributions were then
used as inputs in the capillary bundle model (Lindstrom and Boersma,
1971) to predict solute dispersion in the Mololmi soil (Chapter 5).
For ease of presentation, this dissertation has been organized
into five chapters, each dealing with a major aspect of the overall
objectives of the study. Each chapter is a complete unit in that it

xx
contains sections for abstract, introduction, theory, materials and
nlethods, and results and discussion. Some major conclusions reached
from this study are listed in Chapte~ 6, entitled General Conclusions.
Several ancillary developments which were essential to the completion
of the study and yet are either too long to fit in any chapter or were
of general application throughout the dissertation are presented in
six appendices. All of the references cited in this dissertation
are pooled and presented in one section at the end.

CHAPTER 1
TECHNIQUES FOR QUALITATIVE AND QUANTITATIVE ANALYSIS
OF BREAKTHROUGH CURVES FROM MISCIBLE DISPIACEMENT
OF REACTIVE AND NONREACTIVE SOLUTES IN SOILS:
1. DEVELOPMENT

ABSTRACT
Miscible dispi~cement techniques are widely used to study
dispersion of various solutes in soils. The data obtained from such
studies are conventionally presented as plots of relative solute
concentration in the effluent versus cumulative effluent volume.
These plots are commonly referred to as the breakthrough curves or
BTCs. Several techniques for qualitative and quantitative analysis
of such BTCs are developed to enable an understanding of the gross
behavior of nonreactive and reactive solutes in soils during their
displacement through soils.
BTC obtained from tracer solution displacing tracer-free solution
initially saturating the voids of the soil column is defined as the
Tracer-In BTC, while the opposite technique yields Tracer-Out BTC.
It was recognized that much more rewarding interpretations of the
BTC data could be made by treating them as independent units, and
plotting the "mirror-image" or the inverted Out BTC along with the In
BTC.
Six principal characteristic properties of the BTCs from
frontal displacement, where a step chap-ge in inlet solute concentration
occurs suddenly, were utilized in proposing some BTC models for the
displacement of both reactive and nonreactive solutes in soils.
These properties are: (i) shape, (ii) location, (iii) area above the
BTC, (iv) area under the BTC, (v) relative locations of the In and the
Out BTCs, and (vi) slope.
~vo basic BTC models for nonreactive solutes were developed
based on the extent to which mixing between the displacing and the

3
displaced solutions takes place. Total lack of mixing or piston flow
(Model I) is an ideal case, and does not occur for Newtonian fluids.
Longitudinal dispersion (Model II) results in BTCs that are sigmoidal
in shape. Whereas a narrow and symmetrical pore-size distribution
in the soil results in a symmetrical BTC (Model lIA), asymmetrical
BTCs are obtained when the soil possesses wide-range in its pore-sizes
(Model lIB). Quantitative indices, which allow the determination of
whethe~ all or only a fraction of soil water were mobile, and also
the fraction temporarily excluded from flow, were developed.
A reactive solute can be either excluded from soil surfaces
(Model III) or be retained on them due to adsorption (Model IV).
Three sub-models can be developed for an adsorbed solute depending on
the relative ease of desorption, which influences the location of the
Out BTC and the area above it, with respect to that of the In BTC.
Hysteresis in adsorption, which results in more solute being retained
on the soil surfaces during desorption than during adsorption, causes
the Out BTC to be translated to the left of the In BTC (Model IVA),
while identical In and Out BTCs are obtained when kinetics of adsorp
tion and desorption are similar (Model IVC). However, when desorption
kinetics are more rapid than kinetics of adsorption, the resulting
Out BTC is shifted to the right in the early phases, but in the later
phases is transl~ted to the left (Model IVC).
Equations are presented to allow for the estimation of the
fraction of soil near equilibrium for adsorption during In displacement
(defined as EQUIL), and that desorbed by the soil during Out Displace
ment (defined DESOR).

INTRODUCTION
Miscible displacement methodology introduced into soils
literature by Nielsen and Biggar (1961) is most commonly used to study
solute dispersion through soils. Two different displacement techniques,
frontal and ~al, are available. In the former technique, solution
containing a given concentration (Co) of solute of interest is passed
through an initially water-saturated soil column at a constant solution
flux unti1 the effluent concentration (C) is equal to that in the
input solution (i.e., CICo = 1.00). In the zonal displacement method,
a pulse of the tracer solution of a given concentration (Co) and
volume (Vp) is introduced into an initially water-saturated soil
column, and displaced at a constant solution flux by a tracer-free
solution until no more tracer can be detected in the effluent.
The resulting data are conventionally presented as plots of
relative solute concentration (C/C o) versus cumulative effluent
volume (V) or number of pore volumes (VIVo, where Vo represents
total water-filled pore volume in the column). These plots are
generally referred to as the breakthrough curves or BTCs for
brevity. BTCs from frontal displacement are sigmoidal in shape,
while those from zonal displacement are bell-shaped.
Before presenting some BTC models, let us briefly examine some
important factors that are responsible for solute dispersion in soils,
and processes that influence the properties of BTCs resulting from
miscible displacement studies. Consider a frontal displacement,
where the tracer concentration at the inlet end of the soil column,
is initially saturated with tracer-free solution suddenly rises to
C. We will describe the progression of the tracer front in the column.o

5
At very short times (t~ 0), mixing between the tracer front
entering the column and tracer-free solution within the column is
by diffusion alone due to longitudinal concentration gradients,
and the tracer front is very abrupt. However, at larger times
(t = tl' tl > 0), convective dispersion is the dominant process
responsible for the advance of the tracer front, while radial diffusion
results in a nearly homogeneous (radially) and diffuse tracer front
(Figure l-lA and I-IB). At still longer times (t = t 2), some fraction
of the pore spaces in the column behind the front is completely
invaded by the tracer solution, and the diffuse tracer front advances
still farther in the column due to both convective and diffusive
transport (Figure l-lA and I-IB).
The advance of the tracer front is slower for an adsorbed solute,
since some of the tracer is temporarily immobilized due to retention
on the soil. This is illustrated schematically in Figure I-IC and
I-ID for a system which in all other aspects is exactly identical to
that described for a nonreactive solute (Figure l-lA, I-IB). The
retardation of the advance of the wetting front is proportional to the
extent of adsorption of the reactive solute by soil.
In this presentation, we shall confine our attention to the BTCs
obtained from such frontal displacements (solution concentration
monitored at the outlet end of the column). The major objective of
this chapter is to develop some very useful qualitative and quantitative
techniques for analysis of BTCs obtained from frontal displacement.
For ease of organization, evaluation of these techniques with experi
mental BTC data for reactive solute displacement in certain Hawaiian
soils w~ll be presented in Chapter 2. Applicability of these

FLO W ----;»DIRECTION
6
NONREACTIVE SOLUTE
A
t=tz
B
C
D
1
oCJ
........CJ
oCJ
........CJ
11--__
ADSORBED SOLUTE
DISTANCE ALONG COLUMN
Figure 1-1. Schematic representation of the advance of atracer front (A and C) and corresponding relative soluteconcentration profiles within the soil column (B and D)
for nonreactive and adsorbed solute

7
techniques is further extended in Clmpter 3 to quantification of the
fraction of soil water excluded from flow processes in Hydrandepts
and Oxisols of Hawaii.

NONREACTIVE SOLUTES
BTC Models
Dispersion of solutes through soils has generally been described
by two principal characteristics, the shape and position, of the BTC
resulting from a frontal displacement for a given soil-solute system.
The position of the BTC is referenced to the intersection of
C/Co = 0.5 and V = Vo ' and the symmetry of thp. BTC about this
reference or lack of such symmetry is described.
~vo basic BTC models for nonreactive solutes, presented by
Danckwerts (1953) and Nielsen and Biggar (1962), are summarized in
Figure 1~2. Model I represents piston flo~, when there is no mixing
between the displaced and displacing solutions in the soil column.
The BTC from such an idealized displacement is described by a step
function with C/co ::; 0 for V< Vo ' and C/Co ::; 1.00 for V > Vo
(Figur.e l-3A). Perfect piston flow as shown in Figure l-3A, however,
will never occur with Newtonian fluids (Danckwerts, 1953). Longitu
dinal mixing between the displaced and displacing fluid fronts within
the soil column can be described by Model II. Miscible displacement
of nonreactive solutes through an "ideal" soil will result in a
symmetrical BTC which passes through the intersection of C/Co ::; 0.5
and V ::; Va. An ideal soil is presumed to possess a narrow and normal
pore-size distribution. The BTC resulting from such a soil is shown
in Figure l-3B. However, in soils with a wide-range in pore-sizes,
the resulting BTC is asymmetrical and generally shifted to the left
of the reference intersection (Figure l-4B). This type of BTCs are
common for miscible displacement of nonreactive solutes through

NONREACTIVE SOLUTES
, I I
No Mixing or
Piston Flow
8Narrow pore-size
distribution
I MODEl IIAI
MixingI
Wide-range
pore-size
distribution
I MO~EL IIB I
Figure 1-2. Flow-chart for a classification scheme for the BTCs fromdisplacement of nonreactive solutes through soils. Summary ofthe system originally proposed by Danckwerts (1953) and Nielsen
and Biggar (1962). See also Figures 1-3 and 1-4.\0

11 'to. <' <: '" < '" <:: <::, I 'IJ
0MODEL I
u
,'\. y- J"
-v '\. '\. '\.1
u
MODEL IIA
0u
..-u
uz
.0u
U
f:£l
Z
Represents
0
~
U
...:l
f:£l
0
~
tr.l V
s= o~...:l0
~""""~,,""""",,)f ~1-1
tr.lV Iv .l:S·1 0
~
s=eo·
...:l
1-1
gaj~
Vj 0
EFFLUENT VOL~~, V
~
EFFLUENT VOLUME, V
Figure 1-3. Two basic BTC models for miscible displacement of nonreactivesolutes through an ideal soil. (A) Piston Flow,
and (B) Longitudinal dispersion.
l-'o

VelVo '" 1.0 .
B11 I :;;> I
~
~
t.,)
~t.,)
WH;:l
Sen
ot.,)t.,)
MODEL IIA
Vo
A
v Iv ~ "1.0e 0
11 I ....... .....J
0t.,)-t.,)~
t.,)z0t.,)
WH;:l~0en
~1-1H
:.J~ . ~
EFFLUENT VOLUME. V EFFLUENT VOLUME, V
Figure 1-4. BTC models for miscible displacement of nonreactive soiutesin soils when some fraction of the soil ~v.ater is (A) completely excl~ded
and (B) temporarily excluded from flow processes. Model IIA curve isshown in both cases as reference. I-'
I-'

12
aggregated soils, where rapid flow through macropore sequences results
in the intra-aggregate micropores being bypassed (Nielsen and Biggar,
1962; Krupp and Elrick, 1968; Cagauan, 1969; Green, Rao, and Corey,
1972). Exchange of the solute between macropores and micropores is
a slow, diffusion-controlled process. As a result, extensive tailing
in reaching cleo = 1 and early arrival of tracer are characteristics
of BTCs from these soils (Figure l-4B). The exclusion of the
micropores is only temporary and all soil water will eventually
participate in the flow process.
A BTC of the type shown in Figure l-4A is obtained when a fraction
of the soil water is completely excluded from the flow. Examples of
such an exclusion are demonstrated in a later chapter of this
dissertation (see Chapter 3).
Effective Pore Volume
Orlob and Radhakrishna (1958) used a third characteristic of the
BTC, the area above the curve, to measure the effective pore volume
(Ve) or that volume which actively participated in flow, and to
determine the fraction of stagnant pore volume in a soil column.
This is possible because the area above the BTC, corresponding to
the integral,
(1-1)
represents the volume of soil water that was effective in the flow
process. By the same argument then, the area above the BTC for
piston flow (Model I) would represent Vo• For an "ideal" soil Vo is
equal to Ve ; the ratio Ve/Vo in this case is equal to 1. Danckwerts

13
(1953) assumed that for displacement of nonreactive solutes, VelVo
is always equal to 1. However, in some special cases, when some of
the soil water does not participate in flow, such as in cases of air
entrapment (Orlob and Radhakrishna, 1958) and existence of a non-
solvent fraction of soil water (Rao and Green, 1973; see also Chapter
3), there is a general translation of the BTC to the left and the
decrease in area above the BTC is reflected by VelVo being less than 1.
Holdback
Orlob and Radh~krishnars (1958) approach is capable of deter-
mining whether all or only part of the soil water was active in flow,
but fails to yield any index of temporary exclusion of certain pore-
sequences. It was proposed by Danckwerts (1953) that the quantity H,
called holdback, represented by the integral
(1-2)
be used as an index for such exclusion (Figure 1-5). The value of H
may vary from 0 for perfect piston flow to values approachLng 1 when
most of the soil water in the column is deadwater (Chapter 3,
Figure 3-1).
The concept of holdback was developed by Dan~kwerts (1953) for
flow of fluids through pipes. He used piston flow (Model I) as the
reference in defining H (equation 1-2). It is implied in his approach
that nonzero values for H indicate the presence of deadwater. Some
apparent drawbacks of this approach are that (i) even if all soil
water actively participates in flow, nonzero values for H are obtained

EFFLUF.NT VOLUME, V
Figure 1-5. Graphical representation of DanclGNert's(1953) concept of Holdback (H) as an index oftemporary exclusion of a certain fraction of soil
water fr.om flow processes.
14

15
due to longitudinal mixing (Model II), indicating the presence of
deadwater; and (if) it fails to consider the dispersion belmvior of
reactive solutes displaced through soils.
We have just seen that miscible displacement of nonreactive
solutes through an "ideal" soil results in a symmetrical and sigmoidal
BTC that passes through the reference intersection of C/Co = 0.5
and V = Vo (Model lIA). The characteristic ratio VelVo in this case
is equal to 1.0. BTC Model lIA is used as a standard reference in
describing the BTCs from other situations. We have also noted that
in soils with a wide-range of pore-sizes, such as in aggregated soils,
the BTCs are generally asymmetrical and are translated to the left
of Model lIA BTC. The ratio VelVo for Model lIB is less than 1 if
some fraction of the soil water is excluded from flow and is equal
to 1 if all soil water is mobile.

REACTIVE SOLUTES
BTC Models
A reactive solute can either be adsorbed on soil surfaces or be
excluded due to negative adsorption. The latter results in a BTC
that is translated to the left of Model II BTC and the ratio VelVo
is less than 1.0 (Model III, Figure 1-6A). It is immediately apparent
that negative adsorption yields a BTC that is similar to the one from
Model lIB (Figure 1-4A). Positive adsorption causes the BTC to be
translated to the right of Model II BTC (Model IV, Figure 1-6B) and
the increase in the area above the BTC is reflected in the ratio
VelVo being greater than 1.0. The degree of shift of the BTC either
to the left or to the right is dependent on the extent of negative or
positive adsorption, respectively, of the solute by soil. Thus,
Orlob and Radhakrishna's (1958) approach can be extended to the study
of miscible displacement of reactive solutes through soils. It is of
interest to compare the adsorption capabilities of the soil under
both equilibrium and flow conditions, with an intent of determining
the degree of disequilibrium that exist in the soil column during
displacement studies. The following method of computation is useful
in enabling us to do just that.
Retardation Factors
The amount of solute adsorbed by the soil at various solution
concentrations can be determined under equilibrium conditions by
several techniques. The equilibrium distribution coefficient,
Kd (cm3/g), which is defined to be the ratio of amount of solute in

c,p......U
uzou~Eo<
~til
~1-4
j~
A1 I I 7;P I
l-mDEL III
V/Vo <1.0
"0
EFFLUENT VOLUME, V
ouu
...uzou~
§otil
~H
S~
a'I I I ::;:;0 I
v Iv > 1.0e 0
EFFLUENT VOLUME, V
Figure 1-6. Two basic BTC models for miscible displacement of reactivesolute through soils. (A). Negative adsorption and (B) Positiveadsorption. Model I~ BTC is repeated in both cases as
a reference. l-'"'-J

18
the adsorbed phase (Cs ' ~g/g) to that in the solution phase (Ce , ~g/cm3)
at equilibrium, is a very useful index of the extent of adsorption.
For a soil packed into a column, whose total volume is Vt
(cm3) , at a bulk density of p (g/cm3) with a water-saturated porosity
of Ss (cm3/cm3 ) , the effective pore volume (Ve) will be the sum of
actual water-filled void volume (Vo) and the apparent increase in
pore volume due to sorption (Vtp ~)~ In other words,
(1-3)
Note that Vtp is equal to the total mass of the soil packed into the
soil column and that Vt = vo/Ss. Therefore, equation 1-3 can be
rewritten as,
(1-4)
or
(1-5)
The expression on the right side of equation 1-5 is the retarda-
tion factor used by Hashimoto, Deshpande, and Thomas (1964) and also
by Davidson and Chang (1972). Positive adsorption of the solute
results in a positive value for Kd ; VelVo is therefore greater than
1.0. However, in cases of negative adsorption, Kci has a negative
value and the fraction pKd/S s is negative, hence VelVo is less than
1. o.
The ratio on the left side of equation 1-5 can be readily
calculated from the miscible displacement BTC data as described in
previous sections of this presentation. Ve represents the area above

19
the BTC for the solute under investigation and Vo is represented by
the area above the BTC for the reference solute which is knm~ to
have no interaction with the soil.
The fraction VelVo (equation 1-5) will be subsequently referred
to as the column retardation factor and that on the right side of the
equation 1-5 is defined to be the equilibrium retardation factor.
Due to nonequilibrium conditions that exist in the soil columns
during displacement, the column retardation factor is generally
expected to be smaller than the equilibrium retardation factor.
Therefore, a comparison of these two values should reveal the degree
of disequilibrium for adsorption in a column during flow. This is
important since several transport models assume instantaneous
equilibrium conditions in the soil column for solute adsorption. The
value of a column retardation factor will approach that of an
equilibrium retardation factor as the pore-velocity of displacement
decreases and equilibrium conditions are established in the soil
column.
By using a single value for Kd in computation of the equilibrium
retardation factors i.n equation (1-5), a linear relationship between
solution and adsorbed concentrations was assumed to exist (i.e., the
adsorption isotherm is linear). After an extensive survey of all
available adsorption data for pesticide-soil systems, Hamaker and
TIlompson (1972) concluded that the assumption of linearity for adsorp
tion isotherms may not be valid for several cases. They suggested
that deviations from linearity increase exponentially with increasing
concentrations when adsorption is nonlinear. In such cases, it may
be necessary to use a function, rather than a simple constant, to

20
relate solution and adsorbed phase solute concentrations. The
equilibrium distribution coefficient (Kd) is not a constant in such
cases, but is dependent on the equilibrium solution concentration.
As a first approximation in such cases, we chose to use the Kd
value measured at equilibrium solution concentration equal to that of
Co' since the soil surfaces must ultimately come to equilibrium with
the solution concentration of Co which invades all pores in the soil
column in a frontal displacement. This choice can be further justified
by the fact that Kd at C = Co also is equal to the weighted mean
value of retardation factor in the range of solution concentrations
of C = 0 to C = Co. Proof of this identity is presented in detail in
Appendix 6. Thus, we could use a simple constant in the estimation
of the column retardation factor for the case of nonlinear adsorption
isotherm. It must be realized that this is only an approximation,
and exact values must be determined by use of function rather than
constants to relate the adsorbed and solution concentrations. However,
for our purposes, we are only interested in quantifying the gross
effects of adsorption rather than describing the actual shape of the
BTC. Therefore, approximations of this kind are assumed to be
satisfactory.
We also note that, if both adsorbed and solution phase concentra-
tions were expressed in terms of unit column volumes (symbols with
asterisk as a superscript),
* *C = pC and C = 8 Cs s e s e
* / 8 PKd/8s~ = pC C =s s e
(1-6a)
(1-6b)

21
which when substituted into equation (1-5) yields the relationship,
= (1-7)
Influence of Normalized Rate of Adsorption
Consider a soil column initially saturated with tracer-free
solution, through which tracer solution is being displaced at a
constant flux and the tracer concentration in the effluent is being
monitored. If the tracer is preferentially adsorbed by the soil, it
is seen that the effluent solution is devoid of any tracer for a
period of time. As more and more tracer molecules occupy the limited
number of adsorption sites available to them, a small fraction of the
tracer appears in the effluent. The tracer concentration in the
effluent will rise as increasing volumes of the tracer solution are
displaced through the soil column, until it is equal to that in the
input solution. At this point, the entire soil mass in the column
has been saturated with the tracer to its adsorption capacity at the
concentration of the input solution. An example of such a BTC was
presented in Figure l-6B as a model of adsorption (Model IV).
Two definitions for the adsorption rate can be defined. The
first is a normalized rate which describes the rate at which the soil
mass is saturated by the tracer, and can be measured by observing the
time required for the CICo to rise from zero to 1.00. The second is
the absolute rate of mass transfer between the liquid and solid
phases. Marks et al. (1963) presented a mathematical model for
computation of the absolute rate of adsorption from BTC data for a
given set of experimental conditions. We are at present concerned

22
with the former, i.e., the relative rate of adsorption only.
If adsorption were to proceed at an infinitely large rate
(~+ 00), as the tracer front advances in the soil column the
soil mass immediately adsorbs all the tracer molecules, thus the
tracer solution concentration at the effluent end will be equal to
zero until such a time that all of the soil mass is completely
saturated. This would result in a BTC similar in shape to that from
piston displacement (Model I), but shifted to the right in proportion
to the Kd (equation 1-5). As the rate of adsorption decreases, the
resulting BTC has the more familiar sigmoidal shape, and the shift
to the right and its slope would be a function of displacement
variables such as particle size, flow velocity, and degree of
saturation. To facilitate comparison of the slopes of the BTC, and
thus the adsorption rates, we normalize the effluent volume axis in
terms of the midpoint of the BTC (defined to be at CICo = 0.5).
Three such normalized BTCs are illustrated in Figure 1-7 to
demonstrate the effects of the relative adsorption rate on the
slopes of the BTC.
Influence of Hysteresis in Adsorption
Most frontal displacement studies for adsorbed solutes reported
in the literature have dealt only with the adsorption phase of the
displacement. In such studies, tracer-free solution initially
saturating the soil column is displaced with tracer solution at a
constant solution flux, and the tracer concentration in the effJ.'.lent
is monitored. The problem of the desorption phase, i.e., displace
ment of tracer solution saturating the column with tracer-free

ou......u
MODEL IV
+
- ve o
k ='.(1()
r,,/
/I': =small
V r
+ ve
23
NOID1ALIZED AXIS •
Figure 1-7. Normalized BTC for an adsorbed soluteillustrating the influence of the relative rate
of adsorption (kr ) on the slope of the BTC

24
solution has been generally overlooked.
In the present discussion, we shall refer to the adsorption
phase BTC as Tracer-In and that from desorption phase as Tracer-Out.
Relative solute concentrations (C/Co) in the effluent for the
Tracer-In BTC start at zero and reach a maximum of 1.00 when all of
the soil mass in the column is saturated by that tracer at
C/Co = 1.0. The Tracer-Out BTC values, on the other hand, start at
C/Co equal to 1.0 and reach zero when all of the tracer has been
displaced from the soil column.
In zonal displacement with adsorbed solutes, the left-hand
portion of the BTC represents the adsorption phase, while the right
hand portion of the BTC is a result of desorption of the solute once
the solute peak has passed. It is generally accepted that the
observed positive skewness in the BTCs for adsorbed solutes, i.e.,
tailing on the desorption phase, is a result of non-singular adsorp
tion and desorption processes (Swanson and Dutt, 1973; van Genuchten,
Davidson, and Wierenga, 1974). Hysteresis in the adsorption process
causes more solute to be retained on the solid phase during desorption
than during the adsorption phase. Observed hysteresis in adsorption
of polymers and gases on solids has a sound foundation in principles
of physical chemistry of surfaces, and may be a~tributed to 'chemi
sorption' (Kipling, 1965). However, the concept of adsorption
hysteresis for weakly adsorbed solutes has not been completely
rp.solved in soils literature. It remains a fact that hysteresis in
adsorption of herbicides by soils Ims been observed both in equilibrium
and transient systems (Swanson and Dutt, 1973; Hornsby and Davidson,

25
1973; van Genuchten et al~, 1974), and this factor has been successfully
incorporated into solute transport models (Hornsby and Davidson, 1973;
van Genuchten et a1., 1974). An attempt is made here to present some
possible factors that are responsible for the observed hysteresis
in adsorption.
Two kinds of adsorption hysteresis are recognizable. The first,
referred to as kinetic hysteresis, is a consequence of desorption
kinetics being slower than kinetics of adsorption, resulting in lack
of equilibrium during desorption. Differences in adsorption and
desorption energies or surface migration of adsorbed molecules to
less accessible sites may be responsible for slower desorption
kinetics. Since miscible displacement studies are transient in
nature, the effects of kinetic hysteresis, if it exists, are expected
to be significant.
A second type of hysteresis, defined as non-kinetic hysteresis,
is due to (i) lack of the presence of competing ions in the solution
phase during desorption for ion exchange reactions, (ii) a change in
adsorption mechanism over time for systems in which several adsorption
mechanisms are operative, some of which may not be reversible, and
(iii) changing availability of new surfaces or sites for adsorption,
such as in the case of structural breakdown of soil aggregates, during
the desorption phase. As an example of case (i), consider chloride
adsorbed on the positive charge sites of a soil. If during desorption
the displacing solution contained only anions such as bicarbonates
and nitrates, we may observe some non-kinetic hysteresis. However,
if the solution phase were composed of anions such as sulphates and

26
phosphates, chloride would be readily desorbed from the soil surfaces,
being replaced by the multivalent anions that are preferentially adsorbed
by soil.
We will present here a technique, which utilizes relative locations
of the Tracer-In and Tracer-Out BTCs and the areas above them in an
attempt to gain insight into the influence of both types of adsorption
hysteresis just discussed on solute dispersion and also to quantify
the fraction of the adsorbed solute that could not be desorbed during
the Tracer-Out displacement. Such a measurement technique can also be
qualitatively related to the hysteresis loops observed in equilibrium
adsorption/desorption isotherms.
Conventionally the desorption phase of the frontal BTC, if
measured, is treated as a continuation of the adsorption phase (as
though it were a zonal displacement). As an example, BTC data from
the work of Nielsen and Biggar (1961) for chloride displacement through
Yolo loam soil are reproduced in Figure 1-8. Snelling (1968) and
Snelling, Hobbs, and Powers (1969) were the first to recognize that a
much more rewarding interpretation of the BTC data can be made if In
and Out BTCs were treated as independent units. They compared the In
BTC with the mirror image of separately plotted Out BTC to draw
conclusions regarding the reversibility of atrazine (2-chloro-4
(ethylamino)-6-(isopropyl-amino)-~triazine) herbicide adsorption
during its displacement through several soils. l~upp and Elrick (1968)
attempted a plotting technique, where In BTC is plotted as C/'Co versus
V, and the mirror image of Out BTC (i.e., l-C/Co versus V) is plotted
along with it, to investigate the effects of density and viscocity

~AA
t::..t::..
~--L~1~
D.t::.
~A~A
o Tracer-InD.. Tracer-Out
___.... Tracer-Out replotted
1 t :; __ io"'.) be H
0°"'U
tEfftU ENT VOLUME
Figure 1-8. Tracer-In and Tracer-Out BTCs obtained from miscible displacementof O.Ol~ CaS0
4with O.Ol~ CaCl
Zthrough a column of Yolo loam. The BTC
shmvn is that for chloride (Or~ginal data of Nielsen and Biggar, 1961).
N
""

28
differences on solute dispersion through glass bead (inert) media.
Green, Rao and Corey (1972) have also used the same plotting scheme
to study miscible displacement of tritiated water and picloram
(4-amino-3,5,6-trichloro picolinic acid) herbicide through saturated
columns of Molokai and Cecil subsoils, but made only limited
interpretations from it. Snelling (1968) and Snelling et al. (1969)
utilized the characteristic effluent volume when C/Co had reached 1.0
for the In curve or zero for the Out curve as an index of the adsorption
capability of the soil. We Will, however, compare the areas above the
In and Out BTCs to investigate the influence of adsorption hysteresis
on solute dispersion in soils.
Nielsen and Biggar's (1961) data are replotted as described above
in Figure 1-8. The differences between In and Out BTCs may have been
the result of density and viscocity differences between the O.OlN
CaS04 and O.l~ CaC12 which were used both as the displaced and
displacing solutions (Rose and Passioura, 1971).
BTC models for the miscible displacement of reactive solutes
through soils, proposed on the basis of relative locations of In and
Out BTCs and the areas above them (or corresponding column retardation
factors), are summarized in Figure 1-9. The differences between
exclusion (Model III) and adsorption (Model IV) of the solute have
already been discussed in an earlier part of this presentation.
Three sub-models can be developed for adsorbed solute displacement
depending on the ease of desorption, which influences the location of
the Out BTC in relation to that of the In BTC. These sub-models are
illustrated in Figure 1-10. Notice that while the Tracer-In BTC is
plotted the conventional way (Cleo versus V), that of Tracer-Out is

REACTIVE SOLUTES. 1 ---,I I
EXCLUSION ADSORPTION
1MOdL III I IMoL IV II
~
Ads> Des
IMOd11 IVA I
,- I
Ads = Des Ads < Des
--L-. II~ 1Model IVC[
Figure 1-9. A flow-chart for the BTC models for miscible displacementof reactive solutes through soils. Abbreviations Ads and Des
refer to adsorption and desorption respectively.
N\0

30
EFFLUENT VOLID.m, V
Figure 1-10. BTC models for miscible displacement of adsorbedsolutes through soils. (A) Adsorption Desorption, (B)Adsorption=Desorption, and (C) Adsorption Desorption.BTC model IIA (curve 1) is repeated as the case of noadsorption. Curve 2 is for Tracer-In and curves 3 and4 are for Tracer-Out. Note that CICo vs. V is plottedfor Tracer-In, while I-C/Co is plotted for Tracer-Out.

31
shown as (l-C/C o) versus V.
As an extreme case of non-kinetic hysteresis, consider the case
of a solute which is not desorbed by the soil. The In BTC (curve 2)
would be, as we now know, shifted to the right of Model IIA BTC
(curve 1, Figure 1-10A). The column retardation factor for the In
curve, as computed from the area above the BTC, would correspond to
the equilibrium distribution coefficient (Kd) if equilibrium conditions
prevailed in the soil column. However, if the solute retained on the
soil surfaces is not desorbed and only the solute in the solution
phase is displaced, the resulting Out BTC (curve 4) would be similar
in location to that from Model IIA (curve 1), except for the differences
due to disparity in molecular diffusion coefficients of the reference
and adsorbed solutes (Figure 1-10A). The retardation factor from curve
4, corresponding to the case of complete lack of desorption, is then
equal to 1.00, the same as that for a nonreactive solute displacement.
For the case when adsorption hysteresis (either kinetic or non-kinetic
or both) results in some fraction of the solute being retained in the
soil column, the Out BTC (curve 3) is also shifted to the left of the
In BTC (curve 2), but not as much as curve 4 (Figure 1-10A). The
column retardation factor for such a case is greater than 1.00, but
less tIffin that for the In BTC if non-kinetic hysteresis is operative,
and equal to that of In BTC if kinetic hysteresis is responsible for
the shift to left.
When adsorption and desorption kinetics are similar and adsorption
is reversible (as defined previously), both In and Out BTCs (curves
marked 2 and 3) are identical, and are shifted equally to the right of
Model IIA BTC marked curve 2 (Figure 1-10B). Identical In and Out
32
BTCs, as illustrated, are more readily obtained from displacement of
nonreactive than reactive solutes, since in case of the former,
effects of diffusion and dispersion are identical both during In and
Out displacements. In case of the reactive solutes, the influence of
hysteresis is likely to cause the In and Out BTCs to be dissimilar in
shape and/or location.
Model IVC (Figure 1-9) represents the case when desorption kinetics
are more rapid than kinetics of adsorption. As illustrated in Figure
l-lOC, the early part of the Out BTC (curve 3) is shifted to the right
of the In BTC (curve 2). Since the condition of conservation of mass
requires that the area above the Out BTC be either less tlmn or equal
to that above the In BTC, the later part of the Out BTC is shifted to
ieft of In BTC such that the column retardation factors from both
of these curves are equal (Figure l-lOC).
So far, we have examined the cases when the soil column could act
as a sink for the adsorbed solutes. Now we will look at the case
when the soil is a source. Such a situation is encountered in the case
of nitrification of added ammonium, e.g. in the simultaneous miscible
displacement of nitrate and ammonium through soil columns. In these
cases, the Out BTC is shifted to the right of the In BTC, and the
increase in the column retardation factor is proportional to the
nitrate production. This is a special case, and hence is not considered
among other BTC models proposed.
In as much as the area above the Tracer-In BTC yields an index of
the degree of disequilibrium in the soil column during displacement, a

33
comparison of the areas above the In and Out BTCs also yields an index
of the fraction of solute readily desorbed by the soil. A simple
calculation method, involving the column retardation factors, is
presented below to demonstrate how such a quantification can be made.
Let us define the following quantities for an adsorbed solute
which will be used in the computation method:
(Ve/Vo) out
(Ve /Vo)equi1
= column retardation factor obtained from
Tracer-In BTC (1-1.00 by definition)
= column retardation factor obtained from
Tracer -Out BTC [1. 00 ~ (Ve/V0) out ~ (Ve/V0) in ]
= equilibri.um retardation factor calculated
from equation 1-5
= column retardation factor obtained for the
BTC of reference solute (Model IIA)
van Genuchten et a1. (1974) defined the term FREQ as the ratio
between the retardation distances of Tracer-In BTCs from equilibrium
and nonequilibrium conditions. However, the area above such BTCs is
a much more reliable and accurate estimate rather than the retardation
distances, which depend on the shape of the BTC. Hence, we will
define the quantity EQUIL to quantify the degree of equilibrium
conditions in the column during solute displacement studies, as follows:
(Ve/Vo)in (Ve/Vo) refEQUIL = (1-8)
(Ve/Vo)equil (Ve/Vo) ref

34
The value of EQUIL varies from 0 for the case of no adsorption
(Model IIA) to 1.0 when complete equilibrium conditions existed in the
column during displacement. It must be recognized that the magnitude
of EQUIL is a function of the average pore-velocity (vo) of displace-
ment; as the mean residence times decrease with increasing velocities,
the value of EQUIL decreases. A schematic representation of EQUIL is
presented in Figure 1-11.
Let us define the fraction readily desorbed as DESOR and that
retained in the soil column as NONDES. In the following discussion we
will develop a relationship between DESOR and NONDES.
DESOR = 1
or
DESOR =
DESOR = 1 (1-9a)
(1-9b)
(1-9c)
Note that the fraction in brackets on the right side of equation
l-9b is the definition of NONDES. With the knowledge that (Ve/Vo)ref
is equal to 1.00, equation 1-9c can be further reduced to,
DESOR = (1-10)

35
~---"7__EQUIL
ou'"u
vo
EFFLUENT VOLUME Il V
Figure 1-11. BTCs for miscible displacement of reactivesolute which is adsorbed (Model IV) by the soil.Model lIA BTC is the reference for no adsorption,while the two BTCs sho\vu as dashed lines are forModel IV. The shaded area represents the reductionin column retardation factor (equation 1-8) due to
disequilibrium conditions in column.

36
0 TRACER-INC,)
---C,)
.C,)
SC,)
~H
~....1ga
0V
0
1IS
........0
t)~....C,) TRACER-OUTIr-l.......
.C,)
fVe/Vo)out - (Ve/Vo)re;]z0C,)
g;H
j~
0V
0
EFFLUENT VOLUME, V
Figure 1-12. Schematic representation of the calculation of thefraction of the solute that is desorbed (DESOR; equation 1-10)from the soil column during Tracer-Out displacement. Curve 1is BTC for Model IIA, curve 2 is Tracer-In for BTC Model IVA,and curve 3 is Tracer-Out BTC for Model IVA. The shaded arearepresents the increase in pore volumes due either to
adsorption or desorption.

37
A diagramatic representation of equation 1-10 is shovm in
Figure 1-12; the shaded areas in A and B represent the denominator and
numerator, respectively, in equation 1-10. The magnitude of DESOR
varies from 0 for the case of no desorption to 1.0 when the adsorption
is a reversible process. Effects of hysteresis are reflected by 0<
DESOR< 1.
Thus it is possible not only to compute the fraction displaced
from equilibrium (equation 1-8) during In displacement, but also the
fraction of solute that will be readily desorbed from the soil during
Out displacement (equation 1-10). Such a calculation would not have
been possible without the knowledge of the Tracer-Out BTC for an
adsorbed solute. At present, it is also possible to relate, at least
qualitatively, the magnitude of EQUIL and DESOR to adsorption kinetics
and to the hysteresis loops in equilibrium adsorption/desorption
isotherms, respectively.
In summary, certain important characteristics of the Tracer-In
and the Tracer-Out BTCs obtained from miscible displacement of non
reactive and reactive solutes through soils were very useful in
qualitative and quantitative description of the gross effects of
processes that influence solute dispersion in soils. In the following
two chapters, techniques developed here are applied for miscible
displacement of reactive solutes (Chapter 2) and nonreactive solutes
(Chapter 3) through some Hawaiian soils, and also for analysis of
selected published BTC data. Finally, a brief summary of the concepts
presented in this chapter is given in Appendix 1.

CHAPTER 2
TECHNIQUES FOR QUALITATIVE AND QUANTITATIVE ANALYSIS
OF BREAKTHROUGH CURVES FROM MISCIBLE DISPlACEMENT OF
REACTIVE AND NONREACTIVE SOLUTES IN SO ILS :
2. APPLICATION TO REACTIVE SOLUTES

ABSTRACT
Quantitative and qualitative techniques proposed for the analysis
of BTC data from miscible displacement of reactive solutes through soils
were evaluated with experimental data obtained from several soil-
solute systems. By utilizing the areas above the Tracer-In and the
Tracer-Out BTCs, it was possible to quantify the fraction of soil
in equilibrium with the solute (denoted as EQUIL) during the adsorp
tion phase, and the fraction of solute desorbed from the soil column
(denoted as DESOR) during the desorption phase of the displacement.
Qualitative differences in the rates of adsorption of solutes could
be noticed by a comparison of the slopes of the normalized BTCs.
Non-kinetic hysteresis loops obtained from equilibrium adsorption/
desorption experiments with a picloram herbicide-Hilo subsoil system
could be qualitatively related to the relative locations of the
Tracer-In and the Tracer-Out BTCs obtained from miscible displacement
of picloram through a saturated column of Hilo subsoil. An additional
advantage of the BTC data was that the influence of kinetic hysteresis,
which was nonexistent in equilibrium data, could be detected in a
Hilo subsoil-chloride system. Apparently, complete equilibrium
conditions for the adsorption of both picloram and chloride existed
in the Hilo soil column (EQUIL = 1). By calculation of the quantity
DESOR, it was found that only about 45% of picloram and 57% of
chloride retained by the Hilo soil was desorbed during the Out
displacement.
Comparison of the magnitude of EQUIL computed from the BTC
data obtained from miscible displacement of chloride through a

40
saturated column of Wahiawa subsoil at two different flow velocities
revealed that equilibrium conditions for adsorption were approached
only at the slower displacement. However, at both velocities, all
of the chloride retained by the Wahiawa subsoil was desorbed
(DESOR = 1) during the Out displacement.
Published BTC data for atrazine herbicide and barium displace
ment'through several soils could be successfully described by BTC
models developed here. All of the atrazine and barium adsorbed by
four soils studied could be desorbed during the Out displacement
(DESOR = 1). However, due to limited data available in the source
publications, evaluation of the BTC parameter EQUIL was not possible.
Usefulness and certain limitations of the BTC models and the
quantitative BTC parameters proposed for the analysid of miscible
displacement data are discussed.

INTRODUCTION
Miscible displacement techniques pioneered by petroleum engineers,
were introduced into soils literature by Nielsen and Biggar (1961) in
a five-paper series concluded by Biggar and Nielsen (1963). This
technique has been widely used in the study of movement of fertilizers,
salts and pesticides through soils. Displacement of one fluid that
saturates the voids of a porous medium by another mutually soluble
fluid forms the basis of miscible displacement methods.
In miscible displacement studies, the concentration of the tracer
in various segments of the soil column after a known volume of tracer
solution has been displaced through the column can be determined.
However, this technique requires a new soil column for every displace
ment. The tracer concentration in the effluent solution can be
monitored instead, and the results are shown as plots of effluent
concentration expressed as a ratio of input concentration (C/Co)
versus cumulative effluent volume (V). These plots are referred to
as the breakthrough curves (or BTCs for brevity), and probably offer
the most precise measurement for solutes of sufficient mobility to be
leached out of the soil column. The BTCs obtained when tracer solution
displaces tracer-free solution in the soil columns are denoted here
as the Tracer-In BTCs, while the opposite technique yields the
Tracer-Out BTCs (see Chapter 1).
The effects of complex void geometry of a porous medium through
which the tracer molecules are transported and the consequent mixing
and dilution by the tracer-free solution initially saturating the
porous medium are reflected in the BTC that is measured. Interactions
of the tracer molecules with the soil surfaces that line the walls of

42
the pore-sequences through which they are being conducted also influence
the BTCs measured. A study of six principal characteristics of the
BTC (shape, location, area above and under the curve, relative locations
of Tracer-In and Tracer-Out curves and the areas above these BTCs,
and the slope) are useful in gaining an insight into the gross belmvior
of the solute within the soil column during its displacement. Several
useful techniques for qualitative and quantitative analysis of the
BTCs were presented in Chapter 1.
The major objective of the work reported here is to test the
utility of the BTC models proposed for reactive solutes in Chapter 1
of this dissertation. Experimental BTC data obtained from miscible
displacement of picloram herbicide (4-amino-3,5,6-trichloropicolinic
acid) and chloride through saturated Hilo and Wahiawa subsoil columns
was used in such an evaluation. Published BTC data for barium and
atrazine herbicide (2-chloro-4-(ethylamino)-6-(isopropylamino)-~
triazine) in several soils, reported by Snelling (1968) and Snelling,
Hobbs, and Powers (1969), are also employed in testing the BTC models
proposed for reactive solutes. Some of the properties of the BTCs
utilized in quantitative and qualitative analysis of the BTCs were:
(i) location with respect to reference, (ii) areas abOve the In and
Out curves, (iii) location of the In and Out BTCs with respect to
each other, and (iv) slope of the curves.

EXPERIMENIAL
Miscible Displacement
Two soils, Hilo (member of thixotropic, isohyperthermic family of
Typic Hydrandepts) and Wahiawa (member of clayey, kaolinitic,
isohyperthermic family of Tropeptic Eutrustox), were used in the study
reported here. Important properties of both these soils, and details
of miscible displacement techniques employed are presented in Chapter 3.
Displacement of picloram herbicide and chloride through saturated
columns of Hilo subsoil was studied at an average pore-velocity of
0.134 em/min. Chloride displacement through a saturated column of
Wahiawa subsoil (0.25 - 2 rom aggregates) was studied at two velocities
of 0.179 and 0.08 em/min. In both soil columns, l4C-methano1 was used
as a reference solute, which was assumed not to interact with the soil
surfaces and to illustrate only the effects of hydrodynamic dispersion.
Data from frontal displacement of atrazine herbicide and barium
through saturated columns of Tivoli fine sandy loam, Keith silt loam,
Geary silty clay loam, and a Muck soil with chloride as the reference
solute, reported by Snelling (1968) and Snelling et al. (1969), were
also chosen to further test the utility of the techniques proposed in
Chapter 1.
In all of the miscible displacement studies, both Tracer-In
and Tracer-Out BTCs were obtained.
Equilibrium Adsorption and Desorption Measurements
Hysteresis in adsorption under equilibrium conditions was
characterized only for the picloram-Hilo system. Field-moist (210%

44
moisture on weight basis) soil, equivalent to 2 g oven-dry soil was
equilibrated with 10.76 m1 pic10ram solution, to give a final soil to
solution ratio of 1:7.5. Equilibration was accomplished in 50-m1
Nalgene centrifuge tubes by shaking for 24 hours on a wrist action
shaker. At the end of the equilibrium period, the tubes were centrifuged
in a Sorval1 centrifuge at 12,100 XG for 10 minutes and 7 ml of the
clear supernatent solution were removed for analysis of picloram by
the colorimetric procedure of Cheng (1969). To these same tubes, 7
ml of Hilo soil solution (extracted by distilled water at a soil to
solution ratio of 1:7.5) were added to replenish the equilibrium
solution removed. The soil was resuspended by vigorously vibrating
on a Vari-W11ir1 mixer for about 10-15 minutes. The tubes were then
shaken for another 24 hours and the whole procedure just described
repeated another three times. The first step yielded the adsorption
isotherm, while the latter four steps gave us the desorption isotherms
from each concentration at which adsorption was measured.
Triplicate tubes for each concentration, except for the two
highest, were maintained throughout the experiment. The possibility
of picloram degradation during the six-day period for the adsorption/
desorption experiments was not investigated. Although no experimental
data is available on degradation in Hi10 soil, picloram is generally
considered to be very persistent herbicide.
Adsorption of chloride on Hi10 subsoil was determined by exactly
the same batch equilibrium techniques just described. However, since
the first desorption step indicated that both adsorption and desorption
isotherms were identical, further desorption steps were not carried out.

45
Duplicate samples of 5 g oven-dry equivalent of Wahiawa subsoil
(6% moisture on weight basis) were equilibrated with 25 ml chloride
solution at different concentrations. After a 24 hour equilibration
period, the tubes were centrifuged at 12,100 X G and 5 m1 aliquot of
the clear supernatent solution titrated against AgN03 with potassium
dichromate as an indicator (Chapman and Pratt, 1961). However, due to
rather large errors in the analytical technique, complete isotherm
could not be obtained. Therefore, the value of amount adsorbed at the
solution concentration equivalent to that used in miscible displacement
studies was remeasured, and the equilibrium distribution coefficient
(Kd) alone computed. This resulted in our inability to evaluate if
chloride adsorption on Wahiawa soil was reversible under equilibrium
conditions.
Analysis of BTC Data
Quantitative techniques described in Chapter 1 were utilized in
the analysis of both Tracer-In and Tracer-Out BTCs obtained from all
miscible displacement studies. All BTC data are presented as plots
of relative solute concentration (C/Co or 1-C/Co) in the effluent
versus VIVo, where Vo represents one pore volume. The area above the
reference ETC (14C-methano1 for Hi10 and Wahiawa) served as a representa-
tion of Vo (see Chapter 1 for explanation) and that above the adsorbed
solute BTC represented Ve (effective pore volume) in calculations of the
column retardation factors (see Chapter 1). The equilibrium retarda-
tion factors were computed from known column bulk density (p),
saturated water content (8 ), and equilibrium distribution coefficients
(Kd) using equation 1-5 in Chapter 1.

46
The fraction of solute in equilibrium with the soil during
displacement through soil columns (designated as EQUIL) was computed
from equation 1-8, and that desorbed (designated as DESOR) from the
soil column during Tracer-Out displacement (desorption phase) was
estimated by equation 1-10. The areas above the Tracer-In, Tracer-Out
and reference BTCs were measured by planimetry (1% precision).
Normalized rates of adsorption (kr ) , although not calculated,
were qualitatively compared by plotting the same BTC data as illustrated
in Figure 1-8. For this purpose, the effluent volume axis of the
BTCs (VIVo) was presented as positive or negative distances (in terms
of number of pore volumes) from the midpoint of the BTC (defined as
the point of C/Co = 0.5). Such normalization of the x-axis of the BTCs
facilitated comparison of BTCs from different solutes and also from
different soil columns.

RESULTS AND DISCUSSION
Adsorption Hysteresis
Equilibrium adsorption and desorption isotherms for the pic10ram
herbicide-Hi10 subsoil system are presented in Figure 2-1. Although
these isotherms are not identical, they could be described by the
Freundlich relationship,
NS = K Cf
where, S = equilibrium adsorbed concentration (~g/g) and C =
(2-1)
equilibrium solution concentration (~g/m1), and Kf and N are constants
which include all the factors that influence solute adsorption from
solution. From a log-log plot, such as the one shown in Figure 2-1, of
S versus C, the numerical values of constants Kf (as the S-intercept
at C = 1) and N (slope of the adsorption isotherm) can be readily
evaluated. The pic10ram adsorption isotherm shown in Figure 2-1 is
characterized by Kf = 24.5 ~g/g and N = 0.585. A value other than 1.00
for the slope N implies non-linearity of the isotherm (on a linear
plot); the degree of nonlinearity is proportional to deviation of N
from unity (Hamaker and Thompson, 1972).
Since the native pH of the Hi 10 subsoi 1 (pH ~ 6) is less than
measured Zero Point of Charge (ZPC = 6.36), Hi10 subsoil possesses a
net positive charge (Rahman, 1968; Ba1asubramanian, 1974). Since the
pKa of picloram herbicide is 3.6, at the pH of Hilo subsoil, a majority
of the pic10ram molecules exist in anionic form. Therefore, with
predominance of positive charge sites on the soil surfaces and most of
the herbicide in its anionic form, adsorption of picloram on Hi10 soil
can be expected to be high.

48
l
A Desorption
o AdsorptioiJ,
Hi10 Subsoi1-
System
Picloram Herbicide
104r--------...,--------r------
1011--_.l.-..J.-J-J..-U...w.J._-l._I-JI..-I-..u..iW.l-_.-L.-1......L...J...iU...&..!.,J
100
EQUILIBRIUM SOLUTION CONC., llg/ml
Figure 2-1. Freundlich adsorption isotherm for picloramadsorption on Hilo subsoil, with k=24.5 gig, andN=O.585. Non-reversibility of adsorption is shown
by the hysteresis in the desorption loops.

49
Adsorption and desorption isotherms for picloram-Hilo system shown
in Figure 2-1, which are not identical, are indication of hysteresis
in adsorption. Similar hysteretic behavior has been observed in
several previous instances (Swanson and Dutt, 1973; Davidson and Mc
Dougal, 1973; Hornsby and Davidson, 1973; van Genuchten, Davidson, and
Wierenga, 1974) for adsorption of herbicides on soils. However,
explanation as to the cause of such observed hysteresis has not been
presented. ~~o types of hysteresis, kinetic and non-kinetic, were
defined in Chapter 1 and possible reasons for both types were
presented.
In all reported cases of adsorption hysteresis, equilibrium had
apparently been reached between adsorbed and solution phases, thus
excluding the possibility of kinetic hysteresis being responsible.
Giddings (1965) 1ms suggested that two (or possibly more) types of
adsorption sites are available for solutes. One of these is the normal
adsorption site, leading to rapid exchange, which is mainly responsible
for solute adsorption. According to Giddings (1965), other types of
adsorption sites exist, relatively scarce, but desorb at a much slower
rate and are probably responsible for the observed hysteresis. In the
study reported here and in other published studies, long periods of
desorption times were not allowed. Therefore, the possibility of
kinetic hysteresis as a possible explanation cannot be completely
overlooked. It is also possible that certain adsorption sites retain
the solute by a different mechanism than others, which may not be
reversible and result in non-kinetic hysteresis. Unfortunately,
in our study we cannot differentiate between both these effects.

so
One other important factor that needs to be considered is the
ionic composition of the solution phase during both adsorption and
desorption. In most studies, dilute salt solutions (such as O.Ol~ CaC12)
are used as the displacing solution in the desorption experiments.
However, it may be more appropriate to employ extracted soil solution
(at the same soil:solution ratio as used in the adsorption studies)
instead of dilute salt solutions to better simulate nearly identical
environmental conditions during both adsorption and desorption phases.
Such a technique helps in maintaining the concentration of the water
soluble salts and organic fractions nearly constant during continued
desorption steps. One other alternative is to pretreat the soil
with a salt solution to obtain a homoionic soil, and subsequently use
same salt solution both in adsorption and desorption experiments.
It is apparent that the slopes of the adsorption and desorption
isotherms in Figure 2-1 are not identical, and that the slope of the
desorption isotherm depended on the maximum adsorbed concentration
(Smax) at which desorption was cow~enced. Designating Nads and Ndes
to be the slopes of adsorption and desorption isotherms, respectively,
we can develop a relationship between Srnax and the ratio of Nads/Ndes'
Such a graphical relationship for picloram-Hilo system is shown in
Figure 2-2. Note the straight line (on a log-log plot) relationship
which could be described by the equations,
Smax > 20 (2-2a)
Smax < 20 (2-2b)
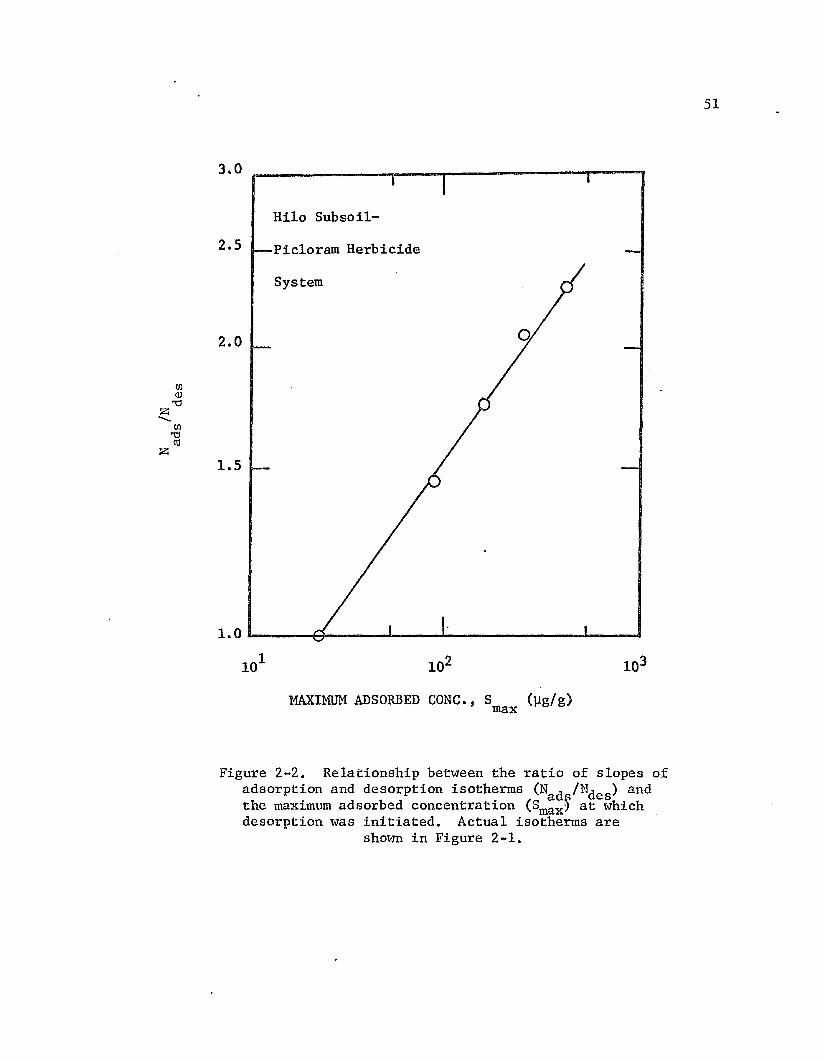
3.0
51
CJ)Q)
'0Z-CJ)
'0n:l
Z
Hilo Subsoil-
2.5 Picloram Herbicide
System
2.0
1.5
1.0a----f-:iI-----l..--..A-.--------.l---4
MAXIMUM ADSORBED CONC., S (~g/g)max
Figure 2-2. Relationship between the ratio of slopes ofadsorption and desorption isotherms (N d /Ndes) andthe maximum adsorbed concentration (sm:x~ at whichdesorption was initiated. Actual isotherms are
shovm in Figure 2-1.

52
Swanson and Dutt (1973) reported a constant value of 2.3 for the
ratio of Nads/Ndes for atrazine herbicide adsorption by Mohave and Walla
Walla soils. van Genuchten et al. (1974) observed decreasing values
for the ratio Nads/Ndes with increasing value of Smax; an average value
of 2.5 was found to be satisfactory for a picloram herbicide-Norge
loam system. It is likely that such a relationship would depend on
the specific adsorption mechanism responsible for retention of the
organic molecules on the soil surfaces.
The adsorption isotherm for the Hilo subsoil-chloride system could
be characterized by Kf = 6 ~g/g and N = 0.71. Since the first
desorption step indicated that both adsorption and desorption isotherms
were identical (i.e., no hysteresis), further desorption steps were
not carried out. A complete isotherm for the Wahiawa subsoil-chloride
system could not be obtained due to certain analytical problems.
Therefore, the amount adsorbed at equilibrium solution concentration
(Ce ) same as that used in miscible displacement studies (i.e.,
Ce = Co) alone was determined. It was not possible to draw conclusions
regarding reversibility of chloride adsorption on Wahiawa soil due to
very limited data on hand.
Equilibrium distribution coefficients (Kd = amount adsorbed/
amount in solution) and associated column parameters (p, 8 s ) used
in the computation of the equilibrium retardation factors for various
soil-solute systems tested in this study are presented in Table 2-1.
All of the Kd values shown in Table 2-1 were taken from an appropriate
adsorption isotherm at a solution concentration corresponding to that
employed in the miscible displacement studies. Problems associated with
using a single Kd value to represent nonlinear (N # 1) isotherms

Table 2-1. -- Sunnnary of equ~.librium distribution coefficients(Kd) and assoclated column parameters (p, 8s ) used in thecomputation of equilibrium c~tardation factors for three
soil-solute systems
53
Soil Solute p 8s Kdo
g/cm3 cm3/cm3 cm3jg
Hilo Subsoil Picloram 0.253 0.820 3.95
Chloride 0.253 0.820 1.81
Wahimva Subsoil Chloride 1.042 0.644 0.69

54
were discussed in Chapter 1. However, such an estimation was shown
to be a good first approximation of more accurate expressions
(see Appendix 6).
Miscible Displacement Studies
BTCs obtained from miscible displacement of chloride and picloram
through a saturated column of Hilo subsoil, both in the roles of
displacing (In) and displaced (Out) solutes, are presented in
Figures 2-3 and 2-4, respectively. The BTC for methanol, which was
chosen as a nonreactive reference solute, is also shown in both these
figures as a solid curve. The reason for the shift of methanol
BTC to the left is due to the presence of about 10% nonsolvent fraction
of soil water in the highly hydrated Hilo subsoil, a fact which is more
fully discussed in Chapter 3.
The characteristic shift of both chloride and picloram In BTCs
to the~ of the reference BTC is typical of adsorbed solute
displacement (Model IV). Removal of solute from the solution phase
due to retention on the soil surfaces delays the arrival of the solute
in the effluent, hence the shift of the measured BTC to the right.
Both picloram and chloride Out BTCs are shifted to the left of the
corresponding In BTCs (see Figures 2-3 and 2-4), indicating hysteresis
in adsorption (Model IVA). The results for picloram (Figure 2-4)
are consistent with observed nonkinetic hysteresis in picloram
adsorption by Hilo subsoil (Figure 2-1). It is also possible that due
to the transient nature of the displacement, additional effects of
kinetic hysteresis, if any, may have been responsible in causing the
shift of picloram Out ETC to the left of In BTC. The technique

o
55
1.0
451~"'·H 9 LO 80
.6/lb.6
v = 0.134 em/min 00
A O0.8 !.:::J.
00 80u....... 8u
I....1
...~
00
0 0.6u0.......
u ~
..SH
0~E-lZ
~r.t:l 0.4u 0Z0u
b.r.t:lE-l Methanol::J 0S l::.rn 0 CHLORIDE Tracer-In~ 0.2
0H 0 ~ CHLORIDE Tracer-Ouj~ 0
o 1 2 3
PORE VOLUMES, V/Vo
Figure 2-3. Tracer-In and Traqer-Out BTCs obtained bymiscible displacement of chloride through a saturatedcolumn of Hilo subsoil. Reference BTC for methanol
is shown as a solid curve.

56
o
1.0
.&/;:~8 ° aHI LO A
O
lY. 0~
v = 0.134 em/min D,.0
~ 0
0.8 AA 0
0u
A........ 0UI
r-I AJ.I 00
0 0.6 Au........
0u
'" 0z0H 0~E-tZ 0~
0.4b-
0U
rz.:l 0~S 0Ul 0g;
0.2 0 -- MethanolH
a 0 Picloram In
.6 Picloram Out
o 1 2 3
PORE VOLUMES, V/Vo
Figure 2-4. Tracer-In and Tracer-Out BTCs obtained bymiscible displacement of picloram herbicide througha saturated column of Hilo subsoil. Reference BTC
for methanol is shown as a solid curve.

57
proposed here does not have the capability of differentiating between
these t~qO types of hysteresis. Since no hysteresis in the adsorption
of chloride by Hilo subsoil was observed under equilibrium conditions,
the shift of Out BTC to the left of In BTC (Figure 2-3) may be due to
some kinetic hysteresis effects.
Similar results as reported above were also obtained from
miscible displacement studies on a duplicate Hilo subsoil column, and
also on a column packed with Hilo subsoil collected from a different
site. This confirmed our conclusions reached above. The actual BTC
data, however, are not shown here.
Miscible displacement of chloride through a saturated column of
Wahiawa subsoil was studied at two average velocities (vo) of 0.179 and
0.08 cm/min, and the resulting In and Out BTCs are shown in Figures
2-5 and 2-6. The reference BTC for methanol is also shown as a solid
curve. Note tl~t the methanol BTC passes through the intersection of
cleo = 0.5 and VIVo = 1.0, resembling Model IIA BTC (Chapter 1). Nearly
identical In and Out BTCs for chloride, both shifted equally to the
right of the reference BTC are characteristic of Model IVB (Chapter 1)
and indicate similar kinetics for adsorption and desorption. Identical
In and Out BTCs also imply no hysteresis in adsorption of chloride by
Wahiawa subsoil.
A comparison of BTCs in Figures 2-5 and 2-6 revealed that the
BTC for the fast velocity (vo = 0.179 cm/min) is not shifted as far to
the right as that for a slow velocity (vo = 0.08 cm/min). This result
is in agreement with observed higher adsorption at slower flow velocities
due to greater mean residence times for the solute within the soil

Methanol
() Chloride In
~ Chloride Out
o 2.~ ofAfA
0°6,A
o l:::.o
A0D.
l:::.o8.
~
AboO
1::.080o
o I -4 @~ ! , ! I
0u......u 1.0I..-l
l-l
~ailiaWa0
0
0.8 vo
::: 0.179u......u...uS 0.6u~E-l............:I0
0.4tJ)
~H
~0.2ga
o 1 2 3 4
PORE VOLUMES, VIVo
Figure 2-5. Tracer-In and Tracer-Out BTCs obtained by miscibledisplacement of chloride through a saturated column of Wahiawasubsoil at an average pore-velocity of 0.179 em/min. Reference
BTC for methanol is shown as a solid curve.Vlco

o Chloride In
l:::. Chloride Out
oo ~
00 A
A
9 8.
8.o~
c.
1::.°
;.
Methanol
v =0.08 cm./mno
Wahiawa
t:.o
~b.
01 "6&___/~,L..~ 4 4:La 4:> I I
, 0 C6'J.~1.0, .:;>" 0'106 g .o 2:l.
0.2
0.6
0.4
0.8
...o
.uzoU
t:Jt-<;::,....Jotr.l
t:J:>H
~...:l
~
ouu
ouUI~
a 1 2 3
PORE VOL~ffiS~ V/Vo
Figure 2-6. Tracer-In and Tracer-Out BTCs obtained by miscibledisplacenent of chloride through saturated column of \vahiawasubsoil at an average pore-velocity of 0.08 cm/min. Reference
BTC for nethanol is sho,~ as a solid curve.
....,-.:::

60
column (Kay and Elrick, 1967; Davidson and Chang, 1972; Davidson and
Mc Dougal, 1973; van Genuchten et al., 1974). Aggregated nature of
the Wahiawa soil only amplifies such an effect, since a significant
fraction of the adsorption sites may be located in the interior of the
aggregate, and solute penetration to these sites by diffusion in
addition to the kinetics of adsorption on the surfaces become the
limiting factors at higher velocities.
BTC data from miscible displacement of chloride (reference),
barium and atrazine (both adsorbed solutes) through saturated columns of
four soils, reported by Snelling (1968) and Snelling et al. (1969),
are reproduced in Figure 2-7. It is apparent that chloride BTCs in all
four soils are described by Model IIA, while the BTCs for barium
resemble Model IVA. Atrazine BTC from Tivoli, Keith and Geary soils
fits Model IVB, while that from Muck soil can be described by Model IVC
(Figure 2-7). It should be recalled that Model IVC implies desorption
kinetics to be faster than kinetics of adsorption. BTC models applicable
to all soil-solute systems investigated are summarized in Table 2-2.
In Chapter 1 it was noted that the areas above the In and Out
BTCs are very useful in quantifying the degree of equilibrium conditions
(EQUI~) for adsorption of the solute during the In displacement, and
also to estimate the fraction desorbed (DESOR) from the column during
the Out displacement. Equations 1-8 and 1-10 in Chapter 1 enable such
a computation. The values of all quantitative BTC parameters calculated
for data from Hilo and Wahiawa soil columns are sunnnarized in Table 2-3.
It can be concluded from an examination of the EQUIL values listed
in Table 2-3 for various soil-solute combinations that equilibrium

61
1 ........_-:rtlo"'---------rTIVOLI
18126o ~~~_...J-_--L.---J~--'--.--'
oEFFLUENT VOLIDIE. V (1 )
Figure 2-7. Breakthrough curves obtained from miscibledisplacement of chloride (~), atrazine herbicide(~), and barium (ODOD) through saturated columnsof four different soils. Tracer-In BTCs are sho\Ynas data points, while the corresponding Tracer-OutBTCs are shown as solid curves. Data taken from Snelling
et al. (1969)

Table 2-2. Summary of BTC models applicable to themiscible displacement data from various
soil-solute systems examined
Soil* Solute BTC Model Source
Hilo Subsoil Picloram IV A This Paper
Chloride IV A This Paper
Wahiawa Subsoil Chloride IV B This Paper
Tivoli FSL Barium IV A Snelling et al
Atrazine IV B Snelling et al
Keith SL Barium IV A Snelling et al
Atrazine IV B Snelling et al
Geary SCL Barium IV A Snelling et al
Atrazine IV B Snelling et al
Muck Barium IV A Snelling et al
Atrazine IV C Snelling et al
~..SL - silty loam; SCL - silty clay loam'FSL - fine sandy loam;
62

Table 2-3. Summary of BTC parameters calculated for miscibledisplacement of two adsorbed solutes through saturated
columns of two Hawaiian soils
Soil SoluteRetardation Factors (Ve/Vo)
EQUIL DESORV o
(em/min) Equi1ib In Out
Hi10 Pic10ram 0.134 2.22 2.22 1.55 1.00 0.45
Chloride 0.134 1.56 1.58 1.33 1.01 0.57
1.Jahiawa Chloride 0.179 2.13 1. 78 1.85 0.69 1.09
Chloride 0.081 2.13 2.05 2.13 0.93 1.08
0'W

64
conditions for adsorption were approached closely only for the
displacement of chloride and picloram in Hilo, and also for slow
displacement of chloride in Wahiawa soil. Preliminary studies (data
not shown) indicated that adsorption of picloram on Hilo soil is
completed in only one hour equilit~ium period. Accessibility of the
soil surfaces even during rapid flow conditions was apparently not a
limiting factor in picloram and chloride adsorption on the Hilo subsoil,
which possesses a gel-like intra-aggregate structure (see Chapter 3).
Equilibrium conditi.ons for chloride adsorption on highly aggregated
Wahiawa soil did not exist at the fast velocity (vo = 0.179 em/min),
but near equilibrium conditions prevailed at a slower velocity
(vo = 0.08 em/min). At the high pore-velocity, a significant fraction
of the flow occurs in the inter-aggregate macroporosity, thus much of
the soil surface within the aggregates is bypassed. The mean residence
time for the solute (chloride) is apparently too short to allow for
diffusion of solute to all adsorbing sites in the intra-aggregate
porosity. This results in EQUIL being less than unity. However, at a
much slower velocity, the mean residence time in the column appears to
be sufficiently long enough for a greater fraction of the soil mass to
come into equilibrium with the solute being displaced. This resulted
in EQUIL being much closer to unity. van Genuchten et al. (1974)
found it necessary to incorporate such effects into their solute
transport predictive model.
vfuile all chloride apparently was desorbed from the Wahiawa soil
column at both velocities (DESOR ~ 1), only about 57% of the chloride
and 45% of the picloram could be desorbed from the Hilo subsoil column

65
(Table 2-3). While adsorption of chloride by Wahiawa may have been a
simple ion exchange process, picloram may have been retained on the
organic matter fraction of the Hilo soil. This may be why picloram
adsorption is not reversible even under equilibrium conditions.
A value of greater than 1.00 for chloride displacement in Wahiawa
subsoil (Table 2-3) is suspected to be due to experimental errors in
the analysis of chloride. It should be recognized, however, that
DESOR > 1 implies that additional amounts of the solute are being
produced in the soil column during displacement. Continuous leaching
studies involving NH4N03 would yield such results for nitrate BTCs, if
additional amounts of nitrate are being generated in the soil column
by the nitrification of~. WIlen no such source can be found, then a
value of greater than 1.0 for DESOR should be attributed to some
experimental errors.
Finally, it must be recalled that the equilibrium and column
retardation factors are dependent not only on the equilibrium distribu
tion coefficient (~) but also on the column parameters (p, e ).s
Although the Kd for chloride adsorption on Wahiawa soil was less than
that for Hilo soil (Table 2-1), the computed equilibrium retardation
factor for Wahiawa soil is greater than that for Hilo (Table 2-3).
Note that the bulk density of Wahiawa soil is much larger than that of
Hilo (Table 2-1), which means that the total mass of Wahiawa soil
packed into the column is greater. This would result in the total
amount of chloride being retained on Wahiawa being more than that on
Hilo soil. Therefore, a shift of the In BTC is not only influenced
by the Kd (an indication of extent of adsorption) but also on the total

66
mass of the soil (or number of adsorption sites) available for
adsorption.
The normalized rate (kr ) of adsorption describes the rate at
which the soil mass in the column is saturated by a given solute, and
can be measured by observing the time required by tracer concentration
in the effluent (C/Co) to rise from zero to 1.00. Therefore, the
shorter the time required to saturate the soil mass (i.e., larger the
relative rate), the steeper is the slope of the BTC measured (Chapter
1). Relative rate of adsorption is influenced by the absolute rate of
mass transfer between the solution and solid phases and by the energy
of adsorption. Generally, the greater the energy of adsorption of a
solute, the slower is the relative rate of adsorption, hence, the
measured BTC is more flat. Marks et ale (1963) presented theory to
enable calculation of the absolute rate of adsorption from the BTC
data for given experimental conditions. We shall focus our attention
on qualitative comparison of the slopes of the BTCs obtained from
various soil-solute systems investigated. Such an analysis will yield
an indication of the rate at which a given soil was saturated by a
solute being displaced through that soil column.
If the abscissa of the BTCs is normalized in terms of positive
and negative distances (or pore volumes) from the mid-point of the BTC
(defined to be at CICo = O.S), the slopes of the BTCs from various
soil-solute systems can be readily compared. BTCs normalized according
to the scheme just described are plotted in Figures 2-8 and 2-9.
Although no attempt was made here to actually calculate the normalized
or absolute rates, nor was there any supporting data on adsorption

o
10I I
HiDo Subsoili
I08
0u......u
... 06uz0U
LIJI-::;)-oJ
ct40(/)
AI o METHANOLLU:>
6. CHLORIDE-I-<r-oJ
.2 ,...,/ II o PICLORAMLIJ l-e:::
-loS -10 -.5 o +05 +1. -tl.5
NUMBER OF PORE VOLUMES FROM MIDPOINT
Figure 2-8. Normalized BTCs for methanol, chloride and picloramobtained from Hilo subsoil column to facilitate
the comparison of the slopes the BTCs.
0'1'-l

..fol .. ;'+10+e>5o-.s~1.
o-loS
III
080
u'"u
co.06uz
0u~e;:3 04-Cf)
/f o WAHIAWA-Methanol~
I:>H
HILO-Chloride~ 0...:l
~ 02 1- / / ~ WAHIAWA-Chloride
NUMBER OF PORE VOLUMES FROM MIDPOINT
Figure 2-9. Normalized BTCs for methanol and chloride from aWahiawa subsoil and that of chloride from Hilo subsoil to
facilitate the comparison of the slopes0'\(Xl
CP

69
energies, certain qualitative comparisons are possible for solute
displacement studies reported here.
It is apparent from a comparison of the slopes of the BTCs
presented in Figure 2-7 that the relative rate of adsorption of picloram
on Hilo soil is lower than that for chloride. This is probably so
because of relatively higher energies associated with picloram adsorp
tion on Hilo subsoil. The normalized BTC for methanol is also shown
as a reference case in which the surface interaction of the solute
molecules does not limit the rate at which the soil is saturated by
methanol. The difference in slopes between adsorbed solutes and
methanol then is an index of the influence of surface reaction kinetics.
The normalized breakthrough curve for chloride displacement through
Wahiawa soil is compared in Figure 2-8 with that from Hilo soil. It
is suggested that the lower relative rate of adsorption of chloride in
Wahiawa soil column was due to the aggregated nature of the soil.
Leenheer and Ahlrichs (1971) concluded that the rate limiting step in
the adsorption of parathion (O,O-Diethyl-Q-E-nitrophenylphosphorothioate)
on soil was the diffusion of the insecticide molecules into the
interior of adsorbing material. As it has been suggested before,
the surface accessibility in Hilo soil does not appear to be a limiting
factor. The kinetics of surface reaction (i.e., adsorption of reactive
solutes) was also found to be not limiting. This resulted in rapid
saturation of the Hilo soil.
In conclusion, the quantitative and qualitative techniques
developed in Chapter 1 for reactive solutes were successfully employed
in the analysis of BTC data obtained from miscible displacement of
several adsorbed solutes through some soils. It was possible to quantify

70
the fraction of soil in equilibrium (denoted as EQUIL) during the
adsorption phase, and also the quantity of solute desorbed from the
soil column during the desorption phase (denoted as DESOR) of the
displacement. Hysteresis loops obtained from equilibrium adsorption/
desorption experiments were qualitatively related to that observed
from a study of the In and Out BTCs. An additional advantage of the
BTC data is that influences of nonkinetic hysteresis, which is
nonexistent in equilibrium studies, can be quantified. Since real
field problems are transient in nature, a study of factors that influence
solute transport under transient flow conditions is important.
Miscible displacement techniques offer this practical advantage over
equilibrium batch systems. Finally, the proposed techniques not only
allow for quantitative analysis of the BTC data, but a classification
of the BTCs based on most significant factors that influence their
properties is also made possible by the BTC models developed in
Chapter 1.

CIi4.PTER 3
QUANTITATIVE EVALUATION OF NONSOLVENT FRACTION
OF SOIL WATER IN CERTAIN HAWAIIAN
HYDRANDEPTS AND OXISOLS

ABSTRACT
A simple quantitative miscible displacement technique was employed
to determine the nonsolvent fraction of soil water that would be
excluded from the flow processes in Hilo (Typic Hydrandepts) and
Wahiawa (Tropeptic Eutrustox) soils. The technique utilizes the
areas above the breakthrough curves obtained from miscible displacement
of nonreactive solutes through saturated soil columns.
Soils classified as Hydrandepts are characterized by extremely
high water contents (about 200-400% by weight) and very low bulk
densities (about 0.2-0.5 g/cm3). A significant portion of the soil
water in these soils, however, may in fact be part of the soil matrix
and be excluded from flow. Wahiawa soil is highly aggregated, and it
was expected that the intra-aggregate micropore water may be bypassed
during rapid flow through inter-aggregate macropore sequences.
Data from equilibrium and miscible displacement studies revealed
that while all of the soil water in Hilo soil readily exchanged with
added tritiated water, about 10% did not solvate l4C-methanol. Retention
of picloram herbicide and chloride in a Hilo soil column was about 10%
less under flow conditions than anticipated from equilibrium measure
ments. Physical inaccessibility of some of the soil surfaces due to a
strongly adsorbed layer(s) of water molecules rather than adsorption
kinetics was probably responsible for incomplete adsorption. The
thickness of such nonsolvent soil water in Hilo soil was estimated to
be only 5 molecular layers.
Analysis of breakthrough curves from miscible displacement of
14C-methanol indicated that all of the soil water in Wahiawa soil was

73
active in the solute transport process. The use of tritiated water as
a reference solute ,~s limited due to its adsorption by Wahiawa soil.
A comparison of calculated equilibrium and column retardation factors
for chloride displacement through Wahiawa soil revealed that nearly
equilibrium conditions existed in the column only at a slower but not
at a higher pore-velocity of displacement.
The utility of the technique proposed was further tested with some
selected published miscible displacement data for several nonreactive
solutes.
INTRODUCTION
Soil is a heterogeneous porous medium, and water contained in
different pore-sequences exhibits nonuniform properties. Most of the
soil water can be easily removed by application of small external forces.
However, a small fraction of soil water is so tightly held by the soil
surfaces that it cannot be readily removed from the soil. Numerous
attempts have been made to estimate the thickness of the strongly
adsorbed layer of water~ commonly referred to as the bound water or
nonliquid water, without good agr.eement. The estimates of thicknesso
ranged from 4 to 20 molecular layers (or approximately 10 - 50 A)
depending on the type of clay mineral, cations associated with the clay
surfaces and similar other factors (Grim, 1968). However, an attenuated
ohydration shell could extend as far as 200-300 A away from the clay
surfaces (Low, 1961).
Two properties of soil water of particular interest to soil
physicists are mobility and solv(~nt capabilities. The outline, shown
in Figure 3-1, represents a classification scheme based on these two
properties of soil water. Soil water can either participate in or be
excluded from flow processes. Due to an extreme range in pore-velocities,
certain pore-sequences are temporarily excluded from the mass transport
of solutes and water, even though all soil water is mobile. The presence
of dead water, dead-end pores, and intra-aggregate micropores results
in the temporary exclusion just discussed (Danm~erts, 1953; Nielsen
and Biggar, 1962; Green, Rao, and Corey, 1972). Not only is the flow
between pore-sequences unequal, but the flow velocities within a single
pore are nonuniform. The velocity of the invading fluid at the axis
of the pore is approximately twice the average pore-velocity

(Mobile ~.jater)
SOIL WATER
I IParticipates freely in TemporarilyFlow Processes Excluded
I• I
1PermanentlyExcluded
Due to velocitydifferences betweenpore-sequences
(Micropore Water)
Due to velocitydifferenceswithin pores
(Film water)
Excludedfrom allflow
(StagnantPore Water)
Excludedfrom onlysolute flow
water ofhydrationexcludedfrom allsolutes
(TrulyNonsolvent)
~ water excludeddue tonegativeadsorption
(SpecificNonsolvent)
Figure 3-1. Classification of soil water based on itsmobility and solvent properties
'"V1

76
(Taylor, 1953). There is an exponential decrease in mobility of solutes
and water as the soil surface is approached (Kemper, 1960; Kemper,
Massland, and Porter, 1961; Dutt and Low, 1962). An imaginary boundary
may be assumed to exist, beyond which the flow rates are essentially
zero, and the soil water between this boundary and the soil surface
has been considered to be immobile (Skopp and Warrick, 1974). Diffusion
alone was considered to be responsible for solute transport across this
imaginary boundary.
In some instances, a certain fraction of the soil water is
completely excluded from the transport phenomenon. Orlob and
Radhakrishna (1958) present an example of such permanent exclusion,
when some of the soil water is entrapped and isolated between air
pockets. They called this type of excluded water stagnant pore-water.
A portion of the soil water may appear to lack solvent properties,
such as in the case of negative adsorption of anions by positively
charged surfaces, but this water retains its mobility. It would be
inappropriate to call such water excluded, since that term implies total
exclusion from all flow. Rode (1965) and El-Swaify et al. (1967) have
used the term nonsolvent water to describe the soil water which was
excluded from certain solutes but not from flow. In some special
cases, a significant fraction of the soil water may actually be part
of the soil matrix, such as in the soils classified as Hydrandepts
(Jones and Uehara, 1973), and may be expected to be nonsolvent in
nature.
Several efforts were made recently to incorporate consideration
of the excluded fraction of soil water into solute transport models

77
(Krupp, Biggar, and Nielsen, 1972; Raats, 1973; Skopp and Warrick,
1974). All of these models basically assume that the soil water is
composed of mobile and immobile zones, and evaluate the influence of
solute lagging behind in the immobile zone on the solute transport in
the mobile zone. Applicability of these predictive models to several
movement studies is immediately apparent in view of the above discussion.
Therefore, a need exists to quantitatively evaluate and characterize
the nonsolvent fraction of soil water to enable improved prediction
of solute and water transport in soils.
The major objective of the work reported here is a quantitative
evaluation of the nonsolvent fraction of soil water in soils classified
as Hydrandepts (Hilo soil) and Oxisols (Wahiawa soil). A simple
quantitative miscible displacement technique, developed in Chapter J.
of this dissertation, was utilized in such an evaluation. Hilo soil
is characterized by very high water contents, and a significant
fraction of the soil water may in fact be part of the soil matrix,
and be excluded from flow. Intra-aggregate micropore water in the
Wahiawa soil may be bypassed during rapid flow through inter-aggregate
macropores. The utility of the quantitative technique is further
illustrated by application to some selected published miscible
displacement data.

MATERIALS AND METHODS
Soils
Two soils, Hilo (member of thixotropic, isohyperthermic family of
Typic Hydrandepts) and Wahia~'Ta (member of clayey, Kaolinitic,
isohyperthermic family of Tropeptic Eutrustox), were used in the
study reported here.
The Hilo soil occurs in the high rainfall (about 400 em/year)
areas of the Hamakua coast on the island of Hawaii and is mostly
planted to sugarcane. This is an unusual volcanic ash-derived soil,
characterized by very low bulk densities of 0.2 to 0.4 g/cm3 and
extremely high water contents of 200 to 300% by weight even at field
capacity. The mineralogy of the Hilo soil is dominated by amorphous
hydroxides of aluminium and iron and noncrystalline alumino-silicates
(Uehara, Ilmwa, and Sato, 1971). The Hilo soil is slightly acidic
(pH = 6.2) and was shown to have a net positive charge (Rahman, 1969;
Melmru and Uehara, 1972). The existence of gel-hulls, coatings of
amorphous gel-like suspension surrounding and linking the colloidal
aggregates, was demonstrated with the aid of high resolution electron
photomicrographs (Jones and Uehara, 1973). It is also known that
Hydrandepts lose significant fraction of soil water "irreversibly"
on drying resulting in decreased cation exchange capacity (Kanehiro
and Chang, 1956) and also anion exchange capacity (Balasubramanian,
1974).
Soils in the Wahiawa series occur only on the island of Oahu in
areas with an average annual rainfall of about 100 cm and are mostly
planted to sugarcane and pineapple. The mineralogy of the Wahiawa

79
soil is primarily of 40-50% kaolinite and 15-20% iron oxides (Uehara,
Ikawa, and Sato, 1971). The soil is characterized by low organic
matter (less than 1%), low cation exchange capacity (about 10-15
me/IOO g soil), and possesses a net negative charge (Ikawa et al., 1974).
Sharma and Uehara (1968) have studied the soil water relationships
in this highly aggregated soil.
Subsoils of both Hilo and Wahiawa were collected to be used in
the study reported here. Due to thixotropic nature of the Hilo soil,
manipulation of the soil during sample preparation was kept to a minimum.
The soil was never allowed to dry below the water content at which it
was collected and was stored in the refrigerator when not used.
Wahiawa soil was collected at a field moisture of about 30%, but was
allowed to air dry before sieving to retain only aggregates between
0.25 - 2.0 rom diameter. The Hilo soil was collected from a depth of
62-112 cm, while the Wahiawa soil was obtained from a depth of 40-55 cm.
Column Preparation
The plexiglass column used to pack the soil was 30.4 cm long and
6.9 cm in diameter, giving a total column volume of 1137 cm3• Coarse
porosity fritted glass discs (0.5 cm thick) mounted in plexiglass
endplates, provided stable support at each end of the soil column.
These fritted discs contained about 4 cm3 water each, and had air-entry
value between 40-50 cm water tension.
In packing the Hilo subsoil, extra lengths of plexiglass
cylinders, each about 10 cm long, were attached to both ends of the
30 cm column and soil was packed into this column by measured increments.
When the entire SO cm column was packed, the two end sections were
80
cut-off and only the central 30 cm section used. The average bulk
3density of the soil columns thus packed was about 0.25 g/cm on oven
dry basis.
A different procedure was adapted for packing the Wahiawa subsoil
columns due to the aggregated nature of the soil. Plexiglass extensions,
25 em long each, were attached to the 30 em column and the soil was
deposited in this assembly by tremmie-type packing device. The
tremmie system consisted of a large reservoir for soil attached to a
long stem. This device was filled with well mixed soil, and soil
deposited into the plexiglass column by manually raising the tremmie
device while the column assembly was being rotated at a constant speed.
This allowed for no "free fall" of the soil aggregates through the
plexiglass column and avoided possible radial segregation. When
the whole column assembly was thus filled, six poundings with a 10 kg
weight were given to the top of the column to increase the bulk density
of packing. No radial or vertical segregation was noticeable by visual
inspection. The bulk density of the Wahiawa column was about 1.04
g/cm3 •
One end plate was attached to the column, and the column was
wetted with distilled, deaerated water from the bottom by pumping at very
low flow rates. When water appeared at the top of the column, flow
was discontinued and the other end plate secured in place. The column
then was placed in a horizontal position, and the pumping of distilled
water was continued. ~~en the soil column was completely water saturated,
as indicated by no change in the total weight of the column, it was
ready for miscible displacement measurements. It should be pointed

81
out that the Wahiawa soil column was saturated with C02 prior to water
saturation to ensure the micropore wetting. Since Hilo soil is highly
hydrated, only macropore sequences needed to be water saturated, CO2
saturation was not deemed important. The procedure described above
resulted in high degree of saturation of both soil columns.
Solute Displacement
Constant solution flux through the horizontal soil column during
a given displacement was maintained with a peristaltic tubing pump
which had negligible pulsing. The flow rates chosen for the displacement
studies were nearly same as the steady-state infiltration rates obtained
in the field plots of these soils. Only frontal or step-increase
displacement was used. The effluent solution was collected in 20-ml
aliquots with an automatic fraction collector. All measurements were
+made in a constant temperature room maintained at 20.3 - 0.3 C.
Prior to the first solute displacement measurement on any given
soil column and also at periodic intervals thereafter the saturated
hydraulic conductivity of the soil column was measured. These measure-
ments were used as indices of any structural breakdo,vu in the column
as a result of continuous solution flux. The average pore-velocity of
a displacement was chosen such that it was about one-tenth that of the
saturated hydraulic conductivity.
Tracers and Their Analyses
3 14 14Tritiated water (H20), C-labeled methanol ( CH30H), picloram
herbicide (4-amino-3,S,6-trichloropicolinic acid), and chloride were
used as tracers in miscible displacement experiments with Hilo soil.

82
Tritiated water and methanol were used as reference solutes which would
have minimal interaction with soil surfaces and were assumed to illus-
trate the effects of hydrodynamic dispersion alone. Picloram and
chloride represented solutes which are adsorbed by the soil. Both
these anionic solutes were used as salts of potassium.
Picloram solutions were adjusted to a pH of 7 to maintain the
compound in its anionic form (pI~ = 3.6). The pH of the effluent
fractions was monitored and found to be equal to that of the soil
solutions. The input solutions contained a combination of tritiated
water (6.45 ~Ci/1) and pic10ram (120 ~g/m1) ££ 1% methanol (5.45 ~Ci/1)
and chloride (180 ~g/m1).
For miscible displacement studies in Wahiawa soil column,
tritiated water (10.3 ~Ci/l), 14C-methanol (1 ~Ci/1) and chloride
(about 200 ~g/ml) were used as tracers. All three tracers were
dissolved in distilled water and simultaneous miscible displacement
of these solutes was studied.
14Tritiated water and C-methano1 were analyzed by liquid
scintillation counting techniques with a dioxane based scintillation
solution. Counting efficiencies exceed 85% for l4C and 30% for 3H•
Picloram in the effluent samples was determined by the colorimetric
procedure of Cheng (1969); 2-ml a1iquots of the effluent fractions
were mixed with 4 m1 9 ~ HzS04 and 1 ml 0.1~ NaN02 and the yellow
color read at 405 ~ wavelength on a spectrophotometer. At concentra-
tions exceeding 20 ~g/m1 pic1oram, the samples were diluted to increase
precision. Chloride concentrations in the samples were determined by
titrating 5-m1 aliquots against standard AgN03 (2.4 gil) solution with
potassium chromate as indicator (Chapman and Pratt, 1961).

83
Adsorption Measurements
Adsorption of tritiated water and l4C-methanol on Hi10 subsoil
was determined by the flow-through equilibration technique of Green
and Corey (1972). The equilibration was accomplished in pyrex glass
tubes (22.5 cm long and 1.3 cm i.d.) with a fritted glass disc fused
2.5 cm from the bottom. The tubes were initially filled with appropri
ate solutions and 2 g soil (oven-dry basis) was allowed to drop
through the solution and settle by gravity at the bottom, on top of the
fritted disc. This procedure resulted in good packing with minimal
breakdown of the soil structure. Solutions containing appropriate
solutes, with same concentrations as in the miscible displacement
studies, were pumped through at a flow rate of about 0.4 ml/min. Use
of multiple tubing pump facilitated simultaneous measurement of adsorp
tion on triplicate tubes for each of the two solutes and duplicates
for the blanks. A 3-hour equilibrium period was allowed for both
solutes. Preliminary trials had indicated adsorption to be complete
in only one hour.
AdsorpLion of pic10ram herbicide and chloride on Hi10 subsoil
samples and that of tritiated water, 14C-methano1, and chloride on
samples of Wahiawa subsoil was determined by the standard batch
equilibration technique.
Equilibrium adsorption distribution coefficients (Kd) were
calculated as the ratio between amounts of solute in the adsorbed
phase (~g/g) to that in solution phase (~g/ml). These values were
subsequently used in the computation of equilibrium retardation factors
for each solute-soil system studied. In cases of negative adsorption

84
or exclusion of the solute, a minus sign was assigned to the Kd
value.
Retardation Factors
Equilibrium and column retardation factors are defined in
Chapter 1 (equation 1-5). Briefly~ equilibrium retardation factor
indicates the apparent increase in pore volumes due to adsorption
in a displacement study if equilibrit~ conditions existed for adsorp
tion. A comparison of equilibrium and column retardation factors is
then useful in determining the degree of disequilibrium in the
column studies.
The areas above the breakthrough curves for solutes of interest,
both from our studies and also from published sources, were measured
with a planimeter and were taken to represent the effectIve pore
volume (Ve) of the soil column. The precision in p1animetry was
about ~ 1%. The area above the breakthrough curve for tritiated
water and l4C-methanol provided the values of column pore-volume (Vo)
in the computation of column retardation factors. In calculation of
retardation factors from published data, Vo was assumed to correspond
to the area above the breakthrough curve for piston flow.
Equilibrium retardation factors were calculated by equation 1-5
(see Chapter 1), where p and 8s were measured column values, and the
Kd was obtained by adsorption measurements as described in the
preceeding section.
Planimetering the area under the breakthrough curves for non
reactive solutes up to one pore volume (equation 1-2; Chapter 1), and

dividing it by area representing Va' yielded numerical values of
holdback (Danckwerts, 1953).
85

RESULTS AND DISCUSSION
Hilo Subsoil Data
Preliminary batch equilibrium studies with Hilo subsoil revealed
that all of the native soil water readily exchanged with added
tritiated water after only a two hours of gentle shaking such that the
soil structure was not disturbed. This suggested that all soil
surfaces, including those in the interior of the colloidal aggregates,
were readily accessible for solutes in a relatively short period
of time.
However, exchange with water of hydration or proton transfer on
the soil surfaces may enable the tritiated water to equilibrate in a
unique way such that other solutes may not. Stewart and Baker (1973)
reported that the hyroxyl exchange between the clay crystal-lattice
and the bulk phase of water tagged with either deuterium or tritium
varied from about 2% for kaolinite to over 50% for vermiculite and
certain montmorillonite clays. This may explain the lack of difference
in relative rates of movement of deuterium- and tritium-tagged water
in miscible displacement studies of Corey and Horton (1968) with an
acidic kaolinitic soil. Although oxygen-18 can be used as a direct
tag for water (Corey and Horton, 1968), the cost, complex analytical
procedures for o~jgen-18, and possibility of anion exchange of l80H
with clay-surface hydroxyl groups (Halevy, 1964) impose restrictions
on the use of oxygen-18 as a practical tracer of water.
Because of the limitatio~s of water tagged with any of the
isotopes to serve as a reference solute, an alternate reference solute
was sought, which would have similar molecular properties as water.

87
Methanol was chosen to be tested for such a purpose and 1% aqueous
solutions of l4C-methanol were used both in equilibrium and column
displacement studies. The concentration of methanol in water was
maintained low to avoid any complications due to its strong dessicant
properties at higher concentrations. Preliminary trials to evaluate
the fraction of soil water equilibrating with added methanol failed to
yield reliable results due to large experimental variation in the
batch technique.
Green and Corey (1972) have demonstrated increased precision of
adsorption measurements when flow-through method was used instead of
conventional batch technique. Errors in our measurements using their
system were less than 1%. Flow-through equilibration of a sample of
Hilo subsoil indicated that while all of the native soil water
exchanged with added tritiated water, only 94% of the soil water
equilibrated with added methanol. Equilibrium adsorption distribution
coefficient (Kd) of 3.95 and 1.81 ml/g, respectively for picloram and
chloride, were also calculated from adsorption measurements on Hilo
subsoil in a flow-through system. The larger Kd for picloram herbicide
is indicative of greater adsorption of that solute than chloride on
Hilo soil.
It is of interest to determine if more soil water would be
excluded from methanol under flow conditions and if the fraction of
soil water excluded from methanol will also be excluded frrnn other
solutes, such as picloram herbicide and chloride.
Results from miscible displacement of tritiated water and
l4C-methanol are presented in Figure 3-2. The two types of data points

321o21
oo
1.0I .
I ;;::0.,34 em/min
~• ~-
'b0 Iv
o"0.134 em/min tvu....
UI 0.8.-l
J.< I to0
0u
I ~14
.... I 3 M 0uCH
30H
~ 2A
0U 0.6z
I 00U
til
~~~0fJ)
~ 0.4 0~
~~
9~
0.2
PORE VOLUMES. V/V0
Figure 3-2. Breakthrough curves for (A) tritiated water and (B) 14C-Methano1obtained from a saturated column of Hi10 subsoil at an average
pore-'ve1ocity of 0.134 em/min. coco

89
for tritiated water (Figure 3-~) were obtained by two successive
displacements. The methanol data are sho~vn as data points in
Figure 3-2B. In both cases the solid line representing the break
through curve is a visually-fitted curve to the experimental data
points. The tritiated water breakthrough curve is repeated in
Figure 3-2B for reference. Notice that the methanol breakthrough
curve is described in Model lIB while that of tritiated water fits
Model lIA. The reader is referred to Chapter 1 of this dissertation
for a detailed description of the breakthrough curve models.
Assuming no adsorption of both these solutes, we use the areas
above the breakthrough curves to calculate the column retardation
factor (VelVa from equation 1-5) of 0.91 for methanol in contrast to
1.00 for tritiated water. Thus, it appears that while all of the
native soil water in Hila subsoil is available for solute transport
processes, a small fraction of about 10% is apparently not. Similar
to the negative adsorption of anions by positively charged clay surfaces,
a small volume of the soil water was excluded from methanol in Hila
soil.
It should be pointed out that all of the soil water participated
in displacing ~ritiated water, suggesting that the nonsolvent fraction
of soil water is exchangeable. These results also suggested that it
may be more meaningful to use methanol as a reference solute than
tritiated water in all subsequent displacement studies on the Hila
soil. Further substantiation of this assumption is presented later in
the discussion.
Breakthrough curves from miscible displacement of chloride and

90
pic10ram are presented in Figure 3-3. The methanol breakthrough curve
(Figure 3-2B) is shown here as a solid curve for reference. Model IV
(see Clmpter 1) describes the breakthrough curves for both picloram
and chloride, indicating adsorption. Due to greater adsorption of
pic10ram by Hilo soil, the breakthrough curve for picloram is shifted
farther to the right than that for chloride (Figure 3-3A vs 3-3B;
see also Chapter 1). The areas above these breakthrough curves were
measured (to represent Ve ) for calculation of the column retardation
factors (=Ve/Vo) with both tritiated water and methanol as reference
(to represent Vo)'
Retardation factors calculated from both flow-through equilibra
tion and miscible displacement for the four solutes studied are summa
rized in Table 3-1. Comparison of retardation factors for methanol
and tritiated water reveals that while all soil water equilibrated
with tritiated water, only about 94% and 91% were available for
equilibration with methanol under equilibrium and flow conditions,
respectively.
A comparison of retardation factors for pic10ram and chloride
from both equilibrium and displacement data with tritiated water as
the reference (Table 3-1, columns 1 and 2) indicates that adsorption
of both these solutes was incomplete under transient conditions.
This implies that nonequilibrium conditions for adsorption existed in
the displacement studies. Evidence is presented in the following
discussion to show that equilibrium conditions did exist in the
column, and that above implication is the result of using improper
reference solute.

oo
o
o
o
Q
"(J
o
oo
oo
o,p
o PICLCRAM00
o
HILO Subsoil
CHLOR IDE•.
oG)
c
o
o
o
o
o
o
HlLO Subsoil
-; -0.134 cm!rnno
0.4
0.2
~...:loen
s:....~
~
.u8
::;:p::: e i1 0 ;; ise I I• i , .--...
0.8o
u.....UI....~
o
U o 0.6.....u
32o21
0' I' 000- I I ! 'CSE>QiJV I , ,
o
PORE VOLUMES. VIV0
Figure 3-3. Breakthrough curves for (A) chloride and (B) picloram obtainedfrom miscible displacement through a saturated column of Hilo subsoilcolumn, at an average pore-velocity of 0.134 em/min. The reference BTC
of methanol is ShO\Vll as a solid curve in both cases.
\0I-'

92
Table 3-1. Comparison of retardation factors computed usingequilibrium and miscible displacement techniques:
Data for Hi10 subsoil column
------------------------------------Retardation Factors
Solute
Reference
Equilibrium Miscible Displacement(Ve/V0)
Adsorbed
Pic10ram
Chloride
1.00
0.94
2.22
1.56
1.00
0.91
2.04
1.45
(1. 00)
2.22
1.58

93
Adsorption of picloram and chloride on Hilo soil is completed in
only one hour equilibration. Kinjo and Pratt (1972) obtained similar
results for nitrate adsorption on a related Andept soil from South
America. Average residence times (=L/vo ' where L is the length of the
soil column, cm; and vo is the average pore-velocity, cm/hr) are
calculated to be about 4 hours for both picloram and chloride in Hilo
soil column. Surface accessibility is also not limiting in adsorption
as indicated by tritiated water equilibrium data. Therefore, with the
possibility of near equilibrium conditions uuring flow, complete
adsorption of both these solutes can be expected.
If the fraction of soil water e>~c1uded from methanol is truly
nonsolvent (see Figure 3-1), i.e., excludes all solutes, it would be
more realistic to use methanol breakthrough curve as reference in
computation of column retardation factors, rather than that of
tritiated water. Recalculated values of the column retardation factors
for pic10ram and chloride with methanol as reference are also presented
in Table 3-1. The nearness of these values to those obtained under
equilibrium conditions confirms the estimate of nonso1vent fraction of
soil water obtained with methanol. It should be recognized that, in
cases of anion displacement through soils which possess high net
negative charge (say a soil predominantly montmorillonite), the soil
water "VOid" of anions due to negative adsorption is not truly
nonsolvent but is specific nonso1vent (Figure 3-1). The fraction of
soil water excluded from anions, such as chloride, is ~ excluded
from solutes such as calcium, magnesium or other similar solutes. In
such studies the use of tritiated water as a reference may be
appropriate.

94
Wells and Furkert (1972) in a study involving a Hydrandept soil
from New Zealand found tbat water in that soil can be classified into
three broad groups based on the nature of bonding of water molecules
to allophane. They suggested that soil water existed in the
Hydrandepts as (i) free water, the bulk soil water, (ii) hydrogen
bonded clusters of water molecules situated in the interior of
the colloidal aggregates, and (iii) single water molecules hydrogen
bonded to the allophane surfaces. Based on the results obtained from
equilibrium and flow measurements on Hilo soil, we may conclude that
the soil water in groups (i) and (ii) readily exchanges with water
and solutes and participated in flow, while that in group (iii) may
be nonsolvent due to greater affinity of water molecules with the
soil surfaces.
Finally, it must be stated that breakthrough curves from miscible
displacement of methanol and tritiated water through a duplicate
column of Hilo soil and also a column packed with Hilo soil collected
from another site yielded similar results as reported here. This
further confirmed our findings on Hilo soil.
Given that the Hilo soil column was packed with 291 g soil
(oven-dry basis) and contained a total of 941 ml water, and taking an
average value from flow and equilibrium measurements reported earlier,
the nonsolvent fraction of soil water in Hilo soil is calculated to
be about 0.24 ml/g soil (=0.075 X 941/291). This value corresponds
well with the magnitude of specific nonsolvent fraction of water in
vermiculite (0.22 ml/g) and in montmorillonite (0.36 ml/g) reported by
El-Swaify et al.(1967).

95
AS8uming the specific surface area of Hilo soil is equal to
2 0],-200 m /g' and that a single water molecule occupies an area of
10.8 %2 (Foster, 1948), the thickness of truly nonsolvent fraction
of soil water in Hilo soil is calculated to be approximately 5 molecular
layers. This value is well within the magnitude of bound water
thickness discussed earlier in this paper. Bower and Goertzen (1955)
reported the thickness of specific nonsolvent water to be only about
1-2 molecular layers. Calculations from the data of El-Swaify et ale
(1967) also yielded similar values. Rode (1965) defines such water
as firmly bound water to differentiate from loosely bound water; the
latter being part of the attenuated hydration shell. It is doubtful,
however, if a clear and abrupt boundary exists between these two groups
of soil water.
Wahia\va Subsoil Data
The pore space in aggregated soils, such as in Wahiawa soil
used in this study, consists of inter-aggregate macroporosity and
intra-aggregate microporosity, resulting in a bimodal pore-size
distribution (Sharma and Uehara, 1968; Tsuji, Watanabe, and Salmi,
1974). Extremes in pore-velocities exist in an aggregated soil as a
result of such bimodal pore-size distribution. During solute and
water transport, the macropore sequences serve as the major conducting
channels, while the solute and water contained in the microporosity
may be bypassed. Movement of solute out of these micropores is believed
*As estimated by students in SOILS 640 course (class of Spring1974) taught by Dr. Samir El-Swaify at the University of Hawaii;Unpublished data from a class project.

96
to be a slow, diffusion-controlled process (Green, Rao, and Corey,
1~72). It is of interest, therefore, to employ the same technique as
used for evaluation of the truly nonsolvent fraction of soil water in
Hydrandepts in quantifying the fraction of soil water, if any, that is
temporarily or permanently excluded from the flow process in a Wahiawa
subsoil.
Breakthrough curves obtained from simultaneous miscible displace
ment of tritiated water, 14C-Iabeled methanol, and chloride through a
saturated column of Wahiawa subsoil are presented in Figure 3-4.
It is apparent that the breakthrough curve for 14C-methanol is described
by Model IIA, while that of tritiated water and chloride fits Model
IV (see Chapter 1). Since the major clay mineral in Wahiawa subsoil is
kaolinite, and hydroxyl exchange between clay-lattice and bulk water is
expected to be small (Stewart and Baker, 1973), the observation that
tritiated water is adsorbed by Wahiawa soil is surprising. A frontal
displacement at a lower velocity (0.08 em/min) and a zonal displacement
at a velocity of 0.18 em/min were run for confirmation (data not
shown here), which also yielded similar results. It is probable
that the hydroxyl exchange between the iron oxides and the tagged
water may be the cause for observed adsorption.
Since tritiated water cannot be used as reference tracer due to
its adsorption on Wahiawa soil, l4C-methanol was chosen for such a
purpose in computation of the column retardation factors. A ratio of
Ve/Vo = 1.00 (Table 3-2) further justifies the use of methanol as the
reference solute, and also indicates that ~ soil water is mobile in
Wahiawa soil inspite of its aggregated nature. These results are

~ 14CH OHJ
a JH 02
C CHLORIDE
\~AHIAHA SUBSOIL
(0 0 25 - 2.0 rom)
Vo = 0018 em/min
1. , , I • Q,
u2[] oS
U
UJ:> 04...l-e.'!.JW(Ioe
ou-.....:.......au
. ,.
:3
vivoe
VOLUMES I
41
PORE
0' ~I ! , • , IQ
Figure 3-4. Breakthrough curves for methanol, tritiated water,and chloride obtained from a saturated column of
Wahiawa subsoil at an averagepore-velocity of 0.18 em/min
\0......

98
contradictory to those reported by Cagauan (1969) for the same soil.
He concluded that about 30% of the soil water was dead ~mter from
a computation method based on the shift of tritiated water breakthrough
curves to the left of one pore volume. However, column retardation
factor calculated from his data revealed that all soil water was
indeed mobile (Table 3-3, VelVo = 1.00). Asymmetrical breakthrough
curves with extensive tailing in reaching CICo = 1.0 obtained by
Cagauan (1969) may be the result of radial segregation of aggregates
caused by poor packing techniques (Ripple, James, and Rubin, 1974).
Furthermore, effects of intra-aggregate diffusion are expected to be
negligible for packings of soil less than 2 rom diameter (see Appendix
5). Thus, it is concluded that all soil water in Wahiawa soil is
mobile. The fraction of soil water considered dead water by Cagauan
(1969) may have been that excluded only from active flow. It is the
author's conclusion that this fraction of soil water may have been that
contained in the intra-aggregate micropore sequences.
Calculated equilibrium and column retardation factors for three
tracers studied are presented in Table 3-2. It is apparent that
methanol is not adsorbed by Wahiawa soil. However, a value of greater
than 1.00 for the retardation factor for tritiated water further
substantiates the observation that it is adsorbed by Wahiawa soil. A
comparison of equilibrium and column retardation factors for chloride
reveal that nearly equilibrium conditions for the adsorption of chloride
existed only at the slower displacement (Table 3-2) and not at a high
pore-velocity.
Results obtained from equilibrium and column studies on Hilo
and Wahiawa soils (Tables 3-1, and 3-2) suggest that the use of

99
Table 3-2. Comparison of retardation factors computed usingequilibrium and miscible displacement techniques:
Data for Wahia't'l1a subsoil column
Retardation Factors
SoluteEquilibrium
(l+p Kd/8 s)
....Miscible Displacement"
(Ve/Vo)
VI
l4C~OH 1.00 1.00
3H 0 1.11 1.092
Chloride 2.13 1. 78
1.00
1.07
2.05
*Miscible displacement studies conducted at two average porevelocities of vI = 0.18 cm/min and v2 = 0.08 cm/min.

100
tritiated water as a reference solute may be limited by either
adsorption or failure to represent effective pore-volume. Methanol
appears to have promise as a substitute for tritiated water in the two
soils investigated here. Attention must be given to the possibility
of hydroxyl exchange between labeled water and clay-lattice hydroxyl
in use of tritiated water.
Selected Published Data
To further evaluate the utility of the method employed in this
paper, originally developed in Chapter 1, some published miscible
displacement data for nonreactive solutes were analyzed. Holdback (H)
and column retardation factors (Ve/Vo) calculated from these data are
presented in Table 3-3. It is apparent that when the soil column is
completely saturated, all soil water participated in the solute
displacement process, as indicated by a value of 1.00 for the column
retardation factor. However, with decreasing water contents the fraction
of soil water excluded from flow process increases, implied by
decreasing value of column retardation factor (data of Nielsen and
Biggar, 1961; and Krupp and Elrick, 1968). Most of the excluded soil
water in these studies is probably entrapped in air pockets (Or lob
and Radhakrishna, 1958) rather than being either truly or specific
nonsolvent fraction of the soil water.
The data of Van Rosenberg (1956) and Handy (1959) was included
due to the unusual nature of the displaced fluid/displacing fluid
combination. In both these cases, however, all of the pore-sequences
were active in flow (Ve/Vo = 1.00).

Table 3-3. Calculated values of holdback (H) and column retardation factors (Ve/Vo)from selected published miscible displacement data
Flow Retar.Source Soil/Media Displacing Displaced yelocity Wate3 Co~t. Holdback Factor
Type Fluid Fluid v(cm/hr) (cm /cm ) (H) (Ve/Vo)
Van Rosenberg (1956) Otta\va Sand Ethyl-n Benzene 2.5,20,150 0.35 0.02 1.00butyrate
Handy (1959) Consolidated Methanol/ v7ater 0.83 0.25 0.06 1.01Sandstone sucrose
in water
Nielsen and Biggar Oakley sand 0.01.!,'! CaC12 0.01.!,'! CaS04 0.30 0.36~... 0.06 0.99
(1961) 0.33" 0.10 1.000.27* 0.13 0.93
Krupp and Elrick Glass Beads O.l.!,'! CaC12 water 5.46 0.37... 0.02 1.00(1966) 9.23 0.21: 0.08 0.98
2.13 0.10" 0.09 0.92
Cagauan (1969) Wahia,;va 3H 0 water 9.2 0.56 0.33 1.002
Green, Rao, and Molokai 3H 0 \vater 9.3 0.62 0.21 1.00Corey (1972) 2
Cecil 3H 0 water 10.0 0.57 0.06 1.002
*unsaturated conditions, all others are saturatedI-'0I-'

102
Values of holdback (H) were computed by equation 1-2 for all
miscible displacement data and are also shotvn in Table 3-3. Holdback
values approach zero as the flow approaches piston displacement
(Model I, Chapter 1), as is the case for displacement of ethyl-~
butyrate through benzene-saturated Ottawa sand (Van Rosenberg, 1956)
and chloride through water-saturated glass beads packing (Krupp and
Elrick, 1968).
Data from Wahiawa, Mololmi, and Cecil soils (Table 3-3) indicate
that all soil water is mobile and participated in the displacement of
tritiated water through saturated columns of these aggregated soils.
These results do not support cmnmonly held concept that micropore
water in aggregated soils is excluded from flow (dead water). It is
suggested that greater attention must be given to the process of solute
transfer between intra-aggregate micropores (which act as a distributed
temporary sink/source for the solute) and the conducting macropore
sequences.
The above discussion sufficiently demonstrates the applicability
of the technique proposed (Chapter 1) in quantitative evaluation of
nonsolvent fraction (or that excluded from flow) of soil water. The
method also allows for determination of the degree of disequilibrium
conditions for adsorption that exist in the soil column during miscible
displacement studies by comparing column and equilibrium retardation
factors. Results reported here also suggest that it may be more
14appropriate to use C-methanol as a reference tracer than tritiated
water, in miscible displacement studies with Hydrandepts and ilicisols
of Hawaii.

CHAPTER 4
COMPARISON OF TWO DIFFERENT TECHNIQUES FOR
COMPUTING EFFECTIVE PORE-SIZE DISTRIBUTION
OF AN AGGREGATED OXISOL
ABSTRACT
The pore-size distribution of a Molokai subsoil column packed
with sieved aggregates (0.25 to 4 mm diameter) was measured by two
different methods. The soil moisture characteristic curve (displace
ment of soil water by air) is made use of in determining the actual
void-size distribution in the method of immiscible fluids. The method
of miscible fluids utilizes the breakthrough curves from displacement
of two miscible fluids through a saturated soil column to measure the
size distribution of bundles of capillaries that are assumed to
describe the porous medium. A narrow and nearly symmetrical gaussian
distribution resulted from the method of miscible fluids, while the
method of immiscible fluids yielded a distribution with extreme positive
skewness. Results reported here and by others in the litercture point
out the fact that the concept of Eore is not unequivocally defined;
thus care must be exercised in comparing pore-size distributions
obtained from various techniques. In our efforts at understanding the
complex geometry of the porous media and in modelling the flow
processes, some measure of the pore accessibility in addition to the
pore-size distribution is essential.

INTRODUCTION
Since all transport phenomena, both in gaseous and liquid phases,
occur in the voids of a porous medium, a quantitative and qualitative
description of these voids is of interest to the soil physicist. The
size distribution of the voids, their location in the medium, how the
voids are inter-connected and their accessibility to fluids characterizes
the porous medium.
Most important techniques available for determination of the pore
size distribution of porous media are summarized in Table 4-1. In the
methods of immiscible fluids, the volume of liquid either withdrawn
from or entering a sample of the porous medium is measured when the
suction or pressure imposed OIl the sample is successively incrementally
increased. The average radius of the pore either being invaded or
emptied by the liquid is computed from the capillary-rise equation.
A unique procedure, based on displacement of two miscible fluids
through a sample of the porous medium, was devised by Klinkenberg
(1957) to obtain the effective capillary-size distribution of the
medium. The cumulative frequency distribution of the capillaries is
obtained from the experimentally determined relationship between the
amounts of the displaced fluid recovered from the sample and the amount
of displacing fluid entering the sample.
The concept of stereology forms the basis for the photomicLo
graphic techniques. Wood's metal is injected into a sample at the
least penetrant pressure and subsequently the metal is allowed to
solidify. The size distribution of the pores that contain the metal
is determined micrographically on thin sections of the sample. More

Table 4-1. Some major categories of methods available for determinationof pore-size distribution of porous media
Hethod
I. Methods of Immiscible Fluids
a) soil moisture characteristic
b) mercury intrusion porosimetry
c) oil intrusion porosimetry
II. Methods of Hiscib1e Fluids
miscible displacement
III. Photomicrographic Methods
IV. Gas Adsorption Methods
Principle
Air-water displacement
Air-mercury displacement
Air-oil displacement
To1uene-isooctane displacement
Tritiated water-distilledwater displacement
Wood's metal intrusionand stereo1ogy
Nitrogen gas adsorptionand BET equation
Reference
Leamer and Lutz, 1940
Washburn, 1921Rootare and Nyce, 1971
Pickell et a1., 1966
K1inkenberg, 1957
This Paper
Du11ien, 1970, 1972Du11ien and Mehta, 1971Dullien and Dhawan, 1973
Barrett et a1., 1951Sills et a1., 1973a,b
......o0'\

107
metal is injected into another statistically identical sample at a
higher pressure and the above described sequence of events is repeated.
The injection pressure is increased from sample to sample until the
sample is finally saturated with the metal.
The Braunuer, Emmett and Teller (BET) adsorption theory is
utilized in computation of the pore-size distribution of a porous
medium from nitrogen gas adsorption data. This method is useful in
determination of the size distribution of the micropores (radius less
than about 300 R).Since generally the actual geometry of the voids in a porous
medium is complex ~nd may not be accurately measured by any of the
above techniques, greatly simplified models, such as bundles of
capillaries of different radii, are assumed to describe the medium.
Childs and Collis-George (1950), Marshall (1958), and Millington and
Quirk (1960) have presented pore-interaction models to predict the
permeability of porous media based on the pore-size distribution.
More recently, Lindstrom and Boersma (1971) have extended the capillary
bundle approach to prediction of solute dispersion. They proposed
that dispersive equations for predicting solute transport in soils can
be improved by considering the entire pore-velocity distribution in
the medium rather than just an average pore-velocity term.
It was necessary to obtain a reliable measure of the pore-size
distributions of certain Hawaiian soils in our attempts to evaluate
the utility of the Lindstrom-Boersma (1971) model for predicting solute
dispersion in these soils. A review of the literature (Klinkenberg,
1957; Dullien, 1972; Dullien and Mehta, 1971) revealed that widely

108
different pore-size distributions can be obtained on the same sample
depending on the method employed. Therefore, it was decided to obtain
the pore-size distribution of our soils by at least two methods, and
compare the results thus obtained.
Among the methods listed in Table 4-1, suitable apparatus was not
available in our laboratory to employ Methods Ib, Ic, and III. It
was decided not to use Method IV due to its applicability over a
olimited pore-size range (14 to 600 A; see Rootare and Nyce, 1971).
Hence pore-size distributions were determined only by Methods Ia and
II. This choice is further justified in that the use of soil moisture
characteristic curves to obtain the size distribution of pores in a
soil (Method Ia) is popular among soil scientists. Method Ia has an
added advantage over Methods Ib and Ic in that the former method
employs water as the wetting fluid, while the latter two methods
use mercury and oil, respectively. Inasmuch as petroleum engineers
are interested in relating mercury and oil intrusion porosimetry data
to residual oil saturations, we must be concerned with the accessibility
of soil pores to water and not to mercury or oil.
Since the assumption that the geometry of the porous medium can
be described by bundles of cylindrical capillaries was implied in the
Lindstrom-Boersma model, and since the method of miscible fluids
(Method II, Table 4-1) determines the size distribution of such
capillaries in the medium, it was further decided to utilize this
technique as an alternate method. It should also be noted that this
method has not been adapted to the study of soils.
The objective of the work reported here is to compare the two
aforementioned methods of obtaining pore-size distribution of an

Oxisol. A discussion of the causes for difference distributions
obtained by various techniques listed in Table 4-1 is included.
Experimental data from miscible displacement studies with Mo101~i
subsoil columns (Green, Rao, and Corey, 1972) were used in the
analysis presented here.
109

THEORY
Method of Immiscible Fluids
The relationship between soil water content (8) and the suction
(~) is commonly referred to as the soil moisture characteristic
curve. The degree of saturation of the medium (S) at any given
suction is defined as the ratio of volumetric water content at that
suction to the saturated water content. The mean pore radius (r)
corresponding to the degree of saturation can be computed from the
Laplace equation, commonly referred to as the capillary-rise equation,
as r = O.149/~ (where r is in cm and ~ is expressed in cm water) ,
under the assumption that the contact angle between the soil and water
is zero. The degree of saturation of the medium at a given suction is
also the fraction of total pore volume corresponding to pores with radii
less than or equal to that calculated from the Laplace equation. Thus,
the measurement of the soil moisture characteristic curve allows for
the determination of a cumulative pore-size distribution of the soil.
However, the validity of the capillary-rise equation breaks down
for very large suctions (i.e., very small radii). Furthermore, it is
very difficult to obtain an accurate description of the soil moisture
curve at its lower end (for large suctions). Such difficulties can
be overcome by redefining the degree of saturation of the porous medium
according to Brutsaert (1966). He introduced the linear transformation,
(4-1)
to define the effective degree of saturation, Se' where, Sr is the
irreducible or residual saturation. Sr is assumed to correspond to the

111
pore volume that does not contribute significantly to the transport
phenomenon, and its choice is fairly arbitrary. However, for some
applications its value can be defined to be equal to that approximating
field capacity or some estimate of capillary porosity (e.g. water held
in the soil at tensions exceeding 100 em water).
The corresponding pore-size density distribution, se(r), is then
given by
(4-2)
and can be determined either analytically if the function Se(r) is
knovm or graphically as the slopes of the experimentally measured
plot of Se(r) versus r developed from the soil moisture characteristic
curve.
The mean pore-radius (~r) and the variance (ar2) of the pore
size density distribution thus determined can be defined as follows:
, 1; Se(r) dr / f:(r) (4-3a)ml = ~ = drr
00
Se(r) dr / l~(r) dr,
jr2m2 (4-3b)
a 2 (,~ I ,<0m2 = = ... (r - ~r)2 se(r) dr j se(r) dr (4-4a)ro 0
a 2,
(m~)2= m2 (4-4b)r
where,r
and r •ml m2 are the f1rst and second moments about the origin and
m2 is the second moment about the mean. The denominator in equations
4-3 and 4-4a is equal to 1.0 and can normally be ignored. However,
errors introduced by numerical integration schemes can be compensated
for by defining the moments as in equations 4-3 and 4-4.

112
The fraction of void volume occupied by a given pore-size
increment can be determined by approximating the frequency distribution
curve with histograms with small increments along the x-axis (radius
increment). The ratio of area under a given rectangle to tlmt of
total area under the frequency curve is the fraction of the total void
volume occupied by the j th pore-size increment. These fractions are
referred to as the weighing coefficient (Aj) by Lindstrom and Boersma
(1971), whose terminology we will follow here.
Method of Miscible Fluids
A unique procedure was described by Klinkenberg (1957) to obtain
the effective size distribution of the capillaries in a porous medium,
assuming that the medium could be modelled as an assemblage of straight,
cylindrical, and unconnected bundles of capillaries of varying radii.
The cumulative frequency distribution of such capillary bundles is
obtained from experimentally determined relation between the amount of
displaced fluid recovered and the amount of displacing fluid entering
the porous medium from displacement of two miscible fluids through the
porous medium. Klinkenberg (1957) utilized the breakthrough curves
obtained from miscible displacement of iso-octane with toluene in
sandstone cores to illustrate his method.
The density distribution of the capillary bundles that makeup
the porous medium is assumed to be described by a function F(r) such
that F(r)dr is the fraction of the total pore volume occupied by
capillaries with radii between rand rtdr. It is also assumed that
~nax is the radius of the largest capillary and that of the smallest
capillary is rmin. Klinkenberg (1957) has shown that the volume of

displacing fluid (Vx) entering
Jr max
Vx = (l/rx2
)
r min
the column at any time tis,
r 2 F(r) dr
113
(4-5)
and the volume of displaced fluid recovered (~) at that time tis,
i rmax~ = r F(r) dr +
x lr
2 x(l/rx )
r .IllJ.n
F(r) r 2 dr (4-6)
After differentiating both equations 4-5 and 4-6 to obtain dVx/drx
and dRx/drx , respectively, and rearranging yields,
(4-7)
The quantity on the L.R.S. of equation 4-7 can be determined
either experimentally or graphically as the R-axis intercept of a
tangent to the plot of R versus V. Note that both R and V are expressed
as a fraction of the total pore volume of the column.
Thus, the fraction of the total pore volume occupied by capillaries
with radii between r x and rmax can be found. However, to be compatible
with the method of immiscible fluids described in the previous section,
we require
=frx
jrmaxSeer) F(r) dr = 1 - r F(r) dr (4-8a)
r min x
= 1 - [~ Vx (dR/dV)x J (4-8b)
The capillary radius, r x ' corresponding to the value of Seer)
calculated in equation (4-8b) is computed as,
(4-9)
where, k is the intrinsic permeability of the medimu (cm2), 8s

114
is the porosity of the medium (cm3/cm3), and Vx is defined in equation
(4-5). The permeability k can be determined from more easily measured
saturated hydraulic conductivity, Ksat ' from the relationship
k = Ksat n/g p , where n is viscocity, p is density of the water, and
g is acceleration due to gravity.
The pore-size frequency distribution and its mean and variance
are computed as described before according to the method of moments
(equations 4-2, 4-3, and 4-4).

MATERIALS AND METHODS
Experimental breakthrough data from miscible displacement of
tritiated water in packed columns of Molol~i (Typic Torrox) subsoil
reported by Green, Rao, and Corey (1972) were utilized in computation
of the pore-size density distribution by the method of miscible fluids.
The soil moisture characteristic curve for the same Molokai soil
column measured by these authors was made use of in the method of
immiscible fluids. Experimental techniques for measuring the break-
through curves are reported by Green, Rao, and Corey (1972) and also
elsewhere in this dissertation (Chapter 3).
The recovery (Rx) of tritiated water from the Molokai column was
calculated from the breakthrough curve, where distilled water displaced
tritiated water in the column, by the following relationships:
and
(4-10a)
(4-l0b)
where,
Veffl = effluent volume, ml
Vo = total pore volume of the column, ml
(~Veffl)j_= increment of the effluent volume for j th
interval chosen for approximation of ~' ml
(C/Co)j = mean relative solute concentration for
j th interval chosen

116
The values of the R-intercepts of the tangents to the plot of R
versus V were determined by the method of "mirror images". Numerical
evaluation of equations 4-2, 4-3, and 4-4 was accomplished by a
FORTRAN IV algorthim (Appendix 2) with the aid of an IBM 360 computer.
The relationship between effective saturation (Se) and the pore
radius (r) was developed from the soil moisture characteristic curve
for the Molokai soil. Se(r) was computed by equation 4-1 and r was
calculated from the capillary-rise equation. The value of the residual
saturation (Sr) was chosen to be equal to that of the S at a tension of
100 cm water to coincide approximately with the definition of
micropore or capillary water. The hydraulic conductivity at a tension
of 100 cm water was predicted by the Green and Corey (1971) method to
be about 0.00001 cm/min; the measured saturated conductivity was
2.225 cm/min. This is another justification for the choice of Sr as
defined above.

RESULTS
The soil moisture characteristic curve for the Molokai soil
column is presented in Figure 4-1. The inflection point at a tension
of about 5 cm water indicates the presence of several large
(> 200 11m radius) pore-sequences. The relatively horizontal nature of
the curve for tensions between 100 to 1000 cm water suggests that all
of the macro pore-sequences are emptied beyond a tension of 100 cm
water. This was the justification for the choice of Sr to be equal
to the value of S at a tension of 100 cm water. It is apparent that
about 50% of the pore space in Molokai soil is occupied by intra
aggregate micropores. The existence of a bimodal pore-size distribution
in Molokai and Wahiawa (Typic Eutrustox) soils was demonstrated
recently by Tsuji, Watanabe, and Sakai (1974) from an analysis of a
complete soil moisture characteristic curves and scanning
electron photomicrographs of aggregates of these soils.
The moisture content chosen here as representing the lower limit
of macropores (8 v = 0.3) is in close agreement with the measured
"field capacity" of the Molokai field profiles (Rao et al., 1974).
The breakthrough curve (BTC) obtained by miscible displacement
of tritiated water with distilled water through a packed column of
Mololmi subsoil is presented in Figure 4-2. The displacement was
done at an average pore-velocity (vo) of about 0.153 cm/min. The BTC
is assymetrical in shape and is displaced slightly to the left of one
pore volume, suggesting "exclusion" of the solute (see Chapter 1).
A plot of the recovery (R) of tritiated water from the Mololmi soil
column versus the effluent volume, (both expressed as a fraction of the

,.......M
SU
.........M
s .6 r- ........... MOLOKAI SUBSOILu'-'
(J)
.E-<:z:
.4~ \- JQ.:l
E-<:z:0u
~Q.:l
E-<-<;::...:z1-4
0 ..2en
1 10 100 1000
SOIL WATER TENSION,~ (em water)
Figure 4-1. Soil moisture characteristic curve for a Molokai subsoilcolumn. The vertical arrow drawn at a tension of 100 em
water points the limit chosen for Sr'
,.......-co

1.0
0.8
MOLOKAI SUBSOIL COL~~
TRITIATED WATER
-; aO.153 em/mino
0s-0.626 em3/cm3
119
0.6u
0
.....u
z0H
~I-<
15 0.4uz80
M:::
'"~H
~ 0.2
o
o 400 800' 1200 1600
E F FLU E H T VOL U M E, V (m1)
Figure 4-2. Breakthrough curve obtained by miscibledisplacement of tritiated water initially saturatinga Molokai subsoil column with distilled water at anaverage pore-velocity (vo) of 0.153 em/min. Thehistograms used in estimation of the recovery
(R) are also sho\vu.

120
total column pore volume) is shown in Figure 4-3. This plot was
developed from the data presented in Figure 2. R-intercepts of several
tangents to the plot of R vs. V are also illustrated in Figure 4-3.
The relationship between the effective degree of saturation
(Se) and the pore-radius (r) computed by the two methods described
here (equations 4-1, 4-8, and 4-9) are given in Figure 4-4. The
differences in location and shape of these two curves is very striking.
The frequency distributions, se(r) , approximated by numerical solution
of equation 4-2 for data presented in Figure 4-4 further demonstrate
the extreme positive skewness in the frequency distribution obtained by
the method of immiscible fluids (Figure 4-5A ar.d 4-5B). The calculated
mean radius (~r) was about 10 times less and the variance (Or2 ) about
400-times lower for the frequency distribution estimated from the
method of miscible fluids than that obtained from the method of
immiscible fluids (Table 4-2).
The weighing coefficients, Aj , defined to be the fraction of the
total void volume occupied by the pores in the j th size increment,
were ascertained by approximating the area under the frequency
distribution curves (Figure 4-5) by histograms of equal width
(corresponding to constant radius increments). A. was calculated asJ
the ratio of the area under a given histogram to the sum of areas
under all histograms that approximated the curve. The average of the
upper and lower limits of the radius of each radius increment was
taken to represent the mean radius (r j ) of that size increment.
The radii were normalized by dividi- the mean pore radius of the
distribution (~r) to facilitate the {,
distributions computed from the two m£
lon of the pore-size
under discussion here

121
2
3H 0 Recovery Curve2
3
EFFLUENT PORE VOLUMES, V
Figure 4-3. Recovery (R) of tritiated water from a Mo101mi subsoilcolumn by displacement with distilled water o Normals andthe corresponding R-intercepts of the tangents to the recovery
curve dra~vn at specific points are also presented.

103102
:'1+ HETHOD OF11ISCIBLE FLUIDS
01 Q,bMA -o__~ I
101 I
1. 0 Ii ,..;;s i b. =:;:;A I
/LI
£I
Ii. METHOD OF;IMMISCIBLE FLUIDS
!$,.
jj
z!i
D./
(1Jtf)
..0.8~-z
0H
~~tf) 0.6~0
~
~Co' 0.4~&:l
~:>HE-lU~
0.2~~~
PORE RADIUS, t (llm)
Figure 4-4. Effective pore-size frequency distribution, S (r),curves for a Molol~i subsoil column measured by
the methods of miscible and immiscible fluids. ......NN

80
20
M
I~
..~
oZ
l:::l
~
0
l:::l
~
I=z.t
60
40
o
.
METHOD OF IMMISCIBLE l--1ETHOD OF MISCIBLEFLUIDS FLUIDS -
.....
1600
1200
800
400
o
o 200 400 600 800 10 20 30 40 60
1?OJll5 RADIUS, r (].lm)
Figure 4-5. Effective pore-size density distributions, se (r), for a Molokaisubsoil, column computed using equation (4~2). The histograms
approximating the frequency distributions are also shown.
J-lNVJ

Table 4-2. Comparison o~ the mean pore-radius (~r)
and the variance (or ) for the effectivepore-size density distributions estimated
by two different techniques
124
Method
Miscible Fluids
Immiscible Fluids
Mean Radius(~r)cm
2.003 X 10⁻³
1. 811 X 10-2
Variance(O~ ~
cm
3.863 X 10⁻⁷
1.604 X 10⁻⁴

125
(Figure 4-6). The difference between the results from the two methods
is very striking. The method of immiscible fluids gave a distribution
with an extreme positive skewness, while the method of miscible fluids
resulted in a size distribution which was nearly symmetrical and
relatively narrow.

.20
.16
126
MOLOKAI SUBSOIL
~ Method of MiscibleFluids
o Method of ImmiscibleFluids
6\
E-Iz .12J:LlHUHrx..IX-<J:LloU
c..!>z .08H
6H
~
.04
oo 1 2 3 4
NORMALIZED RADIUS. r/~r
Figure 4-6. Effective pore-size distributions of a Mololmisubsoil column measured by the methods of miscibl.e andimmiscible fluids plotted against the normalized radius
(r/~ ) to facilitate comparison.r

DISCUSSION
There have been several attempts in the past to compare different
methods of measuring the pore-size distribution of porous media.
Dullien (1972) and Dullien and Mehta (1971) compared the pore-size
distribution of sandstone as measured by mercury intrusion porosimetry
(Method Ib) and th.e photomicrographic method (Method III). A very
narrow pore-size distribution was obtained from the former method,
while the latter gave a very broad distribution. Klinkenberg (1957)
obtained a very broad size distribution of pores in a sandstone by the
method of immiscible fluids (Method Ib), while a narrow distribution
resulted from Method II. Good agreement was reported between pore-size
distributions computed from nitrogen adsorption (Method IV) and mercury
intrusion methods (Sills, Aylmore, and Quirk, 1973a,b and also between
the results from oil intrusion (Method Ic) and mercury intrusion techniques
(Pickell, Swanson, and Hickman, 1966). It is apparent that the measured
pore-size distribution of a porous medium is dependent on the method
employed and that the concept of pore is not very clearly defined in the
literature. It is of interest to note that, to the author's knowledge,
no attempts have been made to compare Method la, which is most popular
in soil science, with Method Ib, which is widely used by petroleum
engineers and powder technologists.
The most commonly accepted model of the pore shape in evaluation
of data from Method I has been that of cylindrical pores proposed by
Washburn (1921). However, it must be recognized that in real porous
media the pore shapes are rather irregular and may be best described
by the classic ink-bottle type or some other pore shape with a

128
constricting neck opening into a much larger cavity or~. Such pore
shapes are known to be responsible for the c~nonly observed phenomenon
of hysteresis between absorption and desorption of fluids by porous
media. Thus, the relationship between the degree of saturation and
pore radius, i.e., the cumulative pore-size distribution function, is
not unique but is dependent on whether it was computed from the
absorption data (as in most mercury intrusion porosimetry studies)
or desorption data (such as the soil moisture characteristic curves).
l~en pressurizing the fluid into such ink-bottle type pores, the
cavity is invaded by the fluid at the same pressure as is required to
penetrate the neck, i.e., at a pressure which is higher than that corre
sponding to the void radius. ~en decreasing the pressure to desorb the
fluid from the medium, the cavity releases the fluid at a pressure
corresponding to its proper radius, i.e., at a lower pressure than at
which it was invaded. Consequently, the absorption curve is shifted
towards smaller radii as compared to the desorption curve. Data illus
trating this effect are presented by Rootare and Spencer (1972) and
Svata (1972). A method known as the Reverberi method and described by
Svata (1972) utilizes the differences between the absorption phase and
desorption phase curves to evaluate the void-size and neck-size
distributions in the porous medium. A computer program enabling rapid
processing of data from mercury intrusion porosimetry to compute void
size, neck-size, and pore-area distributions was reported by Rootare
and Spencer (1972).
It is obvious from the foregoing dis""]' ion tt;?t care must be
exercised in comparing the pore-size distributiol. mtained from
different techniques. It can now be concluded thai: ~:,le pore-size

129
distribution of the Molokai soil column, reported in this study,
computed from the method of immiscible fluids (Method Ia) represents
the distribution of the voids, while the size-distribution of the
effective capillary bundles that were assumed to make up the medium
is given by the method of miscible fluids (Method II). The differences
reported between Methods Ib and III (Dullien, 1972; Dullien and Mehta,
1971) may also be explained on the basis of the discussion in the previous
paragraph. These authors compared the data obtained from the absorption
phase curve of mercury intrusion, which describes the constricting
pore-neck size distribution, and the photomicrographic technique,
which yielded the actual void-size distribution in the medium; hence
the drastic difference between the two curves.
In any attempts to utilize the pore size distributions in modelling
the pore geometry of porous media, we must recognize what exactly is
being measured by the specific method employed. The pore-interaction
models for predicting the permeability (Childs and Collis-George, 1950;
Marshall, 1958) consist essentially of combined parallel and series
coupling of capillary tubes of different radii, whose size distribution
is measured by Method Ia. Such a pore-size distribution, however, not
only is unable to detect the dimensions of the ink-bottle type pores,
but assigns the pore volumn of such pores to the dimension of the
constricting pore-necks. It is interesting then to note that the
pore-interaction models have been fairly successful in predicting
the hydraulic conductivity of soils (Green and Corey, 1971). The
concept of "structural difficulty index" was introduced by Dullien
(1972) to quantify the differences between the void-size and neck-size
distributions, and he obtained good correlations between this quantity

130
and residual oil saturations in oil recovery tests. Dullien proposed
a model of the principal pore structure of the media, in which all of
the flow paths consist of very short tube segments in series connections
with wider segments alternating with narrower ones.
In conclusion, some measure of the accessibility of pores in
addition to the void- and neck-size distributions is essential to our
understanding of the complex pore geometry. In our efforts at
modelling the flow processes in porous media, there exists a need for
quantitative expressions which adequately describe that geometry. Some
implications of the drastic differences between pore-size distribution
obtained for Mololmi soil column by the two methods described here are
discussed i.n more detail in the Chapter 5 of this dissertation.

CHAPTER 5
EVALUATION OF A CAPILLARY BUNDLE MODEL FOR PREDICTION
OF DISPERSION OF NONREACTI\rn SOLUTES
IN HIGHLY AGGREGATED SOILS

ABSTRACT
Both zonal and frontal BTCs obtained by miscible displacement of
tritiated water through a saturated column of Molokai (Typic Torrox)
subsoil were utilized in an evaluation of a capillary bundle model
proposed by Lindstrom and Boersma (1971) for prediction of solute
dispersion in porous media. The Lindstrom-Boersma model is based on
partitioning the porous medium into several pore-size increments,
each characterized by an average pore-velocity (voj ) and dispersion
coefficient (Doj). The solution of the differential eqlmtion obtained,
subject to appropriate boundary and initial conditions, for each pore
size increment is then summed in a linear manner to yield the total
solution for the whole medium.
The pore-size distribution of the Molokai soil column was
determined by both the method of miscible and immiscible fluids
(denoted as MMF and MIF, respectively). In accordance with the
requirements of the Lindstrom-Boersma model, it was assumed that
these pore-size distributions represented the size distribution of
effective bundles of capillaries that describe the pore geometry of
the soil column; pore-velocity distributions could then be computed
by the Poiseuille equation. The dispersion coefficient (Doj ) of any
given p~re-size increment was calculated by assuming a simple linear
relationship between Voj and Doj • These data were then used as the
inputs for the predictive model.
The predicted solute dispersion profiles were highly dependent
on the pore-velocity distribution used as input data in the predictive
model. BTCs predicted either by using a pore-velocity distribution

133
from the ~~m or by using an average pore-velocity to represent the
whole soil approximated the measured curves well. However, when the
pore-velocity distribution obtained by the MIF was employed as the
input data in the Lindstrom-Boersma model, the predicted BTCs failed
to describe the measured BTCs.
The success of the capillary bundle model to predict solute
dispersion depp.nded mainly on the ability to describe the size distri
bution of effective capillary bundles that were assumed to make up the
medium. The assumption of independent flow in all capillaries was
not met in the experiments, and mixing of solute between adjacent
flow paths resulted in much less dispersion than anticipated from the
model. Some measure and mathematical description of pore accessi
bility and inter-connectedness of pore sequences appears to be
essential for quantitative prediction of the effects of pore geometry
of soils on solute dispersion.
Certain limitations of the Lindstrom-Boersma model in relation
to other geometric models as well as some macroscopic approaches of
predicting solute transport in soils are also discussed.

INTRODUCTION
Significant progress has been made in recent years in both
experimental and mathematical description of solute transport
phenomenon in porous media. Most predictive models, however, overcome
the complex nature of the problem at hand by making several simplifying
assumptions regarding the geometry of the media and the processes that
influence solute dispersion in the media. Most researchers have been
fairly successful in employing an average pore-velocity and an average
dispersion coefficient to characterize the porous medium in their
efforts of predicting solute transport through soils. Nielsen and Biggar
(1962) discussed limitations of such an approach. Most practical cases
cannot be mathematically treated as simple saturated porous media of
uniform pore size. This is especially true in soil science which
must be concerned with media having wide ranges in pore-size distribu
tion and water content.
Since it is almost impOSSible to describe the intricate geometry
of the porous medium in any exact mathematical form, the general
recourse has been to substitute an idealized and fictitious geometric
model for the real medium. In the simplest of such geometLic models,
the porous medium is assumed to be described by bundles of parallel,
unconnected, straight, and cylindrical capillaries of varying radii.
Childs and Collis-George (1950), Marshall (1958), and Millington and
Quirk (1960) have incorporated the concept of pore-interaction into
such sinlplistic models to predict the permeability of porous media.
Green and Corey (1971) have successfully employed these pore-inter
action models to predict the hydraulic conductivity of several soils
135
using a pore-size distribution measured by the soil moisture
characteristic curve (method of immiscible fluids, Chapter 4). A
possible extension of such models is to utilize the pore-size
distribution in prediction of solute dispersion in soils.
For any solute transport predictive model to have universal
application, it should be able to relate certain independently
measured physical and chemical properties of the porous media to
solute dispersion. Since unequal pore-velocities in adjacent pore
sequences is considered to be the principal cause of solute dispersion,
it would be best to use an actual pore-velocity distribution rather than
au average velocity in solute transport models.
Lindstrom and Boersma (1971) presented a predictive model, in
which they assumed that the soil can be represented simply by bundles
of capillaries of different radii. The size distribution of such
capillaries was obtained from mercury intrusion techniques (see
Chapter 4). This enabled them to use a pore-velocity distribution
rather than an average velocity in prediction of solute dispersion in
glassbead columns. Hrnvever, Lindstrom and Boersma (1971) have only
presented theoretical solute concentration profiles within the columns,
but did not compare these predicted distributions with those measured
from experiments. This theory was extended by Lindstrom, Boersma, and
Stoclmrd (1971) to include the kinetics of adsorption for a reactive
solute displacement.
Our interest in the Lindstrom and Boersma (1971) model was
further encouraged due to certain similarities in the shapes of zonal
BTCs obtained from a highly aggregated Molokai soil (Green, Rao, and

136
Corey, 1972) and those presented by Lindstrom and Boersma (1971) for
a hypothetical medium. Double peaks and "shoulders" in the zonal
BTCs measured by Green et al. (1972) could also be seen in those
predicted by the Lindstrom and Boersma (1971) model; the position and
the extent of "shoulders" in the latter BTCs being dependent on the
assumed pore-size distribution to represent the hypothetical medium.
To date, the Lindstrom-Boersma capillary bundle model has not been
evaluated with experimentally measured solute dispersion profiles in
real soil systems. Saxena, Lindstrom, and Boersma (1974) have recently
evaluated the applicability of the solution presented by Lindstrom
and Boersma (1971) for prediction of 2,!J.-D dispersion through glass
bead packings with very narrow pore-size distributions. Since
aggregated soils possess a much greater range in pore-velocity
distribution than glassbead media, solute dispersion in these soils
is much greater than in soils or other porous media with narrow pore
size distributions. Therefore, it is of interest to relate the
pore-size distribution of an aggregated soil with measured solute
dispersion profiles.
The major objective of the work reported here is to test the
validity of the Lindstrom-Boersma model (referred to as the L-B model
in all subsequent discussion) for prediction of nonreactive solute
dispersion in a highly aggregated soil. Experimental BTCs obtained by
miscible displacement of tritiated water through a saturated column
of Molokai soil were compared with those predicted by the L-B model.
The pore-size distribution of the same Mololroi soil column was measured
by both the methods of miscible and immiscible fluids (denoted as MMF

137
and MIF, respectively) and the calculated effective pore-velocity
distributions were used as the input data in such an evaluation.
Certain limitations of the L-B model in comparison with other geometric
models and certain macroscopic approaches of prediction of solute
transport in porous media are also discussed.
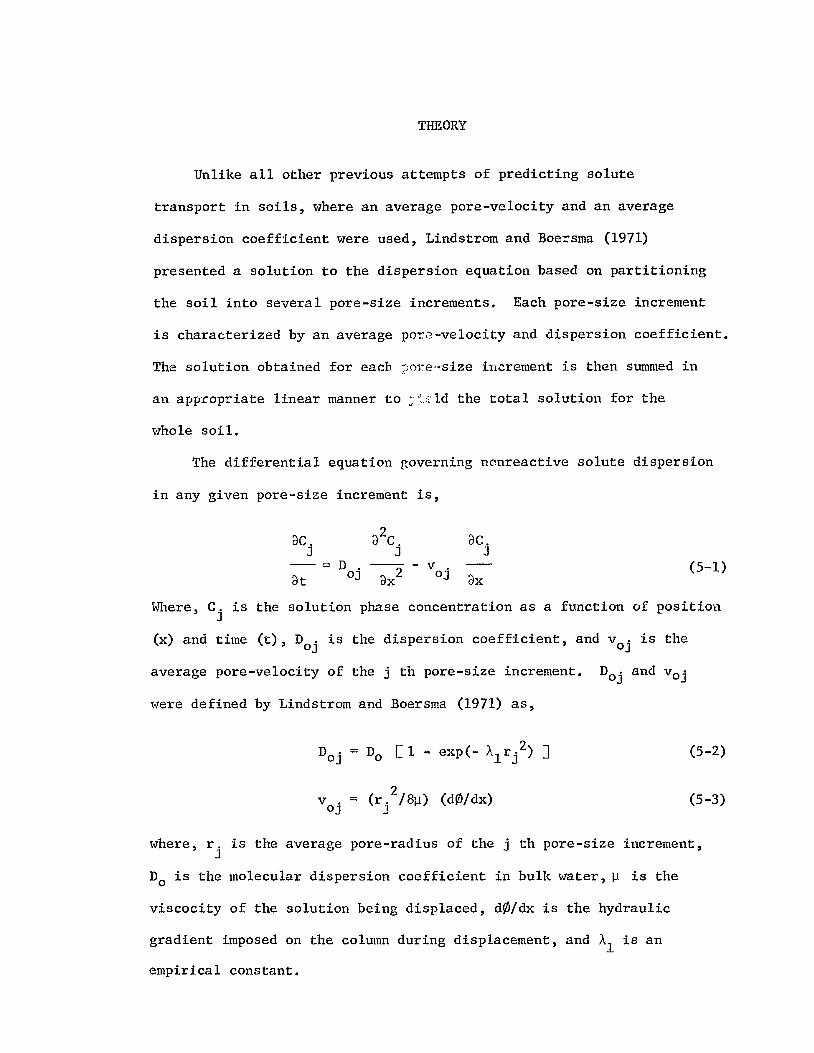
THEORY
Unlike all other previous attempts of predicting solute
transport in soils, where an average pore-velocity and an average
dispersion coefficient were used, Lindstrom and Boe=sma (1971)
presented a solution to the dispersion equation based on partitioning
the soil into several pore-size increments. Each pore-size increment
is characterized by an average por8-velocity and dispersion coefficient.
The solution obtained for each r;()n~··size increment is then summed in
an appropriate linear manner to ~.>: Id the total solution for the
whole soil.
The differential equation governing nonreactive solute dispersion
in any given pore-size increment is,
ac. a2c. ac.
J J J-=Doj 2 - vojat ax ax
(5-1)
Where, c. is the solution phase concentration as a function of positionJ
(x) and time (t), Doj is the dispersion coefficient, and voj is the
average pore-velocity of the j th pore-size increment. Doj and Voj
were defined by Lindstrom and Boersma (1971) as,
(5-2)
v . = (rJ.2/8~) (d~/dx)OJ
(5-3)
where, r. is the average pore-radius of the j th pore-size increment,J
Do is the molecular dispersion coefficient in bulk water, ~ is the
viscocity of the solution being displaced, d~/dx is the hydraulic
gradient imposed on the column during displacement, and Al is an
empirical constant.

139
Equation (5-2) assumes an exponential relationship between the
dispersion coefficient (DOj ) and the average pore-radius (rj ) , and
was based on the work of Chandrashekar (1943) for ergotic processes
in the presence of reflecting and absorbing barriers. Saxena et al.
(1974) have recently reported that 2,4-D diffusion in packings of
glassbeads could be described by equation (5-2). The value of Doj
in equation (5-2) varies between a maximum of Do as the pore-radius
approaches 00, and a minimum of zero as r. approaches zero. EquationJ
(5-3) is simply the Poiseuille equation.
In our evaluation of the L-B model, we have opted to use a simple
linear, rather than an exponential, relationship between Doj and
Voj as given below.
2D . = T (D + A2V .)
OJ 0 OJ(5-4)
where, D is the apparent molecular diffusion coefficient for theo
solute in free \Vater, T2 is the tortuosity factor, and A
2is an
empirical constant whose value depends on the soil-solute system being
considered. A relationship similar to that given in equation (5-4)
was also used by Davidson, Mansell, and Baker (1973). The value of
D . in equation (5-4) varies between D T2 for r. approaching zero,
OJ 0 J
and an upper limit defined only by the velocity (v.) of the largestOJ
pore-size increment.
Lindstrom and Boersma (1971) presented the solution of equation
(5-1) for displacement of an initially uniformly distributed rectangular
solute pulse (of length L) through a saturated soil column as,

x-L';'v .tOJCj (x, t) (
------- = ~ erfcC
o
x-v . t XV . x+v . tOJ OJ OJ
( ) - erfc ( ) + exp (--) {erfc ( )zv1.):t 2~ D . Z~
OJ OJ OJ OJ
x+L+v . t 1OJ- erfc ( )}
? ;;:;--;""_VlJ .tOJ
+~fg~/ .11 D 7f.., oj
XV . x+L+v . t x+V . t 1OJ OJ Z OJ Zexp (--) {exp (- ) - exp <- ) }
D . zvfl:t z~OJ OJ OJ
+ [<x+v. t)OJ
v . xv .OJ OJ
(--) exp (--)2D • D .
OJ OJ
X+v .t ]OJerfc ( __)
zlD .tOJ
- [<X+L+v . t)OJ
v . xv .OJ OJ
(--) exp (--)ZD • D •
OJ OJ
X+L+VOjtJ
erfc <~Z oj
(5-5)
where, erfc H = zrrr
/<0 e",p <_p2
) dp
W
!-'~o

141
It can be shown that for [ (J:+vojt) / I 4Doj tJ > 3/2, all but the
first two terms of the solution presented in equation (5-5) may be
neglected. This is so for cases involving large velocities, large
times, or large x values. The errors introduced by use of the
approximate solution become very large for small times.
The solution of differential equation (5-1) for a case of step
increase in solute concentration at the inlet end of an initially
water-saturated column (i.e. for a frontal displacement) is,
(5-6)
The average relative concentration of the solute at any position
and time can be calculated from an appropriate linear summation,
N
C (x, t) ~A. (Cj/Co). J= J= I (5-7)
'"Co ~ A·Jj=-I
where, the quantity Aj represents the weighing coefficient for the j
th pore-class (see Chapter 4), and the summation is carried over allN
N pore-size increments. Note that 2. Aj = La.j -;..,

METHODOLOGY
Miscible Displacement
Both zonal and frontal breakthrough curves (BTCs) obtained by
3miscible displacement of tritiated water ( H20) through saturated
Molokai subsoil (Typic Torrox) column, reported originally by Green,
Rao, and Corey (1972), were utilized in the evaluation of the L-B
capillary bundle model. Detailed methodology on column packing,
saturation, and solute displacement techniques is presented in the
paper by Green et al. (1972) and also in Chapter 3 of this disserta-
tion. Only pertinent details are presented here.
Sieved, air-dried aggregates (0.25 to 4 rom diameter) of Mololmi
subsoil were packed into a 20-cm long plexiglass column with an
internal diameter of 7 cm. The bulk density of the soil in the column
was 1.06 g/cm3 , and the total porosity was 0.626 cm3/cm3• The soil
column was saturated initially with CO2 and subsequently with a dilute
solution of CaC12 (0.01~) under partial vacuum to ensure a high
degree of pore saturation. Prior to any solute displacement studies,
and intermittently thereafter, the satuTat~d hydraulic conductivity
(Ks ) of the soil column was measured. A constant solution flux through
the horizontal soil column was maintained with a peristaltic tubing
pump which had negligible pulsing. The tritiated water solution was
3displaced at a velocity (=Q/Ac ' Q=flux, cm /min; Ac=cross-sectional
column area, cm2) of 0.098 cm/min, which compares vlith K = 2.22 cm/mins
for the same column.
Tv10 types of displacement were used: (1) zonal, i.e., displacement
of a 45 ml "zone" of 0.01!,! CaC12 containing 0.16 llCi/ml 3~o by a
143
tracer-free solution of 0.01~ CaC1Z' and (Z) frontal, i.e., total
displacement of 0.01~ CaC1Z in the soil column by the same solution
containing tritiated water, and subsequent displacement of tracer
solution with CaC1Z solution. These two frontal displacements are
referred to as Tracer-In and Tracer-Out, respectively (see Chapter 1).
Effluent solution was collected in 15 ml aliquots with an automatic
fraction collector and analyzed on a liquid scintillation counter for
3HZO.
Pore-Size and Pore-Velocity Distributions
Following solute displacement measurements, volumetric water
content of the soil column was determined in the tension range of 5
to 30 cm water with the soil intact. The soil column was subsequently
segmented, placed in retainer rings on porous ceramic plates, and
water content measured at tensions of 100, 300, 600, and 900 cm water
in a pressure plate apparatus. The soil moisture characteristic
curve thus obtained was then used to calculate pore-size distribution.
This technique is referred to as the method of immiscible fluids
(see Chapter 4). The pore-size distribution of the Mololmi soil
column was also determined by the method of miscible fluids (see
3Chapter 4) from a HZO Tracer-Out breakthrough curve.
The values of mean pore-radius (r j ) of the j th size-fraction and
the associated weighing coefficient (A j ) computed from the two
techniques mentioned above can be used to calculate the pore-velocity
distribution for the soil column during a given solute displacement.
Given the mean pore-radius (rj) of a pore-size increment, the average
pore-velocity (voj) is calculated from equation (5-3); the hydraulic

lt~4
gradient d~/dx can be determined from Darcy's law as Q/KsAc from
known values of flux (Q) for the displacement, the cross-sectional area
(Ac) and saturated hydraulic conductivity (Ks ) of the soil column.
The Poseui11e equation (see equation 5 ..3) can be then reduced to,
= S r. 2J
(5-8)
where, S = (Q/KsAc)/(~)' and r j and voj are as defined previously.
Since the value of S is directly proportional to Q imposed on a
displacement, its value is not a constant. For the miscible displace-
ment of tritiated water through Mololmi soil column, the value of S
-4 -2. -1was 3.9053 x 10 cm ~m m~n
A weighted mean pore-velocity for the whole soil was also computed
from each pore-velocity distribution as,rJ N
v* = ~(A.V.) / ~ A.o j:..1 J OJ J::.1 J
(5-9)
and c~pared with the measured average pore-velocity (;0 = Q/Ac s)
from the soil column.
Prediction of Breakthrough Curves
A solution of equation (5-1) subject to the boundary condition of
uniform rectangular solute pulse in the soil column at time t=O, i.e.,
C = Co' 0 < x < L, t = 0
C = 0, x > L, t = 0
is given by equation (5-5). It was assumed that the 45 m1 solute
(5-10)
pulse introduced into the soil column was piston-displaced and was
unifonnly distributed over a column length of L (=45/A 8). Thec s

145
magnitude of L was then adjusted to correspond to 110% recovery of
tritiated water from Mololmi soil column (i.e., including about 10%
error in measured BTC) , since our interest here is to be able to
predict the measured BTC. With the pore-size distributions obtained
from the methods of miscible and immiscible fluids, and an average
pore-velocity as input, the L-B capillary bundle model was evaluated
for its ability to predict the measured zonal BTC. Equation (5-5)
was solved for constant x (the length of column used in experiments
was 20 cm) for several values of t for each pore-size increment and
an average relative solute concentration obtained from equation (5-7)
for given t. The frontal BTCs were also predicted with the same input
data, but by equations (5-6) and (5-7).
The conservation-of-mass condition requires that the area under
the predicted BTC and that under the rectangular solute zone be equal.
No problems were encountered in making such a check on predicted
solute dispersion profiles within the soil column (i.e., for a given
t, varied x). However, when a check of conservation-of-mass condition
was made on the effluent concentration profiles predicted by the L-B
model (for constant x, varied t), problems were encountered concerning
what reference time would represent the solute zone length on the time
axis (BTCs were plotted as CICo on y-axis versus the independent
variable t on x-axis). A representation of such time was found to be
equal to,
N
t s = L. ;?: (Aj/voj)J=-1
(5-11)
where, t s represents the average time required to piston displace
the solute zone through all capillaries, and Aj and Voj in equation

146
(5-11) are as defined previously. Detailed development of equation
(5-11) is given in Appendix 3.
To facilitate comparison of measured BTCs with those predicted
by the L-B model, we needed to define an average time required to
displace one pore volume of solution through all of the capillaries
that were assumed to describe the soil. This time was used to normalize
the time axis of the predicted BTCs such that it is equivalent to
number of pore volumes (i.e., VIVo) displaced through the column. An
average time, to' is equal to,
(5-12)
where, X is the length of the soil column, and Aj and Voj are defined
as previously. This relationship is fully developed in Appendix 3.
Measured effluent volumes i.n the miscible displacement studies were
expressed as pore volumes (VIVo' where Vo = XAc8s ) in plotting the
measured BTCs.
The measured frontal BTC for tritiated water was analyzed by the
log-normal transformation technique proposed by Rose and Passioura
(1971) to calculate an average dispersion coefficient (Do) of 0.2828
cm2/min. The value of the empirical constant A2 could be then
computed as,
A2
= {(j) IT 2) - D } / v000
(5-13)
where, Do is the self-diffusion coefficient of water (since we are
attempting to predict the dispersion of tritiated water, Do was
taken to be 1.404 x 10⁻³ cm2/min), the tortuosity factor (T2) was

147
assumed to be 0.6, and the average pore-velocity (vo) imposed during
the miscible displacement was 0.153 cm/min. The value of AZ
thus
computed was 3.0 cm, which was then substituted into equation (5-4)
to compute the Doj for a given pore-velocity (voj) in the pore
velocity distribution computed by the method of immiscible fluids
(MIF). Preliminary computations, however, indicated that same value
for the constant AZ could not be employed for the pore-velocity
distribution from the method of miscible fluids (MMF); a value of
AZ
= 0.3 was found to be satisfactory. Justification for such a
choice is presented elsewhere in this chapter.
All parameters used in the prediction of the zonal and frontal
BTCs obtained from a Molokai subsoil column by the L-B capillary bundle
model are summarized in Table 5-1 for the convenience of the reader.

Table 5-1. Sun~ary of parameters used in the predictionof solute dispersion in a Mo101mi subsoil column
by the L-B capillary bundle model
A = 38.5 2emc
Do-3 2/.= 1.404 x 10 cm m1n
Doj = from equation (5-4)
D = 0.2828 cm2/min0
Ks = 2.22 cm/min
L = 2 cm
N = 41 for MIF
N = 18 for MMF
t = from equation (5-11)s
to = from equation (5-12)
v = from equation (5-8)oj
Vo = 0.153 cm/min_-kVo = from equation (5-9)
X = 20 cm
(3 -4 cm min-1 -2= 3.9053 x 10 lJm
1.2 = 3.0 cm for MIF
1.2 = 0.3 cm for MMF
2 = 0.6T
3 3e = 0.626 cm /cms
= 1.06 g/cm3p
148

RESULTS AND DISCUSSION
Pore-Velocity Distributions
The pore-size distributions measured by the method of miscible
fluids (MMF) and the method of immiscible fluids (MIF) were utilized
in the computation of pore-velocity distributions. In accordance with
the requirements of the L-B model, it was asstmed that the pore-size
distribution measured represented the size distribution of bundles of
capillaries that make up the voids of the soil column. The mean pore
radius (rj) of the j th fraction was substituted in equation (5-8)
to yield the value of the pore-velocity (voj) of that size fraction.
The weighing coefficient (A j ) associated with the j th fraction was
then assigned to the computed pore-velocity. Pore-velocity distributions
thus computed by the two techniques are given in Tables 5-2 and 5-3.
Dispersion coefficients (Doj ) for each size fraction, calculated from
equation (5-4) are also shown. These values served as input data for
the L-B model for prediction of both zonal and frontal BTCs.
It is seen from comparison of Tables 5-2 and 5-3 that the MMF
yielded a very narrow and nearly symmetrical distribution (range
0.039 - 0.756 cm/min, mean = 0.162 cm/min), while a very broad and
asymmetrical distribution resulted from the MIF (range 0.156 - 262.6
em/min, mean 16.38 cm/min).
Measured and Predicted BTCs
An experimentally measured zonal BTC from miscible displacement
of a tritiated water pulse through a satucaced column of Mololmi
subsoil at an average pore-velocity of 0.153 cm/min is compared with
those predicted by the L-B model (equations 5-5 and 5-7) in Figure 5-1.

Table 5-2. Pore-velocity distribution in a Molokai columncalculated from a pore-size distribution measured
by the method of miscible fluids
150
j
12345618q
1011121314151611i8
v :koJ
(cm/min)
7.561E-016.889E-Ol6.24fJE-015.b39E-Ol5.061E-Ol4.5H·E-Ol3.999E-Ol3 .. 515E-013.062E-Ol2 .. 640E-Ol2 .. 249E-Oll.t390E-Ol1.562£.-011.2651:-019.998E-027.654£=-025.624E-023.Q05E-02
i.300E-033.200E-034.4GOE-036.4COE-C39 .. 500E-031.270E-021.780E-022.230E-022 .. '540E-023 .. 8LUE-Ul5 .. 410E-028.270E-021 ... 527E-Ol2.162E-011.S08E-Cll.209E-O!3.820E-023.200E-C3
(cm2/min)
1.369E-Ol1 .. 248E-Ol1.133E-OlleOl3E-Ol9 .. 194E-1l28.210E-027.282E-026 .. 411E-025 .. 595E-024.B36E-024.133E-023 .. 486E-022. SC;6E-022.362E-021.884E-021.462E-021.0~6E-02
7.869E-03
..."voj calculated by equation (5-8)
*o/(D 0 ( )calculated by equation 5-4 withoJ
= 0.3

Table 5-3. Pore-velocity distribution in a Mololmi columncalculated from a pore-size distribution measured
by the method of immiscible fluids
jok Aj **Voj Doj
em/min cm2/min
1 2.62bE 02 1.000E-04 4.127E 02
2 2.499E 02 2.000E-04 4 .. 499E 02
3 2 .. :3 7bE 02 3.000E'-04 4.277E 02
4 2.256E 02 ~. 00OE-C4 4 .. G60E 02
5 2 .. 139E 02 5.000E-O/~ 3.849E 02
6 2.024E: 02 6.000E-04 3 .. 644E 02
1 1.. 914E 02 1.000E-04 3.444E 02
8 I..BObE 02 8.000e-04 3.250E OZ
9 1.70lE 02 I.200E-03 3.06lE 02
10 1.600E 02 1 .. 500E-03 2.879E OZ
11 l .. 50lE 02 1.700E-03 2.70ZE 02
12 1 .. 406E 02 1. eOCE-03 2.53lE OZ
13 1.314E 02 ·2 .. UOOE-03 2 ... 365E 02
14 1.225E OZ 2 .. 500E-03 2.204E 02
15 1.139E 02 2.9COE-03 2 .. 050E 02
16 1 .. 056E 02 3 .. 400F-03 1.901E 02
17 9 .. 763E 01 4.400E-03 1 .. 757E 02
18 8.9178E 01 5.100E-03 1.620f 02
-19 ti.2b4E 01 6.800E-03 1. '.a7E 02
20 7.561( 01 1. BOGE-GJ 1 .. 361E 02
21 6 .. 889E 01 9.500E-03 1" ZI.OE 02
22 6.2481:: 01 1.,260E-02 1.125E 02
23 5 .. 639E 01 1.360E-02 lo0l5E 02
24 5.061E 01 1.'DOS-fJ2 9.110E 01
25 4.514E 01 1.100E-02 8.,!26E 01
26 3 .. '999E 01 1.87CE-02 1 .. 198E 01
27 .3.515E 01 2 .. 040E-02 6.321E 01
28 3.062E 01 2.380E-02 !i.511E 01
29 2.640E 01 2.5501:-02 4.152E 01jO .l .. 249E 01 2.890E-02 4 .. 049E 01
31 1.890E 01 3.230E-02 3.402E 01
32 I.So2E 01 3.740E-02 2.812E 01
33 1.2b5E 01 4 .. 420E-02 2.278E 01
34 9 .. 976E 00 5.210E-C2 1.1~6E 01
35 7.654E 00 6 .. 460E-C2 1 .. 378E 01
36 5.624E 00 7.fJ2CJE-02 , 1.012E 01
37 J .. 905E 00 ').520E-02 7.030E 00
.:Hi 2 .. 499E 00 J..190E-Ol 4 .. 4<;9E 00:;9 1.460E 00 1.224E-C1 2 .. 629E 00
40 6.250E-Ol 1.173E-Ol 1.126E 00
41 1.560E-01 6.800E-03 2.816E-O!
~'\
'voj calculated by equation (5-8) -
*'i'Doj calculated by equation (5-4) vlith = 3.0
151
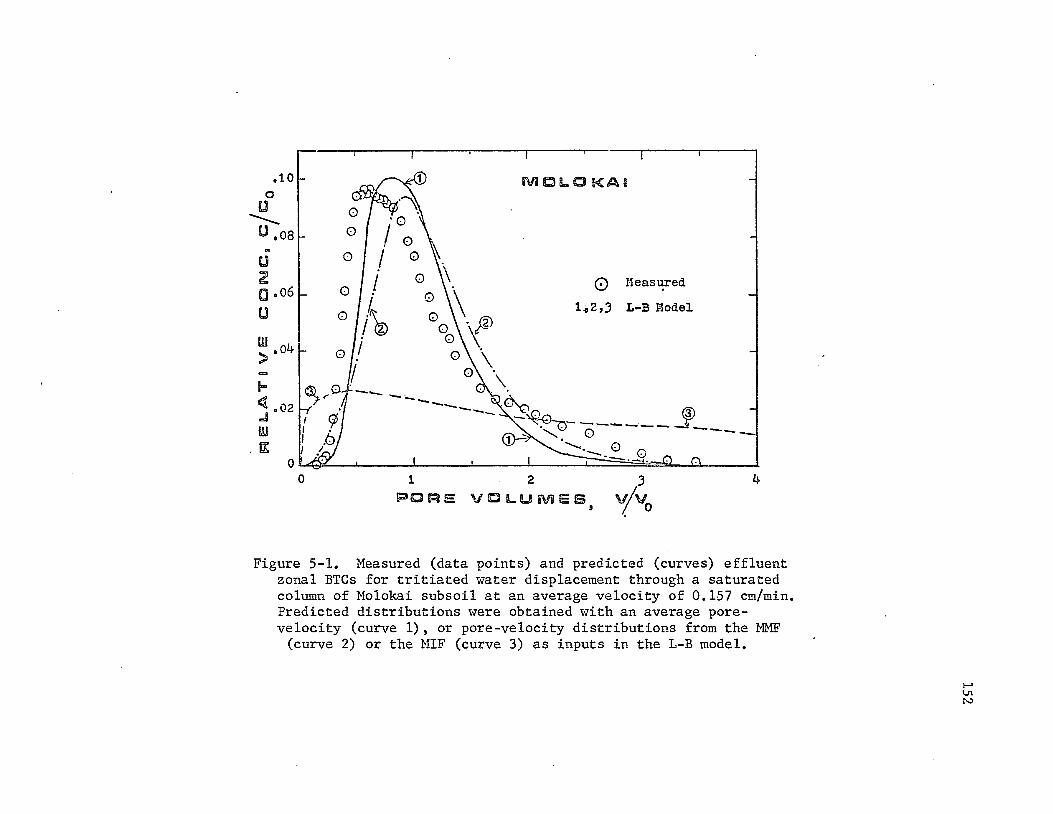
r-- I I
MOLO KAI
o r'leasured
1.,2,3 L-B fIodel
·100
u
-----U .08..IU 0
2(] .06 L 0
u I 0
w" .04."....
""~ .02 I
W I
.ttI,
00
-..... -..... _----.,-
1 2PORE VOLUMES •
"_ 0
3
ViVo4
Figure 5-1. Measured (data points) and predicted (curves) effluentzonal BTCs for tritiated water displacement through a saturatedcolumn of Molokai subsoil at an average velocity of 0.157 cm/min.Predicted distributions were obtained with an average porevelocity (curve 1), or pore-velocity distributions from the MMF
(curve 2) or the MIF (curve 3) as inputs in the L-B model.
......\.J1N

153
The measured BTC is shown as data points, while that predicted by
using an average velocity (curve 1), and with pore-velocity distribu
tions from method of miscible fluids (MMF, curve 2) and method of
immiscible fluids (MIF, curve 3) are presented as solid curves in
Figure 5-1.
The shift of the measured BTC peak to the left of one pore volume
and tailing in the right half of the curve are indications of rapid
flow through macropore sequences and diffusion-controlled movement of
the solute out of the micropore sequences (Green et a1., 1972). The
Mo1okai subsoil packed into the column contained about 23% (by weight)
aggregates with diameter greater than 2 mm. It was shown in Appendix 5
that intra-aggregate diffusion plays a significant role in solute
dispersion in aggregated soils with aggregates greater than 2 rom in
diameter.
It is apparent that the predicted dispersion profiles are dependent
on the pore-velocity distribution used. With the pore-velocity
distribution computed from the MIF as the input, the L-B model pre
dicted a BTC (curve 3) which was extremely dispersed without a well
defined peak. However, the BTCs predicted by either an average pore
velocity to represent the soil (curve 1) or a pore-velocity distribution
obtained from the MMF (curve 2) are nearly identical and better
approximate the measured BTC (Figure 5-1).
The shift of all predicted BTCs to the left of one pore volume
is due to the form of solution given in equation (5-5) and the choice
of how Vo was defined in this study. Although the solute zone was
assumed to have been initially distributed over a 2 em length of the
soil column, we chose to define pore volume on the basis of the total
154
length of the column. This would result in the peak of the predicted
BTC being shifted to the left of ViVo = 1. It must also be recognized
that the location of the BTC peak is dependent on the predominant
pore-velocity in the distribution of velocities used as input in the
L-B model.
Frontal BTCs obtained by miscible displacement of tritiated
water, both in the roles of displacing (Tracer-In) and displaced
(Tracer-Out) solute, are shown as data points in Figure 5-2. The
frontal BTCs predicted from the L-B model (equations 5-6 and 5-7)
are also presented in Figure 5-2 as solid curves. The predicted BTCs
with either an average pore-velocity (curve 1) or wi~h pore-velocity
distribution from the MMF (curve 2) are nearly identical and are in
good agreement with the measured BTCs. However, when the pore-velocity
distribution computed from the MIF was used as the input, the predicted
BTC (curve 3, Figure 5-2) was similar in nature to that of Model
IIB (see Chapter 1, Figure 1-4B); the predicted dispersion of solute
was much greater than that experimentally measured.
A slight shift of the predicted frontal BTCs to the left of one
pore volume (VIVo = 1) at C/Co = 0.5 obtained from au average pore
velocity (curve 1) or a pore-velocity distribution from the MMF
(curve 2) in Figure 5-2 is the result of the second term in the
solution presented in equation (5-6); this term contributes significantly
to the sum of the two complementary error functions. When the velocity
is large, the contribution of the exponential term exv/D is very large.
It was demonstrated in Chapter 4 of this dissertation that the
concept of pore is not unequivocally defined, and that drastically

43
vivo
-- ------------
QMeasured Tracer-In
A Measured Tracer-Out
1,2,3 Predicted L-B Model
1 2
PORE VOLUMES lJ
/'/'
,//'
®-,.//
/I
//
/I
IIII
OIl
oo
w" 94....1=({oJ 02Wtt
Figure 5-2. Measured (data points) and predicted (curves) effluent frontalBTCs for tritiated water displacement through a saturated column ofMo1okai subsoil at an average velocity of 0.153 cm/min. Predicteddistributions were obtained with an average pore-velocity (curve 1)or pore-velocity distributions from the MMF (curve 2) or the MIF
(curve 3) as inputs in the L-B model.
I-'\J1\J1

156
different pore-size distributions could be obtained for the same soil
sample depending on the specific technique employed. This is so
because the definition of a pore was different in each of these
techniques (see Chapter 4). Since the solute dispersion profiles are
directly dependent on the pore-velocity distribution used as input,
care must be exercised in which technique is employed in characterizing
the pore geometry of the soil.
It should be recalled at this point that the L-B model assumes
that the pore geometry of the soil can be described by parallel bundles
of straight, cylindrical, and unconnected capillaries of equal length
but varying radii. It is therefore implied in the L-B model that no
mixing occurs between adjacent capillaries. These are exactly the same
asstmptions tl~t form the basis in the development of the MMF for obtain
ing the size-distribution of such capillary bundles to represent the
pore geonletry of the soil (Chapter 4). In fact, the effective capillary
size distribution was ascertained from the same e2cperimentally measured
frontal BTC that we are now attempting to p~edict by the L-B model.
Hence, vnlen a pore-velocity distribution computed from the MMF is used
as the input in the L-B model, the predicted BTC is nearly identical
to that measured experimentally; the slight difference between the
two BTCs is probably due to the added effects of the dispersion term
in the L-B model. Recall that the pore-size distribution computed by
the MMF already includes the effects of the dispersion coefficient,
since D effects the shape of the BTC. This was the reason for choosing
the value of the empirical constant AZ
to be 0.3 rather than 3.0 as
in the other two cases (average velocity and MIF). Choice of a still

157
smaller value for A2
resulted in greater deviation of the pr.edicted
BTC from that measured experimentally.
The pore-size distribution measured by the MIF represents the
actual void-size distribution. The dimensions of these voids are
apparently much larger than effective capillaries (see Clmpter 4).
A ten-fold difference in the mean radius calculated from the MMF and
the MIF (Table 4-2, Chapter 4) resulted in a lOO-fold difference in
mean velocity from these two techniques (Tables 5-2 and 5-3). A much
greater range in pore-velocities, in addition to the larger magnitude
of the velocities, resulted in the predicted BTC from the MIF being
more dispersed than that measured.
In computation of theoretical solute dispersion profiles within
a glass bead column, Lindstrom and Boersma (1971) have assumed that the
pore-size distribution determined by the mercury intrusion technique
(Method Ib, Chapter 4) represented the size-distribution of capillary
bundles. However, the mercury intrusion method measures the size
distribution of constricting pore-necks that control the access into
voids. Moreover, the distribution of these pore-necks is generally
much narrower than that of the voids (Dullien, 1972). When a very narrow
velocity distribution is used as the input in the L-B model the result
ing dispersion profiles are nearly gaussian in shape, and the peak
position is determined 'by the predominant velocity in the distribution.
This IT~y explain why Lindstrom and Boersma (1971) did not encounter
any problems in their computations. From the above discussion it would
appear that if we had used a pore-size distribution measured by mercury

158
intrusion porosimetry instead of that from a water desorption curve,
the resulting computed BTCs may have predicted the measured curve with
a greater accuracy.
It would then appear that the success of the L-B capillary bundle
model to predict the solute dispersion depended mainly on our ability
to describe the size-distribution of effective capillary bundles
that make up the pore geometry of the soil. The assumption of indepen
dent flow in all capillaries is obviously not met in the experiments,
and mixing of solute between adjacent flow paths resulted in much less
dispersion of the solute than anticipated from the L-B model.
In conclusion) it is suggested that unless some quanti.tative
measures of the mixing of the solute between adjacent flow paths
(i.e., an index of the inter-connectedness of the pore sequences) and
acces~irLlity of the pores are available, it would be very difficult
to model the geometry of the porous media. Lack of an understanding
of the true geometry of the media will result in our inability to
predict the flow processes in soils. A brief discussion of other
geometric as well as certain macroscopic approaches of predicting solute
transport are presented in the next section of this chapter.
When complications of kinetics of adsorption and desorption of
reactive solutes in a transient system coupled with the hysteresis in
adsorption are superimposed on the complex geometry of the porous
media (which in itself is physically intractible), the task of
prediction of solute transport appears to become overwhelming.
However, success of an average velocity and an average dispersion
coefficient in predicting tritiated water dispersion in highly
aggregated Molokai soil is encouraging.

159
Other Predictive Models
Lindstrom and Boersma's (1971) capillary bundles model, evaluated
in this Chapter, is one of the most basic and Simplest of the geometric
models available in the literature. However, their simplistic represen
tation of the pore geometry of the soil fails to predict the miscible
displacement of solutes. MarIe and Defrenne (1960) studied the flow
in two parallel capillaries with different cross sections and regularly
spaced interconnections. This approach may overcome the restricting
assumption of independent flow in all capillaries. However, any fixed
capillary model of the soil would be inadequate to describe the complex
medium. De Josselin de Jong (1958) and Saffman (1960) have proposed
that the porous medium may be considered to consist of a random network
of interconnected capillaries of different radii and lengths. ~ne
path of the fluid is considered to be of random walk in nature, in which
the length, duration and direction of each step are random va~iables.
Dullien (1972) and Payatakes (1973) have proposed a principal ltructure
for the porous media, in which all of the flow paths consist of very
short tube segments in series connections with wider segments alternating
with narrower ones. The fundamental limitation of all geometric models
is that they are either too simple to be accurate or too academic to be
of practical use.
Modelling of solute transport processes in aggregated soils
presents some unique problems due to the wide range in pore-sizes in
these soils. Generally, the total porosity of the soil can be considered
to consist of macroporosity, characterized by pore spaces of large
dimensions, and microporosity, which consists of intra-aggregate pores

160
with small radii. During solute transport through aggregated soils, a
significant fraction of the flow occurs in the macropore sequences,
while the intra-aggregate microporosity behaves like a distributed
sink/source for the solute. The effects of retention of the solute in
the micropores is further enhanced by adsorption on the walls in the
interior of the aggregates. Passioura (1971) incorporated the effects
of such a distributed sink/source in the longitudinal dispersion
coefficient for aggregated soil. Passioura and Rose (1971) presented
experimental verification of this theoretical model. Raats (1973)
considered the intra-aggregate pore water to be immobile, and presented
a theoretical model for convective transport in the inter-aggregate
macroporosity; the exchange of solute between macropores and micropores
was considered to be controlled by a first-order process.
Gottschlich (1963) presented a film model, which treats the
stagnant pore water as occurring in thin films surrounding the soil
particles. Mass transfer into this film is governed by diffusion.
Skopp and Warrick (1974) proposed a similar film model, which also
accounted for adsorption of the solutes on the soil surfaces within
this immobile film. They found that the thickness of the film varied
with the velocity with which the solute was being displaced. Such
representation of the nonconducting fraction of the porosity is only
empirical at best and are impractical, since the necessary parameters
need to be obtained by curve-fitting techniques and not by independent
measurements.
In another line of modelling efforts, the nonconducting porosity
was represented as dead-end porosity. Goodknight, Klikoff, and Fatt
(1960) suggested a bottle-neck representation of such dead-end porosity,

161
where a spherical volume is joined to the conducting channel by a
small capillary neck. Exchange of solutes between the conducting
channels and the dead-end porosity is a diffusion-controlled process.
However, Goodknight et al. (1960) neglected convective transport
in their analysis. Coats and Smith (1964) suggested a similar geometry
of the dead-end pore volume, but incorporated both diffusive and
convective solute transport in their nlodel. Turner (1957) visualized
the dead-end porosity to occur as rectangular pockets along the main
conducting flow channel. Gill and Ananthakrishnan (1966) employed a
continuous stagnant pocket or Turner structure to model the stagnant
pore volume.
It is apparent that among the multitude of predictive models
available in the literature, most were designed to meet the requirements
of a specific system and are not very general in their approach to
predicting solute transport.

CHAPTER 6
GENERAL CONCLUSIONS

163
1. A study of six principal characteristics of the breakthrough
curves obtained from miscible displacement of reactive and
nonreactive solutes through saturated columns of soils was found
useful in gaining an insight into the behavior of the solute
within the soil column during displacement.
2. Quantitative and qualitative techniques proposed for the analysis
of the BTCs were found useful in analysis of the experimental
BTC data from miscible displacement of several adsorbed solutes
through several soils.
3. It was possible to quantify the fraction of soil mass in equilibrium
with the solute and the fraction of solute desorbed from the
soil column during displacement.
4. Data from equilibrium and miscible displacement studies revealed
that while all of the soil water in Wahiawa (Tropeptic Eutrustox)
subsoil participated in the solute transport process, about 10%
of the soil water in Hilo subsoil (Typic Hydrandept) was excluded
from all solutes other than tritiated water. These results are
not in agreement with the frequently mentioned concept that the
intra-aggregate micropore water in aggregated soils is excluded
from flow. It is suggested that micropores act as a temporary
sink/source of solute for the conducting macropores.
5. Results reported here also suggested that it may be more
appropriate to use l4C-methanol as a reference solute rather
than tritiated water in miscible displacement studies with
Hydrandepts and Oxisols of Hawaii.

164
6. ~~o different techniques of measuring pore-size distribution gave
strikingly different distributions for the same Molokai (Typic
Torrox) subsoil column, pointing out that the concept of pore is
not unequivocally defined in the literature. The method chosen,
therefore, will depend upon (a) intended use of the pore-size
distribution data and (b) ease of the measurement technique.
7. The success of predicting BTCs with the Lindstrom-Boersma solute
transport model (in which a distribution of pore flow velocities
is estimated from a "measured" pore-size distribution) depended
strongly on the pore-size input data; the pore-size distribution
derived from a desorption water characteristic curve gave poor
results, while the distribution obtained from miscible displace
ment technique gave reasonably good results.
8. The measurement and mathematical description of accessibility
and interconnectedness of pores appear to be essential for
quantitative prediction of the effects of pore geometry on
solute dispersion in aggregated soils.

APPENDICES

APPENDIX 1
A Guide to Classification of BTCs
A brief summary of the concepts presented in Chapter 1 is given
below to serve as a guide i.n identifying and classifying breakthrough
curves (BTCs) obtained from miscible displacement of both nonreactive
and reactive solutes through soils.
In an evaluation of the BTCs, consider the following six
characteristics:
(a) Shape -- existence or lack of symmetry with respect to
piston flow model (Model I)
(b) Location passes through or shifted either to the left or
to the right of the reference intersection of
cleo = 0.5 and V = Vo
(c) Area above the BTC with respect to piston flow model
(d) Area under the BTC from V = 0 to V = Vo
(e) Relative locations of the Tracer-In and the Tracer-Out BTCs-
with respect to piston flow model and also to each
other
(f) Slope of the BTC -- with respect to each other and also that
of the piston flow model
(a) Shape: For miscible displacement of a nonreactive solute,
sjlmnetrical and sigmoidal BTC implies a normal pore-size distribution
(Model lIA), and an asymmetrical, skewed BTC indicates a wide range in
the pore-size distribution (Model lIB).
(b) Location: For a nonreactive solute,
BTC passes through 1 pore-volume -- no exclusion (Model lIA)

167
BTC passes to the left -- temporary or permanent exclusion (Model lIB)
as determined by property (c).
For a reactive solute,
BTC passes to the right for an adsorbed solute (Model IV) and the
degree of shift to the right is an indication of the extent of adsorption
by soil; a shift to the left of 1 PV implies negative adsorption
(Model III).
(c) Area Above the BTC: Let the area above the piston flow model BTC
equal to Vo and that above the BTC for the solute under examination to
be Ve , and define the retardation factor as the ratio Ve/Vo • For a
nonreactive solute,
=VelVo 1.00 expected case (all soil water mobile)
if BTC shifted to left wide range in pore-
size distribution, but all soil water mobile.
1.00 -- some fraction of soil water completely excluded
from the flow process.
For a reactive solute,
VelV0 > 1. 00 adsorption
VelVo < 1.00 negative adsorption
(d) Area Under BTC: The area under the BTC from V = 0 to V = Vo
is defined as holdback (H), and is useful as an index of the temporary
exclusion of a fraction of soil water from nonreactive solute
displacement. It should be recognized that the concept of holdback
does not apply to the displacement of reactive solutes in soils.
H equal to 1.00 implies all soil water is immobile and
H equal to 0.00 implies no deadwater and is an example of perfect
piston f10't'1.

168
(e) Relative Locations of Tracer-In and Tracer-Out BTCs: For
nonreactive solute displacement both Tracer-In and Tracer-Out BTCs
are expected to exhibit identical properties that are being considered
in this evaluation. However, for reactive solute displacement this
is not the case.
Tracer-In BTC displaced to the right of Tracer-Out BTC implies
adsorption is not reversible, and the degree of irreversibility can
be quantified by a comparison of the areas above these two BTCs.
However, if the areas above these BTCs are identical, it must be
concluded that the desorption kinetics are slower than that of
adsorption (Model IVA).
Identical Tracer-In and Tracer-Out BTCs indicate reversibility of
the adsorption process and also similar kinetics of adsorption and
desorption (Model IVB).
Tracer-In BTC displaced to the left of Tracer-Out BTC implies
that the desorption kinetics are more rapid than that of adsorption.
The degree of reversibility of adsorption can be quantified by
comparison of the areas above the BTCs (Model IVC).
(f) Slope of the BTC: The normalized rate of saturation (kr )
detel~ines the slope of the BTC. The greater the slope the larger is
the k , and lower k values result in lower BTC slopes. It has alsor r
implications in the absolute rate of mass transfer.

APPENDIX 2
Listing of Computer Program PORADIUS
cC p~~GRA~ PORADIUSCC pqC~PA~ DEst~~~D TO C3~PUTE THE ~EAN AND VA~IANCE OF ThEC PC~E-SllF CISTQIBUTIO~ OF A SOIL GIVEN THE TABULATED VALUES OFC CU~ULATIVE EfFECTIVE SATU~ATIO~ AS A FUNCTICN UF RAUJUS Of POKE.C
DlvE~SI~N ~C50I,S(50),CSC50),ZlC5D),LZC50),lC5~),OZlC5UJ,DI2C~O.0
·C(")/lEr.jTCZO)C10JOO ~~~CC5,11,ENOD~99. COMENT
11 r"C"AT C2064.WQIT~16,2Z)CQ~E~T
2Z Fn~~ATCIHl,lOX,20A41111.
REt.CC5,LJN1 FO;;"'"TCl2'
cC RE~D INPUT CATA FOR nAND SC
REIlCCS,Z) CIlCI),SCI ItIal,NJ2 FJ~~ATITll,FlO.5,T31,FlO.5J
cC COMPUTE 'rE EFFECTIVE PORE-SIZE DENSITY FUNCTlOr..l OSIRJC G~VcN P. AND scq).C
~ALL OGT3 CR,S,CS,N,IERJWP JTEC6,66) IER
66 Fa~MATIIIIOX,lPEIO.311)
CC C~":>LJ'= THE FU':cTlcrIS ell I.~) AND OZZ CRt AS ne TI<ANSFORI4EDC FU~CTIO~S AS DEFINED BElOh.C
CIJ 3 lal,NDZl(1J • R(l)IllCS(J)Dl2111 • PCIt0DZUU
3 ((1"" TINUEC NlI.\!!'~ICAL INHG'lATICN OF THE FUNCTlr.~s DSCQ),OZllR),OZZCRJ I'UThC THr. SUBROUTINE QTFG USING THE TRAPEZOIDAL R~LE.
CC~ll CTFGCR,DS,Z,N)
CALL a!F~ (Q,Dll,ll,N&CALL QTFG (C,CZZ,ZZ,~I
C PRINTING OF OUTPUTC
DO 4 1"'1, NWrJT",C6,5) f/CI),SCI),DS(I),OZlCIJ,OZZCl),ZCIJ,ZlU),ZZCU
!) FI1PIAT UOX,OIlP::IO.'3,310t4 CCNTINUE
Cf. COMPUTt.TICN OF MEA~,VARIANCE, AND STD. OEVQ
PHAQaZ! CtlllLOO'(VAl): CZZ (PIli ZI "l))- CRBAROitBARIJfl~VAr .IT. 0.01 RveRaO.OrST~~V .. SQqTCQVARI~~ITE(b,b)~BAP,~VAR,RSrDEV
b frr~ATCIIIOX,'~EANa ',lFEIO.3,2X,'VARIANCEu ',lPEIO.3,ZX,'STOEVm 0
C
'" ,I PHD.)G') T" 10000
q'Jq cr''''TlNlJESTC,PE"lO

APPENDIX 3
Derivation of Appropriate Expressions
- -for Terms t s and to for a Soil Column
Assume that the soil column is made up of bundles of straight,
cylindrical, unconnected capillaries of varying radii but of equal
length. Assume also that the solute pulse, L cm long, is initially
uniformly distributed within the soil column between distances of x = 0
to x = L. As this solute pulse is piston-displaced (special case of
no mixing) through the soil column, the time taken for the head of the
solute pulse to reach the end of the column in any given capillary will
depend on its radius (or velocity). Similarly, the time taken by the
solute pulse to empty out of a given capillary once it reaches the end
of the column is also proportional to the pore-velocity of that
capillary.
Let us denote the time required to empty the solute pulse of
length L out of capillaries once it reaches the end of the soil column
in the j th size-fraction, with a velocity cf Voj' as t Sj • It can be
shown that,
t. = L/v.sJ OJ (A3-l)
Since Aj represents the fraction of solute pulse emptying out of the j
th size, a weighted-mean time can be represented as,
(A3-2)
Therefore,
N N
t s = 2 (IAj/voj ) /2:, Ajj=.1 j:: I
is equal to LOO, and L is a constant.N
~A.J-....' J
(A3-2) reduces to,
However,
equation

t = Ls
171
(A3-3)
Now, for the special case of an average velocity (va) representing
the whole soil (i.e., Aj = 1.0), equation (A3-2) can be further
simplified to,
= (A3-4)
In the course of this study it was determined that replacing Vo
by a weighted-mean pore-velocity (vo) for the case of pore-velocity
-distribution does not yield the same expressions for t s as shovm
below. We know that,
Substitution of equation (A3-S) in equation (A3-4) yields,
N '"t s = ~L Aj / J~Aj Voj
(A3-S)
(A3-6)
or,
= L
N
(1 / ~Aj Voj) (A3-7)
It is immediately apparent that equation (A3-7) is not the same as the
correct expression of t s given in equation (A3-3).
Proceeding along these same lines of argument, we will develop
an expression for the weighted-mean time required to displace one pore
volume through the Boil column. In other words, we want to calculate
the time required to travel the column length X, in any given capillary.
Denoting such time as t oj ' and the pore-velocity of the j th fracticn
as Voj' it can be shown that,
t .oJ = X / v .
OJ (A3-8)

172
and
= (A3-9)
where, to represents the weighted-mean, and can be used to normalize
the time axis of the predicted breakthrough curves.
For the special case of a single average pore-velocity (vo)
representing the whole soil medium, equation (A3-9) reduces to the
well known expression,
== (A3-10)
The condition of conservation mass, which requires that all the
solute introduced into a soil system will remain in it at all times
and will not be lost to the outside, must be met by all solute transport
predictive models. In predicting the effluent BTCs by the L-B model
(see Chapter 5), we were interested in checking if the condition of
conservation of mass is indeed being satisifed. For such a check,
the areas under the predicted BTC must be compared with that equivalent
to the solute pulse introduced into the soil column. Evidence is
presented below to show that the area under the rectangle of dimensions
t s by [C/Co = 1.0J must be equal to the area represented by the solute
zone of L cm long.
If all of the solute pulse were displaced from the soil column,
the area under the zonal BTC, represented by the integral [ ~(C/C ) dtJ)0 I 0
must be approximately equal to the sum of all rectangles that are piston
displaced through each of the capillaries that makeup the soil column,
i. e. ,N
~ ~ Aj . (C/Co) j . tsjj::l
(A3-11)

173
in which tsj and Aj are as defined previously. However, since CICo
on the right side of equation (A3-ll) corresponds to the input
rectangular solute pulse and is equal to 1.00 for all j, equation
(A3-l1) reduces to,
= (A3-l2)
The areas under the predicted BTCs were numerically integrated by
the subroutine DQSF available in the IBM system/360 Scientific Sub-
routine Package, which performs the integration of an equidistantly
tabulated function by a combination of Simpson's and Newton's 3/8
rules. These areas were subsequently compared with t s (see equation
A3-l2) to calculate the percent recovery (RECOV) of the solute from
the soil column as
% RECOV = (Area under BTC / t s) "/: 100 (A3-l3)
Note that RECOV is equal to 100% if the condition of conservation
of mass is Batisfied, as it should be for the predictive model to
be valid.

APPENDIX 4
Listing of Computer Program TRANSPORT
PROGRAM TRANSPORT
COMPUTER PROGRAM CESIGN~IED TO EVALUATE TI1~ L-B HCDEL SCLUTIONFOR ZONAL OISPlACE~ENT GF A ~ONRE~crIVE SOLUTE THROUGH SOiLS.WRITTEN BY P. S. C. RAG AT THE UNIVERSITY OF ~AHAII.
REFERENCE TO THE L-B ~OGEL CAN BE FOU~D IN A P~PER illLINuSTROM AND BOERS~A I~ SOIL SCIENCE, VOL 111; 1911.
DEFINITION OF TERMS USEG IN THE PROGRA~
SATl'lATLAMDA =H =S1'l\P.TT
PORVELA =C "
COLLTI1TCRT ,.OlEP.O
L =t, ,.NOIM
TlERO =
VAl:lfl. '"RELCONAVRCONEHIME
PORVOLDELT =
RECOV =AREA '"
AVEkAHE FuRE-VELCCITY OF THE J T~ SIZE, eM/MINWEIGIiINl> COefFICIENT OF THE J TH SiZE, DIMENSIONLESSCISPERSlfN crEFFICIENT OF T~E J TH SIlE, CM.~2/HIN
CALCULATEO FReM PCRVEL.SATURATED WATEfl CC~TENT OF THE selL COLl~N
EMPIRICAL CC~STANT ~SED TO CALCULATE 0TIME INCREMEhT, ~I~, TO CALCULATE THE RELATIVE CCNC.STARTING TIME AT ~hICH THE RELATIVE SOLuTE CONCE~TRATIO~
IS TO BE CC~PUTED, ~It,
LENGTH OF THE SCll CCLUMN, CMTORTUOSITY FACTOR, C!MENSIONlESSAPPARENT MCLECULAR ~iffUSIC~ CO~FFICIENT OF THE SOLUTECMn2lHINLENGTH CF THE SOLUTE PULSE ASSUHEC TO OF INITIALLYDISTRIBUTED "ITHI~ THE SOIL COLU~N, CMNUMBEK OF PORE CLASSES~U~AER CF CIFFEREhT TIMES AT WHICH THE CICO VALUES AREOE~I~~O TO bE COMPLTEO. NCTE THAT NDIM$~ GIVES THE V~LUE OFICTAL TIME T~E DISPLACEMENT WAS RUN.
hEIGHTED ~EA~ TIME RE~UIRED TO TR~VEL THE LENGTH OF THESOIL COLU~N IN ALL CAPILLARIES, ~IN
RFPRESE~TS 'UANTITV EQUIVALENT TC ONE PCRf VOLUME ON THETrHr: AX! S.
wEIGHTED MEAN PORE VELUCITV FOR THE COLUM~, C~/Mlh
RELATl VE SOLUTE CCl'CEt\TR~TlON IN TIiE J lei SIZE= wEIGHTED MEA~ RELAIIVE SGLUTE CO~CENTRATIGN IN T~E CClUVN
ACCUMULATED TIME AT WHICH THE EFFLUENT peRE VOLU~ES
APE COf.4PUTED.F.~UtVALENT t,UMRER CF PORE VCLUHES DISPLACEDWEIGHTED HEAh TIH~ kE~UlkEU TO UISPLAGE THE SOLUTE LONEOF LENGTH l C~CE IT ARRIVES AT T~E END CF THE sellCOLUMN, MEAN OF ALL CAPILL~RIES.
PERCENT REC~VERY OF SGLUTE ZCNEAREA UNutR TME lO~AL BTC, CCMPUfED I:lV sueRoUTINE CQSF
IT HLST BE RECOGt,IlED THAT IN THIS PROGRA~ THE RELATIVE SOLUTECONCENTRATION IS COMPUTEU FCR A FIXED DEPTH IAT THE END CF THEsell COlUMNI FOR VAPI[US TII'FS. T~IS IS ESSFNTlhLLY S4ME ASPkEDICT WG TIl::: ErfLUEt,i UKC~I\TIHHJUGli CURVES. THE Al.iSCI5SA ISTII'E, ANC CAN BE NORMALllEC BY TlERO TO BE EQUIVALENT TC PORE VCLUMES.
DOUBLE PRECISION X,U,V,RELCCN,AVRCON,SUMl,ASUH,DEPTH,AREA,HREAL l,LAMDA

cDIMENSION COMENTIZOI,PORVEL(ZOO),AlZOOI,OIZOOI,RELCONIZOOI,
.~lJMTl2110I,EFTlMEIZuO I,AVRCONIZOOI ,DEPTH( ZOOI,PORVOU ZOO) ,AREAfZCC.CC READ INPUT DATAC~999 REAOIS,lC,END=lOOO) C(~ENT
10 FURMAl( ZOA4)READ(S,211 SATWAT,LAMCA,H,STARTT,COLlTH,TORT,DZERO,l
21 FORMATI8FI0.S)READIS,ZCI N
20 FGJ;HATlI31READlS,301 lPORVELll),Afll,l a l,N)
30 FORMAT(Tll,F10.S,T21,FlO.SJCCC COMPUTE VBAR AND TZEROC
SUMA :: O.SLII,PCP=O.FGI'T 1"=0.
DO 900 lol,NSIJMA=SUMA+AIIJSU~POR=SU~POR+A(II*PCPVELfl)
POkTIM :: PORTIM+ lCOLLTH/PORVEL(()I*A(()900 CO~TI NUE
TlFRO=PORTIM/SUMAVBAR::SUMPCR/SUMA
CC COMPUTATION OF THE DISPERSION COEFFICIENT FOR THE J TH SIZEC
DC 4536 1=1,,.,0111 = TORT=IOlERO+(PGRVELllloLAMOAJ)
4536 cer.n f\UECC PR l~lT INPUT DATAC
nOIT~16,401 COMEN1~o FJPHATllHl,2QA4///)
hR ITt" 16,33:;,333 FOPMATIIII0X,'***.INPUT OATA $.*.'//1
WPITEI6,lOllN,SAThAT,LAMDA,r,STRATT,TlERO,VBAQ101 FOPMATI/5X,'N::',I3,10X.'SAThAT=',F6.3,IOX,'LAMDA-',F4. 1/
*SX,'H=',Fb.3,lOX,'STAATT=',F6.3,lOX,'TlERCc·,f10.5,'VdARa',Fl0.S/)l1f<lTElt.,1021
10Z ~OR~4TITI5,'N',TZ1,'PGRVEL',T45,'~',T61,'CISPCOEFF"t/J;lTEI6,103'
103 fOPMATI/TZ2,'IC~/~I~)',T61,'(CMO~2/HINI'I/)
DO 222 !::l,N111< iT [' I b , 1114 ) I ,POR VEL ( II , AI I J, 0 ( 1 )
104 FOR~ATIT14,I3,T21,lPEIO.3,T41,lPEIO.3,T61,lPEIO.3)
ZZ2 CONTINUE
175
CCCC
COMPUTATION OF REl~TIVE SCLUTE CO~CENTOATION

176
1\0114=100TIfJE=STARTTX=COLLTH
00 300 J-l,NOlflSUMI .. O.ASU'~=O,
00 200 I c l,N01 PORV[Llll~TIME
82 '" X-L-tH83 .. 2.*ISQRTCO;IloTIHEI)84 X-Bl65 = lX*PCHVELIIIJ/OlIJ8b X+Bl67 '" 8b+L~8 PORVElCII*CSQRTlTIME/lOIIJ*3.1415927J')6~ PORVELCI'/IZ.*OIIJ'
CUl eZlB3U2 = B4/8'3U3 Ob/B3U4 = 81103U5 187.B71/~B3.B3'Ub 18b~~bI/I03.B3)
IflD5 .GE. 170.' 85=170.IFIUS .GE. 170.1 U5=170.IFIU6 .GE. 170.1 U6=!70.
CCl = ERFCIUll - ERFCIUZI
C2 EXPIB5J*lERFCIU3J-ERFCIU4JIC3 0.5*CCl+C21C4 EXPI05J*lll./EXPCU511-11./EXPIU6'.JC5 e8"'C4C6 18b~tl9''''IEXPIS5'*ERFCIU3')C1 IB1*R91"'IEXPCB51*ERFC(U4))
C3 • C5 • C6 - C1~ELCONC I'
CALL DQSF IH,AVRCON,AREA,I\OIMJOH T :: O.
C
CSUMI '" SUMI • RELCONlII*AIIJASuM .. ASU~ + AilJ
ZOO CONTINUEAVRCONIJI=SUMI/ASUMEFTIMEIJJ = TI~E
Pu~VOL(JI .. EFTIMEIJJ/TZEROTlME=TI ME.H
300 CONTINUE88 WRITEI6,444J
444 FURMATIIH1.10X.' •••• CUTPUT FOR THE ABOVE INPUT••• ·IIIIW~ITElb,98021
9802 FORMATIIITll,·TI~E"T21"PCRVCl·,T31"AVRCON·I'nKITElb,98031IEFTIMEIJI,PORVClIJI,AVRCONIJI.J=I,I\CIH,2J
9803 FURMATITl1.F6.1,T2I,F6.4,T31,Fb.4'CC CUMPUTE THE AREA UNDER CLRVE AND RECOVEPYC
SUI~A '" o.00 5649 lel,N
Del T " OELT+IAtJI/PORVELIIJJSLihA c SUr'lA+A I I I
5049 COM !I\UfDLL r = UE:L T*lRfCnV = IARF.AINOIM'/OELTIOIOO.hnlT[lh,198IA~EA(~DIMI.nECCV
I~U fUhHATIIII0X.·AREA=·.lPEI0.3,5X,·RECCVERYa·,F10.3,IX,·~'J
9'J GO TO 9999lOCO CCNTlNUE
5TCPeND

APPENDIX 5
Analysis of Diffusion in Aggregates
In our attempts to describe solute diffusion in aggregates, we will
define the pore space of the medium to consist of macroporosity,
characterized by multiply connected, continuous pore spaces of large
dimensions, and of microporosi~, which consists of p0re spaces of
small dimensions. The inter-aggregate porosity is then considered to
be the macroporosity, and the intra-aggregate porosity is the
representation of the microporosity. During solute transport in an
aggregated medium, the macropores serve as the major conducting
channels, while the microporosity behaves more like a distributed sink/
source for the solute. In the analysis that follows, additional
assumptions listed below are operative.
(a) The idealized exterior geometry of an aggregate can be
described by a sphere of radius R, and the effects of
internal geometry can be described by inclusion of a tortuosity
term (T2 ) in the diffusion coefficient (DA = Do T2 , where
DA is the diffusion coefficient of the solute within the
aggregate, Do is the molecular diffusion coefficient in
bulk water).
(b) At time t = 0, the internal solute concentration distribution
is known, and can be described by a function f(r); for
simplicity let f(r) = Co' some constant uniform solute
concentration within the aggregate.
(c) On the exterior of the aggregate surface, say in the
inter-aggregate macropores, the solute concentration is

178
maintained constant at C ; consider a special case ofm
C = ° due to continuous removal of the solute by rapidm
flux in the macropore sequences.
(d) The differential equation governing solute transfer between
micropore and macropore sequences is assumed to be Fick's
second lml7 \l7ritten in radial coordinates,
aC a2c 2 1f},= D
A{- + t > 0, 0 < r < R
at ar2r ar
't'lith the boundary and initial conditions,
C(r,O) f(r) = C0
C(R, t) = C = ° or some other constantm
C(O,t) -J. coT
solution to which \vas presented by Luikov (1968) for
the case of C = ° as,m
(AS-I)
(AS-2)
C(r,t)
Co
00e:--'-'..... RA',> n .
=~ r lln. Sl.n
Y\ ::. I
II r 2(~ )·exp (-ll F )
R n 0(AS-3)
where,
A = (2). (_l)n+ln
lln = n7T
Fo = DAt / R2
If the solute concentration on the exterior of the aggregate
is not equal to zero (Le. , C j 0), we can definem
e = C(r,t) - C / (C - C ) to replace C(r,t)/C on them o m 0
left side. of equation (AS-3).

179
(e) The average relative solute concentration in the aggregate,
(r,t), can be approximated by the following series
(Luikov, 1968),
6(r,t) - 6- 7f2
2(-ll F )
n 0(AS-4)
(f) From the numerical tables for the approximate solution
of equation (AS-4), as prese~ted by Luikov (1968), the
characteristic time (to) for 99% mass transfer to be
completed can be computed as follows: For e (r,t) = 0.99
the value of dimensionless time 7f2 Fo is equal to 4.00, hence
(AS-5)
or, on rearrangement (with d = 2R),
(AS-6)
Equation (AS-6) closely resembles a relationship between
sorptivity and to developed by Philip (1968).
The relationship between aggregate radius (R) and the characteristic
time (to) developed in equation (AS-6) is graphically illustrated in
Figure AS-I. It was assumed that the molecular diffusion coefficient
(Do) is equal to 0.001404 cm2;min (chosen to represent diffusion of
water), anu curves for two different tortuosity terms are shown in
Figure AS-I. It is apparent that the characteristic time for mass
transfer is very small for aggregates with radius less than 0.1 cm. A
direct consequence of such behavior is that the influence of intra-
aggregate diffusion is minimal in retarding solute 1eachtng in soils

0.60.50.40.30.20.1
0' ~ , , r , I
o
200 , • i , a;, J •
160
""' I D a 0,001404 cm2/mint::....~
0
0 120...
!@I-lE-<
UI-l 80E-<t/)I-lp::WE-<U
~Q 40
AGGREGATE RADIUS, R (cml
Figure AS-I. A relationship between aggregate radius (R) and thecharacteristic time for absorption (t). See equation AS-6.o
l-'coo

181
with aggregates less than 2 rom in diameter. The influence of intra
aggregate tortuosity ( T2 ) does not appear to have a significant effect
on the value of to for aggregate radii less than 0.1 em, but such
effects rapidly become very important for larger aggr.egates.
A more detailed examination of the intra-aggregate tortuosity
influence on to can be made as follows. By substitution of (Do T2 )
for DA in equation (AS-6), and assuming Do = 0.001404 cm2fmin as
before, we obtain,
(A5-7)
A graphical representation of the relationship given above is
shown in Figure AS-2 for two different aggregate sizes. It is
apparent that for aggregates less than 0.1 em in radius, the effect
of intra-aggregate tortuosity is minimal, while it becomes significant
with increasing radius of the aggregates.
In a majority of solute transport studies, the columns are packed
with sieved soil with aggregates less than 0.1 em radius. Thus, it
can be proposed, on the basis of foregoing discussion, that in such
studies the process of intra-aggregate ~iffusion will have minimal
effects on solute transfer betweeLl intra- and inter-aggregate porf:
sequences. However, in field soils, which are highly aggregated with
significant natural channeling (resulting in near bimodal pore-size
distributions), the intra-ped diffusion may significantly retard
solute leaching with irrigation. Examples of such a case are presented
in the field studies of nitrate and pic10ram herbicide movement in
highly aggregated Molokai soil (Balasubram~nian et al., 1973; Rao et a1.,
1974).

100, . i
....... 80,1 \ 2l:D = 0.001404 em /min"r'l
08.......-
0-l.J
.. 60E:l'"HEo<
UHEo<t/)Hp::;
40wEo<U
~(3
20
1,00.80.60.40.2
o i I I , ! I
o
TORTUOSITY TERM, T"2
Figure AS-2. A relationship between intra-aggregate tortuosity factor (T2)
and the characteristic absorption time (to)' See equation AS-7. ......co!'oJ

183
The pl~~ceding analysis holds for diffusion of solute out of an
aggregate into macropores. Philip (1968) presented a theory of
absorption into aggregated soils, and concluded that the magnitude
of to for absorption may be less than 28 sec in most cases of common
interest. He suggested that the effects of soil aggregation are
important only for aggregates of unusually large size (> 0.2 cm
diameter), and low sorptivity. Farrel and Larson (1973) developed
theory for the effects of intra-aggregate diffusion on oscillato1~
flow dispersion in aggregated luedia, and concluded that such effects
are not important for media with less than 0.2 cm diameter aggregates.
Finally, it must be recognized that the theory presented in
this appendix is only valid for the diffusion of nonreactive solutes
out of aggregates. If one is considering displacement of reactive
solutes, say adsorbed on the soil surfaces, the effects of kinetics
of adsorption/desorption in addition to diffusion into and out of soil
aggregates must also be considered. Such a detailed analysis is not
attempted here.

APPENDIX 6
Development of Expressions for CoIQ~n Retardation
Factors for Adsorbed Solutes
The differential equation governing the solute dispersion in soil
is,
2 2 PdC/dt = D (d C/dx ) - v (dC/dx) - El (dS/dt) (A6-1)
where, C and S are the solution and adsorbed phase solute concentrations
as a function of space (x) and time (t); D is the dispersion coefficient;
V is the average pore-velocity; p is the bulk density; and e is the
volumetric water content.
Assume that adsorption of the solute by soil can be described by
the Freundlich relationship,
(A6-2)
where, Kf and N are constants which define the adsorption isotherm,
and C and S are as defined previously. Upon differentiation of
equation (A6-2) with respect to time, we obtain
dS/dtN-l
= I<f N C dC/dt (A6-3)
which when substituted into equation (A6-l) yields,
N-l 2 2[l + t KfN C ] (dC/dt) = D (d C/dx ) - v (dC/dx) (A6-4)
The quantity in brackets on the left hand side of the equation (A6-4)
is defined to be the retardation factor. For a general case, we note

185
that the retardation factor is a function of the free phase solute
concentration (C). The nonlinear differential equation describing
solute dispersion has to be solved by numerical techniques.
If the adsorption isotherm were linear (i.e., the constant N in
equation A6-2 is equal to 1.0), equation (A6-4) reduces to
[ 1+ t KfJ .(dC/dt) = D(iC/dl) - v (dC/dx) (A6-S)
In this case, the Freundlich constant Kf is equal to the
equilibrium distribution coefficient Kd • Thus, for a linear adsorp-
tion isotherm, the retardation factor is a constant, hence the
differential equation can be solved analytically.
For the purpose of obtaining a single best estimate of the
retardation factor, which for the case of a nonlinear adsorption
isotherm was shown to be a function of the solution concentration,
we will compute a weighted mean value of the retardation factor within
the range of solution concentrations of our interest.
-The weighted mean, denoted as K, is given as,
_ jc.:c" N-lK = KfN C
Co=O
c = Co
dC / f dCCocO
(A6-6)
which upon integration between C = 0 and C = Co can be shown to be
K= K CN
/ Cof 0
or
K= KfN-l
Co
(A6·.. 7a)
(A6-7b)
Proof is presented in the following derivation that the quantity
K is equivalent to the equilibrium distribution coefficient computed

186
at an equilibrium solution concentration of Co and equilibrium adsorbed
concentration of So. Using these two quantities, we will define the
equilibrium distributio~ coefficient, Kdo to be
(A6-8)
The quantity Kdo can be then substituted into equation (A6-4)
for KfNCN- l to yield,
[1 + ~ KdoJ (dC/dt) = D (d2C/dx2) - v (dC/dt) (A6-9)e
Therefore, the best estimate of the column retardation factor for
an adsorbed solute displacement through soil (for the nonlinear
adsorption isotherm condition) is,
(A6-lO)
and will be used in place of equation (1-5) in Chapter 1 to compute
the column retardation factors for chloride and picloram BTCs in
Chapter 2.
LITERATURE CITED
Aris, R. 1956. On the dispersion of a solute in a fluid flowingthrough a tube. Proc. Roy. Soc. (London). A235:67-77.
Balasubramanian, V. 1974. Adsorption, denitrification, andmovement of applied ammonium and nitrate in Hawaiian soils.Ph.D. Dissertation, University of Hawaii.
Balasubramanian, V., Y. Kanehiro, P. S. C. Rao, and R. E. Green.1973. Field study of solute transport in a highly aggregatedOxisol with intermittent flooding: 1. Nitrate. J. Environ.Qual. 2:359-362.
Barrett, E. P., L. G. Joyner, and P. P. Halena. 1951. The determination of pore volume and area distributions in porous substances.I. Computations from nitrogen isotherms. J. Amer. Chern. Soc.73:373-380.
Bear, J., D. Zas1avsky, and S. Irmay. 1968. Hydrodynamic dispersion.p. 311-332. In J. Bear, D. Zaslavsky, and S. Irmay (ed.)Physical Principles of Water Percolation and Seepage. AridZone Research Series XXIX, UNESCO, Paris, France.
Biggar, J. W. and D. R. Nielsen. 1963. Miscible displacement:V. Exchange processes. Soil Sci. Soc. Ame~" Proc. 27:623-627.
Biggar, J. W. and D. R. Nielsen. 1967. Miscible displacement andleaching phenomenon. p. 254-274. In R. M. Hagan, H. R. Haise,and T. W. Edminster (ed.) Irrigatio~ofAgricultural Lands.Amer. Soc. Agron., Madison, Wisconsin.
Boast, C. W. 1973. Mod~lling the movement of chemicals in soilsby water. Soil Sci. 115:224-230.
Bower, C. A. and J. O. Goertzen. 1955. Negative adsorption ofsalts by soils. Soil Sci. Soc. Amer. Proc. 19:147-151.
Brutsaert, W. 1966. Probability laws for pore-size distributions.Soil Sci. 101:85-92.
Cagauan, B. G. Jr. 1969. Solute dispersion in tropical soils.Ph.D. Dissertation, University of Hawaii. Disser. Abstr. Internl.30:5235B, Microfilm No. 70-9971, 159 p.
Chandrasekhar, S. 1943. Stochastic problems in Physics andAstronomy. Rev. Mod. Phys. 15:1-87.
Chapman, H. D. and P. F. Pratt. 1961. Methods of Analysis for Soils,Plants, and Waters. Division of Agricultural Sciences, Universityof California, California. p. 100.

188
Cheng, H. H. 1969. Extraction and colorimetric det~rmination
of pic10ram in soil. Agr. Food Chem. 17:l174~1177.
Childs, E. C. and N. Collis-George. 1950. The permeability ofporous media. Proc. Roy. Soc. A20l:392-405.
Coats, K. H. and B. D. Smith. 1964. Dead-end pore volume anddispersion in porous media. AIME Trans. 231:73-84.
coreY2 J. C. and J. H. Horton. 1968. Movement of water tagged withH, 3H, and 180 through acid kaolinitic soil. Soil Sci. Soc.
Amer. Proc. 32:471-475.
Danckwerts, P. V. 1953. Continuous flow systems: Distribution ofresidence times. Chem. Eng. Sci. 2:1-13.
Davidson, J. M. and R. K. Chang. 1972. Transport of pic10ramin relation to soil-physical conditions and pore-velocity.Soil Sci. Soc. Amer. Proc. 36:257-261.
Davidson, J. M. and J. R. McDougal. 1973. Experimental and predictedmovement of three herbicides in a water-saturated soil. J.Environ. Qual. 2:428-433.
Davidson, J. M., R. S. Mansell, and D. R. Baker. 1972. HerbIcidedistributions within a soil profile and their dependence uponadsorption-desorption. Soil and Crop Sci. Soc. Florida Proe.32 :36-41.
De Josselin de Jong, G. 1958. Longitudinal and transverse diffusionin granular deposits. Trans. Amer. Geophys. Union. 39:67-74.
Dullien, F. A. L. 1970. Study of accessibility of pores in porousmedia. Proc. 1st Symp., Fundamentals of Transport Phenomenonin Porous Media, Intern. Assoc. of Hydraulic Res., Haifa, Israel.p. 67-72.
Dulll.en, F. A. L. 1972. Pore structure and flow properties ofporo~s media. Proc. 2nd. Symp., Fundam~ntals of TransportPhenomenon in Porous Media, Intel'n. Assoc. of Hydraulic Res.and Intern. Soc. of Soil Sci., Guelph, Canada. 1:58-73.
Dullien, F. A. L. and P. N. Mehta. 1971. Particle size and pore(void) size distribution by photomicrographic methods. PowderTechnol. 5:179-193.
Dullien, F. A. L. and G. K. Dhawan. 1973. Photomicrographic sizedistribution determination of non-spherical objects. PowderTechnol. 7:305-313.
Dutt, G. R. and P. F. Low. 1962. Diffusion of alkali chlorides inclay-water systems. Soil Sci. 93:233-240.

189
EI-Swaify, S. A., N. T. Coleman, G. Bredell, and M. Area. 1967.Negative adsorption by Velimiculite. salt exclusion from interlayer volumes. Soil Sci. Soc. Amer. Proc. 31:464-466.
Farrell, D. A. and W. E. Larson. 1973. Effect of intra-aggregatediffusion on oscillatory flow dispersion in aggregated media.Water Resour. Res. 9:185-193.
Foster, A. G. 1948. Pore size and pore distribution. DiscussionFaraday Soc. No.3.
Fried, J. J. and M. A. Combarnous. 1971. Dispersion in porous media.Advances in Hydroscience. 7:169-282.
Giddings, J. C. 1965. Dynamics of zone spreading. In Dynamics ofChromatography. Part I. P~incip1es and Theory. ~rce1 Dekker,Inc., New York. p. 13-94.
Gill, W. N. and V. Ananthakrishnan. 1966. Laminar dispersion incapillaries: II. Effect of inlet boundary condition and Turnertype system capacitance. A.I.Ch.E. J. 12:906-915.
Goodknight, R. C., W. A. Klikoff, and I. Fatt. 1960. Non steadystate fluid flow and diffusion in porous media containing deadend pore volume. J. Phys. Chern. 64:1162-1168.
Gottschlich, C. F. 1963. A.I.Ch.E. J. 9:88. As quoted in R. J.Nunge and W. N. Gill. 1969.
Green, R. E. and J. C. Corey. 1971. Calculation of hydraulicconductivity: A further evaluation of some predictive methods.Soil Sci. Soc. Amer. Proc. 35:3-8.
Green, R. E. and J. C. Corey. 1972. Pesticide adsorption measurementby flow equilibration and subsequent displacenlent. Soil Sci.Soc. Amer. Proc. 35:561-565.
Green, R. E., P. S. C. Rao, and J. C. Corey. 1972. Solute transportin aggregated soils: Tracer zone shape in relation to porevelocity distribution and adsorption. Proc. of Symp. on theFundamentals of Transport Phenomenon in Porous Media, 2nd.,Intern. Assoc. for Hydraulic Res. and Intern. Soc. of Soil Sci.Guelph, Canada. 2:732-752.
Greenkorn, R. A. 1972. Matrix properties of porous materials.Proc. of Symp. on the Fundamer.tals of Transport Phenomenonin Porou~ Media, 2nd., Intern. Assoc. for Hydraulics Res. andIntern. Soc. of Soil Sci. Guelph, Canada. 1:27-57.
Grim, R. E. 1968. Clay-water system. p. 251-252. !g Clay Mineralogy.McGraw-Hill Book Co., New York, Chapter 8.

190
Halevy, E. 1964. The exchangeability of hydroxyl groups in l~olinite.
Geochem. et Cosmochim. Acta. 28:1139-1145.
Hamaker, J. W. and J. M. Thompson. 1972. Adsorption. p. 51-143.C. A. I. Goring and J. W. Hamaker (ed.) Organic Chemicals inthe Environment. Volume 1. Marcel Dekker, Inc., New York.
Handy, L. L. 1959.displacement.
An evaluation of diffusion effects on miscibleAIME Trans. 216:382-384.
Harada, W. T.Oxisols.
1970. Digital simulation of water infiltration intoUnpublished M.S. Thesis. University of Hawaii.
Hashimoto, I., K. B. Deshpande, and H. C. Thomas. 1964. Pecletnumbers and retardation factors for ion exchange in columns.Ind. and Eng. Chern. Fund. 3:213-218.
Hornsby, A. G. and J. M. Davidson. 1973. Solution and adsorbedFlu(~eturon concentration distribution in a water-saturatedsoil: Experimental and predicted evaluation. Soil Sci. Soc.Amer. Proc. 37:823-828.
Ikawa, H., H. H. Sato, A. T. Chang, S. Nalmmura, and E. Robello Jr.1974. Soils of the Hawaii Agri~ultural Experiment Station,University of Hawaii: 1. Soil survey and chemical data. HawaiiAgr. Expt. Sta. Misc. Publ. (In Press)
Jones, R. C. and G. Uehara. 1973. Amorphous coatings on mineralsurfaces. Soil Soc. Amer. Proc. 37:792-798.
Kanehiro, Y. and A. T. Chang. 1956.the Hawaiian Great soil groups.Bull. No. 31. 27 p.
Cation exchange properties ofHawaii Agr. Exp. Sta. Tech.
Kay, B. D. and D. E. Elrick. 1967. Adsorption and movement oflindane in soils. Soil Sci. 104:314-322.
Kemper, W. D. 1960. Water and ion movement in thin films asinfluenced by electrostatic charge and diffuse double layer ofcations associated with clay mineral surfaces. Soil Sci. Soc.Amer. Proc. 24:10-16.
Kemper, W. D., D. Maas1and, and L. Porter. 1964. Mobility of wateradjacent to mineral surfaces. Soil Sci. Soc. Amer. Proc.28:164-167.
llinjo, T. and P. F. Pratt. 1971. Nitrate adsorption: I. In some acidsoils of Mexico and South America. Soil Sci. Soc. Amer. Proc.35:722-725.
Kipling, J. J. 1965. The adsorption of Polymers. In Adsorptionfrom Solutions of Nonelectro1ytes. Academic Press, Inc., NewYork. p. 152-157.

191
K1inkenberg, L. J. 1957. Pore-size distribution of porous mediaand displacement experiments with miscible fluids. AIME Trans.210:366-369.
Krupp, H. K. and D. E. Elrick. 1968. Miscible displacement in anunsaturated glass bead medium. Water Resour. Res. 4:809-815.
Krupp, H. K., J. W. Biggar, and D. R. Nielsen. 1972. Relativeflow rates of salt and water in soils. Soil Sci. Soc. Amer.Proc. 36:412-417.
Leamer, R. W. and J. F. Lutz. 1940. Determination of pore sizedistribution in soils. Soil Sci. 49:347-360.
Leenheer, J. A. and J. L. Ah1richs. 1971. A kinetic and equilib~ium
study of the adsorption of carbaryl and parathion upon soilorganic matter surfaces. Soil Sci. Soc. Amer. Proc. 35:700-704.
Lindstrom, F. T. and L. Boersma. 1971. A theory on the mass transportof previously distributed chemicals in a water saturated sorbingmedium. Soil Sci. 111:192-199.
Lindstrom, F. T., L. Boersma, and D. Stockard. 1971. A theory onthe mass transport of previously distributed chemicals in awater saturated sorbing porous medium: II. Isothermal cases.Soil Sci. 112:291-300.
Low, P. F. 1961. Physical chemistry of clay-water interactions.Adv. Agron. 13:269-327.
Luikov, A. V. 1968. Nonstationary temperature field without heatsources: Boundary condition of the first kind. ~Ana1ytica1
Heat Diffusion Theory. Academic Press, Inc. New York.p. 119-131. Translated from Russian. English edition editedby J. P. Hartnett.
Marks, D. E., R. J. Robinson, C. W. Arnold, and A. E. Hoffmann.1963. Dynamic behavior of fixed-bed adsorbers. AIME Trans.228(1):443-449.
MarIe, C. and P. Defrenne. 1960. La description mathamatique dudepa1cement de f1uides miscib1es dans un milieu pooreux.Rapp. Inst. Fr. Petro1e No. 5433. (As quoted in Fried andCombarnous, 1971)
Marshall, T. J. 1958. A relation between permeability and sizedistribution of the pores. J. Soil Sci. 9:1-8.
Melmru, T. and G. Uehara. 1972. Anion adsorption in ferruginoustropical soils. Soil Sci. Soc. Amer. Proc. 36:296-300.
Millington, R. J. and J. P. Quirk. 1960. Transport in porous media.Int. Congr. Soil Sci., Trans. 7th. (Madison, Wisconsin)1-3:97-106.

Nielsen, D. R. and J. W. Biggar. 1961.soils: I. Experimental information.25:1-5.
192
Miscible displacement inSoil Sci. Soc. Amer. Proc.
Nielsen, D. R. and J. W. Biggar. 1962. Miscible displacement insoils. III. Theoretical considerations. Soil Sci. Soc. Amer.Proc. 26:216-221.
Nunge, R. J. and W. N. Gill. 1969. Mechanisms affecting dispersionand miscible displacement. Ind. and Engg. Chern. 61:33-49.
Orlob, G. T. and G. N. Radhakrishna. 1958. The effects of entrappedgases on hydraulic properties of porous media. Tran. Amer.Geophys. Union. 30:648-659.
Passioura, J. B.1. Theory.
1971. Hydrodynamic dispersion in aggregated media:Soil Sci. 111:339-344.
Passioura, J. B. and D. A. Rose. 1971. Hydrodynamic dispersionin aggregated media. 2. Effects of velocity and aggregatesize. Soil Sci. 111:345-351.
Payatakes, A. C. 1973. A neH' model for granular porous media.Application to filtration through packed beds. Ph.D. Dissertation.Syracuse University. Disser. Abstr. Internl. 34:494l-4942B,Microfilm No. 74-8293, 367 p.
Perkins, T. K. and O. C. Johnston. 1963. A review of diffusion anddispersion in porous media. AlME Trans.
Philip, J. R. 1968. Theory of absorption in aggregated media.Aust. J. Soil Sci. 6:1-19.
Pickell, J. J., B. F. Swanson, and W. B. Hickman. 1966. Applicationof!iir-mercury and oil-air capillary pres sur,; data in the studyof pore structure and fluid distribution. AIME Trans. 237:55-61.
Raats, P. A. C. 1973. Propagation of sinusoidal solute densityoscillations in the mobile and stagnant phases of a soil.Soil Sci. Soc. Amer. Proc. 37:676-680.
Ralunan, A.soils.
1969. Some electrokinetic phenomenon in three HawaiianUnpublished M.S. thesis, University of Hawaii.
Rao, P. S. C. and R. E. Green. 1973. Nonsolvent fraction of soilwater in Hydrandepts in relation to solute and water transport.Agron. Abstr. p. 78.
Rao, P. S. C., R. E. Green, V. Balasubramanian, and Y. I<anehiro.1974. Field study of solute transport in a highly aggregatedOxisol with intermittent flooding: 2. Picloram. J. Environ.QuaL 3:197-202.

Ripple, C. D., R. V. James, and J. Rubin. 1914.radial particle-size segregation: Influencedispersion and water transfer measurements.Amer. Proc. 38:219-222.
Packing-inducedon hydrodynamicSoil Sci. Soc.
193
Rode, A. A. 1965. Bound water in the soil. Sorption of liquidwater. In Theory of Soil Moisture, Vol. I. Moisture p!~l)perties
of soils-and movement of soil moisture. U. S. Dept. of Agric.and Nat. Sci. Foundation, Washington, D.C. p. 92-158.Translated from Russian by J. Schmorak.
Rootare, H. M. and A. C. Nyce. 1971. The use of porosimetry in themeasurement of pore size distribution in porous materials.Intern. J. Mettulurgy. 7:3-11.
Rootare, H. M. and J. Spencer. 1972. A computer program for porevolume and pore area distribution calculations using mercuryporosimetry data on particulate or porous materials. PowderTechnol. 6:17-23.
Rose, D. A. 1973. Some aspects of the hydrodynamic dispersion ofsolutes in porous materials. J. Soil Sc. 24:284-295.
Rose, D. A. and J. B. Passioura.on hydrodynamic dispersion.
1970. The analysis of experimentsSoil Sci. 111:252-257.
Rose, D. A. and J. B. Passioura. 1971.miscible disp1a~ement experiments.
Gravity segregation duringSoil Sci. 111:258-265.
Saffrnan, P. G. 1960. Dispersion due to molecular diffusion andmacroscopic mixing in flow through a network of capillaries.J. Fluid Mech. 7:194-208.
Santo, L. 1974. Soil water hysteresis in the inter-aggregate voidsof two Hawaiian Oxiso1s. Unpublished M. S. Thesis. Universityof Hawaii.
Saxena, S. K., F. T. Lindstrom, and L. Boersma. 1974. Experimentalevaluation of chemical transport in water saturated porous media:1. Nonsorbing media. Sui1 Sci. 118:120-126.
Saxena, S. K., L. Boersma, F. T. Lindstrom, and J. L. Young. 1974.Effect of pore size on diffusion coefficients in porous media.Soil Sci. 117:80-86.
Scheidegger, A. E. 1957. The physics of flow through porous media.Univ. of Taranto Press, Taranto, Canada. 2nd ed., 236 p.
Sharma, M. L. 1966. Influence of soil structure on water retention,water movement and thennodynamic properties of adsorbed .vlater.Ph.D. Dissertation. University of lfuwaii.

194
Sharma, M. L. and G. Uehara. 1968. Influence of soil structure onwater relations in Low Humic Latasols: I. Water retention. SoilSci. Soc. Amer. Proc. 32:765-770.
Sills, I. D., L. A. G. Aylmore, and J. P. Quirk.of pore-size in Illite-Kaolinite mixtures.24,:480-490.
1973a. An analysisJ. Soil Sci.
Sills, I. D., L. A. G. Aylmore, and J. P. Quirk. 1973b. A comparisonbetween mercury injection and nitrogen sorption as methods fordetermining pors BZze distributions. Soil Sci. Soc. Amer. Proc.37:535-537.
Skopp, J. and A. W. Warrick. 1974. A two-phase model for themiscible displacement of reactive solutes in soils. SoilSci. Soc. Amer. Proc. 38:545--550.
Snelling, K. W. 1968. Miscible displacement of atrazine throughsoil columns. Ph.D. Dissertation, Kansas State University.Disser. Abstr. Internl., 29:l903B. Microfilm No. 68-17531.121 p.
Snelling, K. W., J. A. Hobbs, and W. L. Powers. 1969. Effects ofsurface area, exchange capacity, and organic matter contenton miscible displacement of atrazine in soils. Agron. J.61:875-878.
Stewart, G. L. and J. H. Baker. J.973. Factors influencing the useof tritium as a tracer of se:. 'i. water. Agron. Abstr. p. 79.
Svata, M. 1972. Determination of pore size and shape distributionfrom porosimetric hysteresis curves. Powder Technol. 5:345-349.
Swanson, R. A. and G. R. Dutt. 1973. Chemical and physical processesthat affect atrazine movem8nt and distribution in soil systems.Soil Sci. Soc. Amer. Proe. 37:872-876.
Taylor, G. Sir. 1953. Dispersion of soluble matter in solventflowing slowly through a tube. Proc. Roy. Soc. (London)A2l9:l86-203.
Tsuji, G. Y. 1967. Measurement and evaluation of soil water transmission coefficients in some lmwaiian soils. UnpublishedM. S. Thesis. University of Hawaii.
Tsuji, G. Y., R. T. Watanabe, and W. S. Salmi. 1974. Influence ofsoil micro-structure':>n water characteristics of selectedHawaiian soils. Submitted to Soil Sci. Soc. Amer. Proc.
Turner, G. A. 1957. The flow structure in packed beds. Chern. Engg.Sci. 7: 156,.

195
Uehara, G., H. lkawa, and H. H. Sato. 1971. Guide to Hawaiiansoils. Hawaii Agr. Exp. Sta. Misc. Bull. No. 83. 32 p.
van Genuchten, M. Th., J. M. Davidson, and P. J. Wierenga. 1974.An evaluation of kinetic and equilibrium equations for theprediction of pesticide movement through porous media. SoilSci. Soc. Amer. Proc. 38:29-35.
Van Rosenberg, D. U. 1956. Mechanics of steady state single-phasefluid displacement from porous media. A.l.Ch.E. J. 2:55-58.
Washburn, E. W. 1921. Note on a method of determining the distribution of pore sizes in porous media. Nat. Acad. Sci. Proc.(U.S.A.) 7:115.
Wells, N. and R. J. Furkert. 1972. Bonding of water to allophane.Soil Sci. l13~110-115.