─ xbma ─ cross-border m&a data points beijing, june 12-13, 2008
TRANSCRIPT
─xbma─
Cross-Border M&A Data Points
Beijing, June 12-13, 2008

2─xbma─
Global M&A Volume: 1995-2007
• Steady growth of global M&A volume from 2003 (under US$2 trillion) through mid-2007 (US$5.1 trillion), fueled by the availability of vast amounts of cheap debt, growing pools of investment capital across the globe, and confidence in the markets.
• US$5.1 trillion M&A volume in 2007 represented a new high water mark, beating prior high watermark of US$4.3 trillion in 1999.
• Generally three- to four-year cycles historically.
0
1
2
3
4
5
6
US
$tr
illio
ns
1995 1997 1999 2001 2003 2005 2007
Global M&A Dollar Volume
Source: Dealogic Thomson
$4.3T
$5.1T
$1.5T
3─xbma─
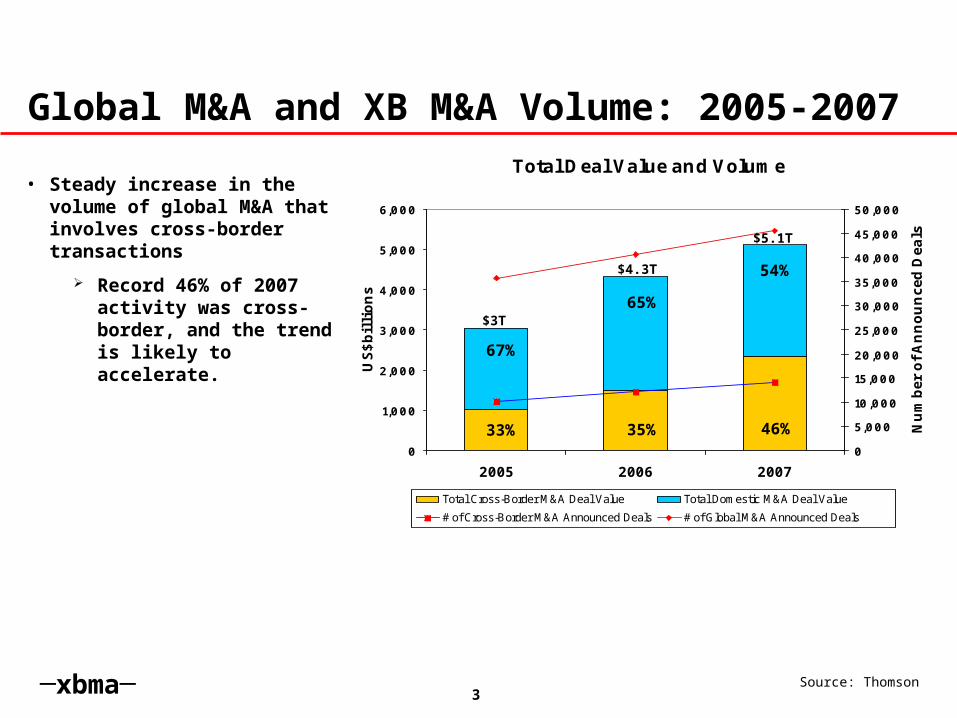
Global M&A and XB M&A Volume: 2005-2007
• Steady increase in the volume of global M&A that involves cross-border transactions
Record 46% of 2007 activity was cross-border, and the trend is likely to accelerate.
Total Deal Value and Volume
0
1,000
2,000
3,000
4,000
5,000
6,000
2005 2006 2007
US$bil
lions
0
5,000
10,000
15,000
20,000
25,000
30,000
35,000
40,000
45,000
50,000
Num
ber
of A
nnounce
d D
eals
Total Cross-Border M&A Deal Value Total Domestic M&A Deal Value
# of Cross-Border M&A Announced Deals # of Global M&A Announced Deals
46%
54%
65%
35%
67%
33%
$3T
$4.3T
$5.1T
Source: Thomson

4─xbma─
Total Deal Value and Volume
0
1,000
2,000
3,000
4,000
5,000
6,000
2005 2006 2007 2008
US$bil
lions
0
5,000
10,000
15,000
20,000
25,000
30,000
35,000
40,000
45,000
50,000
Num
ber
of A
nnounce
d D
eals
Total Cross-Border M&A Deal Value Total Domestic M&A Deal Value
# of Cross-Border M&A Announced Deals # of Global M&A Announced Deals
Global M&A: Current Conditions
46%
54%
65%
35%
67%
33%
$3T
$4.3T
$5.1T
*2008 figures projected based on 2008 Q1 and estimated Q2 data
Est. $3T?
Source: Thomson
• Sub-prime and credit crises of mid-2007 marked the beginning of a down-cycle – 2008 YTD volume down significantly
• Key determining factors for activity in the second half of 2008 are likely to be:
Restoration of liquidity; re-emergence of private equity deals
Restoration of confidence in the markets; acceleration of strategic deals
Acquisition activity from China, India and oil-rich countries (including the growing SWFs)
~47%
~53%

5─xbma─
M&A Volume by Target’s Region – 2007
South & Central America
2%
Western Europe
40%
Eastern Europe
4%
Asia-Pacific (Ex-Japan)
10%
Japan2%
Africa/Middle East2%
North America
40%
Breakdown of $5.1 Trillion of 2007
Transactions
• M&A markets in North America and Western Europe are significantly more developed and liquid than those of the rest of the world
80% of global M&A occurred in North America and Western Europe (which represent 60% of the world’s GDP)
12% of global M&A occurred in Asia (which represents 22% of the world’s GDP)
• But the M&A volume involving China, India and oil-rich countries (including SWFs) is growing fast
Source: Thomson
6─xbma─
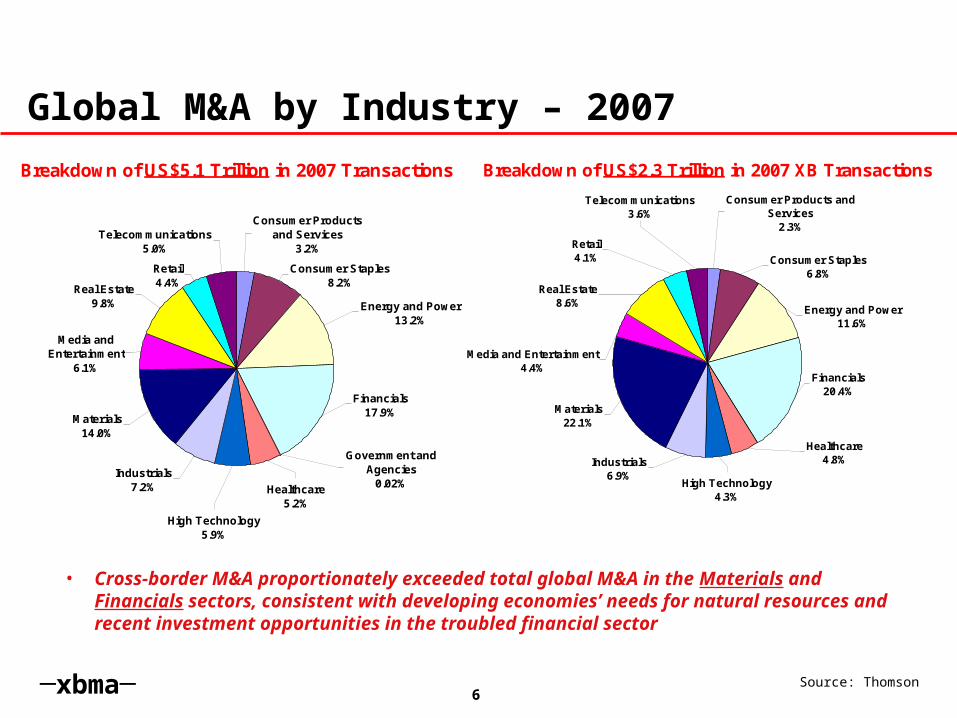
Global M&A by Industry – 2007
• Cross-border M&A proportionately exceeded total global M&A in the Materials and Financials sectors, consistent with developing economies’ needs for natural resources and recent investment opportunities in the troubled financial sector
Source: Thomson
Breakdown of US$5.1 Trillion in 2007 Transactions
Consumer Products and Services
3.2%
Consumer Staples8.2%
Retail4.4%
Telecommunications5.0%
Real Estate9.8%
Media and Entertainment
6.1%
Materials14.0%
Industrials7.2%
Government and Agencies
0.02%Healthcare5.2%
High Technology5.9%
Financials17.9%
Energy and Power13.2%
Breakdown of US$2.3 Trillion in 2007 XB Transactions
Retail4.1%
Telecommunications3.6%
Consumer Products and Services
2.3%
Consumer Staples6.8%
Energy and Power11.6%
Financials20.4%
High Technology4.3%
Healthcare4.8%Industrials
6.9%
Materials22.1%
Media and Entertainment4.4%
Real Estate8.6%

7─xbma─
Asia-Pacific (ex-Japan): M&A Volume – 2005-2007
Asia-Pacific (ex-Japan) M&A and Cross-Border M&A Total Deal Value
0
100
200
300
400
500
600
2005 2006 2007
US$bil
lions
Total Cross-Border M&A Deal Value Total Domestic M&A Deal Value
40% 41% 41%
60%
59%
59%
$267B
$427B
$533B
Source: Thomson
• Steady increase in volume throughout the region – US$533B of domestic and inbound M&A in 2007.
• China accounts for a growing component of the total, representing about US$20B of the 2006 total and about US$30B of the 2007 total.
† Asia-Pacific (ex-Japan) region includes India

8─xbma─
China Inbound and Outbound M&A and Investment, by Industry – 2007
• Chinese investors and acquirers have been most active in outbound investments/acquisitions in the financial, mining and oil sectors. The trend of buying natural resources offshore is continuing in 2008, with more than $21B worth of transactions in those sectors already announced in 2008 YTD
• Inbound investments highest in financial and real estate sectors
Source: Thomson
Inbound M&A/Investments by IndustryBreakdown of US$25 Billion in 2007 Inbound M&A
Retail1.3%
Consumer Products and Services
3.9%Consumer Staples
3.3%
Telecommunications0.8%
Energy and Power2.6%
Financials53.3%
High Technology7.7%
Healthcare2.0%
Industrials5.8%
Materials4.9%
Media and Entertainment
1.6%
Real Estate12.8%
Outbound M&A/Investments by IndustryBreakdown of US$37 Billion in 2007 Outbound M&A
Consumer Staples0.7%
Telecommunications1.0%
Energy and Power1.9%
Financials75.2%
High Technology2.1%
Industrials0.6%
Materials18.1%
Real Estate0.3%
9─xbma─
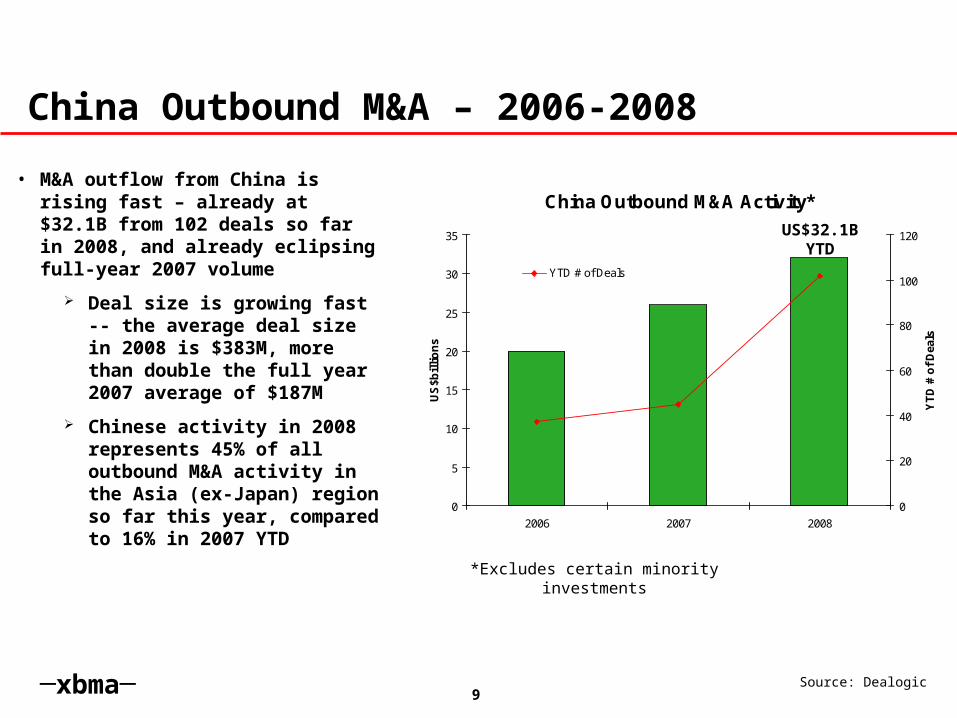
China Outbound M&A – 2006-2008
• M&A outflow from China is rising fast – already at $32.1B from 102 deals so far in 2008, and already eclipsing full-year 2007 volume
Deal size is growing fast -- the average deal size in 2008 is $383M, more than double the full year 2007 average of $187M
Chinese activity in 2008 represents 45% of all outbound M&A activity in the Asia (ex-Japan) region so far this year, compared to 16% in 2007 YTD
Source: Dealogic
China Outbound M&A Activity*
0
5
10
15
20
25
30
35
2006 2007 2008
US
$bil
lio
ns
0
20
40
60
80
100
120
YT
D #
of
Dea
ls
$ YTD # of Deals
US$32.1BYTD
*Excludes certain minority investments

10─xbma─
China Inbound M&A – 2006-2008
Source: Dealogic
China Inbound M&A Activity
0
5
10
15
20
25
30
2006 2007 2008
US
$bil
lio
ns
0
50
100
150
200
250
300
YT
D #
of
Dea
ls
$ YTD # of Deals
US$6.5BYTD
• China inbound activity rose through 2007, but would appear to be at a lower pace so far in 2008, perhaps reflecting the downturn in the West.
$18.3B
$25.1B
11─xbma─
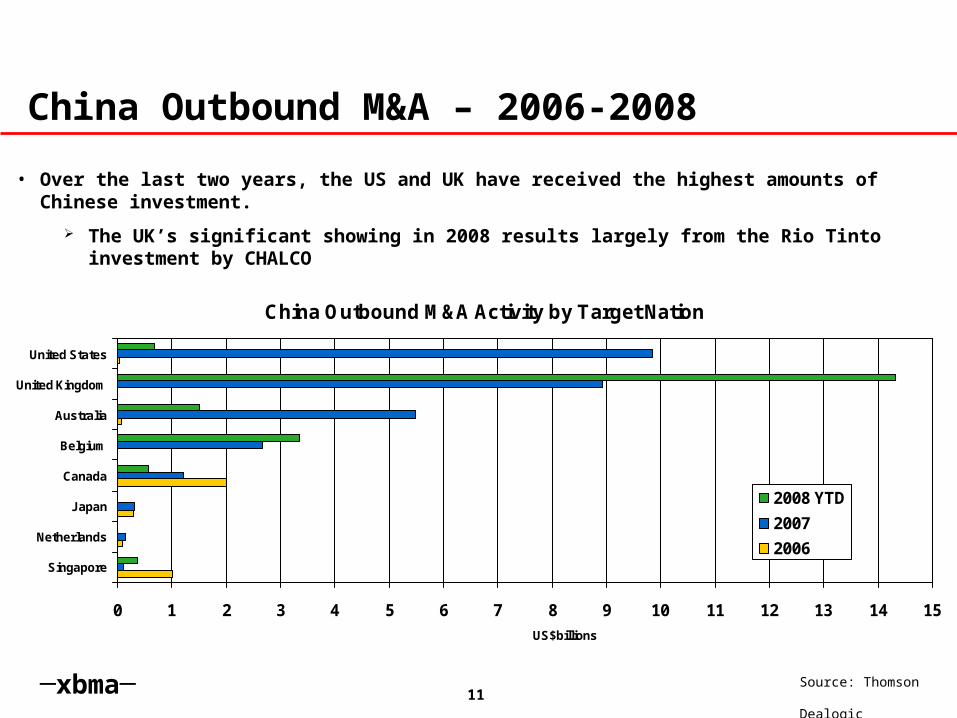
China Outbound M&A Activity by Target Nation
0 1 2 3 4 5 6 7 8 9 10 11 12 13 14 15
Singapore
Netherlands
Japan
Canada
Belgium
Australia
United Kingdom
United States
US$billions
2008 YTD
2007
2006
China Outbound M&A – 2006-2008
• Over the last two years, the US and UK have received the highest amounts of Chinese investment.
The UK’s significant showing in 2008 results largely from the Rio Tinto investment by CHALCO
Source: Thomson Dealogic
12─xbma─
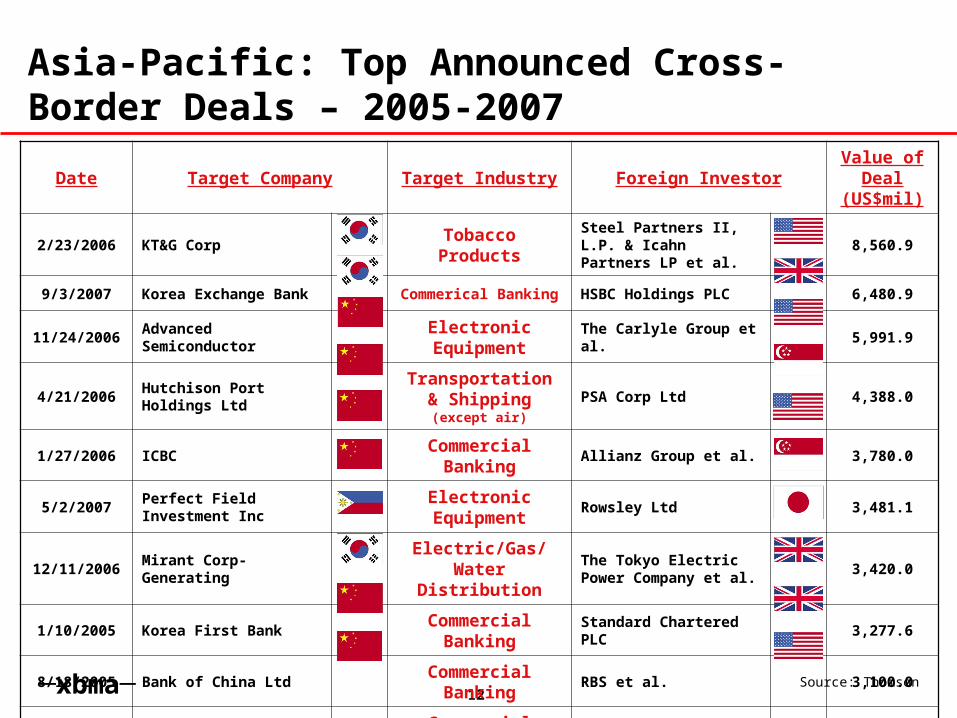
Asia-Pacific: Top Announced Cross-Border Deals – 2005-2007
Date Target Company Target Industry Foreign InvestorValue of
Deal (US$mil)
2/23/2006 KT&G CorpTobacco Products
Steel Partners II, L.P. & Icahn Partners LP et al.
8,560.9
9/3/2007Korea Exchange Bank
Commerical Banking
HSBC Holdings PLC 6,480.9
11/24/2006Advanced Semiconductor
Electronic Equipment
The Carlyle Group et al.
5,991.9
4/21/2006Hutchison Port Holdings Ltd
Transportation & Shipping
(except air)
PSA Corp Ltd 4,388.0
1/27/2006 ICBCCommercial
BankingAllianz Group et al. 3,780.0
5/2/2007Perfect Field Investment Inc
Electronic Equipment
Rowsley Ltd 3,481.1
12/11/2006Mirant Corp-Generating
Electric/Gas/Water
Distribution
The Tokyo Electric Power Company et al.
3,420.0
1/10/2005 Korea First BankCommercial
BankingStandard Chartered PLC
3,277.6
8/18/2005 Bank of China LtdCommercial
BankingRBS et al. 3,100.0
11/16/2006Guangdong Development Bank
Commercial Banking
Citigroup et al. 3,100.0
Source: Thomson

13─xbma─
China: Top Announced Inbound Cross-Border Deals – 2007
Date Target CompanyTarget
IndustryForeign Investor
Value of Deal
(US$mil)
5/2/2007Perfect Field Investment Inc
High Technology
Rowsley Ltd 3,481.1
9/2/2007China Eastern Airlines Corp
Industrials Temasek et al. 923.8
12/6/2007Kerry (Shenyang) Real Estate Development Co Ltd
Real EstateAllgreen Properties Ltd
650.7
9/10/2007China National Chemical Corp
MaterialsBlackstone Group LP
600.0
7/10/2007City Centre Development Phases
Real EstateChina Real Estate Opp
548.1
9/25/2007China Fortune Securities Co Ltd
Financials Morgan Stanley 533.0
1/28/2007Guangzhou Hengda Industrial Group Co
Financials Investor Group 400.0
2/13/2007 C-BONS Hair CareConsumer Staples
Beiersdorf AG 381.4
12/12/2007
Shenzhen ExcelStor LtdHigh Technology
Iomega Corp 323.1Source: Thomson
14─xbma─
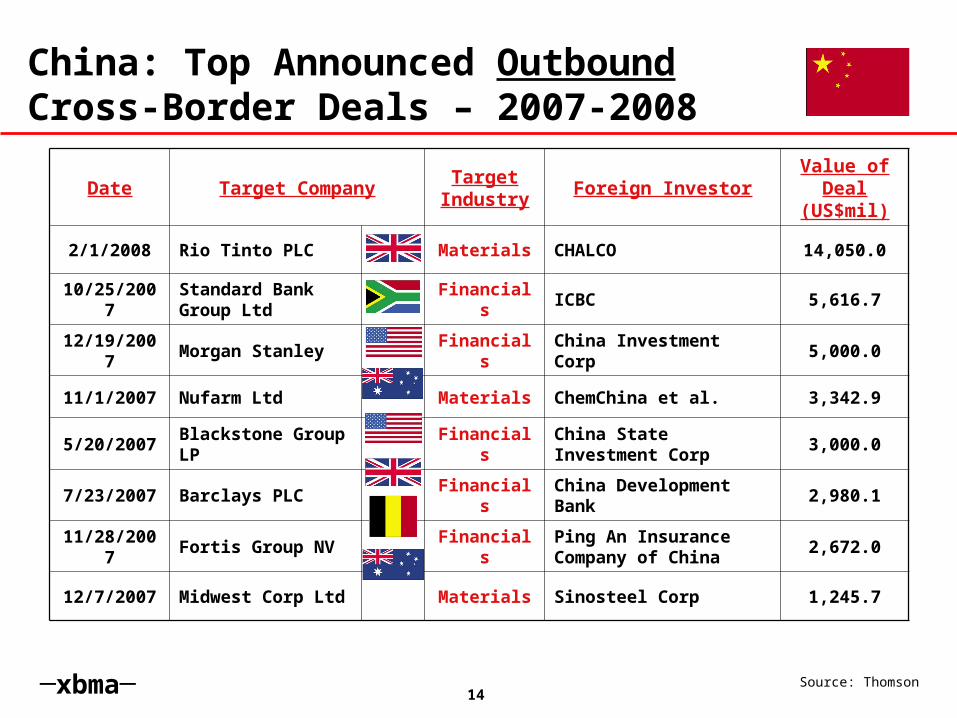
China: Top Announced Outbound Cross-Border Deals – 2007-2008
Date Target CompanyTarget
IndustryForeign Investor
Value of Deal
(US$mil)
2/1/2008 Rio Tinto PLC Materials CHALCO 14,050.0
10/25/2007
Standard Bank Group Ltd
Financials ICBC 5,616.7
12/19/2007
Morgan Stanley FinancialsChina Investment Corp
5,000.0
11/1/2007 Nufarm Ltd Materials ChemChina et al. 3,342.9
5/20/2007Blackstone Group LP
FinancialsChina State Investment Corp
3,000.0
7/23/2007 Barclays PLC FinancialsChina Development Bank
2,980.1
11/28/2007
Fortis Group NV FinancialsPing An Insurance Company of China
2,672.0
12/7/2007 Midwest Corp Ltd Materials Sinosteel Corp 1,245.7
Source: Thomson

15─xbma─
Sovereign Wealth Fund Assets
CIC $200B
~$8B
~$20B
$33B
$50-$60B
$213B
$380B
$489B
$500-$875B
$1.7 trillion
0 200 400 600 800 1000 1200 1400 1600 1800
Oman
Dubai
Russia
Qatar
Kuwait
Norway
Singapore
Abu Dhabi
China
(US$ billions)
SAFE
SWFs manage approximately US$3 trillion in assets, including:
16─xbma─
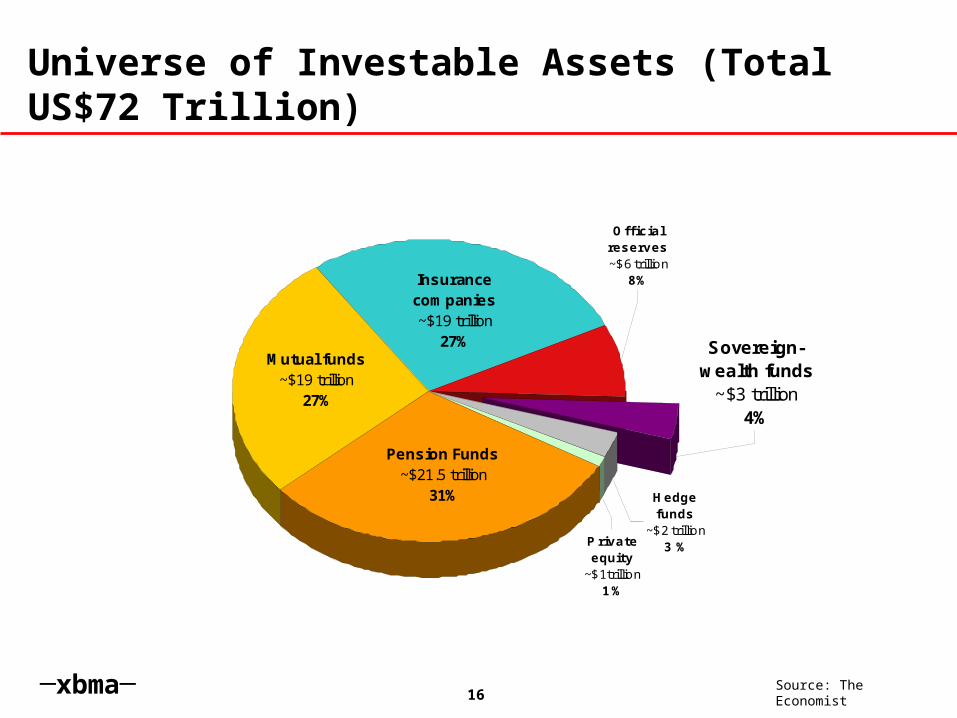
Universe of Investable Assets (Total US$72 Trillion)
Source: The Economist
Hedge funds
~$2 trillion3 %Private
equity~$1 trillion
1 %
Sovereign-wealth funds
~$3 trillion4%
Official reserves~$6 trillion
8%Insurance companies~$19 trillion
27%Mutual funds
~$19 trillion27%
Pension Funds~$21.5 trillion
31%