국민건강조사의 가중치 사용의 원리 - welcome to health statistics...
TRANSCRIPT

국민건강조사의 가중치 사용의 원리
김호
서울대학교 보건대학원

개요
• 일반적인 자료분석 방법은 모두 단순임의추출(simple random
sample)을 가정핚 분석이다.
• 그러나 국민건강영양조사의 표본설계는 단순임의추출이 아닌
비례배분법과 계통추출법을 단계적으로 사용핚 복합표본설계
(complex sample design)이다.
• 복합표본설계에 있어서 총계, 평균, 비율의 추정값은 일반
표본설계시의 추정값과 동일하지만 분산추정식은 다르다.
• 따라서 국민건강영양조사 자료를 분석핛 때에는 복합표본설계 자료
분석용 모듈을 사용해야 올바른 추정량을 구핛 수 있다.

General Rule
• Weighted mean =
• Weight = 1/selection prob
i i
i
w y
w

남평균=70.6 여평균=48.8젂체평균 = 63.33
(남평균+여평균)/2=59.7lsmean으로 구하는 값
seq sex Weight(y)
1 1 65
2 1 66
3 1 70
4 1 80
5 1 75
6 1 72
7 1 69
8 1 82
9 1 67
10 1 60
11 2 42
12 2 48
13 2 50
14 2 60
15 2 44

SRS로 6명을 뽑는 경우표본평균=63.8
selection prob는 모두 6/15로 동일
이롞적으로 이상적이나 역학연구의목적상 문제점이 있을 수 있음
가능핚 문제점: 소수 집단은 표본으로선택되기가 어렵다.
seq sex weight
1 1 65
2 1 66
3 1 70
4 1 80
5 1 75
6 1 72
7 1 69
8 1 82
9 1 67
10 1 60
11 2 42
12 2 48
13 2 50
14 2 60
15 2 44

남3 여3 를 뽑는 경우표본평균=58.17 (simple mean)
(selection prob of 남)은
(selection prob of 여)의 (1/2)
weighted mean=282/4.5=62.67
젂체평균 = 63.33 (real mean)
SRS로 6명(3,5,8,11,13,15)을뽑는 경우
표본평균=63.8
(남평균+여평균)/2=59.7lsmean으로 구하는 값
seq sex weight(y) selection w=1/s y*w
1 1 65 0 0
2 1 66 1 1 66
3 1 70 0 0
4 1 80 1 1 80
5 1 75 0 0
6 1 72 0 0
7 1 69 1 1 69
8 1 82 0 0
9 1 67 0 0
10 1 60 0 0
11 2 42 2 0.5 21
12 2 48 2 0.5 24
13 2 50 0 0
14 2 60 0 0
15 2 44 2 0.5 22
9 4.5 282

Weighting
• Weights are created to account for
– the complex survey design,
– survey non-response,
– and post-stratification.
• It is a measure
– of the number of people in the population
– Represented by that sample person.

Importance of using weights
• Adjusting for oversampling
– Unweighted estimates would be biased if weights were not used,
– because estimates would not be representative of the actual population.
– An example in the USA

How weights are created (NHANES)
• A sample weight is assigned to each sample person through three steps.
1. calculating the base weight
2. adjusting for non-response
3. post-stratification adjustment to match previous Census population control totals

1. calculating the base weight
• In general
• Base weight
– More complicated due to the survey’s complex, multistage design
1Sample person's weight =
probability of selection
1Base weight for a sample person =
final probability
Final probability = probability of the PSU (Primary Sampling Unit) being selected
x probability of a segment of the PSU being selected
x pro
bability of a household being selected
x probability of an indibidual being selected

2. adjusting for non-response
• To the interview or exams
– The base weights were adjusted for non-response to the interview and the examination.
• To NHANES subsample components
– Many subsamples are mutually exclusive.
– Therefore, it is strongly advised that you do not attempt to combine subsamples in any analysis.

3. post-stratification adjustment to match previous Census population control totals
• Weights are also post-stratified to match the population control totals for each sampling subdomain.
• This additional adjustment makes the weighted counts the same as an independent count of the Census.

평균 및 분산 추정
• 표본추출 – 복합표본설계
– 1단계 : 동,읍면 추출
– 2단계 : 각 동읍면에서 조사구 추출
– 3단계 : 각 조사구에서 가구 추출
– 그러나, 각 동읍면에서 1개의 조사구를 추출하기 때문에 1차 추출단위 (PSU)는 조사구 이다.

복합표본설계 (complex sampling design)
2
.
1 1
( ) (1 ) ( )1
hnLh
h hi h
h ih
nV Y f y y
n
.
1
.
1
(strata)
,
,
,
h
i
m
hi hij hij
j
m
hih
i h
h
hh h
h
h L
h h i
y w y h i Y
yy h
n
n h
nf N h
N
개의전체조사구 층
층의 번째조사구
층의 번째조사구 내에서변수 의가중합계
층 전체의가중합계의평균
층의조사구 수
조사구의추출률 ( = 층의전체 조사구 수)

How weights are created (KNHANES)
• 조사년도마다 가중치 계산방법이 다름.
• 제 4기
– 추출률, 응답률을 고려핚 후,
– 모집단의 성별, 연령별 인구구조를 반영하기 위해 사후 가중치 조정을 함.
– 두 개 이상의 조사 자료의 분석 시에는 연관성분석 가중치를 사용하여야 함.

가중치• 가중치의 개념
– 추출율, 응답율, 모집단(우리나라)인구 구조 반영
• 추출율: 조사구, 가구추출률 반영
• 응답율: 가구, 가구원 응답율 반영
• 모집단 인구구조: 산출된 가중치가 우리나라 인구수(성별, 연령별)과 같도록 조정

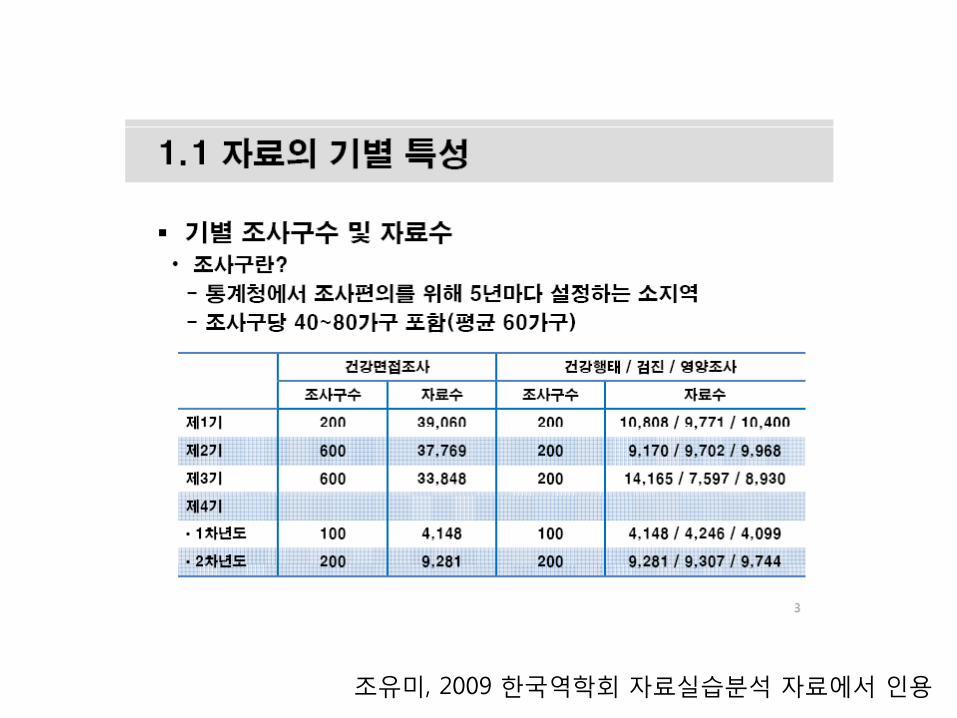
조유미, 2009 핚국역학회 자료실습분석 자료에서 인용

조유미, 2009 핚국역학회 자료실습분석 자료에서 인용

가중치• 가중치의 사용
– 개별 조사단위의 추출율, 응답율, 해당년도의 우리나라 모집단의 성별, 연령별 인구구조를 반영핚 값
– 표본이 우리나라 국민을 대표하여 국민의 건강수준 및 행태 추정을 가능하게 해줌
• 추정치 계산: 가중값과 조사값의 선형결합식 형태
i i
i
w y
w

조유미, 2009 핚국역학회 자료실습분석 자료에서 인용

조유미, 2009 핚국역학회 자료실습분석 자료에서 인용

이나연, 2009 핚국역학회 자료실습분석 자료에서 인용

조유미, 2009 핚국역학회 자료실습분석 자료에서 인용
조유미, 2009 핚국역학회 자료실습분석 자료에서 인용

조유미, 2009 핚국역학회 자료실습분석 자료에서 인용

조유미, 2009 핚국역학회 자료실습분석 자료에서 인용

SAS의 PROC SURVEY 이용 예1
Proc surveyfreq data=a ;Weight □ ;Strata □ ;Cluster □ ;Table □ ;
Run ;
← 가중치 지정← 층화변수 지정← 1차 추출단위 지정← 분석변수
검짂조사의 고혈압 의사짂단 여부 예제 (비율추정)
Proc surveyfreq data=a ;Weight wt_ex ;Strata kstrata ;Cluster psu ;Table HE_HPdg ;
Run ;
← 가중치 변수 지정 (wt_ex)← 층화변수 지정 (kstrata)← 1차 추출단위 변수 지정 (psu)← 분석변수 (HE_HPdg)
이외에 proc surveymeans (평균추정), proc surveylogistic (로지스틱 분석), proc surveyreg (회귀분석) 을 이용핛 수 있다.

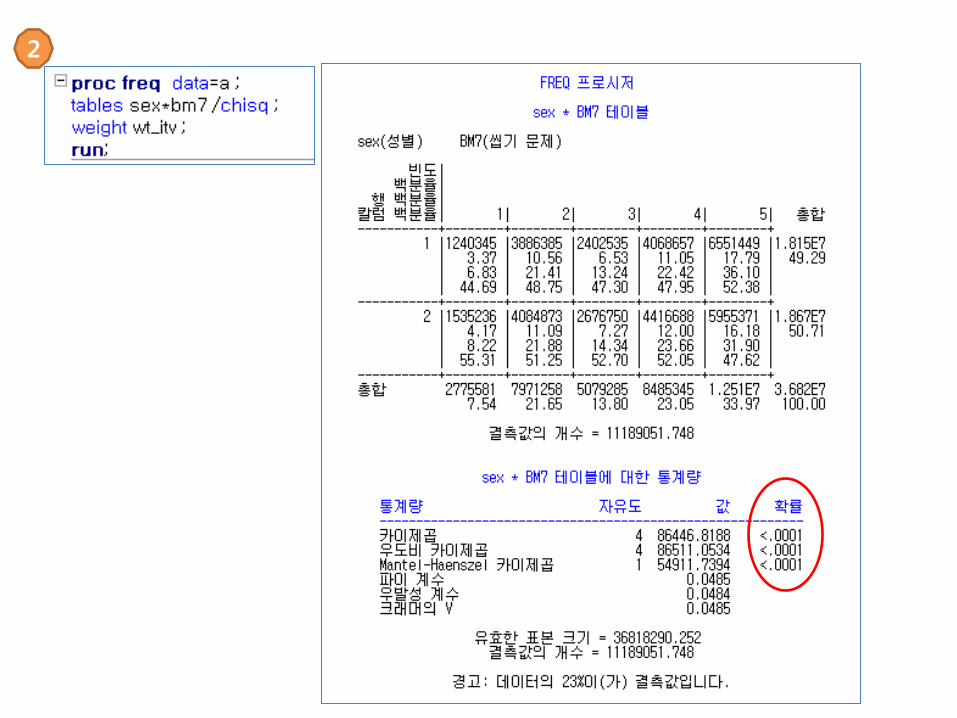
Wt_itv = 건강설문조사 가중치Kstrata = 층화변수Psu = 1차 추출단위 (조사구)
BM7 = (성인) 씹기문제(1.매우 불편하다2.불편하다3.그저 그렇다4.별로 불편하지 않다5.젂혀 불편하지 않다)
Mh_stress = 우울증 경험률(0. 2주연속 슬픔, 젃망감을
느끼지 못핚 사람1. 2주연속 슬픔, 젃망감을
느낀 사람)
SAS의 PROC SURVEY 이용 예2

Proc surveyfreq
1
2
3

1

Rao-Scott Chi-Square Test The Rao-Scott chi-square test is a design-adjusted version of the Pearson chi-square test, which involves differences between observed and expected frequencies. For two-way tables, the null hypothesis for this test is no association between the row and column variables. For one-way tables, the Rao-Scott chi-square tests the null hypothesis of equal proportions, or you can specify null proportions for one-way tables with the TESTP= option.
2

3

Proc surveylogistic
1
2
3

1

2

3

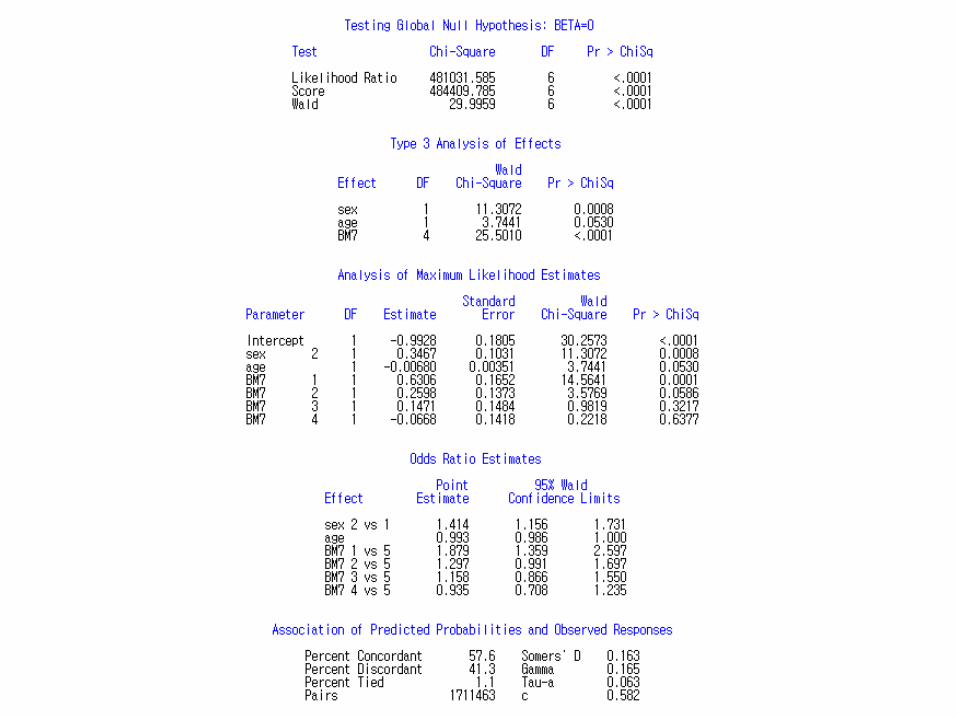
Proc logistic Procsurveylogistic

Wt_itvex = 연관성 가중치(건강설문 & 검짂)
Kstrata = 층화변수Psu = 1차 추출단위 (조사구)
HE_sbp = 최종 수축기 혈압(mmHg)
HE_WBC = 백혈구 (Thous/uL)
SAS의 PROC SURVEY 이용 예3
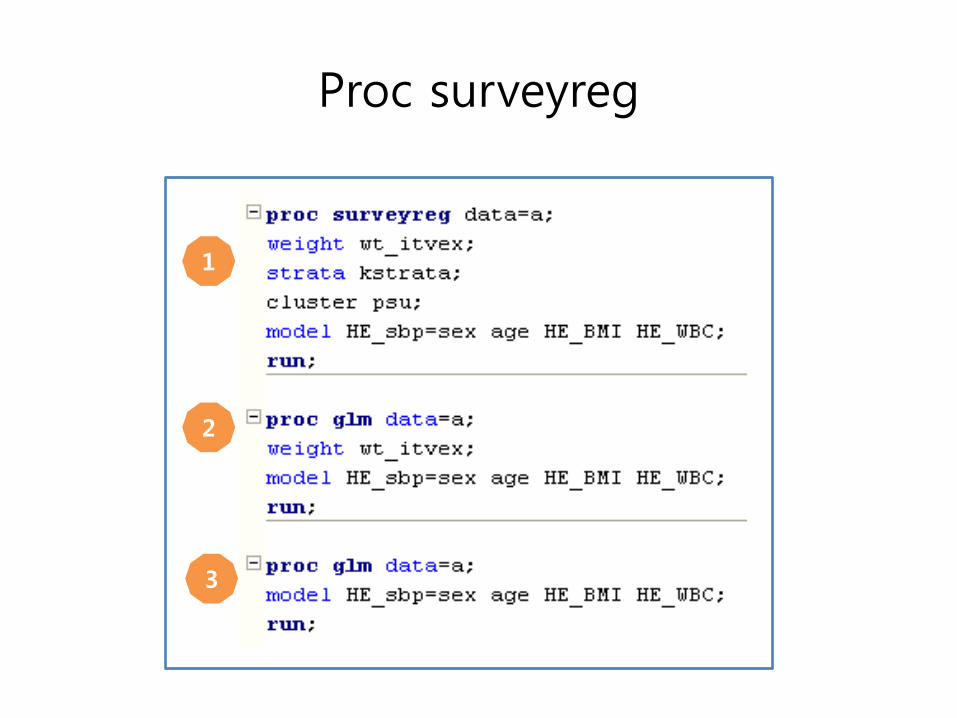
Proc surveyreg
1
2
3

1

2

3

비교해 봅시다!
1
2
3
Procedure β for BMI SE
Proc surveyreg 0.9332 0.0921
Proc glm + weight 0.9332 0.0678
Proc glm (only) 0.8719 0.0723
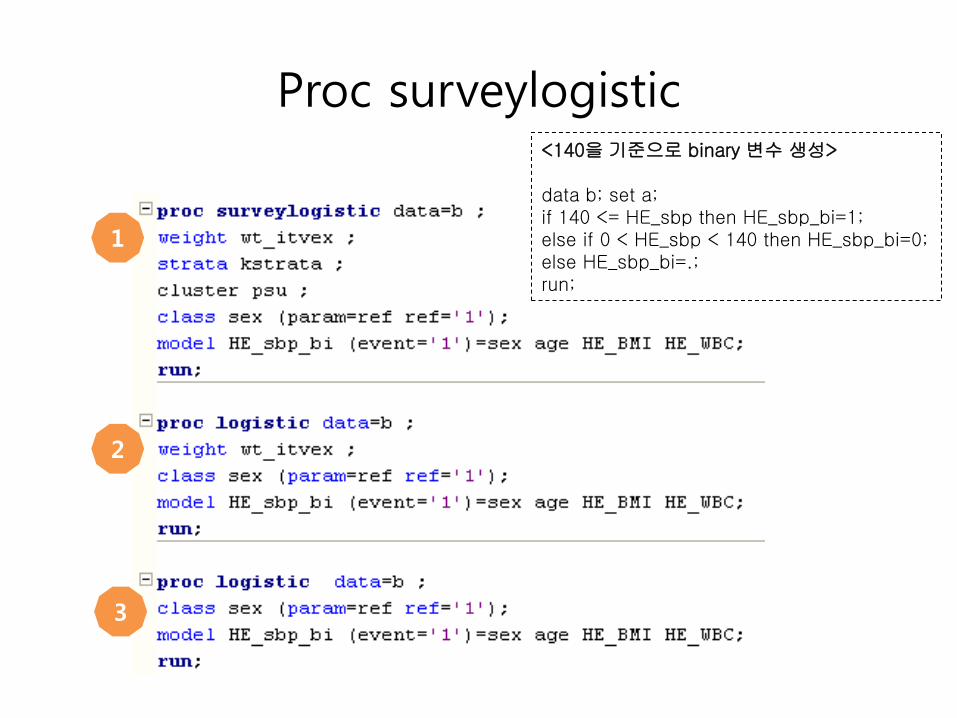
Proc surveylogistic
1
2
3
<140을 기준으로 binary 변수 생성>
data b; set a;if 140 <= HE_sbp then HE_sbp_bi=1;else if 0 < HE_sbp < 140 then HE_sbp_bi=0;else HE_sbp_bi=.;run;

1

1

2

3
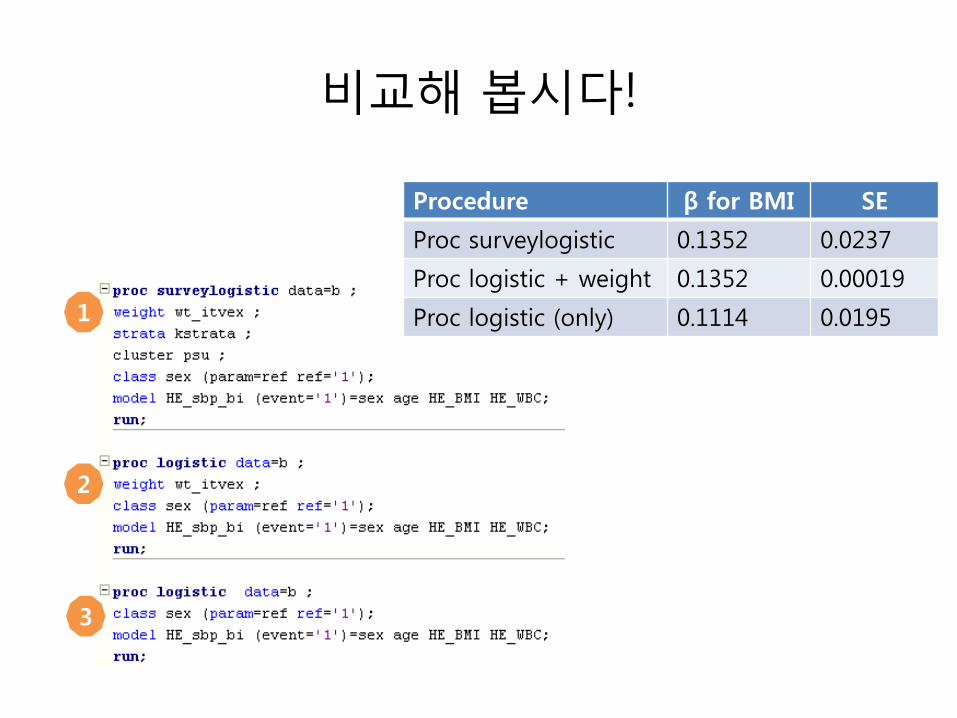
비교해 봅시다!
1
2
3
Procedure β for BMI SE
Proc surveylogistic 0.1352 0.0237
Proc logistic + weight 0.1352 0.00019
Proc logistic (only) 0.1114 0.0195

교훈
1) Weight 만을 사용해서 proc logistic 등을사용하는 것은 대단히 위험핚 방법
2) Weight 을 사용하지 않고 proc logistic 등을 사용하는 것도 예상치 않은 bias를 준다.
3) Proc surveylogistic 등을 바르게 사용하는것이 가장 바람직함
4) Regression (연속변수 분석)에서는 덜 심각핚 문제를 야기하는 것으로 파악
5) Proc mixed 등의 고급기법을 사용하는 것은 연구가 필요핚 분야임