jtethys.orgjtethys.org/.../uploads/2013/12/khaleghi-et-al.-2013-pro… · web viewusing airborne...
TRANSCRIPT
Using Airborne Geophysical Databases for Assigning Relationships between Gravimetric Facies and seismic Faults Location in North of Qazvin, Iran.
Roya Khaleghi1*, Reza Mehrnia2, Behnam Babaei3
1- M.Sc. of Gravimetric, Department of Geophysics, Islamic Azad University of Hamedan, Iran.2- Associate Prof., Department of Geology, Payam Noor University, Iran.3- Assistance Prof., Islamic Azad University of Mahalat, Iran.
* Corresponding Author: [email protected]
Abstract
In this research which is based on the interpretations of seismic, gravity and magnetic data which would be considered on models of hidden fault on the area with a radius of 40 km in north of Qazvin that limited between latitude (35.°75´ to 37.°07´) and in longitude (49.°45´ to 50.°84´). Airborne magnetic and gravity databases have been processed (by Geosoft) for extract hidden lineaments associated with seismic structures in depth of quaternary formation. A reduction to pole and first derivative applications also have been well done before geological interpretations. Our research showed that magnetic and gravity lineaments not only coincide with geological evidences but realize the hidden structural locations according to fabrication peculiarities of earthquake epicenters. Geophysical contoured maps in addition to magnitude values of earthquakes catalogue have been traced by observed structures (Bereberian fault map) for obtaining better results related to impression of the magnitudes (2<Ms<8) since 1962 to fabrication processes of seismic lineaments.The result of these reviews is accessing to the 56432 points interpolation with an isometric grid. Also we will discuss about facies changes and better evaluation of gravity lineaments identity and recognizing hidden faults in the area by geologic map of mentioned region and using two criteria including observed structures and gravity lineaments which have topological association with seismic events. Accessing to such a model prepare to analysis of mechanisms of seismic attributed to northern faulted region of Qazvin and it will be basis of new research for exploration model of obvious and hidden seismic faults which is provable their identity in terms of geophysics.
Keywords: Airborne Geophysics, Gravity Facies, Qazvin North Faults, Seismic Lineaments.
1– Introduction
The overall interpretation and modeling of geophysical data be done in quantitative and qualitative manner. In qualitative interpretation, the types of causer structures, direction and protraction and rate of their extension are considered more. In this condition, shape, depth, extension, protraction and physical properties of abnormalities are determined in the comparative situation. Nowadays this type of information in order to evaluate subsurface geology specially linear structures in tectonic studies and its usage earthquake hazard is spread. The increasing development of industry and extension of vital arteries in most of place in this area requires that
situation of subsurface lineaments in order to identify hidden faults and analysis of hazard cause of it, should be considered. In the research that have been done on seismic faults, shows that discontinuities have determinative role in systematic and dynamic of fault process, and recognizing of discontinuities is the most important factor in identity of fault arena smithereens (Sardashti, 2004).In territory of study, linear and checking their relation with faults and gravity facies, and their role in seismic of area has high importance. In this research in addition to confirm the existing and prior fault of area, hidden fault is
1
recognized. Also we will check that with diagnosing around the gravity fabric of area if does changes of geology facies exist or not, and if this changes of facies is consonant with changes of slate density and if done confirmed the report of gravity linear and their relation with faulty-seismic system in area of north Qazvin fault. According to achieved results, there is a direct relation between faults and compression of linear as the most compression linear is nearby the faults.
2–The Geography of the case study areaQazvin province is 15640 Km2 with 968000 population, it is located between coordinates 35.°24´ to 36.°49´ northern latitude also 48.°44´ to 50.°51´eastern longitude. North faulted region of Qazvin is placed in Alborz mountains, the mechanism of this faulted region has been reversed.The northern thrust region with eastern-western trending and 60 km of length is passed by 11 km from north of Qazvin that cause to be corrupted the fault formation of Karaj to Eocene age and be driven on the quaternary and steeped destructive deposition to Neogene age. The phenomena of active tectonic in this area due to abundance of igneous formation constitution of rhyolite, rhyodacite and andesite tracks units with the subtraction and changes of wide magmatic subtraction causes to creation of magmatic hydrothermal system (Aleaster, 2001).
The geographic situation of Qazvin province is shown in Fig.1.
Figure 1) Map of Iran and location of Qazvin province (www.iranchamber.com(.
3–Geological and Geomorphologic overview
In the view of geology, Qazvin province is located between common areas of western Alborz and northern edge of central Iran. In other words the highland of north province is located in southern margin of Alborz also most part of province that is included plain of Qazvin and southern highlands belongs to the structural-sedimentary central of Iran and it seems to be the boarder of these two areas conformed on the thrust of NQF that separates the north highlands from plain of Qazvin, but surely this boarder is estimated in the way that determination of a boarder real line is impossible between Alborz and central Iran and both (Alborz-central Iran) of them are from the same basin (Geological Survey of Iran).
The history of geology and tectonic of this area has more complicated points than other active tectonic areas of Iran. From cretaceous and after that, this region had experienced lots of compression and tension phases that each of them not only has affected on the tectonic construction before themselves but also on the creation of the wide Volcanism and Plutonism and has added on the tectonic complication of region (Geological Survey of Iran).
- North Qazvin Fault (NQF)
This fault is located in Alborz-Azerbaijan (39N) zone, the mechanism of this fault had been reversed, thrust NQF with eastern-western trending also more than60 km length is passed by 11 km from North of Qazvin that caused to be corrupted the fault construction of Karaj to Eocene age and be driven on the quaternary and Steeped destructive deposition to Neogene age (Berberian and Yeats, 1999).
This fault is the most important constructional phenomena in correlated with large seismicevents that possess long-term return due to constructing Caspian compressive system (Berberian and Yeats, 1999).
2

The sudden division height between Qazvin (with the average height of 1250 m above the surface of the sea) and the nearest peak to that (Hezar Ghale Si, peak with height of 2700 m ) is placed at the distance of 30 km from northeastern of Qazvin that is one of the most remarkable attributes of Qazvin topography that is the result of alignment movements at the length of north faulted region. This faulted region has made a border between plutonic-pyroclastic igneous units due torocks in construction of Karaj (north) and quaternary alluvial (south) formations. This fault has been activated from the view of seismo-tectonics. So it can be regarded a seismic threatening factor for Qazvinprovince as a one of the industrial center of the country (fig.2).
Figure 2) North Qazvin fault Mechanism (Hesami et al., 2003)
In the most of geological cutting of the NQF in the foothills have been seen that alluvial are more or less horizontal sloped, due to approaching to fault line also the function of NQF suddenly change theirslope and sometimes take alignment forms. Neo tectonically movements of NQF that is located in some section of Iran is unrest and aggressive.But according to deficient information, the seismic
story is not truly clear.It seems the historical earthquake has been occurred due to movement of this fault with relative magnitude 6/5 to 1119 AD (Ambraseys & Melvilla, 1982).
The NQF is located on the southern part of central Alborz and extended to the east next to Taleghan fault System. The NQF has been introduced by different researches as a thrust fault and sloped to the north (Berberian and Yeats, 1999).
Northern regions of Qazvin have been seen with many historical earthquakes during that the city has been destroyed many times. Among the faults has been seen on north of Qazvin, It can be noted to Barajin and Ardabilak faults. The Ardabilak fault is along with Barajin-Niagh villages and that is the main factor of creation of north highlands Qazvin. This fault is active and seismogenic (Fig.3).
Figure 3) Ardabilak fault traces in north of Qazvin (Abbasimehr.ir).
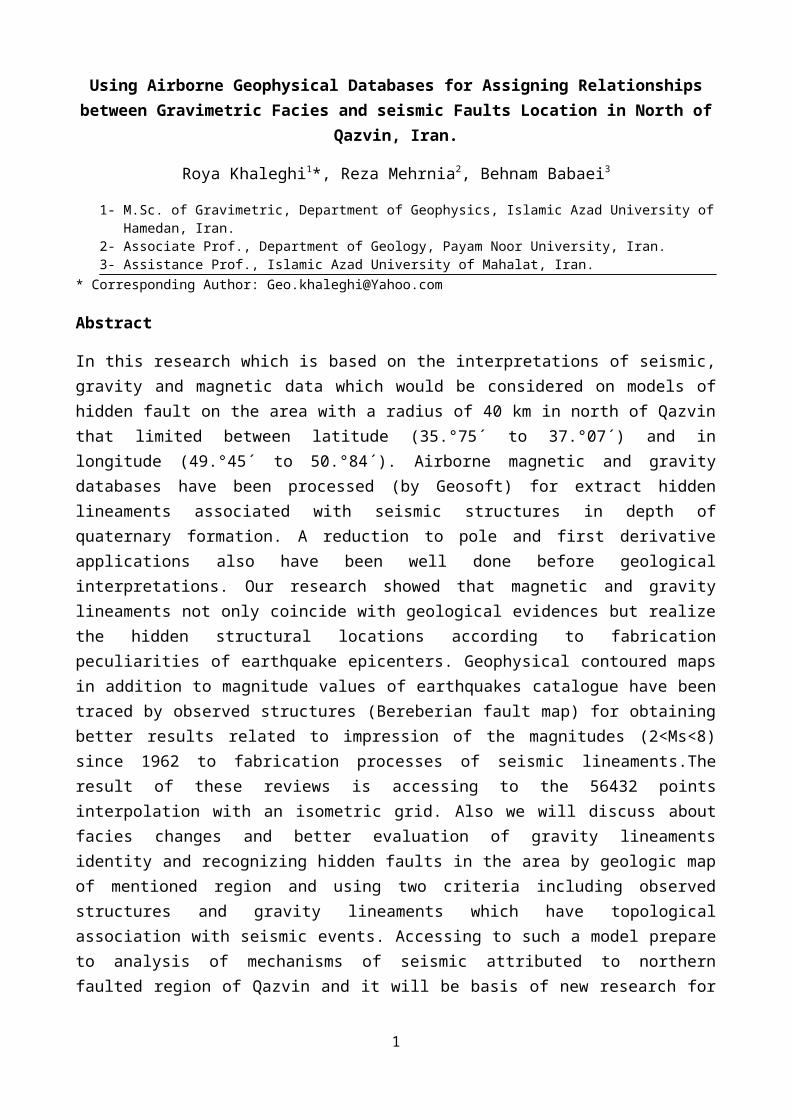
The fault of Barajin in northern region of Qazvin just has limited occurrences on the road of Bahramabad to 3 km Barajin village. Most part of this fault is hidden (Fig.4).
3
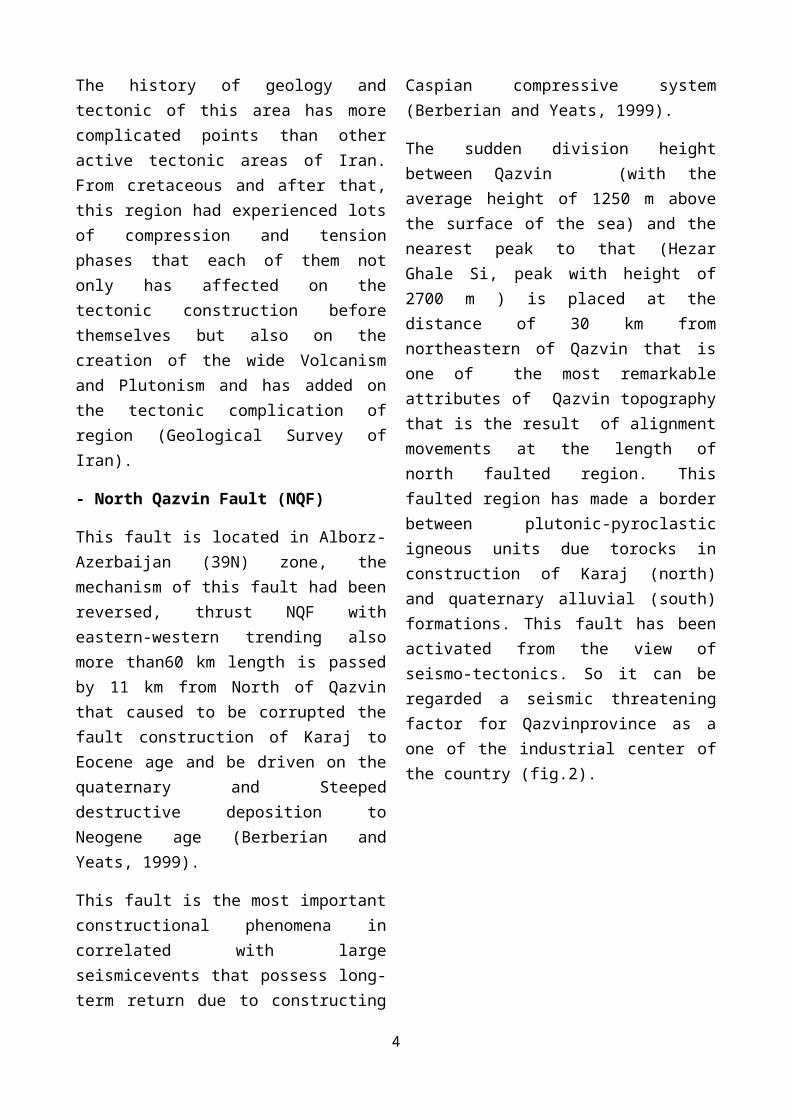
Figure 4) The Fault of Barajin village, north of Qazvin (Abbasimehr.ir).
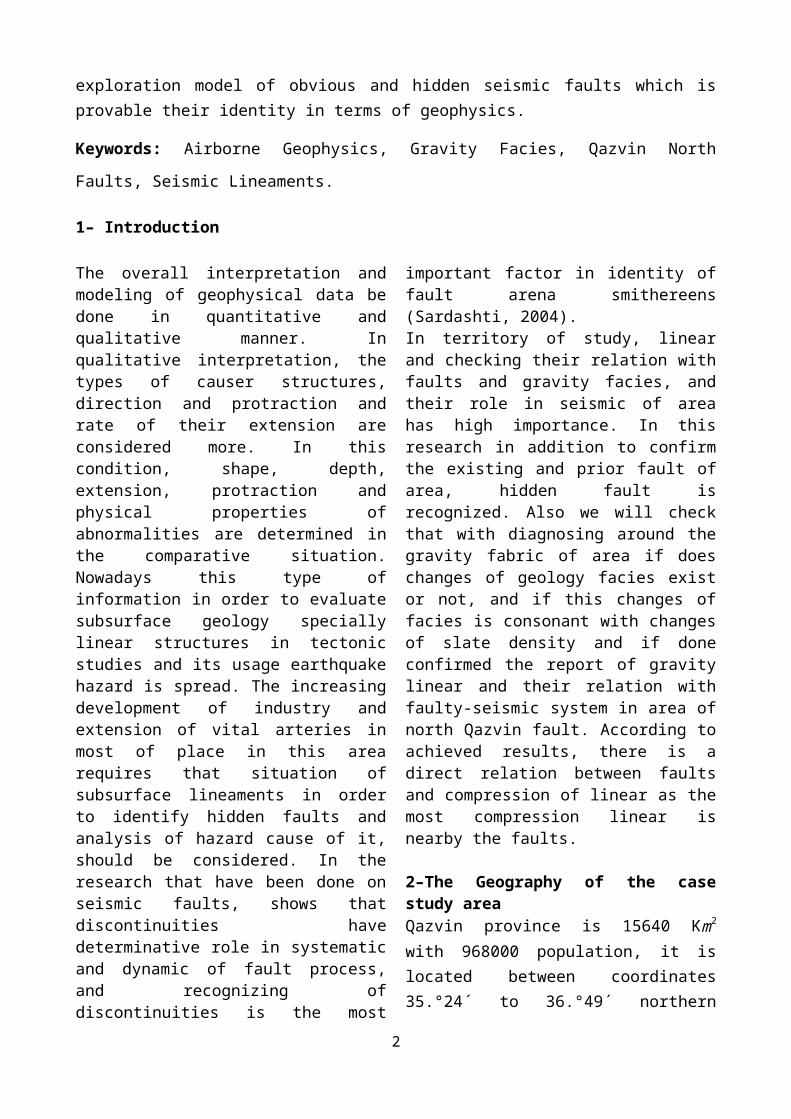
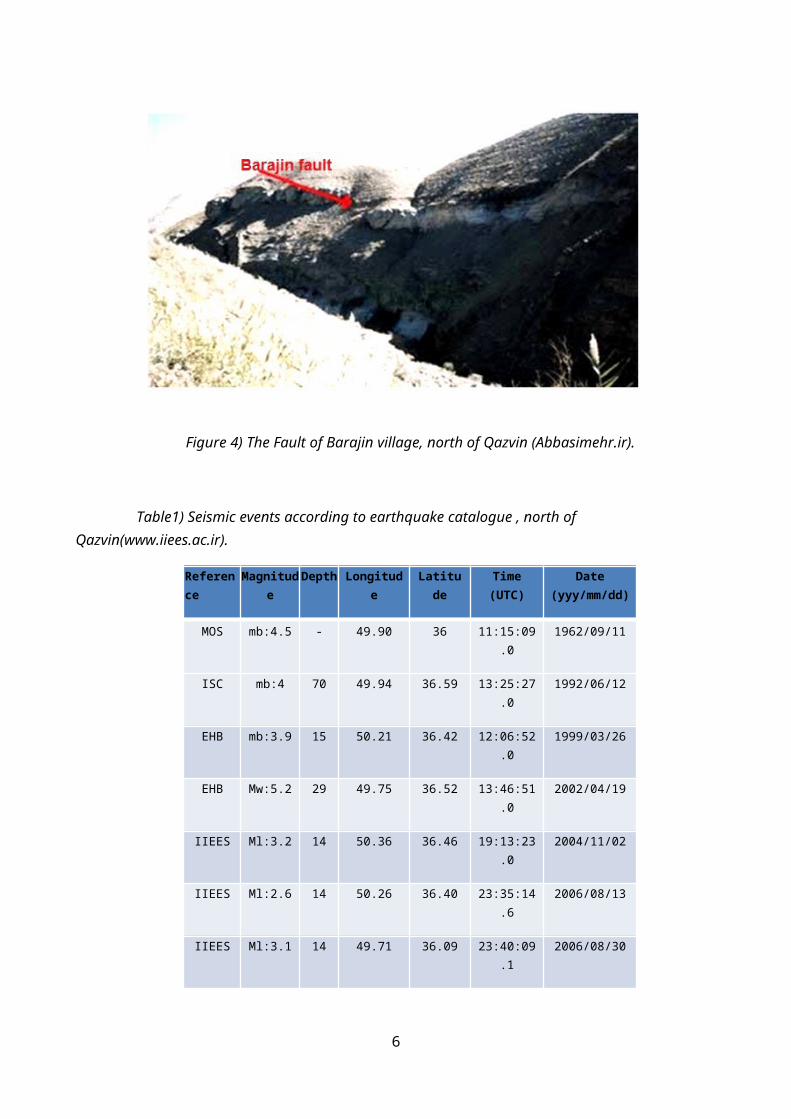
Table1) Seismic events according to earthquake catalogue , north of Qazvin(www.iiees.ac.ir).
Date (yyy/mm/dd)
Time (UTC)LatitudeLongitudeDepthMagnitudeReference
1962/09/1111:15:09.03649.90-mb:4.5MOS
1992/06/1213:25:27.036.5949.9470mb:4ISC
1999/03/2612:06:52.036.4250.2115mb:3.9EHB
2002/04/1913:46:51.036.5249.7529Mw:5.2EHB
2004/11/0219:13:23.036.4650.3614Ml:3.2IIEES
2006/08/1323:35:14.636.4050.2614Ml:2.6IIEES
2006/08/3023:40:09.136.0949.7114Ml:3.1IIEES
2007/03/2614:28:08.036.3150.3827Ml:2.7IIEES
2008/01/2120:17:56.936.5449.8815Ml:3.1IIEES
2009/10/1718:16:44.936.4949.9915Ml:2.5IIEES
2010/07/0623:57:11.736.3450.0415Ml:2.5IIEES
2011/01/2703:59:17.136.3849.7718Ml:2.6IIEES
4

The map of fault zone that has been gotten from Institute of Earthquake Engineering and Seismology that its circles radius is proportional with its magnitude (Fig.5).
Figure 5) Faults and structures in northern region
of Qazvin (www.iiees.ac.ir).
One of the clear characteristic of NQF is a young and active structure with more than 12 significant seismic events since 1962 AD.According to regional studies there are traces of active tectonic so that clear lineaments are observed by using regional Satellite images that is represented to NQF recent activities in quaternary because of its cutting and replacement effects on alluvial formations (Fig.6).
Figure 6) Qazvin plain located in north west of central Iran (Schmidt et al., 2005).
- Najmabad fault
The fault scarp that can be seen on the satellite image SRTM (90M) represents an eastern-western approximate trending in southern part of NQF (Taherkhani et al., 2010).
The mentioned fault, for the first time has been studied in the proximity of Najmabad village (10 km to north of Qazvin) then was called Najmabadfault (Fig.7).
Figure 7) SRTM photomap from north faulted regions of Qazvin represents the situation of NQF and Najmabad fault, The small figure on the top shows the limited situation of case study (Taherkhani et al., 2010).
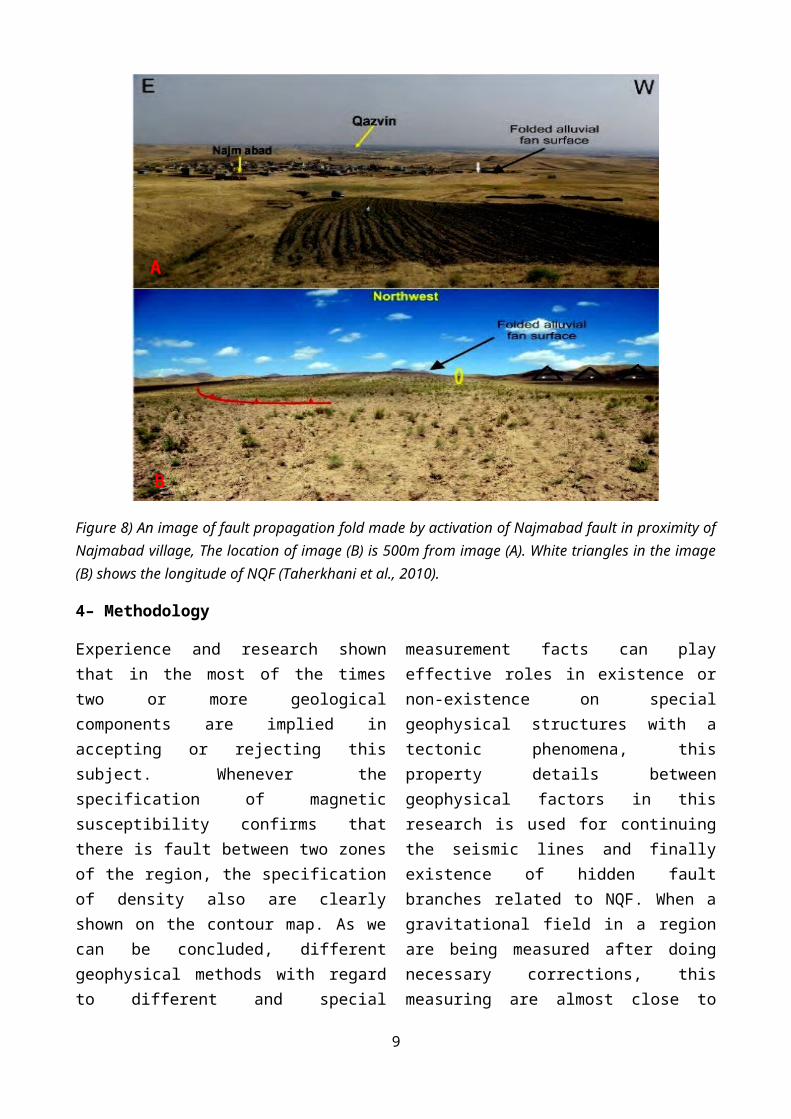
What can be seen of this fault on the ground is alluvial information fold in Hezardare that is regarded as fault Propagation fold. It seems Najmabad fault is a progressive branch of NQF
5
which traces in young alluvial are made by far northern activities nearby regolith. This fault is
regarded as external structure compare with NQF as an internal (Bull, 2007) (Fig.8).
Figure 8) An image of fault propagation fold made by activation of Najmabad fault in proximity of Najmabad village, The location of image (B) is 500m from image (A). White triangles in the image (B) shows the longitude of NQF (Taherkhani et al., 2010).
4– Methodology
Experience and research shown that in the most of the times two or more geological components are implied in accepting or rejecting this subject. Whenever the specification of magnetic susceptibility confirms that there is fault between two zones of the region, the specification of density also are clearly shown on the contour map. As we can be concluded, different geophysical methods with regard to different and special measurement facts can play effective roles in existence or non-existence on special geophysical structures with a tectonic phenomena, this property details between geophysical factors in this research is used for
continuing the seismic lines and finally existence of hidden fault branches related to NQF. When a gravitational field in a region are being measured after doing necessary corrections, this measuring are almost close to each other and there is not any remarkable changes if the geological layers be firm, but if in some part of the region these measurement experiences remarkable changes it means the occurrence of changes in gravity gradient and density of the region. This situation indicates the placement of different geophysical layers beside each other or in other words abruption in ground structure of that region from the view of gravity one of the most important reasons of this
6
B
A

occurrence is the existence of fault in this region. This research is by airborne geophysical usage that has both airborne magnetometer survey and gravity survey data is decimal degree and also the seismic information of seismic catalogue from International Institute of Earthquake Engineering and Seismology (IIEES) till radius of 40 km from the city of Qazvin, had been done by counting of 12 seismic event and regional geological map, after that these data will be gathered and by using of surfer software and then their grid, after interpolation of statistical data had been prepared in kriging method. Then the first derivation and contour map had been drawn, and then from contour map were extracted seismic lineament were specified on map. Also north Qazvin major fault map retrieved from IIEES was also drawn on contour map that is shown some of lineament are on thefield of NQF and some of them are not placed. Then between this framwork found a solution that if we have had regional magnetic and gravity data and draw the contour map of data, then extract and specify magnetic lineament and seismic gravity, it can be concluded after modulation of two or three cases which of lineaments in seismic catologue is realy representative of seismic lineament and which one is not (fig.9,10,11).
Figure 9) Contoured map of seismicity in north faulted region of Qazvin based on entities and the magnitude of earthquakes (scale: 1/1000000).
Figure 10) The first derivation results for Contoured map of seismicity in northe faulted region of Qazvin based on the magnitude of earthquakes. In this map, red dotted lines are fault lines & black lines are seismic linements (scale: 1/1000000).
7
Degree
Degree
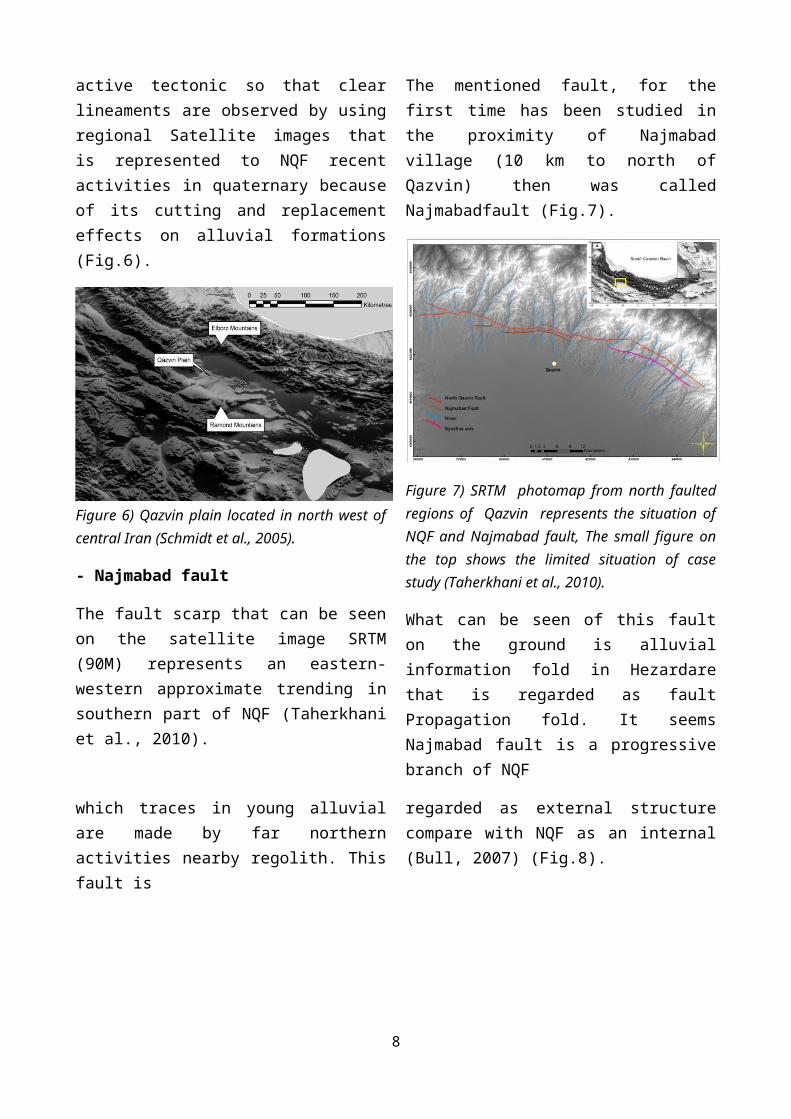
Figure 11) Contoured map of seismicity in north faulted region of Qazvin based on entities and depth variation of earthquakes. In this map, yellow triangles are earthquke Places & red triangle is biggest earthquke with the magnitude of Ms:5.2 richter (scale: 1/1000000).
All over the world lineaments are determines of crust’s weak zones. If any structural replacement does not specify on them, rocks may completely be broken and susceptible to erosion. At the first described linear forms on satellite that are called lineament, but after that if the field study and basic map confirms the structural displacement, they will be specified as a fault (Sardashti, 2004).
Fabric is a micro-structure phenomenon due to geophysical vectors anisotropy that usually has convergent and divergent properties in specific directions. The fabrics are affected by local field and usually confirms in the margin faulted systems with geophysical gradient. In this research fabrics are the vector result of magnetic or gravity anisotropy in a subscale. In simpler interpretation micro-Structure components are
in the effect environment a magnetic or gravity field thatin effect, their aggregation or intensifications, part of geophysical unit will be separated from other part, so fabrics are affected of gravitational facies of a geological unit and by lineaments are controlled in a regional scale (National Geoscience Database of Iran).
As can be seen on the maps, the location of lineaments are related with the place of the strongest seismic gradients that their fabric are linear shown with black. The major observed structures in north of Qazvin can be seen in red dotted lines on the map are along with eastern-western.The place of seismic gap (current quiet area) is where has not been regestered any earthquake in that area during last decayeds and is on low risk that has been shown with yellow polygon on the map. More of the earthquakes has been occurred at depths less than 30 km and the most biggest earthquake with the magnitude of 5/2 has been occurred in 49.°75´ longitude and 36.°52´ latitude at a depth of 29 km on 2002 AD that is shown with red triangle on the map. Only one of the earthquake events that is related to 1992 AD, had occurred on the north fault of Engebarajeen with 49.°94´ longitude and 36.°59´ latitude with 70 km depth and 4 richter magnitude,from the scattering of earthquakes epicenter on the depth map of region can be concludedthat north-west part of Qazvin and southern part of Engebarajeen fault have had the most occurance of earthquake in term of magnitude and quantity. The first derived map had clearly shown the gravity changes of the earthquake magnitude. In the FVD map based on the magnitude of earthquakes, zone with coordination of 36.° 33´ till 36.°41´ latitude and 49.°73´ till 49.°83´ longitude and zone with coordination of 36.°55´ till 36.°60´ latitude and 49.°93´ till 50.°00´longitude are important, due to some part of these zones are Berberian fault that crossed from negetive and posetive gravity. On the map, some of the seismic-faulted lineaments with the gradient change scale are shown, anywhere gradient has been changed,
8
Degree
can guess there is a lineament in that zone. These lineaments illustrates dangerous zone of seismicity and if two geophysical components confirm the existance of two almost same lineaments on the map, that zone should be placed as special importance of being seismicity.
5– Aeromagnetic and gravimetric evidence
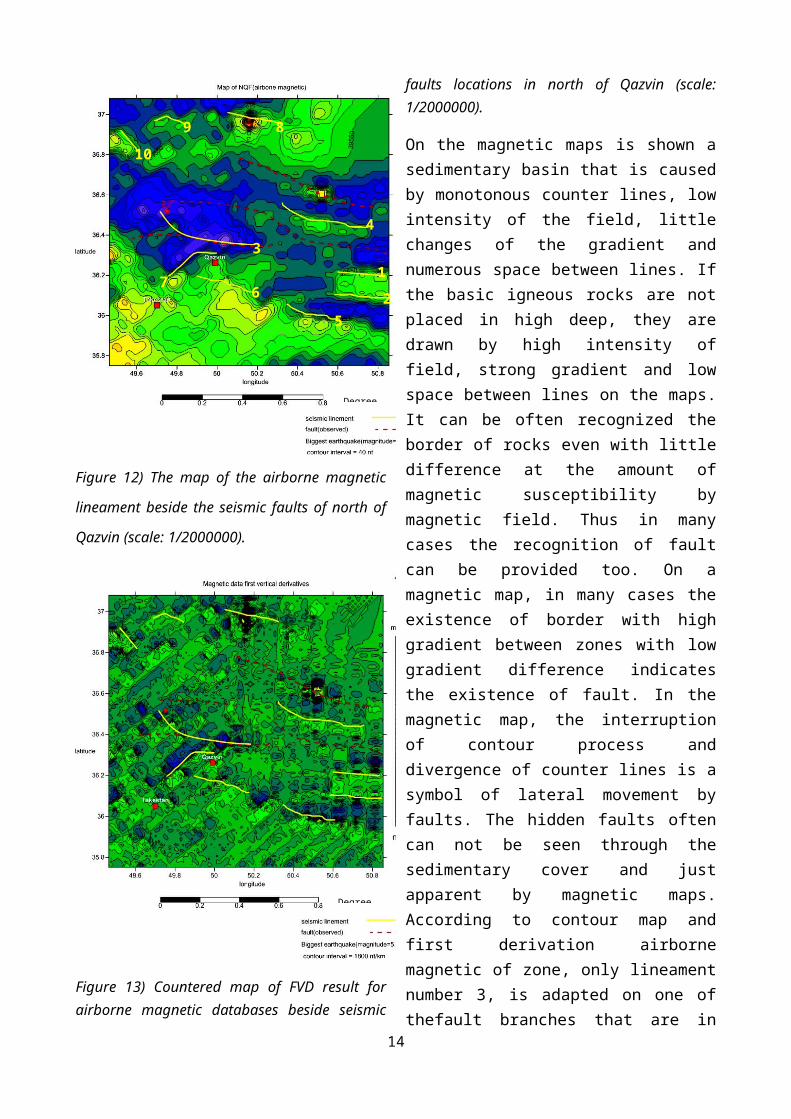
In during the exploration, the existence or nonexistence of a fault or buried influent mass is more important than determination of form or depth of burial. In a magnetic map, there are some parts with large and significant magnetic changes that represent rocks with high magnetic susceptibility & low burial depth. The airborne magnetic databases have been gridded by IDW geo-statistical techniques (Inverse Distance Weighting) for obtaining 18760 interpolated values in studied geological quadrangle that contour and first derivativemaps has shown in Fig.12 & Fig.13 respectively.
In this contour maps yellow lines are seismicity magnetic linements & red dotted lines are berberian’s faults (observed). On magnetic contour map seismicity magnetic linements are numbered.With using the contour map of magnetic data about length and width of area and itsinterpretation can be realized the existence of NQF with trending eastern-western, and for confirming the accuracy of this matter, it can be compared airborne magnetic map of the area with fault zone map.
Figure 12) The map of the airborne magnetic
lineament beside the seismic faults of north of
Qazvin (scale: 1/2000000).
Figure 13) Countered map of FVD result for airborne magnetic databases beside seismic faults locations in north of Qazvin (scale: 1/2000000).
9
Degree
Degree
8
4
9
10
2
17
6
5
3

On the magnetic maps is shown a sedimentary basin that is caused by monotonous counter lines, low intensity of the field, little changes of the gradient and numerous space between lines. If the basic igneous rocks are not placed in high deep, they are drawn by high intensity of field, strong gradient and low space between lines on the maps. It can be often recognized the border of rocks even with little difference at the amount of magnetic susceptibility by magnetic field. Thus in many cases the recognition of fault can be provided too. On a magnetic map, in many cases the existence of border with high gradient between zones with low gradient difference indicates the existence of fault. In the magnetic map, the interruption of contour process and divergence of counter lines is a symbol of lateral movement by faults. The hidden faults often can not be seen through the sedimentary cover and just apparent by magnetic maps. According to contour map and first derivation airborne magnetic of zone, only lineament number 3, is adapted on one of thefault branches that are in seismic catalogue map of area and also Berberian faulted pattern confirm it and other lineaments are new and fault probably. In fig.12 & 13, yellow and green areas have high susceptibility. When the ratio of magnetic susceptibility of subsurface mass is increased, the intensity of magnetic anomaly will be increased too, therefore with increasing the magnetic susceptibility, the range of anomaly will be increased. It is evident that, using of the geology information of the area and gravity data can help to more efficient interpretation. With using and interpretation of contour map of gravity data about the latitude and longitude of area can find out the main fault, north faulted region of Qazvin, that was trending on eastern-western. The comparison this map with Berberian faulted map confirms it. Contour and first derivative airborne gravity maps are shown in fig.14 & 15 respectively.
Figure 14) The counter map of the airborne gravity of north faulted region of Qazvin (scale: 1/2000000).
Figure 15) Countered map of FVD result for airborne gravimetric databases beside seismic faults locations in north of Qazvin(scale:1/2000000).
10
Degree
Degree
34
1
56
8910
2
7

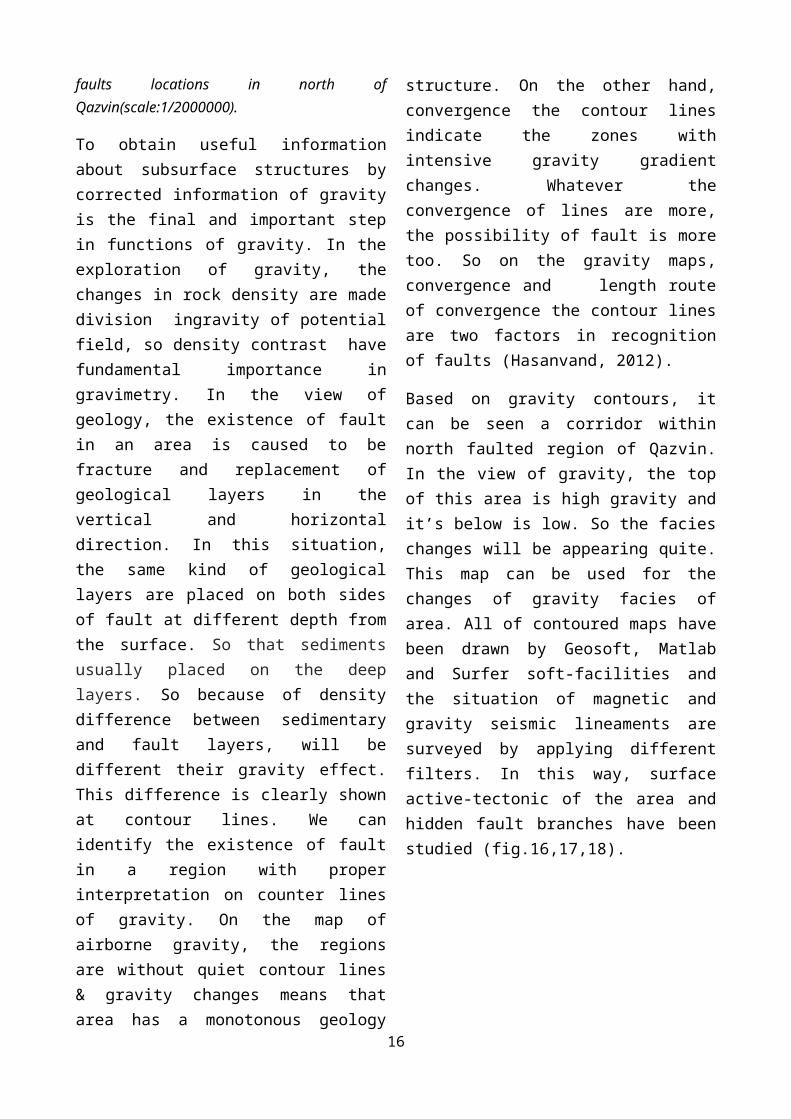
To obtain useful information about subsurface structures by corrected information of gravity is the final and important step in functions of gravity. In the exploration of gravity, the changes in rock density are made division ingravity of potential field, so density contrast have fundamental importance in gravimetry. In the view of geology, the existence of fault in an area is caused to be fracture and replacement of geological layers in the vertical and horizontal direction. In this situation, the same kind of geological layers are placed on both sides of fault at different depth from the surface. So that sediments usually placed on the deep layers. So because of density difference between sedimentary and fault layers, will be different their gravity effect. This difference is clearly shown at contour lines. We can identify the existence of fault in a region with proper interpretation on counter lines of gravity. On the map of airborne gravity, the regions are without quiet contour lines & gravity changes means that area has a monotonous geology structure. On the other hand, convergence the contour lines indicate the zones with intensive gravity gradient changes. Whatever the convergence of lines are more, the possibility of fault is more too. So on the gravity maps, convergence and length route of convergence the contour lines are two factors in recognition of faults (Hasanvand, 2012).
Based on gravity contours, it can be seen a corridor within north faulted region of Qazvin. In the view of gravity, the top of this area is high gravity and it’s below is low. So the facies changes will be appearing quite. This map can be used for the changes of gravity facies of area. All of contoured maps have been drawn by Geosoft, Matlab and Surfer soft-facilities and the situation of magnetic and gravity seismic lineaments are surveyed by applying different filters. In this way, surface active-tectonic of the area and hidden fault branches have been studied (fig.16,17,18).
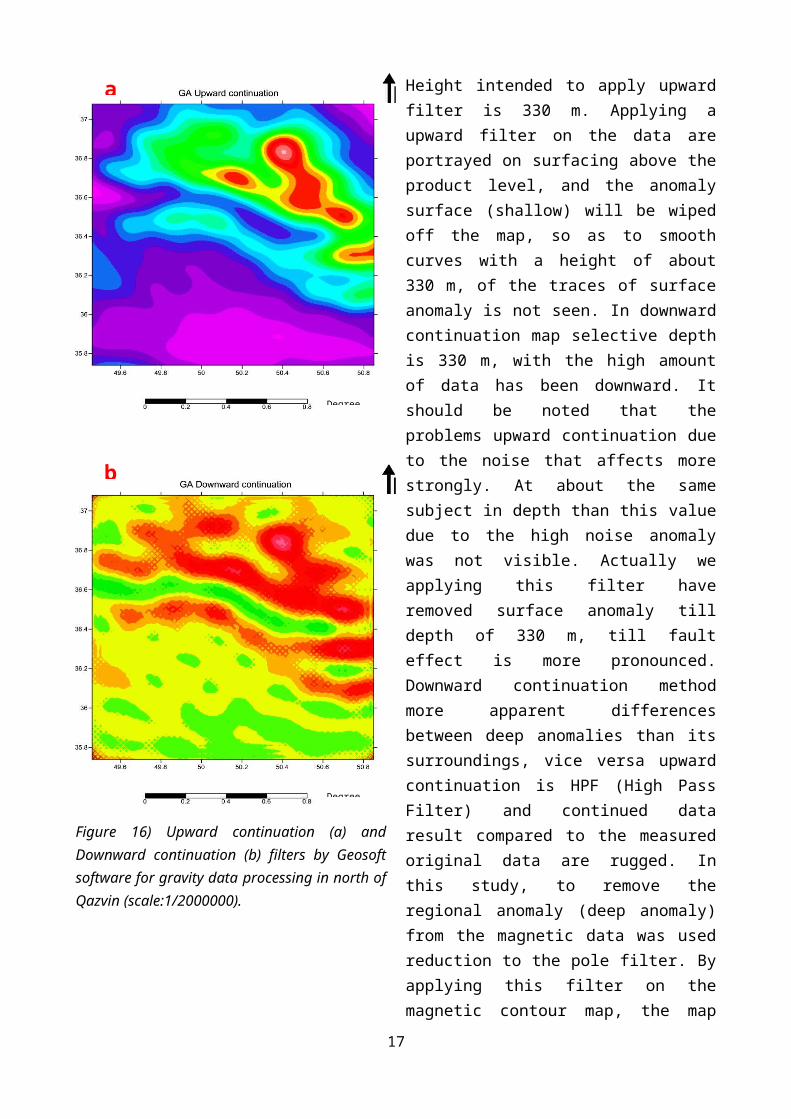
Figure 16) Upward continuation (a) and Downward continuation (b) filters by Geosoft software for gravity data processing in north of Qazvin (scale:1/2000000).
11
a
b
Degree
Degree

Height intended to apply upward filter is 330 m. Applying a upward filter on the data are portrayed on surfacing above the product level, and the anomaly surface (shallow) will be wiped off the map, so as to smooth curves with a height of about 330 m, of the traces of surface anomaly is not seen. In downward continuation map selective depth is 330 m, with the high amount of data has been downward. It should be noted that the problems upward continuation due to the noise that affects more strongly. At about the same subject in depth than this value due to the high noise anomaly was not visible. Actually we applying this filter have removed surface anomaly till depth of 330 m, till fault effect is more pronounced. Downward continuation method more apparent differences between deep anomalies than its surroundings, vice versa upward continuation is HPF (High Pass Filter) and continued data result compared to the measured original data are rugged. In this study, to remove the regional anomaly (deep anomaly) from the magnetic data was used reduction to the pole filter. By applying this filter on the magnetic contour map, the map has been slightly change and displacement and this anomaly turned to the north slightly. Before applying the RTP filter, the observed anomaly is seen to be very asymmetric. In fact the RTP filter converts magnetic anomaly in the vertical pattern. As you can see, there are both positive and negative polein places where the gradient changes. So we can say it is similar to the first derivative filter. Various methods are presented for detection boundary anomaly. Local phase filters are the combination of gravity gradients than, have produced new and powerful tool in review gravity maps and determination the gravity anomaly corners. One of these filters is the tilt angle. Tilt angle filter is given by the Eq.1 (Miller & Singh, 1994). Figure 17) (a).RTP filtering for aeromagnetic data
processing (b). TA filtering for gravity data processing by Matlab software in north of Qazvin (scale: 1/2000000).
12
a
b
Degree
Degree
Tilt Angle=tan−1[ ∂ g∂ z
√[ ∂ g∂ x ]
2
+[ ∂ g∂ y ]
2 ](1)In the above equation (Eq.1) g is gravity field, in fact it’s inverse tangent the vertical derivative
of gravity field (∂ g∂ z ) to Horizontal derivative of
gravity field¿). In this study, tilt angle filter used to as a method for locating anomaly edges and it’s purpose is gravity lineaments place can be recognized with more accurately. Also better ability to the TA filter is compared with TDX filter in detection the edges of the anomaly. The vertical gradient value at the edge of the anomaly is zero and the horizontal gradients are Maximum, therefore the value of the TA filter in edges is zero and the rest of the amount will be negative. This angle is in the range of ±90 degrees and it’s determined the corners of the anomalybetter than the analytical signal (Ebrahimzadeh Ardestani, 2009).
The contour map of gravity apply the filter tilt angle, the minimum value of the local phase (Dark blue areas), zones are with slow and negligible gravity changes and those are explanatory the boundary of the anomaly, and vice versa the maximum value of the local phase (white areas), zones are with intense and sharp gravity changes and the anomaly edges and corners is more prominent. Analytical signal is a combination of horizontal and vertical gradients of potential field data, the maximum amount is placed on the mass edges. The advantage of this method is, not dependent analytical signal measure on the characteristics of the magnetization vector of mass disruption and the vector of magnetic field (Nabighian, 1972).
Figure 18) Analytical signal (TDX) filtering for gravity data processing by Matlab software in north of Qazvin (scale: 1/2000000).
Analytic signal was defined first time for two-dimensional objects the following equations:
A ( x , y )=∂ g∂ x
i+ ∂ g∂ y
j(2)
|A (x , y )|=√( ∂ g∂ x )
2
+( ∂ g∂ y )
2
(3)
In the Eq.3, |A (x , y )| is two-dimensional analytic signal amplitude in position ( x , y ) and g is gravity field measurements in position ( x , y ). This method is based on the taking the derivative in different directions and then vector sum of the derivatives, that the edges of the anomaly will be clear better (Mansourian & Nourouzi, 2007).
With the help of the TDX filter position of faults outcrop is estimated more accurately that, correspond with the evidence in the geological map of the area.
13
Degree
At the end, the hidden fault branches and gravity lineaments of area have been identified and confirmed by overlap of gravity contours and airborne magnetic of the area with the Berberian faulted pattern (fig.19).
In maps (fig.19) Berberian faulted system (observed faults) is shown with red dotted lines & new linements are shown with yellow lines. As the clear from the fig.19, in many cases linement and Berberian faulted system have confirmed each other, but in cases added the linements visible to hidden faults. Using of geology map of the area and drawing gravity facies map by changes of rocks density. It’s necessary to say, the changes of gravity facies of the stratigraphy units are along with density changes. To analysis this pattern have been used geology data of geo reference according to coordinates in GIS. So the map of gravity changes is drawn to check fabrics that are between formations or not (fig.20).
In facies map, the No.1 lineament is being start along eastern-western from 36.°25´ latitude and 50.°5´ longitude and is issued from east part of the area with approximately 38/9 km on 36.°20´ latitude and 50.°85´ longitude and No.4 lineament along north-western, south-eastern is being start from 36.°55´ latitude and 50.°35´ longitude is issued from east part of the area with approximately 44/5 km on 36.°4´ latitude and 50.°70´ longitude. Because these two mentioned faultare confirmed by magnetic, gravity and geology. So are introduced as a seismic fault branching which aren’t pointed in the Berberian fault map, while recorded earthquakes around them can be the confirmation of that. Such this kind of hidden fault are covered by alluvial quaternary and can’t be recognized on the earth. Figure 19) The overlap map of airborne magnetic
contour (a) and airborne gravity contour (b) with Berberian seismic system pattern (1992) (scale: 1/2000000).
14
a
b
Degree
Degree
4
3
89
10
12
56
7
109
34
56
8
7
1
2

Figure 20) The map of gravity facies of the area adapted from geological map (scale: 1/2000000).
6– Conclusion
In this study, by combining neotectonic evidence, aeromagnetic data, gravity data and seismic data, can better quantify the seismic potential of regions where strain rates are high, and identify blind faults mechanisms. This research turns into a scientific research by using seismic catalogues as the real events, gravity data and airborne magnetic, that are prepared due to high quality in appearance from geological organization and discovering the subsurface of structural phenomena and it’s result can be used as a reasonable and reliable sources. In this research, at first seismic lineaments were extracted and identified by using of seismic catalogue of zone and based on the changes of gradient magnitude earthquake are occurred during a
period of around 51 years. Then the lineaments of seismic gravity and magnetic were extracted and identified by using of the gravity and magnetic airborne data and according to the gradient changes of the gravity and magnetic field strength. In cases that, the seismic lineaments are confirmed each other at least based on two geophysical parameters that consisted of three seismic, gravity and magnetic parameters that absolutely are introduced as a seismic lineament also in most cases the prepared patterns are matched with Berberian patterns (1992) and in some cases the hidden and burial branches of fault are introduced from NQF. In fact with argument about gravity facies changes, we can prove better the
15
Degree
existence of fault in the view of gravity. Based on the result has gotten from this research found that the specified fault No.1 and No.4 which are in the eastern-northern area are the new fault branches and confirmed by map of magnetic, gravity and geology. Also gravity lineament 3,6,7,10 on the gravity facies of the area map. But lineament 3 & 7 are matched with Berberian faulted map and the registration of two current earthquake with 2.7 richter magnitude, 38 km from Qazvin and 2.9 richter, 20 km from Razmian city (north of Qazvin province) along with new fault branch (lineament No.4) is a confirmation for this truth. But since the fault No.1 and No.4 are existed with undeniable and tough scientific evidence, So they can be a new fault branch and cause to happening of earthquake and be recognized as a new dangerous area.
Acknowledgments:
The authors would like to thank Dr. R. Mehrnia and Dr. B. Babaei for their kind and careful comments that made the manuscript improved.
References:-Ambraseys, N.N., and Melvilla, C.P., 1982. A history of Persian earthquakes, combridge university press, combridge, England. Gheophysical Research Letters: 53, 705-740.
-Aleaster, M., 2001. Aghvaran license report relevant to Mianeh target area in Estern Azerbaijan province of Iran. submitted to karand: 40, 221-233.
-Aghanabati, A., 2004. Geology of Iran. Geological Survey and State Mineral Exploration. Tehran: 1-708.
-Ardestani Ebrahimzadeh, V., 2009, Applied Gravity (mineral exploration, engineering geology). Tehran, Institute of Tehran University, first edition, n. 3121.
-Berberian, M. and Yeats, R. S., 1999. Pattern of historical earthquake rupture in the Iranian plateau. Bulletin of the Seismological Society of America: 89, 120-139.
-Bull, W. B., 2007. Tectonic geomorphology of mountains: A new approach to paleoseismology. Blackwell publishing: 1-376.
-Hesami, H., Jamali, F., Tabasi, H., 2003. Explanatory Notes to the Map of Major Active Faults of Iran. JSEE: 8, 1-11.
-Hasanvand, Sh., 2012. Identify Gravity-magnetic Fabric associated with Seismic faulted system in the quadrate of Tabriz-Poldasht, M.Sc thesis, Islamic Azad University of Hamedan: 1-50.
-Sardashti, M., 2004. Lineaments pattern of destructive earthquakes in Taleghan basin using GIS and Remote Sensing (RS), M.Sc thesis, Shahid Beheshti University: 21-26.
-Schmidt, A., Horsley, T. and Fazeli, H., 2005. Tepe Ghabristan: A chalcolithic Tell Buried in Alluvium. 6th International Conference on Archaelogical Prospection, Rome: 1-15.
-Mansourian, E., and Nourouzi, GH., 2007. To determine the depth of the magnetic body using analytical signal. Thirteenth Iranian Geophysical Conference: 166-169.
-Nabighian, M. N., 1972. The analytic signal of two-dimensional magnetic bodies with polygonal cross-section: its properties and use for automated anomaly interpretation. Jornal of Applied Geophysics: 37, 507-517.
-Sardashti, M., 2004. Lineaments pattern of destructive earthquakes in Taleghan basin using GIS and Remote Sensing (RS), M.Sc Thesis, Shahid Beheshti University: 21-26.
-Site of National Geoscience Database of Iran (WWW.NGDIR.IR).
16
-Site of International Institute of Earthquke Engineering and Seismology (WWW.IIEES.IR).
-Site of Geological Survey of Iran (WWW.GSI.IR).
-Taherkhani, B., Pourkermani, M., Arian, M., Nazari, H., 2010. North of Qazvin fault scope from the perspective active tectonic. the first meeting of the national conference reviews the achievements of Iranian scholars Earth Sciences: 38, 1-8.
17