biblio.ugent.be · web viewtotal word count: 10,943 authors’ note this research was supported...
TRANSCRIPT
Running head: OVERCOMPENSATION AND CUSTOMER LOYALTY
How Much Compensation is Too Much? An Investigation of the Effectiveness of Financial
Overcompensation as a Means to Enhance Customer Loyalty
Tessa Haesevoetsa, Alain Van Hiela, Mario Pandelaereb,c, Dries Bostyna, & David De Cremerd
a Department of Developmental, Personality and Social Psychology; Ghent University; Henri
Dunantlaan 2, B-9000, Ghent, Belgium
b Department of Marketing; Ghent University; Tweekerkenstraat 2, B-9000, Ghent, Belgium
c Pamplin College of Business; Virginia Tech; 2023 Pamplin Hall, Blacksburg, VA 24061, USA
d Judge Business School; University of Cambridge; Trumpington Street, Cambridge CB2 1AG, UK
TOTAL WORD COUNT: 10,943
Authors’ Note
This research was supported by a research grant from the National Fund for Scientific Research-
Flanders (under grant number G095912N). Correspondence concerning this article should be
addressed to Tessa Haesevoets, Department of Developmental, Personality and Social
Psychology, Henri Dunantlaan 2, B-9000, Ghent, Belgium. E-mail:
[email protected], Tel: +32 (0)9 264 62 69, Fax: +32 (0)9 264 64 99.

OVERCOMPENSATION AND CUSTOMER LOYALTY 1
Abstract
The present paper examines the effectiveness of financial overcompensation as a means to
enhance customer loyalty after a product failure. Overcompensation implies that customers
are entitled to a refund that is larger than the purchase price. It is, however, still unclear
whether large overcompensations entail saturation effects, or alternatively, result in an actual
drop in customer loyalty. We predicted that the overcompensation–loyalty relationship is
generally characterized by an inverted U-shaped function. In line with this prediction, the
results of four studies showed that mild overcompensations had an additional positive effect
on customer loyalty beyond equal compensation, but only up to compensation levels of
approximately 150% of the purchase price of faulty products. After this optimal level had
been reached, the effectiveness of overcompensation diminished, eventually leading to a
general drop in customer loyalty. Despite this overall pattern, two studies revealed robust
individual differences in how customers react to increasing overcompensation. A majority of
customers increased their loyalty when the overcompensation enlarged, but the curve
flattened out in the high range. However, there was also a smaller portion of customers who
reacted negatively to every form of overcompensation. A practical implication of these
findings, therefore, is that companies should not offer compensations that are greater than
150% of the initial price, as these do not contribute to greater loyalty in any category of
customers.
Keywords: overcompensation; customer loyalty; curve progression; inverted U-function;
optimum; individual differences
OVERCOMPENSATION AND CUSTOMER LOYALTY 2
Introduction
Suppose that you bought a new vacuum cleaner at a nearby store. The vacuum cleaner
turned out to be malfunctioning and you decided to go straight back to the store to complain
about this. One way to settle this product failure is through a monetary reimbursement by the
store. Customers often receive compensation that exceeds the damage suffered, which is
generally referred to as overcompensation (Gelbrich & Roschk, 2011). In the example of a
malfunctioning vacuum cleaner, the store can, for instance, offer you a reimbursement that is
worth more than the original purchase price. Similarly, in case of hotel overbooking,
customers can be offered the finest suite of the hotel or, if no other room is available, a
voucher- or cash-based compensation that is worth more than the original room price (Noone
& Lee, 2011). Or, when a restaurant serves the wrong dish, it can replace the dish and
additionally offer the customer the meal for free (Hocutt, Bowers, & Donavan, 2006). Other
examples of overcompensation can be found in the context of insurance companies that
sometimes overpay material losses (Tullberg, 2006).
Despite its pervasive use and its additional financial cost to companies, it is surprising
to see that it is still unclear how overcompensation affects customers’ responses beyond
compensation that covers the damage exactly (i.e., equal compensation). This is particularly
the case in light of maintaining or even enhancing customer loyalty. From an economic
perspective, individuals are primarily concerned with maximizing their own outcomes (cf.
Camerer & Thaler, 1995; Dawes & Thaler, 1988). As a result, the greater the level of
compensation the higher the level of recovery should be. Following this “more is better”
assumption, overcompensation should be a more effective recovery remedy than equal
compensation; and, even more importantly, greater levels of overcompensation should result
in higher loyalty levels than smaller ones. In the present study we investigated whether this is
indeed the case.

OVERCOMPENSATION AND CUSTOMER LOYALTY 3
Effectiveness of Financial Overcompensation
For most companies occasional lapses in product (or service) quality are nearly
inevitable, making attempts to restore such failures highly relevant. Because the primary
reason for a complaint is often a monetary loss by the customer, reimbursing this tangible
damage is seen as vital for the recovery process. Ample studies have indicated that
compensation is indeed the key driver of satisfaction and repurchase intention after failures
(for overviews, see Davidow, 2003; Gelbrich & Roschk, 2011). Consequently, companies
might opt to provide customers as much compensation as possible, and – as illustrated by the
above mentioned examples – compensations that surpass the mere damage are frequently
employed by companies. A critical question that arises is whether such costly
overcompensations have beneficial effects on the recovery process beyond less costly equal
compensation.
Although overcompensation is an open-ended interval with no natural upper boundary,
most prior compensation studies included a maximum of two or three overcompensation
levels (e.g., Boshoff, 1997; Garrett, 1999; Gilly & Hansen, 1985; Hocutt et al., 2006; Noone
& Lee, 2011), which is insufficient to cover the broad overcompensation range. Fortunately,
there is a recent study by Gelbrich, Gäthke, and Grégoire (2015) in which the effectiveness of
11 compensation levels (ranging from 0% to 200% of the loss, in steps of 20%) were
compared. Importantly, although Gelbrich and colleagues included a total of 11 compensation
levels, only five of these were larger than the loss and can hence be categorized as
overcompensations (i.e., 120%, 140%, 160%, 180%, and 200%). In this overcompensation
range, the compensation–satisfaction relationship was represented by a concave curve. Small
amounts of overcompensation were more effective than equal compensation. However, there
was some level of discrepancy between the estimated curve and the actual observations in the
higher range of overcompensations. Specifically, for larger overcompensations the estimated
OVERCOMPENSATION AND CUSTOMER LOYALTY 4
curve showed a downward slope when customers rejected a flawed service, but a further
examination of the observed mean values indicates a saturation effect instead of a negative
return. Consequently, Gelbrich et al. noted the following: “As the observed means seem to
indicate saturation, we suggest collecting additional data for extreme values to better
understand this pattern (…). Such research could confirm a saturation effect or may find a
true negative effect” (p. 119).
In reaction to this observation, an important aim of the present research was to
investigate the curve progression between overcompensation and recovery in greater detail, in
order to unravel whether high amounts of overcompensation lead to a saturation effect
(resulting in a flattening curve) or a true negative effect (leading to a downstream curve). In
both cases, the overcompensation becomes cost-ineffective at a certain point, but a
downstream curve would even indicate that costly overcompensation may in fact harm the
interests of companies. In this vein, we also aimed to identify the optimal overcompensation
level that results in the highest degree of recovery. Further, we also explored if there are
individual differences in how customers respond to different levels of overcompensation.
Curve Progression
In the present study customer loyalty – a multiple dimensional construct that includes,
besides repurchase intention, the willingness to recommend a company to others and to return
to a company in the future (see Lam, Shankar, Erramilli, & Murthy, 2004; Webster &
Sundaram, 1998) – was investigated as the main outcome variable. We started from the basic
assumption that the degree of customer loyalty may depend on the overcompensation size (cf.
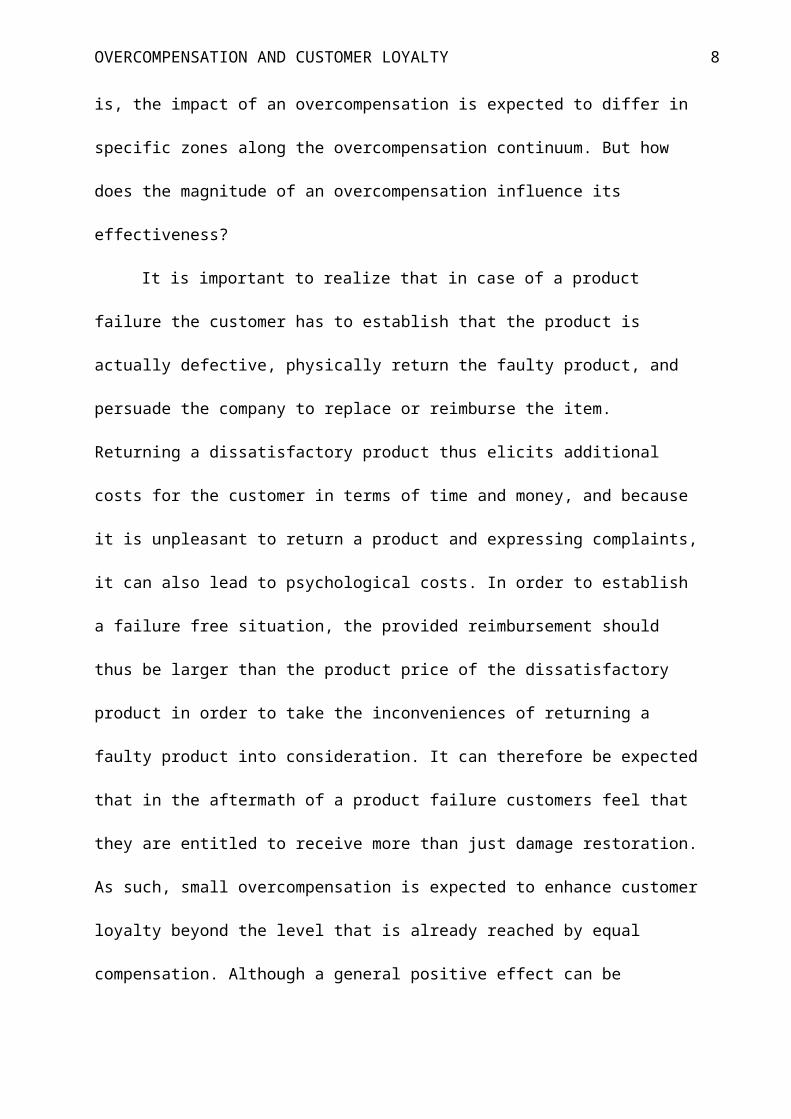
Gelbrich et al., 2015). That is, the impact of an overcompensation is expected to differ in
specific zones along the overcompensation continuum. But how does the magnitude of an
overcompensation influence its effectiveness?

OVERCOMPENSATION AND CUSTOMER LOYALTY 5
It is important to realize that in case of a product failure the customer has to establish
that the product is actually defective, physically return the faulty product, and persuade the
company to replace or reimburse the item. Returning a dissatisfactory product thus elicits
additional costs for the customer in terms of time and money, and because it is unpleasant to
return a product and expressing complaints, it can also lead to psychological costs. In order to
establish a failure free situation, the provided reimbursement should thus be larger than the
product price of the dissatisfactory product in order to take the inconveniences of returning a
faulty product into consideration. It can therefore be expected that in the aftermath of a
product failure customers feel that they are entitled to receive more than just damage
restoration. As such, small overcompensation is expected to enhance customer loyalty beyond
the level that is already reached by equal compensation. Although a general positive effect
can be expected from small overcompensation, prior research indicates that especially large
amounts of cash-based overcompensation are not well received by customers (see Estelami &
De Maeyer, 2002; also see Garrett, 1999; Noone & Lee, 2011, for some examples). In this
light, it can be expected that, from a particular level onwards, the overcompensation will be
perceived as too much, and as such could result in a decay in customer loyalty.
Taken together, we hypothesize that the effect of overcompensation on customer
loyalty will be characterized by an inverted U-shaped function: As the level of
overcompensation increases, customer loyalty also improves, but only to a certain point
beyond which an increase in overcompensation generates a drop in customer loyalty. In the
present contribution we aimed to identify the optimal overcompensation level that produces
the highest level of customer loyalty.
Individual Differences
Prior studies investigating overcompensation effects all employed between-subject
designs in which participants were confronted with only one single compensation level (see
OVERCOMPENSATION AND CUSTOMER LOYALTY 6
Boshoff, 1997; Estelami & De Maeyer, 2002; Gelbrich et al., 2015; Garrett, 1999; Hocutt et
al., 2006; Noone & Lee, 2011). As a result, these studies did not incorporate analyses of how
people react to different overcompensation sizes, and as such these studies were not suited to
thoroughly investigate the role of individual differences. Although we expect that the curve
between overcompensation and customer loyalty is inverted U-shaped, it is possible that there
are individual differences in how customers respond to various overcompensation levels.
Indeed, the presence of a general trend does not preclude the possibility of different classes of
individuals, all reacting differently to increasing levels of overcompensation.
In this regard, it can be expected that there are customers for whom loyalty increases
with extra overcompensation and customers for whom loyalty decreases with extra
overcompensation. A salient group, at least in theoretical terms, might be labelled as “homo
economicus” (or economic man). This concept portrays humans as consistently rational and
narrowly self-interested agents who usually pursue to maximize utility as a consumer (see
Rittenberg & Tregarthen, 2012; also see Camerer & Thaler, 1995; Dawes & Thaler, 1988).
Because in economic terms larger compensations result in better outcomes for the customer,
for these people it can be expected that the greater the level of compensation, the higher the
level of recovery will be. As such, for this subset of customers it is expected that
overcompensation results in higher loyalty ratings than equal compensation (cf. Boshoff,
1997; Gilly & Hansen, 1985, Hocutt et al., 2006), and, even more importantly, that greater
levels of overcompensation result in higher loyalty ratings than smaller ones (cf. Gelbrich et
al., 2015).
However, this particular group should be accompanied by other groups of customers
given the evidence that rather high overcompensation results in similar or even lower levels of
customer loyalty than equal compensation (see Garrett, 1999; Estelami & De Maeyer, 2002;
Noone & Lee, 2011; also see Haesevoets, Reinders Folmer, De Cremer, & Van Hiel, 2013;

OVERCOMPENSATION AND CUSTOMER LOYALTY 7
Haesevoets, Van Hiel, Reinders Folmer, & De Cremer, 2014). A possible other group of
costumers might be those who react negatively to every form of overcompensation, resulting
in an immediate decline in customer loyalty once the compensation transcends the point of
equality. Indeed, many people prefer equal outcomes over unequal outcomes (Loewenstein,
Thompson, & Bazerman, 1989). Moreover, inequality is not only considered to be unwanted
when one receives less than another party, but receiving more than others is generally
considered to be undesirable too (see Blount, 1995; Dana, Cain, & Dawes, 2006). Given that
overcompensation is a form of advantageous inequality, customers may feel guilty and
indebted to the provider of the compensation as they believe that they are getting much more
than they deserve (Garrett, 1999; McCollough, Berry, & Yadav, 2000). Their might thus also
be a subset of customers for whom greater levels of overcompensation result in lower levels
of customer loyalty than smaller ones.
However, as we are unaware of any study of individual differences in the context of
overcompensation, the present exploration may yield other classes of individuals showing
distinct reactions across the range of overcompensations. Moreover, rising and falling curves
are not necessarily linear but might instead be quadratic. In the present research we employed
within-subject design studies in which each participant had to rate multiple overcompensation
levels in order to examine the existence of these individual difference patterns.
The Present Studies
The goals of the present study were twofold. First, we aimed to determine the exact
nature of the relationship between the level of overcompensation and the degree of customer
loyalty, because especially in the high overcompensation range it is still unclear whether in
general terms the compensation–loyalty curve flattens or actually declines. If too much
compensation is offered to customers, companies are unnecessarily wasting money, even at
the risk of adverse effects on customer loyalty. In this venture, the present research meets the
OVERCOMPENSATION AND CUSTOMER LOYALTY 8
call of ample scholars (e.g., Davidow, 2003; Estelami & De Maeyer, 2002; Gelbrich et al.,
2015; Gelbrich & Roschk, 2011) who have argued that it is vital for companies to identify the
point from which more compensation becomes too much. In this light, we also aimed to
identify the optimal level of overcompensation that generates the highest degree of customer
loyalty. Moreover, although the relationship between overcompensation and customer loyalty
is generally expected to be characterized by an inverted U-curve, customers might react
differently to various overcompensations. The second aim of our research was therefore to
investigate if there are robust individual differences in how customers react to increasing
levels of overcompensation. No prior studies, at least to our knowledge, have investigated
such individual differences.
In order to achieve these two goals, we conducted four studies in which we
systematically studied the overcompensation continuum by including a wide range of
different overcompensation levels and by using different study methods. More precisely, in
the first study participants were asked to evaluate one single compensation level, whereas in
the latter three studies participants had to rate multiple compensation levels (both separately
and in pairs).
Study 1
Similarly to the research of Gelbrich and colleagues (2015), we investigated the
overcompensation continuum using a design in which the different compensation levels were
manipulated between-subjects. In order to better understand the slope of the compensation–
loyalty curve in the high overcompensation range (flat or declining), we followed these
authors’ suggestion to include more extreme overcompensation values. In this light, in
addition to a 100% and 150% compensation level, we included two more extreme
overcompensation amounts which covered 300% and 500% of the product price of a
dissatisfactory product.
OVERCOMPENSATION AND CUSTOMER LOYALTY 9
Method
Participants and Design. A sample of 192 US citizens (92 men, 100 women, Mage =
34.22, SD = 12.13) was recruited through Amazon Mechanical Turk, which has been
demonstrated to be an appropriate method of recruiting participants (Buhrmester, Kwang, &
Gosling, 2011; Hauser & Schwarz, 2016; Paolacci & Chandler, 2014). Participants completed
a scenario study in exchange for payment. To safeguard data quality, we implemented
multiple attention checks spread throughout the study. One participant (0.5%) was excluded
from further analyses because he failed on these check questions; three additional participants
(1.6%) were excluded because they were unable to answer our manipulation check regarding
the received compensation level correctly. Participants were randomly assigned to one
condition of a 4-level (compensation level: 100%, 150%, 300%, and 500% of the purchase
price) between-subjects design.
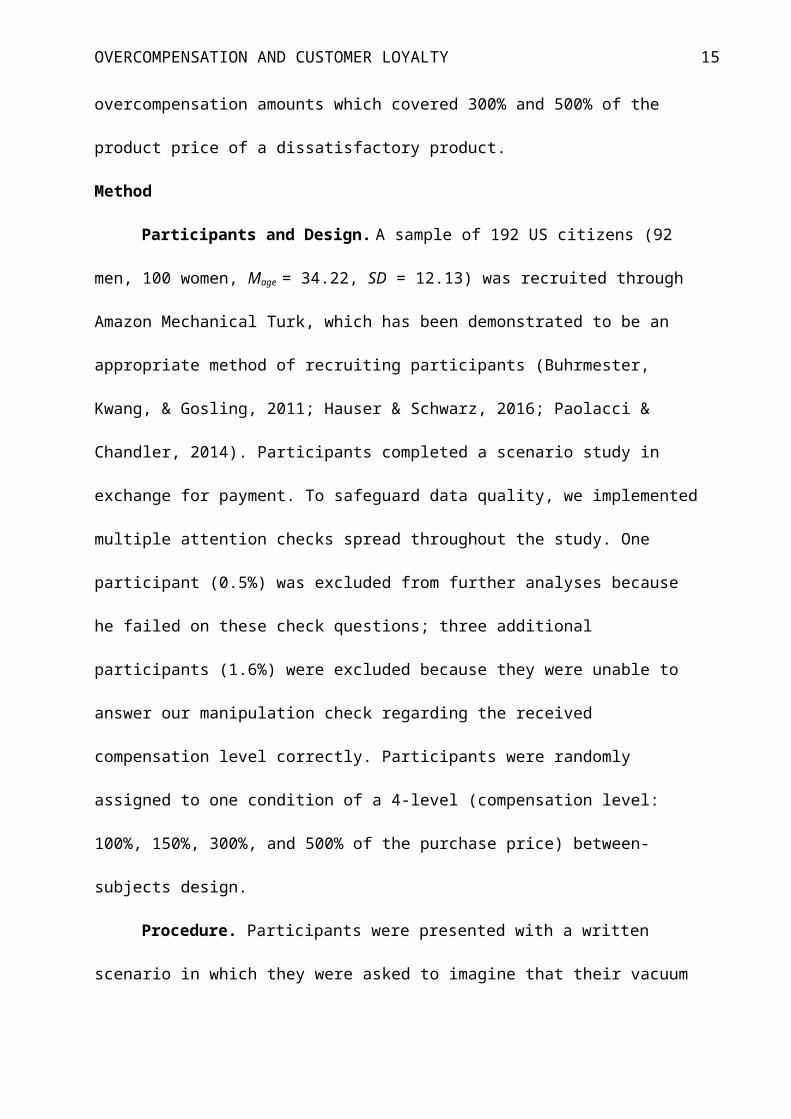
Procedure. Participants were presented with a written scenario in which they were
asked to imagine that their vacuum cleaner broke down and that they paid $100 for a new one
at a nearby store. When participants returned home, their new vacuum cleaner turned out to be
malfunctioning. Participants were then asked to imagine that they returned to the store to
complain about this product failure. Subsequently, participants were informed that the store
reacted to this failure by offering them a compensation that exactly covered the purchase price
(i.e., $100) in the equal compensation condition, or a compensation that was larger than the
purchase price in the three overcompensation conditions (i.e., $150, $300, or $500).
Measures. Following Gelbrich et al. (2015), we first checked the effectiveness of the
compensation manipulation using an open-ended question about the perceived monetary value
of the remuneration. More specifically, we asked participants: “How much money did you
receive from the store as compensation for your broken vacuum cleaner?” Next, customer
loyalty was measured with a four item scale. These items are based on former scales that
OVERCOMPENSATION AND CUSTOMER LOYALTY 10
probed different indicators of customer loyalty (see Butcher, Sparks, & O’Callaghan, 2002;
Grewal, Roggeveen, & Tsiros, 2008; Lam et al., 2004). More precisely, we asked participants
to rate the following items, after receiving this compensation: “I am planning to purchase
products at this store in the future” (repurchase), “I look forward to return to this store again”
(return), “I will recommend this store to a friend who seeks my advice” (recommend), and “I
will buy more products in this store again in the future” (patronage) (1 = not at all, 7 = very
much; M = 5.14, SD = 1.64, Cronbach alpha = .97).
Results
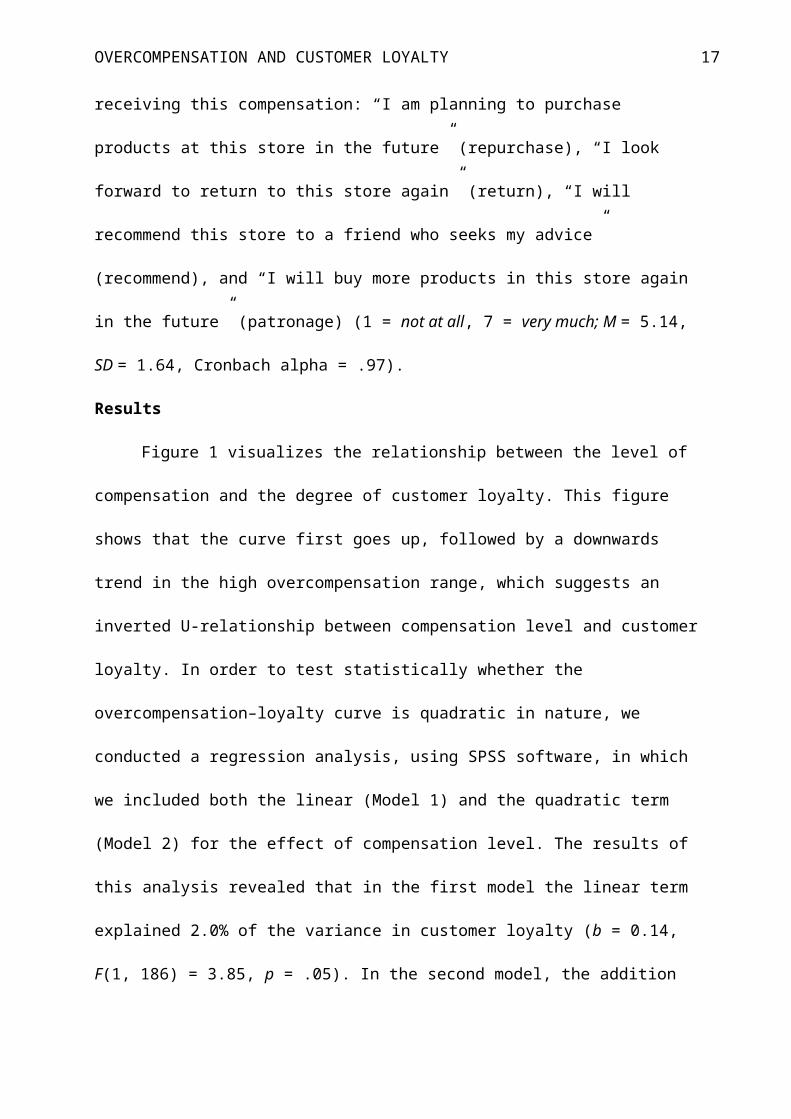
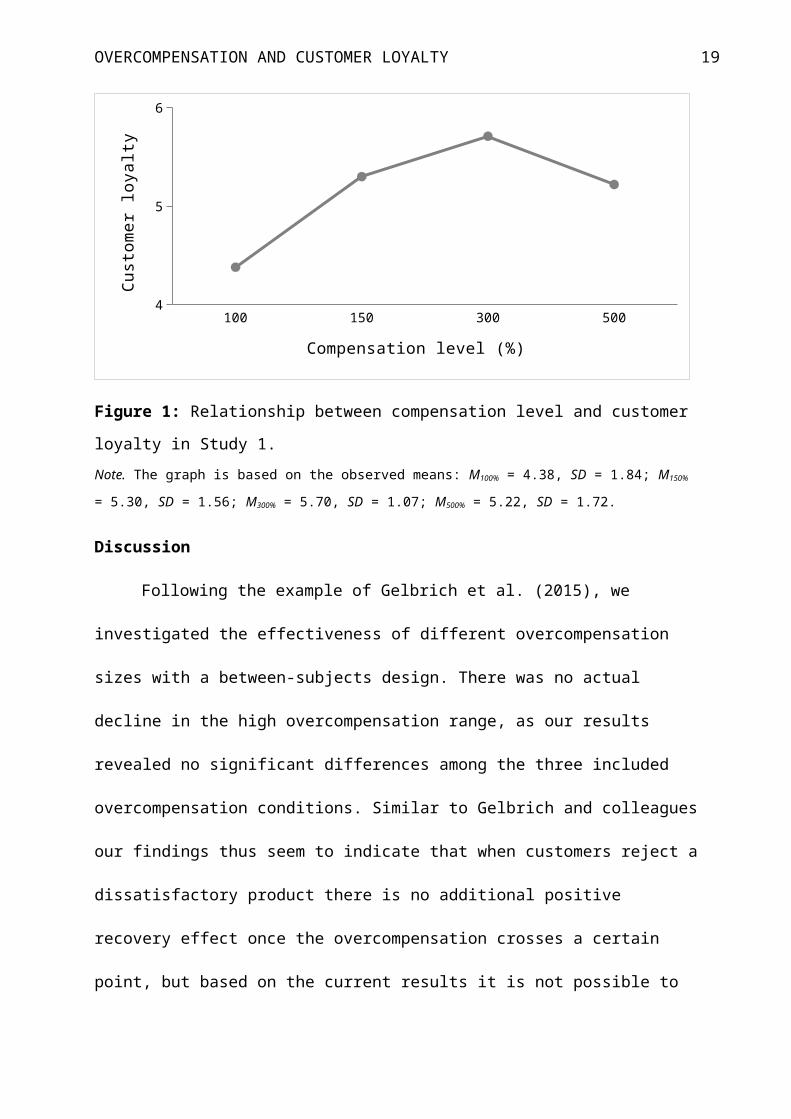
Figure 1 visualizes the relationship between the level of compensation and the degree
of customer loyalty. This figure shows that the curve first goes up, followed by a downwards
trend in the high overcompensation range, which suggests an inverted U-relationship between
compensation level and customer loyalty. In order to test statistically whether the
overcompensation–loyalty curve is quadratic in nature, we conducted a regression analysis,
using SPSS software, in which we included both the linear (Model 1) and the quadratic term
(Model 2) for the effect of compensation level. The results of this analysis revealed that in the
first model the linear term explained 2.0% of the variance in customer loyalty (b = 0.14, F(1,
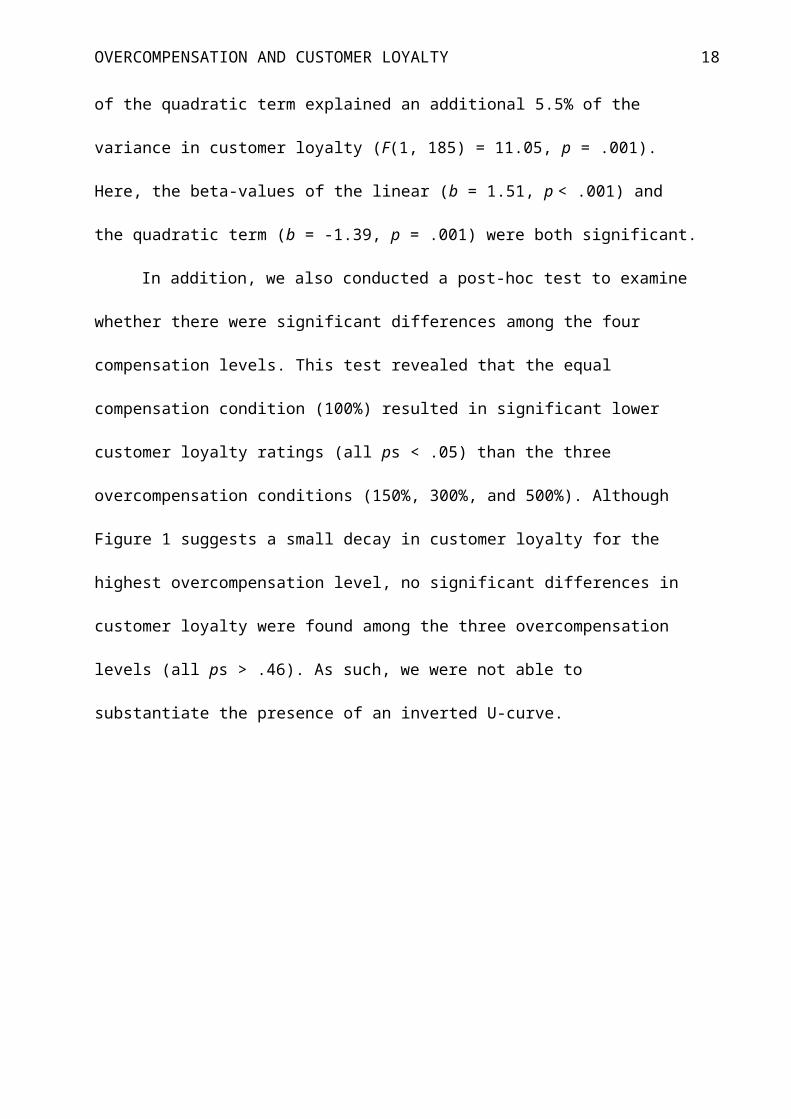
186) = 3.85, p = .05). In the second model, the addition of the quadratic term explained an
additional 5.5% of the variance in customer loyalty (F(1, 185) = 11.05, p = .001). Here, the
beta-values of the linear (b = 1.51, p < .001) and the quadratic term (b = -1.39, p = .001) were
both significant.
In addition, we also conducted a post-hoc test to examine whether there were
significant differences among the four compensation levels. This test revealed that the equal
compensation condition (100%) resulted in significant lower customer loyalty ratings (all ps <
.05) than the three overcompensation conditions (150%, 300%, and 500%). Although Figure 1
suggests a small decay in customer loyalty for the highest overcompensation level, no

OVERCOMPENSATION AND CUSTOMER LOYALTY 11
significant differences in customer loyalty were found among the three overcompensation
levels (all ps > .46). As such, we were not able to substantiate the presence of an inverted U-
curve.
100 150 300 5004
5
6
Compensation level (%)
Cus
tom
er lo
yalty
Figure 1: Relationship between compensation level and customer loyalty in Study 1. Note. The graph is based on the observed means: M100% = 4.38, SD = 1.84; M150% = 5.30, SD = 1.56; M300% = 5.70,
SD = 1.07; M500% = 5.22, SD = 1.72.
Discussion
Following the example of Gelbrich et al. (2015), we investigated the effectiveness of
different overcompensation sizes with a between-subjects design. There was no actual decline
in the high overcompensation range, as our results revealed no significant differences among
the three included overcompensation conditions. Similar to Gelbrich and colleagues our
findings thus seem to indicate that when customers reject a dissatisfactory product there is no
additional positive recovery effect once the overcompensation crosses a certain point, but
based on the current results it is not possible to draw a firm conclusion regarding the location
of this particular point, and the effectiveness of overcompensation after this point (flat or
declining).

OVERCOMPENSATION AND CUSTOMER LOYALTY 12
Importantly, the use of between-subjects designs to investigate preferences for
different compensation levels is associated with some disadvantages. An important limitation
of manipulating compensation levels between-subjects is that participants only have to judge
one single compensation level. By using a within-subjects design in which the same
participants have to judge multiple compensation levels, more fine-grained analyses can be
conducted. Based on the evaluability framework, customers are expected to be more sensitive
to differences in overcompensation sizes when they evaluate multiple compensation levels
than when they are confronted with only one compensation level (see Hsee, 1996; Hsee,
Loewenstein, White, & Bazerman, 1999; Hsee & Zhang, 2010).
In this regard, Bazerman, Loewenstein, and White (1992) have made an important
distinction between two methods that can be used to evaluate multiple alternatives, that is,
participants can be forced to choose one preferred option among two or more alternatives, or
be asked to judge multiple alternatives separately. In the next study, we used the first method
in which participants had to judge different compensation levels in pairs, and indicate which
of the two levels they preferred. Such a method of paired comparisons allows an explicit
comparison of many different compensation levels as well as the estimation of a curve that
visually displays the nature of the relationship between the level of overcompensation and the
degree of customer loyalty. Moreover, this method also provides a useful way to determine
the optimal level of overcompensation that results in the highest degree of customer loyalty.
Study 2
Method
Participants and Design. A total of 19 undergraduate university students (3 men, 16
women, Mage = 22.89, SD = 3.81) of different faculties (i.e., psychology and educational
sciences, political and social sciences, arts and philosophy, medicine and health sciences, and
law) participated in this study in exchange for payment. In the current study, the

OVERCOMPENSATION AND CUSTOMER LOYALTY 13
compensation levels ranged from 100% up till 200% of the purchase price of a dissatisfactory
product, in small steps of 5%. This implies that in total 21 compensation levels were included.
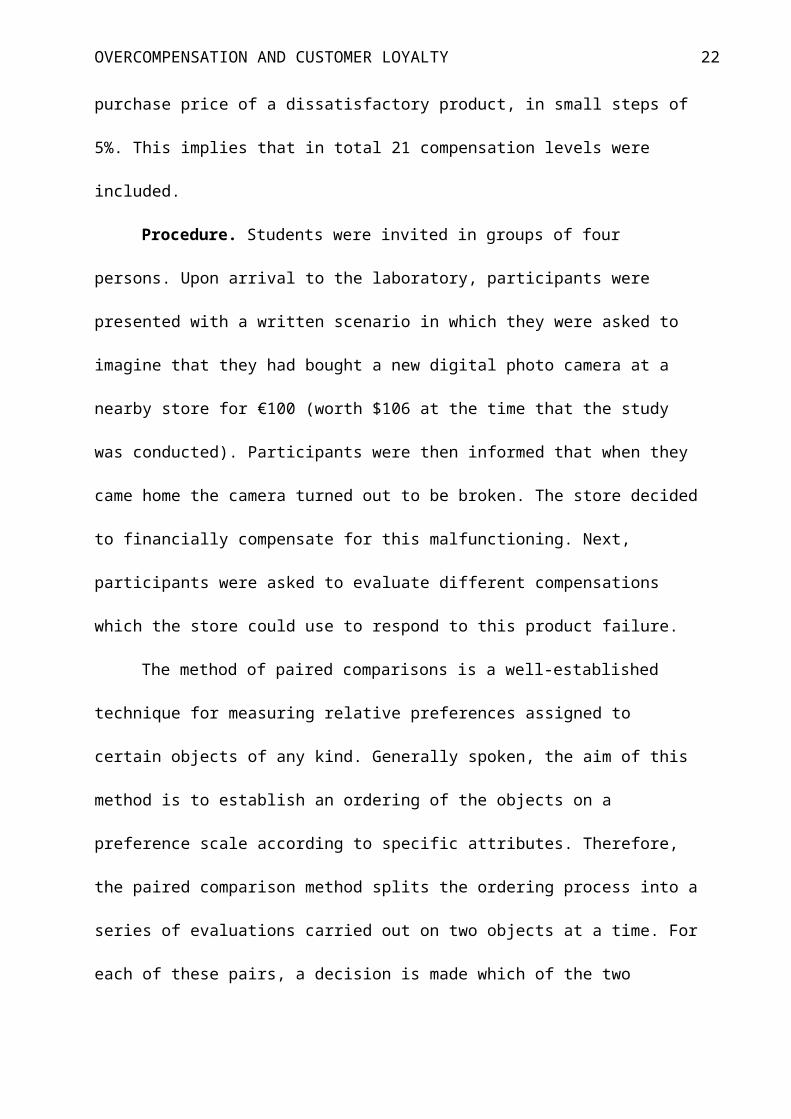
Procedure. Students were invited in groups of four persons. Upon arrival to the
laboratory, participants were presented with a written scenario in which they were asked to
imagine that they had bought a new digital photo camera at a nearby store for €100 (worth
$106 at the time that the study was conducted). Participants were then informed that when
they came home the camera turned out to be broken. The store decided to financially
compensate for this malfunctioning. Next, participants were asked to evaluate different
compensations which the store could use to respond to this product failure.
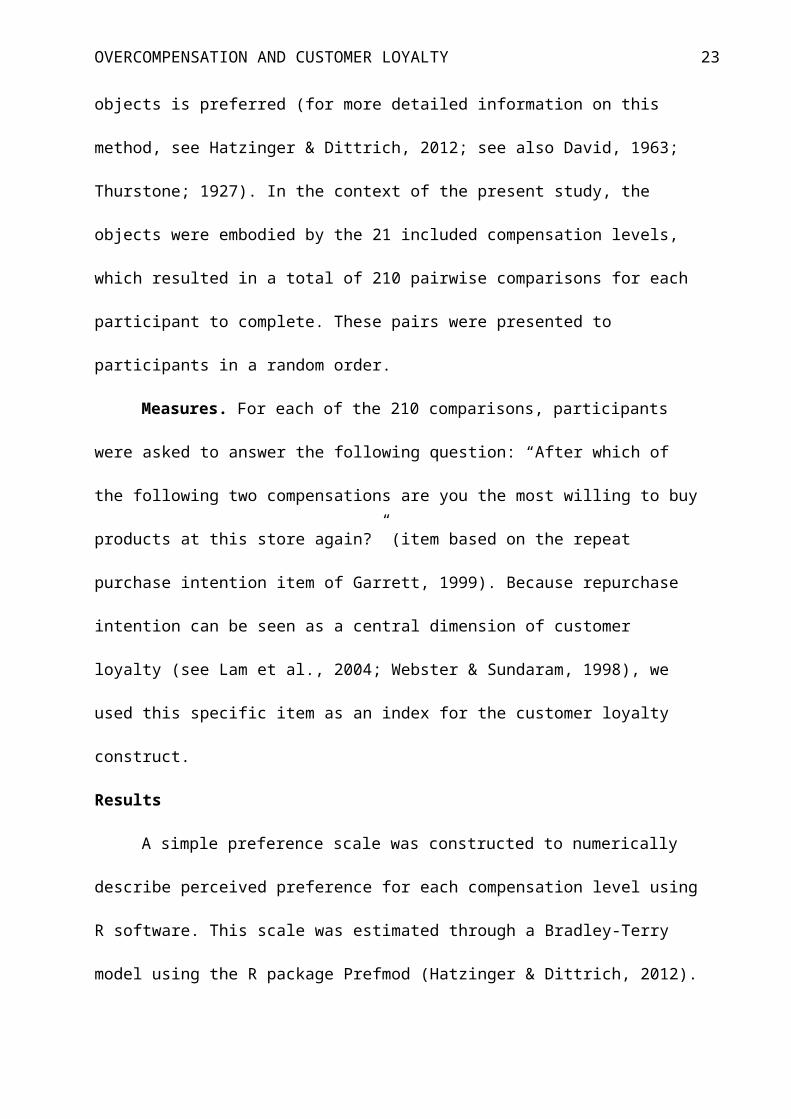
The method of paired comparisons is a well-established technique for measuring
relative preferences assigned to certain objects of any kind. Generally spoken, the aim of this
method is to establish an ordering of the objects on a preference scale according to specific
attributes. Therefore, the paired comparison method splits the ordering process into a series of
evaluations carried out on two objects at a time. For each of these pairs, a decision is made
which of the two objects is preferred (for more detailed information on this method, see
Hatzinger & Dittrich, 2012; see also David, 1963; Thurstone; 1927). In the context of the
present study, the objects were embodied by the 21 included compensation levels, which
resulted in a total of 210 pairwise comparisons for each participant to complete. These pairs
were presented to participants in a random order.
Measures. For each of the 210 comparisons, participants were asked to answer the
following question: “After which of the following two compensations are you the most
willing to buy products at this store again?” (item based on the repeat purchase intention item
of Garrett, 1999). Because repurchase intention can be seen as a central dimension of
customer loyalty (see Lam et al., 2004; Webster & Sundaram, 1998), we used this specific
item as an index for the customer loyalty construct.
OVERCOMPENSATION AND CUSTOMER LOYALTY 14
Results
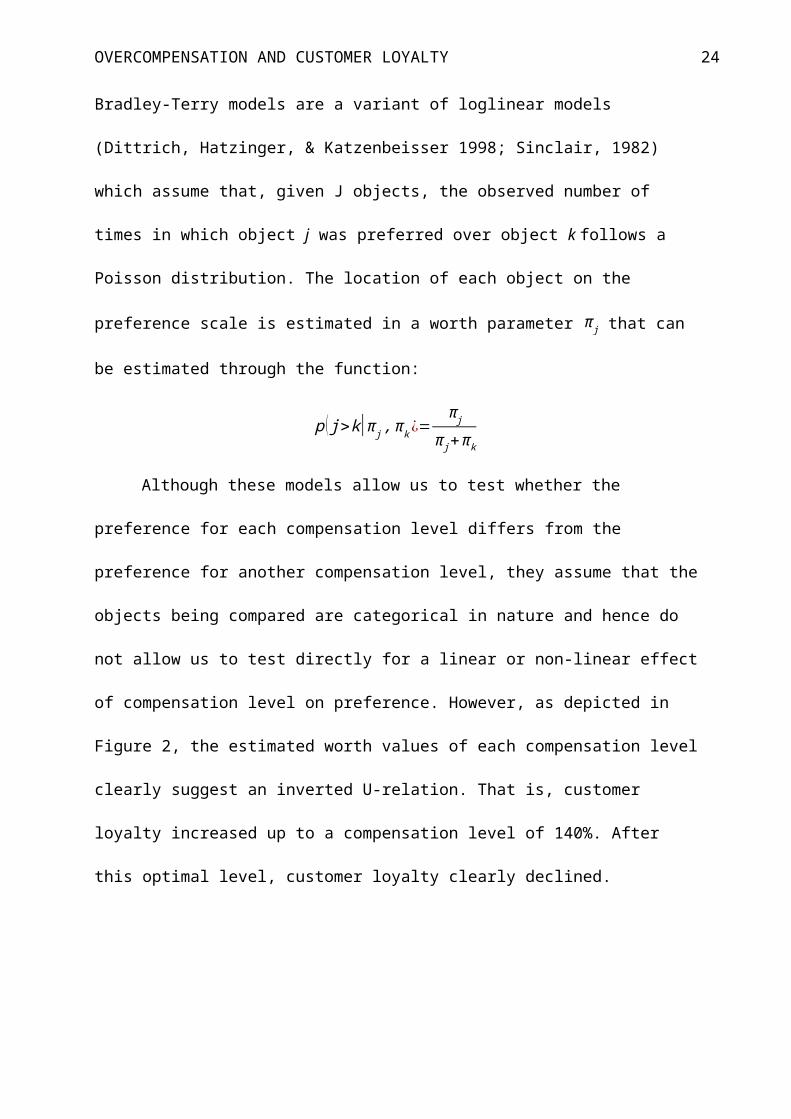
A simple preference scale was constructed to numerically describe perceived
preference for each compensation level using R software. This scale was estimated through a
Bradley-Terry model using the R package Prefmod (Hatzinger & Dittrich, 2012). Bradley-
Terry models are a variant of loglinear models (Dittrich, Hatzinger, & Katzenbeisser 1998;
Sinclair, 1982) which assume that, given J objects, the observed number of times in which
object j was preferred over object k follows a Poisson distribution. The location of each object
on the preference scale is estimated in a worth parameter π j that can be estimated through the
function:
p ( j>k|π j , πk ¿=π j
π j+πk
Although these models allow us to test whether the preference for each compensation
level differs from the preference for another compensation level, they assume that the objects
being compared are categorical in nature and hence do not allow us to test directly for a linear
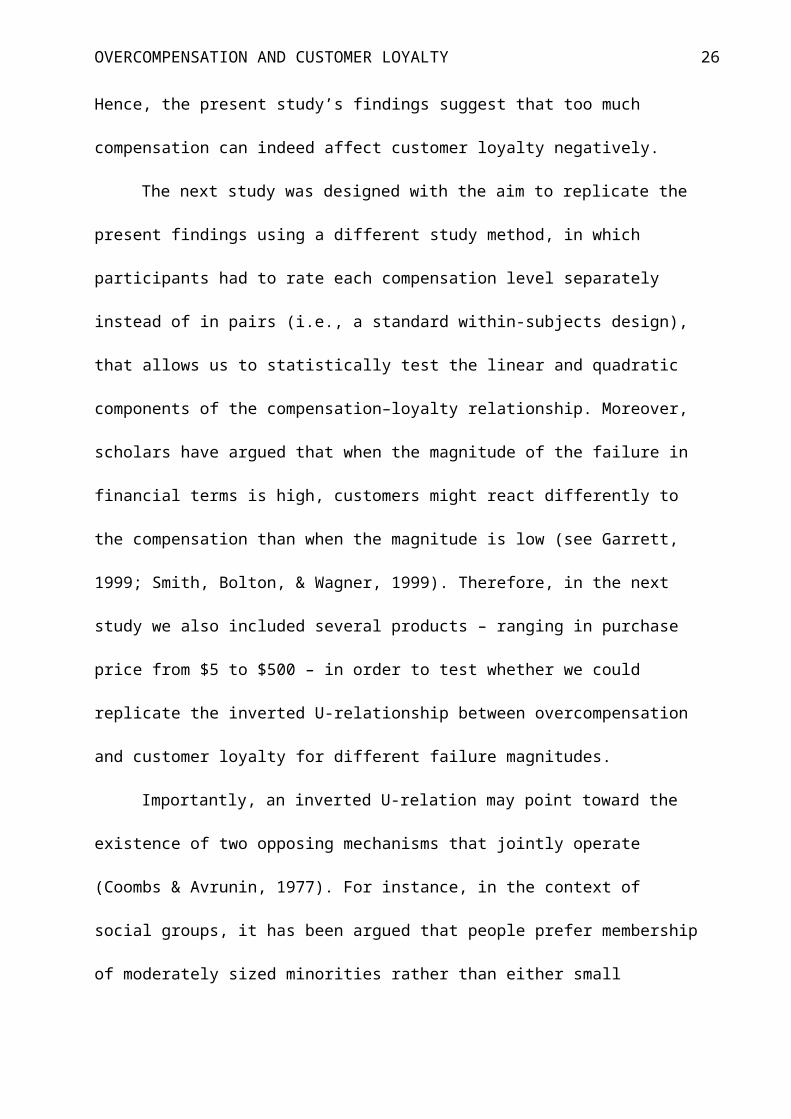
or non-linear effect of compensation level on preference. However, as depicted in Figure 2,
the estimated worth values of each compensation level clearly suggest an inverted U-relation.
That is, customer loyalty increased up to a compensation level of 140%. After this optimal
level, customer loyalty clearly declined.
OVERCOMPENSATION AND CUSTOMER LOYALTY 15
100 105 110 115 120 125 130 135 140 145 150 155 160 165 170 175 180 185 190 195 2000
0.01
0.02
0.03
0.04
0.05
0.06
0.07
Compensation level (%)
Cus
tom
er lo
yalty
(wor
th p
aram
eter
)
Figure 2: Relationship between compensation level and customer loyalty in Study 2. Note. Worth parameter: Given two compensation levels j and k, the probability that compensation level j is
preferred over compensation level k is given by the worth of j divided by the sum of the worth of j and the worth
of k. The line represents a loess-curve fitted to the predicted worth values for visualization purposes.
Discussion
The present study provides some initial evidence for the predicted inverted U-curve
between level of overcompensation and degree of customer loyalty. Especially, in the present
study the ideal overcompensation level emerged at 140% of the purchase price of the
dissatisfactory product. After overcompensation exceeded this threshold, its effectiveness as a
means to enhance customer loyalty seems to deteriorate. Hence, the present study’s findings
suggest that too much compensation can indeed affect customer loyalty negatively.
The next study was designed with the aim to replicate the present findings using a
different study method, in which participants had to rate each compensation level separately
instead of in pairs (i.e., a standard within-subjects design), that allows us to statistically test
the linear and quadratic components of the compensation–loyalty relationship. Moreover,
scholars have argued that when the magnitude of the failure in financial terms is high,
customers might react differently to the compensation than when the magnitude is low (see

OVERCOMPENSATION AND CUSTOMER LOYALTY 16
Garrett, 1999; Smith, Bolton, & Wagner, 1999). Therefore, in the next study we also included
several products – ranging in purchase price from $5 to $500 – in order to test whether we
could replicate the inverted U-relationship between overcompensation and customer loyalty
for different failure magnitudes.
Importantly, an inverted U-relation may point toward the existence of two opposing
mechanisms that jointly operate (Coombs & Avrunin, 1977). For instance, in the context of
social groups, it has been argued that people prefer membership of moderately sized
minorities rather than either small minorities or large majorities, because it balances the need
for belonging – which implies a positive relation between group size and preference – and the
need for distinctiveness – which implies a negative relation between group size and
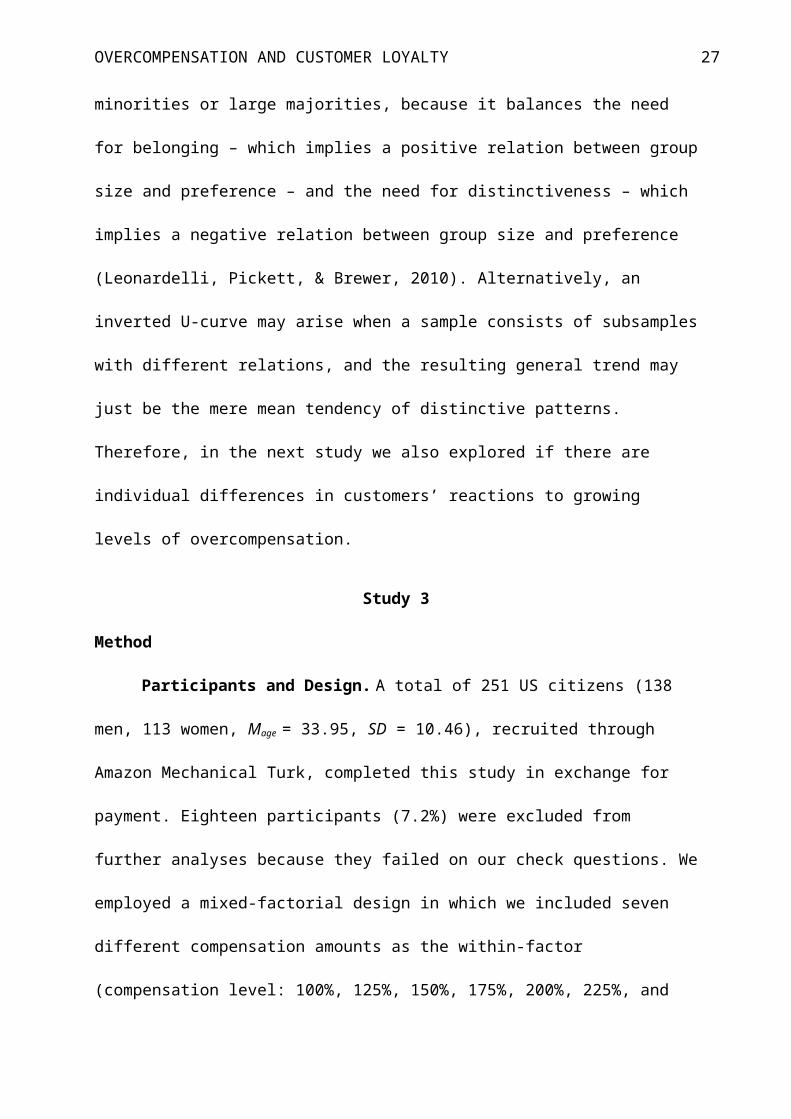
preference (Leonardelli, Pickett, & Brewer, 2010). Alternatively, an inverted U-curve may
arise when a sample consists of subsamples with different relations, and the resulting general
trend may just be the mere mean tendency of distinctive patterns. Therefore, in the next study
we also explored if there are individual differences in customers’ reactions to growing levels
of overcompensation.
Study 3
Method
Participants and Design. A total of 251 US citizens (138 men, 113 women, Mage =
33.95, SD = 10.46), recruited through Amazon Mechanical Turk, completed this study in
exchange for payment. Eighteen participants (7.2%) were excluded from further analyses
because they failed on our check questions. We employed a mixed-factorial design in which
we included seven different compensation amounts as the within-factor (compensation level:
100%, 125%, 150%, 175%, 200%, 225%, and 250% of the purchase price) and 12 different
products that were nested within four different price classes as the between-factor (product
price and product type: $5: kilo tomatoes, book, pair of socks; $50: blender, sweatshirt, bottle
OVERCOMPENSATION AND CUSTOMER LOYALTY 17
of wine; $100: pair of shoes, espresso machine, coffee table; and $500: television, watch,
dining table).
Procedure. To administer our manipulations, participants were presented with a
written scenario in which they were asked to imagine that they had bought one of these 12
different products at a nearby store, and that it turned out that their purchase was damaged or
malfunctioning. Participants were then asked to imagine that they returned to the store to
complain about this product failure. Subsequently, participants evaluated seven responses by
which the store could react to this failure. Each of these reactions presented a specific
compensation level. In the present study, the different compensation levels were offered in
ascending order. Customer loyalty was measured with the same four items as in Study 1.
Results
Curve Progression. We analyzed the effect of compensation level on customer
loyalty – an index created by aggregating the return, repurchase, recommend, and patronage
items. A one-way repeated measures ANOVA on customer loyalty showed that the
compensation levels of 100%, 225%, and 250% all lead to lower customer loyalty than the
compensation levels of 125% to 200% (all ps < .001), which supports the notion that loyalty
increases with higher compensation up to a certain point, after which it decreases again. In
fact, loyalty for the compensation levels of 100%, 225% and 250% did not significantly differ
from each other (all ps > .18). Figure 3 visualizes the relationship between the level of
compensation and the degree of customer loyalty.
OVERCOMPENSATION AND CUSTOMER LOYALTY 18
100 125 150 175 200 225 2504
5
6
Compensation level (%)
Cus
tom
er lo
yalty
Figure 3: Relationship between compensation level and customer loyalty in Study 3. Note. The graph is based on the observed means (collapsed across product prices): M100% = 5.05, SD = 1.60;
M125% = 5.66, SD = 1.39; M150% = 5.67, SD = 1.54; M175% = 5.54, SD = 1.68; M200% = 5.43, SD = 1.85; M225% =
5.23, SD = 2.02; M250% = 5.12, SD = 2.12.
To examine the inverted U-relation in greater depth, we analyzed the data through
multilevel regression in Mplus, with observations (level 1) nested in participants (level 2). We
treated the independent variable, level of compensation, as a quantitative variable in our
analyses and we estimated the functional form of its effect by considering both a linear and a
quadratic trend. To eliminate problems associated with small parameter estimates, we rescaled
the compensation levels (100% to 250%, in steps of 25%) to an index variable (1 to 7). This
linear transformation did not affect any substantial result or statistical test. Finally, we
included the effect of product price ($5, $50, $100, and $500) using three dummy variables
with the highest price being the reference category.
Because the data are multilevel, the Cronbach alpha of customer loyalty can be
estimated at the between and the within levels. The analyses revealed that both are very high
(α = .99 and α = .96, for respectively the between and the within level). In our first model, we
tested whether the relation between level of compensation and customer loyalty is moderated
by product price by including interactions between the three dummy variables and both the
OVERCOMPENSATION AND CUSTOMER LOYALTY 19
linear and quadratic trend for level of compensation. We found that none of the product price
dummies interacted with the linear (all ps > .35) or the quadratic trend (all ps > .33). In
addition, none of the three dummy variables themselves had a significant effect (all ps > .78).
We therefore collapsed our data across price levels. The subsequent analysis revealed a
significant linear (t(1396) = 5.49, p < .001) and quadratic trend (t(1396) = 7.44, p < .001).
This analysis further indicates that as the compensation level increased to about 168%,
customer loyalty became more favorable, but it started to become less favorable after the
168% compensation level.
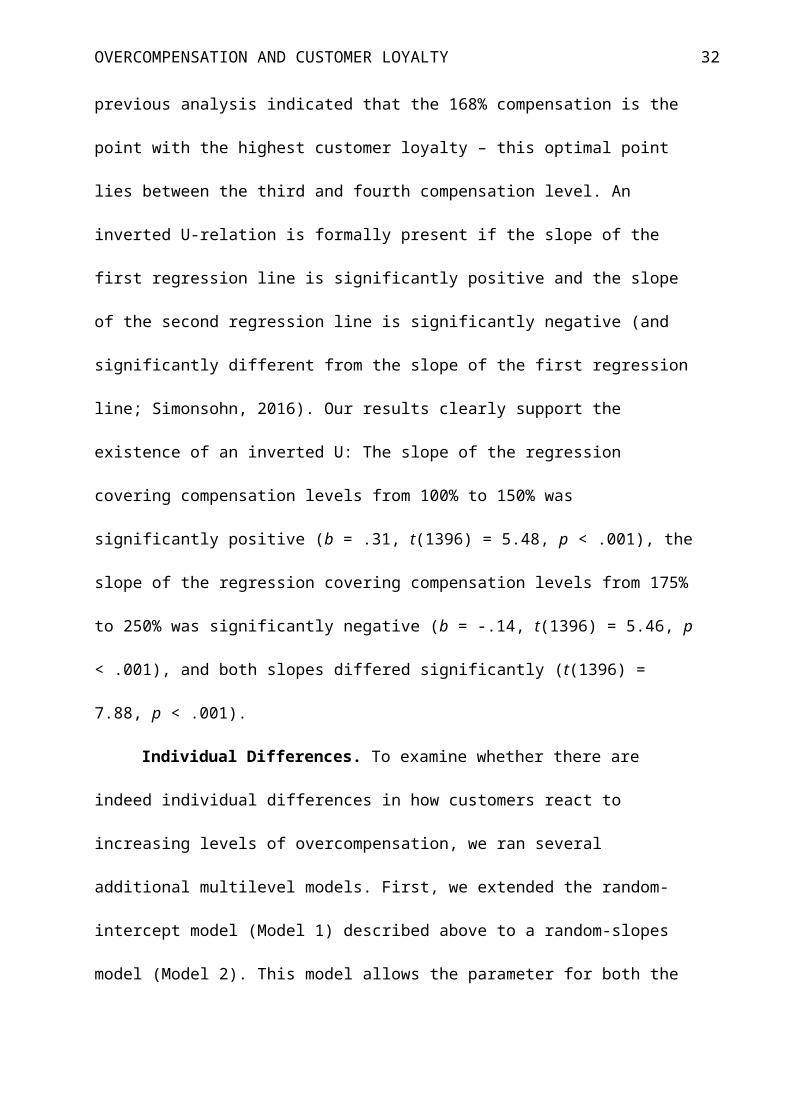
Finally, to formally test the existence of an inverted U-relation, we estimated in one
overall analysis a model that approximates the quadratic relation with two linear relations
(Simonsohn, 2016). Specifically, we estimated one linear relation on the basis of the data for
the first three compensation levels and a second linear relation was estimated on the
remaining four levels, by introducing a breakpoint that allowed for a different intercept and
slope for the two regression lines. We selected this breakpoint because our previous analysis
indicated that the 168% compensation is the point with the highest customer loyalty – this
optimal point lies between the third and fourth compensation level. An inverted U-relation is
formally present if the slope of the first regression line is significantly positive and the slope
of the second regression line is significantly negative (and significantly different from the
slope of the first regression line; Simonsohn, 2016). Our results clearly support the existence
of an inverted U: The slope of the regression covering compensation levels from 100% to
150% was significantly positive (b = .31, t(1396) = 5.48, p < .001), the slope of the regression
covering compensation levels from 175% to 250% was significantly negative (b = -.14,
t(1396) = 5.46, p < .001), and both slopes differed significantly (t(1396) = 7.88, p < .001).
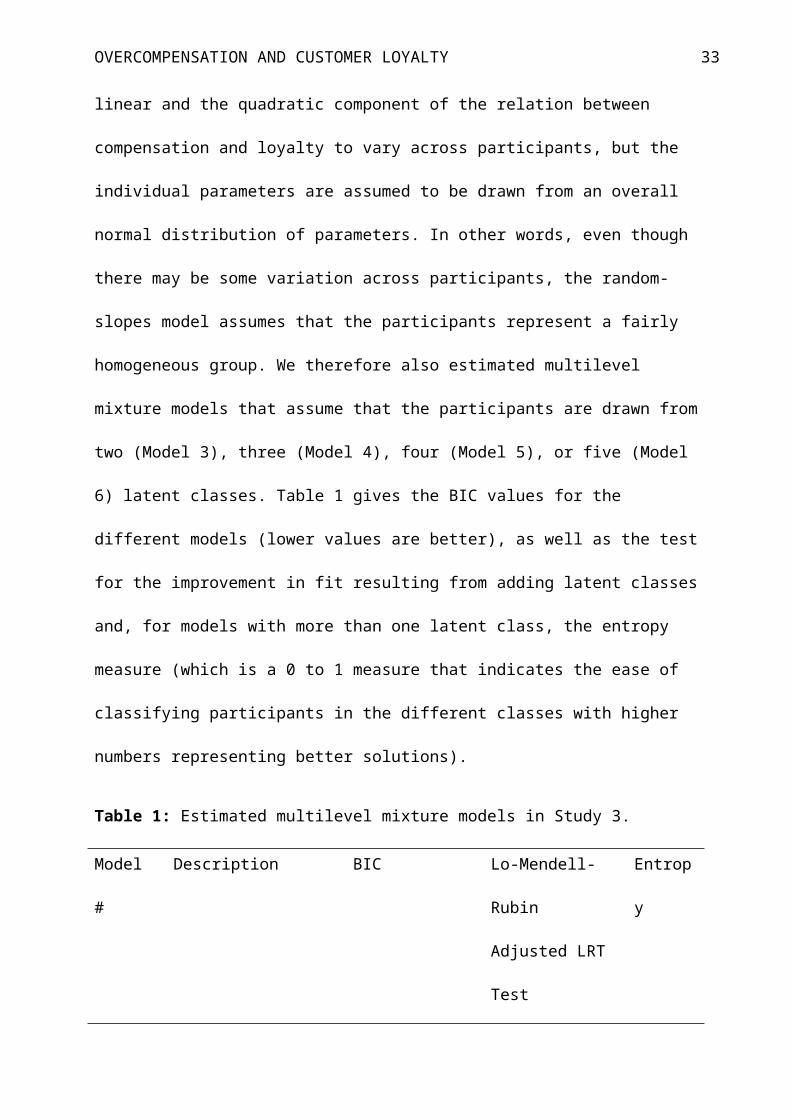
Individual Differences. To examine whether there are indeed individual differences
in how customers react to increasing levels of overcompensation, we ran several additional

OVERCOMPENSATION AND CUSTOMER LOYALTY 20
multilevel models. First, we extended the random-intercept model (Model 1) described above
to a random-slopes model (Model 2). This model allows the parameter for both the linear and
the quadratic component of the relation between compensation and loyalty to vary across
participants, but the individual parameters are assumed to be drawn from an overall normal
distribution of parameters. In other words, even though there may be some variation across
participants, the random-slopes model assumes that the participants represent a fairly
homogeneous group. We therefore also estimated multilevel mixture models that assume that
the participants are drawn from two (Model 3), three (Model 4), four (Model 5), or five
(Model 6) latent classes. Table 1 gives the BIC values for the different models (lower values
are better), as well as the test for the improvement in fit resulting from adding latent classes
and, for models with more than one latent class, the entropy measure (which is a 0 to 1
measure that indicates the ease of classifying participants in the different classes with higher
numbers representing better solutions).
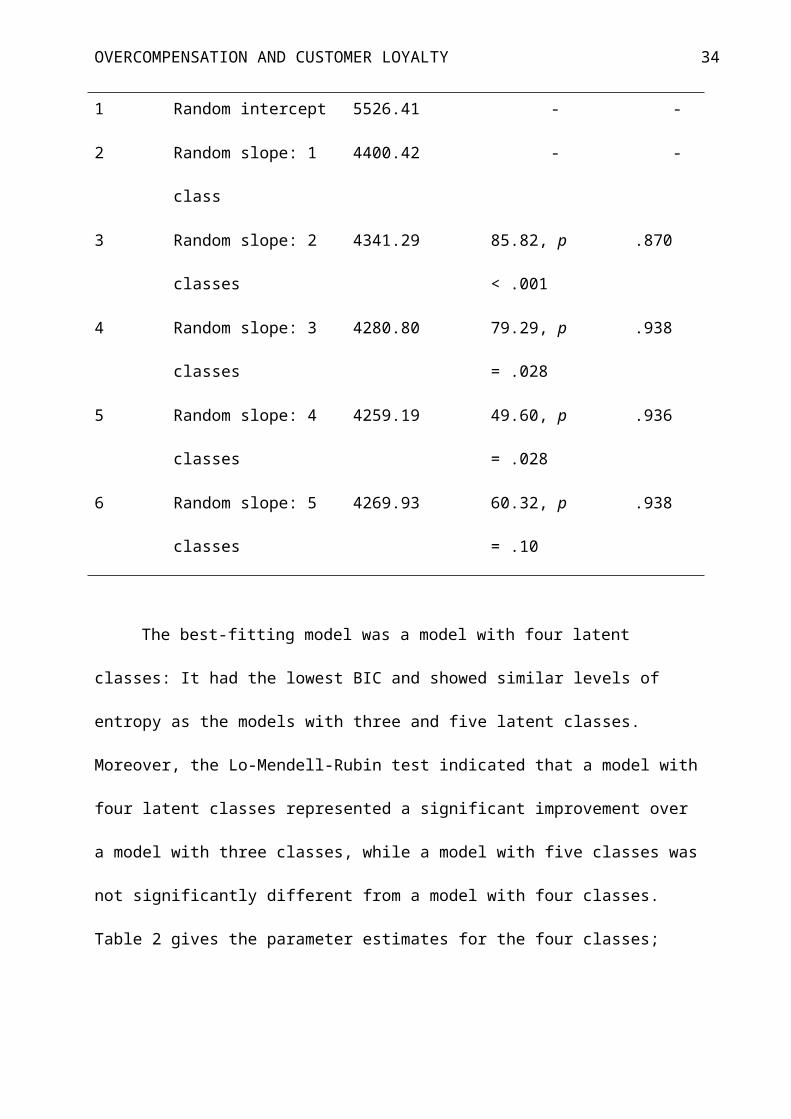
Table 1: Estimated multilevel mixture models in Study 3.
Model # Description BIC Lo-Mendell-Rubin
Adjusted LRT Test
Entropy
1 Random intercept 5526.41 - -
2 Random slope: 1 class 4400.42 - -
3 Random slope: 2 classes 4341.29 85.82, p < .001 .870
4 Random slope: 3 classes 4280.80 79.29, p = .028 .938
5 Random slope: 4 classes 4259.19 49.60, p = .028 .936
6 Random slope: 5 classes 4269.93 60.32, p = .10 .938

OVERCOMPENSATION AND CUSTOMER LOYALTY 21
The best-fitting model was a model with four latent classes: It had the lowest BIC and
showed similar levels of entropy as the models with three and five latent classes. Moreover,
the Lo-Mendell-Rubin test indicated that a model with four latent classes represented a
significant improvement over a model with three classes, while a model with five classes was
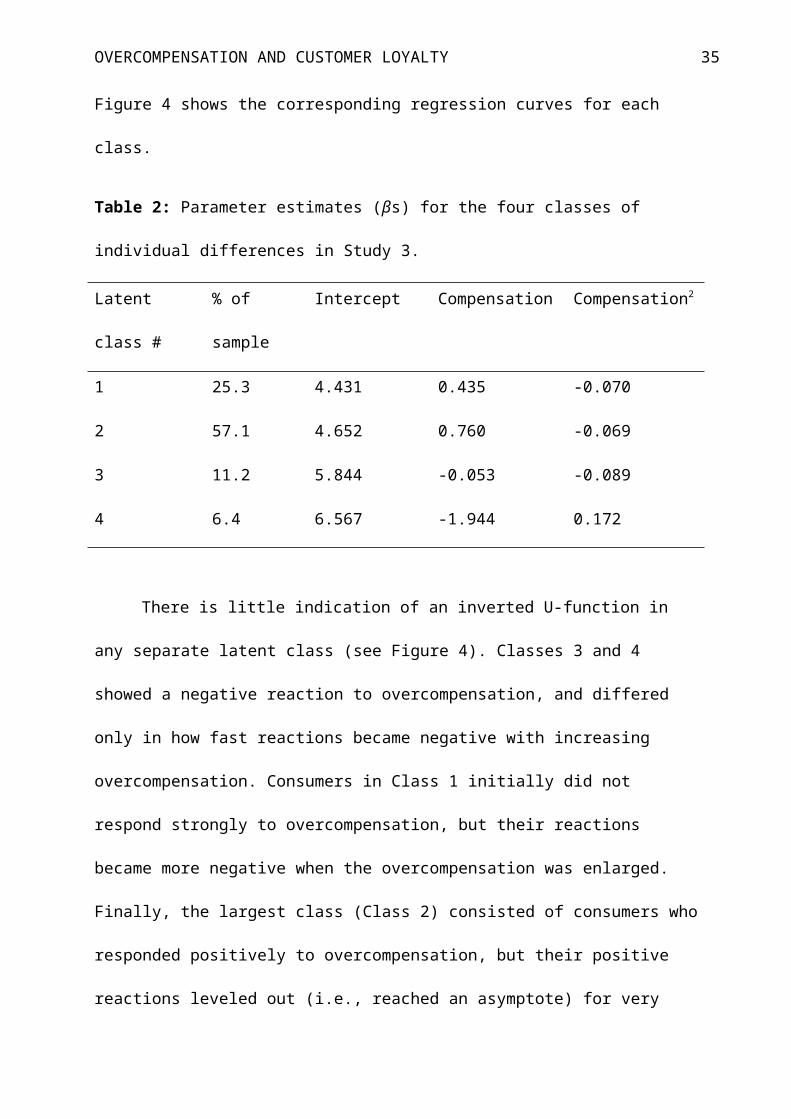
not significantly different from a model with four classes. Table 2 gives the parameter
estimates for the four classes; Figure 4 shows the corresponding regression curves for each
class.
Table 2: Parameter estimates (βs) for the four classes of individual differences in Study 3.
Latent class # % of sample Intercept Compensation Compensation2
1 25.3 4.431 0.435 -0.070
2 57.1 4.652 0.760 -0.069
3 11.2 5.844 -0.053 -0.089
4 6.4 6.567 -1.944 0.172
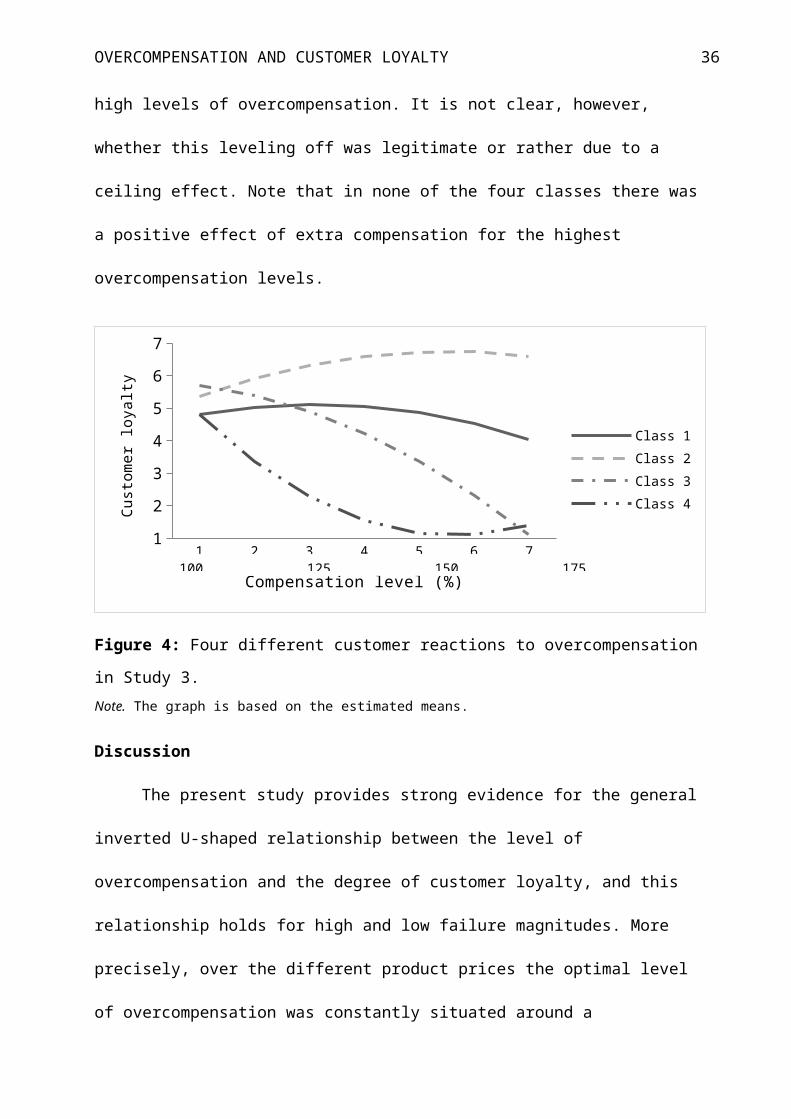
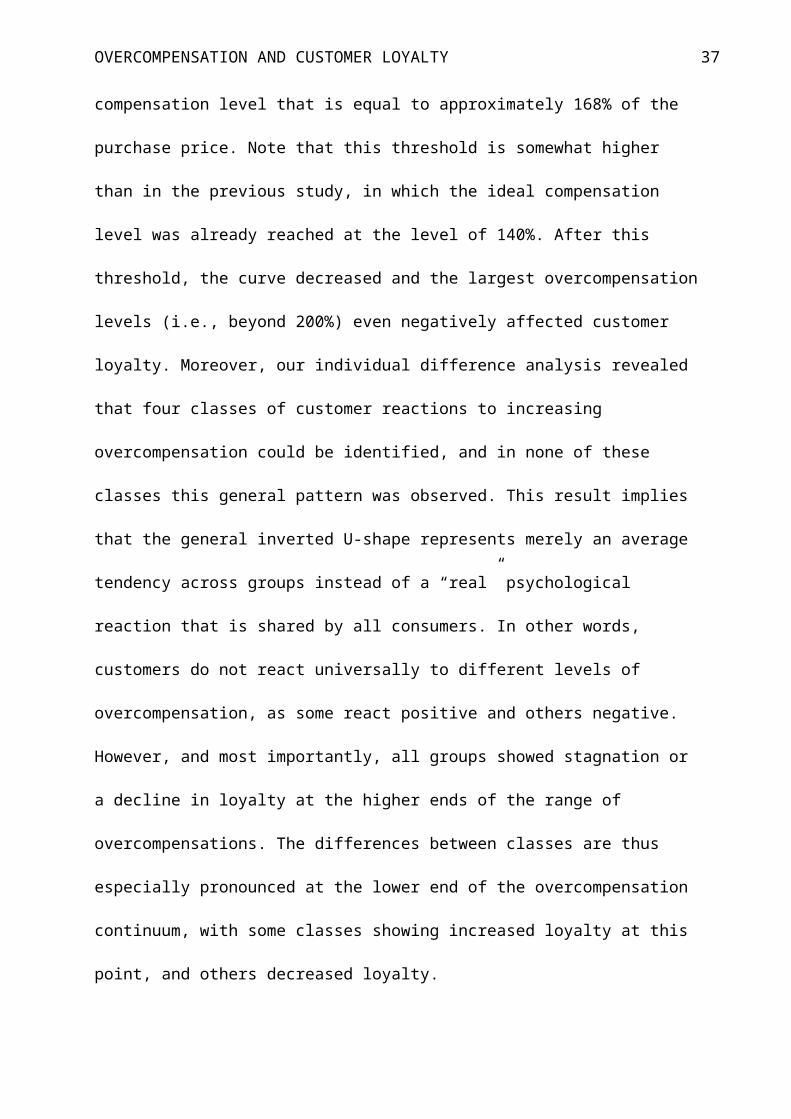
There is little indication of an inverted U-function in any separate latent class (see
Figure 4). Classes 3 and 4 showed a negative reaction to overcompensation, and differed only
in how fast reactions became negative with increasing overcompensation. Consumers in Class
1 initially did not respond strongly to overcompensation, but their reactions became more
negative when the overcompensation was enlarged. Finally, the largest class (Class 2)
consisted of consumers who responded positively to overcompensation, but their positive
reactions leveled out (i.e., reached an asymptote) for very high levels of overcompensation. It
is not clear, however, whether this leveling off was legitimate or rather due to a ceiling effect.
Note that in none of the four classes there was a positive effect of extra compensation for the
highest overcompensation levels.
OVERCOMPENSATION AND CUSTOMER LOYALTY 22
1 2 3 4 5 6 71
2
3
4
5
6
7
Class 1
Class 2
Class 3
Class 4
Compensation level (%)
Cus
tom
er lo
yalty
Figure 4: Four different customer reactions to overcompensation in Study 3. Note. The graph is based on the estimated means.
Discussion
The present study provides strong evidence for the general inverted U-shaped
relationship between the level of overcompensation and the degree of customer loyalty, and
this relationship holds for high and low failure magnitudes. More precisely, over the different
product prices the optimal level of overcompensation was constantly situated around a
compensation level that is equal to approximately 168% of the purchase price. Note that this
threshold is somewhat higher than in the previous study, in which the ideal compensation
level was already reached at the level of 140%. After this threshold, the curve decreased and
the largest overcompensation levels (i.e., beyond 200%) even negatively affected customer
loyalty. Moreover, our individual difference analysis revealed that four classes of customer
reactions to increasing overcompensation could be identified, and in none of these classes this
general pattern was observed. This result implies that the general inverted U-shape represents
merely an average tendency across groups instead of a “real” psychological reaction that is
shared by all consumers. In other words, customers do not react universally to different levels
of overcompensation, as some react positive and others negative. However, and most
100 125 150 175 200 225 250
OVERCOMPENSATION AND CUSTOMER LOYALTY 23
importantly, all groups showed stagnation or a decline in loyalty at the higher ends of the
range of overcompensations. The differences between classes are thus especially pronounced
at the lower end of the overcompensation continuum, with some classes showing increased
loyalty at this point, and others decreased loyalty.
Two limitations of the present study should be acknowledged. First, in the current
study the overcompensation range (in steps of 25%) was rather large, and thus not very
sensitive to unravel the optimal level of overcompensation. To overcome this limitation, in the
next study we investigated the continuum using a much finer range, in small steps of only
10%. These more fine grained steps might shed a different light on the operation of individual
differences in the context of mild overcompensations, which shows the greatest variability.
Secondly, in the present study the compensation levels were presented to participants in a
fixed order. In order to avoid potential sequential effects, the compensation levels were
randomized in the next study.
Study 4
Method
Participants and Design. The sample consisted of 128 US citizens (62 men, 66
women, Mage = 36.46, SD = 12.32), who were recruited through Amazon Mechanical Turk and
participated in this scenario study in exchange for payment. Fourteen participants (10.9%)
were excluded from further analyses because they failed on our check questions. To
administer our compensation manipulation we employed a within-subjects design in which we
included eight compensation levels (i.e., 100%, 110%, 120%, 130%, 140%, 150%, 160%, and
170% of the purchase price). Because the prior study showed there was no further increase in
customer loyalty for overcompensations beyond the level of 168% (which was identified as
the optimum), we did not include compensation sizes beyond this particular level in the
present study.
OVERCOMPENSATION AND CUSTOMER LOYALTY 24
Procedure. Participants read a scenario in which they imagined that they had bought a
new espresso machine at a nearby store for the price of $100. In the present study we only
included one product price, because in the previous study the compensation–loyalty
relationship was not affected by the magnitude of the product failure. Participants imagined
themselves that they came home and then realized that their espresso machine did not
function properly. They thus decided to go back to the store to complain about this
malfunctioning. Participants were asked to evaluate eight responses by which the store could
react to this situation; each of these reactions presented a specific compensation level.
Importantly, the different compensation levels were presented in a random order.
Measures. We used the same four items as in Study 1 to measure customer loyalty. In
addition, to measure whether the compensation level manipulation was successful, we also
probed participants’ perception of the magnitude of the compensation. Therefore, we asked
participants for each of the compensation levels: “To what extent do you find this
compensation large?” (1 = not at all, 7 = very much).
Results
Similar to Study 3, most analyses were conducted using Mplus software. We again
treated the independent variable, level of compensation, as a quantitative variable and we
estimated the functional form of its effect by considering both a linear and a quadratic trend,
using a regression approach. Because every participant responded to eight different
compensation levels, we used a multilevel regression model with observations (level 1) nested
in participants (level 2). To eliminate problems associated with small parameter estimates, we
rescaled the compensation levels (100% to 170%) to an index variable (1 to 8). As in the
previous study, this linear transformation did not affect any substantial result or statistical test.
Perception of Compensation Size. As a manipulation check, we first tested the effect
of compensation level on perception of compensation size. The analysis revealed both a

OVERCOMPENSATION AND CUSTOMER LOYALTY 25
significant linear (t(796) = 8.95, p < .001) and quadratic trend (t(796) = 4.74, p < .001) for the
relation between compensation level and size perception. Figure 5 reveals that individuals
tend to view less difference between adjacent compensation levels as the compensation size
becomes larger. This finding is in line with a host of research on the mental number line,
showing a logarithmic relation between numbers and their mental representation (e.g.,
Dehaene, 1992; Nieder & Miller, 2003).
100 110 120 130 140 150 160 1701
2
3
4
5
6
7
Compensation level (%)
Size
per
cept
ion
Figure 5: Relationship between compensation level and size perception in Study 4. Note. The graph is based on the observed means: M100% = 2.02, SD = 1.76; M110% = 3.18, SD = 2.14; M120% = 3.96,
SD = 1.97; M130% = 4.58, SD = 2.04; M140% = 5.08, SD = 1.79; M150% = 5.55, SD = 1.68; M160% = 5.86, SD = 1.66;
M170% = 6.21, SD = 1.42.
Curve Progression. We subsequently analyzed the effect of compensation level on
customer loyalty, which was again created on the basis of the repurchase, return, recommend,
and patronage items (α = .99 and α = .97, for respectively the between and the within level). A
one-way repeated measures ANOVA showed a significantly lower loyalty level for the
compensation of 100% than for the other compensation levels (all ps < .001). Loyalty for the
compensation level of 110% was significantly lower than for all the levels up to 160% (all ps
< .05), and marginally different from the compensation level of 170%. Loyalty for the
compensation level of 120% was significantly lower than for all the levels up to 150% (all ps
OVERCOMPENSATION AND CUSTOMER LOYALTY 26
< .05), but not different from the compensation levels of 160% and 170% (all ps > .26).
Loyalty for the compensation levels from 130% to 170% did not significantly differ among
each other (all ps > .10). This analysis thus reveals evidence for an increasing positive
reaction to overcompensation, which leveled off around compensation levels of 130%. As
could be expected, the small range of overcompensations precluded us to substantiate the
presence of an overall inverted U-reaction (see Figure 6).
100 110 120 130 140 150 160 1704
5
6
Compensation level (%)
Cus
tom
er lo
yalty
Figure 6: Relationship between compensation level and customer loyalty in Study 4. Note. The graph is based on the observed means: M100% = 4.85, SD = 1.84; M110% = 5.23, SD = 1.70; M120% = 5.47,
SD = 1.65; M130% = 5.68, SD = 1.59; M140% = 5.71, SD = 1.56; M150% = 5.73, SD = 1.56; M160% = 5.61, SD = 1.73;
M170% = 5.56, SD = 1.81.
We conducted a subsequent multilevel regression in Mplus to identify the optimal
overcompensation level. This analysis revealed both a significant linear (t(796) = 5.05, p
< .001) and quadratic trend (t(796) = 4.93, p < .001). Here, the optimal compensation level
that resulted in the highest loyalty rating was identified at a compensation level of 146%.
Individual Differences. To examine the presence of meaningful individual
differences in the reactions to the various overcompensation levels, we ran several multilevel
models. As in the prior study we first ran a random-intercept model (Model 1) and a random-
slopes model (Model 2). Again, we also estimated multilevel mixture models that assume that
OVERCOMPENSATION AND CUSTOMER LOYALTY 27
the participants are drawn from two (Model 3), three (Model 4), or four (Model 5) latent
classes. Table 3 gives the BIC values for the different models, the test for the improvement in
fit resulting from adding latent classes, and the entropy measure.
Table 3: Estimated multilevel mixture models in Study 4.
Model # Description BIC Lo-Mendell-Rubin
Adjusted LRT Test
Entropy
1 Random intercept 3002.02 - -
2 Random slope: 1 class 2602.83 - -
3 Random slope: 2 classes 2582.92 45.51, p = .034 .908
4 Random slope: 3 classes 2576.60 32.39, p = .58 .937
5 Random slope: 4 classes 2584.92 18.60, p = .79 .885
The model with two latent classes was selected as the best-fitting model. It had the
second lowest BIC and almost the same entropy as the model with three latent classes.
Moreover, the Lo-Mendell-Rubin test indicated that a model with two classes represented a
significant improvement over a model with only one class, but the model with three classes
was not better compared to the model with two classes. Moreover, the results of the three
latent classes model revealed that the additional class consisted of only 2.6% of the
participants, and that the other classes were basically similar as those from the two-cluster
solution. Table 4 gives the parameter estimates for the two classes; Figure 7 shows the
corresponding regression curves for each class.
Table 4: Parameter estimates (βs) for the two classes of individual differences in Study 4.
Latent class # % of sample Intercept Compensation Compensation2
1 84.2 4.796 0.440 -0.034
OVERCOMPENSATION AND CUSTOMER LOYALTY 28
2 15.8 4.364 0.055 -0.039
As in Study 3, the largest class (Class 1) consisted of consumers who responded
positively to overcompensation, but again their positive reactions leveled out (i.e., reached an
asymptote) for higher levels of overcompensation. In this case, this leveling off does not seem
to signal a ceiling effect, as there was still some room for more positive evaluations. Class 2
showed a negative reaction to overcompensation, which became even more negative with
increasing levels of overcompensation.
1 2 3 4 5 6 7 81
2
3
4
5
6
7
Class 1
Compensation level (%)
Cus
tom
er lo
yalty
Figure 7: Two different customer reactions to overcompensation in Study 4. Note. The graph is based on the estimated means.
Discussion
In the current study we investigated the overcompensation continuum with smaller
steps of 10%. Here, the optimum overcompensation level was reached at a compensation level
that is equivalent to about 146% of the purchase price. Beyond this point customer loyalty
again flattened. The use of moderate overcompensation levels precluded the presence of a
downstream curve. Again, our findings revealed that there are individual differences in how
people evaluate different compensation levels. As in the prior study, most consumers reacted
100 110 120 130 140 150 160 170

OVERCOMPENSATION AND CUSTOMER LOYALTY 29
positively to increasing overcompensation, at least to a certain level. In the present study not
less than 84.2% of the customers showed this pattern, which is consistent with Study 3.
Indeed, in Study 3 Classes 1 and 2, which included 82.4% of the participants, also showed
higher loyalty levels in the low range of overcompensations. In the present Study a smaller
proportion of customers (15.8%) responded negatively to all forms of overcompensation,
which mirrors the behavior of customers included in Classes 3 and 4 of Study 3 (17.6%), who
showed a similar pattern.
General Discussion
When products fail to live up to customers’ expectations, companies can financially
compensate these customers for their loss. Companies often choose to provide dissatisfied
customers more compensation than required to undo the failure with the aim to further
increase their loyalty. The aim of the present paper was to investigate in detail the
effectiveness of monetary overcompensation as a means to enhance customer loyalty. Based
on the current literature, it is still unclear whether in the high overcompensation range a
saturation effect (leading to a flattening curve) or a true negative effect (resulting in a
downstream curve) occurs. As such, our research responds to the request that additional
research is needed to determine how much compensation is perceived as too much (see
Davidow, 2003; Estelami & De Maeyer, 2002; Gelbrich et al., 2015). Moreover, because it
can be expected that customers do not react universally to increasing amounts of
overcompensation, we also included a thorough analyses of individual differences.
Main Conclusions
Across three studies the optimal level of overcompensation was always located around
a compensation level that is equivalent to an average of about 150% of the purchase price of
the faulty product (i.e., 140% in Study 2, 168% in Study 3, and 146% in Study 4). Note that in
Study 1, which asked participants to provide ratings for only one compensation level, this
OVERCOMPENSATION AND CUSTOMER LOYALTY 30
optimum seems to be located further along the continuum. Taken into account that
overcompensation is characterized by an open-ended interval which has no natural upper
boundary, it can be concluded that the optimum level is situated at the rather low end of the
continuum. Importantly, after this ideal point had been reached, the effect of
overcompensation on customer loyalty was limited – and for more extreme overcompensation
levels there was even an actual decrease in customer loyalty, which sharply contrasts with the
standard economic notion that increasing levels of compensation would continue to produce
higher levels of customer loyalty. As such, the present research has established the existence
of an overall inverted U-relation between the amount of overcompensation and the degree of
customer loyalty. These results corroborate ample previous compensation research that failed
to report favorable effects of large overcompensation relative to equal compensation (e.g., see
Estelami & De Maeyer, 2002; Garrett, 1999; Haesevoets et al., 2013, 2014; Noone & Lee,
2011).
We hypothesized that an inverted U-curve may arise because there are subsamples of
customers that react differently to increasing levels of overcompensation. The present paper is
the first, at least to our knowledge, to investigate individual differences in overcompensation
effectiveness. We found similar patterns of rising and dropping curves in Studies 3 and 4.
More specifically, in line with the idea that humans are economic men, in both studies about
80% of the customers reacted positively to overcompensation by increasing their loyalty when
the provided overcompensation enlarged, but this was only up to a certain point after which
the curve flattened. Hence, even for customers who reacted positively to increasing
overcompensation this effect was bounded. Or, stated otherwise, while it is true that the
majority of people react as homo economicus, they do so only to a certain point, after which
they seem fulfilled.
OVERCOMPENSATION AND CUSTOMER LOYALTY 31
The overall decline in the high overcompensation range seems to be due to the fact
that there was also a smaller group of customers (which included approximately 20% of all
customers) that reacted negatively to every form of overcompensation, and, importantly, most
of these customers’ reactions became even more negative with increasing overcompensation.
Our individual difference analyses thus entail that customers do not react universally to
various overcompensations, but instead there is a large subgroup of customers that react
positively and a smaller segment of customers that react negatively to increasing levels of
overcompensation. Importantly, however, what seems to be universal is that all customer
groups show stagnation or a decline in loyalty at the higher ends of the range of
overcompensations, which further substantiates the central finding that high
overcompensations do not yield any beneficial effect on loyalty.
Because in both studies there was no indication of an inverted U-function for the
separate classes, the general curve represents an average tendency rather than a genuine
psychological reaction, which has theoretical implications. For instance, we reasoned that
returning a faulty product is associated with additional costs for the customer in terms of lost
time and experienced inconveniences. Because of these additional costs, we argued that
overcompensation should transcend the mere product price of a dissatisfactory product in
order to further elicit loyalty. But after this level of overcompensation is reached, loyalty
levels should drop. Whereas this reasoning seems valid on the basis of the general curve
across groups, close inspection of the specific curves in each of the four classes identified in
Study 3 and the two classes in Study 4 revealed no such pattern. The absence of this curve in
specific groups suggests that customers do not think in terms of such additional costs, or at
least that such costs are not explicitly taken into account when making loyalty judgments.
Practical Implications of the Present Research
OVERCOMPENSATION AND CUSTOMER LOYALTY 32
It is important to realize that despite these robust individual differences in customers’
reactions to various overcompensation levels, the general data pattern which consists of an
inverted U still holds some important practical implications for companies, who often have no
information regarding how an individual customer will react to a certain compensation level,
and as such have to rely on general trends in customers’ reactions.
Overcompensating dissatisfied customers entails high costs for companies because it is
associated with incremental expenses. As our findings revealed that, in general,
overcompensation only has beneficial effects on customer loyalty at the rather low end of the
overcompensation continuum, the present research cautions companies that attempt to
differentiate themselves by overcompensating customers for product failures. Companies
should be aware that when the overcompensation exceeds the original purchase price with
more than 50%, they are generally wasting money which does not further enhance loyalty for
the largest group of customers, but instead even results in a decline for about one fifth of their
customers. As such, more extreme overcompensations are not only not cost-effective but
actually even cost-ineffective for companies. Knowledge of this upper threshold after which
more compensation becomes too much is of vital importance as it will enable companies and
marketers to realize an optimal allocation of their marketing budget and avoid inefficient
spending on too large overcompensation.
Companies may be concerned about the costs and returns of overcompensation
strategies. In this regard, it must be noted that although mild overcompensation generally has
a significant positive influence on customer loyalty, the additional benefit on top of equal
compensation is rather small. Indeed, corroborating previous compensation research (see
Davidow, 2003; Gelbrich & Roschk, 2011, for overviews), our results revealed that for most
customers equal compensation already resulted in a rather favorable situation in term of
loyalty. A relevant question, therefore, is whether this rather small increase in customer
OVERCOMPENSATION AND CUSTOMER LOYALTY 33
loyalty is worth the extra cost that overcompensation entails. An overcompensation of 150%,
for example, holds that, in addition to the reimbursement of the expenses, the company offers
the customer an extra amount that is half as large as the damage suffered. This might not be a
problem for companies when the magnitude of the failure is low, but when the monetary
value of a dissatisfactory product is high, like in the automobile sector, the costs of
overcompensation in absolute terms rapidly increase. The question whether overcompensation
is a cost-effective repair strategy is one that each company should answer for itself; and the
answer to this question might depend on other factors such as the competitiveness of the
market and the status of the client (regular versus occasional customer).
Strengths, Limitations, and Recommendations
First of all, an important strength of the present research is that we used different
methods of data collection as well as different study samples. That is, in Study 1 we used a
between-subjects design to deliver the different compensation levels. In contrast, in Study 2
we employed the method of paired comparisons, whereas in Studies 3 and 4 participants rated
each presented compensation level separately. In Studies 1, 3, and 4 the sample consisted of
consumers that were recruited through Amazon’s Mechanical Turk, which have been shown
to be able to provide reliable and high-quality data (see Buhrmester et al., 2011; Hauser &
Schwarz, 2016). Study 2 was conducted among undergraduate university students. The fact
that we could replicate the diminished effectiveness of large overcompensation using this
divergence in methods, designs, and samples enlarges our confidence in the robustness of the
reported findings.
A second strength of the present research is that we focused on customer loyalty as the
outcome variable. Many previous compensation studies mainly focused on post-complaint
satisfaction, a construct that has been defined very differently across different studies (Olsen
& Johnson, 2003). Although we acknowledge that satisfaction is an important aspect of the
OVERCOMPENSATION AND CUSTOMER LOYALTY 34
recovery process, we believe that it is at least equally important to companies that customers
are willing to recommend the company to others and to purchase products again – two critical
elements of customer loyalty (see Lam et al., 2004; Webster & Sundaram, 1998).
A limitation of our research is that we relied on scenario-based experiments in which
participants had to imagine receiving different amounts of compensation from a company. As
with all research methodologies, scenarios yield advantages and disadvantages (see Carlsmith,
Ellsworth, & Aronson, 1976). An important advantage of this method is that it enhances
internal and statistical conclusion validity by controlling manipulated variables and by
reducing random noise in the outcome measure (Cook & Campbell, 1979; Churchill, 1995).
Yet, imagining receiving compensation might differ from actually receiving compensation.
Future research should thus investigate whether the present results also apply when customers
actually receive different levels of overcompensation in a field setting (cf. Garrett, 1999).
As a closing remark, we would like to mention that an important factor that may
influence customers’ reactions towards overcompensation is whether a company recalls a
defective product or whether the customer him- or herself has to detect that a product is
defective. In this light, it can be expected that the costs for the customer may be lower when
the company recalls a product, because under such circumstances a part of the fault-finding
expenses and inconveniences have already been carried out by the company. As such, the
optimal compensation level might also be smaller when companies themselves recall faulty
products, and therefore be located earlier on the overcompensation continuum. We believe
that the investigation of overcompensation effects under such conditions provides an
interesting avenue for future compensation research.
OVERCOMPENSATION AND CUSTOMER LOYALTY 35
References
Bazerman, M. H., Loewenstein, G. F., & White, S. B. (1992). Reversals of preference in
allocation decisions: Judging an alternative versus choosing among alternatives.
Administrative Science Quarterly, 37, 220-240. DOI: 10.2307/2393222
Blount, S. (1995). When social outcomes aren’t fair: The effect of causal attributions on
preferences. Organizational Behavior and Human Decision Processes, 63, 131-144.
DOI: 10.1006/obhd.1995.1068
Boshoff, C. (1997). An experimental study of service recovery options. International Journal
of Service Industry Management, 8, 110-130. DOI: 10.1108/09564239710166245
Buhrmester, M., Kwang, T., & Gosling, S. D. (2011). Amazon’s Mechanical Turk a new
source of inexpensive, yet high-quality, data? Perspectives on Psychological Science,
6, 3-5. DOI: 10.1177/1745691610393980
Butcher, K., Sparks, B., & O’Callaghan, F. (2002). Effect of social influence on repurchase
intentions. Journal of Services Marketing, 16, 503-514. DOI:
10.1108/08876040210443382
Camerer, C., & Thaler, R. H. (1995). Anomalies: Ultimatums, dictators and manners. The
Journal of Economic Perspectives, 209-219. DOI: 10.1257/jep.9.2.209
Carlsmith, J. M., Ellsworth, P., & Aronson, E. (1976). Methods of research in social
psychology. Reading, MA: Addison-Wesley Publishing Company.
Churchill, G. A. (1995). Marketing research: Methodological foundations. Fort Worth, TX:
Dryden Press.
Cook, T. D., & Campbell, D. T. (1979). Quasi-experimentation: Design and analysis for field
settings. Chicago, IL: Rand McNally.
Coombs, C. H., & Avrunin, G. S. (1977). Single-peaked functions and the theory of
preference. Psychological Review, 84, 216-230. DOI: 10.1037/0033-295X.84.2.216
OVERCOMPENSATION AND CUSTOMER LOYALTY 36
Dana, J., Cain, D. M., & Dawes, R. M. (2006). What you don’t know won’t hurt me: Costly
(but quietly) exit in dictator games. Organizational Behavior and Human Decision
Processes, 100, 193-201. DOI: 10.1016/j.obhdp.2005.10.001
David, H. A. (1963). The method of paired comparisons (Vol. 12). London: Griffon.
Davidow, M. (2003). Organizational responses to customer complaints: What works and what
doesn’t. Journal of Service Research, 5, 225-250. DOI: 10.1177/1094670502238917
Dawes, R. M., & Thaler, R. H. (1988). Anomalies: cooperation. The Journal of Economic
Perspectives, 2, 187-197. DOI: 10.1257/jep.2.3.187
Dehaene, S. (1992). Varieties of numerical abilities. Cognition, 44, 1-42. DOI: 10.1016/0010-
0277(92)90049-N
Dittrich, R., Hatzinger, R., & Katzenbeisser, W. (1998). Modelling the effect of subject‐specific covariates in paired comparison studies with an application to university
rankings. Journal of the Royal Statistical Society: Series C (Applied Statistics), 47,
511-525. DOI: 10.1111/1467-9876.00125
Estelami, H., & De Maeyer, P. (2002). Customer reactions to service provider overgenerosity.
Journal of Service Research, 4, 205-216. DOI: 10.1177/1094670502004003004
Garrett, D. E. (1999). The effectiveness of compensation given to complaining customers: Is
more better? Journal of Consumer Satisfaction, Dissatisfaction and Complaining
Behavior, 12, 26-34.
Gelbrich, K., Gäthke, J., & Grégoire, Y. (2015). How much compensation should a firm offer
for a flawed service? An examination of the nonlinear effects of compensation on
satisfaction. Journal of Service Research, 18, 107-123. DOI:
10.1177/1094670514543149
OVERCOMPENSATION AND CUSTOMER LOYALTY 37
Gelbrich, K., & Roschk, H. (2011). Do complainants appreciate overcompensation? A meta-
analysis on the effect of simple compensation vs. overcompensation on post-complaint
satisfaction. Marketing Letters, 22, 31-47. DOI: 10.1007/s11002-010-9101-6
Gilly, M. C., & Hansen, R. W. (1985). Consumer complaint handling as a strategic marketing
tool. Journal of Consumer Marketing, 2, 5-16. DOI: 10.1108/eb008139
Grewal, D., Roggeveen, A. L., & Tsiros, M. (2008). The effect of compensation on
repurchase intentions in service recovery. Journal of Retailing, 84, 424-434. DOI:
10.1016/j.jretai.2008.06.002
Haesevoets, T., Reinders Folmer, C., De Cremer, D., & Van Hiel, A. (2013). Money isn’t all
that matters: The use of financial compensation and apologies to preserve relationships
in the aftermath of distributive harm. Journal of Economic Psychology, 35, 95-107.
DOI: 10.1016/j.joep.2013.02.003
Haesevoets, T., Van Hiel, A., Reinders Folmer, C., & De Cremer, D. (2014). What money
can’t buy: The psychology of financial overcompensation. Journal of Economic
Psychology, 42, 83-95. DOI: 10.1016/j.joep.2014.02.001
Hatzinger, R., & Dittrich, R. (2012). Prefmod: An R package for modeling preferences based
on paired comparisons, rankings, or ratings. Journal of Statistical Software, 48, 1-31.
DOI: 10.18637/jss.v048.i10
Hauser, D. J., & Schwarz, N. (2016). Attentive Turkers: MTurk participants perform better on
online attention checks than do subject pool participants. Behavior Research Methods,
48, 400-407. DOI: 10.3758/s13428-015-0578-z
Hocutt, M. A., Bowers, M. R., & Donavan, D. (2006). The art of service recovery: fact or
fiction? Journal of Services Marketing, 20, 199-207. DOI:
10.1108/08876040610665652

OVERCOMPENSATION AND CUSTOMER LOYALTY 38
Hsee, C. K. (1996). The evaluability hypothesis: An explanation for preference reversals
between joint and separate evaluations of alternatives. Organizational Behavior and
Human Decision Processes, 67, 247-257. DOI: 10.1006/obhd.1996.0077
Hsee, C. K., Loewenstein, G. F., White, S. B., & Bazerman, M. H. (1999). Preference
reversals between joint and separate evaluations of options: A review and theoretical
analysis. Psychological Bulletin, 125, 576-590. DOI: 10.1037/0033-2909.125.5.576
Hsee, C. K., & Zhang, J. (2010). General evaluability theory. Perspectives on Psychological
Science, 5, 343-355. DOI: 10.1177/1745691610374586
Lam, S. Y., Shankar, V., Erramilli, M. K., & Murthy, B. (2004). Customer value, satisfaction,
loyalty, and switching costs: an illustration from a business-to-business service
context. Journal of the Academy of Marketing Science, 32, 293-311. DOI:
10.1177/0092070304263330
Leonardelli, G. J., Pickett, C. L., & Brewer, M. B. (2010). Optimal distinctiveness theory: A
framework for social identity, social cognition, and intergroup relations. Advances in
Experimental Social Psychology, 43, 63-113. DOI: 10.1016/S0065-2601(10)43002-6
Loewenstein, G. F., Thompson, L., & Bazerman, M. H. (1989). Social utility and decision
making in interpersonal contexts. Journal of Personality and Social psychology, 57,
426-441. DOI: 10.1037/0022-3514.57.3.426
McCollough, M. A., Berry, L. L., & Yadav, M. S. (2001). An empirical investigation of
customer satisfaction after service failure and recovery. Journal of Service Research, 3
121-137. DOI: 10.1177/109467050032002
Nieder, A., & Miller, E.K. (2003). Coding of cognitive magnitude: Compressed scaling of
numerical information in the primate prefrontal cortex. Neuron, 37, 149-157. DOI:
10.1016/S0896-6273(02)01144-3

OVERCOMPENSATION AND CUSTOMER LOYALTY 39
Noone, B. M., & Lee, C. H. (2011). Hotel overbooking: The effect of overcompensation on
customers’ reaction to denied service. Journal of Hospitality & Tourism Research, 35,
334-357. DOI: 10.1177/1096348010382238
Olsen, L. L., & Johnson, M. D. (2003). Service equity, satisfaction, and loyalty: From
transaction-specific to cumulative evaluations. Journal of Service Research, 5, 184-
195. DOI: 10.1177/1094670502238914
Paolacci, G., & Chandler, J. (2014). Inside the Turk: Understanding Mechanical Turk as a
participant pool. Current Directions in Psychological Science, 23, 184-188. DOI:
10.1177/0963721414531598
Rittenberg, L. & Tregarthen, T. (2012). Principles of Microeconomics (Version 2.0).
Washington, DC: Flat World Knowledge, Inc.
Simonsohn, U. (2016). Two-lines: The first valid test of u-shaped relationships.
Sinclair C. D. (1982). GLIM for Preference. In R. Gilchrist (ed.), Proceedings of the
International Conference on Generalised Linear Models (pp. 164-178). New York:
Springer-Verlag.
Smith, A. K., Bolton, R. N., & Wagner, J. (1999). A model of customer satisfaction with
service encounters involving failure and recovery. Journal of Marketing Research, 36,
356-372. DOI: 10.2307/3152082
Thurstone, L. L. (1927). A law of comparative judgment. Psychological Review, 34, 273-286.
DOI: 10.1037/h0070288
Tullberg, J. (2006). Excesses of responsibility? – reconsidering company liability. Journal of
Business Ethics, 64, 69-81. DOI: 10.1007/s10551-005-5906-2
Webster, C., & Sundaram, D. S. (1998). Service consumption criticality in failure recovery.
Journal of Business Research, 41, 153-159. DOI: 10.1016/S0148-2963(97)00004-0