economics.usf.edueconomics.usf.edu/pdf/prevalence_final.docx · web viewplasmodium which is...
TRANSCRIPT
Malaria Prevalence, Indoor Residual Spraying, and Insecticide Treated Net Usage in Sub-Saharan Africa1
Gabriel PiconeDepartment of Economics
University of South Florida
Robyn KiblerDepartment of Economics
University of South Florida
Bénédicte H. ApoueyParis School of Economics -
CNRS
February 1 2017
Abstract
This paper examines the extent to which bed net usage is responsive to changes in malaria prevalence and whether indoor residual spraying crowds out bed net usage. We show that malaria prevalence increases the probability of sleeping under an insecticide treated net but the implied elasticities are below one. For children under five, a one percentage point increase in malaria prevalence increases the probability of sleeping under a bed net by 0.41 percentage point. We find that indoor residual spraying does not crowd out bed net usage. Instead, children under five who live in houses that were recently sprayed are 3.1 percentage points more likely to sleep under a bed net.
JEL Classification: I12, I15, I18, H4
Key Words: Malaria prevalence, Indoor residual spraying, Insecticide treated nets.
1 Corresponding author: Gabriel Picone, Department of Economics, University of S. Florida, 4202 E. Fowler Ave., CMC206A, Tampa, FL 33620, 813-974-6537, [email protected]. The authors thank two anonymous referees, Andrei Barbos, Patricia Jones, Joshua Wilde, and participants to the 9 th IHEA World Congress for helpful comments. The authors also thank the support of Grant Number R03TW009108 from the Fogarty International Center. The content is solely the responsibility of the authors and does not necessarily represent the official views of the Fogarty International Center or the National Institute of Health.
1

1. Introduction
Malaria is a life-threatening infection that is transmitted to people through the bites of
infected mosquitoes. Despite the existence of proven strategies to prevent the disease, malaria
remains one of the major causes of mortality in sub-Saharan Africa (WHO, 2011). In 1998, the
Roll Back Malaria (RBM) Partnership was launched to coordinate global efforts to fight malaria.
One of the main accomplishments of this collaboration was the development of the Global
Malaria Action Plan (GMAP) which was endorsed by the 2008 Millennium Development Goals
Malaria Summit (RBM, 2012). GMAP is the first global plan on how to control and eradicate
malaria, containing goals, strategies, costs, and timelines. The primary intervention recommended
by GMAP for sub-Saharan Africa is that every person at risk sleeps under an insecticide treated
net (ITN). Sleeping under an ITN is considered the most effective intervention to prevent malaria
because the mosquito dies immediately upon contact with the ITN, thereby preventing
individuals’ infection and reducing the mosquito population (Lengeler, 2004). The second most
important malaria control intervention recommended by GMAP for sub-Saharan Africa is indoor
residual spraying (IRS), which entails spraying the interior of dwellings with an insecticide to kill
the mosquitoes that spread the disease. In most cases, GMAP recommends that these two
interventions be used together (RBM, 2012).
One of the main contributions of Economics to Epidemiology is the recognition that
individuals adapt their health behaviors rationally in response to changes in the prevalence of an
infection. The “rational epidemics” theory highlights the interdependence between the infection
rate and preventive behaviors, which in turn affect the probability of becoming infected
(Geoffard and Philipson, 1996; Kremer, 1996; Philipson, 2000; Gersovitz and Hammer, 2003,
2005). A central measure in this theory is the “prevalence elasticity” of the individual demand for
prevention, which quantifies the effect of a change in the prevalence of the disease on
2
individuals’ preventive behaviors. We expect the elasticity of ITN usage with respect to malaria
prevalence to be positive, that is, when malaria prevalence decreases ITN usage also decreases.
Moreover, this elasticity could be either smaller than one (in that case, ITN usage would be
inelastic) or greater than one (ITN usage would be elastic). If ITN usage is elastic, a decline in
malaria prevalence will lead to a proportionally greater decrease in ITN usage. In contrast, if ITN
usage is inelastic, then as malaria prevalence declines, individuals will reduce their preventive
behaviors less than proportionally.
In addition to responding to malaria prevalence, individuals may also adapt their ITN
usage in response to government interventions such as IRS. Sleeping under an ITN is a private
behavior that requires active participation of individuals: they must hang the nets and sleep under
them. IRS programs are public preventive interventions provided free of charge by the national
malaria control programs, and they do not require active participation of individuals. If
individuals believe that IRS and ITN are substitutable, they will respond to the provision of IRS
by reducing their ITN usage and this “crowding out” may reduce the overall effectiveness of
controlling malaria with IRS. In contrast, if individuals believe that the public provision of IRS is
an indication of the importance of taking preventive measures against malaria in general (that is,
if they view IRS and ITN as complements), they will respond to IRS campaigns by increasing
their ITN usage.
In this study, we empirically estimate the malaria prevalence elasticity of sleeping under
an ITN and test whether IRS crowds out ITN usage. The existing literature finds that there is a
positive relationship between malaria prevalence and preventive behaviors, but the evidence is
mixed regarding the magnitude of this effect (Pattanayak el al. 2006; Seban et al., 2013;
Berthelemy et al. 2013). Similarly, there is no agreement on the substitutability or
complementarity between IRS and ITN (Chase et al., 2009; Carneiro et al. 2012). Compared to
3
our study, each of the previous articles regarding malaria prevalence and preventive behaviors
either is based on a relatively small sample of individuals, uses data from a very specific
geographical area with limited variation in malaria prevalence, or does not address the
endogeneity of malaria prevalence. We use information on a large sample of individuals from
nine sub-Saharan countries with diverse levels of malaria prevalence and we account for the
endogeneity of malaria prevalence.
We construct a unique dataset by merging data from four sources: (i) recent surveys from
the MEASURE Demographic and Health Surveys (DHS) program that contain individual- and
household-level information on ITN usage and IRS for nine sub Saharan African countries; (ii)
malaria prevalence and malaria genetic mutations data from the Malaria Atlas Project (MAP)
(iii) precipitation and temperature data from the Climatic Research Unit; and (iv) the Kiszewski
et al.’s (2004) index of malaria ecology.
We perform our analyses separately for four population groups: children under five, older
children, adult women, and adult men. We attempt to identify the causal effect of malaria
prevalence and household IRS on individual ITN usage. In our empirical specification, we
control for the intensity of the antimalarial (ITN and IRS) campaigns in the cluster where the
individual lives, we use different levels of area fixed effects (administrative areas and
geographical clusters), and we also instrument malaria prevalence to account for the potential
measurement error of prevalence and for the omitted variables bias. Our instruments for malaria
prevalence are the altitude of the cluster and the Kiszewski et al.’s (2004) index of malaria
ecology.
Our results show that malaria prevalence has a positive effect on the probability of
sleeping under an ITN for all four population groups but the implied elasticities are below one.
For instance, for children under five, when we control for geographical areas fixed effects and
4

use instrumental variables, a one percentage point increase in malaria prevalence increases the
probability of sleeping under an ITN by 0.41 percentage point. We also find that IRS does not
crowd out bed net usage. Instead, children under five who live in houses that received IRS are 3.1
percentage points more likely to sleep under an ITN.
The rest of the paper is organized as follows. Section 2 provides background information
on malaria and describes our data whereas section 3 contains a literature review. Section 4
outlines the empirical strategy while section 5 discusses the results. Section 6 presents extensions.
Finally, section 7 contains some concluding remarks.
2. Background and data
2.1. Malaria transmission and prevalence
Malaria is an infectious disease caused by the parasite Plasmodium which is transmitted
from one person to the next through the bites of an infected mosquito belonging to the Anopheles
genus. After biting a human infected by the parasite, the mosquito itself becomes infected and
turns into a vector of the disease which can transmit the parasite to another human through its
saliva when it bites him to feed. There are several species of the Plasmodium parasite that can
cause malaria in humans.i Among them, the Plasmodium falciparum is the most common and
deadly malaria transmitting specie (RBM, 2012). For this reason, in this study we refer to malaria
risks as those caused by the Plasmodium falciparum parasite.
In this article, we focus on nine sub- Saharan countries (Angola, Burundi, Cameroon,
Liberia, Madagascar, Malawi, Mozambique, Tanzania, and Uganda) which are divided into
clusters. We measure malaria prevalence as the Plasmodium falciparum parasite rate (PfPR) in
each cluster. Specifically, our measure of PfPR is PfPR2-10 for the year 2010, obtained from the
Malaria Atlas Project (MAP),ii which represents the percentage of children between the ages of
5

two and ten (the age group for which the parasite is most easily detected) who have measurable
levels of the Plasmodium falciparum parasite in their peripheral blood (Gething et al., 2011).
MAP uses parasite surveys as well as environmental data to calculate PfPR on a five by
five km grid using a geostatistical model. For Africa, MAP employs 16,131 parasite surveys
carried out between 1985 and 2012. Useful pieces of parasite survey information are the location-
time of each survey, the number of individuals tested for the parasite, and the number of
individuals infected with the parasite. The environmental data include rainfall, temperature, land
cover, and urban/rural status. In the geostatistical model, the imputed value of PfPR for a
particular target location is a weighted average of the observed values of PfPR (from the nearby
parasite surveys) and the predicted values of PfPR (computed using the environmental factors).
The weights reflect the spatial and temporal proximity between the target location and the
location of the parasite surveys. We describe the parasite surveys conducted in our nine countries
of interest in Appendix A and we discuss in more detail the geostatistical model in Appendix B.
We measure malaria risk using malaria prevalence. One could argue that malaria
incidence is a better proxy for the risk of contracting malaria than malaria prevalence. Malaria
incidence, as captured by the entomological inoculation rate (EIR), is the expected number of
infected bites per person per unit of time. We choose to use malaria prevalence because rich data
on PfPR are available for all of our countries of interest whereas data on EIR are sparse (given
the expense of assessing the number of infected bites) and because PfPR is an excellent proxy for
EIR.iii
2.2. Antimalarial campaigns
Malaria infections can be controlled using several preventive interventions: ITN usage,
IRS, intermittent preventive treatment uptake during pregnancy (IPTp), use of mosquito
repellants, cleaning of drains, and treatment of standing water with larvicidal chemicals. These
6

interventions work by reducing the number of mosquitoes and/or by preventing bites. Among
these, the two main strategies used to control malaria are ITN distribution and IRS.iv International
donors, such as the Global Fund and the President Malaria Initiative, provide ITNs and funding to
perform IRS in each country. Then, the National Malaria Control Programs (NMCP) for each
country is responsible for the distribution of nets and the implementation of IRS with the help of
non-governmental organizations.
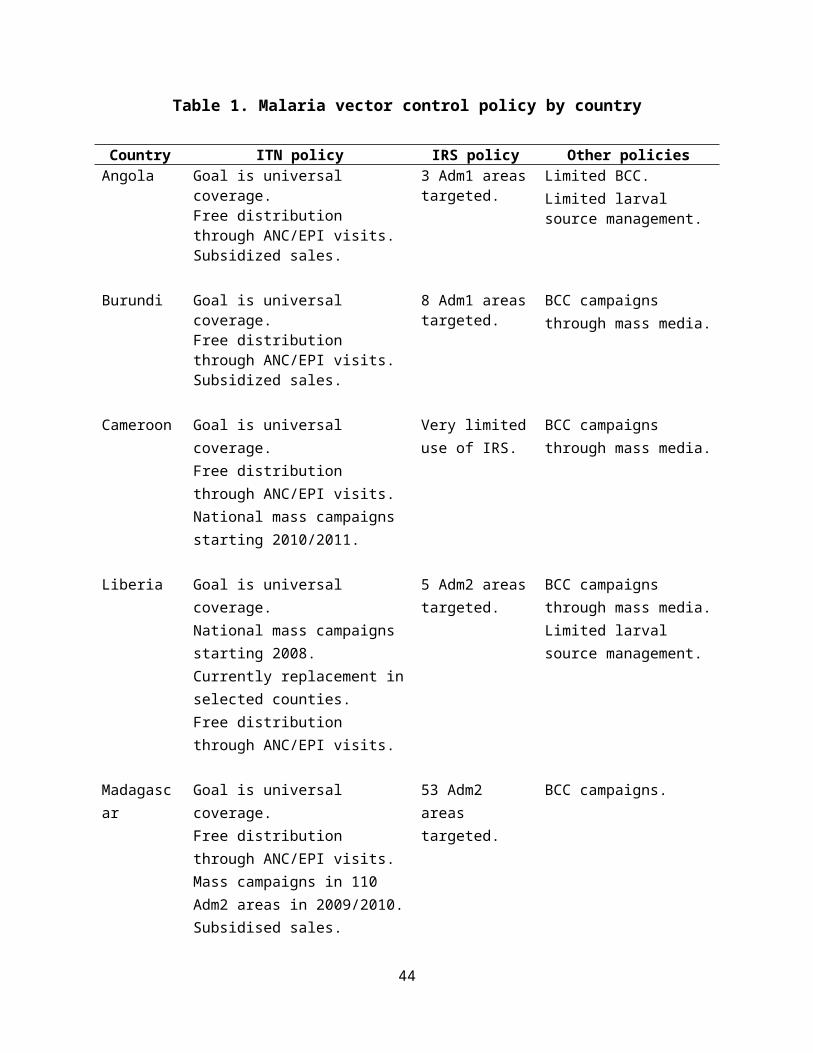
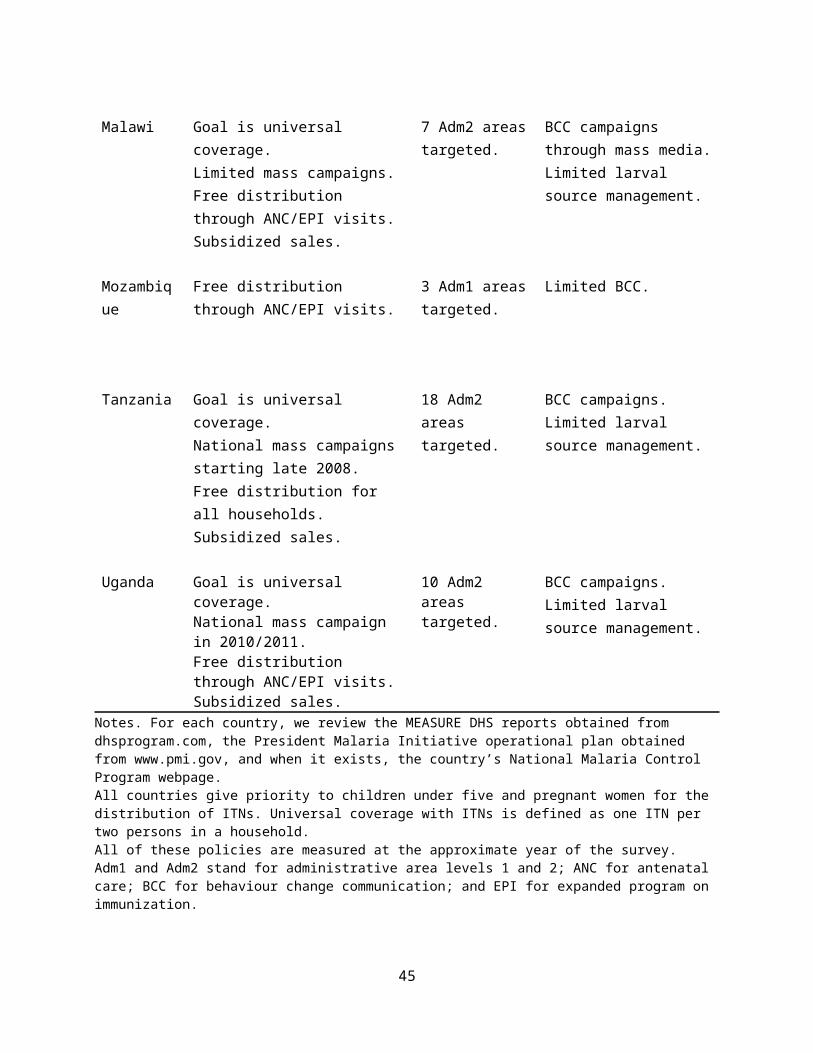
In Table 1, we review each of the nine countries’ malaria action plans, emphasizing how
ITNs are distributed, how IRS is implemented, and which other programs are developed to
control malaria.v All countries give priority to children under five and pregnant women because
they are particularly vulnerable (children under five lack immunity against the disease, whereas
pregnant women temporarily lose their immunity). Most countries have a goal of universal
coverage with nets (that is, one ITN per two individuals). There are several methods to distribute
ITNs: (i) commercial, (ii) commercial subsidized, (iii) free with antenatal care and immunization
visits, and (iv) free mass campaigns (door to door). In recent years, door to door mass campaigns
became a more common method of distributing ITNs. Door to door campaigns are not carried out
simultaneously in the whole country but district by district. At the time of the surveys, some
countries (for example, Liberia) have already achieved full national coverage and are at the
replacement stage (ITNs last between three and five years), while other countries (for example,
Angola) are still in the planning stage. In addition, in all countries, a few districts are targeted for
IRS. Some countries have behavioral change communication programs (BCC) that teach people
how to use ITNs and promote their use. BCC programs are usually achieved through mass media.
Finally, larval source management plays a minor role in malaria control.
2.3. The MEASURE Demographic and Health Surveys
7

All individual- and household-level information on ITN usage and ownership, IRS, and
sociodemographic characteristics come from the project of the Monitoring and Evaluation to
Assess and Use Results Demographic and Health Surveys (MEASURE DHS). Within this
project, we use data from the Standard Demographic Health Surveys (DHS), the Malaria
Indicator Surveys (MIS), and the AIDS Indicator Surveys (AIS). The standard DHS contain
detailed information on health and preventive health behaviors for children, women, and men.
MIS and AIS use the same basic questionnaire as the standard DHS, but have more detailed
questions about malaria or AIDS and do not include all the modules of the standard DHS. For
certain surveys, DHS/MIS/AIS have additional information on whether the house was sprayed
with insecticide and the number of mosquito nets owned by the household.vi
We restrict our analysis to the DHS/MIS/AIS surveys for sub-Saharan Africa that were
conducted in 2011 and 2012 and contain information on IRS. These restrictions leave us with the
following nine countries: Angola (MIS 2011), Burundi (MIS 2012), Cameroon (DHS 2011),
Liberia (MIS 2011), Madagascar (MIS 2011), Malawi (MIS 2012), Mozambique (DHS 2011),
Tanzania (AIS 2011-12), and Uganda (DHS 2011).
DHS/MIS/AIS samples are drawn from geographical clusters that are nationally
representative of the population. In rural areas a cluster is usually a village, and in urban areas it
is approximately a city block. There are 2,837 clusters in our sample, and Figure 1a shows their
spatial distribution. On average, 21.75 households and 106.88 individuals are interviewed in each
cluster. DHS/MIS/AIS provide the latitude and longitude of the centroid of these clusters, and we
use this information to combine the DHS/MIS/AIS with the level of malaria prevalence (PfPR) in
each cluster. Figure 1b shows that that there are large variations in the level of malaria prevalence
between clusters, ranging from less than 5 percent to over 75 percent. Note that areas where PfPR
is less than 5 percent must be treated with caution since malaria transmission is likely to be
8

seasonal and individuals may respond differently to changes in malaria prevalence. For these
reasons, we restrict our sample to areas where PfPR is greater than 5 percent.
[Insert Figure 1]
3. Literature review
The previous literature finds that ITN usage is positively associated with malaria
prevalence or risk. Indeed, using data from Tanzania, Winch et al. (1994) show that seasonal
variation in mosquito population and febrile episodes is associated with the use of ITNs.
Moreover, Yasuoka et al. (2006) show that household malaria history is associated with malaria
prevention. More recently, Berthélemy et al. (2013) conducted a village level analysis using data
for Uganda in 2009 and found that malaria prevalence is positively correlated with the usage of
ever treated nets in villages.
However, previous results regarding the magnitude of the effect of malaria prevalence on
preventive behaviors and the substitutability/complementarity between IRS and ITN are
somewhat contradictory. As far as the magnitude of the effect is concerned, Pattanayak et al.
(2006) use country-level data in Ethiopia and India and find that the elasticity for net usage
equals 0.159, while for nets sold it equals 0.520. As shown below, our results for nine sub-
Saharan countries are consistent with these findings, since we find that malaria preventive
behaviors are inelastic with respect to prevalence. The low responsiveness of individuals’ malaria
preventive behaviors to changes in malaria prevalence are in line with the findings of Oster
(2012) who highlights low levels of behavioral responses to high HIV infection rates in Africa. In
contrast, using household level data from the Haut Katanga district in the Democratic Republic of
Congo in 2009, Seban et al. (2013) find that bed net ownership is elastic with respect to malaria
prevalence. Seban et al.’s findings are consistent with the elastic response for individual
9
preventive behaviors for HIV and influenza infection rates in developed countries (Ahituv et al.,
2006; Philipson, 2000).
Regarding the relationship between IRS and ITN, Chase et al. (2009) make use of data
from a district in Mozambique to find that individuals who receive IRS are less willing to pay for
ITNs. However, using experimental data from a region in Eritrea, Carneiro et al. (2012) show
that receiving IRS increases ITN ownership and usage. Consistent with this finding, our results
suggest that IRS and ITN usage are complements (see below).
4. Conceptual framework and empirical strategy
In this subsection, we discuss the decision of the malaria control official (a social planner)
regarding the intensity of the antimalarial campaigns in each area, and we explain how this
decision affects the malaria prevalence level and individual ITN usage. We consider a country
that is divided into several areas (g) which are at risk of malaria. We assume that the malaria
control official who is in charge of antimalarial policies determines the proportion of houses that
will be sprayed with insecticide in area g (IRSg) and the number of nets that will be distributed
(ITNg). We also assume that the level of malaria prevalence in each area g is given by
MPg=MP ( MPg0 , ITN g , IRSg ) where MPg
0 is the level of malaria prevalence in the absence of
antimalarial policies, that is, when ITN g=IRSg=0. Without loss of generality, we also assume
that there are only two areas in the country (g=1,2).
The malaria burden for the whole country can be written as:
MP (MP10 , ITN 1 , IRS1 )+MP ( MP2
0 , ITN2 , IRS2 )
The objective of the social planner is to choose the optimal levels ofITN1, ITN2, IRS1, and IRS2
that minimize the malaria burden in the country, subject to two budget constraints. One budget
constraint depends on the total number of ITNs that the social planer received from international
10

donors and the cost of nets distribution in each area. The other budget constraint depends on the
amount of IRS that the social planner received from international donors and the cost of
providing IRS in each region. We denote ITN g¿ and IRSg
¿ the solutions to this minimization
problem. The observed level of malaria prevalence in the area is the result of the choices of the
malaria control official, MPg¿=MP ( MPg
0 , ITN g¿ , IRSg
¿ ) .
Next, the planner distributes ITN g¿ and IRSg
¿ in region g. Let itnig¿ and irsig
¿ denote the
quantities received by household i, and ITN−ig¿ and IRS−ig
¿ denote the quantities received by other
households in the area. We assume that itnig¿ is distributed among the household members
according to some allocative process.
Finally, individuals decide whether to sleep under an ITN on a particular night. This
decision depends not only on the level of malaria prevalence in the area (MPg¿ ), but also on the
four variables that describe the intensity of the malaria campaigns (itnig¿ , irsig
¿ , ITN−ig¿ , and IRS−ig
¿ )
because these four variables will also affect the individual’s perception of the risk of contracting
malaria and the usefulness of these technologies. We then model the probability that individual i
sleeps under an ITN as:
Slept ITNig=β0+β1 MPg¿+β2irsig
¿ +β3itnig¿ +β4 IRS−ig
¿ +β5 ITN−ig¿ +Other factors (1)
We expect increases in malaria prevalence (MPg¿ ) to have a positive effect on ITN usage
because the risk of contracting malaria is higher. Household IRS (irsig¿ ) will have a negative effect
on ITN usage if IRS crowds out ITN usage and a positive effect on ITN usage if public provision
of IRS signals to individuals that the health concerns of malaria are larger than previously
thought (Carneiro et al., 2012). The number of ITNs that the household owns (itnig¿ ) should have a
positive effect on ITN usage because when this number increases, the cost of using an ITN
decreases (that is, the likelihood that individuals need to share a bed to sleep under an ITN
11

decreases). The level of IRS of other households in the area (IRS−ig¿ ) and the number of ITNs
received by other households in the area (ITN−ig¿ ) could have either a positive or a negative
impact on ITN usage, depending on whether individuals see these variables as complements or
substitutes to their own ITN usage. They will be substitutes if ITN usage and IRS by others in the
area creates health externalities similar to the ones described by Bennett (2011) for sanitation.
Our goal is to estimate the effects of malaria prevalence and household IRS in equation
(1) for children under five, older children (ages 5-14), adult women (ages 15-49), and adult men
(ages 15-49). These population groups have different levels of immunity against malaria and
may respond differently to changes in malaria prevalence and household IRS. Although we are
not interested in the effect of the antimalarial campaigns on ITN usage per se, we must account
for them in our empirical specification; otherwise, our estimates of malaria prevalence and
household IRS will be biased. To this end, we replace the four malaria campaigns’ intensity
variables with their sample counterparts and estimate:
Slept ITNic=β0+ β1 MalPrc+β2irsic +β3 itnic
+ β4 IRS−ic+β5 ITN−ic+β6 X ic+vg+v ic . (2)
where i denotes the individual, c the cluster, and g the area where the cluster is located. Slept ITNic
is a binary variable for whether the individual slept under an ITN the night preceding the
interview. We do not distinguish between long lasting insecticidal nets (LLINs), a relatively new
technology, and regular ITNs that need to be re-impregnated every six months (RBM, 2012)
because some of our surveys do not allow such a distinction. MalPr c is malaria prevalence for
2010 in the cluster where the individual lives; irsic is a binary variable for whether the inside
walls of the house were sprayed with insecticide during the 12 months preceding the interview;
itnic is the number of ITNs per person in the household; IRS−ic denotes the share of households in
the cluster, excluding household i, whose houses were sprayed with insecticide during the past 12
12

months; and ITN−ic is the number of ITNs divided by the number of persons in the cluster,
excluding the number of ITNs and persons in household i. We estimate equation (2) using linear
models; the standard errors are robust to heteroskedasticity and are clustered at the geographical
cluster level c.
The controls Xic include information on sociodemographic characteristics, precipitation
and temperature, and malaria-related genetic mutations. The sociodemographic variables are age
(for older children and adults), the mother’s age (for children under five), household size, and
binary variables for: being a male (for children under five and older children), being the child of
the household head (for children under five and older children), living in an urban area, whether
the mother completed primary education (for children under five), whether the individual
completed primary education (for adults), and whether the individual lives in a household with
the lowest indicators of wealth. The latter variable is a binary variable for whether the household
has none of these items: an improved water source, improved sanitation facilities, and
electricity.vii The precipitation and temperature variables are the monthly precipitation and
temperature deviations from the annual monthly mean in the cluster.viii The malaria related
genetic mutation we control for is the cluster percentage of individuals with Glucose-6-phosphate
dehydrogenase (G6PD) deficiency.ix As discussed in Jones (2014) and Capellini and Fiorelli
(2008), G6PD deficiency is asymptomatic and does not affect life expectancy or quality of life,
but it gives individuals substantial protection against severe malaria. The G6PD deficiency
prevalence in the cluster should have a direct effect on ITN usage because clusters with higher
levels of G6PD deficiency are likely to have fewer episodes of severe malaria, holding all else
constant.x
The area specific effects vg are either level 1 or 2 administrative areas (Adm1 or Adm2)
fixed effects, or cluster fixed effects. Levels 1 and 2 administrative areas correspond to the largest
13

and next-largest administrative areas respectively (for example a state and a county in the US). In
our data, there are 178 Adm1 and 760 Adm2 areas.xi These area fixed effects control for
unobserved location-specific factors that are correlated with malaria prevalence and/or household
IRS and have their own effect on ITN usage. For example, they account for other antimalarial
control interventions, such as BCC, that are usually implemented using mass media campaigns.
However, BCC may potentially vary even within Adm1 or Adm2 levels. For a subset of countries
(Angola, Liberia, Madagascar, Malawi, and Tanzania), the DHS data contain information on
whether women in the household heard an antimalarial message and whether this message was
given by a health care promoter/provider. For this smaller set of countries, we are thus able to
estimate an additional specification that includes these household-level BCC variables.
As discussed earlier, clusters in our data are the size of a village or a city block.
Controlling for cluster fixed effects should completely account for omitted area-level variables
that affect individual-level ITN usage. Because MalPr c is cluster specific, its effect is captured by
the cluster fixed effects and cannot be estimated using this specification. However, this
specification should give us an accurate and consistent estimate of the effect of household IRS on
ITN usage. We believe that after controlling for the cluster fixed effects and the household
number of ITNs, households are as good as randomly selected to receive IRS.
Our main identification concern is that MalPr c might still be endogenous due to
measurement errors and/or other forms of location-specific omitted variable bias, in spite of the
Adm1 or Adm2 area fixed effects. Indeed, malaria prevalence can be measured with error for two
reasons. First, in our data, the latitude and longitude of the clusters may be slightly shifted for
privacy reasons so that the actual area of residence of individuals is sometimes indicated with
error. Second, our measure of malaria prevalence is an approximation of the average percentage
14
of individuals infected with the parasite in a cluster in 2010, but the true level of malaria
prevalence at the time of the interview is likely to be different.
Additionally, malaria prevalence in the cluster, PfPR in 2010, may be correlated with
cluster level antimalarial campaigns, other than ITN distribution and IRS campaigns, which we
do not control for in our specification. Although ITN usage and IRS are the main interventions
recommended by international donors to control malaria, we cannot rule out that local
governments also implemented other measures such as behavioral change communication
programs (BCC), cleaning of drains and treatment of standing water with larvicidal chemicals to
control for malaria prevalence in the cluster (see Section 2.2 for a discussion of all antimalarial
campaigns). All of these omitted antimalarial campaigns are likely to be positively correlated
with PfPR in 2010 leading to a positive bias. However, the overall direction of the bias, assuming
a positive effect of malaria prevalence on sleeping under an ITN, is unclear since measurement
error leads to the well-known problem of attenuation bias.
To address these concerns, we also estimate equation (2) using instrumental variables.
Our instruments for MalPr c are the cluster altitude and the Kiszewski et al.’s malaria ecology
index (Kiszewski et al., 2004). Altitude is the elevation (in meters) of the cluster, obtained by
DHS using a GPS receiver. The Kiszewski et al.’s malaria ecology index was developed by
Kiszewski et al. (2004) and is available from the Earth Institute at Columbia University.xii It
depicts the stability of malaria transmission for the whole world by combining information on the
biological characteristics (that is, the human feeding rates, daily survival rates, and incubation
period) of the dominant Anopheles vectors and on climatic conditions.xiii Specifically, for each
region-country, Kiszewski et al. (2004) find the dominant Anopheles vector on a month by month
basis. In total, they identify 34 dominant Anopheles vectors with different feeding rates and daily
survival rates. They also identify 260 regions as malarious or potentially malarious. Then, using
15

climatic factors such as vegetation indexes, elevation/altitude, monthly precipitation, and monthly
temperature thresholds (all of these variables measured in 0.5° cells), they calculate the limits of
the distribution of the dominant vector within a region for each month. For example, they use a
monthly temperature threshold of 15°C. Finally, for each 0.5° cell, they calculate the suitability
index as: ∑m=1
12
a i ,m2 p i ,m
E /−ln ( pi ,m) where m is the month; i is the dominant vector; a is the human
feeding rate of i; p is the daily survival rate of i; and E is the length of extrinsic incubation period
in days. E is inversely related to monthly temperature. So when temperature is lower, the
incubation period is longer and an infected Anopheles vector is less likely to survive long enough
to infect a human.
We expect both of our instruments to have high predictive power in explaining variations
in malaria prevalence. Altitude should be negatively correlated with malaria prevalence because
altitude is negatively associated with malarial conditions (WHO, 2011) and the Kiszewski et al.’s
malaria ecology index should be positively correlated with malaria prevalence by construct. Even
though altitude and the Kiszewski et al.’s malaria ecology index are obviously correlated, there
should still be a significant level of independent variation between our two instruments. In our
sample, the correlation coefficient between altitude and the Kiszewski et al.’s malaria ecology
index is around -0.26 which leaves a substantial amount of separate variation.
We argue that, controlling for other factors, altitude and the Kiszewski et al.’s index only
have an impact on ITN usage through malaria prevalence. Altitude is correlated with temperature
which may affect the probability of sleeping under an ITN. However, we control for temperature
during the month of the interview in our specifications. A potential concern with the Kiszewski
et al.’s malaria ecology index is that it may be correlated with the prominence of mosquito bites
in the cluster. This has a direct impact on ITN usage if individuals use ITNs because they dislike
16

being bitten by mosquitoes, regardless of the malaria risks associated with the bites. Note
however that most bites are not from Anopheles mosquitoes but from other species that do not
carry malaria.xiv The Kiszewski index, which is estimated for the Anopheles mosquitoes, is thus
less likely to capture the effect of mosquito bites on ITN usage. Moreover, the index does not
capture mosquito abundance.
5. Main results
Table 2 presents the summary statistics separately for our four population groups.
Children under five, who are the most vulnerable group, are the most likely to sleep under an
ITN. Indeed, 44.7 percent of young children slept under an ITN the previous night, versus 44.1
percent of women, 33.8 percent of older children, and 33.1 percent of men. Mean malaria
prevalence is around 35 percent. Approximately 17 percent of individuals had their dwellings
sprayed with an insecticide (IRS) in the year preceding the interview. On average, there is one
ITN per four individuals in a household. The average fraction of households sprayed with IRS in
the cluster is 0.17 and average number of ITNs per person in the cluster is 0.25. Most mothers
completed primary education (61%), about one-third of individuals live in households with the
lowest indicators of wealth (34% for children under five) and in urban areas (27% for children
under five), 12 percent of individuals have G6PD deficiency, and the average monthly
temperature is 23°C.
[Insert Table 2]
Table 3 contains our main results for the effects of malaria prevalence and household IRS.
Columns (1) and (2) report results using Adm1 and Adm2 fixed effects respectively, while
column (3) shows the cluster fixed effect results. Controlling for Adm1 fixed effects (column
(1)), the effect of malaria prevalence on the probability of sleeping under an ITN is consistently
positive and significant. Moreover, the effects are well below unity. For example, a 1 percentage
17

point increase in malaria prevalence increases the probability of sleeping under an ITN by 0.16
percentage point for children under five, 0.19 percentage point for older children, 0.22 percentage
point for adult females, and 0.13 percentage point for adult males. If a household receives IRS,
the probability of sleeping under an ITN increases by 2.4 percentage points for children under
five, 2.2 percentage points for older children, 1.2 percentage points for adult females, and 1
percentage points for adult males. This suggests that individuals consider the public provision of
IRS to be complementary to their private use of an ITN. The effect of receiving IRS is also large
relative to the effect of malaria prevalence: for example, for children under five, receiving IRS
has the same effect as a 14.6 percentage points increase in malaria prevalence (which corresponds
to approximately one standard deviation).
When we include Adm2 fixed effects (column (2)), the coefficients on malaria prevalence
decrease for all four population groups and become insignificant for children under five and adult
males. However, the coefficients are still positive for all specifications. On the other hand, the
effects of household IRS are similar to those in column (1) although the standard errors are
larger. It is important to note that even though Adm2 areas are more disaggregate than Adm1
areas and better account for area specific omitted factors, compared to Adm1 fixed effects, Adm2
fixed effects accentuate the attenuation bias due to the measurement error.
In Table 3, column (3), we control for cluster fixed effects, which gives us the most
reliable estimates of the impact of household IRS. For children under five, older children, and
adult females, the coefficients on household IRS are slightly larger than in columns (1) and (2)
for all specifications. Being a member of a household that received IRS increases the probability
of sleeping under an ITN by 3.1 percentage points for children under five, 2.3 percentage points
for older children, and 1.5 percentage points for adult females. These results suggest that IRS
does not crowd out ITN usage and that ITN and IRS are complements rather than substitutes.xv
18

[Insert Table 3]
Table 4 reports the results of our main explanatory variables controlling for the two BCC
variables described in Section 3 to reduce the potential omitted variable bias due to unmeasured
antimalarial campaigns in Table 3. Specifically, for the subsample for which BCC variables are
available, columns (1), (3), and (5) present the results of the model that does not control for
household-level BCC variables, while columns (2), (4), and (6) contain the estimates for the
model that does control for household-level BCC variables. Columns (1), (3), and (5) give similar
results as Table 3 especially for malaria prevalence. For example, for children under five, a one
percentage point increase in malaria prevalence increases ITN usage by 0.151 percentage points
when Adm1 fixed effects are included and 0.125 percentage points when Adm2 fixed effects are
used. For the full sample in Table 3, the corresponding effects were 0.164 and 0.061,
respectively. Controlling for BCC variables at the household level does not affect the estimates of
malaria prevalence or household IRS in Table 4, columns (2), (4), and (6). These results support
the main results (for the full sample) in Table 3 in which we control for BCC and other location-
specific, unobservable variables using areas fixed-effects.2
[Insert Table 4]
Table 5 presents the instrumental variables results. Panel A reports the results for children
under five and older children, while Panel B presents the results for adult females and males. The
top section of each panel reports the second stage estimates and the bottom section reports the
first stage estimates for the instruments. Using Adm1 fixed effects, a one percentage point
increase in malaria prevalence increases the probability of sleeping under an ITN by 0.761
percentage point for children under five, 0.671 percentage point for older children, 0.608 2 Although the coefficients for household IRS are not statistically significant, likely due to the reduced sample size, their magnitudes are similar to those in Table 3. The preferred specification for the effect of IRS are presented in Table 3 in which we control for cluster FE, which provides consistent estimates for household IRS under weak assumptions.
19
percentage point for adult females, and 0.268 percentage points for adult males. The
corresponding effects using Adm2 fixed effects are 0.408, 0.173, 0.422, and 0.002. Although
these coefficients are still below unity, they are usually a bit larger than the OLS estimates
presented in Table 3. We cannot reject the null hypothesis that one of our instruments is
exogenous, using the Hansen J-test in any of our specifications using Adm2 fixed effects, but we
only fail to reject at one percent level for adult males using Adm1 fixed effects. However, the
Hansen J statistic is never above 10.
The bottom section of each panel shows the first stage results. For all specifications, our
instruments have the expected sign and a high predictive power. In the sample of children under
five, a one meter increase in altitude decreases malaria prevalence by -0.011 percentage point and
a one percentage point increase in the Kiszewski et al.’s malaria ecology index increases malaria
prevalence by 0.137 percentage point using Adm1. The effects are virtually identical for all
population groups and if we use Adm2 fixed effects.
[Insert Table 5]
Overall our results show that malaria prevalence has a positive effect on the probability of
sleeping under an ITN, but the elasticities in percentage points are always below one. We also
confirm that household IRS is positively correlated with the probability of sleeping under an ITN.
6. Extensions
In the interest of conserving space, we only report the results of this section for children
under five (our most important group). Results for other groups are available upon request.
6.1 Traditional elasticities and probit results
So far, taking advantage of the linear probability models, we have interpreted the effect
of malaria prevalence as the effect of a one percentage point increase in malaria prevalence on
the percentage point change in the probability of using an ITN. It is also informative to estimate
20

the standard elasticity measures, that is, the impact of a one percent increase in malaria
prevalence on the percentage change in ITN usage. The elasticities derived from the linear
probability models are likely to be implausible because the predictions of the probability of using
an ITN may be less than zero or greater than one. To avoid this problem, we estimate the
standard elasticities using a probit model.
Table 6 reports the average partial effects, the elasticity at the average, and the average
elasticity of malaria prevalence controlling for Adm1 fixed effects.xvi Unsurprisingly, the average
partial effects from the probit model are similar to the estimates of the same specification from
the linear probability model (0.142 in Table 6, column (1), versus 0.164 in Table 3, column (2)).
The elasticity at the average is 0.183 and the average elasticity is 0.207. Thus standard elasticities
measures are slightly larger than the elasticity in percentage point for our study.
[Insert Table 6]
6.2. Just-identified instrumental variables results
We also estimate equation (2) using each instrumental variable separately (just-identified
model). If the instruments are valid and instrumental variables estimates are consistent, results
from the just-identified models should be similar to those from the two instruments model. Table
7 reports the just-identified models. Columns (1) and (2) show the results using Adm1 fixed
effects and columns (3) and (4) using Adm2 fixed effects.
An increase in malaria prevalence leads to a higher probability of sleeping under an ITN
using altitude or the Kiszewski et al.’s malaria ecology index as an instrument for Adm1 and
Adm2 fixed effects. However, the effects of malaria prevalence are larger and more precisely
estimated when using altitude as an instrument (0.828 using Adm1 and 0.426 using Adm2).
Altitude also has a higher predictive power on malaria prevalence in the first stage, and the effect
21

of altitude on malaria prevalence is similar (-0.011) regardless whether we control for Adm1 or
Adm2 fixed effects.
[Insert Table 7]
6.3. Heterogeneity analysis
We now explore whether the impact of malaria prevalence on ITN usage varies with the
level of malaria prevalence. For this heterogeneity analysis, we employ the baseline specification
with Adm2 fixed effects and the Adm2 instrumental variables specification.
Using a spline regression, we first allow the effect of prevalence to be different for areas
in which prevalence is low (PfPR is between 5% and 20%), intermediate (PfPR is between 20%
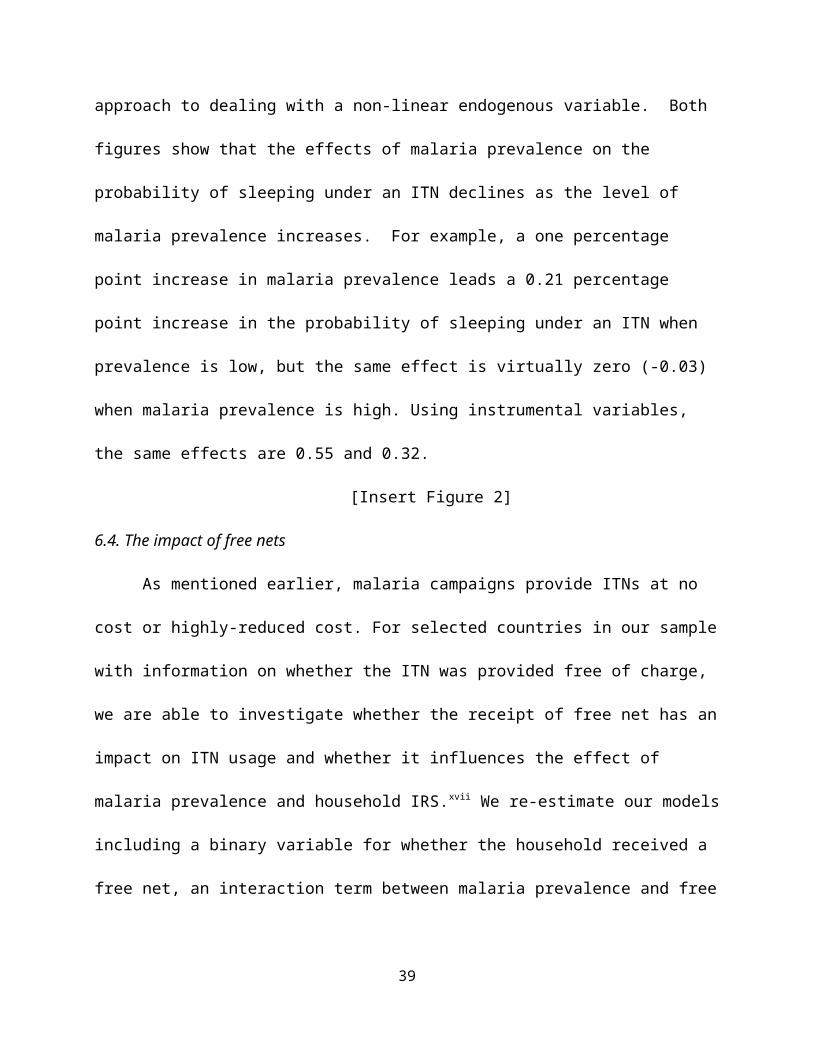
and 40%), and high (PfPR is greater to 40%). Figure 2 graphs the coefficients on malaria
prevalence for the three categories of prevalence. The bold dots represent the coefficients on
malaria prevalence, and the bars, the 95 percent confidence intervals. Panel (a) shows the results
using Adm2 fixed effects and panel (b) the Adm2 instrumental variables results. We implement
the Adm2 instrumental variables method using the control function approach to dealing with a
non-linear endogenous variable. Both figures show that the effects of malaria prevalence on the
probability of sleeping under an ITN declines as the level of malaria prevalence increases. For
example, a one percentage point increase in malaria prevalence leads a 0.21 percentage point
increase in the probability of sleeping under an ITN when prevalence is low, but the same effect
is virtually zero (-0.03) when malaria prevalence is high. Using instrumental variables, the same
effects are 0.55 and 0.32.
[Insert Figure 2]
6.4. The impact of free nets
As mentioned earlier, malaria campaigns provide ITNs at no cost or highly-reduced cost.
For selected countries in our sample with information on whether the ITN was provided free of
22

charge, we are able to investigate whether the receipt of free net has an impact on ITN usage and
whether it influences the effect of malaria prevalence and household IRS.xvii We re-estimate our
models including a binary variable for whether the household received a free net, an interaction
term between malaria prevalence and free net, and another interaction term between household
IRS and free net.
Table 8 column (1) reports the Adm2 fixed effects results and column (2) reports results
using Adm2 fixed effects and instrumental variables. Receiving a free net is positively and
significantly correlated with ITN usage for both specifications. In addition, the receipt of free
nets significantly reduces the effect that malaria prevalence has on the decision to sleep under an
ITN. Thus individuals getting ITNs for free become more insensitive to changes in malaria
prevalence and are more likely to use ITNs. These findings are consistent with those of Cohen
and Dupas (2010) who show, using experimental data, that individuals are more likely to utilize
ITNs when provided at no cost rather than at highly subsidized prices. A plausible explanation is
that individuals interpret the free distribution of ITNs as an indicator of the benefits of ITN usage.
Additionally, we also find that individuals with a free net are more likely to consider IRS
to be a complement to their individual net usage. For instance, when using Adm2 fixed effects,
IRS increases the probability of sleeping under an ITN by 0.058 percentage points for those with
a free net.
[Insert Table 8]
7. Conclusion
The most important private preventive behavior to avoid malaria infections is to sleep
under an ITN. This paper shows that individuals respond to increases in malaria prevalence by
increasing their ITN usage. Moreover, individuals who live in households that received IRS
during the previous 12 months are more likely to sleep under ITN. These results hold for children
23
under five, older children, adult women, and adult men. Our conclusions do not change when we
control for cluster fixed effects when analyzing the effects of household IRS and when we
account for the potential endogeneity of malaria prevalence using instrumental variables.
We show that increases in malaria prevalence lead to less than proportional increases in
the probability of sleeping under an ITN, which is consistent with the results of Pattanayak et al.
(2006). This finding has important policy implications because if individuals respond to
reductions in malaria prevalence with proportionally larger decreases in private preventive
behaviors, further reductions in malaria prevalence will be considerably more expensive to
achieve with current technologies. Positive and less than proportional preventive responses were
also found for another infectious disease in Africa, HIV (Oster, 2012).
That receiving IRS (a public intervention) does not “crowd out” ITN usage (a private
behavior) may seem surprising to some economists if they assume that these two interventions
are substitutes for each other. However, our results for IRS are similar to those of Carneiro et al.
(2012) who use experimental data for Eritrea. We agree with Carneiro et al.’s signaling
explanation: individuals may have poor information on the dangers of malaria and the benefits of
protection, and so the public provision of malaria preventive behaviors may signal the importance
of the dangers of the disease and benefits of prevention. Consistent with this signaling
hypothesis, we find that free net distribution increases ITN usage but decreases individuals’
response to changes in malaria prevalence.
Some caveats to our results must be mentioned. First, our estimates for malaria prevalence
using area fixed effects likely provide lower bounds of the true effects because of measurement
error and omitted variable bias. Indeed, our estimates for malaria prevalence using instrumental
variables are larger but still considerably less than one. Second, we focus on areas/clusters where
malaria prevalence is above 5 percent, but the responsiveness of ITN usage to changes in malaria
24

prevalence may be different for areas where malaria prevalence is less than 5 percent. These are
interesting avenues for future studies.
25
Table 1. Malaria vector control policy by country
Country ITN policy IRS policy Other policiesAngola Goal is universal coverage.
Free distribution through ANC/EPI visits.Subsidized sales.
3 Adm1 areas targeted.
Limited BCC.Limited larval source management.
Burundi Goal is universal coverage.Free distribution through ANC/EPI visits.Subsidized sales.
8 Adm1 areas targeted.
BCC campaigns through mass media.
Cameroon Goal is universal coverage.Free distribution through ANC/EPI visits.National mass campaigns starting 2010/2011.
Very limited use of IRS.
BCC campaigns through mass media.
Liberia Goal is universal coverage.National mass campaigns starting 2008.Currently replacement in selected counties.Free distribution through ANC/EPI visits.
5 Adm2 areas targeted.
BCC campaigns through mass media.Limited larval source management.
Madagascar Goal is universal coverage.Free distribution through ANC/EPI visits.Mass campaigns in 110 Adm2 areas in 2009/2010. Subsidised sales.
53 Adm2 areas targeted.
BCC campaigns.
Malawi Goal is universal coverage.Limited mass campaigns.Free distribution through ANC/EPI visits.Subsidized sales.
7 Adm2 areas targeted.
BCC campaigns through mass media.Limited larval source management.
Mozambique Free distribution through ANC/EPI visits.
3 Adm1 areas targeted.
Limited BCC.
26

Tanzania Goal is universal coverage.National mass campaigns starting late 2008.Free distribution for all households.Subsidized sales.
18 Adm2 areas targeted.
BCC campaigns. Limited larval source management.
Uganda Goal is universal coverage.National mass campaign in 2010/2011.Free distribution through ANC/EPI visits.Subsidized sales.
10 Adm2 areas targeted.
BCC campaigns. Limited larval source management.
Notes. For each country, we review the MEASURE DHS reports obtained from dhsprogram.com, the President Malaria Initiative operational plan obtained from www.pmi.gov, and when it exists, the country’s National Malaria Control Program webpage.All countries give priority to children under five and pregnant women for the distribution of ITNs. Universal coverage with ITNs is defined as one ITN per two persons in a household. All of these policies are measured at the approximate year of the survey.Adm1 and Adm2 stand for administrative area levels 1 and 2; ANC for antenatal care; BCC for behaviour change communication; and EPI for expanded program on immunization.
27

Table 2. Descriptive statistics
Children under five
Older children
Adult females
Adult males
Dependent variableSleeping under an ITN 0.447 0.338 0.441 0.331the previous night (0.497) (0.473) (0.496) (0.470)
Explanatory variablesMalaria prevalence 0.355 0.354 0.337 0.353
(0.152) (0.155) (0.156) (0.154)
ITNs and IRS campaignsHousehold IRS 0.168 0.178 0.171 0.165(Household received IRS) (0.374) (0.383) (0.376) (0.371)Household ITN 0.244 0.240 0.290 0.253(# of ITNs per household member) (0.221) (0.232) (0.284) (0.281)Cluster IRS 0.168 0.171 0.164 0.162(% of households with IRS in the cluster) (0.374) (0.300) (0.290) (0.283)Cluster ITN 0.253 0.261 0.282 0.245(# of ITNs per person in the cluster) (0.154) (0.156) (0.169) (0.149)
Socio-demographic characteristicsMale 0.498 0.496 - -
(0.500) (0.499)Age 2.003 9.239 28.031 28.238
(1.420) (2.828) (9.397) (9.631)Child of the household head 0.747 0.726 - -
(0.434) (0.445)Woman completed primary education - - 0.777 -
(0.416)Mother’s age 25.213 - - -
(11.330)Mother completed primary education 0.609 - - -
(0.487)Lowest indicators of wealth 0.340 0.317 0.285 0.262
(0.473) (0.465) (0.451) (0.440)Household size 6.758 7.208 6.412 6.036
(3.346) (3.245) (3.483) (3.340)Urban 0.270 0.288 0.354 0.397
(0.444) (0.452) (0.478) (0.489)
28

Area characteristicsG6PD deficiency 0.114 0.116 0.116 0.116
(0.046) (0.045) (0.045) (0.046)Precipitation level (mm) 114.4 112.1 116.1 112.9
(82.30) (84.65) (85.22) (88.92)Precipitation deviation 8.664 6.581 11.11 3.090
(66.15) (66.79) (68.45) (68.06)Temperature level (°C) 23.43 23.41 23.51 23.49
(2.635) (2.673) (2.629) (2.710)Temperature deviation -0.042 -0.110 -0.035 -0.084
(1.642) (1.681) (1.644) (1.681)
InstrumentsKiszewski et al.’s malaria ecology index 7.913 7.910 7.809 7.797
(6.185) (6.227) (6.326) (6.427)Altitude 615.2 632.8 632.0 566.2
(558.9) (558.9) (566.9) (547.2)
Countries 9 9 9 9Adm1 areas 178 178 178 178Adm2 areas 760 760 760 760Clusters 2,834 2,834 2,834 2,804Observations 54,390 87,954 69,713 54,844
29

Table 3. Malaria prevalence, household IRS, and ITN usage
Dependent variable: Slept under an ITN the previous night(1) (2) (3)
Adm1 FE Adm2 FE Cluster FE
Panel A. Children under five
Malaria prevalence 0.164*** 0.061 -(0.042) (0.066)
Household IRS 0.024*** 0.026*** 0.031***
(0.009) (0.009) (0.009)Observations 54,316 54,316 54,390R-squared 0.394 0.416 0.461
Panel B. Older children
Malaria prevalence 0.192*** 0.114* -(0.038) (0.064)
Household IRS 0.022*** 0.021*** 0.023***
(0.008) (0.008) (0.008)Observations 87,789 87,789 87,954R-squared 0.437 0.455 0.492
Panel C. Adult females
Malaria prevalence 0.217*** 0.173*** -(0.041) (0.062)
Household IRS 0.012* 0.013* 0.015*
(0.007) (0.007) (0.008)Observations 69,576 69,576 69,713R-squared 0.348 0.367 0.406
Panel D. Adult males
Malaria prevalence 0.131*** 0.024 -(0.041) (0.064)
Household IRS 0.010 0.010 0.009(0.008) (0.008) (0.008)
Observations 54,715 54,715 54,844R-squared 0.352 0.369 0.409
Malarial control campaignsHousehold ITN Yes Yes YesCluster IRS (others) Yes YesCluster ITNs (others) Yes Yes
Fixed effects Adm1 Adm2 ClusterNotes. All models include controls for age, age of the mother (for children under five), household size, male (for children under five and older children), child of the household head (for children under five and older children), mother completed primary education (for children under five), woman completed primary education (for adult females), lowest indicators of household wealth, urban area, G6PD deficiency, and monthly precipitation and temperature deviations. The standard errors (in parentheses) are robust and clustered at the cluster level. *** p<0.01, ** p<0.05, * p<0.1.
30

Table 4. Malaria prevalence, household IRS, and ITN usage (BCC sub-sample)
Dependent variable: Slept under an ITN the previous night(1) (2) (3) (4) (5) (6)
Adm1 FE Adm2 FE Cluster FEw/out BCC with
BCC w/out BCC with BCC w/out BCC with BCC
Panel A. Children under five
Malaria prevalence
0.151*** 0.156*** 0.125 0.136 - -
(0.058) (0.058) (0.101) (0.101)Household IRS 0.016 0.014 0.020 0.018 0.024 0.022
(0.014) (0.014) (0.014) (0.014) (0.016) (0.016)
Observations 20,367 20,367 20,367 20,367 20,441 20,441R-squared 0.426 0.427 0.449 0.450 0.497 0.498
Panel B. Older children
Malaria prevalence
0.221*** 0.223*** 0.250** 0.256** - -
(0.054) (0.053) (0.103) (0.103)Household IRS 0.009 0.009 0.013 0.012 0.017 0.016
(0.015) (0.015) (0.016) (0.015) (0.016) (0.016)
Observations 30,546 30,546 30,546 30,546 30,701 30,701R-squared 0.467 0.468 0.487 0.487 0.529 0.529
Panel C. Adult females
Malaria prevalence
0.225*** 0.229*** 0.270*** 0.281*** - -
(0.057) (0.057) (0.092) (0.092)Household IRS -0.007 -0.008 -0.004 -0.005 0.000 -0.001
(0.013) (0.012) (0.013) (0.013) (0.013) (0.013)
Observations 29,621 29,621 29,621 29,621 29,758 29,758R-squared 0.343 0.344 0.364 0.365 0.407 0.408
Panel D. Adult males
Malaria prevalence
0.086 0.085 -0.020 -0.015 - -
(0.064) (0.063) (0.111) (0.110)Household IRS 0.016 0.014 0.020 0.017 0.023* 0.020
(0.013) (0.013) (0.014) (0.014) (0.014) (0.014)
Observations 15,907 15,907 15,907 15,907 16,022 16,022R-squared 0.443 0.445 0.465 0.466 0.511 0.512
Fixed effects Adm1 Adm1 Adm2 Adm2 Cluster ClusterNotes. All models include controls for age, age of the mother (for children under five), household size, male (for children under five and older children), child of the household head (for children under five and older children),
31

mother completed primary education (for children under five), woman completed primary education (for adult females), lowest indicators of household wealth, urban area, G6PD deficiency, and monthly precipitation and temperature deviations. The standard errors (in parentheses) are robust and clustered at the cluster level. *** p<0.01, ** p<0.05, * p<0.1.
Table 5. Instrumental variables results
(1)Adm1 FE
(2)Adm2 FE
(3)Adm1 FE
(4)Adm2 FE
Panel AChildren under five Older children
Second-stage results
Malaria prevalence 0.761*** 0.408** 0.671*** 0.173(0.124) (0.158) (0.109) (0.158)
Hansen J-statistic 6.745 0.140 7.030 0.453p-value J-test 0.009 0.708 0.008 0.501
First-stage results
Kiszewski malaria 0.137*** 0.173*** 0.080** 0.142***
ecology index (0.042) (0.037) (0.040) (0.037)Altitude -0.011*** -0.011*** -0.011*** -0.011***
(0.001) (0.001) (0.001) (0.001)
Kleibergen-Paap F-stat 85.91 78.68 78.47 72.53
Observations 54,316 54,316 87,789 87,789
Panel BAdult females Adult males
Second-stage results
Malaria prevalence 0.608*** 0.422** 0.268** 0.002(0.117) (0.165) (0.129) (0.183)
Hansen J-statistic 8.883 1.696 3.964 0.178p-value J-test 0.002 0.193 0.046 0.673
First-stage results
Kiszewski malaria 0.111*** 0.150*** 0.113*** 0.141***
ecology index (0.042) (0.038) (0.040) (0.039)Altitude -0.011*** -0.011*** -0.009*** -0.010***
(0.001) (0.001) (0.001) (0.001)
Kleibergen-Paap F-stat 98.94 71.05 61.44 56.00
Observations 69,576 69,576 54,715 54,715
Fixed effects Adm1 Adm2 Adm1 Adm2
32

Notes. All models include controls for household IRS, household ITN, cluster IRS (others), cluster ITN (others), age, age of the mother (for children under five), household size, male (for children under five and older children), child of the household head (for children under five and older children), mother completed primary education (for children under five), woman completed primary education (for adult females), lowest indicators of household wealth, urban area, G6PD deficiency, monthly precipitation and temperature deviations. The standard errors (in parentheses) are robust and clustered at the cluster level. *** p<0.01, ** p<0.05, * p<0.1.
Table 6. Probit malaria prevalence elasticities (Children under five)
Dependent variable: Slept under an ITN the previous night(1) (2) (3)
Average partial effect Elasticity at average
Average of elasticity
Malaria prevalence 0.142*** 0.183*** 0.207***
(0.039) (0.051) (0.062)Observations 54,316 54,316 54,316
Malarial control campaignsHousehold ITN Yes Yes YesCluster IRS (others) Yes Yes YesCluster ITN (others) Yes Yes Yes
Fixed effects Adm1 Adm1 Adm1Notes. We include controls for age, age of the mother (for children under five), household size, male (for children under five and older children), child of the household head (for children under five and older children), mother completed primary education (for children under five), woman completed primary education (for adult females), lowest indicators of household wealth, urban area, G6PD deficiency, and monthly precipitation and temperature deviations. The standard errors are in parentheses. The standard errors of elasticities are computed using bootstraps with 500 replications. *** p<0.01, ** p<0.05, * p<0.1.
33
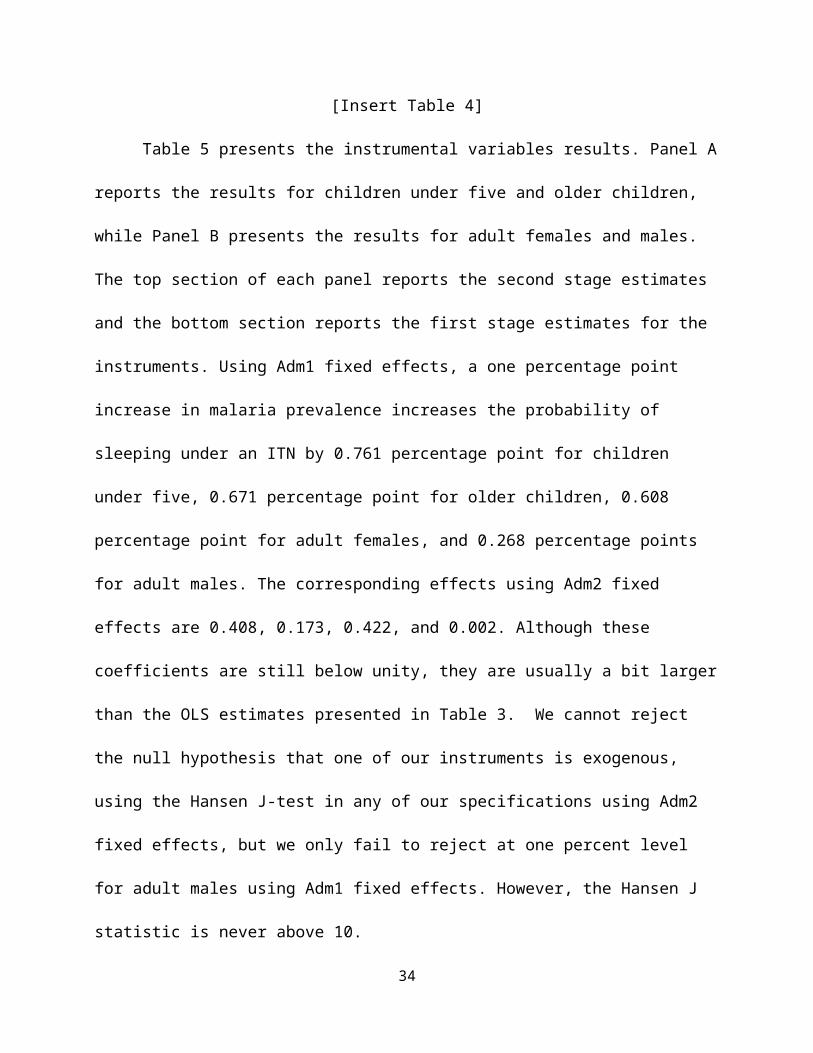
Table 7. Instrumental variables for just identified models (Children under five)
(1)Adm1
FE
(2)Adm1 FE
(3)Adm2
FE
(4)Adm2 FE
Second stage resultsDependent variable: Slept under an ITN the previous night
Malaria prevalence 0.828*** 0.180 0.426** 0.298(0.127) (0.246) (0.168) (0.322)
Observations 54,316 54,316 54,316 54,316
First stage resultsDependent variable: Slept under an ITN the previous night
Kiszewski malaria - 0.298*** - 0.262***
ecology index (0.044) (0.042)Altitude -0.011*** -0.011*** -
(0.001) (0.000)
Kleibergen-Paap F-stat 123.8 47.0 139.5 38.62
Fixed effects Adm1 Adm1 Adm2 Adm2Notes. All models include controls for age, age of the mother, household size, male, child of the household head, mother completed primary education, household with the lowest indicators of wealth, and urban area. The standard errors (in parentheses) are robust and clustered at the cluster level. *** p<0.01, ** p<0.05, * p<0.1.
34

Table 8. Free net effects (Children under five)
Dependent variable: Slept under an ITN the previous night (2) (2)
Adm2 FE IV Malaria prevalence 0.056 0.349**
(0.077) (0.174)Household IRS -0.025 -0.023
(0.016) (0.016)Free net 0.359*** 0.360***
(0.018) (0.019)Malaria prevalence × Free net -0.096** -0.101**
(0.044) (0.046)Household IRS × Free net 0.058*** 0.054***
(0.016) (0.016)
Observations 35,955 35,955R-squared 0.518
Fixed effects Adm2 Adm2Notes. All models include controls for age, age of the mother, household size, male, child of the household head, mother completed primary education, lowest indicators of household wealth, urban area, G6PD deficiency, monthly precipitation and temperature deviations. The standard errors (in parentheses) are robust and clustered at the cluster level.*** p<0.01, ** p<0.05, * p<0.1.
35

Figure 1. Cluster distribution and malaria prevalence
36

Figure 2. Effect of malaria prevalence on ITN usage at different levels of prevalence(Children under five)a. Fixed effects specification
b. Instrumental variables specification
Notes. All models include controls for age, age of the mother, household size, male, child of the household head, mother completed primary education, lowest indicators of household wealth, urban area, G6PD deficiency, monthly precipitation and temperature deviations, and Adm2 fixed effects. Instrumental variables estimates calculated using the control function approach.The bold dots represent the coefficients, and the bars, the 95% confidence intervals.
37

References
Apouey, B., & Picone, G (2014). Social interactions and malaria preventive behaviors in sub-Saharan Africa. Health Economics, 23, 9, 994-1012.
Apouey, B. H., Picone, G., Wilde, J., Coleman, J., & Kibler, R. (forthcoming 2017). Paludisme et anémie des enfants en Afrique subsaharienne : Effet de la distribution de moustiquaires. Revue Economique.
Angrist, J., & Pischke, J. S. (2009). Mostly harmless econometrics: An empiricist’s companion. Princeton University Press.
Battacharyya, S. (2009). Root causes of African underdevelopment. Journal of African Economies, 18, 745-780.
Beier, J., Killen G., & Githure J. (1999). Entomologic inoculations rates and Plasmodium Falciparum Malaria Prevalence in Africa. American Journal of Tropical Medicine and Hygiene, 61, 109-113.
Bennett, D. (2012). Does clean water make you dirty? Water supply and sanitation in the Philipines. Journal of Human Resources, 47, 146-173.
Berthélemy, J. C., Thuilliez, J., Doumbo, O., & Gaudant, J. (2013). Malaria and protective behaviors: is there a malaria trap? Malaria Journal, 12, 200.
Bleakley, H. (2010). Malaria eradication in the Americas: A retrospective analysis of childhood exposure. American Economic Journal: Applied Economics, 2, 1-45.
Cappellini, K., & Fiorelli, G. (2008). Glucose-6-phosphate dehydrogenase deficiency. Lancet, 371, 64-74.
Carneiro, P., Ghebremeskel, T., Keating, J., & Locatelli, A. (2012). Do public health interventions crowd out private health investments? Malaria control policies in Eritrea. Cemmap Working Paper CWP12/12.
Chase, C., Sicuri E., Sacoor, C., Nhalungo, D., Nhacolo, A., Alonso, P. L., & Menéndez, C. (2009). Determinants of household demand for bed nets in a rural area of Southern Mozambique. Malaria Journal, 8, 132.
Cohen, J., & Dupas, P. (2010). Free distribution or cost-sharing? Evidence from a randomized malaria prevention experiment. Quarterly Journal of Economics, 125, 1-45.
Geoffard, P.-Y., & Philipson, T. (1996). Rational epidemics and their public control. International Economic Review, 37, 603–624.
Gersovitz, M., & Hammer, J. S. (2003). Infectious diseases, public policy, and the marriage of economics and epidemiology. World Bank Research Observer, 18, 129-157.
38
Gersovitz, M., & Hammer, J. S. (2005). Tax/subsidy policies toward vector-borne infectious diseases. Journal of Public Economics, 89, 647-674.
Gething, P. W., Patil, A., Smith, D., Guerra, C., Elyazar, I., Johnston, G., Tatem, A., & Hay, S. (2011). A new world malaria map: Plasmodium falciparum endemicity in 2010. Malaria Journal, 10, 378.
Howes, R. E., Piel, F. B., Patil, A. P., Nyangiri, O. A., Gething, P. W., Dewi, M., Hogg, M. M., Battle, K. E., Padilla, C. D., Baird, J. K., & Hay, S. I. (2012). G6PD deficiency prevalence and estimates of affected populations in malaria endemic countries: a geostatistical model-based map. PLoS Medicine, 9, e1001339.
Jones, P. (2014). What can the human genome tell us about the economic effect of malaria? Vassar College Working Paper. Available at:https://editorialexpress.com/cgi-bin/conference/download.cgi?db_name=CSAE2014&paper_id=515. Accessed April 23, 2014.
Kiszewski, A., Mellinger, A., Spielman, A., Malaney, P., Sachs, S., & Sachs, J. (2004). A global index representing the stability of malaria transmission. American Journal of Tropical Medicine and Hygiene, 70, 486-498.
Kremer, M. (1996). Integrating behavioral choice into epidemiological models of AIDS. Quarterly Journal of Economics, 111, 549-573.
Lengeler, C. (2004). Insecticide-treated bed nets and curtains for preventing malaria. Cochrane Database of Systematic Reviews, 2, 1-55.
Lucas, A. (2010). Malaria eradication and educational attainment: evidence from Paraguay and Sri Lanka. American Economic Journal: Applied Economics, 2, 46-71.
Oster, E. (2012). HIV and sexual behavior change: Why not Africa? Journal of Health Economics, 31, 37-49.
Pattanayak, S., Poulos, C., Jones, K., Yang, J., & Van Houtven, G. (2006). Economics of Environmental Epidemiology. RTI Working Paper 06_04.
Philipson, T. (2000). Economic epidemiology and infectious diseases. In: A. J. Culyer, & J. P. Newhouse (Eds.), Handbook of Health Economics, 1761-1799. Elsevier.
Roll Back Malaria (2012). The Global Malaria Action Plan. Available at: www.rollbackmalaria.org/gmap. Accessed April 23, 2014.
Seban, J., Thuilliez, J., & Herbreteau, V. (2013). Possession of bed nets in Haut-Katanga (DRC): prevalence elastic behavior or performance of health care system delivery? Health and Place, 24, 275-285.
39

Weatherall, D. J. (2008). Early life exposure to malaria and cognition in adulthood: Evidence from Mexico. Journal of Health Economics, 31, 767-780.
Wilde, J, Apouey, B. H., Coleman, J, Picone, G (2017). The effect of antimalarial campaigns on child mortality and fertility in sub-Saharan Africa. USF Working paper.
Winch, P.J., A.M. Makemba, S.R. Kamazima, G.K. Lwihula, P. Lubega, J.N. Ninjas, and C.J. Shiff (1994). Seasonal variation in the perceived risk of malaria: Implications for the promotion of insecticide-impregnated bed nets. Social Science & Medicine, 39, 63-75.
World Health Organization (2011). World malaria report 2011. Geneva: World Health Organization. Available at:http://www.who.int/malaria/world_malaria_report_2011/9789241564403_eng.pdf. Accessed April 23, 2014.
Yasuoka, J., Mangione, T.W., Spielman, A., & R. Levins (2006). Impact of education on knowledge, agricultural practices, and community actions for mosquito control and mosquito-borne disease prevention in rice ecosystems in Sri Linka. American Journal of Tropical Medicine and Hygiene, 74(6), 1034-1042.
40

Online Appendix A
Parasite surveys used to calculate PfPR2-10 for the countries in our sample
To construct PfPR2-10, MAP uses data from Plasmodium falciparum parasite rate surveys
that are periodically carried out. More specifically, MAP maintains and continuously updates a
database of parasite surveys obtained from peer-reviewed sources, unpublished studies, and
reports. Approximately 16,131 surveys are contained in the refined database after various survey
exclusions. For Africa, the median number of tested individuals in each survey is 54. In Table
A.1, we report details on the current parasite surveys that MAP uses as an input for PfPR2-10
endemicity predictions for each country in our sample. In some cases, the parasite surveys used
by MAP are the same MEASURE DHS surveys in our sample. For instance, a check of the
current surveys for Angola reveals that of the 352 surveys, 344 correspond to DHS clusters with
corresponding surveys in 2006-2007 and 2011.
[Insert Table A1]
41
Table A.1. Parasite surveys used by MAP to construct PfPR2-10
Country Parasite surveys Survey years
Number of parasite surveys
Number of tested
individuals
Number of individuals who tested positive
Angola Mainly DHS 1989-2011 352 6,353 1,124
Burundi No DHS 1989-2005 367 18,992 4,313
Cameroon About half DHS 1985-2011 683 25,289 8,478
Liberia Mainly DHS 1987-2011 303 8,617 2,917
Madagascar About half DHS 1985-2011 439 35,776 7,397
Malawi No DHS 2003-2012 387 10,830 3,026
Mozambique No DHS 1986-2007 480 14,865 5,941
Tanzania About 1/3 DHS 1985-2012 2,357 151,615 46,659
Uganda About 1/3 DHS 1986-2010 462 22,851 8,964
Notes. This information comes from the current (as of August 1, 2014) MAP survey database and does not necessarily reflect the exact survey sample used in the PfPR data employed in our analyses.
42

Online Appendix B
Calculating PfPR2-10 from parasite surveys and environmental data
This Appendix describes how our main explanatory variable (PfPR2-10) is constructed by
the Malaria Atlas Project (MAP) using parasite surveys and environmental data.
Diggle and Ribeiro (2007) and Diggle et al. (2003) provide a detailed presentation of the
geostatistical method used to calculate the PfPR2-10 map, and Gething et al. (2011) and its online
companion materials contain details on the implementation. Here we only describe a simplified
version of the geostatistical model used to create the PfPR2-10 endemicity map. In particular, we
assume that all surveys are done at the same time, that they are representative of children between
ages two and 10, and that we know all the parameters that characterize the statistical distributions.
Assume that we have n parasite surveys and that for each parasite survey (i), we observe
the location of the survey (xi), the number of individuals tested (ni), and the number of individuals
who tested positive for the parasite (yi). The idea behind the method is to calculate the probability
that an individual who lives in location x0 has the parasite conditional on the observed data {(xi, ni,
yi):i=1,…,n}. x0 can be any location on a continuous spatial region A and each xi in our sample
also belongs to A. In the case of PfPR2-10, region A represents the areas where malaria is stable,
using a 5×5 km pixel grid. We also assume that for every pixel l in A, we observe a vector of
covariates fl. In the case of PfPR2-10, fl is made of 20 environmental covariates, which are
described in the Online Appendix A.4 of Gething et al. (2011).
We assume that the observed yi is a realization from a binomial distribution with probability
of “success” given by a logit function, p(S(xi))=exp(S(xi))/(1+exp(S(xi))) and ni trials. We also
assume that S(xi) follows a normal distribution with E(S(xi))= fl’β, V(S(xi))=σ2, and Corr(S(xi),
43
S(xj))=ρ(uij) where uij=||xi-xj||.3 Let Y=(y1,…,yn) be the n×1 vector of observed outcomes and
S=(S(x1),…,S(xn)) the corresponding realizations of S(x).4 The distribution of S is N(F’β, σ2R)
where F is n×k and R is the n×n matrix of spatial correlations for u.
Our goal is to calculate E ( p (S ( xo ) )∨Y ) for any x0ϵA. The main challenge is that this
conditional expectation depends on the distribution of S ( xo ) conditional on Y which does not have
a closed form solution. However, using Bayes’ rule and our assumptions about the distributions
of Y|S and S, we can calculate the density of S|Y, f(S|Y). Then we can estimate E ( p (S ( xo ) )∨Y ) as
follows:
1) Simulate s(1), s(2),…,s(m) from f(S|Y) using Markov Chain Monte Carlo (MCMC)
simulations. Each s(j) (j=1,…,m) is n×1 and depends on the values of Y.
2) For each s(j) calculate the distribution of S ( xo )∨s ( j) which is normally distributed with
E [ S ( xo )∨s ( j)]=f 0' β+r 0
' ( σ2 R )−1 ( s ( j )−F β )
V [S ( xo )∨s( j )]=σ 2−r0' (σ2 R )−1 r0
where r0' =(ρ (u01 ) , …, ρ (u0 n )). These are called universal kriging predictions in the geostatistical
literature.
3) Simulate a value of s j ( xo ) from the distribution of S ( xo )∨s ( j ) for j=1,…, m.
4) The estimate of E ( p (S ( xo ) )∨Y ) is given by:
1m∑
j=1
m es j ( xo )
1+esj ( xo)
3 The binomial model belong to the class of generalised linear model with link function, ln ( S ( x i )1−S ( xi ) ).
4 For {(xi, ni, yi):i=1,…,n}, S ( x i )=ln ( y i
ni− y i).
44
5) Repeat 1-4 for every x∈ A .
Allowing for unknown parameters significantly complicates the calculation of these
predictions. Fortunately, Bayesian methods have been developed to estimate these models
(Diggle and Ribeiro, 2007). In the construction of the PfPR2-10 endemicity map, there are two
additional challenges: (1) the correlation matrix must also reflect the temporal component of the
parasite surveys, and (2) different surveys tested different age groups. See Gething et al. (2011)
Appendix A.3 for a discussion on how these challenges are solved.
Finally, we can interpret the predicted value of E ( p (S ( xo ) )∨Y ) as a weighted average of f 0' β
and Y. On the one hand, if the location for which we are trying to predict PfPR is close to a
location in our sample such as xi, then yi will have a large predictive weight.5 On the other hand,
for prediction for locations with no nearby sample locations, the environmental covariates will
likely have a large predictive weight.
References
Diggle, P. J., & Ribeiro, P. J. (2007). Model-based geostatistics. Springer, New York.
Diggle P. J., Ribeiro Jr. P.J., & Christensen O.F. (2003). An introduction to model-based geostatistics. Spatial statistics and computational methods. Lecture Notes in Statistics, Volume 173, pp 43-86. Springer, New York.
Gething, P. W., Patil, A., Smith, D., Guerra, C., Elyazar, I., Johnston, G., Tatem, A., & Hay, S. (2011). A new world malaria map: Plasmodium falciparum endemicity in 2010. Malaria Journal, 10, 378.
5 In fact, it can be shown that when yi=S(xi), the kriging prediction of S(xi) is just yi.
45

46

Online Appendix C
Table C.1. Full results (Children under five)
(1) (2) (3)Adm1 FE Adm2 FE Cluster
Malaria prevalence 0.164*** 0.062 (0.042) (0.066)
Household IRS 0.024*** 0.026*** 0.031***
(0.009) (0.009) (0.010)Household ITN 1.063*** 1.052*** 1.039***
(0.018) (0.018) (0.020)
Cluster IRS (others) -0.038** -0.001 (0.016) (0.017)
Cluster ITN (others) 0.209*** 0.130*** (0.033) (0.038)
Male 0.001 0.001 -0.001(0.003) (0.003) (0.003)
Age -0.022*** -0.022*** -0.022***
(0.001) (0.001) (0.001)Child of household 0.062*** 0.062*** 0.065***
head (0.006) (0.006) (0.006)Mother’s age 0.000 0.000 0.000
(0.000) (0.000) (0.000)Mother completed 0.027*** 0.024*** 0.023***
primary education (0.005) (0.005) (0.006)Lowest household -0.010* -0.009 -0.009wealth indicator (0.005) (0.006) (0.007)Household size 0.003*** 0.003*** 0.003***
(0.001) (0.001) (0.001)Urban area 0.002 -0.014
(0.008) (0.008) G6PD deficiency -0.399* -0.189 (cluster) (0.235) (0.414) Precipitation deviation 0.000 -0.000
(0.000) (0.000) Temperature deviation -0.005** -0.007***
(0.002) (0.003)
Observations 54,316 54,316 54,390R-squared 0.394 0.416 0.461
Fixed effects Adm1 Adm2 ClusterNotes. The standard errors (in parentheses) are robust and clustered at the cluster level. *** p<0.01, ** p<0.05, * p<0.1.
47

i The four most common species of the Plasmodium parasite that affect humans are P falciparum, P vivax, P knowlesi, and P malariae.ii See www.map.ox.ac.uk.iii Using data for areas that have information on both PfPR and EIR, Beier et al. (1999) and Gething et al. (2011) find that PfPR has a linear relationship with the logarithm of EIR with a R-squared above 0.7.iv IPTp, a strategy where pregnant women receive full doses of a drug (sulphadoxine-pyrimethamine), is also a very important preventive intervention, but it only protects the mother and the unborn child and does not affect the mosquito population. v For each country, we review the MEASURE DHS reports obtained from dhsprogram.com, the President Malaria Initiative operational plan obtained from www.pmi.gov, and when it exists, the country’s National Malaria Control Program webpage.vi Recent studies on malaria in Africa also use data from the MEASURE DHS project (Apouey and Picone, 2014; Apouey et al., forthcoming; Wilde et al., 2017).vii Following the World Bank, we define an improved water source as any of the following sources: piped water into dwelling, piped water to yard/plot, public tap or standpipe, tubewell or borehole, protected dug well, protected spring, and bottled water. Improved sanitation facilities are defined as: flush toilet, piped sewer system, septic tank, flush/pour flush pit latrine, ventilated improved pit latrine (VIP), pit latrine with slab, and composting toilet.viii We use data on precipitation and temperature between 2000 and 2010 from the Climatic Research Unit, available at www.cru.uea.ac.uk.ix Information on the geographic distribution of G6PD deficiency also comes from MAP (Howes et al., 2012).x G6PD deficiency is not the only genetic mutation that provides protection against malaria. Other mutations such as HbS (the percentage of neonates affected by sickle hemoglobin) also provide protection against malaria. We only control for G6PD deficiency because it is the most common genetic mutation (Weatherall, 2008). xi Information on Adm1 and Adm2 comes from gadm.org.xii See http://www.earth.columbia.edu.xiii This index has been widely used as an instrument for malaria prevalence in studies that shed light on the influence of malaria on educational attainment (Lucas, 2010), income (Battacharyya, 2009; Bleakley, 2010), and malaria preventive behaviors (Pattanayak et al., 2006).xiv For example, the Culex genus of the Culicinae subfamily which is also widely present in Africa and a vicious biter.xv In Appendix C, Table C.1, we report the coefficients for each of the control variables for children under 5 using Adm1, Adm2, cluster fixed effects. We find that the number of ITNs per person is positively correlated with the probability of sleeping under an ITN. While individuals perceive their own household IRS to be complementary to ITN usage, the receipt of IRS by others in the cluster has some degree of substitutability with ITN usage (the effect is only significant when we include Adm1 fixed effects). We also show that an increase in ITNs per person in other households increases individual ITN usage. Socio-demographic characteristics have the expected signs, although they are not always significant: age (-), child of household head (+), and mother’s completed primary education (+). Moreover, G6PD deficiency has a negative effect on the probability of sleeping under an ITN, as expected, since this genetic mutation provides a protective effect against malaria risk. Finally, a temperature above normal levels is negatively correlated with ITN usage.xvi We do not estimate probit models using Adm2 fixed effects because the vast number of Adm2 areas make the bootstrapping estimation computationally intensive.xvii These countries are Angola, Burundi, Cameroon, Liberia, Madagascar, Malawi, and Tanzania.