cancerres.aacrjournals.orgcancerres.aacrjournals.org/highwire/filestream/291513/... · web...
TRANSCRIPT

Supplementary Information
Supplementary Methods
Transcriptome microarray assay
The transcriptome profiles of 198 samples, including 165 triple-negative
breast cancer (TNBC) tissues (patients diagnosed from January 1, 2011 to
December 31, 2012) and 33 paired adjacent normal breast tissues, were
determined using the Affymetrix Human Transcriptome Array 2.0 (HTA 2.0)
GeneChips (Affymetrix, Santa Clara, CA, USA) (1, 2). According to the
standard Affymetrix protocol, biotinylated cDNA was prepared from 250 ng
total RNA using the Ambion® WT Expression Kit. Subsequently, 5.5 μg of
labeled cDNA was hybridized to the HTA 2.0 microarray. Following
hybridization and washing, the GeneChips were scanned with the GeneChip®
Scanner 3000 7G using Affymetrix® GeneChip Command Console (AGCC)
software. The Affymetrix Expression Console (version 1.2.1) implementation
of the Robust Multichip Analysis (RMA) algorithm was used for quantile
normalization and background correction. Combat Software was applied to
adjust the normalized intensity to remove batch effects.
Quantitative real-time PCR (qRT-PCR)
We detected the expression of candidate mRNAs and lncRNAs using
qRT-PCR in all the 275 patients and another cohort of 82 TNBC patients
received neo-adjuvant chemotherapy. cDNA was synthesized using the
PrimeScriptTM RT reagent kit (Takara Bio Inc., Otsu, Japan), and the SYBR®
Premix Ex TaqTM kit (Takara Bio Inc., Otsu, Japan) and ABI PRISM 7900HT
Sequence Detection System (Applied Biosystems, Foster City, CA, USA) were
used for qRT-PCR analysis. All experiments were conducted following the 1

standard protocol provided by the manufacturer. The results were normalized
to U6 expression.
Identification of mRNAs and lncRNAs for signature construction
The detailed filtration process of filtration is illustrated in Supplementary
Figure S1. The random variance model (RVM) (3) corrected t test was applied
to select RNAs that were differentially expressed between 33 pairs of breast
tumor tissues and adjacent normal tissues. We selected the differentially
expressed mRNAs (fold change >2 or <0.33 with a false discovery rate [FDR]
<0.001). The thresholds for differentially expressed lncRNAs were as follows:
fold change >1.5 and FDR <0.001. All differently expressed RNAs were
included in pool A (Supplementary Figure S2). By combining the RNA
expression data from microarray and follow-up data obtained from 165 TNBC
patients, we obtained a set of RNAs correlated with recurrence-free survival
(RFS) that we placed in pool B. For the selection of mRNAs, a P value of less
than 0.1 (log rank test) was determined to be significant, and duplicated
mRNAs were excluded. For the selection of lncRNAs, a P value of less than
0.2 (log rank test) was determined to be significant, as the correlations were
less significant than those observed with the mRNAs. Additionally, only
intergenic lncRNAs were included. We selected the overlapped mRNAs and
lncRNAs between pool A and pool B. These RNAs were both tumor-specific
and correlated with RFS. For each of the selected RNAs, we designed three
different pairs of primers and performed qRT-PCR analysis on the 33 paired
TNBC and normal tissues mentioned previously. If all three primers for a given
RNA did not amplify successfully (i.e., the CT values were undetermined), we
designed three different primers. The qRT-PCR results were analyzed using a
2
paired t test to validate the differential expression patterns, and P<0.1 was set
as significant. RNAs that failed to amplify with all six pairs of primers or that
showed expression patterns that were not concordant between the
transcriptome and qRT-PCR analyses were excluded. After this filtration step,
13 mRNAs and 6 lncRNAs were included. We performed qRT-PCR on all 137
samples in the training set to amplify the 19 RNAs. If there was discordance
between the expression trend of a given RNA and the results of survival
analysis, the RNA was excluded. After this exclusion step, the remaining
seven mRNAs and four lncRNAs were added to the prognostic signature one
by one until the model reached the highest area under curve (AUC) according
to the time-dependent receiver operating characteristic (ROC) curve (4-6).
Finally, three mRNAs and two lncRNAs were included in the final signature.
Continuing adding RNAs into the signature would only diminish the
signature’s performance (data not shown).
Development and validation of the integrated mRNA-lncRNA signature
based on qRT-PCR data
The detailed process of study design, patient selection and analytical
strategy is illustrated in Supplementary Figure S2. In addition to the 165
TNBC patients who provided samples for microarray experiments, we further
recruited another 110 TNBC patients who were diagnosed from January 1,
2010 to December 31, 2010 and randomly classified all 275 TNBC patients
into the training set (137 patients) and validation set (138 patients). All of the
275 TNBC tumor samples were tested using qRT-PCR, as stated before. We
selected an optimum cutoff score for the relative expression of each RNA
using X-tile plots (X-tile software version 3.6.1, Yale University School of
3

Medicine, New Haven, CT, USA) based on the association with patient RFS in
the training set (5, 7) (Supplementary Table S3). Cox proportional hazard
regression modeling was applied to analyze correlation between RNA
expression and RFS. The regression coefficients of each of the RNA were
used to construct a recurrence score formula (5, 6, 8). The optimum cutoff for
the model was determined by the ROC curve by using the Youden Index (9,
10). The integrated mRNA-lncRNA signature was validated in a validation set
and a neoadjuvant cohort using the same coefficients derived from the
training cohort.
RNA interference
Each target sequence was designed using BLOCK-iT RNAi Designer (Life
Technologies, Wilmington, DE, USA) and filtered using NCBI BLAST to
reduce off-target effect. All the siRNA oligonucleotides used in the study were
synthesised by GenePharma Co. Ltd. (Shanghai). For cell ability-based siRNA
screening, the reverse transfection in 96-well plate was performed as follows:
Briefly, for each well in 96-well plate, 0.3 l Lipofectamine RNAiMAX was
dissolved in 25 l Opti-MEM medium and 7.5 pmol siRNA duplex in other 25
l Opti-MEM medium. Then the two reagents were mixed, incubated for 15
min and added to each well, together with 3×10³ cells suspensed in 100 l
antibiotic-free growth medium. The transfection medium was changed with
fresh growth medium for 12 h post-transfection, and the cells were incubated
with another 72 h before cell viability detection by CCK-8 (Dojindo
Laboratories, Kumamoto, Japan). The sequence for siRNA negative control
was: 5-UUCUCCGAACGUGUCACGU-3. All raw data were collected at 450
nm wave length.
4

Measurement of cell proliferation
Cells transfected with siRNA (5 × 10³ per well) were seeded in 96-well
plates. Indicated concentrations of paclitaxel were added into the wells after 6
h from seeding and incubation for the next 48 h, while in control group
paclitaxel was replaced with PBS. Cell viability was assessed by analyzing the
metabolic reduction of WST-8 (CCK-8 cell proliferation assay), as described
previously (12). A 6 parameter nonlinear regression was used to calculate IC50
values using Sigma Plot 2001 software (Systat Software, Chicago, IL, USA).
Cell invasion assay
The Boyden chamber invasion assay was used to assess the invasion
ability. 800 μl of medium (containing 0.1% bovine serum albumin) and cells
were added to the lower and upper compartment of the chamber, respectively.
After incubating for 24 h, non-migrated cells were removed, and cells that had
migrated through the Matrigel filter (BD Biosciences, Franklin Lakes, NJ,
USA) were counted.
Cell cycle arrest assay
For cycle assay, 2 × 10⁵ cells per well were seeded in 6-well plates and
transfected with siRNA. After 48 h transfection, cells were treated with 5 nM
paclitaxel for 16 h. For cycle arrest assay, cells were stained with propidium
iodide and tested using flow cytometry according to the standard protocol
(13).
Co-expression analysis of lncRNAs and mRNAs
To identify interactions between mRNAs and lncRNAs, we constructed co-
expression networks. We pre-processed the data using the median
expression value of all transcripts and then screened for differentially
5

expressed lncRNAs and mRNAs. For each pair of genes analyzed, we
calculated the Pearson correlation.
Gene Ontology (GO) and pathway analysis
GO analysis was applied to analyze the main function of genes co-
expressed with lncRNAs according to the GO database, which is the key
functional classification of the National Center for Biotechnology Information
(NCBI). The analysis can organize genes into hierarchical categories and
uncover the gene regulatory network based on biological process and
molecular function. Meanwhile, pathway analysis was used to determine the
significant pathways of the differential genes according to the Kyoto
Encyclopedia of Genes and Genomes database (KEGG). The Pearson Chi-
square test and Fisher’s exact test were used to select the significant
pathway.
6

Supplementary Tables
Supplementary Table S1. Selected mRNAs and lncRNAs by comparing the expression profiles in 33 paired tumor and adjacent
normal tissues of triple-negative breast cancer.
Symbol ProbeSet Category Tumor/normal
Fold change(tumor/normal)
Fold changeP value FDR Log rank
P value
CHRDL1 TC0X001278.hg.1 mRNA down-regulation 0.32 4.70E-06 2.24E-05 7.59E-04
FCGR1A TC01001172.hg.1 mRNA up-regulation 2.17 2.00E-07 1.73E-06 0.0926
RSAD2 TC02000034.hg.1 mRNA up-regulation 2.19 1.34E-04 3.93E-04 0.0456HIF1A-
AS2 TC14002040.hg.1 lncRNA up-regulation 1.65 < 1E-07 < 1E-07 0.0783
AK124454a TC19002388.hg.1 lncRNA up-regulation 2.01 1.55E-05 7.17E-05 0.1681
aGene symbol are not available for the noncoding RNA, thus GenBank accession number was used to mark the RNA.Abbreviations: FDR, false discovery rate.
7

Supplementary Table S2. Primers for the real-time RT-PCR analysis of
mRNAs and lncRNAs included in the signature.
Symbol Category
Primer
FCGR1A-ForwardFCGR1A-Reverse mRNA
TGGTGAATACAGGTGCCAGACCGTGAAGACTCTGCTGGA
RSAD2-ForwardRSAD2-Reverse mRNA
AGCATCGTGAGCAATGGAAGCGGCCAATAAGGACATTGAC
CHRDL1-ForwardCHRDL1-Reverse mRNA
ACAAGAAGTACAGAGTGGGTGAGGGCAGCACAGATGAGGAAT
HIF1A-AS2-ForwardHIF1A-AS2-Reverse lncRNA
CAACATACATTAAGGTGATGGCAGCTTCAACACCTCCAACTCA
AK124454-ForwardAK124454-Reverse lncRNA
TGTCTCTGCAGTCTCTTAAGCAGGGACAGCATGCACTTTGTT
U6-ForwardU6-Reverse
Internal control
CTCGCTTCGGCAGCACAAACGCTTCACGAATTTGCGT
8

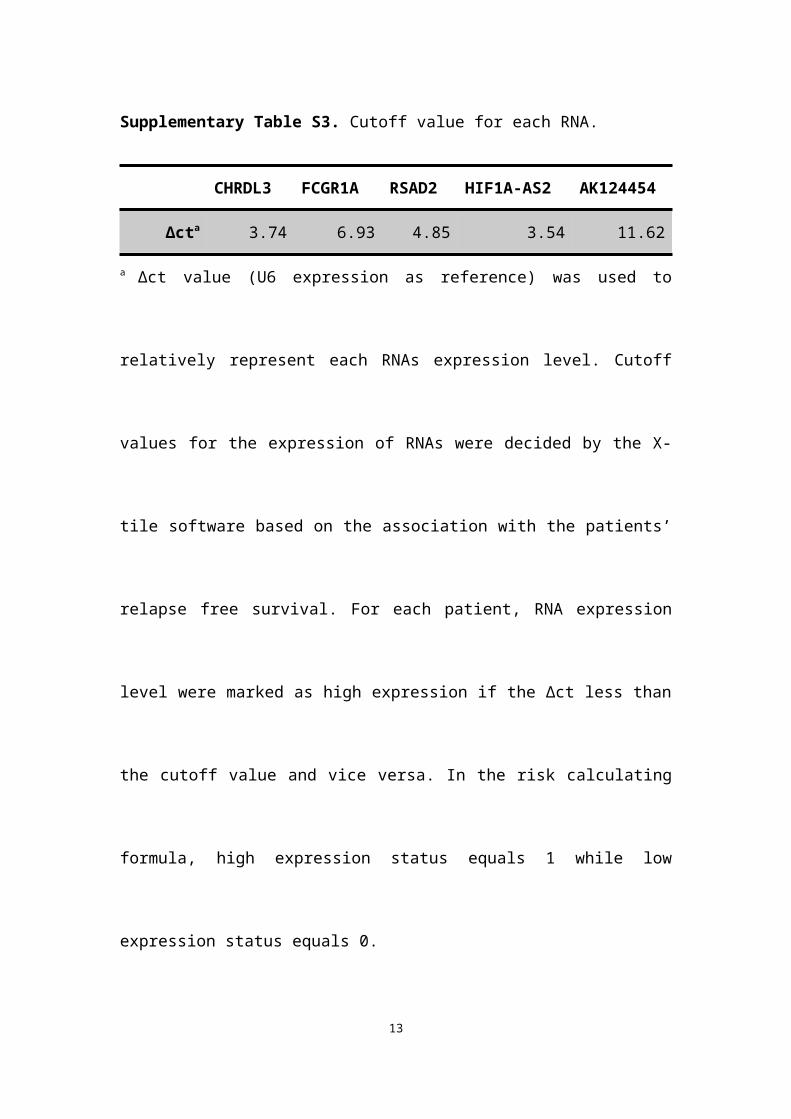
Supplementary Table S3. Cutoff value for each RNA.
CHRDL3 FCGR1A RSAD2 HIF1A-AS2 AK124454Δcta 3.74 6.93 4.85 3.54 11.62
a Δct value (U6 expression as reference) was used to relatively represent each
RNAs expression level. Cutoff values for the expression of RNAs were
decided by the X-tile software based on the association with the patients’
relapse free survival. For each patient, RNA expression level were marked as
high expression if the Δct less than the cutoff value and vice versa. In the risk
calculating formula, high expression status equals 1 while low expression
status equals 0.
9

Supplementary Table S4. Univariate Cox proportional hazards regression
analysis of the integrated RNA signature and clinicopathological
characteristics with recurrence-free survival.
Training Set
HR (95%CI) P
Validation Set
HR (95%CI) P
Age(≤50y vs >50y) 0.33 (0.14-0.77) 0.011 0.73 (0.31-1.72) 0.467
Menopause(No vs Yes) 0.52 (0.22-1.20) 0.125 0.58 (0.24-1.37) 0.213
Tumor grade(≤II vs >II) 0.88 (0.36-2.16) 0.787 2.53 (0.73-8.76) 0.144
Tumor size(≤2cm vs >2cm) 1.46 (0.56-3.81) 0.436 3.01 (0.89-10.24) 0.077
Positive LNs(≤3 vs >3) 5.69 (2.33-13.90) <0.001 3.61 (1.50-8.71) 0.004
Ki67(≤20% vs >20%) 2.37 (0.76-7.43) 0.139 1.12 (0.445-2.81) 0.812
Radiotherapy(no vs yes) 5.40 (1.98-14.76) 0.001 1.74 (0.71-4.24) 0.222
Chemotherapy(non-taxane vs taxane) 1.00 (0.42-2.35) 0.997 0.97 (0.38-2.43) 0.940
Integrated RNA signature (low risk vs. high risk) 2.45 (1.29-4.65) 0.006 2.97 (1.52-5.79) 0.001
Abbreviations: CI, confidence interval; HR, hazard ratio; LN, lymph node.
10

Supplementary Table S5. Clinicopathologic characteristics of patients with
triple-negative breast cancer who received neoadjuvant chemotherapy.
NCT set (n=82)Characteristics No. Low risk (%) High risk (%)Age (y)
MedianIQR
4842-52
5048-52
4641-52
≤50 51 (62.2) 27 (56.2) 24 (70.6) >50 31 (37.8) 21 (43.8) 10 (29.4)Menopausal status Premenopausal 52 (63.4) 25 (52.1) 27 (79.4) Postmenopausal 30 (36.6) 23 (47.9) 7 (20.6)Pre-NCT tumor size (cm)
≤2 2 (2.4) 2 (4.2) 0 (0) >2, ≤5 26 (31.7) 17 (35.4) 9 (26.5)
>5 54 (65.9) 29 (60.4) 25 (73.5)Pre-NCT tumor grade I-II 32 (39.0) 20 (41.7) 12 (35.3) III 50 (61.0) 28 (58.3) 22 (64.7)Pre-NCT LN status Negative
Positive19 (23.2)63 (76.8)
13 (27.1)35 (72.9)
6 (17.6)28 (82.4)
Pathologic response pCR 29 (35.4) 23 (47.9) 6 (17.6) Non-pCR 53 (64.6) 25 (52.1) 28 (82.4)Follow-up time (mo)
MedianIQR
43.519.0-66.0
51.524.5-66.0
32.513.0-73.0
RFS event 28 11 17Abbreviations: IQR, interquartile range; LN, lymph node; NCT, neoadjuvant chemotherapy; pCR, pathological complete remission.
11

Supplementary Table S6. Multivariate logistic regression analysis of the
integrated RNA signature and clinicopathological characteristics with
pathological complete remission.
NCT set
Variablea ORb (95%CI) Pc
Age(≤50y vs >50y) 0.85 (0.31-2.39) 0.764
Menopausal status(pre vs post) 0.73 (0.26-2.07) 0.555
Pre-NCT tumor size(≤2cm vs >2cm) 0.54 (0.20-1.48) 0.227
Pre-NCT tumor grade(≤II vs >II) 0.71 (0.26-1.90) 0.494
Pre-NCT LN status(negative vs positive) 0.76 (0.24-2.34) 0.626
Integrated RNA signature(low risk vs high risk) 0.23 (0.07-0.71) 0.011
Abbreviations: LN, lymph node; NCT, neoadjuvant chemotherapy; OR, odds ratio.aAdjusted by multivariate logistic regression models including age, menopausal status, pre-NCT tumor size, pre-NCT tumor grade,pre-NCT LN status and integrated RNA signature.bOdds ratio for the likelihood of having pathological complete remission, for an increment in expression of one unit based on logistic regression.cP value for likelihood ratio test derived from probit regression.
12
Supplementary Table S7. Top ten mRNAs co-expressed with lncRNAs
AK124454 and HIF1A-AS2.
AK124454 HIF1A-AS2mRNA Coefficient mRNA CoefficientCHEK1 0.5928561 HIF1A 0.7392446
C11orf82 0.5818136 IL8 0.564712DEPDC1 0.5562664 ERO1L 0.5548231SPC25 0.5526421 CLEC5A 0.5244528XRCC2 0.5495506 PGK1 0.5846322DNA2 0.5482257 P4HA1 0.5783645KIF11 0.535331106 PLAUR 0.5484504FLRT2 -0.536526 PGAM1 0.5479989
GPR124 -0.545691 PLOD2 0.5102739MAF -0.555115 HLF -0.526427
13

Supplementary Table S8. Top ten gene-ontology terms and pathways in which the co-expressed mRNAs involved.
AK124454 HIF1A-AS2GO terms P Pathway P GO terms P Pathway P
mitotic prometaphase 5.87E-8 ECM-receptor
interaction 0.001 regulation of glycolysis 4.80E-6 Glycolysis /
Gluconeogenesis 4.86E-4
mitotic cell cycle 1.36E-6 Focal adhesion 0.045response to endoplasmic reticulum stress
7.41E-5 Biosynthesis of amino acids 0.001
M phase of mitotic cell cycle 1.78E-6 Mismatch repair 0.071 cellular response to
interleukin-1 9.91E-5 HIF-1 signaling pathway 0.001
cell adhesion 5.00E-6 Homologous recombination 0.086 gluconeogenesis 2.15E-4 Proteoglycans in
cancer 0.006
cell division 1.26E-5 DNA replication 0.110 glycolysis 2.25E-4 Metabolic pathways 0.011
mitotic anaphase 3.20E-5 PI3K-Akt signaling pathway 0.119 signal transduction 3.50E-4 Pathways in
cancer 0.012
DNA repair 2.45E-4 ABC transporters 0.134endoplasmic reticulum unfolded protein response
7.69E-4Glycine, serine and threonine metabolism
0.037
mitotic spindle organization 3.15E-4
Intestinal immune network for IgA production
0.155 cellular protein metabolic process 0.001 Bladder cancer 0.038
spindle organization 3.96E-4 p53 signaling
pathway 0.206vascular endothelial growth factor production
0.001 Lysine degradation 0.049
meiosis 0.003Complement and coagulation cascades
0.209 neural fold elevation formation 0.001 Malaria 0.049
14

Supplementary Figures
Supplementary Figure S1
Supplementary Figure S1. Flowchart of RNA filtration. Abbreviations: FDR, false discovery
rate; HTA, Human Transcriptome Array; TNBC, triple-negative breast cancer; qRT-PCR:
quantitative real-time PCR.15

Supplementary Figure S2
Supplementary Figure S2. Flowchart of study design, patient selection and analytical strategy. Abbreviations: HTA, Human
Transcriptome Array; RFS, recurrence-free survival; TNBC, triple-negative breast cancer.
16

Supplementary Figure S3
Supplementary Figure S3. Hierarchical clustering of 33 paired tumor and adjacent normal
breast tissues with the 5 differentially expressed RNAs using Euclidean distance and average
linkage clustering. Every row represents an individual mRNA/lncRNA, and each column
represents an individual sample. Pseudocolors indicate transcript levels from low to high on a
log 2 scale from -2 to 2, ranging from a low association strength (dark, black) to high (bright,
red, or green).
17

Supplementary Figure S4
Supplementary Figure S4. Validation of the expression of each mRNA/lncRNA incorporated in
the integrated signature in the 33 paired tumor and adjacent normal tissues from the training set
using quantitative real-time polymerase chain reaction (qRT-PCR). Expression of these mRNAs
and lncRNAs measured by qRT-PCR was notably different between tumor and non-cancer
breast tissues and were significantly correlated with their microarray data.
18

Supplementary Figure S5
Supplementary Figure S5. Predictive values of taxane benefit using the integrated signature.
(A) Estimates of recurrence-free survival (RFS) according to the scores calculated by the
integrated mRNA-lncRNA signature in the neoadjuvant chemotherapy cohort (n=82). (B) Time-
dependent ROC curves were plotted to assess the efficacy of the signature in predicting three-
year recurrence-free survival, with area under curve (AUC) reported.
19

References
1. Wang P, Xue Y, Han Y, Lin L, Wu C, Xu S, et al. The STAT3-binding long noncoding RNA lnc-DC controls human dendritic cell differentiation. Science 2014;344:310-3.2. Shan J, Balasubramanian MN, Donelan W, Fu L, Hayner J, Lopez MC, et al. A mitogen-activated protein kinase/extracellular signal-regulated kinase kinase (MEK)-dependent transcriptional program controls activation of the early growth response 1 (EGR1) gene during amino acid limitation. J Biol Chem 2014;289:24665-79.3. Wright GW, Simon RM. A random variance model for detection of differential gene expression in small microarray experiments. Bioinformatics 2003;19:2448-55.4. Heagerty PJ, Lumley T, Pepe MS. Time-dependent ROC curves for censored survival data and a diagnostic marker. Biometrics 2000;56:337-44.5. Zhang JX, Song W, Chen ZH, Wei JH, Liao YJ, Lei J, et al. Prognostic and predictive value of a microRNA signature in stage II colon cancer: a microRNA expression analysis. Lancet Oncol 2013;14:1295-306.6. Liu NQ, Stingl C, Look MP, Smid M, Braakman RB, De Marchi T, et al. Comparative proteome analysis revealing an 11-protein signature for aggressive triple-negative breast cancer. J Natl Cancer Inst 2014;106:djt376.7. Camp RL, Dolled-Filhart M, Rimm DL. X-tile: a new bio-informatics tool for biomarker assessment and outcome-based cut-point optimization. Clin Cancer Res 2004;10:7252-9.8. Liu N, Chen NY, Cui RX, Li WF, Li Y, Wei RR, et al. Prognostic value of a microRNA signature in nasopharyngeal carcinoma: a microRNA expression analysis. Lancet Oncol 2012;13:633-41.9. Nakayama T, Morita S, Takashima T, Kamigaki S, Yoshidome K, Ito T, et al. Phase I study of S-1 in combination with trastuzumab for HER2-positive metastatic breast cancer. Anticancer Res 2011;31:3035-9.10. Shimizu T, Hirano A, Kamimura M, Ogura K, Kim N, Watanabe O, et al. A phase II study of epirubicin and cyclophosphamide followed by weekly paclitaxel with or without trastuzumab as primary systemic therapy in locally advanced breast cancer. Anticancer Res 2010;30:4665-71.11. Jiang YZ, Yu KD, Peng WT, Di GH, Wu J, Liu GY, et al. Enriched variations in TEKT4 and breast cancer resistance to paclitaxel. Nat Commun 2014;5:3802.12. Zhang L, Wu H, Lu D, Li G, Sun C, Song H, et al. The costimulatory molecule B7-H4 promote tumor progression and cell proliferation through translocating into nucleus. Oncogene 2013;32:5347-58.13. Krishan A. Rapid flow cytofluorometric analysis of mammalian cell cycle by propidium iodide staining. The Journal of Cell Biology 1975;66:188-93.
20