mslouie.weebly.commslouie.weebly.com/uploads/1/2/6/5/12659564/unit_packet_-_lines.docx · web...
TRANSCRIPT


Lesson 001: Function Machines
Objective:
A function machine helps us ______________________________________________________________________
________________________________________________________________________________________________________.
The _____________________ goes into the top of the machine.
The _____________________ tells us what happens inside the machine. The rule is sometimes written as y= and sometimes written as f(x)= . They both mean the same thing.
The _____________________ is the number we get after the input gets put through the machine.
Example:
How can we record what we find? CREATE A TABLE!

Example:
Let’s be descriptive. For the following function machines, write a verbal description for the rule.

What if I gave you a set of function machines. Can you figure out the rule? Directions: For each of the following, write a verbal description for what is happening between the inputs and the outputs. Then write an equation for each.
Let’s step it up a notch! Directions: For each of the following, write a verbal description for what is happening between the inputs and the outputs. When you are done, go back and try to translate your rule into an equation.
Description Equation

Directions: For each of the following, determine the rule. Write a description AND an equation for each of the rules. Then use your rule to fill in the missing spots.

Lesson 002: How Can You Tell If It Will Be Linear?
Objective:
Given the following situations, create a table of the patterns as well as a graph. Determine whether the situation is linear or non-linear.
Equation Table Graph Linear?
y = 3x + 2

y = -4x+5
y = x2 -1
y = 2x + 4
HOW CAN YOU TELL WHAT WILL BE LINEAR?
Equation
Table/Situation
Problem 2-1

1. Draw the next two figures of the pattern in the space above as well as Figure 0.
2. Fill in the table below. Figure Number
Number of Squares
3. Without graphing, determine whether this pattern is linear or not. Explain with a complete sentence why or why not it is linear.
4. Write an equation for the pattern. Where did each number from your equation come from?
5. Determine how many squares will be in the 7th and the 50th figure. HINT: Use the equation for the 50th.

Problem 2-2
.
1. Draw the next two figures of the pattern in the space above.
2. Fill in the table below.
3. Without graphing, determine whether this pattern is linear or not. Explain with a complete sentence why or why not it is linear.
4. Write an equation for the pattern. Where did each of the numbers in your equation come from?
5. Determine how many squares will be in the 7th and the 50th figure. HINT: Use the equation for the 50th.
Figure Number
Number of Squares

Problem 2-3 You know that the next tile pattern is represented by the equation y=3x+1.
1. What does the “3” and the “1” in the equation tell you about your tile pattern? Write at least two complete sentences.
2. Fill in the table below.
3. Without graphing, determine whether this pattern is linear or not. Explain with a complete sentence why or why not it is linear.
4. Where is growth represented on the table? Where is the starting value represented in the table? How are those numbers related to the equation?
5. Determine how many squares will be in the 7th and the 50th figure. HINT: Use the equation for the 50th.
Figure Number
0 1 2 3 4
Number of Squares


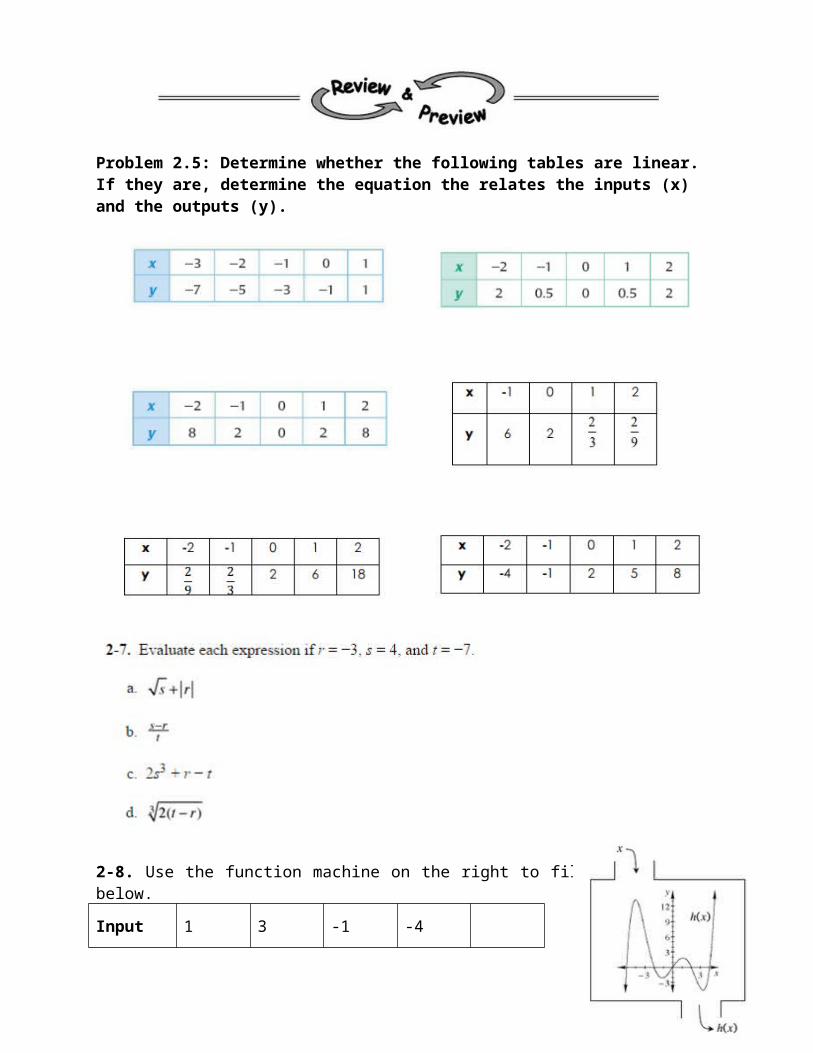
Problem 2.5: Determine whether the following tables are linear. If they are, determine the equation the relates the inputs (x) and the outputs (y).
2-8. Use the function machine on the right to fill in the table below.
Input 1 3 -1 -4
Output 0
Lesson 003: Representing Change
Objective:
Linear relationship add the same amount from one input to the next. **Note: some numbers are not pretty (fractions/decimals).
The word for added change is _________________________________.
Problem 2-10. Use the table below to answer the following problems.
a) Is this a linear pattern? Explain how you know.
b) What is the rate of change? Explain how you know.
c) Graph the numbers below.
How is the slope represented on the graph?

Slope is a number that represents ________________________________________________________________
_______________________________________________________________________________________________________.
Another name for slope is ___________________________________.
One way to “calculate slope” is by finding ________________________________________________________.
DIRECTIONS: For the situations below, find the slope or the unit rate. Show all work as to how you found it.
A) Lupita can wash four dogs in 30 minutes. How long will it take her to wash one dog?
B) Given the following pattern, what is the unit rate?
C) Given the following pattern, what is the unit rate?
D) Find the unit rate of the following table.
Input (x) -4 0 4 8 12Output (Y) 14 28 42 56 70
E) Find the unit rate of the following table.
Input (x) 10 20 30 40 50Output (Y) 100 95 90 85 80

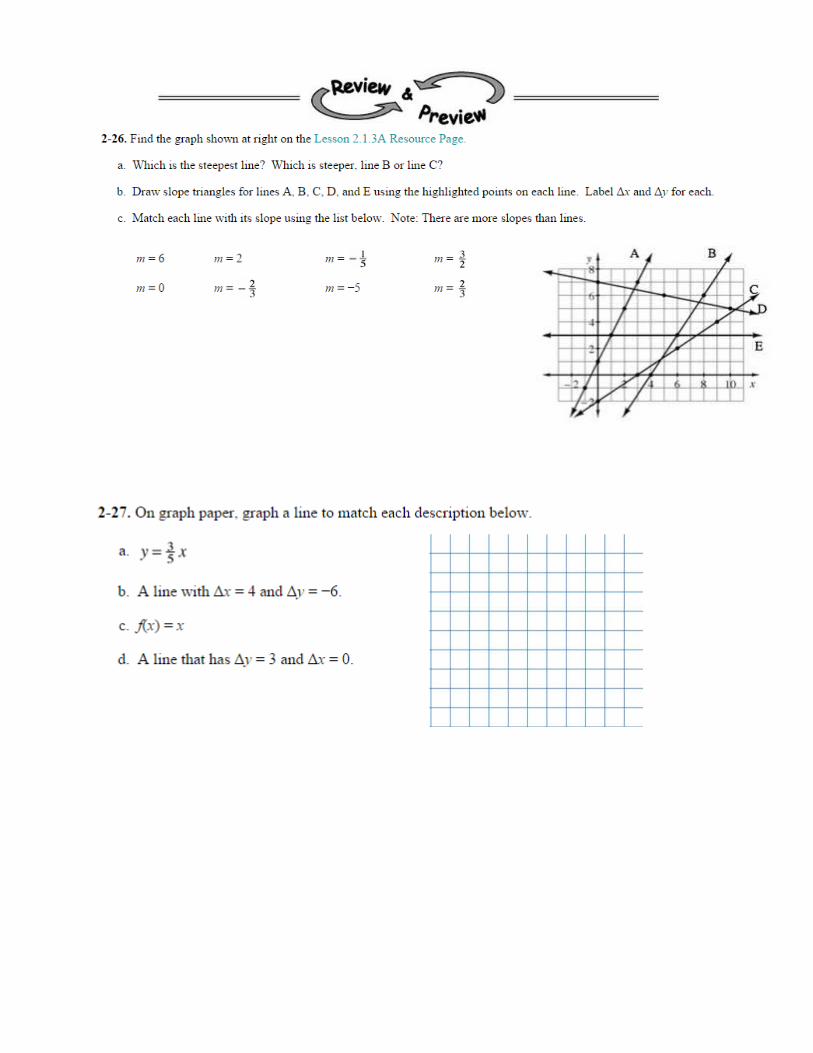
Problem 2-11. Use the graph below to find the slopes of the different lines. Show all the work below.
A B C D
Which of the lines have the steepest slope?
Which of the lines have the smallest unit rate?


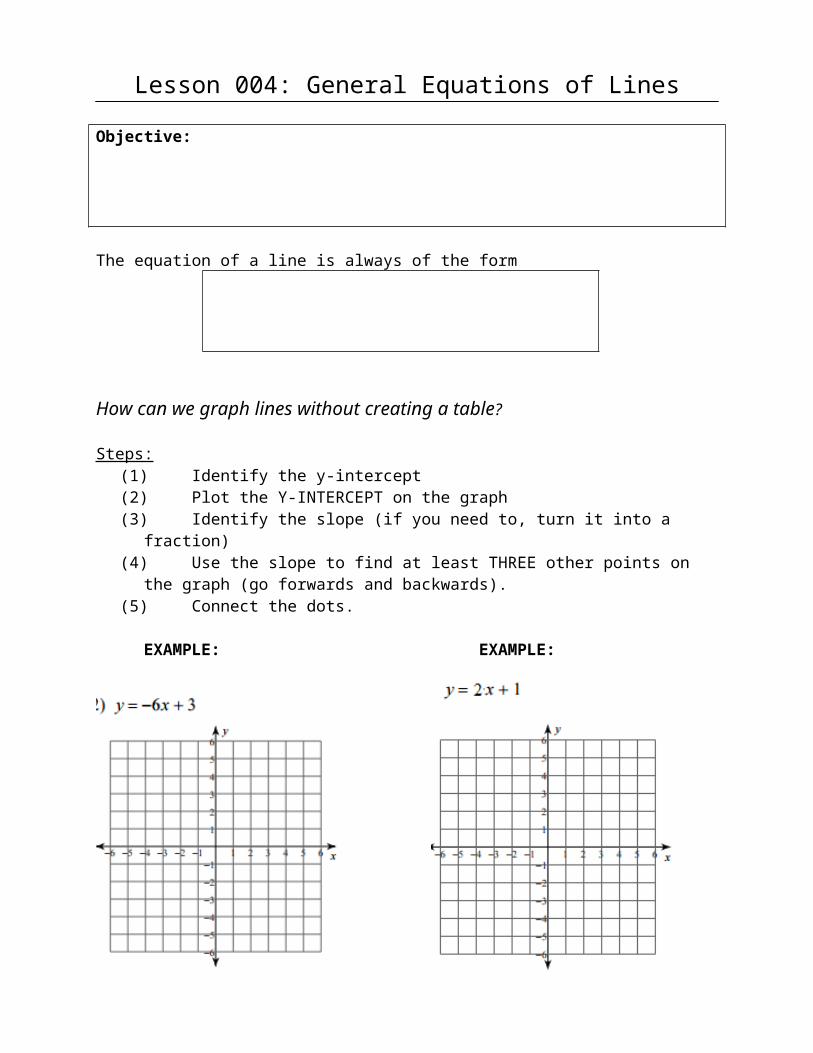
Lesson 004: General Equations of Lines
Objective:
The equation of a line is always of the form
How can we graph lines without creating a table?
Steps:(1) Identify the y-intercept(2) Plot the Y-INTERCEPT on the graph(3) Identify the slope (if you need to, turn it into a fraction)(4) Use the slope to find at least THREE other points on the graph (go forwards and
backwards).(5) Connect the dots.
EXAMPLE: EXAMPLE:

EXAMPLE:
NOW YOU TRY
Going backwards: Can you write the equation for the following graph?
What about Special Cases?There are two equations that are still linear but do NOT look like y=mx+b.
Horizontal Line
Example:
What do you notice about this line? Write at least two bullet points.
Now You Try:
Vertical Line
Example:
What do you notice about this line? Write at least two bullet points.
Now You Try:

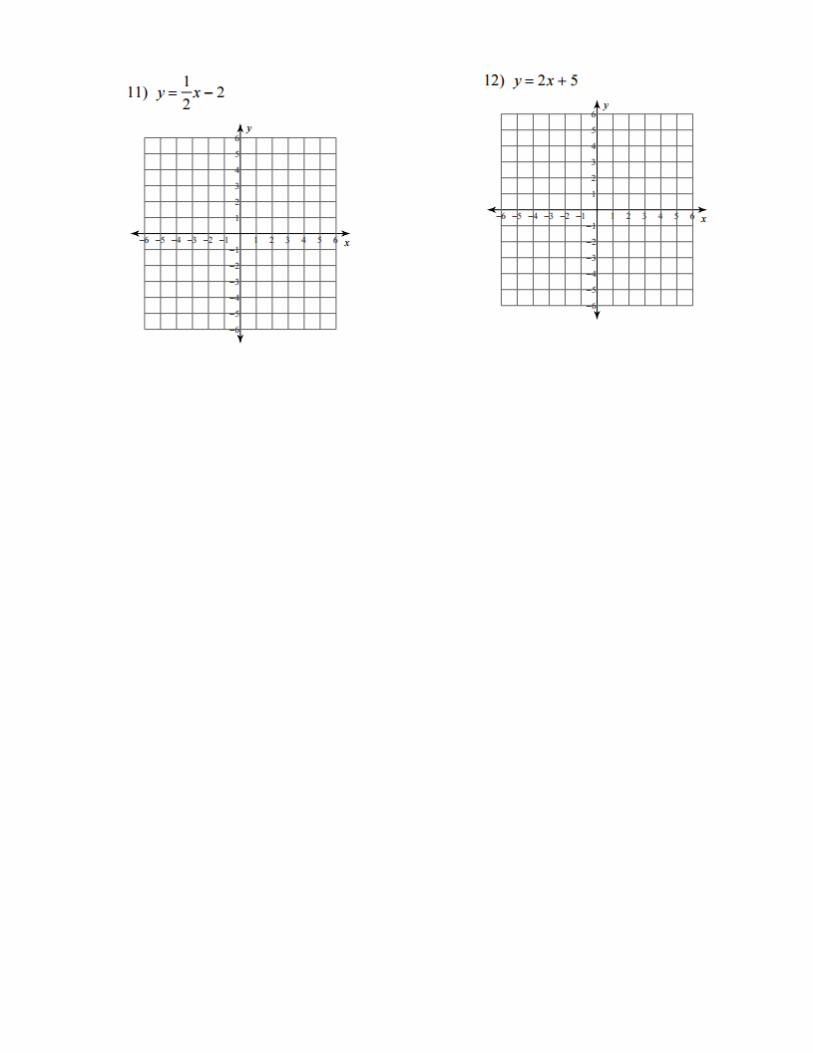
Directions: Graph the following lines.

Directions: Write the equation for the following lines.

Lesson 006: Equations from a Slope and a Point
Objective:
What happens if we aren’t given a “b” term? How can we find it?
EXAMPLE: Soria inherited his dad’s baseball card collection has been collecting baseball cards since he was five years old. He knows that every year he has been given 4 baseball cards from his grandpa, a birthday tradition they have had. At 10 years old, he decided to count how many cards he has and found that he has 32 cards!
a) What does the y-intercept represent in this situation?
b) How many cards did Soria inherited from his dad? How do you know? Show thw work.
c) Write an equation for this situation.
d) Use your equation to solve how many cards Soria has at 35 years. Show all your work below.

Though sometimes it may be feasible to work backwards to find the “b” term, it is not always possible.
EXAMPLE: Find the equation of a line that goes through (50, 26) and hashas a slope of -2. Show all the work below.
Steps
1. Write y = mx + b
2. Plug in the information you know.
3. Solve for “b”.
4. Write the equation.
Example : Find the equation of a line that goes through (14, -4) and has a slope of ½.

NOW YOU TRY


Lesson 008: Equations From Two Points
Objective:
Sometimes, we won’t be given a slope and we will be asked to graph a line.
YOUR ANSWERS: a)
b)
c)
d)
e)

EXAMPLE: Write an equation for the line that goes through (4,5) and (7,8).
Steps:
1) Calculate the slope.
2) Write y=mx+b.
3) Pick a point. Either one will get you to the same answer.
4) Plug in what you know. Solve for “b”.
5) Write the answer as an equation.
EXAMPLE: Write an equation for a line that goes through (10,20) and (20, 15).

NOW YOU TRY!
