spreadingthenumbers.files.wordpress.com file · web viewacct11081 – introductory financial...
TRANSCRIPT

ACCT11081 – Introductory Financial Accounting
S12050340 – Amie-Lee Coleman
Assignment One Steps Seven - Ten
Assignment One Step Seven
Where to start with so many different figures to look at and discuss. Let’s start with my firm, DisscoverIE – they design, manufacture and supply specialised electronic components worldwide. The subsidiary firms and firms they have acquired over the past 4 years are all in the same field. When searching through their past 3 annual reports for inventories what I found very interesting was the difference between the inventory balance on the balance sheet and the cost of inventories. What I also found quite interesting was how the balance in inventories within the balance sheet has changed over the past four years. All of which I will discuss in further detail in the assignment. Apart from the figures listed within the annual reports my firm does not disclose much information on inventories. What I am assuming is that their inventories would be mainly raw material for electronic components they are manufacturing and designing. A small part would be for supply, as from what I can gather most of the items they sell are quite unique and built custom made for customers so they wouldn’t be holding onto these items as inventory for very long.
In all 3 annual reports they describe their inventories the same under the accounting policies as - ‘Inventories comprise goods held for resale and work in progress and are stated at the lower of cost and net realisable value after making allowance for any obsolete or slow-moving items. Cost comprises direct materials, inward carriage and, where applicable, direct labour costs and those overheads that have been incurred in bringing the inventories to their present location and condition.’ So, my assumptions in what inventories covered form my firm was close. Although looking closer at the subsidiaries there are a few which keep inventories on hand with items such as fibreoptic cables and lasers etc which are made in bulk to sell.
Let’s begin by looking at how the figures for inventories change on the balance sheet over the last four years:
2017 50.1million2016 42.9million2015 39.8million2014 19.4million
Just looking at the numbers alone, there is a shift from 2014 to 2015, with an increase of 25%. Which to me sounds like a pretty big deal. So why the big jump of 10.4million in one financial year? I decided to scroll through the whole annual report of 2015 to try to find what significant changes occurred to account for the increase in inventories. I found that DIscoverIE acquired two firms in the financial year ending in 2015 which significantly expanded the design and manufacturing capabilities of my firm.
The first acquisition was for a firm who designs and manufactures fibreoptic cables which is listed as having 1.8million in inventories as provisionally fair valued at time of acquisition. The second acquisition was for a global designer and manufacturer of electromagnetic products, specifically of low, medium and high power transformers and chokes, which is listed as having 16.8million in inventories as provisionally fair valued at time of acquisition. Looking through each of the three annual reports I have noticed that DiscoverIE acquires a lot of different firms, expanding their group every year. Following in suit DiscoverIE acquired 3 businesses in the financial year ending in 2016

and one in the financial year ending in 2017. This seems to have quit an impact on the inventories shown in the balance sheet.
When searching further I found the figures for cost of inventories and write-down of inventories to net realisable value:
Cost of inventories Write-down of inventories to net realisable value
2017 225.7million 1.2million2016 193.7million 1.1million2015 184.2million 1.1million2014 155.5million 1.5million
As you can see from the figures above there hasn’t been much movement in the write-down of inventories to net realisable value. The part that I find quite interesting is the cost of inventories being so high compared to the total amount of inventories. I would assume it is because of the raw material and high-end quality electronic components they are designing, manufacturing and suppling. As the group is expending every year with further acquisitions and improving the current subsidiaries on their portfolio explains the increase in figures with inventories.
Although DiscoverIE does not disclose how they manage their inventory, I am going to assume they use the perpetual method as they have a lot of inventory in stock and in different countries so to keep track of it easily I would assume they would use the perpetual method of recording inventory. The one thing that has changed, that I noticed, was in the notes section for inventory. The 2015 and 2016 annual reports consist of one line reiterating the balance shown in the balance sheet for the notes for inventories whereas the 2017 annual report changes slightly and provides more information as shown below:
2015:
2016:
2017:

As you can see from the above screenshots they have separated the total inventories over 2 categories in 2017 compared to the one total figure in the years 2015 and 2016. There is also an added line about the amount of provision for realisable value against inventories. So why the change? I’m not entirely sure however they did change names from Acal to DiscoverIE in 2017 so with a new name comes a new format? Or they reached a balance of over 50 million worth of inventories maybe there is a policy requiring more information over in London? I would assume London would be very similar in their accounting standards as we are so my first assumption would be more likely however certainly something interesting I noticed that had changed with the inventory figures over the past 3 annual reports.
Overall, I think my firm has large inventory figures. Not as large as Wesfarmers as discussed in Maria’s tutorial videos however still large. The cost of the inventories is substantially larger which I found quite interesting although when talking anything electronic usually there is quite an expense let a lone a specifically designed electronic component. I haven’t worked in retail where I would assume a lot of stocktake takes place however working in hotels I have been around when stocktake happens at the end of the month in the food and beverage departments and it always very time consuming. After learning more about inventories it certainly puts things into perspective. My parents have owned a few restaurants and on buying/selling a full stocktake is done for costings for the future buyer to pay on top of the sale price so all inventory can be transferred over to the new buyer. I have been a part of this process a couple of times and is always an all hands-on deck type of job and again after studying more on inventories gives the process a lot more meaning then just a transfer of ownership.
Assignment One Step Eight
MYOB Training Session Screenshots
Starting out with Accountright screenshot of last transaction within myob – the reconcile bank account:
Starting out with Accountright screenshot of last setup screen within myob – the preference of transactions can’t be changed need to be reversed:

Using Accountright last screen of learning – how to print multiple invoices in the sales function:
I found the training to be quite insightful. What I did though was combined step 8 and 9 together so went through the tutorial videos and used my DiscoverIE company file to create and change transactions and did the transactions to suit the industry of my firm, this made step 9 a lot easier to complete. MYOB seems quite easy to navigate and work on so that will be good in the future to be able to jump on any accounting software and be able to use it. I use a bit of Xero at my current workplace for payroll however they have an accountant that does the rest of the “books”. I honestly was a bit confused over what screens to screenshot until I watched Maria’s tutorial video. I had a play in other areas of MYOB but found it a bit hard when you do not have it completely set up, so I

had a play in the Clearwater file after completing steps 8 and 9 to see the differences in the payroll section which I found quite interesting. I find that they are making computer software programs very user friendly and once you know one they are all similar with one another. I found this to be the case with hotel software’s too. Opera is the main program that hotels worldwide utilise however choice hotels and smaller one-off type hotels have their own systems like Hirum and Choice Advantage and all very similar at the roots.
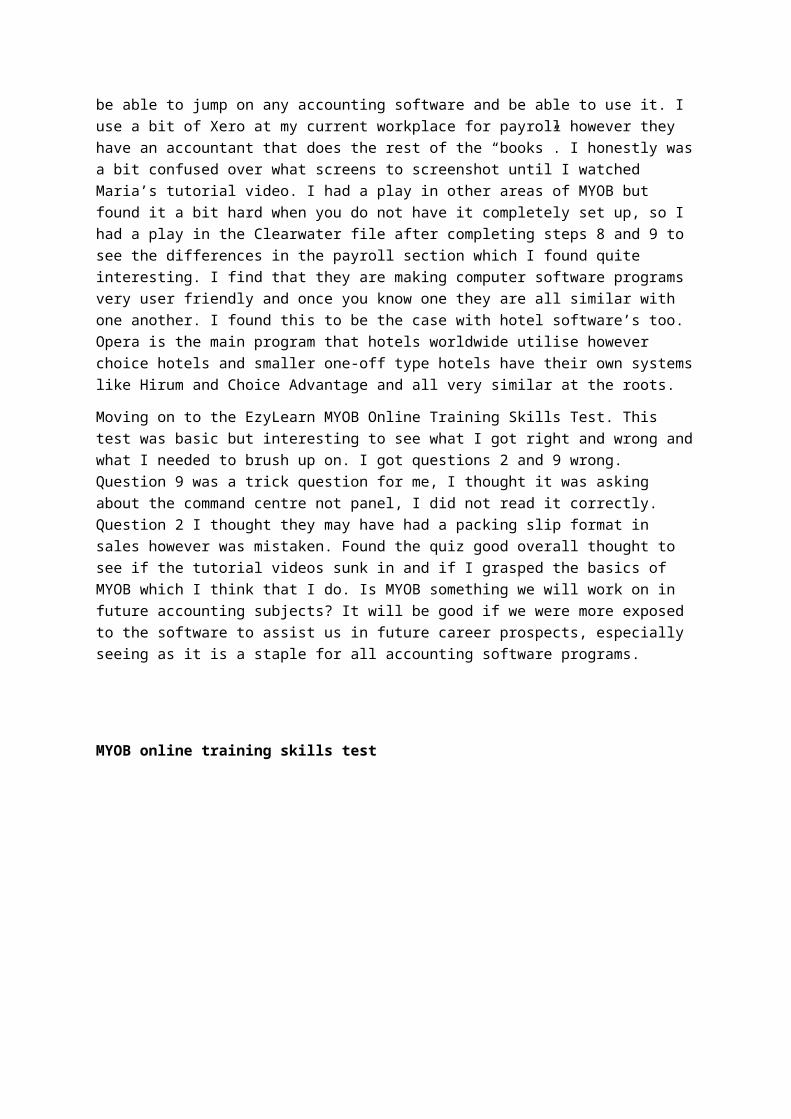
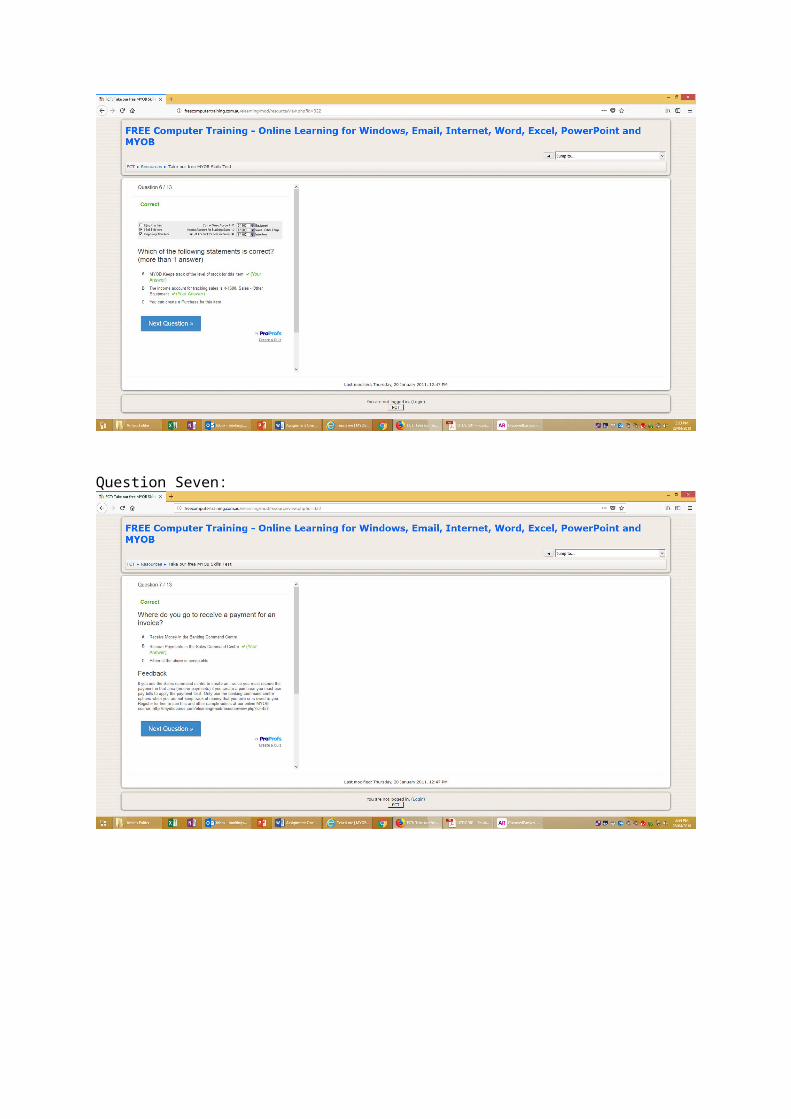
Moving on to the EzyLearn MYOB Online Training Skills Test. This test was basic but interesting to see what I got right and wrong and what I needed to brush up on. I got questions 2 and 9 wrong. Question 9 was a trick question for me, I thought it was asking about the command centre not panel, I did not read it correctly. Question 2 I thought they may have had a packing slip format in sales however was mistaken. Found the quiz good overall thought to see if the tutorial videos sunk in and if I grasped the basics of MYOB which I think that I do. Is MYOB something we will work on in future accounting subjects? It will be good if we were more exposed to the software to assist us in future career prospects, especially seeing as it is a staple for all accounting software programs.
MYOB online training skills test
Question One:
Question Two:
Question Three:

Question Four:
Question Five:

Question Six:
Question Seven:

Question Eight:
Question Nine:
Question Ten:
Question Eleven:

Question Twelve:
Question Thirteen:
Assignment One Step Nine
With choosing the 10 transactions I decided to follow the training tutorial videos on completing them for my own firm for ease while experimenting with the MYOB programme. DiscoverIE is a design, manufacturing and supply firm for electronic components. To choose transactions that related to my firm I kept it basic while trying to choose transactions that would attempt to use different parts of MYOB for further training. So, the following list are my transactions that I have completed in MYOB for my firm:

Transaction One: 14th April 2018 Princess Alexandra Hospital has ordered an electronic part for one of their x-ray machines at the hospital for a cost of $5,621.95.
With this being an increase in an Asset, the Trade Debtors account is debited - $5621.95
To balance this Sales Income is credited $5110.86 and GST Collected is credited $511.09
Transaction Two: 15th April 2018 James Cameron orders a fibreoptic cable for $250.
With this being an increase to an asset, the trade debtors account is debited $250.
To balance this, sales income is credited $227.27 and GST collected is credited $22.73.
Transaction Three: 16th April 2018 Princess Alexandra Hospital pays the invoice for the ordered electronic part for the xray machine of $5621.95.
With this being an increase to an asset the business account is debited $5621.95.
To balance out the trade debtors account $5621.95 is credited.
Transaction Four: 19th April 2018 DiscoverIE purchases some new flyers through MOJO advertising for a mail out to their regular clients at a cost of $2500.
With this being an increase to a liability, the trade creditors account is credited $2500.
To balance this the advertising and marketing account is debited $2272.73 and GST Paid is debited $227.27.
Transaction Five: 19th April 2018 pays an electricity invoice through VISA credit card for $560.
With an increase to a liability, the visa credit card is credited $560.
To balance this the electricity account is debited $509.09 and GST paid is debited $50.91.
Transaction Six: 19th April 2018 account for a receipt from a manager who required stamps and stationery from the post office on the company Visa Credit Card.
With an increase to a liability, the visa credit card is credited $76.95.
To balance this the stamps account is debited $22.73 and the stationery account is debited $47.22 and GST paid debited $7. Due to the receipt covering different items this was split into different account categories.
Transaction Seven: 19th April 2018 due to the recent charges made on the Visa Credit Card DiscoverIE transfers $1,000 from the business account to the Credit Card.
With a decrease to a liability, the visa credit card is debited $1,000 and the business account is credited $1,000.
Transaction Eight: 26th April 2018 DiscoverIE prepares a bank deposit of $4500.
With an increase to an asset, the business account is debited $4500 and undeposited funds credited $4500 to balance.
Transaction Nine: 29th April 2018 DiscoverIE receives the flyers from MOJO advertising and pays the invoice of $2500 on the visa credit card.

With an increase to a liability, the visa credit card is credited $2500 and the trade creditors account is debited $2500 to balance.
Transaction Ten: 30th April 2018 the bank fees of $15 has come through on the business account.
With a decrease to an asset, the business account is credited $15 and the bank fee’s account is debited the $15 to balance.
I completed more transactions then this as you can see by the, all transactions, report due to playing around in the MYOB software which you can find here - Assignment One step nine - all transactions.xlsx. I have attached this report in a separate excel file in case this link does not work correctly.
Here are the financial reports for my firm, DiscoverIE, created through MYOB:
Balance sheet

Statement of Cash Flows
Income Statement
Looking at the reports above and the hypothetical figures for my firm, DiscoverIE, my overall thoughts are positive. With cash at the end of the period nearly doubling from $8,000 to $15,312.85

is a pretty good accomplishment. The sale from Princess Alexandra Hospital certainly bumped this amount up due to the high value item that was ordered. This then flows into high income earned as I only put in cost of sales as one freight item which makes the income a lot higher then what it probably would be in the real world of figures. Looking at the expenses for the firm, which was mainly just general expenses plus a payroll expense of a mobile phone – this came to $4475.05 which if you take this amount away from the high income earned you are left with the net profit which isn’t too bad ($2658.55) for what cash the business is holding onto and relative to the other figures of the business. This net profit figure is then put into the balance sheet under equity as current year earnings (this is like what we have learnt in our studies instead of retained earnings account). The rest of the balance sheet flows as per the transactions I have placed into MYOB, showing a higher total asset amount (mainly due to purchasing a vehicle) of $41062.85 and a total amount of liabilities of $12404.30 (mainly consisting of the business loan of $10,000). Which if these figures were accurate I would be putting some of the overage of cash on to the loan before getting hit with fees and interest however I have found in the world of business interest and fees aren’t too bad as they balance out your earnings so you pay less tax.
Now to put these figures into accounting ratios to show how positive these figures are:
Liquidity Current Ratio: Where we look at the total current assets and divide this by the total amount of current liabilities. Why we do this is that it gives people an overall perspective on how likely the firm can pay off short term obligations in the case of an emergency. For the figures above for my firm, DiscoverIE, the liquidity ratio is $16062.85/$2402.30 = 6.69 which is extremely positive and means they will be able to cover their short-term liabilities straight away in the case of an emergency. To word this in another way the ratio is 1:6 so DiscoverIE has 6 times the amount of current assets compared to current liabilities which is quite a good standing. With this they could invest more by taking equity from the current assets and placing it elsewhere and they would still be safe.
Now that we have looked at the short-term ratio figures from the financial reports, to look at the long-term ratio figures we will calculate this by a solvency ratio.
Financial Leverage Ratio: This is where we look at the total assets and divide this by the total amount of equity. Why we do this is that it gives people and overall perspective on how likely the firm can pay any long-term obligations in the case of an emergency. For the figures above for my firm, DiscoverIE, the financial leverage ratio is $41062.85/$28658.55 = 1.4. This is quite a low figure so is this a good thing or a bad thing considering the higher the figure in liquidity the safe it is as they can pay off their short-term obligations quickly and easily? For this ratio the higher it is the riskier the firm is as it means that they are financing their assets by using debt and other liabilities. So once again showing a positive outcome with a low financial leverage ratio figure.
Now that I have worked out both the short term and long-term ratios for the figures, the last ratio to look at is a profitability ratio.
Return on Equity Ratio: This is where we look at the net income and divide this by the total amount of equity. Why we do this is that it gives people an overall perspective on how likely the firm can generate profits with the invested shareholders money. For the figures above for my firm. DiscoverIE, the return on equity ratio is $2,658.55/$28,658.55 = 0.09. This ration is quite low. So are we wanting a high or low ratio here? We are wanting a high figure here as it shows the firm is effective at turning cash into growth and greater gains for the firm and investors. So, this is not a great ratio to be seeing. As above when I was detailing the high cash turnover and higher amount of

assets – this is where DiscoverIE would reinvest into something else for future gains and growth however has not yet and therefore this ratio is low.
Overall looking at these figures and seeing the position DiscoverIE is in, I would be suggesting for re-investment and to create a plan for future gains in the business for growth and to bump of the return on equity ratio and then they would win the trifecta of ratios listed above. There are a few other ratios to look at however with the limited figures displayed I chose the best 3 to represent the figures the best, to tell the best story.
Assignment One Step Ten
As I started to browse my first financial report of 2017 I came across depreciation explained in the accounting policies which details the method and percentages DiscoverIE uses within the financial report (certainly off to a good start):
So DiscoverIE uses the straight-line method, which makes sense to me as it is the most simple and easy to use method and consists of less mistakes. So, for a large firm like mine it would certainly be the best option for them. This process has stayed the same over the past 3 annual reports. Percentages and methods have stayed the same over the past 4 years for them firm. I thought there may have been a slight change for 2017 due to the firm changing names and noticing changes in other areas of the financial reports however this is not the case with depreciation.
As I went to my financial reports, I realised that there is no depreciation listed on my income statement. I noticed that there is amortisation in the supplementary income statement however still no depreciation. Where have they put the depreciation expense? So, I decided to go straight to the balance sheet and have a look at the non-current assets and have a look at the notes associated with this. My firm, DiscoverIE only has 4 non-current assets listed over the past 3 annual reports:
1. Property, plant and equipment2. Intangible assets - goodwill3. Intangible assets – other4. Deferred tax assets
As I was scrolling to the notes on property, plant and equipment I came across notes 5 and 7 which details operating segment information and operating profit. These two notes list the depreciation expense amounts, note 7 splits depreciation and amortisation into 2 parts which I have listed the values below:
2017 2016 2015 2014Depreciation 3 million 2.2 million 2.1 million 1.1 millionAmortisation 4.6 million 3.4 million 2.6 million 1.3 million

Note 5 kept depreciation and amortisation together however split it into three different categories. The categories are separate parts of the group – Custom distribution, Design & Manufacturing and Central. So, you can see which areas of the group have the most depreciation and amortisation. This was quite interesting to look at. In the first 2 annual reports the Design and Manufacturing segment used up most of the total. I have completed a table below to show what percentage of depreciation and amortisation was expensed to the design and manufacturing segment compared to the total of depreciation and amortisation:
2017 2016 2015 2014Percentage 89.47% 80.36% 72.34% 38.10%
In 2014 the Custom Distribution segment had the highest amount, with a percentage of 52.39%. So why the jump from 38% to 70% what changed in 2015 for this increase? I did notice that DiscoverIE acquired 2 firms in the design and manufacturing segments in the 2014 - 2015 financial year which may have had an impact on the depreciation amounts increasing. At the end of the 2013-2014 financial year there was another design and manufacturing firm acquired. These 3 acquisitions made a total increase of 11.4 million to the property, plant and equipment asset which is where DiscoverIE gets their depreciation from.
Moving to the property, plant and equipment note, I find the millions expensed to depreciation (table on the first page) separated into 3 groups:
1. Land and Buildings2. Leasehold Improvements3. Plant and Equipment
2017 2016 2015 2014Land & Buildings 0.3 million 0.3 million 0.2 million 0.1 million
Leasehold improvements
0.2 million 0.1 million 0.1 million 0.2 million
Plant & Equipment
2.5 million 1.8 million 1.8 million 0.8 million
These results are what I expected with the above percentage results with property, plant and equipment increasing by 3 large acquisitions over the 2015 financial year. What I still find interesting though which I haven’t yet determined is where does depreciation exist in the income statement? DiscoverIE only displays 2 expenses on their income statement which is Selling and distribution costs and Administrative expenses (including exceptional items). Both items have no notes attached to them. I would assume that they consider depreciation as an exceptional item as depreciation doesn’t fit under the rest of the headings. I find it strange that the two expense headings on the income statement have no notes, the only headings which do not have notes either. I wander why they have done it like this? Is it due to them being London based? Do they set their reports differently? Something I am certainly eager to find out by going through other people’s reports.
Depreciation in relation to the total amount of expenses on the income statement is a small amount. I have worked out the percentages to clearly show this:
2017 2016 2015 2014Percentage 2.90% 2.71% 2.68% 1.90%

DiscoverIE depreciation journal entries would look like the following:
2017 Debit CreditDepreciation Expense 0.3 million
Accumulated depreciation on land and buildings
0.3 million
Depreciation Expense 0.2 millionAccumulated depreciation on
leasehold improvements0.2 million
Depreciation Expense 2.5 millionAccumulated depreciation on
plant and equipment2.5 million
I have noticed throughout the steps of this assignment that when DiscoverIE acquires other firms this makes quite an impact to the figures on the financial statements. Another area in which this has a big impact to which I have not discussed as of yet is goodwill. The amount of goodwill has increased throughout the 3 years as shown below:
2017 2016 2015 2014Goodwill 72.6 million 63.6 million 51.6 million 21.2 million
Before I started studying I would look at assets to determine how good a firm is and what they have. I believe having goodwill listed as an asset is deceiving. The asset of the firm that was purchased should be listed as an asset not what was overpaid or what is thought to be gained from acquiring the firm. When completing accounting ratios, you include total amount of assets – this ratio would be incorrect as it would include goodwill. DiscoverIE acquires and disposes of firms in every financial year. Their goodwill is continuously rising from firms they pay extra for or believe they will get future gains from the firm. I don’t believe this portrays an actual picture of true assets of the firm.