--vision 2015
TRANSCRIPT
ODESSA COLLEGE
Financial Statements and Independent Auditors' Report
-
'--VISION 2015 DELIVERING more TO OUR COMMUNITY
Odessa Junior College District August 31, 2013 and 2012
TABLE OF CONTENTS Page ORGANIZATIONAL DATA 1 INDEPENDENT AUDITORS’ REPORT 2 MANAGEMENT’S DISCUSSION AND ANALYSIS 5 FINANCIAL STATEMENTS: Statements of Net Position – Exhibit 1 23 Statements of Financial Position – Odessa College Foundation, Incorporated 25 Statements of Revenues, Expenses and Changes in Net Position – Exhibit 2 26 Statements of Activities – Odessa College Foundation, Incorporated 28 Statements of Cash Flows – Exhibit 3 29 Notes to Financial Statements 31 REQUIRED SUPPLEMENTAL INFORMATION: Schedule of Operating Revenues – Schedule A 48 Schedule of Operating Expenses by Object – Schedule B 50 Schedule of Non-Operating Revenues and Expenses – Schedule C 51 Schedule of Net Position by Source and Availability – Schedule D 52 Schedule of Expenditures of Federal Awards – Schedule E 53 Schedule of Expenditures of State Awards – Schedule F 55 SINGLE AUDIT REPORTS: Independent Auditors’ Report on Internal Control Over Financial Reporting and on Compliance and Other Matters Based on an Audit of Financial Statements Performed in Accordance with Government Auditing Standards 56 Independent Auditors’ Report on Compliance with Requirements That Could Have a Direct and Material Effect on to Each Major Program and on Internal Control over Compliance in Accordance with OMB Circular A-133 58 Schedule of Findings and Questioned Costs 60 STATISTICAL SUPPLEMENT Statistical Supplement 1-12 62
ODESSA JUNIOR COLLEGE DISTRICT
ORGANIZATIONAL DATA
For the Year Ended August 31, 2013
BOARD OF TRUSTEES
OFFICERS Ms. Ray Ann Zant President Mr. J. E. “Coach” Pressly Vice President Mr. Bruce Shearer Secretary Dr. Tara Deaver Assistant Secretary MEMBERS TERM EXPIRES MAY, Mr. Richard C. Abalos Odessa, Texas 2017 Mr. Royce Bodiford Odessa, Texas 2019 Mr. Tommy Clark Odessa, Texas 2019 Dr. Tara Deaver Odessa, Texas 2017 Mr. Neil Grape Odessa, Texas 2019 Mr. Gary S. Johnson Odessa, Texas 2015 Mr. JE “Coach” Pressly Odessa, Texas 2015 Mr. Bruce Shearer Odessa, Texas 2017 Ms. Ray Ann Zant Odessa, Texas 2015
PRINCIPAL ADMINISTRATIVE & FINANCIAL OFFICERS
Dr. Gregory D. Williams Ms. Virginia E. Chisum, CPA Dr. Tanya Hughes Dr. Don Wood Ms. Kim McKay Mr. Shawn Shreves Ms. Brandy Ham
President Vice President for Business Affairs
Vice President for Instruction Effectiveness Vice President for Student Services & Enrollment
Management Vice President for Information Technology
Executive Director of Finance
-1-
Independent Auditors’ Report The Board of Trustees Odessa Junior College District Odessa, Texas Report on the Financial Statements We have audited the accompanying financial statements of Odessa Junior College District (the “District”) as of and for the years ended August 31, 2013 and 2012, and the related notes to the financial statements, which collectively comprise the District’s basic financial statements as listed in the table of contents. Management’s Responsibility for the Financial Statements Management is responsible for the preparation and fair presentation of these financial statements in accordance with accounting principles generally accepted in the United States of America; this includes the design, implementation, and maintenance of internal control relevant to the preparation and fair presentation of financial statements that are free from material misstatement, whether due to fraud or error. Auditor’s Responsibility Our responsibility is to express opinions on these financial statements based on our audit. We conducted our audit in accordance with auditing standards generally accepted in the United States of America and the standards applicable to financial audits contained in Government Auditing Standards, issued by the Comptroller General of the United States. Those standards require that we plan and perform the audit to obtain reasonable assurance about whether the financial statements are free from material misstatement. An audit involves performing procedures to obtain audit evidence about the amounts and disclosures in the financial statements. The procedures selected depend on the auditor’s judgment, including the assessment of the risks of material misstatement of the financial statements, whether due to fraud or error. In making those risk assessments, the auditor considers internal control relevant to the entity’s preparation and fair presentation of the financial statements in order to design audit procedures that are appropriate in the circumstances, but not for the purpose of expressing an opinion on the effectiveness of the entity’s internal control. Accordingly, we express no such opinion. An audit also includes evaluating the appropriateness of accounting policies used and the reasonableness of significant accounting estimates made by management, as well as evaluating the overall presentation of the financial statements. We believe that the audit evidence we have obtained is sufficient and appropriate to provide a basis for our audit opinions.
-2-
JOHNSON MILLER & CO., CPA’s PC An Independent Member Of BDO Seidman Alliance
Odessa, Texas Midland, Texas
Hobbs, New Mexico
Certified Public Accountants A Professional Corporation
2626 JBS Parkway, Suite A-200 • Odessa, Texas 79761 • (432) 362-3800 • Fax (432) 362-4476 jmcpa.com

Opinions In our opinion, the financial statements referred to above present fairly, in all material respects, the respective financial position of the District as of August 31, 2013 and 2012, and the respective changes in financial position, and cash flows for the years then ended in accordance with accounting principles generally accepted in the United States of America. Other Matters Required Supplementary Information Accounting principles generally accepted in the United States of America require that the management’s discussion and analysis on pages 5-22 be presented to supplement the basic financial statements. Such information, although not a part of the basic financial statements, is required by the Governmental Accounting Standards Board, who considers it to be an essential part of financial reporting for placing the basic financial statements in an appropriate operational, economic, or historical context. We have applied certain limited procedures to the required supplementary information in accordance with auditing standards generally accepted in the United States of America, which consisted of inquiries of management about the methods of preparing the information and comparing the information for consistency with management’s responses to our inquiries, the basic financial statements, and other knowledge we obtained during our audit of the basic financial statements. We do not express an opinion or provide any assurance on the information because the limited procedures do not provide us with sufficient evidence to express an opinion or provide any assurance. Other Information Our audits were conducted for the purpose of forming opinions on the financial statements that collectively comprise the District’s basic financial statements. The organizational data and statistical supplement on page 1 and pages 62 through 72 are presented for purposes of additional analysis and are not a required part of the basic financial statements. The schedule of expenditures of federal awards is presented for purposes of additional analysis as required by U.S. Office of Management and Budget Circular A-133, Audits of States, Local Governments, and Non-Profit Organizations, and is also not a required part of the basic financial statements. The accompanying schedule of expenditures of state awards is presented for purposes of additional analysis as required by the Provisions of the State of Texas Single Audit Circular, and is not a required part of the basic purpose financial statements. In addition, the supplementary data presented in schedules A, B, C and D is presented for additional purposes and is not a required part of the basic financial statements. The schedules of expenditures of federal and state awards are the responsibility of management and were derived from and relate directly to the underlying accounting and other records used to prepare the basic financial statements. Such information has been subjected to the auditing procedures applied in the audit of the basic financial statements and certain additional procedures, including comparing and reconciling such information directly to the underlying accounting and other records used to prepare the basic financial statements or to the basic financial statements themselves, and other additional procedures in accordance with auditing standards generally accepted in the United States of America. In our opinion, the schedules of expenditures of federal and state awards are fairly stated in all material respects in relation to the basic financial statements as a whole. The organizational data and statistical supplement have not been subjected to the auditing procedures applied in the audit of the basic financial statements and, accordingly, we do not express an opinion or provide any assurance on them.
-3-

Other Reporting Required by Government Auditing Standards In accordance with Government Auditing Standards, we have also issued our report December 5, 2013, on our consideration of the District’s internal control over financial reporting and on our tests of its compliance with certain provisions of laws, regulations, contracts, and grant agreements and other matters. The purpose of that report is to describe the scope of our testing of internal control over financial reporting and compliance and the results of that testing, and not to provide an opinion on internal control over financial reporting or on compliance. That report is an integral part of an audit performed in accordance with Government Auditing Standards in considering the District’s internal control over financial reporting and compliance.
Odessa, Texas December 5, 2013
-4-

Management’s Discussion and Analysis For the Period Ending August 31, 2013 (Unaudited)
-5-
Management’s Discussion and Analysis INTRODUCTION The Management’s Discussion and Analysis provides an overview of the Odessa Junior College District’s (“the District”) financial activities for the years ended August 31, 2013 (Fiscal Year 2013), 2012 (Fiscal Year 2012), and 2011 (Fiscal Year 2011). In conformity with Government Accounting Standards Board (GASB) Statement No. 34, the discussion focuses on currently known facts, decisions, and conditions and is intended to assist the reader in the interpretation of the financial statements and notes that follow this analysis. Some of the financial and enrollment highlights of Fiscal Year 2013 are as follows:
x The District’s assets exceeded liabilities by $42.9 million at the end of fiscal year 2013, compared to $38.8 million and $33.1 million at the end of fiscal years 2012 and 2011, respectively. Of these amounts, the unrestricted net position totaled $19.1 million, $17.9 million, and $17.7 million for fiscal years 2013, 2012, and 2011. This unrestricted net position is available to meet any of the District’s ongoing obligations.
x The District’s net position as a whole was strengthened as total revenues exceeded total
expenses by $4.5 million in fiscal year 2013. Revenues exceeded expenses by $5.3 million and $2.7 million in fiscal years 2012 and 2011.
x The District’s total debt decreased during fiscal year 2013 by $2.3 million to $89.9 million due principal payments on revenue and general obligation bonds. In fiscal year 2012, the debt increased by $4.5 million to $92.2 million due to the issuance of a campus housing revenue bond.
x Capital assets (net of depreciation) increased by approximately $26.7 million in 2013 and by approximately $11.3 million in 2012.
x Total duplicated headcount of students enrolled in credit courses decreased by 4.8% to
13,889 for the 2012-13 academic year from a total of 14,584 during 2011-12 and 13,990 during 2010-11. Total semester credit hours also decreased slightly by 0.9% to 97,604 for 2012-13, compared to 98,533 during 2011-12 and 103,204 during 2010-11.
x Total contact hours from both credit and noncredit instruction decreased by 4.9% to
2,267,590 in 2012-13 from 2,384,618 in 2011-12 and 2,461,271 in 2010-11. Most of the decrease came from fewer students taking non-credit vocational instruction due to the strong economy and high demand for workers.
BASIC FINANCIAL STATEMENTS There are three basic financial statements presented: the Statement of Net Position; the Statement of Revenues, Expenses and Changes in Net Position; and the Statement of Cash Flows. These statements should be read in conjunction with the notes to the basic financial statements.
Management’s Discussion and Analysis For the Period Ending August 31, 2013 (Unaudited)
-6-
Financial statements for the District’s component unit, the Odessa College Foundation, are issued independently of the District. The Foundation’s Statement of Financial Position and Statement of Activities for its most recently completed fiscal years of 2012 and 2011 are presented as discrete reports on pages 25 and 28 of the District’s basic financial statements. Complete financial statements for the Foundation can be obtained from the Foundation at 201 West University Blvd, Odessa, TX 79764.
x The Statement of Net Position
The Statement of Net Position (Exhibit 1) reports the assets, liabilities, and resulting net position of the District as of the end of the fiscal year. It is a “point in time” financial statement; its purpose is to give the readers a snapshot of the financial condition of Odessa College on the last day of each fiscal year. The Statement of Net Position includes assets and liabilities, both current and non-current, and net position.
x Current assets are those assets that are available to satisfy current liabilities, or liabilities that are due within one year.
x Non-current assets include capital assets, restricted cash, long-term investments, and other assets not classified as current.
x Non-current liabilities include bonds payable and other long-term commitments. Net position is the difference between total assets and total liabilities. Net position is one way to measure the financial health of the District as they represent the amount of resources available to finance future activities. Over time, the increases and decreases in net position is one indicator of whether the overall financial condition has improved or deteriorated during the year when considered with other factors such as enrollment, contact hours of instruction, student retention and other non-financial information.
Net assets are divided into three major categories.
x Invested in Capital Assets, Net of Related Debt, reflects the District’s equity in property, plant and equipment.
x Restricted Net Position has external limitations on the way in which it may be used. x Unrestricted Net Position is available to use for any lawful purpose of the District.
x The Statement of Revenues, Expenses, and Changes in Net Position
The Statement of Revenues, Expenses, and Changes in Net Position (Exhibit 2) explains “why” the net position has increased or decreased during the year. It focuses on the “bottom line results” of the District’s operations. This approach summarizes and simplifies the user’s analysis of the cost of various District services to its students and the burden to the public. The statement is divided into (a) Operating Revenues and Expenses, (b) Non-Operating Revenues and Expenses, and (c) Other Revenue.
Management’s Discussion and Analysis For the Period Ending August 31, 2013 (Unaudited)
-7-
Generally, operating revenues are received in exchange for providing goods and services to the various customers of the District. Operating revenues include:
x Tuition and fees x Federal and state grants x Sales and services of educational activities x Auxiliary and other operating revenues
Operating expenses are those paid to acquire or produce the goods and services provided in return for the operating revenues and to carry out the District’s mission. Depreciation is included as an operating expense. Non-operating revenues are funds received for which goods and services are not directly provided to those providing the revenue. Non-operating revenues include:
x State legislative appropriations x Local property taxes x Federal student aid grants x Non-capital gifts and investment income
Other revenue includes capital contributions, additions to endowments, and special and extraordinary items. Odessa College, like all other Texas community colleges, is primarily dependent upon three sources of revenue: state appropriations, tuition and fees, and local property taxes. Since state appropriations and property taxes are classified as non-operating revenues (per the GASB requirement), all Texas community colleges will display an operating deficit before taking into account other support. Essentially, this operating deficit represents the net cost of services to students that must be covered by state appropriations, local property taxation, and other sources of revenue. Therefore, total revenues and total expenses should be considered in assessing the change in the District’s financial position.
x The Statement of Cash Flows
The final statement presented is the Statement of Cash Flows which analyzes the cash activities of the District for the year. This statement helps readers assess the District’s ability to generate future cash flows and its ability to meet obligations as they come due. The statement is divided into five parts:
x Cash provided by or used for operating activities x Cash flows from non-capital financing activities x Cash flows from investing activities x Cash provided by or used for capital related financing activities, and x Cash used for acquisition and construction of capital items.
Management’s Discussion and Analysis For the Period Ending August 31, 2013 (Unaudited)
-8-
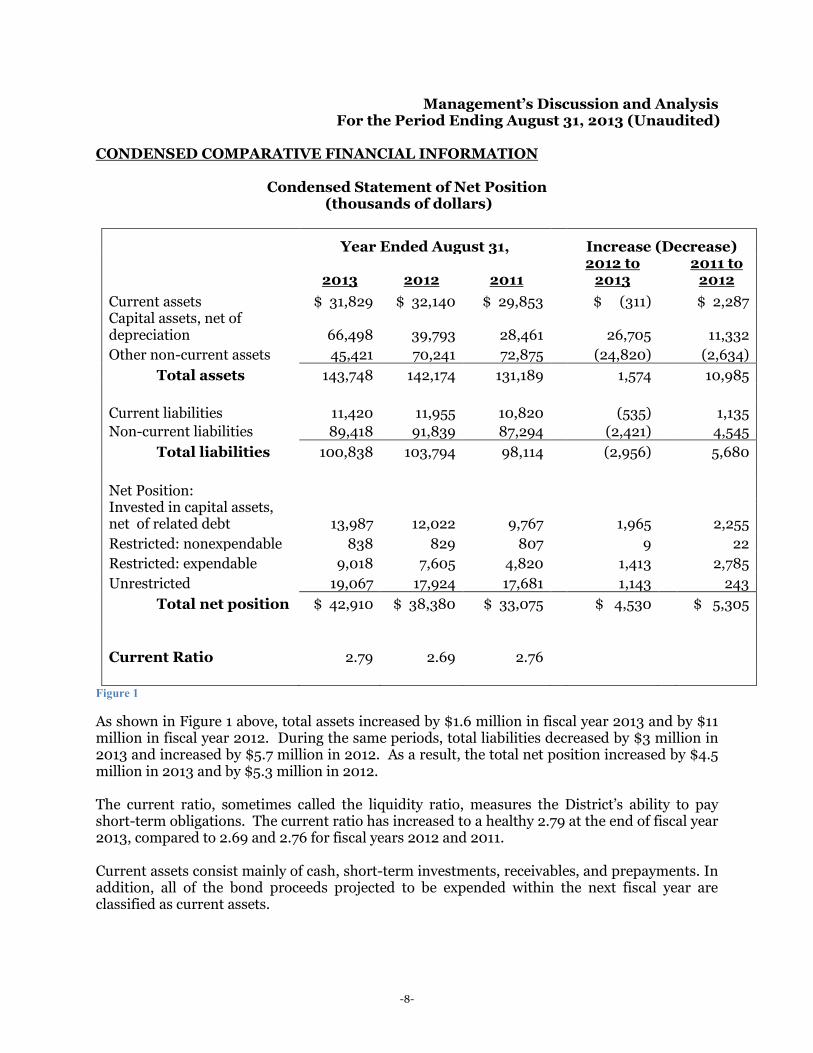
CONDENSED COMPARATIVE FINANCIAL INFORMATION
Condensed Statement of Net Position (thousands of dollars)
Year Ended August 31, Increase (Decrease)
2013 2012 2011 2012 to
2013 2011 to
2012 Current assets $ 31,829 $ 32,140 $ 29,853 $ (311) $ 2,287 Capital assets, net of depreciation 66,498 39,793 28,461 26,705 11,332 Other non-current assets 45,421 70,241 72,875 (24,820) (2,634)
Total assets 143,748 142,174 131,189 1,574 10,985 Current liabilities 11,420 11,955 10,820 (535) 1,135 Non-current liabilities 89,418 91,839 87,294 (2,421) 4,545
Total liabilities 100,838 103,794 98,114 (2,956) 5,680 Net Position: Invested in capital assets, net of related debt 13,987 12,022 9,767 1,965 2,255 Restricted: nonexpendable 838 829 807 9 22 Restricted: expendable 9,018 7,605 4,820 1,413 2,785 Unrestricted 19,067 17,924 17,681 1,143 243
Total net position $ 42,910 $ 38,380 $ 33,075 $ 4,530 $ 5,305
Current Ratio 2.79 2.69 2.76
Figure 1
As shown in Figure 1 above, total assets increased by $1.6 million in fiscal year 2013 and by $11 million in fiscal year 2012. During the same periods, total liabilities decreased by $3 million in 2013 and increased by $5.7 million in 2012. As a result, the total net position increased by $4.5 million in 2013 and by $5.3 million in 2012. The current ratio, sometimes called the liquidity ratio, measures the District’s ability to pay short-term obligations. The current ratio has increased to a healthy 2.79 at the end of fiscal year 2013, compared to 2.69 and 2.76 for fiscal years 2012 and 2011. Current assets consist mainly of cash, short-term investments, receivables, and prepayments. In addition, all of the bond proceeds projected to be expended within the next fiscal year are classified as current assets.
Management’s Discussion and Analysis For the Period Ending August 31, 2013 (Unaudited)
-9-
During fiscal year 2013: x There was a small overall decrease of $311,000 in current assets as cash and
short-term investments increased by $2 million and the previous year’s large Pell receivable declined by $2.2 million.
During fiscal year 2012:
x Current assets increased by 7.7% from $29.9 million to $32.1 million primarily due to an increase of $2.1 million in federal Pell grant receivable. This was due to a timing difference in the draw-down of fall awards as the fall 2011 draw-down occurred in late August (before year-end) in fiscal 2011 while the fall 2012 draw-down did not occur until early September.
During fiscal year 2011:
x Current assets increased by 67.6% from $17.8 million to $29.9 million primarily due to cash and cash equivalent investments from the general obligation bond proceeds that are projected to be spent on capital projects within the next 12 months.
x Current accounts and notes receivable also increased by $0.4 million, or 10%, due to increased student tuition receivables related to student aid refunds to Title IV programs.
Capital assets, net of depreciation, increased by 67%, or $26.7 million, during 2013 while increasing $11.3 million during 2012. In accordance with GASB Statements No. 34 and 35, the District does not record the cost of its capital assets as an expense at the time of acquisition/completion of the asset, but rather shows the expense systematically over the expected life of the asset as depreciation expense. The purchases of land, building improvements, and equipment continue to exceed annual depreciation charges each year.
During fiscal 2013: x The old bread store and adjoining land north of the campus was purchased for
$175,000 for future expansion, and a lot south of 23rd Street was purchased for $25,000 for future parking.
x Construction in Progress increased by approximately $21 million as construction progressed on six Vision 2015 projects, including the Wood Math & Science Building, the Campus Center, the Fire Technology Training Center, the Sedate Hall Welding Labs, the Central Services Building, and the Commons Landscape and Infrastructure improvements.
x Buildings increased by $6.2 million as construction was completed on the Culinary Arts Center and the Softball/Tennis Complex.
x Major equipment purchases included $343,000 for Culinary Arts kitchen equipment, $50,000 for Steinway pianos, $157,000 for computer and network equipment.
x Grant-funded instructional equipment purchases included $67,000 from Carl Perkins Grant, $125,000 from the Title V Rural Areas Distance Learning Grant, and $25,000 from the Texas Nursing Shortage Reduction Grant.
Management’s Discussion and Analysis For the Period Ending August 31, 2013 (Unaudited)
-10-
During fiscal 2012: x Land adjacent to the campus south of 23rd Street was purchased for $130,000. x Construction in Progress increased by approximately $5 million as demolition,
construction and design continued on several Vision 2015 capital improvement projects, including the Culinary Arts Center, the Math and Science Building, the Softball/Tennis Complex, and the Campus Center.
x Buildings increased by $6.7 million due to the purchase of a $6.3 million student housing facility and the purchase of a storage building complex south of campus.
x Major equipment purchases funded by grants included $271,000 from the Title V Rural Areas Distance Learning Grant and $51,000 from Carl Perkins funds.
x Other equipment purchases included $227,000 for buses and other vehicles, $196,000 for a new scoreboard, and $72,000 for Steinway pianos.
x These additions to capital were offset by an increase in accumulated depreciation of $1.4 million.
During fiscal 2011:
x Construction in Progress increased by approximately $337,000 as preliminary architectural and engineering services were paid related to the Vision 2015 capital improvement projects.
x Buildings increased by $451,000 due to completion of remodeling for the instrumentation lab in the ET building and the ICA Community Gym in the Sports Center
x Major equipment purchases funded by grants included $113,000 from the Title V Rural Areas Distance Learning Grant, $106,000 from the CCRA Pre-engineering Grant, $190,000 from the Texas JET Instrumentation Grant, and $57,000 from Carl Perkins funds.
x These additions to capital were offset by an increase to accumulated depreciation of almost $1.3 million.
Total liabilities decreased by $3 million in fiscal year 2013 after increasing by $5.7 million in fiscal 2012. The major changes were in non-current liabilities which decreased by $2.4 million in 2013 after increasing by $4.5 million in 2012. The major contributing factors are explained below.
During fiscal 2013:
x Accounts payable related to construction and vendor purchases declined by $441,000.
x The current portion of bonds payable increased by $125,000 due to scheduled increases in principle payments due within the next 12 months related to outstanding bonds.
x Non-current liabilities decreased by $2.4 million due to principle payments on lease and bond obligations. There were no additions to long-term debt in 2013.
Management’s Discussion and Analysis For the Period Ending August 31, 2013 (Unaudited)
-11-
During fiscal 2012: x Accounts payable increased by a net of $335,000. Year-end payables related to
construction and equipment purchases increased by $682,000 while payables to students and other vendors decreased by $348,000. In addition, a contingent liability of $469,000 was recorded, representing the state’s share of TRS retirement benefits that remained unpaid by the state at year-end. Mote details concerning this contingent liability can be found in Note 21 on page 45 of the Notes to the Financial Statements
x The current portion of bonds payable increased by $310,000 due to scheduled debt service payments due within the next 12 months related to the 2009 revenue bonds, the 2011 general obligation bonds, and the newly issued 2012 revenue bonds.
x Non-current liabilities increased by $4.5 million due to the issuance of $6.3 million in revenue bonds for the acquisition of student housing facility, offset by a principal payment of $1.8 million on the 2009 revenue bond.
During fiscal 2011:
x Deferred revenue increased approximately $863,000, representing tuition for students who registered in the summer for fall classes. The increases were due to a fall 2011 tuition increase of $10 per semester hour for in-district students and $20 per semester hour for out-of-district students.
x The current portion of bonds payable increased slightly by $55,000 due to scheduled debt service payments due within the next 12 months.
x Non-current liabilities increased due to the issuance of $68.5 million in general obligation bonds for capital improvements.
Overall, the District’s net position increased by $4.5 million during fiscal 2013, $5.3 million during 2012, and $2.7 million during 2011. The net position represent the District’s equity, some of which is restricted for certain uses and some of which in unrestricted.
During fiscal 2013: x The Net Investment in Capital Assets, representing the net value of the District’s
capital assets (land, buildings, and equipment) less the related debt, increased by almost $2 million.
x The Restricted Net Position increased approximately $1.4 million. The major increases were related to a $1 million donation restricted for the construction of the Wood Math & Science Building and investment income related to the unexpended bond funds. Assets restricted for debt service payments also increased by $142,000 during the year. This net position will decrease over time as these funds are spent on construction and debt service.
x The Unrestricted Net Position increased by approximately $1.1 million due to an excess of unrestricted revenues over unrestricted expenses.

Management’s Discussion and Analysis For the Period Ending August 31, 2013 (Unaudited)
-12-
During fiscal 2012: x The Net Investment in Capital Assets, representing the net value of the District’s
capital assets (land, buildings, and equipment) less the related debt, increased $2.3 million. Capitalized assets increased by $11.3 million while the related long-term debt increased by $9 million.
x Restricted Net Position increased approximately $2.8 million. The major increases were related to a $3 million donation restricted for the construction of the Wood Math & Science Building and investment income related to the unexpended bond funds. During the same time, assets restricted for debt service decreased by $0.7 million.
x Unrestricted Net Position increased by approximately $243,000 due to an excess of unrestricted revenues over unrestricted expenses.
During fiscal 2011:
x Capital Assets net of related debt increased $1.6 million. Capitalized assets increased by $0.2 million while the related long-term debt decreased by $1.4 million.
x Restricted Net Position increased approximately $181,000. The major increases were related to donations restricted for student scholarship and corporate sponsorships restricted for the purchase of a new scoreboard in the Sports Center. Assets restricted for debt service also increased $46,000.
x Unrestricted Net Position increased by approximately $906,000 due to an excess of unrestricted net revenues.

Management’s Discussion and Analysis For the Period Ending August 31, 2013 (Unaudited)
-13-
Condensed Statement of Revenues, Expenses and Changes in Net Position (thousands of dollars)
Year Ended August 31, Increase
(Decrease)
2013 2012 2011 2012
to 2013 2011
to 2012 Operating revenues
Tuition and fees (net of discounts) $ 7,579 $ 7,463 $ 5,492 $ 116 $ 1,971 Grants and contracts 1,787 2,730 3,020 (943) (290) Other 2,710 2,194 2,060 516 134
Total operating revenue 12,076 12,387 10,572 (311) 1,815
Operating expenses Instruction 14,747 15,272 15,265 (525) 7 Public Service 908 1,210 1,332 (302) (122) Academic Support 4,049 4,138 3,805 (89) 333 Student Services 2,813 2,914 2,837 (101) 77 Institutional Support 6,464 5,796 6,313 668 (517) Operations & Maint of Plant 3,389 3,351 3,705 38 (354) Scholarship & Fellowships 4,713 5,237 6,136 (524) (899) Auxiliary enterprises 1,872 1,675 1,668 197 7 Depreciation 1,575 1,448 1,375 127 73
Total operating expenses 40,530 41,041 42,436 (511) (1,395)
Operating loss (28,454) (28,654) (31,864) 200 3,210 Non-operating revenue/(expense)
State appropriation 8,597 8,427 10,803 170 (2,376) Ad valorem taxes 22,695 20,976 16,027 1,719 4,949 Federal Revenue, non operating 5,093 6,153 7,570 (1,060) (1,417) Interest on debt (4,883) (5,206) (570) 323 (4,636) Other 393 586 516 (193) 70
Total non-operating income 31,895 30,936 34,346 959 (3,410) Other revenue Capital grants and gifts 1,089 3,023 203 (1,934) 2,820 Increase in net position 4,530 5,305 2,685 (775) 2,620 Net assets, beginning of year 38,380 33,075 30,390 5,305 2,685
Net assets, end of year $ 42,910 $ 38,380 $ 33,075 $ 4,530 $ 5,305 Figure 2
Management’s Discussion and Analysis For the Period Ending August 31, 2013 (Unaudited)
-14-
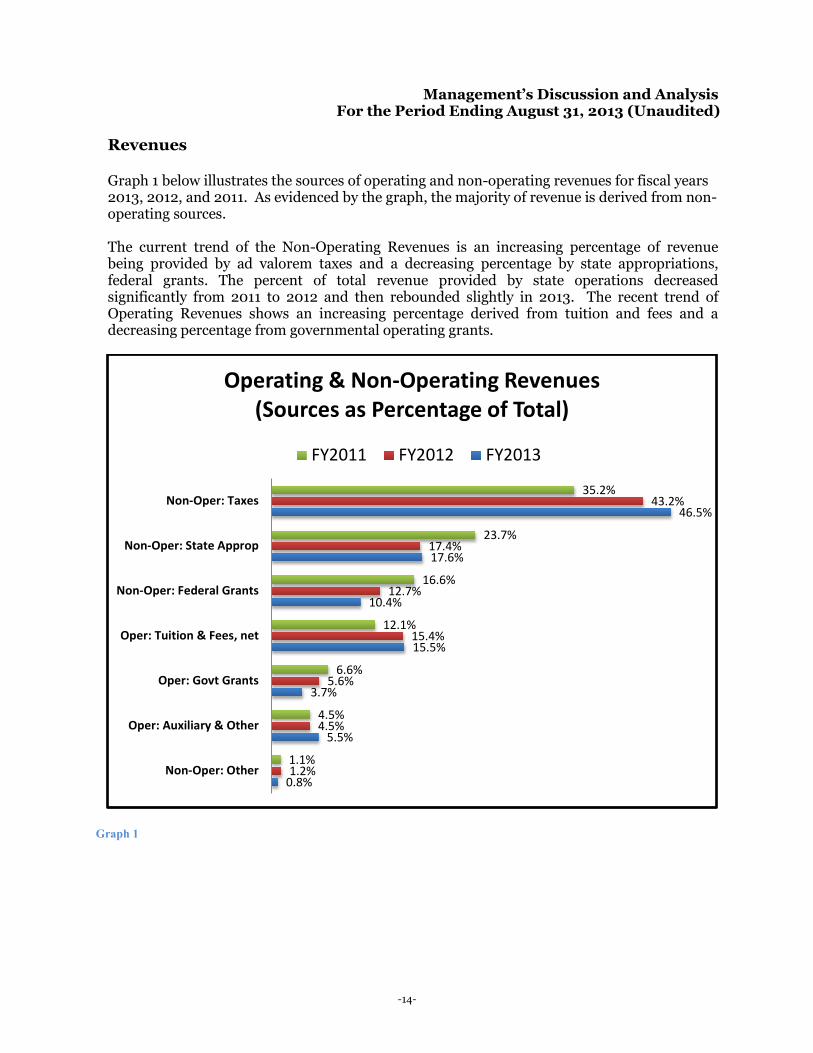
Revenues Graph 1 below illustrates the sources of operating and non-operating revenues for fiscal years 2013, 2012, and 2011. As evidenced by the graph, the majority of revenue is derived from non-operating sources. The current trend of the Non-Operating Revenues is an increasing percentage of revenue being provided by ad valorem taxes and a decreasing percentage by state appropriations, federal grants. The percent of total revenue provided by state operations decreased significantly from 2011 to 2012 and then rebounded slightly in 2013. The recent trend of Operating Revenues shows an increasing percentage derived from tuition and fees and a decreasing percentage from governmental operating grants.
Graph 1
0.8%
5.5%
3.7%
15.5%
10.4%
17.6%
46.5%
1.2%
4.5%
5.6%
15.4%
12.7%
17.4%
43.2%
1.1%
4.5%
6.6%
12.1%
16.6%
23.7%
35.2%
Non-Oper: Other
Oper: Auxiliary & Other
Oper: Govt Grants
Oper: Tuition & Fees, net
Non-Oper: Federal Grants
Non-Oper: State Approp
Non-Oper: Taxes
Operating & Non-Operating Revenues (Sources as Percentage of Total)
FY2011 FY2012 FY2013

Management’s Discussion and Analysis For the Period Ending August 31, 2013 (Unaudited)
-15-
Operating Revenues: Key factors impacting Operating Revenues are explained below:
During fiscal 2013:
x Tuition and Fee Revenue, net of discounts, increased only slightly by $116,000. Gross tuition and fees actually decreased by $170,000 due to a dip in semester credit hours. At the same time, scholarship allowances and discounts declined by $286,000 due to continued decline in federal student aid grants applied to tuition.
x Federal Operating Grants decreased by $835,000 or 38%. Funding of the Title V distance learning grant decreased by $400,000 for 2013 due to decreased activity. In addition, the conclusion of two U.S. Department of Education grants (for Upward Bound and pre-engineering) and a U.S. Department of Labor grant (ARRA-Pathways out of Poverty) resulted in an additional decrease of $371,000.
x State Operating Grants also decreased by $108,000 due to a reduction in State Adult Basic Education grants, AVID training grants, and the end of a Texas Workforce Commission machine training grant.
During fiscal 2012:
x Tuition and Fee Revenue, net of discounts, increased by $3.2 million. Gross tuition and fees increased by $1.5 million due to an increase in student enrollment and higher tuition and fee rates. In addition, scholarship allowances and discounts declined by $1.7 million due to a decline in federal student aid grants applied to tuition.
x Federal Operating Grants decreased by $298,000 or 11.8%, due to the end of the two U.S. Department of Labor job training grants, the CCRA pre-engineering grant, and reduced funding from the Carl Perkins basic grant.
x Sales and Services of Educational Activities increased by $78,000, or 18.6%, due to a full year of increased rates and higher enrollments at the Children’s Center.
During fiscal 2011:
x Tuition Revenue increased by $831,000 or 17.8%, and is attributable to an increase in student enrollment and higher tuition rates for the spring and summer sessions.
x Federal Operating Grants decreased by $1,092,000, or 30.1%, due to several grants ending in fiscal year 2010, including the Title V Co-Op Grant, the TRIO Student Support Services Grant, the ARRA Fiscal Stabilization Grant, and the Head Start Grant. In addition, annual funding was reduced for the CCRA Pre-Engineering Grant and the Carl Perkins Grants.
x State and Local Grants increased by $114,000, or 54.7%, due to increases in the ABE grant and new grants from the City of Andrews and Midland College.
x Sales and Services of Educational Activities increased by $129,020, or 44.8%, due to increases in Children’s Center revenue from increased rates and numbers of children served.
x Other Operating Revenue increased $121,000, or 20.2%, due to corporate sponsorships for a new Sports Center Scoreboard

Management’s Discussion and Analysis For the Period Ending August 31, 2013 (Unaudited)
-16-
Non-Operating Revenues: Non-Operating Revenues increased by $959,000 million in 2013 after decreasing by $2.9 million in 2012 and increasing $1.7 million during 2011. Key factors impacting Non-Operating Revenues are discussed below:
During fiscal 2013:
x Total State Appropriations increased by $170,000 or 2%, due to a reallocation of state funding based on prior year enrollments as well as a slight increase in state funding of group health insurance premiums.
x Property Tax revenue increased by $1,720,000, or 8.2%, due to higher property values. Total assessed valuations increased by 12.8% while the tax rate declined by 4.1%. The major increases in values came from personal property (up 25%) and minerals (up 11%).
x Federal Grants for Title IV student aid decreased by $1,060,000, or 17%, as the number of Pell grant awards decreased from 1,966 in fiscal 2012 to 1,686 in fiscal 2013.
During fiscal 2012:
x State Appropriation declined by $2,376,000 or 22%, including decreases of $1,018,000 in general revenue allocation and $1,385,000 in health insurance and retirement benefits. The District’s allocation from the state nursing shortage reduction grant increased by $67,000.
x Property Tax revenue increased by $4,949,000, or 30.9%, due to higher property values and a new tax levy for debt service. The new debt service tax rate was set at $0.03686 while the rate for maintenance and operations remained unchanged at $0.1584 Taxable appraised values increased for minerals (up 6.4%), industrial property (up 12.5%), and personal property (up 12.8%).
x Federal Grants for Title IV student aid decreased by $1,400,000, or 18.3%, as the number of Pell grant awards decreased from 2,266 in fiscal 2011 to 1,966 in fiscal 2012.
During fiscal 2011:
x Property Taxes increased by $873,951, or 5.8%, although the Board of Trustees lowered the maintenance tax rate from $0.1624 to $0.1584. The increased revenue resulted from higher oil and gas mineral valuations.
x Federal Grants for Title IV student aid increased by $1,130,020, or 17.5%, as the number of Pell grant awards increased.
x Other Revenues increased by $195,812 due to a new state JET capital grant for the instrumentation program.

Management’s Discussion and Analysis For the Period Ending August 31, 2013 (Unaudited)
-17-
Operating Expenses by Functional Classification Functional classifications are the traditional categories that have been used to show expenses. They represent the type of programs and services provided. Graph 2 below compares operating expenses classified by functional category for fiscal years 2013, 2012 and 2011.
Graph 2
4%
2%
5%
7%
8%
10%
12%
16%
36%
4%
3%
4%
7%
8%
10%
13%
14%
37%
3%
3%
4%
7%
9%
9%
14%
15%
36%
Depreciation
Public Service
Auxiliary Enterprises
Student Services
Operation & Maint of Plant
Academic Support
Scholarships
Institutional Support
Instruction
Operating Expenditures (Functions as Percentage of Total)
FY2011 FY2012 FY2013

Management’s Discussion and Analysis For the Period Ending August 31, 2013 (Unaudited)
-18-
As shown in Figure 2, total Operating Expenses decreased by $511,000 or 1.2% in 2013, after a significant decrease of $1,395,000, or 3.3%, during 2012, after increasing by $555,000, or 1.3%, in 2011. Key factors impacting operating expenses by functional expense categories are described below:
During fiscal 2013:
x Instructional expenditures declined by $525,000, or 3.4%, due to a decline in salaries of $244,000 that resulted from several faculty openings during the year, as well as a decline in contracted instruction of $308,000 from a decrease in the enrollment of continuing education students.
x Public Service restricted expenditures declined by $345,000, or 91.7%, primarily due to the Upward Bound federal grant not being awarded during the year resulting in a decrease of $294,000. In addition, fewer renovations were made to the Sports Center facilities as compared to fiscal 2012.
x Academic Support restricted expenditures declined by $340,000, or 31.6%, due primarily to a decline in Title V spending and a decrease in AVID professional development expenses.
x Institutional Support increased by $668,000, or 11.5%, due to new positions in Institutional Effectiveness and Information Technology on campus as well as the board approved salary increases.
x Scholarship expenditures decreased by $524,000, or 10%, due to a continued decline in the number of students receiving Pell grants. At the same time, the amount of TPEG and TEXAS grants increased by about $112,000.
x Depreciation expenditures increased by $126,000, or 8.7%, due to the increase in capitalized assets.
During fiscal 2012:
x Public Service expenditures declined by $122,000, or 9.2% due to the sale of KOCV-FM, the District’s public radio station.
x Academic Support expenditures increased by $333,000, or 8.8%, due to increases salaries and operating expenditures related to the Title V Rural Areas Distance Learning Grant and the AVID training grant.
x Institutional Support decreased by $517,000, or 8.2%, due to a decreases in election costs, marketing expenses, and state-paid benefits.
x Physical Plant expenditures decreased by $354,000, or 9.6% due to several open positions and a decrease in property insurance expense. In addition, there were no major construction projects and fewer renovation projects in 2012.
x Scholarship expenditures decreased by $899,000, or 14.7 %, from the 2011 amount. Two major changes in financial aid affected the award to students starting in FY2011: (1) stricter requirements on the appeal process for satisfactory progress and (2) elimination of additional Pell funds for the summer terms.
x Depreciation expenditures increased by $74,000, or 5.4%, due to the increase in capitalized assets.
Management’s Discussion and Analysis For the Period Ending August 31, 2013 (Unaudited)
-19-
During fiscal 2011:
x Instructional expenditures increased by $883,972, or 6.1%. This increase resulted mainly from higher faculty salaries, the addition of five new faculty positions, and more adjunct faculty needed to serve record student enrollments.
x Student Services expenditures decreased by $496,039, or 14.9%, due to the ending of federal funding of the Student Support Services grant, and vacancies in counseling and testing that were not filled during the year.
x Physical Plant expenditures decreased by $1,330,718, or 26.4%. In anticipation of upcoming capital construction related to the recently passed bond issue, there were no major construction or renovation projects begun in 2011. In addition, utility expenses decreased by $200,000.
x Scholarship expenditures increased by $1,432,52, of 30.5%, as the number of Pell-eligible students increased by about 500 while the maximum Pell award increased by $200 per year.
Other Revenues consist mainly of capital contributions in the form of gifts and grants as well as additions to permanent endowments. Capital contributions for fiscal 2013 were $1.1 million, compared to $3 million in 2012, and $196,000 in 2011. A $1 million anonymous gift was received in honor of Dr. Greg Williams to aid in the Vision 2015 construction campaign. The $3 million donation in 2012 came from the Clay & Louise Wood Family Foundation for the new math and science building. The $196,000 contribution in 2011 was from a state grant for renovation of the instrumentation lab.

Management’s Discussion and Analysis For the Period Ending August 31, 2013 (Unaudited)
-20-
Capital Assets and Debt Administration Capital Assets The District’s investment in capital assets, net of depreciation, was $66.5 million at the end of fiscal 2013, compared to $39.8 million in 2012, and $28.5 million in 2011. A summary of capitalized assets for fiscal years 2013, 2012, and 2011 is shown below in Figure 3. This information is also presented in Note 5 of the Financial Statements. Details of capital asset activity can be found on pages 6-7 of this Management’s Discussion and Analysis report.
Capital Assets, Net of Depreciation (thousands of dollars)
Year Ended August 31, Increase (Decrease)
2013 2012 2011 2012 to
2013 2011 to
2012 Land $ 4,196 $ 3,996 $ 3,866 $ 200 $ 130 Buildings and improvements 42,349 36,156 29,457 6,193 6,699 Other land improvements 6,810 6,654 6,623 156 31 Construction in progress 26,310 5,438 461 20,872 4,977 Furniture and equipment 10,032 9,173 8,262 859 911 Library materials 2,392 2,394 2,395 (2) (1)
Subtotal 92,089 63,811 51,064 28,278 12,747 Less: Accumulated depreciation (25,591) (24,018) (22,603) (1,573) (1,415)
Net Capital Assets $ 66,498 $ 39,793 $ 28,461 $ 26,705 $ 11,332 Figure 3
The District is in the midst of a $78 million, multi-year campus improvement project called “Vision 2015”. Funding is coming from a $68.5 million general obligation bond passed in November 2010 as well as private capital donations. Vision 2015 improvements will result in the addition of 7 new buildings and renovations to 6 existing facilities. Approximately $55 million of construction commitments have been awarded as of August 31, 2013.
Management’s Discussion and Analysis For the Period Ending August 31, 2013 (Unaudited)
-21-
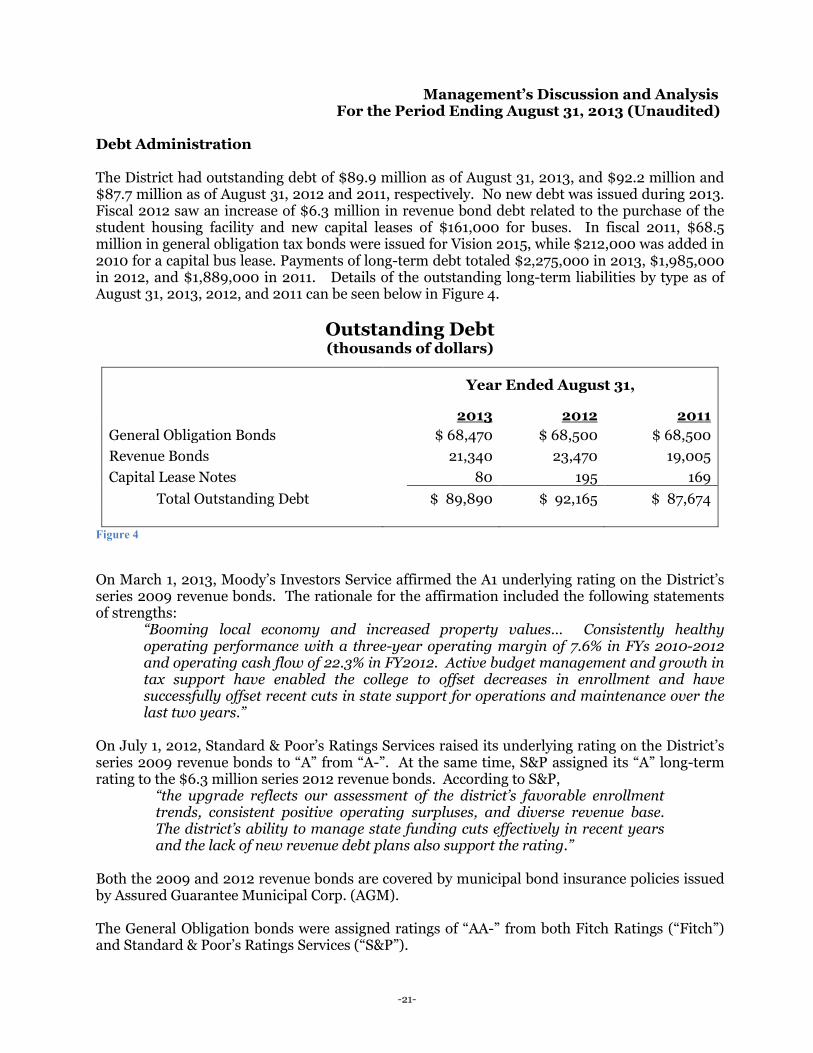
Debt Administration The District had outstanding debt of $89.9 million as of August 31, 2013, and $92.2 million and $87.7 million as of August 31, 2012 and 2011, respectively. No new debt was issued during 2013. Fiscal 2012 saw an increase of $6.3 million in revenue bond debt related to the purchase of the student housing facility and new capital leases of $161,000 for buses. In fiscal 2011, $68.5 million in general obligation tax bonds were issued for Vision 2015, while $212,000 was added in 2010 for a capital bus lease. Payments of long-term debt totaled $2,275,000 in 2013, $1,985,000 in 2012, and $1,889,000 in 2011. Details of the outstanding long-term liabilities by type as of August 31, 2013, 2012, and 2011 can be seen below in Figure 4.
Outstanding Debt (thousands of dollars)
Year Ended August 31,
2013 2012 2011 General Obligation Bonds $ 68,470 $ 68,500 $ 68,500 Revenue Bonds 21,340 23,470 19,005 Capital Lease Notes 80 195 169
Total Outstanding Debt $ 89,890 $ 92,165 $ 87,674
Figure 4
On March 1, 2013, Moody’s Investors Service affirmed the A1 underlying rating on the District’s series 2009 revenue bonds. The rationale for the affirmation included the following statements of strengths:
“Booming local economy and increased property values… Consistently healthy operating performance with a three-year operating margin of 7.6% in FYs 2010-2012 and operating cash flow of 22.3% in FY2012. Active budget management and growth in tax support have enabled the college to offset decreases in enrollment and have successfully offset recent cuts in state support for operations and maintenance over the last two years.”
On July 1, 2012, Standard & Poor’s Ratings Services raised its underlying rating on the District’s series 2009 revenue bonds to “A” from “A-”. At the same time, S&P assigned its “A” long-term rating to the $6.3 million series 2012 revenue bonds. According to S&P,
“the upgrade reflects our assessment of the district’s favorable enrollment trends, consistent positive operating surpluses, and diverse revenue base. The district’s ability to manage state funding cuts effectively in recent years and the lack of new revenue debt plans also support the rating.”
Both the 2009 and 2012 revenue bonds are covered by municipal bond insurance policies issued by Assured Guarantee Municipal Corp. (AGM). The General Obligation bonds were assigned ratings of “AA-” from both Fitch Ratings (“Fitch”) and Standard & Poor’s Ratings Services (“S&P”).
Management’s Discussion and Analysis For the Period Ending August 31, 2013 (Unaudited)
-22-
Economic Factors That Will Affect the Future The economic position of the District is influenced in part by the economic position of the nation, the state of Texas, and of Ector County. While the state of Texas is currently recovering from the recent national recession, the local economy has remained strong. Ector County continues to enjoy an extremely low unemployment rate, and oil-related business activity and retail indicators are continuing to rise. The District has benefitted from increases in taxable values, and this positive trend is expected to continue, although at a more moderate rate. Tuition revenues are stable as a result of healthy enrollment and tuition rate increases. The District has compensated for reduced state support through conservative budgeting combined with increases in enrollment, tuition, and local property tax revenue. After making severe cuts to state funding in 2011, the Texas 83rd Legislative Session resulted in an 8.1% increase in state funds for community colleges for fiscal years 2014 and 2015. The legislature also enacted a student success funding model and codified a 50/50 cost sharing of benefits between the state and the local districts. In addition, the District continues to receive the support of the Odessa community, as indicated by the recent successful bond election and increased levels of donations to the District and the OC Foundation. While it is not possible to predict the effects of future economic conditions, management believes the District has a solid and stable financial position and is well equipped to handle the increasing demands for a better educated workforce. The District continually monitors its internal and external environments for factors that may affect its financial position in either the short-term or long-term. Administration is not aware of any currently known facts, decisions, or conditions that are expected to have a significant effect on the financial position or results of operations during the current fiscal year. Requests for Information This annual financial report is designed to provide interested stakeholders with a general overview of the District’s finances and to show the District’s accountability for the money it receives. Questions concerning the information provided in this report or requests for additional information should be addressed to the Chief Financial Officer at Odessa College, 201 West University Blvd, Odessa, TX 79764.
Virginia Chisum, CPA, M. Ed. Vice President for Business Affairs

FINANCIAL STATEMENTS

Odessa Junior College District Exhibit 1
STATEMENTS OF NET POSITION
August 31, 2013 2012 ASSETS: Current Assets Cash and cash equivalents (Notes 2 and 4) $ 15,699,685 11,391,306 Short-term investments (Notes 2 and 4) 9,725,411 12,024,328 Accounts receivable, net (Note 14) 3,145,541 5,718,588 Inventories (Note 2) 8,527 5,665 Notes receivable – current, net 1,346,884 1,509,442 Prepaid items 1,423,420 1,000,684 Escrow deposits 479,663 489,938 Total Current Assets 31,829,131 32,139,951 Noncurrent Assets: Restricted cash and cash equivalents (Notes 2 and 4) 7,428,091 9,388,219 Endowment investments (Notes 2, 3 and 4) 838,423 829,114 Other long-term investments (Notes 2, 3 and 4) 34,723,187 55,958,815 Notes receivable – noncurrent, net 926,458 2,423,570 Unamortized bond issuance costs 1,504,945 1,641,050 Capital assets, net of accumulated depreciation (Notes 2 and 5)
66,497,639
39,792,728
Total Noncurrent Assets 111,918,743 110,033,496 Total Assets $ 143,747,874 142,173,447 LIABILITIES: Current Liabilities: Accounts payable (Note 14) $ 2,741,061 3,038,315 Accrued liabilities 264,251 231,816 Accrued compensable absences (Notes 6 and 12) 454,970 428,443 Funds held for others 594,304 448,535 Deferred revenue – tuition and fees (Note 2) 4,154,540 4,494,561 Deferred revenue – other (Note 2) 885,772 569,078 Capital lease payable – current portion (Notes 6 and 7) 40,231 114,744 Bonds payable – current portion (Notes 6, 7 and 8) 2,285,000 2,160,000 Contingent liability - 469,274 Total Current Liabilities 11,420,129 11,954,766 Noncurrent Liabilities: Capital lease payable – noncurrent (Notes 6 and 7) 40,231 80,461 Bonds payable – noncurrent (Notes 6, 7 and 8) 87,525,000 89,810,000 Unamortized bond premium 1,852,279 1,948,042 Other noncurrent liabilities (Note 6) - - Total Noncurrent Liabilities 89,417,510 91,838,503 Total Liabilities 100,837,639 103,793,269
-23-
Odessa Junior College District Exhibit 1
STATEMENTS OF NET POSITION (CONTINUED)
August 31,
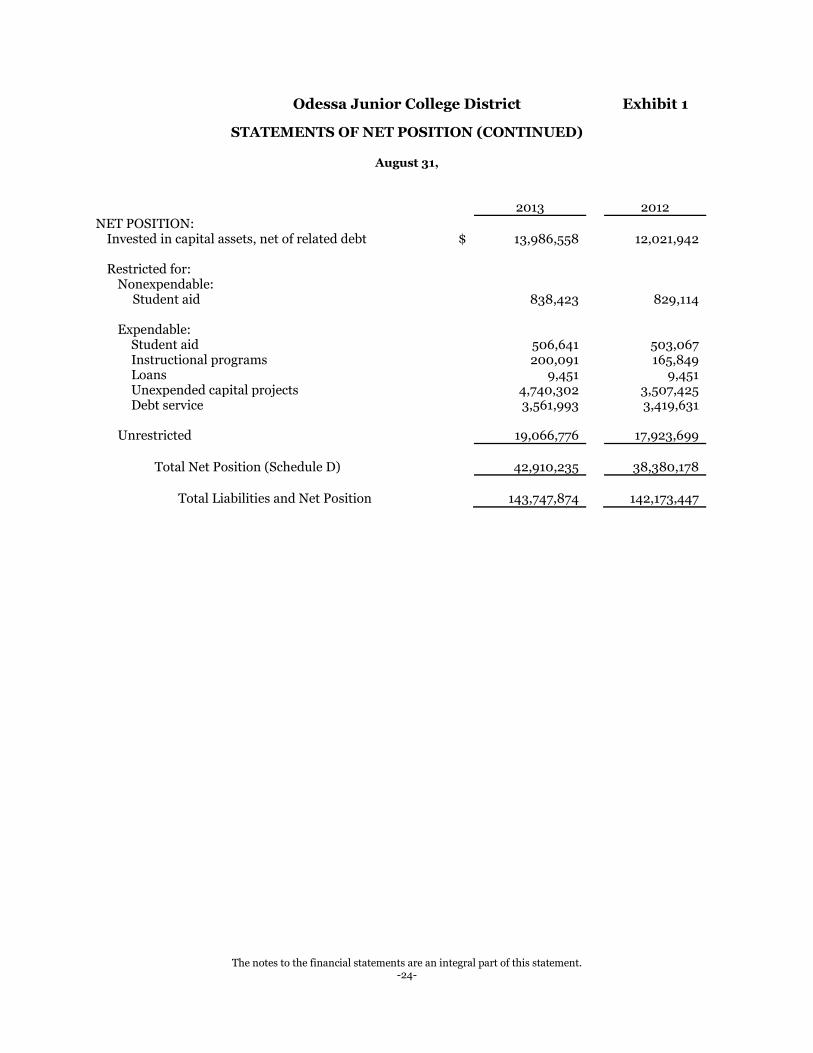
2013 2012 NET POSITION: Invested in capital assets, net of related debt $ 13,986,558 12,021,942 Restricted for: Nonexpendable: Student aid 838,423 829,114 Expendable: Student aid 506,641 503,067 Instructional programs 200,091 165,849 Loans 9,451 9,451 Unexpended capital projects 4,740,302 3,507,425 Debt service 3,561,993 3,419,631 Unrestricted 19,066,776 17,923,699 Total Net Position (Schedule D) 42,910,235 38,380,178 Total Liabilities and Net Position 143,747,874 142,173,447
The notes to the financial statements are an integral part of this statement. -24-

Odessa College Foundation, Incorporated
STATEMENTS OF FINANCIAL POSITION
December 31,
ASSETS 2012 2011 CURRENT ASSETS Cash and cash equivalents $ 703,520 746,148 Pledges receivable 64,453 170,786 Due from Odessa College 3,790 6,744 Total current assets 771,763 923,678 MARKETABLE SECURITIES AT FAIR VALUE 5,819,507 4,624,822 PLEDGES RECEIVABLE - NONCURRENT 177,000 190,167 Total Assets $ 6,768,270 5,738,667
LIABILITIES AND NET ASSETS
2012 2011 LIABILITIES Accounts payable $ 100,560 894 Deferred revenue 2,758 2,758 Total current liabilities 103,318 3,652 NET ASSETS Unrestricted Undesignated 246,416 (252,688 ) Designated for Half-Century scholarships 205,155 205,155 Designed for Health Science scholarships 156,040 156,039 Temporarily restricted 2,287,947 2,196,849 Permanently restricted 3,769,394 3,429,660 Total net assets 6,664,952 5,735,015 Total current liabilities and net assets $ 6,768,270 5,738,667
The notes to the financial statements are an integral part of this statement. -25-
Odessa Junior College District Exhibit 2
STATEMENTS OF REVENUES, EXPENSES, AND CHANGES IN NET POSITION
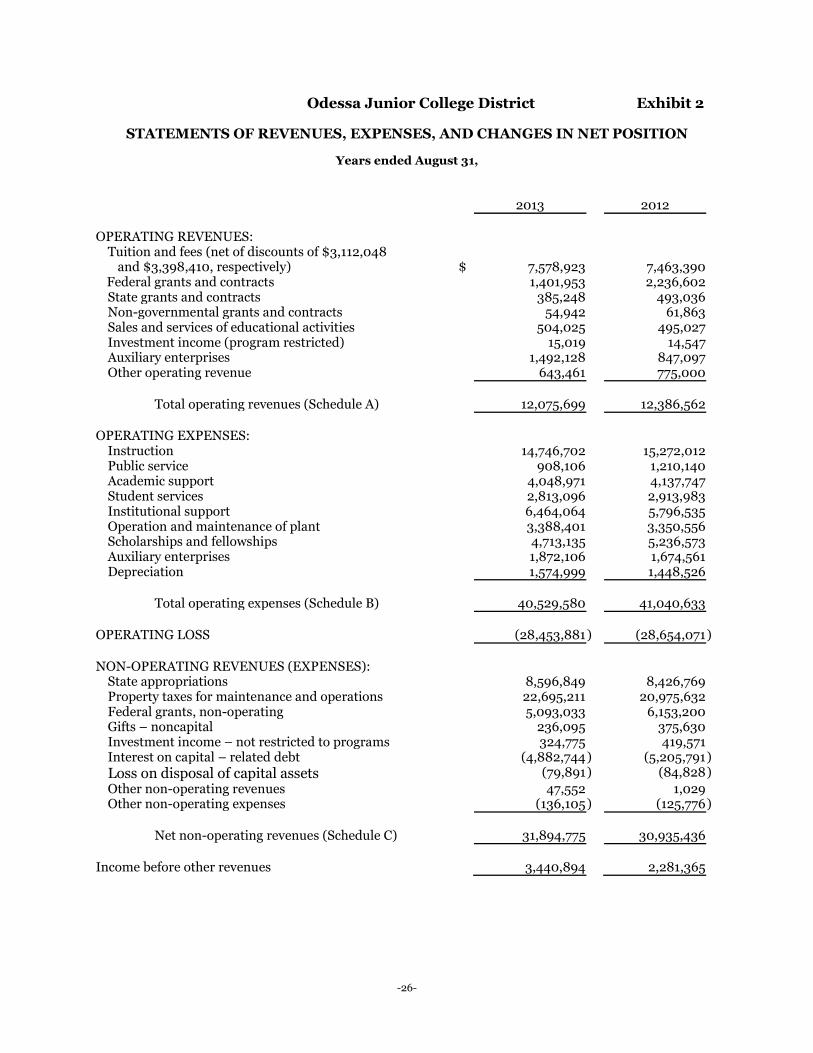
Years ended August 31, 2013 2012 OPERATING REVENUES: Tuition and fees (net of discounts of $3,112,048 and $3,398,410, respectively)
$
7,578,923
7,463,390
Federal grants and contracts 1,401,953 2,236,602 State grants and contracts 385,248 493,036 Non-governmental grants and contracts 54,942 61,863 Sales and services of educational activities 504,025 495,027 Investment income (program restricted) 15,019 14,547 Auxiliary enterprises 1,492,128 847,097 Other operating revenue 643,461 775,000
Total operating revenues (Schedule A) 12,075,699 12,386,562 OPERATING EXPENSES:
Instruction 14,746,702 15,272,012 Public service 908,106 1,210,140 Academic support 4,048,971 4,137,747 Student services 2,813,096 2,913,983 Institutional support 6,464,064 5,796,535 Operation and maintenance of plant 3,388,401 3,350,556 Scholarships and fellowships 4,713,135 5,236,573 Auxiliary enterprises 1,872,106 1,674,561 Depreciation 1,574,999 1,448,526
Total operating expenses (Schedule B) 40,529,580 41,040,633 OPERATING LOSS (28,453,881 ) (28,654,071 ) NON-OPERATING REVENUES (EXPENSES):
State appropriations 8,596,849 8,426,769 Property taxes for maintenance and operations 22,695,211 20,975,632 Federal grants, non-operating 5,093,033 6,153,200 Gifts – noncapital 236,095 375,630 Investment income – not restricted to programs 324,775 419,571 Interest on capital – related debt (4,882,744 ) (5,205,791 ) Loss on disposal of capital assets (79,891 ) (84,828 ) Other non-operating revenues 47,552 1,029 Other non-operating expenses (136,105 ) (125,776 )
Net non-operating revenues (Schedule C) 31,894,775 30,935,436 Income before other revenues 3,440,894 2,281,365
-26-

Odessa Junior College District Exhibit 2
STATEMENTS OF REVENUES, EXPENSES, AND CHANGES IN NET POSITION (CONTINUED)
Years ended August 31,
2013 2012 OPERATING REVENUES (EXPENSES):
Private capital gifts and grants $ 1,076,780 3,000,000 Additions to permanent endowment 12,383 23,403 Total other revenues 1,089,163 3,023,403
Increase in Net Position 4,530,057 5,304,768 Net position – Beginning of year 38,380,178 33,075,410
Net position – End of year $ 42,910,235 38,380,178
The notes to the financial statements are an integral part of this statement. -27-
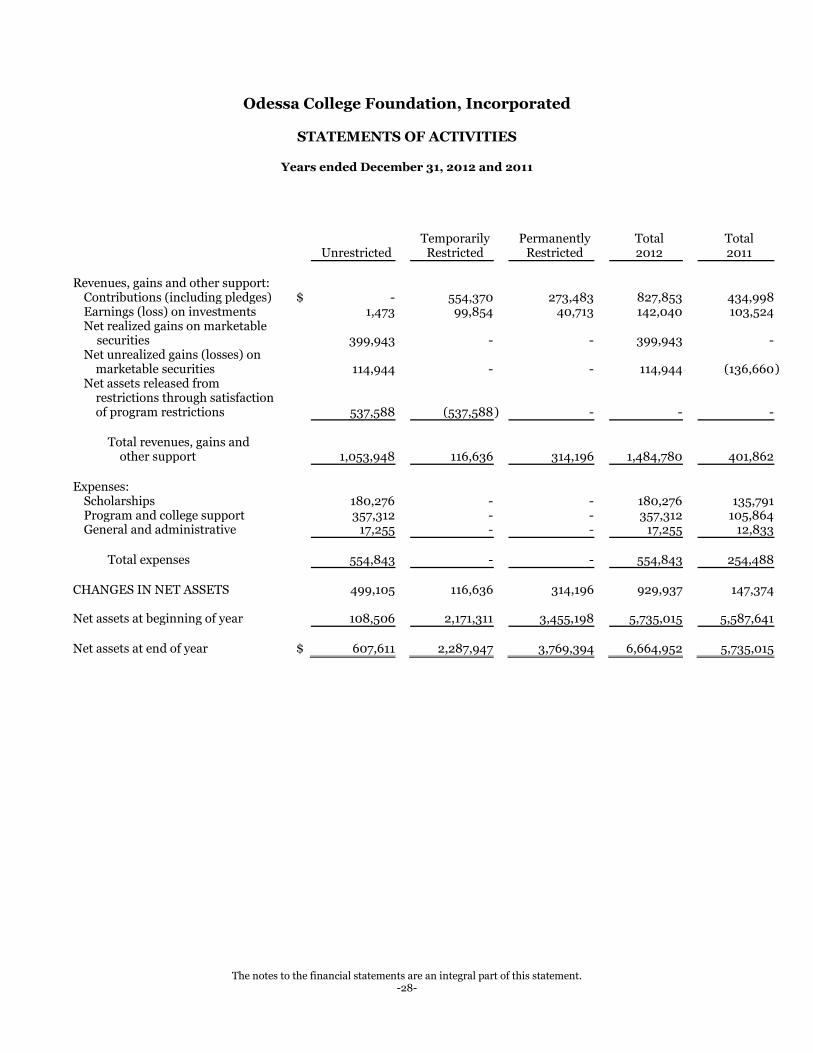
Odessa College Foundation, Incorporated
STATEMENTS OF ACTIVITIES
Years ended December 31, 2012 and 2011
Unrestricted
Temporarily Restricted
Permanently Restricted
Total 2012
Total 2011
Revenues, gains and other support:
Contributions (including pledges) $ - 554,370 273,483 827,853 434,998 Earnings (loss) on investments 1,473 99,854 40,713 142,040 103,524 Net realized gains on marketable securities
399,943
-
-
399,943
-
Net unrealized gains (losses) on marketable securities
114,944
-
-
114,944
(136,660 )
Net assets released from restrictions through satisfaction of program restrictions
537,588
(537,588
)
-
-
-
Total revenues, gains and other support
1,053,948
116,636
314,196
1,484,780
401,862
Expenses:
Scholarships 180,276 - - 180,276 135,791 Program and college support 357,312 - - 357,312 105,864 General and administrative 17,255 - - 17,255 12,833
Total expenses 554,843 - - 554,843 254,488 CHANGES IN NET ASSETS 499,105 116,636 314,196 929,937 147,374 Net assets at beginning of year 108,506 2,171,311 3,455,198 5,735,015 5,587,641 Net assets at end of year $ 607,611 2,287,947 3,769,394 6,664,952 5,735,015
The notes to the financial statements are an integral part of this statement. -28-

Odessa Junior College District Exhibit 3
STATEMENTS OF CASH FLOWS
Years ended August 31,
2013 2012
CASH FLOWS FROM OPERATING ACTIVITIES: Receipts from students and other customers $ 9,409,563 9,752,076 Receipts from grants and contracts 4,383,520 751,708 Receipts from loan collections from students and employees 5,431,853 5,117,513 Other receipts 658,480 789,548 Payments to or on behalf of employees (24,065,529 ) (22,887,864 ) Payments to suppliers for goods or services (9,079,048 ) (9,413,464 ) Payments of scholarships (4,568,209 ) (6,706,293 ) Loans issued to student and employees (5,455,491 ) (5,205,048 ) Other cash payments (422,736 ) (101,759 )
Net cash used in operating activities (23,707,597 ) (27,903,583 )
CASH FLOWS FROM NON-CAPITAL AND RELATED FINANCING ACTIVITIES:
Receipts from state allocations 6,996,733 6,893,480 Receipts from ad valorem taxes 22,615,104 20,943,262 Receipts from non-operating federal revenue 5,093,033 6,153,201 Receipts from gifts and grants other than for capital purposes 248,478 399,128 Receipts from student organizations and other agencies 411,057 (4,867,935 ) Payments to student organizations and other agencies (265,288 ) 5,020,728 Deposit with escrow agents 10,275 (435,749 )
Net cash provided by non-capital and related financing activities 35,109,392 34,106,115
CASH FLOWS FROM CAPITAL AND RELATED FINANCING ACTIVITIES: Proceeds from issuance of capital financing (95,763 ) 6,861,956 Proceeds from capital grants and gifts 2,818,824 452,667 Proceeds from sale of capital assets - - Proceeds from insurance recoveries 47,552 100,277 Purchases of capital assets (28,664,387 ) (12,182,689 ) Payments on capital debt and leases (7,157,487 ) (7,429,200 )
Net cash used in non-capital and related financing activities (33,051,261 ) (12,196,989 )
CASH FLOWS FROM INVESTING ACTIVITIES: Receipts from sale and maturity of investments 40,541,593 20,501,731 Receipts from investment earnings 1,312,437 752,166 Purchases of investments (17,856,313 ) (67,353,899 )
Net cash provided by (used in) investing activities 23,997,717 (46,100,002 )
Increase (decrease) in cash and cash equivalents 2,348,251 (52,094,459 ) Cash and cash equivalents – September 1 20,779,525 72,873,984 Cash and cash equivalents – August 31 23,127,776 20,779,525
-29-
Odessa Junior College District Exhibit 3
STATEMENTS OF CASH FLOWS (CONTINUED)
Years ended August 31,
2013 2012
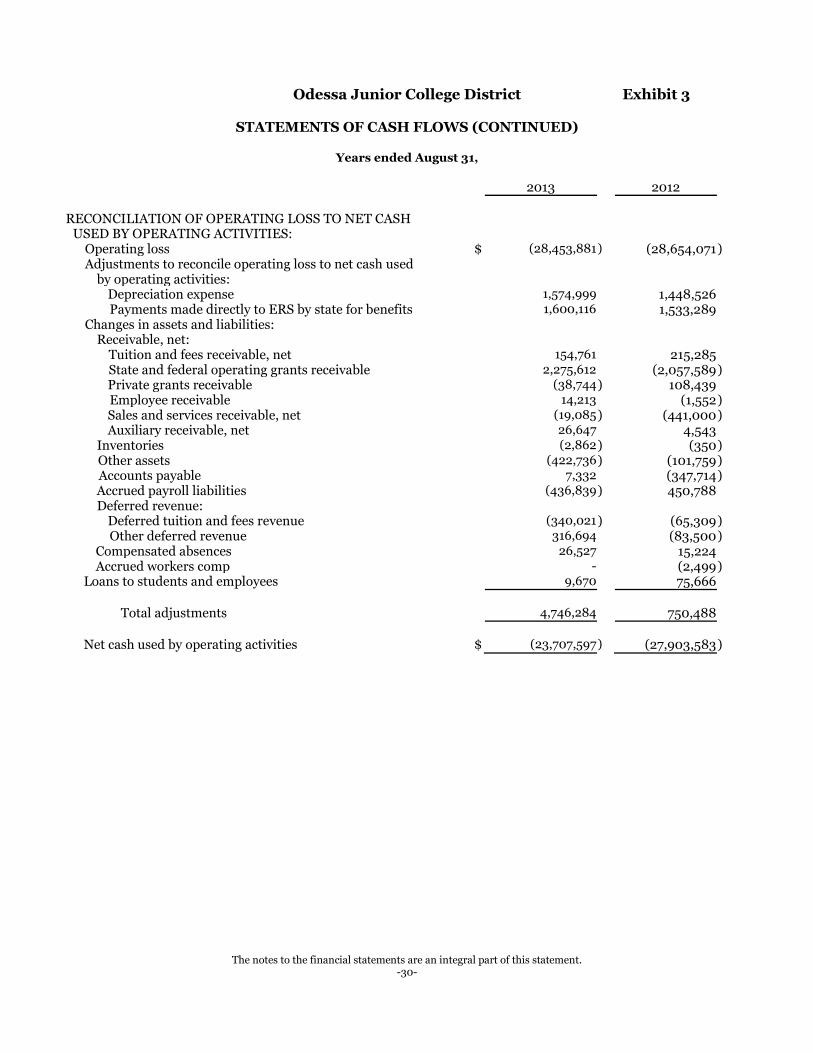
RECONCILIATION OF OPERATING LOSS TO NET CASH USED BY OPERATING ACTIVITIES:
Operating loss $ (28,453,881 ) (28,654,071 ) Adjustments to reconcile operating loss to net cash used by operating activities:
Depreciation expense 1,574,999 1,448,526 Payments made directly to ERS by state for benefits 1,600,116 1,533,289
Changes in assets and liabilities: Receivable, net:
Tuition and fees receivable, net 154,761 215,285 State and federal operating grants receivable 2,275,612 (2,057,589 ) Private grants receivable (38,744 ) 108,439
Employee receivable 14,213 (1,552 ) Sales and services receivable, net (19,085 ) (441,000 ) Auxiliary receivable, net 26,647 4,543 Inventories (2,862 ) (350 ) Other assets (422,736 ) (101,759 )
Accounts payable 7,332 (347,714 ) Accrued payroll liabilities (436,839 ) 450,788
Deferred revenue: Deferred tuition and fees revenue (340,021 ) (65,309 ) Other deferred revenue 316,694 (83,500 ) Compensated absences 26,527 15,224 Accrued workers comp - (2,499 ) Loans to students and employees 9,670 75,666
Total adjustments 4,746,284 750,488 Net cash used by operating activities $ (23,707,597 ) (27,903,583 )
The notes to the financial statements are an integral part of this statement. -30-
Odessa Junior College District
NOTES TO FINANCIAL STATEMENTS
August 31, 2013 and 2012 NOTE 1 – REPORTING ENTITY Odessa Junior College District (the “District”) was established in 1946, in accordance with the laws of the State of Texas, to serve the educational needs of Ector County and the surrounding communities. The District is considered to be a special purpose, primary government according to the definition in Governmental Accounting Standards Board (“GASB”) Statement 14, The Financial Reporting Entity. While the District receives funding from local, state, and federal sources, and must comply with the spending, reporting, and recordkeeping requirements of these entities, it is not a component unit of any other governmental entity. NOTE 2 – SUMMARY OF SIGNIFICANT ACCOUNTING POLICIES 1. Reporting Guidelines The significant accounting policies followed by the District in preparing these financial statements are in accordance with the Texas Higher Education Coordinating Board’s Annual Financial Reporting Requirements for Texas Public Community and Junior Colleges. The District applies all applicable GASB pronouncements. The District is reported as a special-purpose government engaged in business-type activities. 2. Tuition Discounting Texas Public Education Grants Certain tuition amounts are required to be set aside for use as scholarships by qualifying students. This set aside, called the Texas Public Education Grant (“TPEG”), is shown with tuition and fee revenue amounts as a separate set aside amount (Texas Education Code §56.033). When the award for tuition is used by the student, the amount is recorded as tuition and a corresponding amount is recorded as a tuition discount. If the amount is dispersed directly to the student, the amount is recorded as a scholarship expense. Title IV, HEA Program Funds Certain Title IV HEA Program funds are received by the District to pass through to the student. These funds are initially received by the District and recorded as restricted revenue. When the student is awarded and uses these funds for tuition and fees, the amounts are recorded as revenue and a corresponding amount is recorded as a tuition discount. If the amount is dispersed directly to the student, the amount is recorded as a scholarship expense. Other Tuition Discounts The District awards tuition and fee scholarships from institutional funds to students who qualify. When these amounts are used for tuition and fees, the amounts are recorded as tuition and fee revenue and a corresponding amount is recorded as a tuition discount. If the amount is dispersed directly to the student, the amount is recorded as a scholarship expense. 3. Basis of Accounting The financial statements of the District have been prepared on the accrual basis whereby all revenues are recorded when earned and all expenses are recorded when they have been reduced to a legal or contractual obligation to pay.
-31-
Odessa Junior College District
NOTES TO FINANCIAL STATEMENTS (CONTINUED)
August 31, 2013 and 2012 NOTE 2 – SUMMARY OF SIGNIFICANT ACCOUNTING POLICIES (CONTINUED) 4. Budgetary Data Each community college district in Texas is required by law to prepare an annual operating budget of anticipated revenues and expenditures for current operating funds for the fiscal year beginning September 1. The budget, which is prepared on the accrual basis of accounting, is adopted by the District’s Board of Trustees. A copy of the approved budget must be filed with the Texas Higher Education Coordinating Board, Legislative Budget Board, Legislative Reference Library, and the Governor’s Office of Budget and Planning by December 1. 5. Cash and Cash Equivalents The District’s cash and cash equivalents are considered to be cash on hand, demand deposits and short-term investments with original maturities of three months or less from the date of acquisition. Because of their highly liquid nature, funds held in public funds investment pools are also considered to be cash equivalents. 6. Investments In accordance with GASB Statement No. 31, Accounting and Financial Reporting for Certain Investments and External Investment Pools, investments are reported at fair value. Fair values are based on published market rates. Short-term investments have an original maturity greater than three months but less than one year at the time of purchase. Long-term investments have an original maturity of greater than one year at the time of purchase. 7. Inventories Inventories consist of consumable physical plant and food service supplies. Inventories are stated at the lower of cost, determined using the first-in, first-out method, or market. They are charged to expense as consumed. 8. Capital Assets Capital assets are stated at cost. Donated capital assets are valued at their estimated fair market value on the date received. The District’s policy calls for capitalization of equipment, infrastructure and land improvements with a unit cost of $5,000 or more and an estimated useful life in excess of two years. Buildings and building renovations in excess of $100,000 that significantly increase the value or extend the useful life of the structure are also capitalized. The District reports depreciation under a single-line as a business-type unit. Depreciation is computed using the straight-line method over the estimated useful lives of the assets. The following lives are used: Buildings and Building Improvements 50 years Other Real Estate Improvements 20 years Library Books 15 years Furniture, Machinery, Vehicles and Other Equipment 10 years Telecommunications and Peripheral Equipment 5 years 9. Deferred Revenue Deferred revenue relates to student tuition, fees and other revenues received during the current fiscal period for classes or activities to be held in the following period.
-32-

Odessa Junior College District
NOTES TO FINANCIAL STATEMENTS (CONTINUED)
August 31, 2013 and 2012 NOTE 2 – SUMMARY OF SIGNIFICANT ACCOUNTING POLICIES (CONTINUED) 10. Estimates The preparation of the financial statements in conformity with accounting principles generally accepted in the United States of America requires management to make estimates and assumptions that affect certain reported amounts and disclosures. Accordingly, actual results could differ from those estimates. 11. Operating and Non-Operating Revenue and Expense Policy The District distinguishes operating revenues and expenses from non-operating items. The District reports as a BTA and as a single, proprietary fund. Operating revenues and expenses generally result from providing services in connection with the District’s principal ongoing operations. The principal operating revenues are tuition and related fees. The major non-operating revenues are state appropriations, Title IV grant revenue, and property tax collections. Operating expenses include the cost of sales and services, administrative expenses, and depreciation on capital assets. 12. New Accounting Pronouncements GASBS No. 67 GASB Statement 67, Financial Reporting for Pension plans—an Amendment of GASB No. 25, was issued June 2012. The objective of this Statement is to improve financial reporting by state and local governmental pension plans. This Statement results from a comprehensive review of the effectiveness of existing standards of accounting and financial reporting for pensions with regard to providing decision-useful information, supporting assessments of accountability and interperiod equity, and creating additional transparency. This Statement replaces the requirements of Statements No. 25, Financial Reporting for Defined Benefit Pension Plans and Note Disclosures for Defined Contribution Plans, and No. 50, Pension Disclosures, as they relate to pension plans that are administered through trusts or equivalent arrangements (hereafter jointly referred to as trusts) that meet certain criteria. The requirements of Statements 25 and 50 remain applicable to pension plans that are not administered through trusts covered by the scope of this Statement and to defined contribution plans that provide postemployment benefits other than pensions. The provisions of Statement 67 are effect for periods beginning after December 15, 2012. Earlier application is encouraged. GASBS No. 68 GASB Statement 68, Accounting and Financial Reporting for Pensions—an amendment of GASB Statement No. 27, was issued June 2012. The primary objective of this Statement is to improve accounting and financial reporting by state and local governments for pensions. It also improves information provided by state and local governmental employers about financial support for pensions that is provided by other entities. This Statement results from a comprehensive review of the effectiveness of existing standards of accounting and financial reporting for pensions with regard to providing decision-useful information, supporting assessments of accountability and interperiod equity, and creating additional transparency. The provisions of Statement 68 are effective for fiscal years beginning after June 15, 2014. Earlier application is encouraged. GASBS No. 69 GASB Statement 69, Government Combinations and Disposals of Government Operations, was issued in January 2013. This statement establishes accounting and financial reporting standards related to government combinations and disposals of government operations. As used in this statement, the term government combinations includes a variety of transactions referred to as mergers, acquisitions, and transfer of operations. The provisions of Statement 69 are effective for financial statements for reporting beginning after December 15, 2013, and should be applied on a prospective basis. Early application is encouraged.
-33-
Odessa Junior College District
NOTES TO FINANCIAL STATEMENTS (CONTINUED)
August 31, 2013 and 2012 NOTE 2 – SUMMARY OF SIGNIFICANT ACCOUNTING POLICIES (CONTINUED) 12. New Accounting Pronouncements (Continued) GASBS No. 70 GASB Statement 70, Accounting and Financial Reporting for Nonexchange Financial Guarantees, was issued April 2013. Some governments extend financial guarantees for the obligations of another government, a not-for-profit entity, or a private entity without directly receiving equal or approximately equal value in exchange (a nonexchange transaction). As a part of this nonexchange financial guarantee, a government commits to indemnify the holder of the obligation if the entity that issued the obligation does not fulfill its payment requirements. Also, some governments issue obligations that are guaranteed by other entities in a nonexchange transaction. The objective of this Statement is to improve accounting and financial reporting by state and local governments that extend and receive nonexchange financial guarantees. The provisions of Statement 70 are effective for financial statements for reporting beginning after June 15, 2013. Earlier application is encouraged. 13. Characterization of Title IV Grant Revenue In response to guidance provided by the GASB as question/answer 7.72.10 in the Implementation Guide, revenue received for federal Title IV grant programs (i.e. Pell grants) are now characterized as non- operating revenue as opposed to operating revenue. 14. Reclassifications Certain reclassifications have been made to conform to the 2013 presentation. NOTE 3 – AUTHORIZED INVESTMENTS The Board of Trustees of the District has adopted a written investment policy regarding the investment of its funds as defined in the Public Funds Investment Act of 1995 (Section 2256.001, Texas Government Code). The investments of the District are in compliance with Trustees' investment policies. Such investments include (1) obligations of the United States or its agencies, (2) direct obligations of the State of Texas or its agencies, (3) obligations of political subdivisions rated not less than A by a national investment rating firm, (4) certificates of deposit, and (5) other instruments and obligations authorized by statute. In accordance with Sec. 2256.005 (n) of the Public Funds Investment Act, the community college, “...shall arrange for a compliance audit of management controls on investments and adherence to the District’s established investment policies. The compliance audit shall be performed by the District’s internal auditor or by a private auditor...Not later than January 1 of each even numbered year, the community college shall report the results of the most recent audit performed to the state auditor.” The State Auditor has determined that the District and their independent auditors should indicate compliance with the Act by completing the following: x the categorization of investments by risk which is required by GASB 3 in the footnote “Deposits and
Investments,” and x placing a statement in the scope paragraph of the Report on Compliance and on Internal Controls
over Financial Reporting which indicate the audit work covered in the Act, or x writing a separate letter to the State Auditor’s Office stating that the District is in compliance with
all requirements of the Act.
-34-
Odessa Junior College District
NOTES TO FINANCIAL STATEMENTS (CONTINUED)
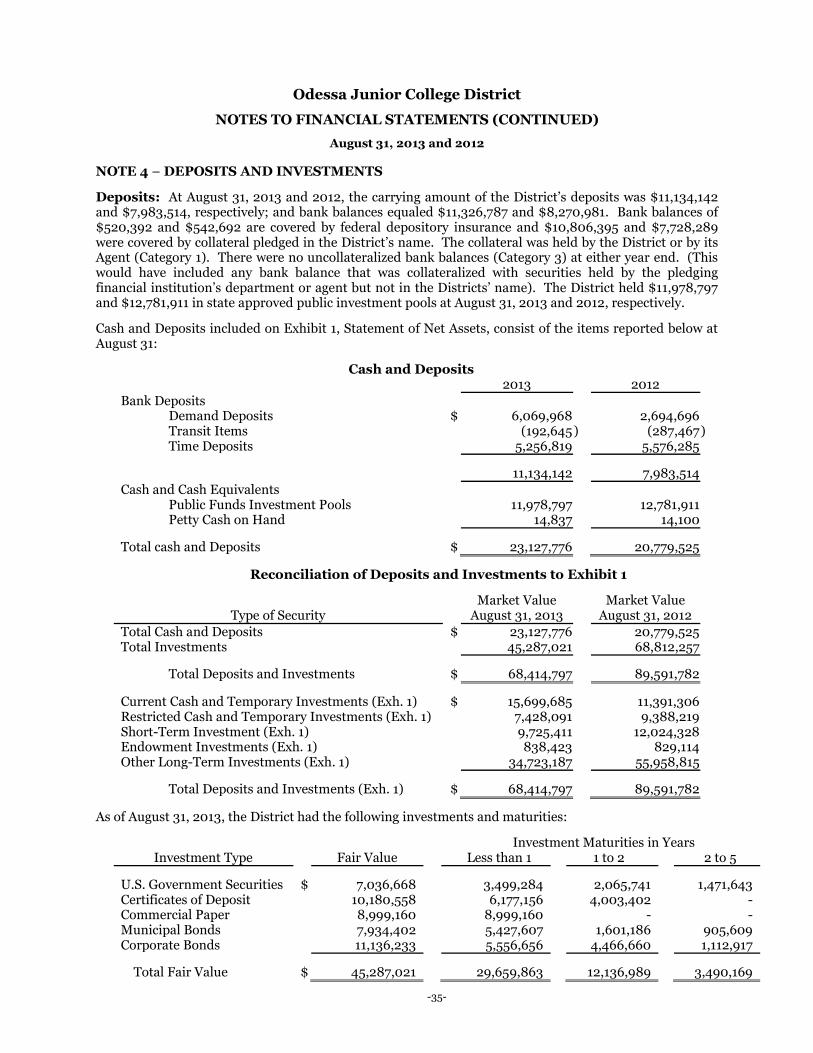
August 31, 2013 and 2012 NOTE 4 – DEPOSITS AND INVESTMENTS Deposits: At August 31, 2013 and 2012, the carrying amount of the District’s deposits was $11,134,142 and $7,983,514, respectively; and bank balances equaled $11,326,787 and $8,270,981. Bank balances of $520,392 and $542,692 are covered by federal depository insurance and $10,806,395 and $7,728,289 were covered by collateral pledged in the District’s name. The collateral was held by the District or by its Agent (Category 1). There were no uncollateralized bank balances (Category 3) at either year end. (This would have included any bank balance that was collateralized with securities held by the pledging financial institution’s department or agent but not in the Districts’ name). The District held $11,978,797 and $12,781,911 in state approved public investment pools at August 31, 2013 and 2012, respectively.
Cash and Deposits included on Exhibit 1, Statement of Net Assets, consist of the items reported below at August 31:
Cash and Deposits
2013 2012 Bank Deposits Demand Deposits $ 6,069,968 2,694,696 Transit Items (192,645 ) (287,467 ) Time Deposits 5,256,819 5,576,285 11,134,142 7,983,514 Cash and Cash Equivalents Public Funds Investment Pools 11,978,797 12,781,911 Petty Cash on Hand 14,837 14,100 Total cash and Deposits $ 23,127,776 20,779,525
Reconciliation of Deposits and Investments to Exhibit 1
Type of Security Market Value
August 31, 2013 Market Value
August 31, 2012
Total Cash and Deposits $ 23,127,776 20,779,525 Total Investments 45,287,021 68,812,257 Total Deposits and Investments $ 68,414,797 89,591,782 Current Cash and Temporary Investments (Exh. 1) $ 15,699,685 11,391,306 Restricted Cash and Temporary Investments (Exh. 1) 7,428,091 9,388,219 Short-Term Investment (Exh. 1) 9,725,411 12,024,328 Endowment Investments (Exh. 1) 838,423 829,114 Other Long-Term Investments (Exh. 1) 34,723,187 55,958,815 Total Deposits and Investments (Exh. 1) $ 68,414,797 89,591,782
As of August 31, 2013, the District had the following investments and maturities:
Investment Maturities in Years Investment Type Fair Value Less than 1 1 to 2 2 to 5
U.S. Government Securities $ 7,036,668 3,499,284 2,065,741 1,471,643 Certificates of Deposit 10,180,558 6,177,156 4,003,402 - Commercial Paper 8,999,160 8,999,160 - - Municipal Bonds 7,934,402 5,427,607 1,601,186 905,609 Corporate Bonds 11,136,233 5,556,656 4,466,660 1,112,917 Total Fair Value $ 45,287,021 29,659,863 12,136,989 3,490,169
-35-
Odessa Junior College District
NOTES TO FINANCIAL STATEMENTS (CONTINUED)
August 31, 2013 and 2012 NOTE 4 – DEPOSITS AND INVESTMENTS (CONTINUED)
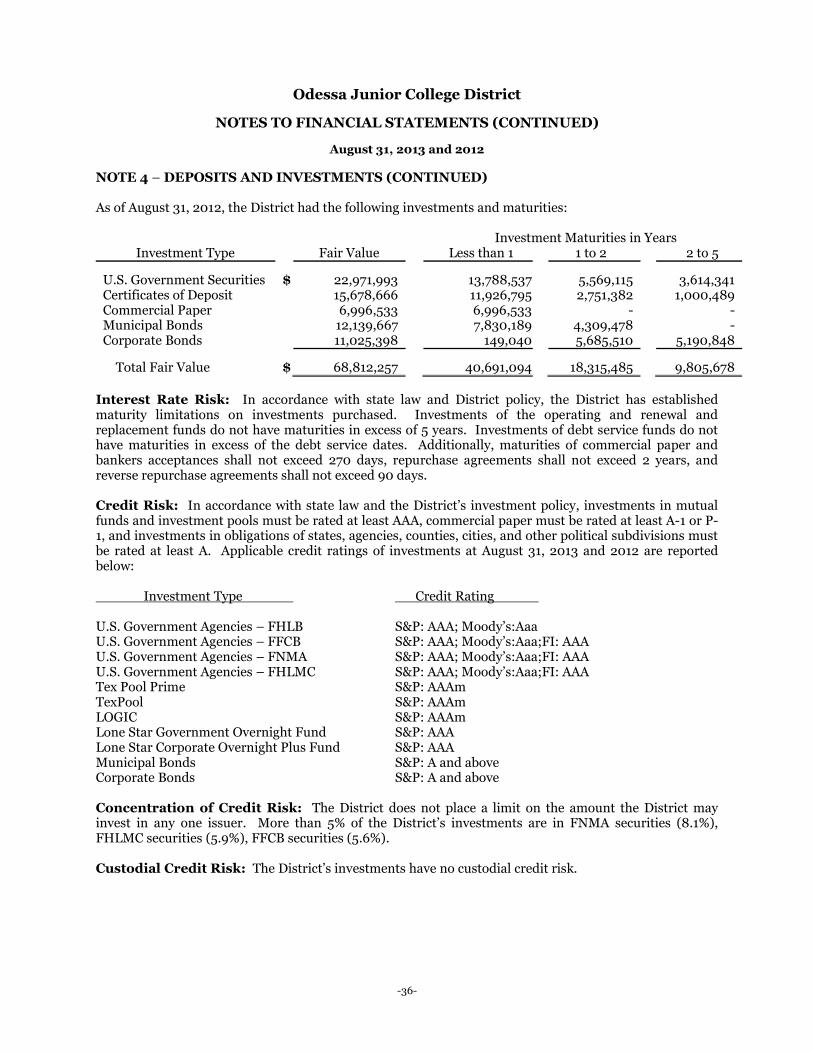
As of August 31, 2012, the District had the following investments and maturities:
Investment Maturities in Years Investment Type Fair Value Less than 1 1 to 2 2 to 5
U.S. Government Securities $ 22,971,993 13,788,537 5,569,115 3,614,341 Certificates of Deposit 15,678,666 11,926,795 2,751,382 1,000,489 Commercial Paper 6,996,533 6,996,533 - - Municipal Bonds 12,139,667 7,830,189 4,309,478 - Corporate Bonds 11,025,398 149,040 5,685,510 5,190,848 Total Fair Value $ 68,812,257 40,691,094 18,315,485 9,805,678
Interest Rate Risk: In accordance with state law and District policy, the District has established maturity limitations on investments purchased. Investments of the operating and renewal and replacement funds do not have maturities in excess of 5 years. Investments of debt service funds do not have maturities in excess of the debt service dates. Additionally, maturities of commercial paper and bankers acceptances shall not exceed 270 days, repurchase agreements shall not exceed 2 years, and reverse repurchase agreements shall not exceed 90 days.
Credit Risk: In accordance with state law and the District’s investment policy, investments in mutual funds and investment pools must be rated at least AAA, commercial paper must be rated at least A-1 or P-1, and investments in obligations of states, agencies, counties, cities, and other political subdivisions must be rated at least A. Applicable credit ratings of investments at August 31, 2013 and 2012 are reported below: Investment Type Credit Rating U.S. Government Agencies – FHLB S&P: AAA; Moody’s:Aaa U.S. Government Agencies – FFCB S&P: AAA; Moody’s:Aaa;FI: AAA U.S. Government Agencies – FNMA S&P: AAA; Moody’s:Aaa;FI: AAA U.S. Government Agencies – FHLMC S&P: AAA; Moody’s:Aaa;FI: AAA Tex Pool Prime S&P: AAAm TexPool S&P: AAAm LOGIC S&P: AAAm Lone Star Government Overnight Fund S&P: AAA Lone Star Corporate Overnight Plus Fund S&P: AAA Municipal Bonds S&P: A and above Corporate Bonds S&P: A and above Concentration of Credit Risk: The District does not place a limit on the amount the District may invest in any one issuer. More than 5% of the District’s investments are in FNMA securities (8.1%), FHLMC securities (5.9%), FFCB securities (5.6%). Custodial Credit Risk: The District’s investments have no custodial credit risk.
-36-
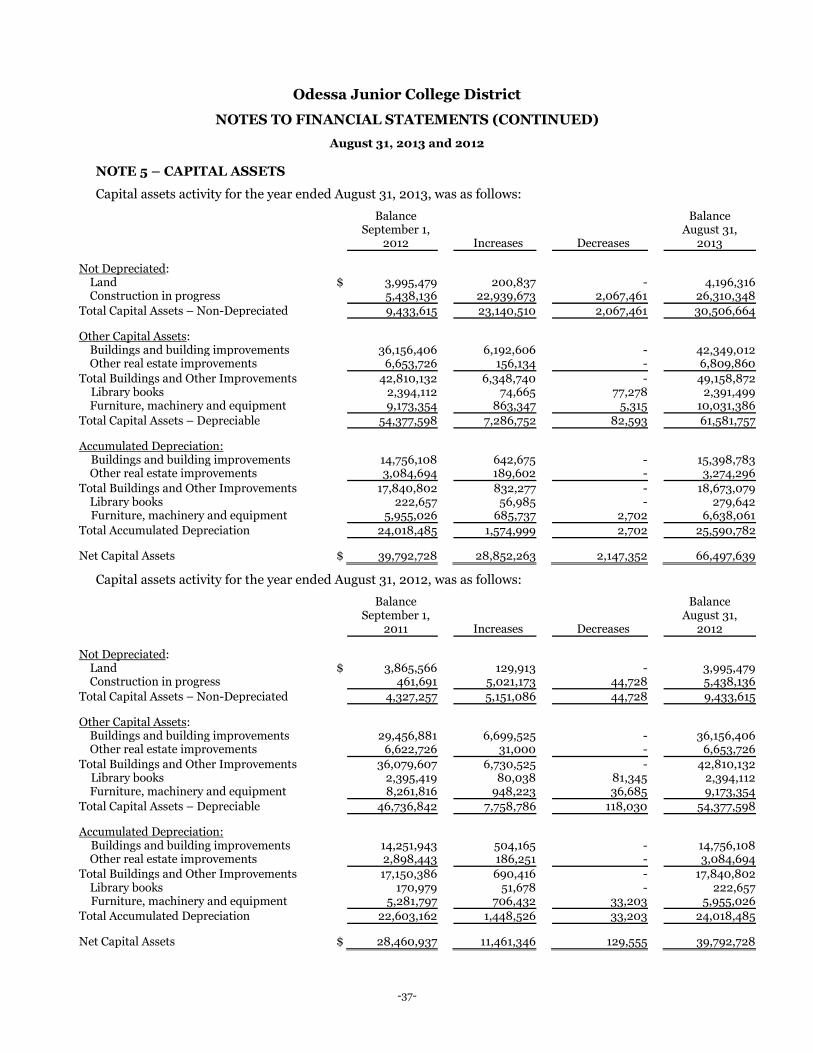
Odessa Junior College District
NOTES TO FINANCIAL STATEMENTS (CONTINUED)
August 31, 2013 and 2012 NOTE 5 – CAPITAL ASSETS
Capital assets activity for the year ended August 31, 2013, was as follows:
Balance September 1,
2012
Increases
Decreases
Balance August 31,
2013
Not Depreciated:
Land $ 3,995,479 200,837 - 4,196,316 Construction in progress 5,438,136 22,939,673 2,067,461 26,310,348
Total Capital Assets – Non-Depreciated 9,433,615 23,140,510 2,067,461 30,506,664 Other Capital Assets:
Buildings and building improvements 36,156,406 6,192,606 - 42,349,012 Other real estate improvements 6,653,726 156,134 - 6,809,860
Total Buildings and Other Improvements 42,810,132 6,348,740 - 49,158,872 Library books 2,394,112 74,665 77,278 2,391,499 Furniture, machinery and equipment 9,173,354 863,347 5,315 10,031,386 Total Capital Assets – Depreciable 54,377,598 7,286,752 82,593 61,581,757 Accumulated Depreciation: Buildings and building improvements 14,756,108 642,675 - 15,398,783 Other real estate improvements 3,084,694 189,602 - 3,274,296 Total Buildings and Other Improvements 17,840,802 832,277 - 18,673,079 Library books 222,657 56,985 - 279,642 Furniture, machinery and equipment 5,955,026 685,737 2,702 6,638,061 Total Accumulated Depreciation 24,018,485 1,574,999 2,702 25,590,782 Net Capital Assets $ 39,792,728 28,852,263 2,147,352 66,497,639
Capital assets activity for the year ended August 31, 2012, was as follows:
Balance September 1,
2011
Increases
Decreases
Balance August 31,
2012
Not Depreciated:
Land $ 3,865,566 129,913 - 3,995,479 Construction in progress 461,691 5,021,173 44,728 5,438,136
Total Capital Assets – Non-Depreciated 4,327,257 5,151,086 44,728 9,433,615 Other Capital Assets:
Buildings and building improvements 29,456,881 6,699,525 - 36,156,406 Other real estate improvements 6,622,726 31,000 - 6,653,726
Total Buildings and Other Improvements 36,079,607 6,730,525 - 42,810,132 Library books 2,395,419 80,038 81,345 2,394,112 Furniture, machinery and equipment 8,261,816 948,223 36,685 9,173,354 Total Capital Assets – Depreciable 46,736,842 7,758,786 118,030 54,377,598 Accumulated Depreciation: Buildings and building improvements 14,251,943 504,165 - 14,756,108 Other real estate improvements 2,898,443 186,251 - 3,084,694 Total Buildings and Other Improvements 17,150,386 690,416 - 17,840,802 Library books 170,979 51,678 - 222,657 Furniture, machinery and equipment 5,281,797 706,432 33,203 5,955,026 Total Accumulated Depreciation 22,603,162 1,448,526 33,203 24,018,485 Net Capital Assets $ 28,460,937 11,461,346 129,555 39,792,728
-37-
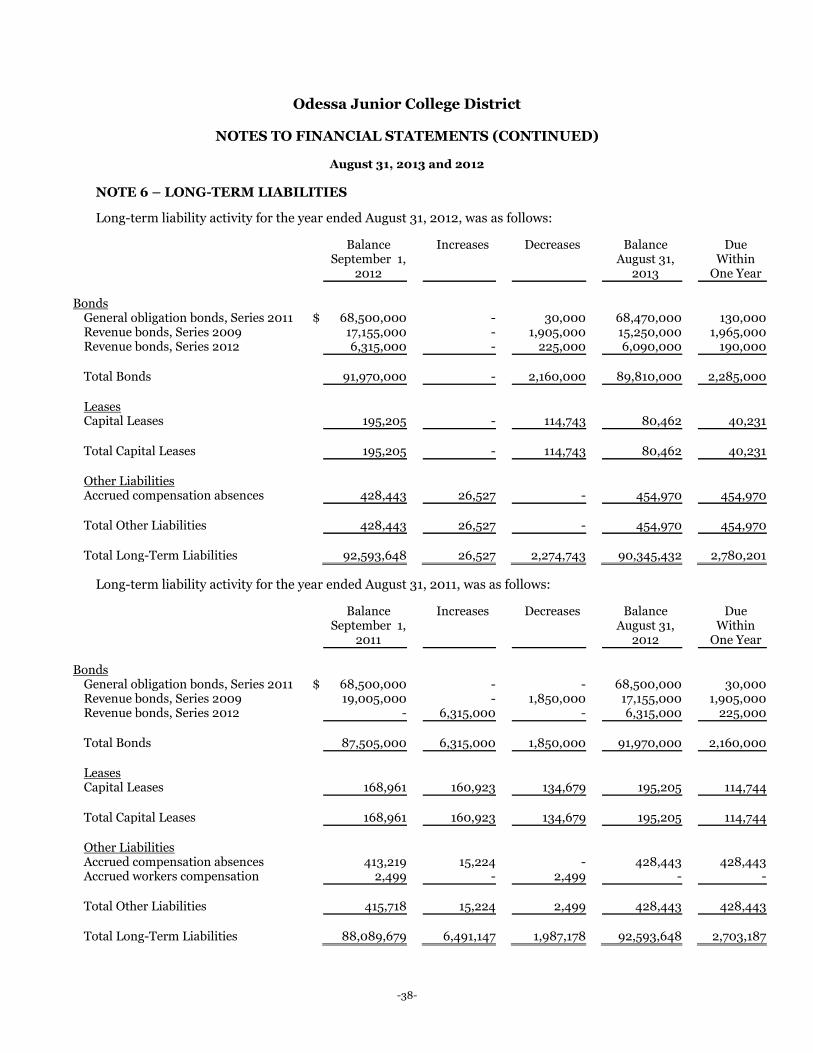
Odessa Junior College District
NOTES TO FINANCIAL STATEMENTS (CONTINUED)
August 31, 2013 and 2012
NOTE 6 – LONG-TERM LIABILITIES Long-term liability activity for the year ended August 31, 2012, was as follows:
Balance September 1,
2012
Increases Decreases Balance August 31,
2013
Due Within
One Year
Bonds
General obligation bonds, Series 2011 $ 68,500,000 - 30,000 68,470,000 130,000 Revenue bonds, Series 2009 17,155,000 - 1,905,000 15,250,000 1,965,000 Revenue bonds, Series 2012 6,315,000 - 225,000 6,090,000 190,000 Total Bonds 91,970,000 - 2,160,000 89,810,000 2,285,000 Leases Capital Leases 195,205 - 114,743 80,462 40,231 Total Capital Leases 195,205 - 114,743 80,462 40,231 Other Liabilities Accrued compensation absences 428,443 26,527 - 454,970 454,970 Total Other Liabilities 428,443 26,527 - 454,970 454,970 Total Long-Term Liabilities 92,593,648 26,527 2,274,743 90,345,432 2,780,201
Long-term liability activity for the year ended August 31, 2011, was as follows:
Balance September 1,
2011
Increases Decreases Balance August 31,
2012
Due Within
One Year
Bonds
General obligation bonds, Series 2011 $ 68,500,000 - - 68,500,000 30,000 Revenue bonds, Series 2009 19,005,000 - 1,850,000 17,155,000 1,905,000 Revenue bonds, Series 2012 - 6,315,000 - 6,315,000 225,000 Total Bonds 87,505,000 6,315,000 1,850,000 91,970,000 2,160,000 Leases Capital Leases 168,961 160,923 134,679 195,205 114,744 Total Capital Leases 168,961 160,923 134,679 195,205 114,744 Other Liabilities Accrued compensation absences 413,219 15,224 - 428,443 428,443 Accrued workers compensation 2,499 - 2,499 - - Total Other Liabilities 415,718 15,224 2,499 428,443 428,443 Total Long-Term Liabilities 88,089,679 6,491,147 1,987,178 92,593,648 2,703,187
-38-
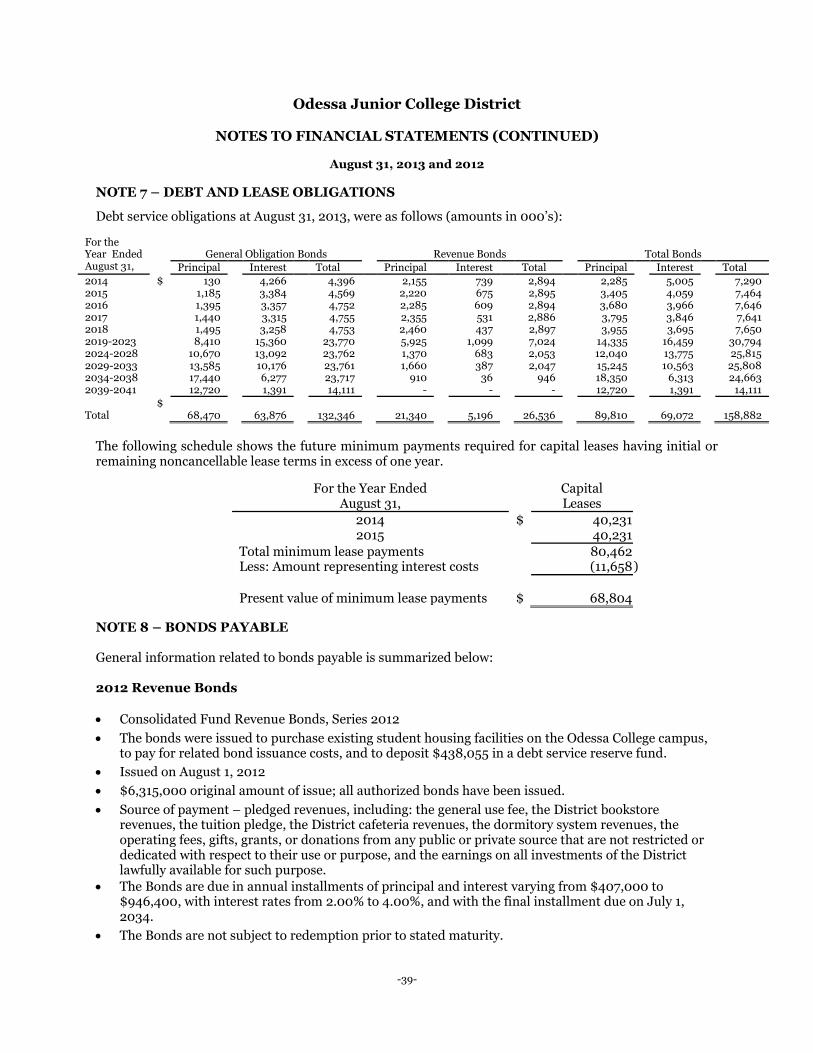
Odessa Junior College District
NOTES TO FINANCIAL STATEMENTS (CONTINUED)
August 31, 2013 and 2012 NOTE 7 – DEBT AND LEASE OBLIGATIONS
Debt service obligations at August 31, 2013, were as follows (amounts in 000’s):
For the Year Ended August 31,
General Obligation Bonds
Revenue Bonds
Total Bonds
Principal Interest Total Principal Interest Total Principal Interest Total 2014 $ 130 4,266 4,396 2,155 739 2,894 2,285 5,005 7,290 2015 1,185 3,384 4,569 2,220 675 2,895 3,405 4,059 7,464 2016 1,395 3,357 4,752 2,285 609 2,894 3,680 3,966 7,646 2017 1,440 3,315 4,755 2,355 531 2,886 3,795 3,846 7,641 2018 1,495 3,258 4,753 2,460 437 2,897 3,955 3,695 7,650 2019-2023 8,410 15,360 23,770 5,925 1,099 7,024 14,335 16,459 30,794 2024-2028 10,670 13,092 23,762 1,370 683 2,053 12,040 13,775 25,815 2029-2033 13,585 10,176 23,761 1,660 387 2,047 15,245 10,563 25,808 2034-2038 17,440 6,277 23,717 910 36 946 18,350 6,313 24,663 2039-2041 12,720 1,391 14,111 - - - 12,720 1,391 14,111 $ Total 68,470 63,876 132,346 21,340 5,196 26,536 89,810 69,072 158,882
The following schedule shows the future minimum payments required for capital leases having initial or remaining noncancellable lease terms in excess of one year.
For the Year Ended August 31,
Capital Leases
2014 $ 40,231 2015 40,231
Total minimum lease payments 80,462 Less: Amount representing interest costs (11,658 ) Present value of minimum lease payments $ 68,804
NOTE 8 – BONDS PAYABLE General information related to bonds payable is summarized below: 2012 Revenue Bonds x Consolidated Fund Revenue Bonds, Series 2012 x The bonds were issued to purchase existing student housing facilities on the Odessa College campus,
to pay for related bond issuance costs, and to deposit $438,055 in a debt service reserve fund. x Issued on August 1, 2012 x $6,315,000 original amount of issue; all authorized bonds have been issued. x Source of payment – pledged revenues, including: the general use fee, the District bookstore
revenues, the tuition pledge, the District cafeteria revenues, the dormitory system revenues, the operating fees, gifts, grants, or donations from any public or private source that are not restricted or dedicated with respect to their use or purpose, and the earnings on all investments of the District lawfully available for such purpose.
x The Bonds are due in annual installments of principal and interest varying from $407,000 to $946,400, with interest rates from 2.00% to 4.00%, and with the final installment due on July 1, 2034.
x The Bonds are not subject to redemption prior to stated maturity.
-39-

Odessa Junior College District
NOTES TO FINANCIAL STATEMENTS (CONTINUED)
August 31, 2013 and 2012 NOTE 8 – BONDS PAYABLE (CONTINUED) 2011 General Obligation Bonds x Limited Tax Bonds, Series 2011 x The bonds were issued for the acquisition, construction, renovation and equipment of school
buildings in the District and to pay for related bond issuance. x Issued on April 21, 2011. x $68,500,000 original amount of issue; all authorized bonds have been issued. x Source of payment – property tax revenues; no bond reserve fund is required. x The Bonds are due in annual installments of principal and interest varying from $4,226,081 to
$4,755,494, with interest rates from 1.65% to 5.25%, and with the final installment due on August 15, 2041.
x The Bonds are subject to optional redemption on or after August 15, 2021. 2009 Revenue Bonds x Consolidated Fund Revenue Refunding Bonds, Series 2009 x The bonds were issued to refund the outstanding obligations of the Series 1998-A Bonds, to pay for
related bond issuance costs, and to deposit $2,491,009 in a debt service reserve fund. x Issued on July 15, 2009. x $22,720,000 original amount of issue; all authorized bonds have been issued. x Source of payment – pledged revenues, including: the general use fee, the District bookstore
revenues, the tuition pledge, the District cafeteria revenues, the dormitory system revenues, the operating fees, gifts, grants, or donations from any public or private source that are not restricted or dedicated with respect to their use or purpose, and the earnings on all investments of the District lawfully available for such purpose.
x The Bonds are due in annual installments of principal and interest varying from $2,478,600 to $2,570,029, with interest rates from 3.00% to 4.00%, and with the final installment due on December 1, 2019.
x The Bonds are not subject to redemption prior to stated maturity. A Summary of bond principal is as follows:
Balance
Sept. 1, 2012
Issued
Retired Balance
Aug. 31, 2013 Series 2009 Bonds $ 17,155,000 - 1,905,000 15,250,000 Series 2011 Bonds 68,500,000 - 30,000 68,470,000 Series 2012 Bonds 6,315,000 - 225,000 6,090,000
Total Bonds $ 91,970,000 - 2,160,000 89,810,000 At August 31, 2013, there were no defeased bonds outstanding.
-40-
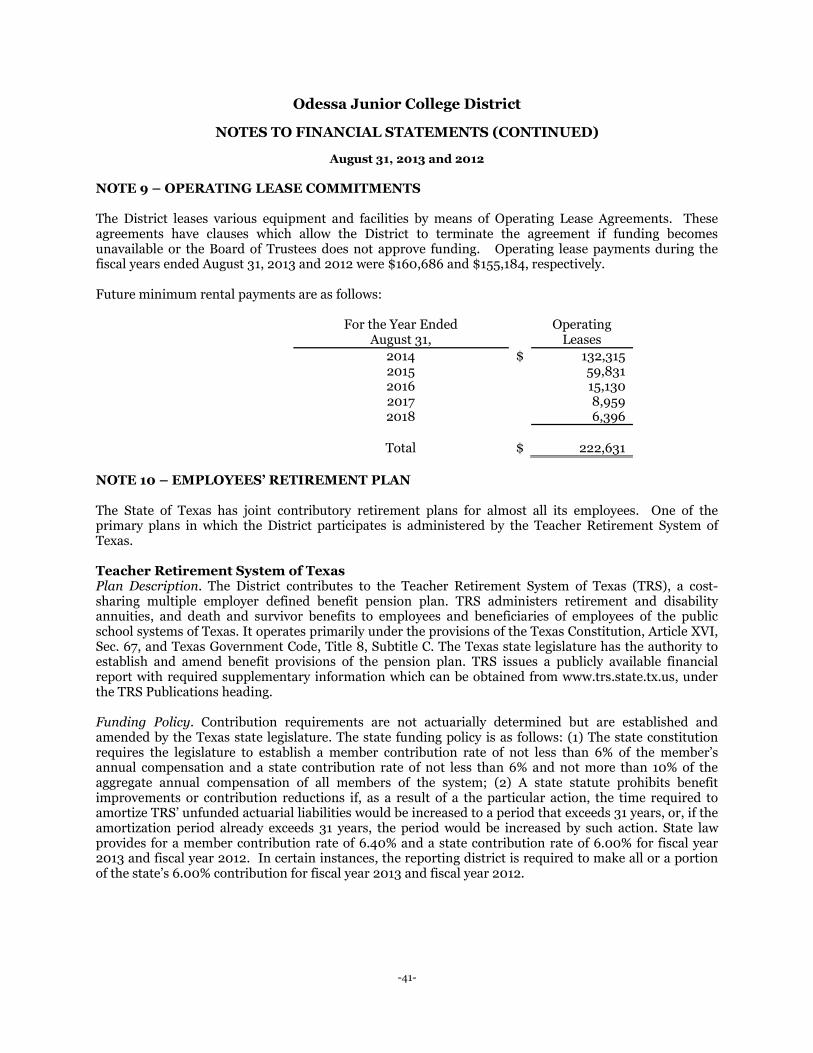
Odessa Junior College District
NOTES TO FINANCIAL STATEMENTS (CONTINUED)
August 31, 2013 and 2012
NOTE 9 – OPERATING LEASE COMMITMENTS The District leases various equipment and facilities by means of Operating Lease Agreements. These agreements have clauses which allow the District to terminate the agreement if funding becomes unavailable or the Board of Trustees does not approve funding. Operating lease payments during the fiscal years ended August 31, 2013 and 2012 were $160,686 and $155,184, respectively. Future minimum rental payments are as follows:
For the Year Ended August 31,
Operating Leases
2014 $ 132,315 2015 59,831 2016 15,130 2017 8,959 2018 6,396
Total $ 222,631
NOTE 10 – EMPLOYEES’ RETIREMENT PLAN The State of Texas has joint contributory retirement plans for almost all its employees. One of the primary plans in which the District participates is administered by the Teacher Retirement System of Texas. Teacher Retirement System of Texas Plan Description. The District contributes to the Teacher Retirement System of Texas (TRS), a cost-sharing multiple employer defined benefit pension plan. TRS administers retirement and disability annuities, and death and survivor benefits to employees and beneficiaries of employees of the public school systems of Texas. It operates primarily under the provisions of the Texas Constitution, Article XVI, Sec. 67, and Texas Government Code, Title 8, Subtitle C. The Texas state legislature has the authority to establish and amend benefit provisions of the pension plan. TRS issues a publicly available financial report with required supplementary information which can be obtained from www.trs.state.tx.us, under the TRS Publications heading. Funding Policy. Contribution requirements are not actuarially determined but are established and amended by the Texas state legislature. The state funding policy is as follows: (1) The state constitution requires the legislature to establish a member contribution rate of not less than 6% of the member’s annual compensation and a state contribution rate of not less than 6% and not more than 10% of the aggregate annual compensation of all members of the system; (2) A state statute prohibits benefit improvements or contribution reductions if, as a result of a the particular action, the time required to amortize TRS’ unfunded actuarial liabilities would be increased to a period that exceeds 31 years, or, if the amortization period already exceeds 31 years, the period would be increased by such action. State law provides for a member contribution rate of 6.40% and a state contribution rate of 6.00% for fiscal year 2013 and fiscal year 2012. In certain instances, the reporting district is required to make all or a portion of the state’s 6.00% contribution for fiscal year 2013 and fiscal year 2012.
-41-
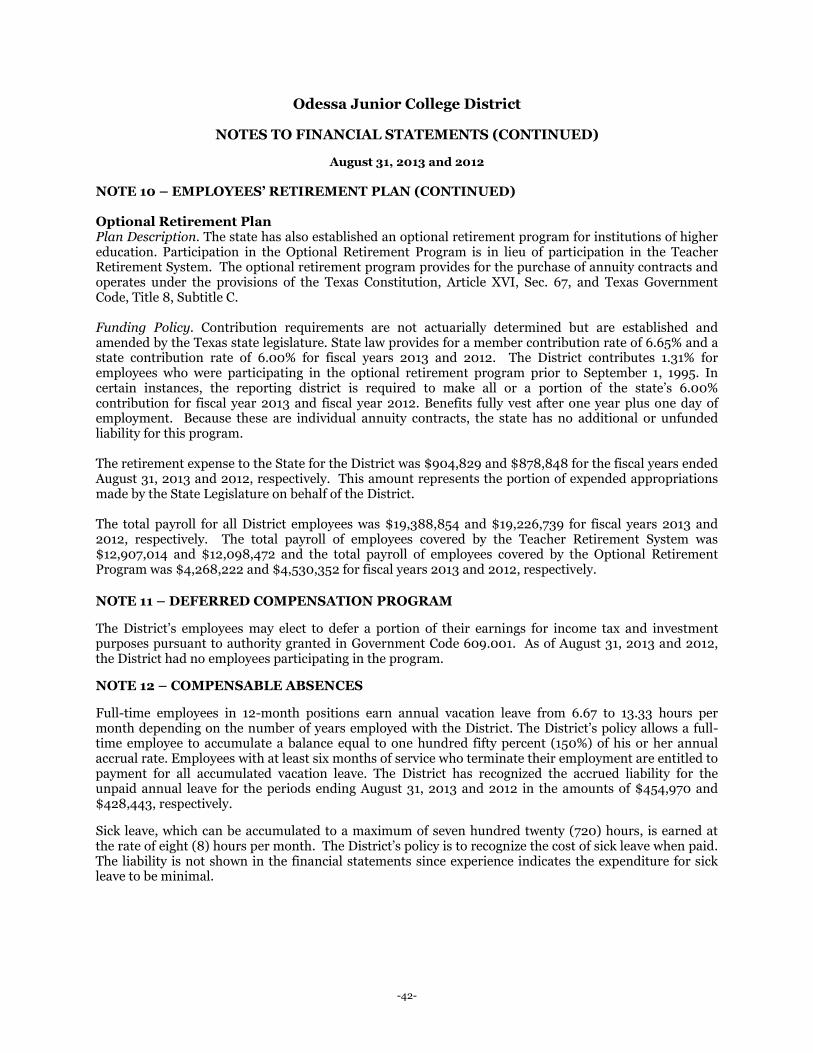
Odessa Junior College District
NOTES TO FINANCIAL STATEMENTS (CONTINUED)
August 31, 2013 and 2012 NOTE 10 – EMPLOYEES’ RETIREMENT PLAN (CONTINUED) Optional Retirement Plan Plan Description. The state has also established an optional retirement program for institutions of higher education. Participation in the Optional Retirement Program is in lieu of participation in the Teacher Retirement System. The optional retirement program provides for the purchase of annuity contracts and operates under the provisions of the Texas Constitution, Article XVI, Sec. 67, and Texas Government Code, Title 8, Subtitle C. Funding Policy. Contribution requirements are not actuarially determined but are established and amended by the Texas state legislature. State law provides for a member contribution rate of 6.65% and a state contribution rate of 6.00% for fiscal years 2013 and 2012. The District contributes 1.31% for employees who were participating in the optional retirement program prior to September 1, 1995. In certain instances, the reporting district is required to make all or a portion of the state’s 6.00% contribution for fiscal year 2013 and fiscal year 2012. Benefits fully vest after one year plus one day of employment. Because these are individual annuity contracts, the state has no additional or unfunded liability for this program. The retirement expense to the State for the District was $904,829 and $878,848 for the fiscal years ended August 31, 2013 and 2012, respectively. This amount represents the portion of expended appropriations made by the State Legislature on behalf of the District. The total payroll for all District employees was $19,388,854 and $19,226,739 for fiscal years 2013 and 2012, respectively. The total payroll of employees covered by the Teacher Retirement System was $12,907,014 and $12,098,472 and the total payroll of employees covered by the Optional Retirement Program was $4,268,222 and $4,530,352 for fiscal years 2013 and 2012, respectively. NOTE 11 – DEFERRED COMPENSATION PROGRAM The District’s employees may elect to defer a portion of their earnings for income tax and investment purposes pursuant to authority granted in Government Code 609.001. As of August 31, 2013 and 2012, the District had no employees participating in the program. NOTE 12 – COMPENSABLE ABSENCES Full-time employees in 12-month positions earn annual vacation leave from 6.67 to 13.33 hours per month depending on the number of years employed with the District. The District’s policy allows a full-time employee to accumulate a balance equal to one hundred fifty percent (150%) of his or her annual accrual rate. Employees with at least six months of service who terminate their employment are entitled to payment for all accumulated vacation leave. The District has recognized the accrued liability for the unpaid annual leave for the periods ending August 31, 2013 and 2012 in the amounts of $454,970 and $428,443, respectively. Sick leave, which can be accumulated to a maximum of seven hundred twenty (720) hours, is earned at the rate of eight (8) hours per month. The District’s policy is to recognize the cost of sick leave when paid. The liability is not shown in the financial statements since experience indicates the expenditure for sick leave to be minimal.
-42-
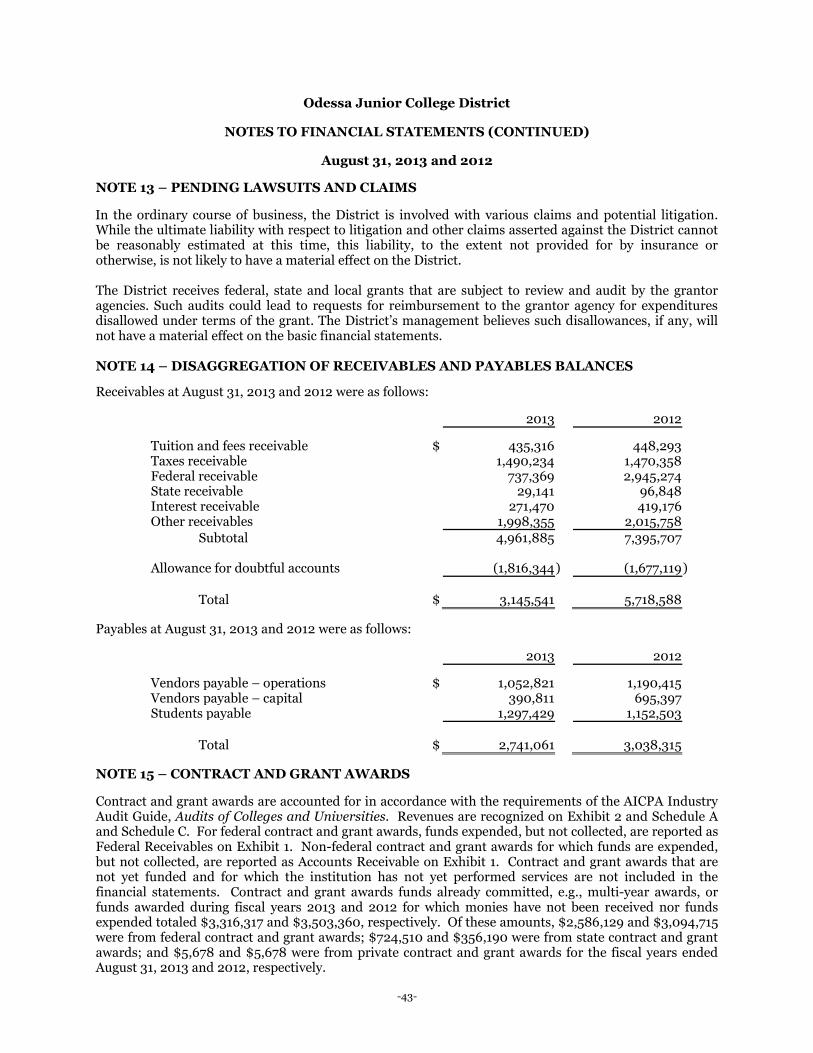
Odessa Junior College District
NOTES TO FINANCIAL STATEMENTS (CONTINUED)
August 31, 2013 and 2012 NOTE 13 – PENDING LAWSUITS AND CLAIMS In the ordinary course of business, the District is involved with various claims and potential litigation. While the ultimate liability with respect to litigation and other claims asserted against the District cannot be reasonably estimated at this time, this liability, to the extent not provided for by insurance or otherwise, is not likely to have a material effect on the District.
The District receives federal, state and local grants that are subject to review and audit by the grantor agencies. Such audits could lead to requests for reimbursement to the grantor agency for expenditures disallowed under terms of the grant. The District’s management believes such disallowances, if any, will not have a material effect on the basic financial statements. NOTE 14 – DISAGGREGATION OF RECEIVABLES AND PAYABLES BALANCES Receivables at August 31, 2013 and 2012 were as follows:
2013 2012 Tuition and fees receivable $ 435,316 448,293 Taxes receivable 1,490,234 1,470,358 Federal receivable 737,369 2,945,274 State receivable 29,141 96,848 Interest receivable 271,470 419,176 Other receivables 1,998,355 2,015,758 Subtotal 4,961,885 7,395,707 Allowance for doubtful accounts (1,816,344 ) (1,677,119 ) Total $ 3,145,541 5,718,588
Payables at August 31, 2013 and 2012 were as follows:
2013 2012 Vendors payable – operations $ 1,052,821 1,190,415 Vendors payable – capital 390,811 695,397 Students payable 1,297,429 1,152,503 Total $ 2,741,061 3,038,315
NOTE 15 – CONTRACT AND GRANT AWARDS Contract and grant awards are accounted for in accordance with the requirements of the AICPA Industry Audit Guide, Audits of Colleges and Universities. Revenues are recognized on Exhibit 2 and Schedule A and Schedule C. For federal contract and grant awards, funds expended, but not collected, are reported as Federal Receivables on Exhibit 1. Non-federal contract and grant awards for which funds are expended, but not collected, are reported as Accounts Receivable on Exhibit 1. Contract and grant awards that are not yet funded and for which the institution has not yet performed services are not included in the financial statements. Contract and grant awards funds already committed, e.g., multi-year awards, or funds awarded during fiscal years 2013 and 2012 for which monies have not been received nor funds expended totaled $3,316,317 and $3,503,360, respectively. Of these amounts, $2,586,129 and $3,094,715 were from federal contract and grant awards; $724,510 and $356,190 were from state contract and grant awards; and $5,678 and $5,678 were from private contract and grant awards for the fiscal years ended August 31, 2013 and 2012, respectively.
-43-

Odessa Junior College District
NOTES TO FINANCIAL STATEMENTS (CONTINUED)
August 31, 2013 and 2012
NOTE 16 – POST RETIREMENT, HEALTH CARE AND LIFE INSURANCE BENEFITS In addition to the pension benefits described, the state provides certain health care and life insurance benefits for retired employees. Almost all of the employees may become eligible for those benefits if they have reached the minimum age for retirement, have the required years of service, and meet applicable qualifications of TRS, Optional Retirement Program (“ORP”) and Employees Retirement System of Texas (“ERS”).
Those and similar benefits for active employees are provided through an insurance company whose premiums are based on benefits paid during the previous year. The state recognizes the cost of providing these benefits by expending the annual insurance premiums. Certain categories of employees, such as physical plant and auxiliary staff, are not eligible for state funding of health care benefits. The District uses local funds to pay the premiums for those employees. The state’s contribution was $1,184,606 and $1,123,717 for the years ended August 31, 2013 and 2012, respectively, for retired and active employees. The cost of providing health care benefits to retirees and active employees is as follows for the years ending August 31:
2013 2012 Number of retirees receiving benefits $ 171 169 Cost of state’s contribution 989,545 892,133 Cost of local contribution 81,745 81,745 Total cost of benefits for retirees 1,071,290 973,878 Number of active employees receiving benefits 330 337 Cost of state’s contribution 195,061 231,584 Cost of federal grant contribution 22,707 52,160 Cost of local contribution 2,030,324 1,887,660 Total cost of benefits for active employees $ 2,248,092 2,171,404
-44-

Odessa Junior College District
NOTES TO FINANCIAL STATEMENTS (CONTINUED)
August 31, 2013 and 2012 NOTE 17 – AD VALOREM TAX
The District’s ad valorem property tax is levied each October 1st on the assessed value listed as of the prior January 1st for all real and business personal property located in the College district.
At August 31: 2013 2012 Assessed valuation of the District (at January 1, 2013 and 2012) $ 14,112,226,708 12,709,098,669 Less: exemptions (1,938,552,413 ) (1,902,355,266 ) Less: abatements (185,363,260 ) (182,418,348 ) Net assessed valuation of the District $ 11,988,311,035 10,624,325,055
At August 31: 2013 2012 Current
Operations Debt
Service
Total Current
Operations Debt
Service
Total Authorized tax rate per $100 valuation
(Maximum per enabling legislation)
$
0.20
0.50
0.70
0.20
0.50
0.70
Assessed tax rate per $100 valuation
$
0.15120
0.03597
0.18717
0.15840
0.036686
0.19526
Taxes levied (including adjustments to the certified levies) for the years ended August 31, 2013 and 2012 were $22,438,522 and $20,745,057, respectively. Taxes are due on receipt of the tax bill and are delinquent if not paid before February 1 of the year following the year in which imposed.
At August 31: 2013 2012 Current
Operations Debt
Service
Total Current
Operations Debt
Service
Total Current taxes collected 17,728,854 4,217,609 21,946,463 16,826,000 3,821,581 20,647,581 Delinquent taxes collected
$
388,243
35,152
423,395
402,752
-
402,752
Penalties and interest collected
$
256,815
28,746
285,561
278,884
18,924
297,808
Total collections 18,373,912 4,281,507 22,655,419 17,507,636 3,840,505 21,348,141
Tax collections for the years ended August 31, 2013 and 2012 were 99.8% and 100%, respectively, of the current year adjusted tax levy. Allowances for uncollectible taxes are based upon historical experience in collecting property taxes. The use of tax proceeds is restricted to maintenance and operations.
NOTE 18 – INCOME TAXES The District is exempt from income taxes under Internal Revenue Code Section 115, Income of States, Municipalities, Etc., although unrelated business income may be subject to income taxes under Internal Revenue Code Section 511 (a)(2)(B), Imposition of Tax on Unrelated Business Income of Charitable, Etc. Organizations. The District has no unrelated business income tax liability for the years ended August 31, 2013 and 2012.
-45-
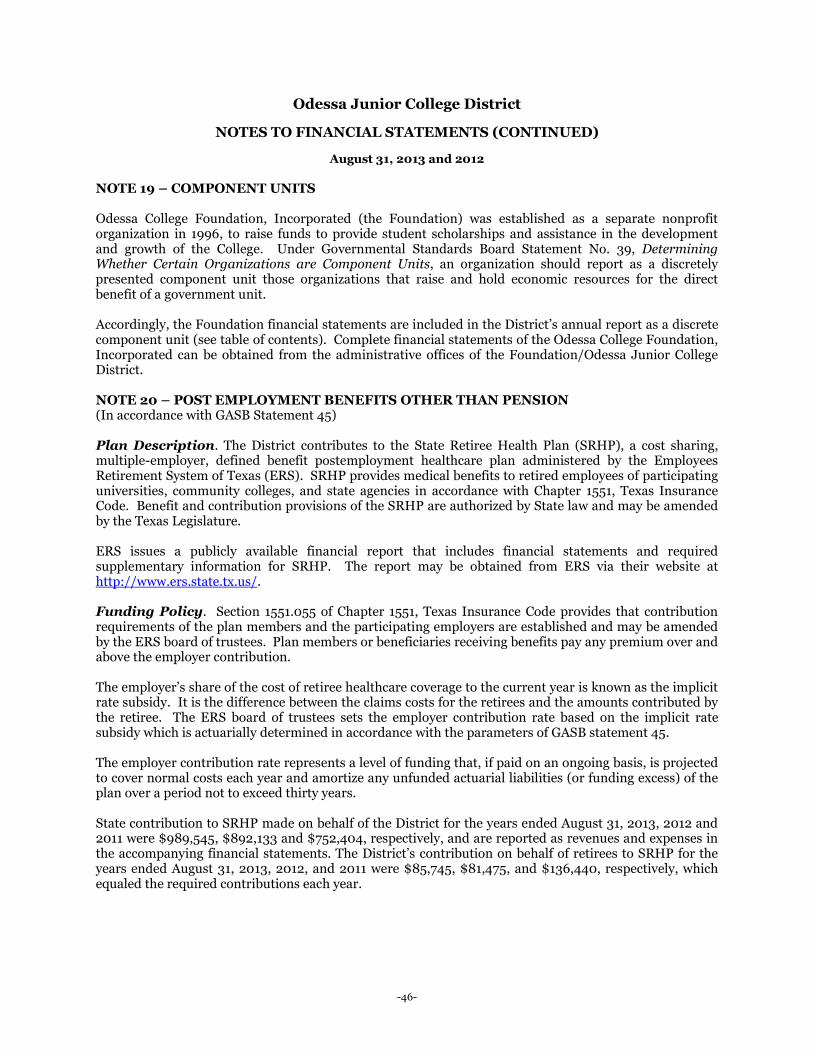
Odessa Junior College District
NOTES TO FINANCIAL STATEMENTS (CONTINUED)
August 31, 2013 and 2012
NOTE 19 – COMPONENT UNITS Odessa College Foundation, Incorporated (the Foundation) was established as a separate nonprofit organization in 1996, to raise funds to provide student scholarships and assistance in the development and growth of the College. Under Governmental Standards Board Statement No. 39, Determining Whether Certain Organizations are Component Units, an organization should report as a discretely presented component unit those organizations that raise and hold economic resources for the direct benefit of a government unit. Accordingly, the Foundation financial statements are included in the District’s annual report as a discrete component unit (see table of contents). Complete financial statements of the Odessa College Foundation, Incorporated can be obtained from the administrative offices of the Foundation/Odessa Junior College District.
NOTE 20 – POST EMPLOYMENT BENEFITS OTHER THAN PENSION (In accordance with GASB Statement 45) Plan Description. The District contributes to the State Retiree Health Plan (SRHP), a cost sharing, multiple-employer, defined benefit postemployment healthcare plan administered by the Employees Retirement System of Texas (ERS). SRHP provides medical benefits to retired employees of participating universities, community colleges, and state agencies in accordance with Chapter 1551, Texas Insurance Code. Benefit and contribution provisions of the SRHP are authorized by State law and may be amended by the Texas Legislature. ERS issues a publicly available financial report that includes financial statements and required supplementary information for SRHP. The report may be obtained from ERS via their website at http://www.ers.state.tx.us/. Funding Policy. Section 1551.055 of Chapter 1551, Texas Insurance Code provides that contribution requirements of the plan members and the participating employers are established and may be amended by the ERS board of trustees. Plan members or beneficiaries receiving benefits pay any premium over and above the employer contribution. The employer’s share of the cost of retiree healthcare coverage to the current year is known as the implicit rate subsidy. It is the difference between the claims costs for the retirees and the amounts contributed by the retiree. The ERS board of trustees sets the employer contribution rate based on the implicit rate subsidy which is actuarially determined in accordance with the parameters of GASB statement 45. The employer contribution rate represents a level of funding that, if paid on an ongoing basis, is projected to cover normal costs each year and amortize any unfunded actuarial liabilities (or funding excess) of the plan over a period not to exceed thirty years. State contribution to SRHP made on behalf of the District for the years ended August 31, 2013, 2012 and 2011 were $989,545, $892,133 and $752,404, respectively, and are reported as revenues and expenses in the accompanying financial statements. The District’s contribution on behalf of retirees to SRHP for the years ended August 31, 2013, 2012, and 2011 were $85,745, $81,475, and $136,440, respectively, which equaled the required contributions each year.
-46-

Odessa Junior College District
NOTES TO FINANCIAL STATEMENTS (CONTINUED)
August 31, 2013 and 2012
NOTE 21 – CONTINGENCY Texas Constitution article 16, section 67(b)(3) provides that the State of Texas must contribute “not less than six percent nor more than ten percent of the aggregate compensation paid to individuals participating in the system,” referring to the State’s Teacher Retirement System (TRS) including the related faculty Optional Retirement Program (ORP). During the 2011 legislative session, the Texas Legislature appropriated retirement funds for various types of educational institutions other than community and junior colleges in satisfaction of this requirement, but the community college appropriations restricted the State’s contribution to TRS/ORP on behalf of community colleges to only six percent of each district’s unrestricted general revenue appropriation for each year of the biennium state budget. There is no pending litigation concerning this issue to construe the constitutional funding requirements; or to hold that the State biennium appropriations satisfy those requirements; or to attempt to collect any shortfall contributions from any community college district. The District has calculated that as of August 31, 2012 the state’s matching contribution that has not been paid to TRS on behalf of District employees is $469,274. The District has elected to record the matching amount that has not been paid to TRS as a contingent liability and a corresponding reduction in net assets. As of August 31, 2013 the state’s matching contribution that has not been paid to TRS on behalf of District employees is $-0-. NOTE 22 – SUBSEQUENT EVENTS
Management of the District has performed an evaluation of the District’s activity through December 5, 2013, the date these financial statements were available for issuance and noted no significant event that would require recording or disclosure.
-47-

REQUIRED SUPPLEMENTAL INFORMATION

Odessa Junior College District Schedule A
SCHEDULE OF OPERATING REVENUES
Year Ended August 31, 2013 With Memorandum Totals for the Year Ended August 31, 2012
Unrestricted
Restricted
Total Educational
Activities
Auxiliary
Enterprises
2013 Total
2012 Total
Tuition: State-funded credit courses In-district resident tuition $ 3,543,377 - 3,543,377 - 3,543,377 3,361,288 Out-of-district tuition 2,219,568 - 2,219,568 - 2,219,568 2,152,501 Non-resident tuition 677,707 - 677,707 - 677,707 629,165 TPEG credit set aside* 326,837 - 326,837 - 326,837 317,208 State-funded continuing education 766,140 - 766,140 - 766,140 1,163,406 TPEG non-credit set aside* 48,923 - 48,923 - 48,923 74,017 Non-state funded educational programs 325,005 - 325,005 - 325,005 264,866 Total tuition 7,907,557 - 7,907,557 - 7,907,557 7,962,451 Fees: Student use fees 1,746,517 - 1,746,517 - 1,746,517 1,823,246 Institutional/course fees 677,373 - 677,373 - 677,373 734,845 Student/services fees - - - 87,460 87,460 91,976 Laboratory fees 187,968 - 187,968 - 187,968 145,351 Other fees 75,941 8,155 84,096 - 84,096 103,931 Total fees 2,687,799 8,155 2,695,954 87,460 2,783,414 2,899,349 Scholarship allowances and discounts: Tuition bad debt allowance (66,581 ) - (66,581 ) - (66,581 ) (118,462 ) Local remissions and exemptions (308,785 ) - (308,785 ) - (308,785 ) (720 ) State remissions and exemptions (289,769 ) - (289,769 ) - (289,769 ) (253,100 ) TPEG allowances (125,604 ) - (125,604 ) - (125,604 ) (121,591 ) Federal grants to students (1,339,936 ) - (1,339,936 ) - (1,339,936 ) (2,061,218 ) State grants to students (115,066 ) - (115,066 ) - (115,066 ) (60,448 ) Local grants to students (866,307 ) - (866,307 ) - (866,307 ) (782,871 ) Total scholarship allowances (3,112,048 ) - (3,112,048 ) - (3,112,048 ) (3,398,410 ) Total net tuition and fees 7,483,308 8,155 7,491,463 87,460 7,578,923 7,463,390 Other operating revenues: Federal grants and contracts 17,711 1,384,242 1,401,953 - 1,401,953 2,236,602 State grants and contracts - 385,248 385,248 - 385,248 493,036 Nongovernmental grants and contracts 25,000 29,942 54,942 - 54,942 61,863 Sales and services of educational activities 504,025 - 504,025 - 504,025 495,027 Investment income (program restricted) - 14,643 14,643 376 15,019 14,547 General operating revenues 593,505 49,956 643,461 - 643,461 775,000 Total other operating revenues 1,140,241 1,864,031 3,004,272 376 3,004,648 4,076,075
-48-

Odessa Junior College District Schedule A
SCHEDULE OF OPERATING REVENUES (CONTINUED)
Year Ended August 31, 2013 With Memorandum Totals for the Year Ended August 31, 2012
Unrestricted
Restricted
Total Educational
Activities
Auxiliary
Enterprises
2013 Total
2012 Total
Auxiliary enterprises: Bookstore $ - - - 205,930 205,930 206,252 Food service - - - 462,734 462,734 494,244 Student housing - - - 689,671 689,671 16,304 Other auxiliaries - - - 133,793 133,793 130,297 Total net auxiliary enterprises - - - 1,492,128 1,492,128 847,097 Total Operating Revenues $ 8,623,549 1,872,186 10,495,735 1,579,964 12,075,699 12,386,562 (Exhibit 2) (Exhibit 2) * In accordance with Education Code 56.033, $375,760 and $391,225 for years ending August 31, 2013 and 2012, respectively, of tuition was set aside for Texas
Public Education Grants (TPEG).
-49-

Odessa Junior College District Schedule B
SCHEDULE OF OPERATING EXPENSES BY OBJECT
Year Ended August 31, 2013
With Memorandum Totals for the Year Ended August 31, 2012
Staff Benefits Salary &
Wages
State
Local Other
Expenses 2013
Total 2012
Total
Unrestricted - Educational Activities Instruction $ 9,513,005 - 1,801,050 1,645,894 12,959,949 13,422,972 Public service 651,473 - 88,153 137,068 876,694 833,478 Academic support 2,204,897 - 508,177 599,629 3,312,703 3,061,808 Student services 1,815,167 - 458,063 344,065 2,617,295 2,635,185 Institutional support 2,913,937 - 979,287 2,209,807 6,103,031 5,466,032 Operation and maintenance of plant 904,203 - 253,372 2,230,826 3,388,401 3,350,556 Scholarship and fellowships - - - 495,847 495,847 655,677 Total Unrestricted Educational Activities 18,002,682 - 4,088,102 7,663,136 29,753,920 29,425,708 Restricted - Educational Activities Instruction 591,869 876,261 39,849 278,774 1,786,753 1,849,040 Public service 5,878 22,564 - 2,970 31,412 376,662 Academic support 279,927 187,953 58,540 209,848 736,268 1,075,939 Student services 25,003 170,798 - - 195,801 278,798 Institutional support 14,995 342,540 - 3,498 361,033 330,503 Operation and maintenance of plant - - - - - - Scholarship and fellowships - - - 4,217,288 4,217,288 4,580,896 Total Unrestricted Educational Activities 917,672 1,600,116 98,389 4,712,378 7,328,555 8,491,838 Total Educational Activities 18,920,354 1,600,116 4,186,491 12,375,514 37,082,475 37,917,546 Auxiliary Enterprises 468,500 - 94,085 1,309,521 1,872,106 1,674,561 Depreciation Expense – Buildings and other real estate improvements
-
-
-
832,277
832,277
690,416
Depreciation Expense – Equipment and furniture
-
-
-
742,722
742,722
758,110
$ 19,388,854 1,600,116 4,280,576 15,260,034 40,529,580 41,040,633 Total Operating Expenses (Exhibit 2) (Exhibit 2)
-50-

Odessa Junior College District Schedule C
SCHEDULE OF NON-OPERATING REVENUES AND EXPENSES
Year Ended August 31, 2013 With Memorandum Totals for the Year Ended August 31, 2012
Unrestricted
Restricted Auxiliary
Enterprises
2013 Total
2012 Total
NON-OPERATING REVENUES: State appropriations: Education and general support $ 6,925,172 - - 6,925,172 6,826,221 State group insurance - 1,184,606 - 1,184,606 1,123,717 State retirement matching - 415,510 - 415,510 409,574 Nursing shortage reduction grant - 71,561 - 71,561 67,257 Total state appropriations 6,925,172 1,671,677 - 8,596,849 8,426,769 Property taxes for maintenance and operations 18,354,130 - - 18,354,130 17,040,582 Property taxes for debt service - 4,341,081 - 4,341,081 3,935,050 Federal revenue, non-operating - 5,093,033 - 5,093,033 6,153,200 Gifts – noncapital 89,257 139,728 7,110 236,095 375,630 Investment income – not restricted to programs 324,775 - - 324,775 419,571 Other non-operating revenues 35,564 11,988 - 47,552 1,029 Total Non-Operating Revenues 25,728,898 11,257,507 7,110 36,993,515 36,351,831 NON-OPERATING EXPENSES: Interest on capital-related debt 4,882,744 - - 4,882,744 5,205,791 Loss on disposal of capital assets 79,891 - - 79,891 84,828 Other non-operating expenses 136,105 - - 136,105 125,776 Total Non-Operating Expenses 5,098,740 - - 5,098,740 5,416,395 Net Non-Operating Revenues $ 20,630,158 11,257,507 7,110 31,894,775 30,935,436 (Exhibit 2) (Exhibit 2)
-51-

Odessa Junior College District Schedule D
SCHEDULE OF NET POSITION BY SOURCE AND AVAILABILITY
Year Ended August 31, 2013 With Memorandum Totals for the Year Ended August 31, 2012
Details by Source Available for Current
Operations
Unrestricted
Restricted
Capital Assets Net of
Depreciation And
Related Debt
Total
Yes
No
Expendable
Non-
Expendable Current: Unrestricted, undesignated $ 18,499,816 - - - 18,499,816 18,499,816 - Unrestricted, board designated 29,679 - - - 29,679 - 29,679 Restricted - 706,732 - - 706,732 - 706,732 Auxiliary enterprises 11,804 - - - 11,804 11,804 - Loans 261,200 9,451 - - 270,651 - 270,651 Endowment - - 838,423 - 838,423 - 838,423 Plant: Capital projects 264,277 4,740,302 - - 5,004,579 - 5,004,579 Debt service - 3,561,993 - - 3,561,993 - 3,561,993 Investment in plant - - - 13,986,558 13,986,558 - 13,986,558 Total Net Position, August 31, 2013 19,066,776 9,018,478 838,423 13,986,558 42,910,235 18,511,620 24,398,615 (Exhibit 1) Total Net Position, August 31, 2012 17,923,699 7,605,423 829,114 12,021,942 38,380,178 17,341,567 21,038,611 (Exhibit 1) Net Increase (Decrease) in Net Position $ 1,143,077 1,413,055 9,309 1,964,616 4,530,057 1,170,053 3,360,004 (Exhibit 2)
-52-

Odessa Junior College District Schedule E
SCHEDULE OF EXPENDITURES OF FEDERAL AWARDS
Year Ended August 31, 2013
Federal Grantor/Pass Through Grantor/ Program Title
Federal CFDA
Number
Document/ Pass Through
Grantor’s Number
Pass Through Disbursement
and Expenditures
U.S. Department of Education Direct Programs: Student Financial Aid Cluster Federal Supplemental Educational Opportunity Grant (11-12)
84.007A
P007A114089
$
300
Federal Supplemental Educational Opportunity Grant (12-13)
84.007A
P007A124089
83,371
Federal Supplemental Educational Opportunity Grant (13-14)
84.007A
P007A134089
31,750
Subtotal 115,421 Federal College Work Study (12-13) 84.033A P033A124089 73,032 Federal College Work Study (13-14) 84.033A P033A134089 1,164 Subtotal 74,196 Federal Pell Grant (11-12) 84.063P P063P112294 6,651 Federal Pell Grant (12-13) 84.063P P063P122294 2,962,939 Federal Pell Grant (13-14) 84.063P P063P132294 2,008,022 Subtotal 4,977,612 Direct Student Loans 84.268 P268K132294 10,697 Title V Expanding and Improving Distance Learning in Rural Areas
84.031S
P031S100097
462,239
Pass-through from: Texas Education Agency Adult Basic Education (12-13)
84.002A
134100017110465
497,736
Pass-through from: Texas Higher Education Coordinating Board Carl Perkins Vocational Education - Basic
84.048
94235
172,433
Total U.S. Department of Education 6,310,334 U.S. Department of Agriculture Pass-through from: Texas Department of Human Services Child and Adult Care Food Program
10.558
165-0013
46,331
Total U.S. Department of Agriculture 46,331 National Science Foundation Pass-through from: University at El Paso LSAMP 47.076 HRD-0703584 8,348
Notes to Schedule on following page.
-53-
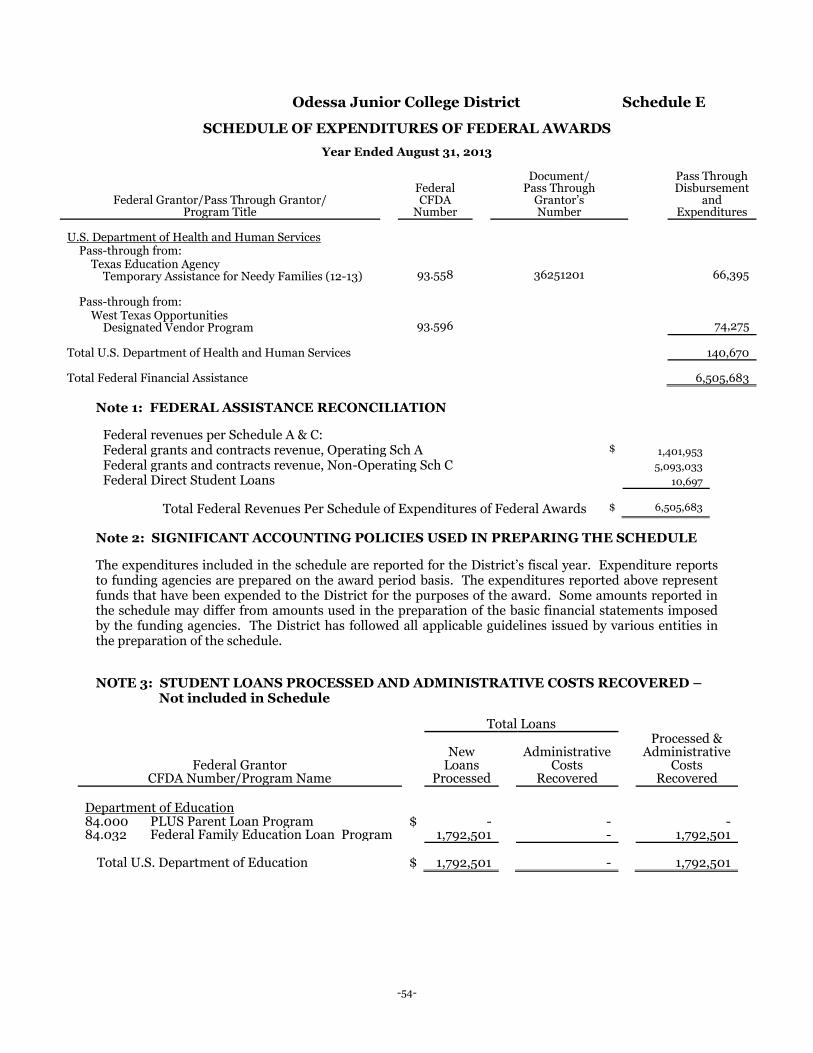
Odessa Junior College District Schedule E
SCHEDULE OF EXPENDITURES OF FEDERAL AWARDS
Year Ended August 31, 2013
Federal Grantor/Pass Through Grantor/ Program Title
Federal CFDA
Number
Document/ Pass Through
Grantor’s Number
Pass Through Disbursement
and Expenditures
U.S. Department of Health and Human Services Pass-through from: Texas Education Agency Temporary Assistance for Needy Families (12-13)
93.558
36251201
66,395
Pass-through from: West Texas Opportunities Designated Vendor Program
93.596
74,275
Total U.S. Department of Health and Human Services 140,670 Total Federal Financial Assistance 6,505,683
Note 1: FEDERAL ASSISTANCE RECONCILIATION
Federal revenues per Schedule A & C: Federal grants and contracts revenue, Operating Sch A $ 1,401,953 Federal grants and contracts revenue, Non-Operating Sch C 5,093,033 Federal Direct Student Loans 10,697 Total Federal Revenues Per Schedule of Expenditures of Federal Awards $ 6,505,683
Note 2: SIGNIFICANT ACCOUNTING POLICIES USED IN PREPARING THE SCHEDULE The expenditures included in the schedule are reported for the District’s fiscal year. Expenditure reports to funding agencies are prepared on the award period basis. The expenditures reported above represent funds that have been expended to the District for the purposes of the award. Some amounts reported in the schedule may differ from amounts used in the preparation of the basic financial statements imposed by the funding agencies. The District has followed all applicable guidelines issued by various entities in the preparation of the schedule. NOTE 3: STUDENT LOANS PROCESSED AND ADMINISTRATIVE COSTS RECOVERED – Not included in Schedule
Total Loans
Federal Grantor CFDA Number/Program Name
New
Loans Processed
Administrative
Costs Recovered
Processed & Administrative
Costs Recovered
Department of Education 84.000 PLUS Parent Loan Program $ - - - 84.032 Federal Family Education Loan Program 1,792,501 - 1,792,501 Total U.S. Department of Education $ 1,792,501 - 1,792,501
-54-

Odessa Junior College District Schedule F
SCHEDULE OF EXPENDITURES OF STATE AWARDS
Year Ended August 31, 2013
Grantor Agency/Program Title
Grant contract Number
Disbursement and
Expenditures Texas Education Agency State Adult Education (12-13) 01001201 105,602 ICA-HCDE Texas Learns 10,700 Texas Higher Education Coordinating Board Texas College Work Study (10-11) - 13,813 Texas Grant I - 160,891 TEOG - 34,430 State Top Ten % Schools - 14,000 Nursing Shortage Reduction Grant - 83,085 AVID Professional Training 05834 3,937 AVID Mentorship Tutor Program - 30,351 College Students Taking STRR Study 06401 - Texas Law Enforcement Officer Standards in Education Agency LEOSE Training Grant
-
-
Total Expenditures of State Awards $ 456,809
NOTE 1: STATE ASSISTANCE RECONCILIATION
State revenues per Exhibit 2: Operating Revenues: State grants and contracts $ 385,248 State revenues per Schedule C: Non-Operating Revenues: Nursing shortage reduction grant 71,561 Total State Revenues per Schedule of Expenditures of State Awards $ 456,809
NOTE 2: SIGNIFICANT ACCOUNTING POLICIES USED IN PREPARING THE SCHEDULE The expenditures included in the schedule are reported for the District’s fiscal year. Expenditure reports to funding agencies are prepared on the award period basis. The expenditures reported above represent funds that have been expended to the District for the purposes of the award. Some amounts reported in the schedule may differ from amounts used in the preparation of the basic financial statements imposed by the funding agencies. The District has followed all applicable guidelines issued by various entities in the preparation of the schedule.
-55-

SINGLE AUDIT REPORTS
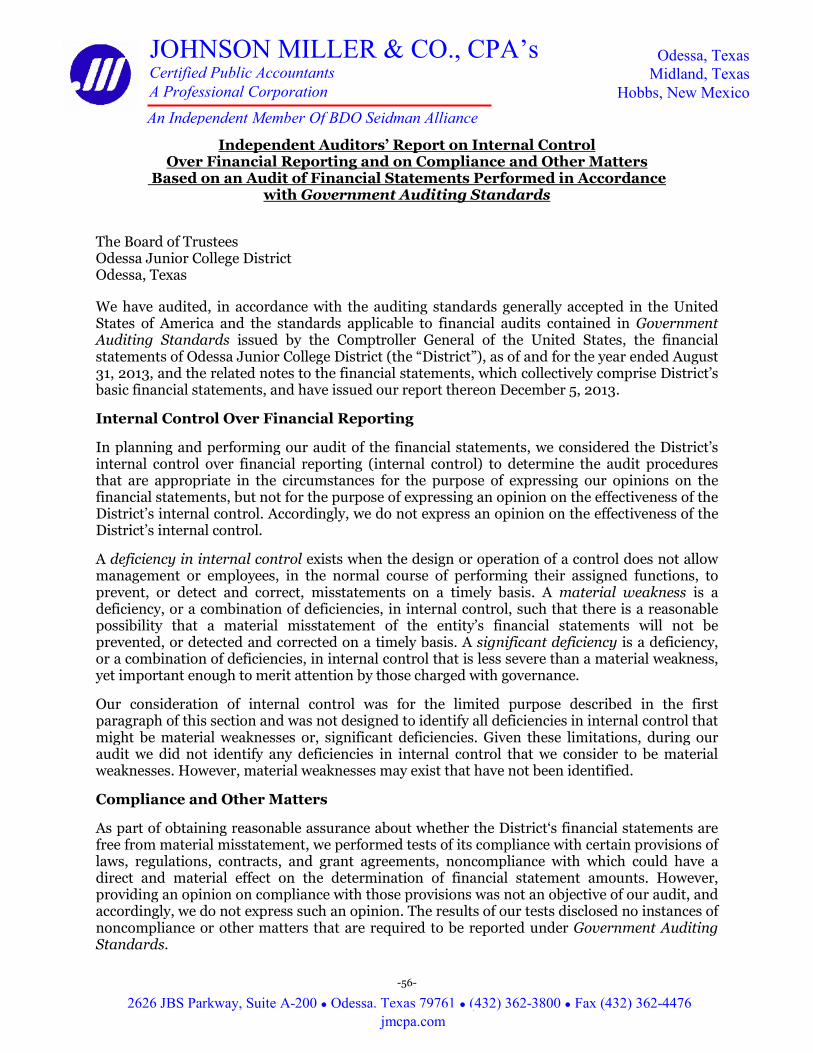
Independent Auditors’ Report on Internal Control Over Financial Reporting and on Compliance and Other Matters
Based on an Audit of Financial Statements Performed in Accordance with Government Auditing Standards
The Board of Trustees Odessa Junior College District Odessa, Texas We have audited, in accordance with the auditing standards generally accepted in the United States of America and the standards applicable to financial audits contained in Government Auditing Standards issued by the Comptroller General of the United States, the financial statements of Odessa Junior College District (the “District”), as of and for the year ended August 31, 2013, and the related notes to the financial statements, which collectively comprise District’s basic financial statements, and have issued our report thereon December 5, 2013. Internal Control Over Financial Reporting In planning and performing our audit of the financial statements, we considered the District’s internal control over financial reporting (internal control) to determine the audit procedures that are appropriate in the circumstances for the purpose of expressing our opinions on the financial statements, but not for the purpose of expressing an opinion on the effectiveness of the District’s internal control. Accordingly, we do not express an opinion on the effectiveness of the District’s internal control. A deficiency in internal control exists when the design or operation of a control does not allow management or employees, in the normal course of performing their assigned functions, to prevent, or detect and correct, misstatements on a timely basis. A material weakness is a deficiency, or a combination of deficiencies, in internal control, such that there is a reasonable possibility that a material misstatement of the entity’s financial statements will not be prevented, or detected and corrected on a timely basis. A significant deficiency is a deficiency, or a combination of deficiencies, in internal control that is less severe than a material weakness, yet important enough to merit attention by those charged with governance. Our consideration of internal control was for the limited purpose described in the first paragraph of this section and was not designed to identify all deficiencies in internal control that might be material weaknesses or, significant deficiencies. Given these limitations, during our audit we did not identify any deficiencies in internal control that we consider to be material weaknesses. However, material weaknesses may exist that have not been identified. Compliance and Other Matters As part of obtaining reasonable assurance about whether the District‘s financial statements are free from material misstatement, we performed tests of its compliance with certain provisions of laws, regulations, contracts, and grant agreements, noncompliance with which could have a direct and material effect on the determination of financial statement amounts. However, providing an opinion on compliance with those provisions was not an objective of our audit, and accordingly, we do not express such an opinion. The results of our tests disclosed no instances of noncompliance or other matters that are required to be reported under Government Auditing Standards.
-56-
JOHNSON MILLER & CO., CPA’s Certified Public Accountants
A Professional Corporation An Independent Member Of BDO Seidman Alliance
Odessa, Texas Midland, Texas
Hobbs, New Mexico
2626 JBS Parkway, Suite A-200 Ɣ Odessa, Texas 79761 Ɣ (432) 362-3800 Ɣ Fax (432) 362-4476 jmcpa.com
Compliance and Other Matters (Continued) We have performed tests designed to verify the District’s compliance with the requirements of the Public Funds Investment Act. During the year ended August 31, 2013, no instances of noncompliance were found. Purpose of this Report The purpose of this report is solely to describe the scope of our testing of internal control and compliance and the results of that testing, and not to provide an opinion on the effectiveness of the entity’s internal control or on compliance. This report is an integral part of an audit performed in accordance with Government Auditing Standards in considering the entity’s internal control and compliance. Accordingly, this communication is not suitable for any other purpose.
Odessa, Texas December 5, 2013
-57-

Independent Auditors’ Report on Compliance with Requirements That Could Have a Direct and Material Effect on Each Major Program and
on Internal Control Over Compliance in Accordance with OMB Circular A-133
The Board of Trustees Odessa Junior College District Odessa, Texas Report on Compliance for Each Major Federal Program We have audited Odessa Junior College District’s (the “District”) compliance with the types of compliance requirements described in the OMB Circular A-133 Compliance Supplement that could have a direct and material effect on each of the District’s major federal programs for the year ended August 31, 2013. The District’s major federal programs are identified in the summary of auditor’s results section of the accompanying schedule of findings and questioned costs. Management’s Responsibility Management is responsible for compliance with the requirements of laws, regulations, contracts, and grants applicable to its federal programs. Auditors’ Responsibility Our responsibility is to express an opinion on compliance for each of the District’s major federal programs based on our audit of the types of compliance requirements referred to above. We conducted our audit of compliance in accordance with auditing standards generally accepted in the United States of America; the standards applicable to financial audits contained in Government Auditing Standards, issued by the Comptroller General of the United States; and OMB Circular A-133, Audits of States, Local Governments, and Non-Profit Organizations. Those standards and OMB Circular A-133 require that we plan and perform the audit to obtain reasonable assurance about whether noncompliance with the types of compliance requirements referred to above that could have a direct and material effect on a major federal program occurred. An audit includes examining, on a test basis, evidence about District’s compliance with those requirements and performing such other procedures as we considered necessary in the circumstances. We believe that our audit provides a reasonable basis for our opinion on compliance for each major federal program. However, our audit does not provide a legal determination of the District’s compliance.
-58-
JOHNSON MILLER & CO., CPA’s Certified Public Accountants
A Professional Corporation An Independent Member Of BDO Seidman Alliance
Odessa, Texas Midland, Texas
Hobbs, New Mexico
2626 JBS Parkway, Suite A-200 Ɣ Odessa, Texas 79761 Ɣ (432) 362-3800 Ɣ Fax (432) 362-4476 jmcpa.com

Opinion on Each Major Federal Program In our opinion, the District complied, in all material respects, with the types of compliance requirements referred to above that could have a direct and material effect on each of its major federal programs for the year ended August 31, 2013. Report on Internal Control Over Compliance Management of the District is responsible for establishing and maintaining effective internal control over compliance with the types of compliance requirements referred to above. In planning and performing our audit of compliance, we considered the District’s internal control over compliance with the types of requirements that could have a direct and material effect on each major federal program to determine the auditing procedures that are appropriate in the circumstances for the purpose of expressing an opinion on compliance for each major federal program and to test and report on internal control over compliance in accordance with OMB Circular A-133, but not for the purpose of expressing an opinion on the effectiveness of internal control over compliance. Accordingly, we do not express an opinion on the effectiveness of District’s internal control over compliance. A deficiency in internal control over compliance exists when the design or operation of a control over compliance does not allow management or employees, in the normal course of performing their assigned functions, to prevent, or detect and correct, noncompliance with a type of compliance requirement of a federal or a state program on a timely basis. A material weakness in internal control over compliance is a deficiency, or combination of deficiencies, in internal control over compliance, such that there is a reasonable possibility that material noncompliance with a type of compliance requirement of a federal or state program will not be prevented, or detected and corrected, on a timely basis. A significant deficiency in internal control over compliance is a deficiency, or a combination of deficiencies, in internal control over compliance with a type of compliance requirement of a federal or a state program that is less severe than a material weakness in internal control over compliance, yet important enough to merit attention by those charged with governance. Our consideration of internal control over compliance was for the limited purpose described in the first paragraph of this section and was not designed to identify all deficiencies in internal control over compliance that might be material weaknesses or significant deficiencies. We did not identify any deficiencies in internal control over compliance that we consider to be material weaknesses. However, material weaknesses may exist that have not been identified. The purpose of this report on internal control over compliance is solely to describe the scope of our testing of internal control over compliance and the results of that testing based on the requirements of OMB Circular A-133. Accordingly, this report is not suitable for any other purpose.
Odessa, Texas December 5, 2013
-59-

Odessa Junior College District
SCHEDULE OF FINDINGS AND QUESTIONED COSTS
August 31, 2013 The Board of Trustees Odessa Junior College District Odessa, Texas
SECTION I - SUMMARY OF AUDITOR’S RESULTS Type of auditor’s report issued Unqualified Internal control over financial reporting: Material weaknesses identified? No Significant deficiencies identified that are not considered to be material weaknesses?
None Reported
Noncompliance material to financial statements noted? No Federal Awards Internal control over major programs: Material weaknesses identified? No Significant deficiencies identified that are not considered to be material weaknesses?
None Reported
Type of auditor’s report issued on compliance for major programs
Unqualified
Any audit findings disclosed that are required to be reported in accordance with section 510(a) of Circular A-133
No
-60-
Odessa Junior College District
SCHEDULE OF FINDINGS AND QUESTIONED COSTS (CONTINUED)
August 31, 2013 Identification of Major Programs: CFDA Numbers Name of Federal Program or Cluster 84.007A Student Financial Aid Cluster:
Federal Supplemental Education Opportunity Grant
84.033A Federal College Work Study Program 84.063P Federal Pell Grant Dollar threshold used to distinguish between type A and type B programs:
$300,000
Auditee qualified as low-risk auditee? Yes Section II – FINANCIAL STATEMENT FINDINGS
No matters were reported.
Section III – FEDERAL AWARD FINDINGS AND QUESTIONED COSTS
No matters were reported.
August 31, 2013 No matters were reported. August 31, 2012 No matters were reported.
-61-

STATISTICAL SUPPLEMENT

-62-
2013 2012 2011 2010 2009 2008 2007 2006 2005 2004
Invested in capital assets, net of related debt 13,987 12,022 9,767 8,169 4,955 (976) (3,148) (5,114) (7,115) (8,978)Restricted - expendable 9,018 7,605 4,820 4,633 4,953 5,496 6,498 6,599 6,662 8,743 Restricted - nonexpendable 838 829 807 813 774 813 838 707 672 670 Unrestricted 19,067 17,924 17,681 16,775 18,511 21,196 19,612 18,851 18,325 17,338
Total primary government net assets 42,910$ 38,380$ 33,075$ 30,390$ 29,193$ 26,529$ 23,800$ 21,043$ 18,544$ 17,773$
For the Fiscal Year Ended August 31,
(amounts expressed in thousands)
Odessa Junior College DistrictStatistical Supplement 1
Net Assets by ComponentFiscal Years 2004 to 2013
(unaudited)
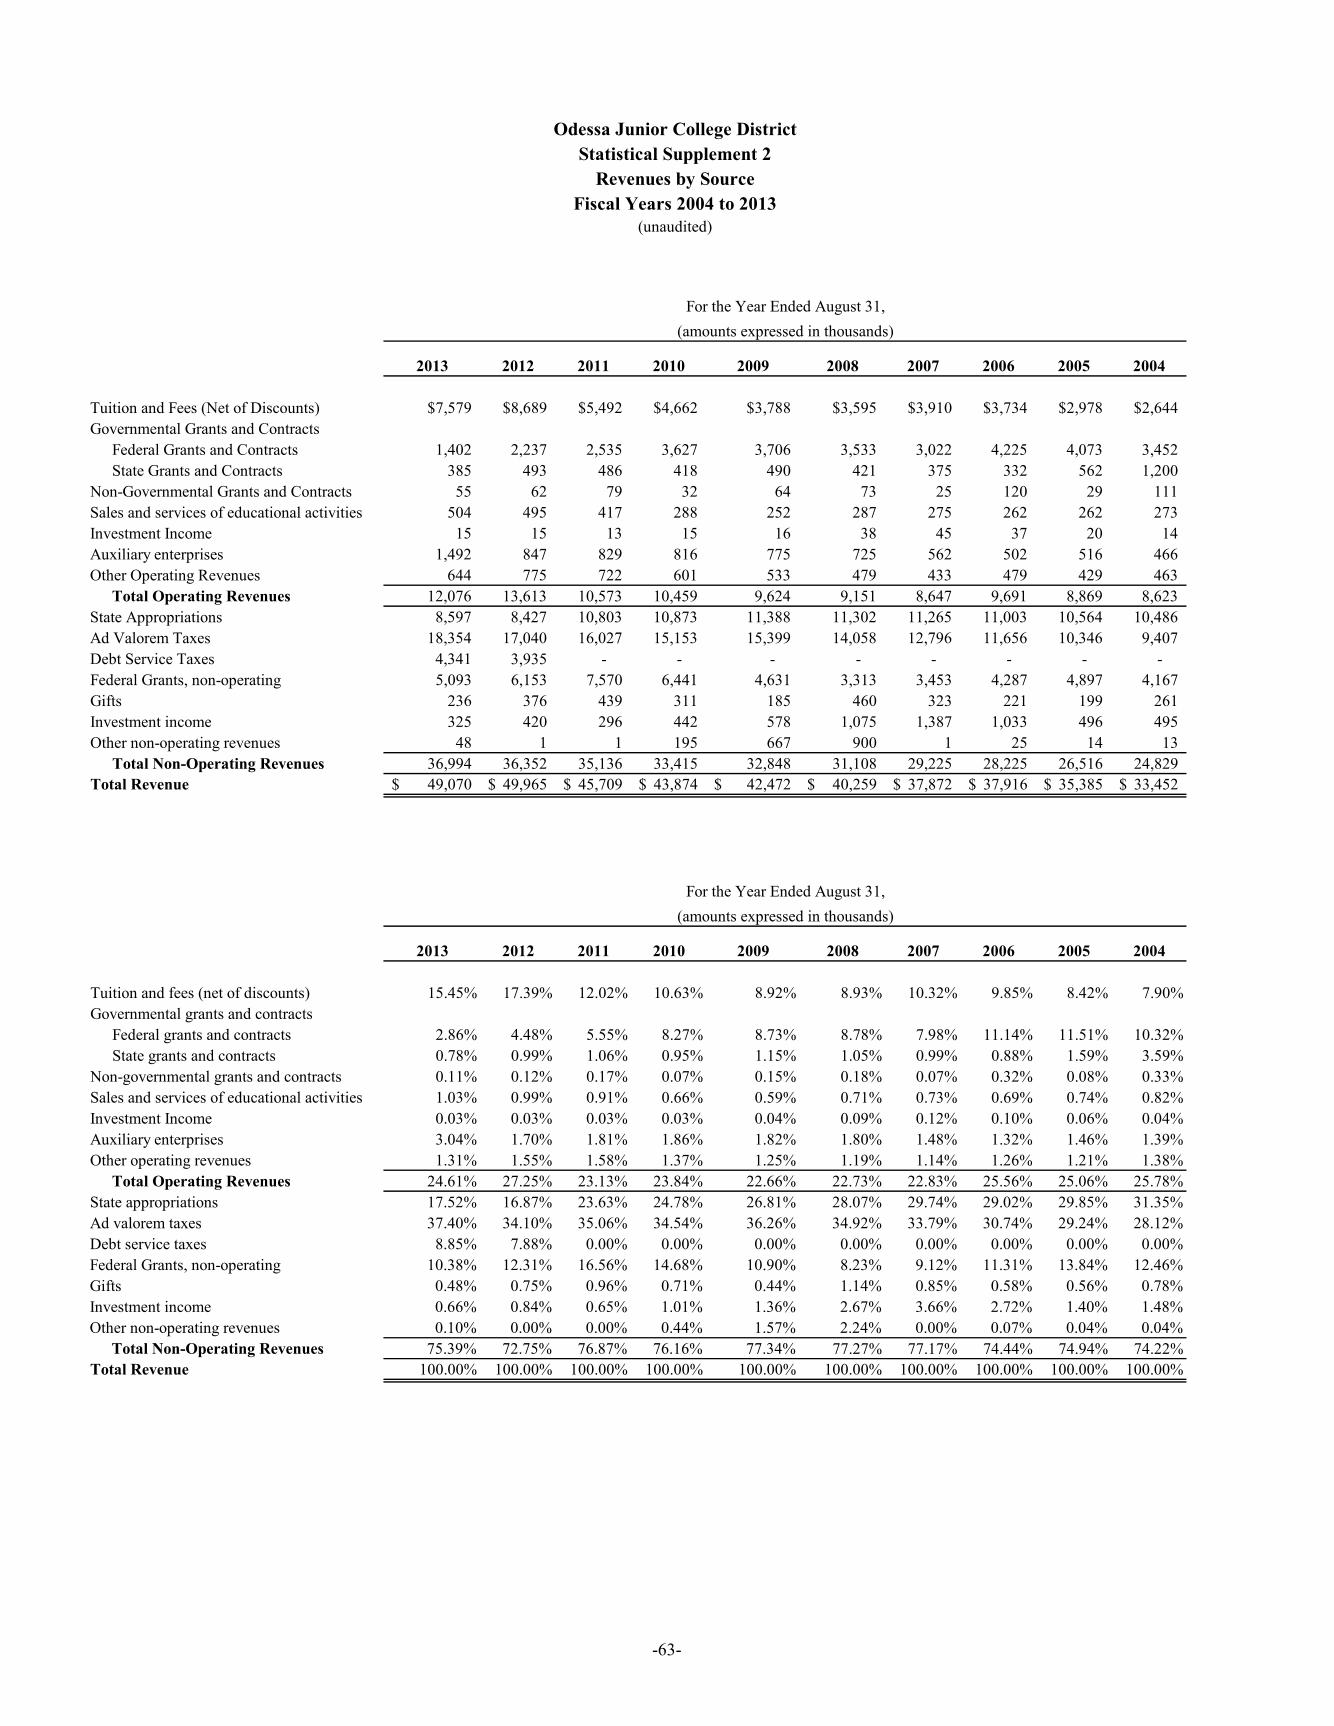
-63-
2013 2012 2011 2010 2009 2008 2007 2006 2005 2004
Tuition and Fees (Net of Discounts) $7,579 $8,689 $5,492 $4,662 $3,788 $3,595 $3,910 $3,734 $2,978 $2,644Governmental Grants and Contracts
Federal Grants and Contracts 1,402 2,237 2,535 3,627 3,706 3,533 3,022 4,225 4,073 3,452 State Grants and Contracts 385 493 486 418 490 421 375 332 562 1,200
Non-Governmental Grants and Contracts 55 62 79 32 64 73 25 120 29 111 Sales and services of educational activities 504 495 417 288 252 287 275 262 262 273 Investment Income 15 15 13 15 16 38 45 37 20 14 Auxiliary enterprises 1,492 847 829 816 775 725 562 502 516 466 Other Operating Revenues 644 775 722 601 533 479 433 479 429 463
Total Operating Revenues 12,076 13,613 10,573 10,459 9,624 9,151 8,647 9,691 8,869 8,623 State Appropriations 8,597 8,427 10,803 10,873 11,388 11,302 11,265 11,003 10,564 10,486 Ad Valorem Taxes 18,354 17,040 16,027 15,153 15,399 14,058 12,796 11,656 10,346 9,407 Debt Service Taxes 4,341 3,935 - - - - - - - - Federal Grants, non-operating 5,093 6,153 7,570 6,441 4,631 3,313 3,453 4,287 4,897 4,167 Gifts 236 376 439 311 185 460 323 221 199 261 Investment income 325 420 296 442 578 1,075 1,387 1,033 496 495 Other non-operating revenues 48 1 1 195 667 900 1 25 14 13
Total Non-Operating Revenues 36,994 36,352 35,136 33,415 32,848 31,108 29,225 28,225 26,516 24,829 Total Revenue 49,070$ 49,965$ 45,709$ 43,874$ 42,472$ 40,259$ 37,872$ 37,916$ 35,385$ 33,452$
2013 2012 2011 2010 2009 2008 2007 2006 2005 2004
Tuition and fees (net of discounts) 15.45% 17.39% 12.02% 10.63% 8.92% 8.93% 10.32% 9.85% 8.42% 7.90%Governmental grants and contracts
Federal grants and contracts 2.86% 4.48% 5.55% 8.27% 8.73% 8.78% 7.98% 11.14% 11.51% 10.32%State grants and contracts 0.78% 0.99% 1.06% 0.95% 1.15% 1.05% 0.99% 0.88% 1.59% 3.59%
Non-governmental grants and contracts 0.11% 0.12% 0.17% 0.07% 0.15% 0.18% 0.07% 0.32% 0.08% 0.33%Sales and services of educational activities 1.03% 0.99% 0.91% 0.66% 0.59% 0.71% 0.73% 0.69% 0.74% 0.82%Investment Income 0.03% 0.03% 0.03% 0.03% 0.04% 0.09% 0.12% 0.10% 0.06% 0.04%Auxiliary enterprises 3.04% 1.70% 1.81% 1.86% 1.82% 1.80% 1.48% 1.32% 1.46% 1.39%Other operating revenues 1.31% 1.55% 1.58% 1.37% 1.25% 1.19% 1.14% 1.26% 1.21% 1.38%
Total Operating Revenues 24.61% 27.25% 23.13% 23.84% 22.66% 22.73% 22.83% 25.56% 25.06% 25.78%State appropriations 17.52% 16.87% 23.63% 24.78% 26.81% 28.07% 29.74% 29.02% 29.85% 31.35%Ad valorem taxes 37.40% 34.10% 35.06% 34.54% 36.26% 34.92% 33.79% 30.74% 29.24% 28.12%Debt service taxes 8.85% 7.88% 0.00% 0.00% 0.00% 0.00% 0.00% 0.00% 0.00% 0.00%Federal Grants, non-operating 10.38% 12.31% 16.56% 14.68% 10.90% 8.23% 9.12% 11.31% 13.84% 12.46%Gifts 0.48% 0.75% 0.96% 0.71% 0.44% 1.14% 0.85% 0.58% 0.56% 0.78%Investment income 0.66% 0.84% 0.65% 1.01% 1.36% 2.67% 3.66% 2.72% 1.40% 1.48%Other non-operating revenues 0.10% 0.00% 0.00% 0.44% 1.57% 2.24% 0.00% 0.07% 0.04% 0.04%
Total Non-Operating Revenues 75.39% 72.75% 76.87% 76.16% 77.34% 77.27% 77.17% 74.44% 74.94% 74.22%Total Revenue 100.00% 100.00% 100.00% 100.00% 100.00% 100.00% 100.00% 100.00% 100.00% 100.00%
(amounts expressed in thousands)
For the Year Ended August 31,(amounts expressed in thousands)
(unaudited)
Odessa Junior College DistrictStatistical Supplement 2
Revenues by SourceFiscal Years 2004 to 2013
For the Year Ended August 31,
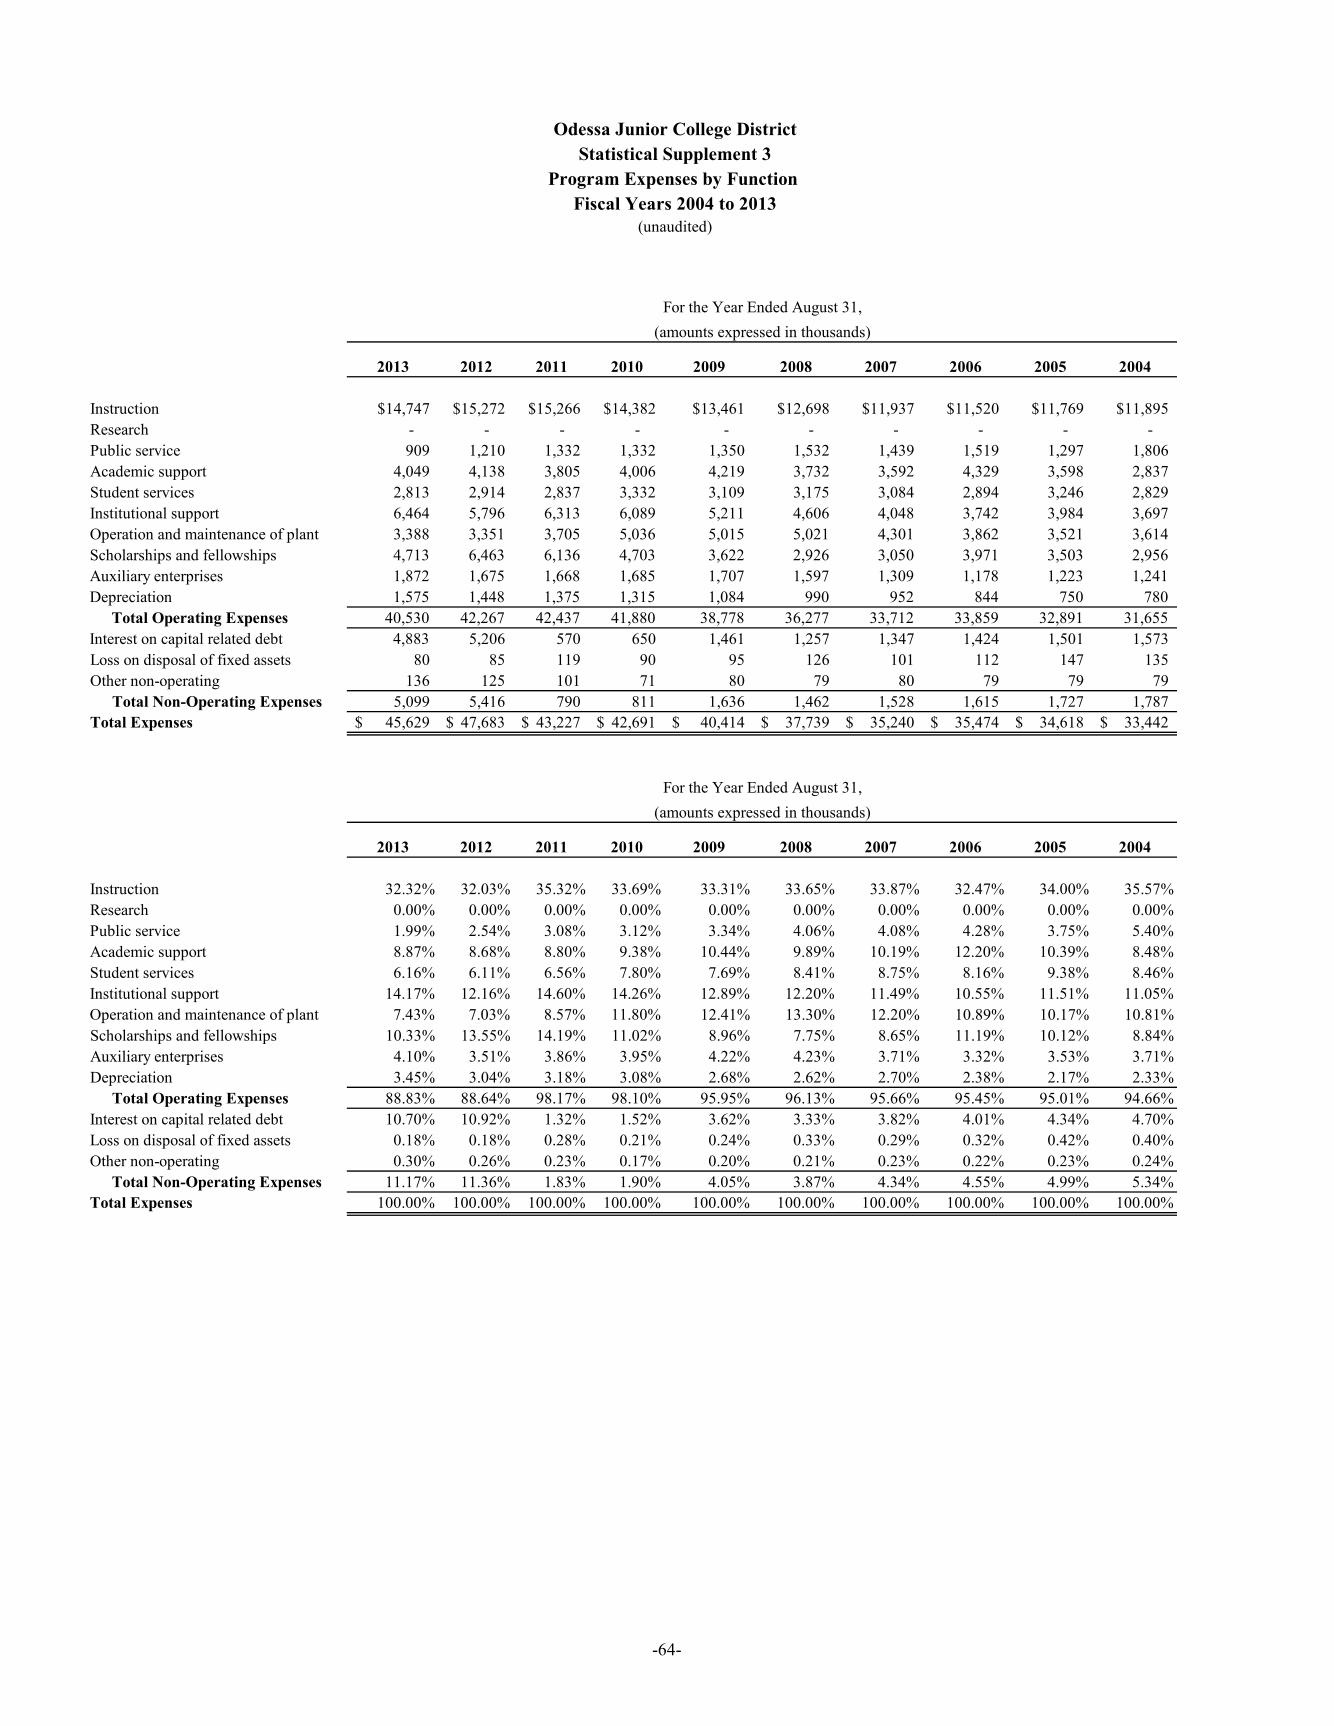
-64-
2013 2012 2011 2010 2009 2008 2007 2006 2005 2004
Instruction $14,747 $15,272 $15,266 $14,382 $13,461 $12,698 $11,937 $11,520 $11,769 $11,895Research - - - - - - - - - - Public service 909 1,210 1,332 1,332 1,350 1,532 1,439 1,519 1,297 1,806 Academic support 4,049 4,138 3,805 4,006 4,219 3,732 3,592 4,329 3,598 2,837 Student services 2,813 2,914 2,837 3,332 3,109 3,175 3,084 2,894 3,246 2,829 Institutional support 6,464 5,796 6,313 6,089 5,211 4,606 4,048 3,742 3,984 3,697 Operation and maintenance of plant 3,388 3,351 3,705 5,036 5,015 5,021 4,301 3,862 3,521 3,614 Scholarships and fellowships 4,713 6,463 6,136 4,703 3,622 2,926 3,050 3,971 3,503 2,956 Auxiliary enterprises 1,872 1,675 1,668 1,685 1,707 1,597 1,309 1,178 1,223 1,241 Depreciation 1,575 1,448 1,375 1,315 1,084 990 952 844 750 780
Total Operating Expenses 40,530 42,267 42,437 41,880 38,778 36,277 33,712 33,859 32,891 31,655 Interest on capital related debt 4,883 5,206 570 650 1,461 1,257 1,347 1,424 1,501 1,573 Loss on disposal of fixed assets 80 85 119 90 95 126 101 112 147 135 Other non-operating 136 125 101 71 80 79 80 79 79 79
Total Non-Operating Expenses 5,099 5,416 790 811 1,636 1,462 1,528 1,615 1,727 1,787 Total Expenses 45,629$ 47,683$ 43,227$ 42,691$ 40,414$ 37,739$ 35,240$ 35,474$ 34,618$ 33,442$
2013 2012 2011 2010 2009 2008 2007 2006 2005 2004
Instruction 32.32% 32.03% 35.32% 33.69% 33.31% 33.65% 33.87% 32.47% 34.00% 35.57%Research 0.00% 0.00% 0.00% 0.00% 0.00% 0.00% 0.00% 0.00% 0.00% 0.00%Public service 1.99% 2.54% 3.08% 3.12% 3.34% 4.06% 4.08% 4.28% 3.75% 5.40%Academic support 8.87% 8.68% 8.80% 9.38% 10.44% 9.89% 10.19% 12.20% 10.39% 8.48%Student services 6.16% 6.11% 6.56% 7.80% 7.69% 8.41% 8.75% 8.16% 9.38% 8.46%Institutional support 14.17% 12.16% 14.60% 14.26% 12.89% 12.20% 11.49% 10.55% 11.51% 11.05%Operation and maintenance of plant 7.43% 7.03% 8.57% 11.80% 12.41% 13.30% 12.20% 10.89% 10.17% 10.81%Scholarships and fellowships 10.33% 13.55% 14.19% 11.02% 8.96% 7.75% 8.65% 11.19% 10.12% 8.84%Auxiliary enterprises 4.10% 3.51% 3.86% 3.95% 4.22% 4.23% 3.71% 3.32% 3.53% 3.71%Depreciation 3.45% 3.04% 3.18% 3.08% 2.68% 2.62% 2.70% 2.38% 2.17% 2.33%
Total Operating Expenses 88.83% 88.64% 98.17% 98.10% 95.95% 96.13% 95.66% 95.45% 95.01% 94.66%Interest on capital related debt 10.70% 10.92% 1.32% 1.52% 3.62% 3.33% 3.82% 4.01% 4.34% 4.70%Loss on disposal of fixed assets 0.18% 0.18% 0.28% 0.21% 0.24% 0.33% 0.29% 0.32% 0.42% 0.40%Other non-operating 0.30% 0.26% 0.23% 0.17% 0.20% 0.21% 0.23% 0.22% 0.23% 0.24%
Total Non-Operating Expenses 11.17% 11.36% 1.83% 1.90% 4.05% 3.87% 4.34% 4.55% 4.99% 5.34%Total Expenses 100.00% 100.00% 100.00% 100.00% 100.00% 100.00% 100.00% 100.00% 100.00% 100.00%
For the Year Ended August 31,(amounts expressed in thousands)
For the Year Ended August 31,(amounts expressed in thousands)
Odessa Junior College DistrictStatistical Supplement 3
Program Expenses by Function Fiscal Years 2004 to 2013
(unaudited)
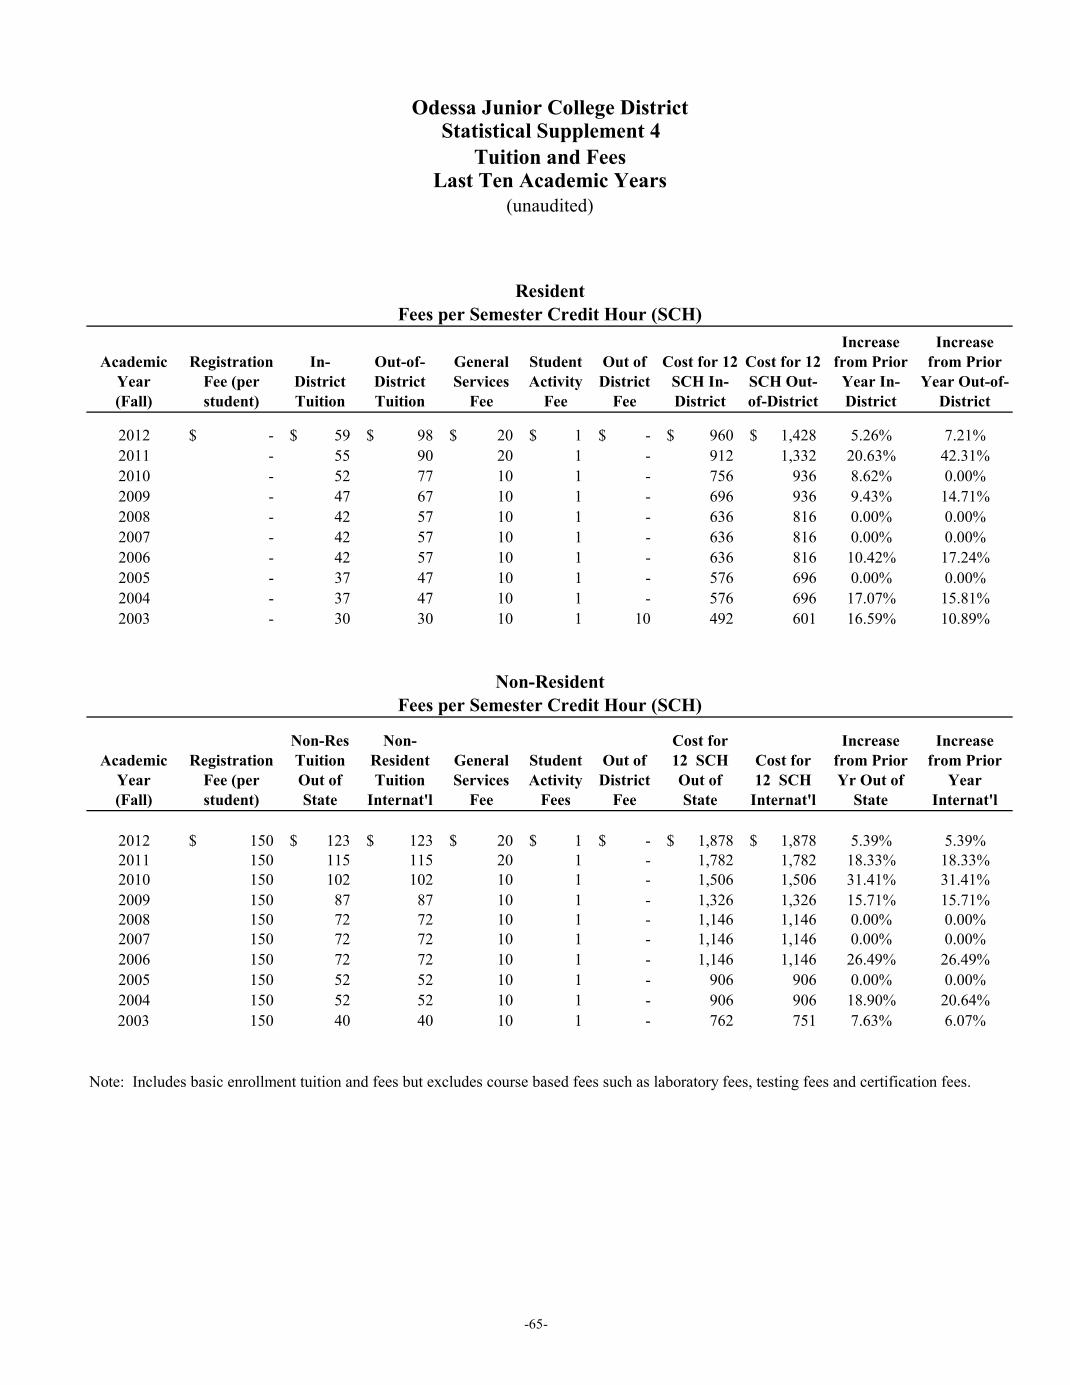
-65-
Academic Year (Fall)
Registration Fee (per student)
In-District Tuition
Out-of-District Tuition
General Services
Fee
Student Activity
Fee
Out of District
Fee
Cost for 12 SCH In-District
Cost for 12 SCH Out-of-District
Increase from Prior
Year In-District
Increase from Prior
Year Out-of-District
2012 -$ 59$ 98$ 20$ 1$ -$ 960$ 1,428$ 5.26% 7.21%2011 - 55 90 20 1 - 912 1,332 20.63% 42.31%2010 - 52 77 10 1 - 756 936 8.62% 0.00%2009 - 47 67 10 1 - 696 936 9.43% 14.71%2008 - 42 57 10 1 - 636 816 0.00% 0.00%2007 - 42 57 10 1 - 636 816 0.00% 0.00%2006 - 42 57 10 1 - 636 816 10.42% 17.24%2005 - 37 47 10 1 - 576 696 0.00% 0.00%2004 - 37 47 10 1 - 576 696 17.07% 15.81%2003 - 30 30 10 1 10 492 601 16.59% 10.89%
Academic Year (Fall)
Registration Fee (per student)
Non-Res Tuition Out of State
Non-Resident Tuition
Internat'l
General Services
Fee
Student Activity
Fees
Out of District
Fee
Cost for 12 SCH Out of State
Cost for 12 SCH
Internat'l
Increase from Prior Yr Out of
State
Increase from Prior
Year Internat'l
2012 150$ 123$ 123$ 20$ 1$ -$ 1,878$ 1,878$ 5.39% 5.39%2011 150 115 115 20 1 - 1,782 1,782 18.33% 18.33%2010 150 102 102 10 1 - 1,506 1,506 31.41% 31.41%2009 150 87 87 10 1 - 1,326 1,326 15.71% 15.71%2008 150 72 72 10 1 - 1,146 1,146 0.00% 0.00%2007 150 72 72 10 1 - 1,146 1,146 0.00% 0.00%2006 150 72 72 10 1 - 1,146 1,146 26.49% 26.49%2005 150 52 52 10 1 - 906 906 0.00% 0.00%2004 150 52 52 10 1 - 906 906 18.90% 20.64%2003 150 40 40 10 1 - 762 751 7.63% 6.07%
Odessa Junior College DistrictStatistical Supplement 4
Tuition and FeesLast Ten Academic Years
(unaudited)
ResidentFees per Semester Credit Hour (SCH)
Non-ResidentFees per Semester Credit Hour (SCH)
Note: Includes basic enrollment tuition and fees but excludes course based fees such as laboratory fees, testing fees and certification fees.

-66-
Student Classification Number Percent Number Percent Number Percent Number Percent Number PercentCE Students 1,392 21.72% 1,888 26.97% 1,828 25.97% 1,650 24.33% 1,934 29.21%0-30 hours 3,904 60.90% 4,270 61.00% 4,362 61.97% 4,536 66.88% 4,035 60.94%31-60 hours 884 13.79% 609 8.70% 773 10.98% 527 7.77% 601 9.08%> 60 hours 230 3.59% 233 3.33% 76 1.08% 69 1.02% 51 0.77%Total 6,410 100.00% 7,000 100.00% 7,039 100.00% 6,782 100.00% 6,621 100.00%
Tuition Status Number Percent Number Percent Number Percent Number Percent Number PercentCE Students 1,392 21.72% 1,888 26.97% 1,828 25.97% 1,650 24.33% 1,934 29.21%Texas Resident (in-District) 3,473 54.18% 3,531 50.44% 3595 51.07% 3471 51.18% 3071 46.38%Texas Resident (out-of-District) 1,342 20.94% 1,383 19.76% 1411 20.05% 1481 21.84% 1441 21.76%Non-Resident Tuition 171 2.67% 166 2.37% 151 2.15% 138 2.03% 139 2.10%Tuition Exempt 32 0.50% 32 0.46% 54 0.77% 42 0.62% 36 0.54%Total 6,410 100.00% 7,000 100.00% 7,039 100.00% 6,782 100.00% 6,621 100.00%
Odessa Junior College DistrictStatistical Supplement 5Fall Enrollment DetailsLast Five Fiscal Years
(unaudited)
Fall 2011 Fall 2010 Fall 2009 Fall 2008Fall 2012
Fall 2012 Fall 2011 Fall 2010 Fall 2009 Fall 2008
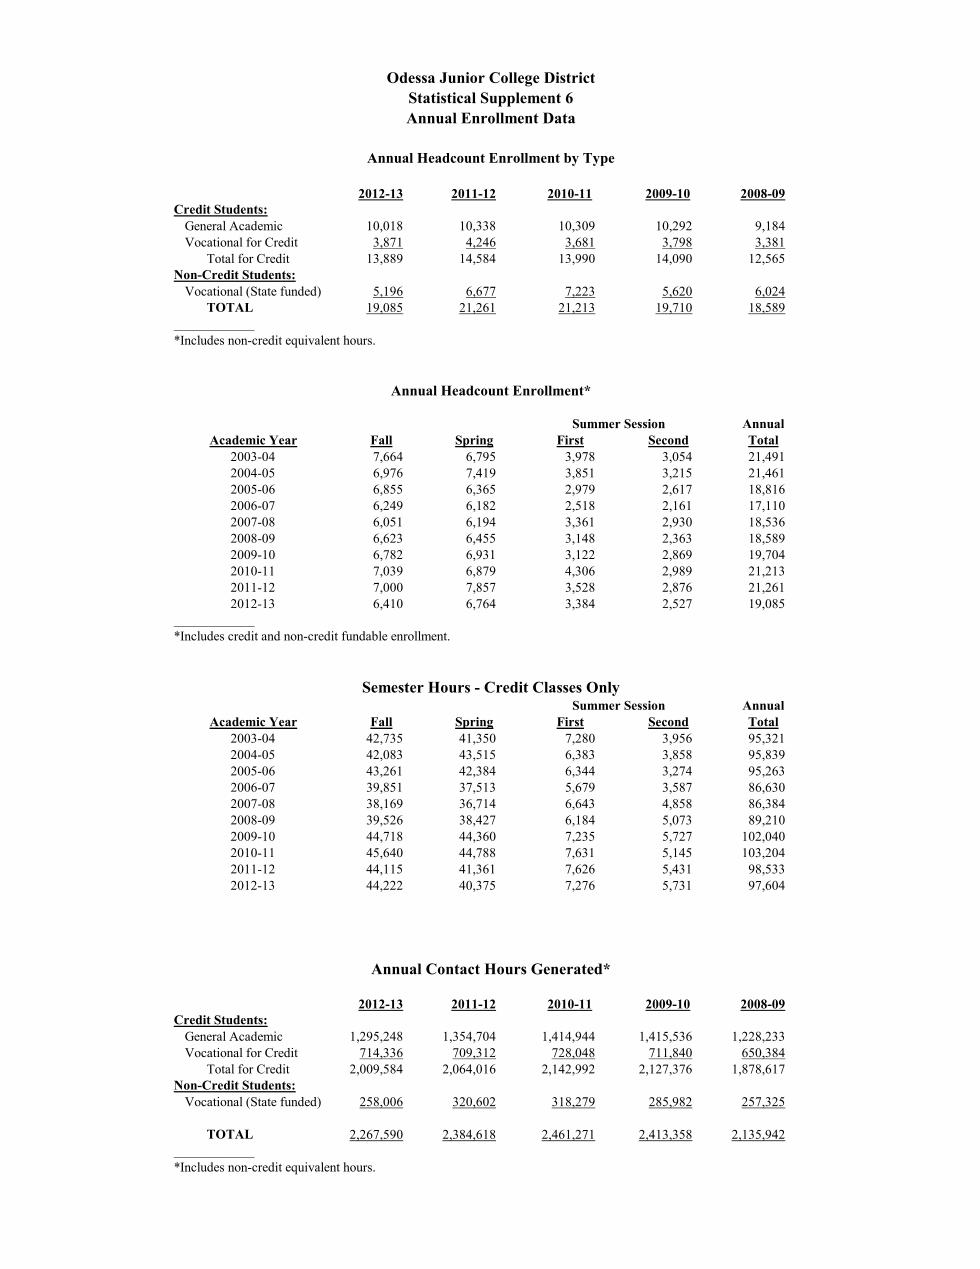
-67-
2012-13 2011-12 2010-11 2009-10 2008-09Credit Students:
General Academic 10,018 10,338 10,309 10,292 9,184Vocational for Credit 3,871 4,246 3,681 3,798 3,381
Total for Credit 13,889 14,584 13,990 14,090 12,565Non-Credit Students:
Vocational (State funded) 5,196 6,677 7,223 5,620 6,024TOTAL 19,085 21,261 21,213 19,710 18,589
____________
AnnualAcademic Year Fall Spring First Second Total
2003-04 7,664 6,795 3,978 3,054 21,4912004-05 6,976 7,419 3,851 3,215 21,4612005-06 6,855 6,365 2,979 2,617 18,8162006-07 6,249 6,182 2,518 2,161 17,1102007-08 6,051 6,194 3,361 2,930 18,5362008-09 6,623 6,455 3,148 2,363 18,5892009-10 6,782 6,931 3,122 2,869 19,7042010-11 7,039 6,879 4,306 2,989 21,2132011-12 7,000 7,857 3,528 2,876 21,2612012-13 6,410 6,764 3,384 2,527 19,085
____________
AnnualAcademic Year Fall Spring First Second Total
2003-04 42,735 41,350 7,280 3,956 95,3212004-05 42,083 43,515 6,383 3,858 95,8392005-06 43,261 42,384 6,344 3,274 95,2632006-07 39,851 37,513 5,679 3,587 86,6302007-08 38,169 36,714 6,643 4,858 86,3842008-09 39,526 38,427 6,184 5,073 89,2102009-10 44,718 44,360 7,235 5,727 102,0402010-11 45,640 44,788 7,631 5,145 103,2042011-12 44,115 41,361 7,626 5,431 98,5332012-13 44,222 40,375 7,276 5,731 97,604
2012-13 2011-12 2010-11 2009-10 2008-09Credit Students:
General Academic 1,295,248 1,354,704 1,414,944 1,415,536 1,228,233Vocational for Credit 714,336 709,312 728,048 711,840 650,384
Total for Credit 2,009,584 2,064,016 2,142,992 2,127,376 1,878,617Non-Credit Students:
Vocational (State funded) 258,006 320,602 318,279 285,982 257,325
TOTAL 2,267,590 2,384,618 2,461,271 2,413,358 2,135,942____________
Annual Contact Hours Generated*
*Includes non-credit equivalent hours.
Statistical Supplement 6
Semester Hours - Credit Classes OnlySummer Session
Annual Headcount Enrollment by Type
Odessa Junior College District
Annual Enrollment Data
Annual Headcount Enrollment*
Summer Session
*Includes credit and non-credit fundable enrollment.
*Includes non-credit equivalent hours.
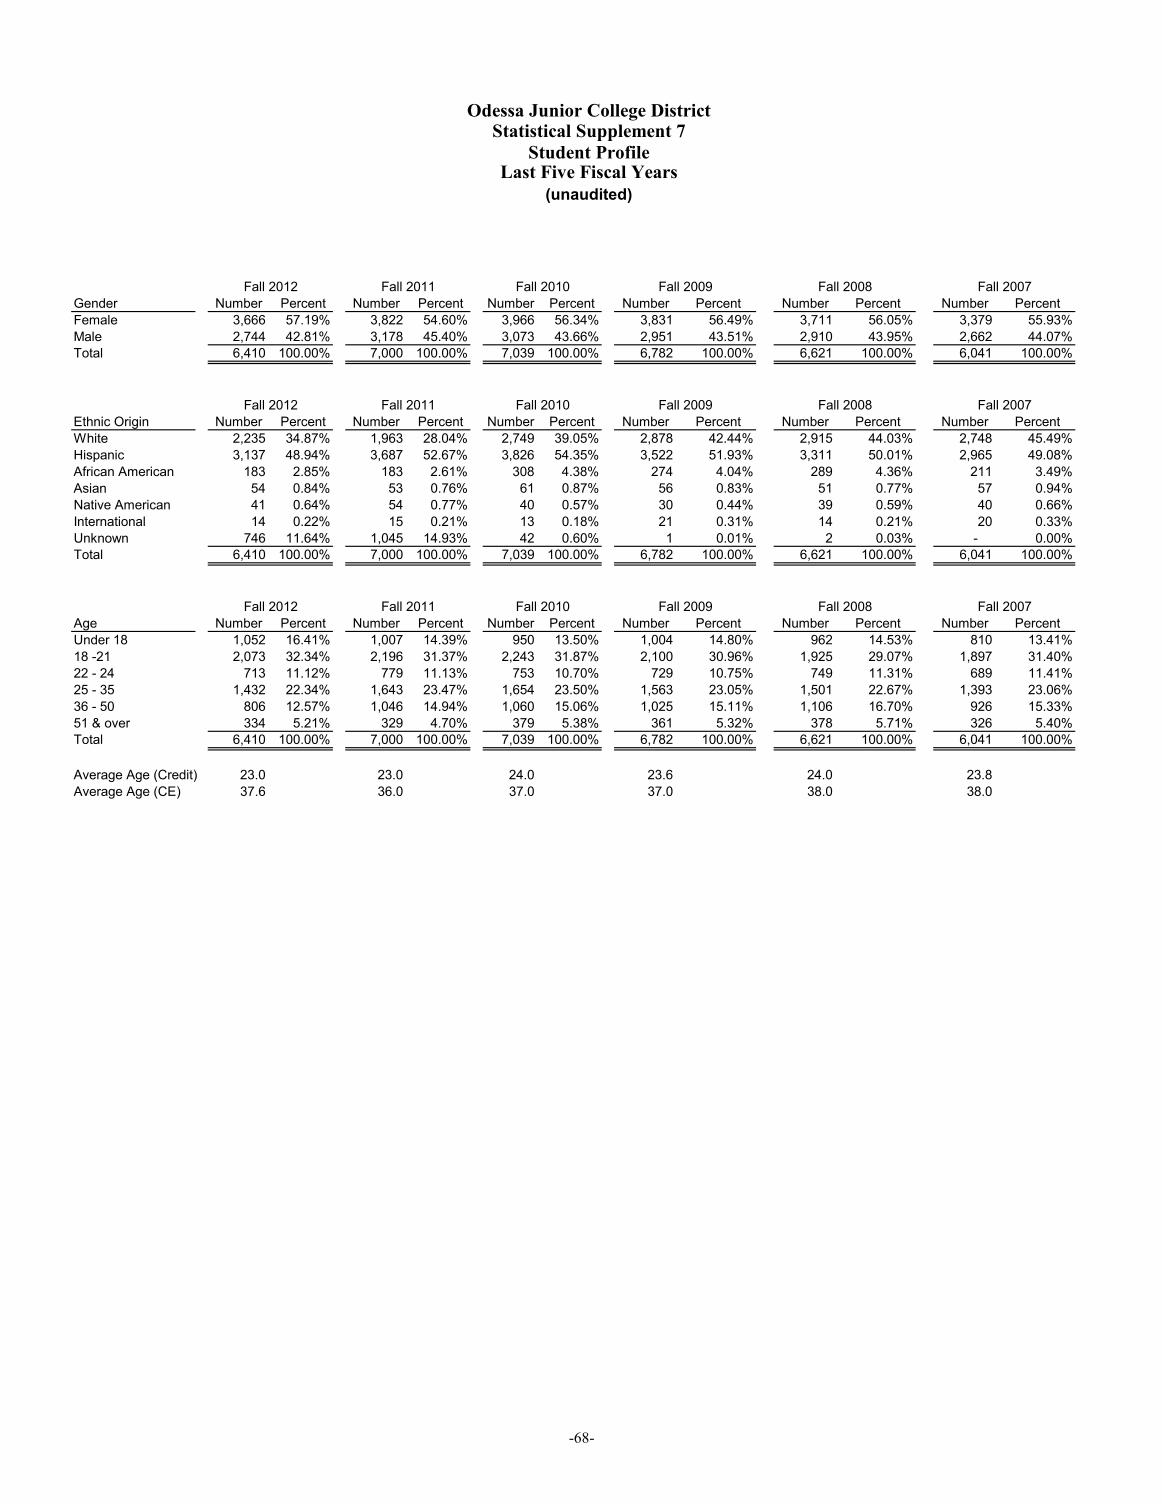
-68-
Gender Number Percent Number Percent Number Percent Number Percent Number Percent Number PercentFemale 3,666 57.19% 3,822 54.60% 3,966 56.34% 3,831 56.49% 3,711 56.05% 3,379 55.93%Male 2,744 42.81% 3,178 45.40% 3,073 43.66% 2,951 43.51% 2,910 43.95% 2,662 44.07%Total 6,410 100.00% 7,000 100.00% 7,039 100.00% 6,782 100.00% 6,621 100.00% 6,041 100.00%
Ethnic Origin Number Percent Number Percent Number Percent Number Percent Number Percent Number PercentWhite 2,235 34.87% 1,963 28.04% 2,749 39.05% 2,878 42.44% 2,915 44.03% 2,748 45.49%Hispanic 3,137 48.94% 3,687 52.67% 3,826 54.35% 3,522 51.93% 3,311 50.01% 2,965 49.08%African American 183 2.85% 183 2.61% 308 4.38% 274 4.04% 289 4.36% 211 3.49%Asian 54 0.84% 53 0.76% 61 0.87% 56 0.83% 51 0.77% 57 0.94%Native American 41 0.64% 54 0.77% 40 0.57% 30 0.44% 39 0.59% 40 0.66%International 14 0.22% 15 0.21% 13 0.18% 21 0.31% 14 0.21% 20 0.33%Unknown 746 11.64% 1,045 14.93% 42 0.60% 1 0.01% 2 0.03% - 0.00%Total 6,410 100.00% 7,000 100.00% 7,039 100.00% 6,782 100.00% 6,621 100.00% 6,041 100.00%
Age Number Percent Number Percent Number Percent Number Percent Number Percent Number PercentUnder 18 1,052 16.41% 1,007 14.39% 950 13.50% 1,004 14.80% 962 14.53% 810 13.41%18 -21 2,073 32.34% 2,196 31.37% 2,243 31.87% 2,100 30.96% 1,925 29.07% 1,897 31.40%22 - 24 713 11.12% 779 11.13% 753 10.70% 729 10.75% 749 11.31% 689 11.41%25 - 35 1,432 22.34% 1,643 23.47% 1,654 23.50% 1,563 23.05% 1,501 22.67% 1,393 23.06%36 - 50 806 12.57% 1,046 14.94% 1,060 15.06% 1,025 15.11% 1,106 16.70% 926 15.33%51 & over 334 5.21% 329 4.70% 379 5.38% 361 5.32% 378 5.71% 326 5.40%Total 6,410 100.00% 7,000 100.00% 7,039 100.00% 6,782 100.00% 6,621 100.00% 6,041 100.00%
Average Age (Credit) 23.0 23.0 24.0 23.6 24.0 23.8 Average Age (CE) 37.6 36.0 37.0 37.0 38.0 38.0
Fall 2012 Fall 2007
Fall 2007
Fall 2007
Fall 2010 Fall 2009 Fall 2008
Fall 2009Fall 2011
Fall 2011
Fall 2011
Fall 2008
Odessa Junior College District
Fall 2010
Statistical Supplement 7Student Profile
Last Five Fiscal Years
Fall 2009
(unaudited)
Fall 2008Fall 2010Fall 2012
Fall 2012
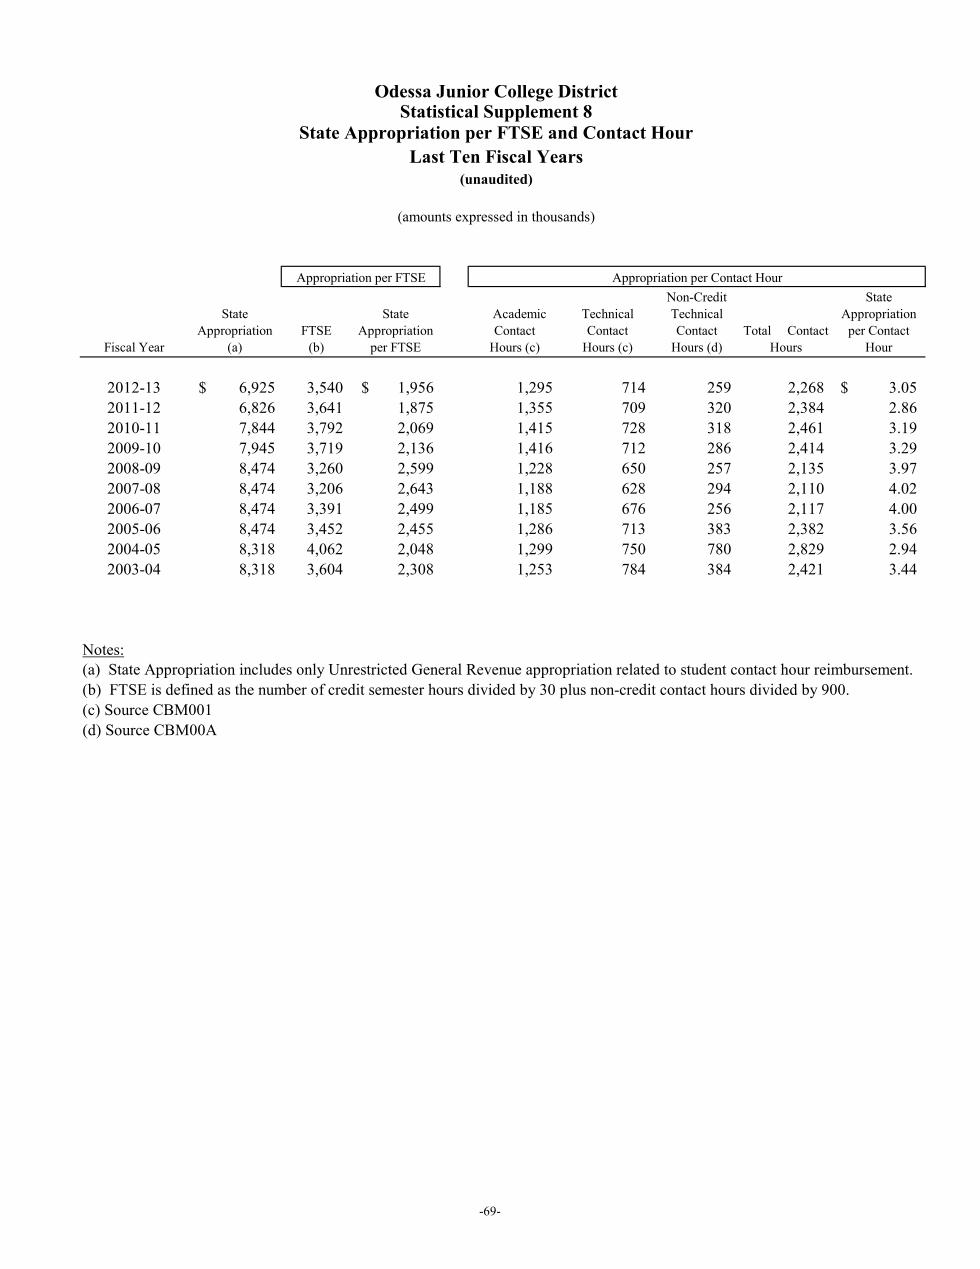
-69-
Fiscal Year
State Appropriation
(a)FTSE
(b)
State Appropriation
per FTSE
Academic Contact
Hours (c)
Technical Contact
Hours (c)
Non-Credit Technical Contact
Hours (d)Total Contact
Hours
State Appropriation
per Contact Hour
2012-13 $ 6,925 3,540 $ 1,956 1,295 714 259 2,268 3.05$ 2011-12 6,826 3,641 1,875 1,355 709 320 2,384 2.86 2010-11 7,844 3,792 2,069 1,415 728 318 2,461 3.19 2009-10 7,945 3,719 2,136 1,416 712 286 2,414 3.29 2008-09 8,474 3,260 2,599 1,228 650 257 2,135 3.97 2007-08 8,474 3,206 2,643 1,188 628 294 2,110 4.02 2006-07 8,474 3,391 2,499 1,185 676 256 2,117 4.00 2005-06 8,474 3,452 2,455 1,286 713 383 2,382 3.56 2004-05 8,318 4,062 2,048 1,299 750 780 2,829 2.94 2003-04 8,318 3,604 2,308 1,253 784 384 2,421 3.44
Notes:(a) State Appropriation includes only Unrestricted General Revenue appropriation related to student contact hour reimbursement.(b) FTSE is defined as the number of credit semester hours divided by 30 plus non-credit contact hours divided by 900.
(amounts expressed in thousands)
Odessa Junior College DistrictStatistical Supplement 8
State Appropriation per FTSE and Contact HourLast Ten Fiscal Years
(unaudited)
Appropriation per FTSE Appropriation per Contact Hour
(c) Source CBM001(d) Source CBM00A

-70-
Transfer Transfer Transfer Total of % of Student Student Student All Odessa All OdessaCount Count Count Transfer Transfer
Academic Technical Tech-Prep Students Students
1 The University of Texas of the Permian Basin 344 24 9 377 52.22%2 Texas Tech University 99 1 100 13.85%3 Angelo State University 36 36 4.99%4 West Texas A & M University 31 31 4.29%5 Texas A & M University 30 30 4.16%6 Texas Tech University Health Science Center 26 26 3.60%7 The University of Texas at Austin 22 1 23 3.19%8 University of North Texas 17 17 2.35%9 Texas State University at San Marcus 15 15 2.08%10 The University of Texas at Arlington 9 2 11 1.52%11 Tarleton State University 9 1 10 1.39%12 Sul Ross State University 9 9 1.25%13 The University of Texas at San Antonio 5 1 1 7 0.97%14 Stephen F. Austin State University 3 1 4 0.55%15 The University of Texas Medical Branch at Galve 4 4 0.55%16 Texas A & M University at Commerce 3 3 0.42%17 Midwestern State University 3 3 0.42%18 University of Houston 3 3 0.42%19 The University of Texas at El Paso 2 2 0.28%20 The University of Brownsville 1 1 2 0.28%21 The University of Texas Health Science Center a 2 2 0.28%22 Texas A & M University at Corpus Christi 1 1 0.14%23 Texas Woman's University 1 1 0.14%24 Texas A & M University at Kingsville 0 1 1 0.14%25 The University of Texas at Pan American 1 1 0.14%26 Texas A & M University at Galveston 1 1 0.14%27 University of Texas at Dallas 1 1 0.14%28 Lamar University 1 1 0.14%
Totals 679 28 15 722 100.00%
(unaudited)
2011 Fall Students as of Fall 2012(Includes only public senior colleges in Texas)
Odessa Junior College DistrictStatistical Supplement 9
Transfers to Senior Institutions

-71-
Fiscal Year
Assessed Valuation of
PropertyLess:
Exemptions
Taxable Assessed Value (TAV)
Ratio of Taxable to Assessed
Value
Maintenance & Operations
(a)
Debt Service
(a)Total (a)
2012-13 14,112,228 2,123,917 11,988,311 84.95% 0.151200 0.035970 0.187170 2011-12 12,709,099 2,084,774 10,624,325 83.60% 0.158400 0.038680 0.197080 2010-11 12,082,970 2,108,081 9,974,889 82.55% 0.158400 0.158400 2009-10 11,725,808 2,417,353 9,308,455 79.38% 0.162400 - 0.162400 2008-09 11,945,389 2,544,708 9,400,681 78.70% 0.162400 - 0.162400 2007-08 9,694,085 2,063,518 7,630,567 78.71% 0.181700 - 0.181700 2006-07 8,367,049 1,624,822 6,742,227 80.58% 0.190000 - 0.190000 2005-06 7,174,228 1,354,242 5,819,986 81.12% 0.200000 - 0.200000 2004-05 6,370,122 1,324,654 5,045,468 79.21% 0.200000 - 0.200000 2003-04 5,775,949 1,145,302 4,630,647 80.17% 0.200000 - 0.200000
Property Use Category 2012/13 2011/12 2010/11 2009/10 2008/09
Real PropertySingle-Family Residential $ 3,768,789 $ 3,604,499 $ 3,578,944 $ 3,601,843 $ 3,320,398 Multi-Family Residential 269,959 199,739 185,067 195,706 184,478Vacant Lots/Tracts 103,505 96,732 101,441 106,371 105,603Acreage (Land Only) 134,490 124,026 122,227 128,470 125,168Farm and Ranch Improvements 15,278 14,220 13,438 19,338 19,488Commercial and Industrial 1,723,487 1,602,608 1,525,132 1,610,747 1,612,968Oil, Gas & Minerals 4,558,628 4,105,181 3,854,425 3,193,131 3,829,259Inventory 62,316 45,363 38,237 55,944 57,393
Tangible Personal PropertyBusiness 2,220,925 1,759,954 1,570,466 1,834,895 1,611,526Other 146,024 132,191 121,928 116,186 105,943
Real & Tangible Personal PropertyUtilities 322,520 259,137 216,347 105,011 231,130
Total Market Assessed Valuations 13,325,921 11,943,650 11,327,652 10,967,642 11,203,354
Constitutionally Exempt Values 786,307 765,449 755,318 758,166 742,035Total Assessed Valuations 14,112,228 12,709,099 12,082,970 11,725,808 11,945,389
Less Exemptions:Constitutionally Exempt 786,307 765,449 755,318 758,166 742,035Residential Homestead 591,446 570,765 558,211 518,120 460,927Loss to 10% Cap 57,929 81,076 186,100 410,766 488,952Over 65 173,421 172,815 170,760 164,600 158,765Disabled/Others 1,892 1,189 848 940 747Productivity Loss 94,864 86,410 90,453 93,670 88,617Freeport Exemption 83,547 73,336 46,692 65,787 77,167Pollution Control 149,147 151,315 135,845 171,327 28,926Abatements 185,364 182,419 163,854 233,977 498,572
Total Exemptions 2,123,917 2,084,774 2,108,081 2,417,353 2,544,708
Taxable Assessed Valuation $ 11,988,311 $ 10,624,325 $ 9,974,889 $ 9,308,455 $ 9,400,681
Odessa Junior College DistrictStatistical Supplement 10
Assessed Value and Taxable Assessed Value of Property Last Ten Fiscal Years
Detailed Tax Roll For Fiscal Years
(amounts expressed in thousands) Tax Rate
(unaudited)

-72-
Taxpayer 2013 2012 2011 2010 2009 2008 2007 2006 2005 2004Occidental Permian LTD Oil & Gas 810,640$ 677,300$ 671,537$ 722,406$ 665,706$ 845,024$ 610,832$ 514,882$ 449,259$ 342,424$ Conocophoillips Oil & Gas 375,281 382,053 401,298 457,937 350,225 372,529 231,750 212,867 172,712 127,058 Odessa-Ector Power Partners Utility 318,767 316,562 226,811 191,925 191,713 - - - - Apache Corporation Oil & Gas 265,774 264,552 236,650 236,130 160,352 286,547 - - - - Halliburton Energy Services Oil & Gas 238,475 132,610 Devon Energy Production Oil & Gas 222,788 256,806 203,373 126,613 Oxy USA WTP LP Oil & Gas 206,678 244,011 223,194 225,445 232,478 296,757 212,925 188,176 119,146 89,841 XTO Energy Oil & Gas 197,932 243,275 308,732 296,139 278,509 313,628 223,288 147,857 82,277 - Sheridan Production Co Oil & Gas 194,557 Chevron USA Inc. Oil & Gas 175,878 - - - - - - - - 72,084 Sandridge Exploration & Prod Oil & Gas 244,663 211,724 179,281 COG Operating Oil & Gas 235,003 190,344 94,093 Oxy USA Inc. Oil & Gas - - 82,994 - 97,017 129,370 - - - - Energen Resources Oil & Gas 95,603 77,649 100,632 66,137 - - - Oncore Electric Delivery Utility - - - - 80,011 84,067 - - - 72,286 Four Star Oil and Gas Oil & Gas - - - - 78,154 116,096 132,860 167,372 123,514 109,559 Flint Hills/Huntsman Polmers Chemicals - - - - - 180,234 184,317 282,588 229,892 242,777 Anadarko Petroleum Corp. Oil & Gas - - - - - - 248,127 229,934 193,987 113,847 TXU Electric Delivery Co. Utility - - - - - - 82,686 81,073 77,387 - BP American Production Co. Oil & Gas - - - - - - 51,858 52,168 43,699 36,772 Southwestern Bell Utility - - - - - - - - - 36,475 Encore Operating LP Oil & Gas - - - - - - - 59,604 60,009 -
Totals 3,006,770$ 2,996,835$ 2,756,657$ 2,625,572$ 2,211,814$ 2,724,884$ 2,044,780$ 1,936,521$ 1,551,882$ 1,243,123$
11,988,311$ 10,624,325$ 9,974,889$ 9,308,455$ 9,400,680$ 7,630,567$ 6,742,227$ 5,819,986$ 5,045,468$ 4,630,647$
Taxpayer 2013 2012 2011 2010 2009 2008 2007 2006 2005 2004Occidental Permian LTD Oil & Gas 6.76% 6.37% 6.73% 7.76% 7.08% 11.07% 9.06% 8.85% 8.90% 7.39%Conocophoillips Oil & Gas 3.13% 3.60% 4.02% 4.92% 3.73% 4.88% 3.44% 3.66% 3.42% 2.74%Odessa-Ector Power Partners Utility 2.66% 2.98% 2.27% 2.06% 2.04% - - - - -Apache Corporation Oil & Gas 2.22% 2.49% 2.37% 2.54% 1.71% 3.76% - - - -Halliburton Energy Services Oil & Gas 1.99% 1.25% - - - - - - - -Devon Energy Production Oil & Gas 1.86% 2.42% 2.04% 1.36% - - - - - -Oxy USA WTP LP Oil & Gas 1.72% 2.30% 2.24% 2.42% 2.47% 3.89% 3.16% 3.23% 2.36% 1.94%XTO Energy Oil & Gas 1.65% 2.29% 3.10% 3.18% 2.96% 4.11% 3.31% 2.54% 1.63% -Sheridan Production Co Oil & Gas 1.62% - - - - - - - - -Chevron USA Inc. Oil & Gas 1.47% - - - - - - - - 1.56%Sandridge Exploration & Prod Oil & Gas - 2.30% 2.12% 1.93% - - - - - -COG Operating Oil & Gas - 2.21% 1.91% 1.01% - - - - - -Oxy USA Inc. Oil & Gas - - 0.83% - 1.03% 1.70% - - - -Energen Resources Oil & Gas - - - 1.03% 0.83% 1.32% 0.98% - - -Oncore Electric Delivery Utility - - - - 0.85% 1.10% - - - 1.56%Four Star Oil and Gas Oil & Gas - - - - 0.83% 1.52% 1.97% 2.88% 2.45% 2.37%Flint Hills/Huntsman Polmers Chemicals - - - - - 2.36% 2.73% 4.86% 4.56% 5.24%Anadarko Petroleum Corp. Oil & Gas - - - - - - 3.68% 3.95% 3.84% 2.46%TXU Electric Delivery Co. Utility - - - - - - 1.23% 1.39% 1.53% -BP American Production Co. Oil & Gas - - - - - - 0.77% 0.90% 0.87% 0.79%Southwestern Bell Utility - - - - - - - - - 0.79%Encore Operating LP Oil & Gas - - - - - - - 1.02% 1.19% -
Totals 25.08% 28.21% 27.64% 28.21% 23.53% 35.71% 30.33% 33.27% 30.76% 26.85%
Total Taxable Assessed Value
Type of Business
Taxable Assessed Value (TAV) by Tax Year ($000 omitted)
% of Taxable Assessed Value (TAV) by Tax Year
Type of Business
Odessa Junior College DistrictStatistical Supplement 11
Principal TaxpayersLast Ten Tax Years
(unaudited)
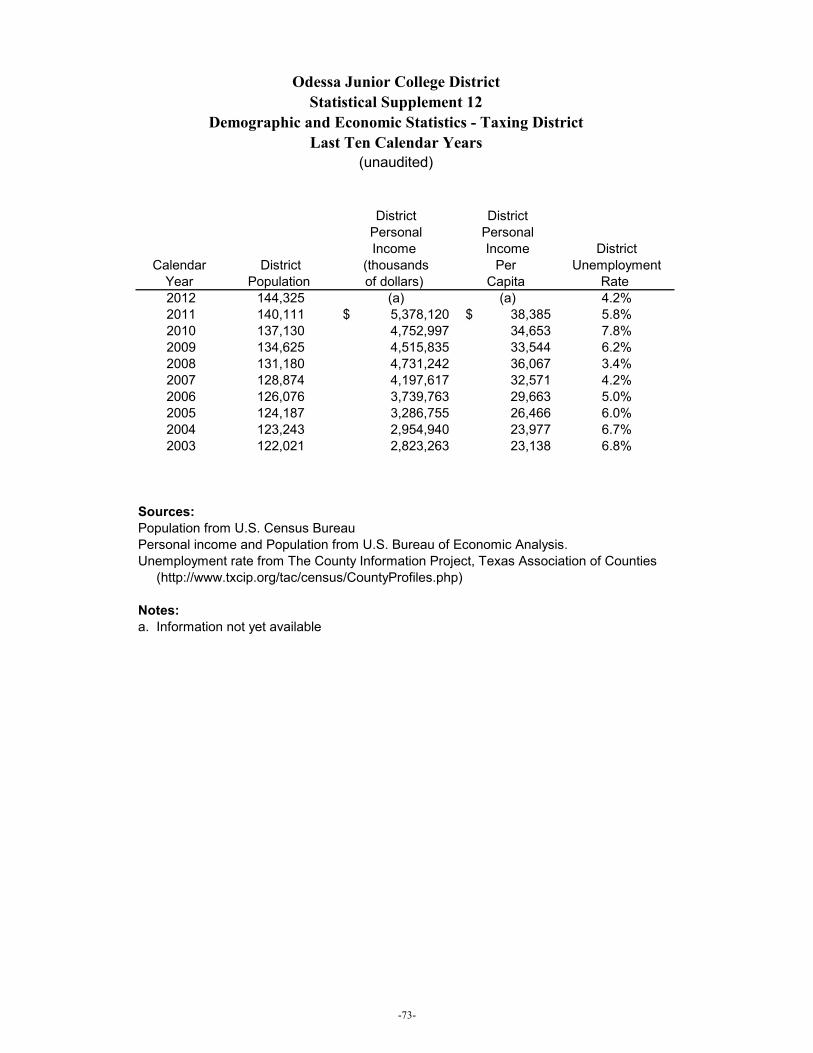
-73-
Odessa Junior College DistrictStatistical Supplement 12
Demographic and Economic Statistics - Taxing DistrictLast Ten Calendar Years
(unaudited)
District DistrictPersonal PersonalIncome Income District
Calendar District (thousands Per UnemploymentYear Population of dollars) Capita Rate 2012 144,325 (a) (a) 4.2%2011 140,111 5,378,120$ 38,385$ 5.8%2010 137,130 4,752,997 34,653 7.8%2009 134,625 4,515,835 33,544 6.2%2008 131,180 4,731,242 36,067 3.4%2007 128,874 4,197,617 32,571 4.2%2006 126,076 3,739,763 29,663 5.0%2005 124,187 3,286,755 26,466 6.0%2004 123,243 2,954,940 23,977 6.7%2003 122,021 2,823,263 23,138 6.8%
Sources:Population from U.S. Census BureauPersonal income and Population from U.S. Bureau of Economic Analysis.Unemployment rate from The County Information Project, Texas Association of Counties (http://www.txcip.org/tac/census/CountyProfiles.php)
Notes:a. Information not yet available