集 understanding the smart cities mission in india
TRANSCRIPT

特 集
(JNNURM) that was criticized for its disparity in funding across city sizes (Khan, 2017)6. The JNNURM was the largest urban development program that was launched in 2005 and covered infrastructural development in both big cities and small towns. With the change in government in 2014, the JNNURM was replaced by the Atal Mission for Rejuvenation and Urban Transformation (AMRUT) to focus on 500 class I cities (1 lakh and above population). Whereas the Smart Cities Mission was launched as a “bold, new initiative” to implement projects that accompanied smart technologies (MoUD, 2015)7. In this manner, it was supposed to be a departure from both the JNNURM and the AMRUT.
The article begins by analyzing the project details of the top 60 cities to reveal that the mission is a continuation of the city development strategy of the JNNURM and largely covers traditional infrastructure projects with few focusing on IT solutions. Therefore, there is also an overlap of objectives with other current urban schemes that are focusing on similar projects. Moreover, much like the JNNURM, the SCM also suffers from slow disbursement of central funds caused by similar roadblocks that are discussed later in the article.
2. Projects and Costs8
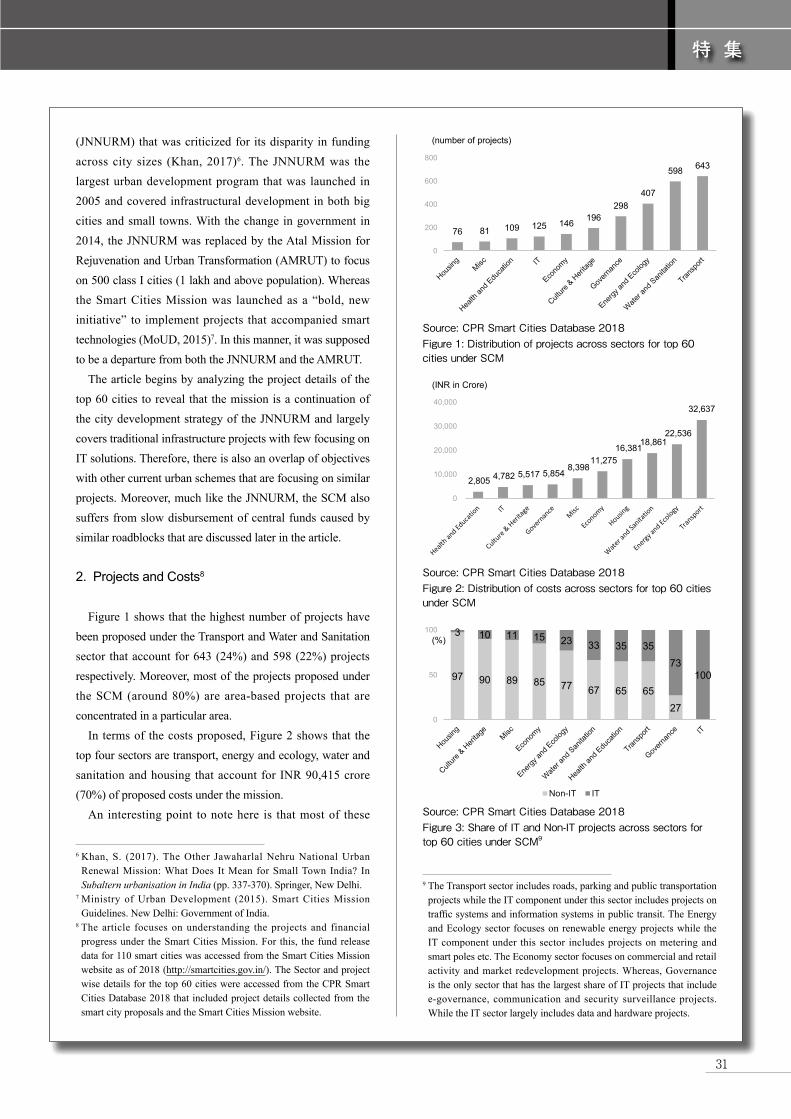
Figure 1 shows that the highest number of projects have been proposed under the Transport and Water and Sanitation sector that account for 643 (24%) and 598 (22%) projects respectively. Moreover, most of the projects proposed under the SCM (around 80%) are area-based projects that are concentrated in a particular area.
In terms of the costs proposed, Figure 2 shows that the top four sectors are transport, energy and ecology, water and sanitation and housing that account for INR 90,415 crore (70%) of proposed costs under the mission.
An interesting point to note here is that most of these
6 Khan, S. (2017). The Other Jawaharlal Nehru National Urban Renewal Mission: What Does It Mean for Small Town India? In Subaltern urbanisation in India (pp. 337-370). Springer, New Delhi.
7 Ministry of Urban Development (2015). Smart Cities Mission Guidelines. New Delhi: Government of India.
8 The article focuses on understanding the projects and financial progress under the Smart Cities Mission. For this, the fund release data for 110 smart cities was accessed from the Smart Cities Mission website as of 2018 (http://smartcities.gov.in/). The Sector and project wise details for the top 60 cities were accessed from the CPR Smart Cities Database 2018 that included project details collected from the smart city proposals and the Smart Cities Mission website.
特
集
The word ‘smart’ has come to be associated with urban governance in the early 2000s when having embraced the digital age, governments world over wanted to subsume it in governance and service provision as well. India specifically becomes a special case in this regard, with growing urbanization and an increasingly aspirational urban middle class that desires better services. The launch of the Smart Cities Mission (SCM) in 2015 was almost seen as a natural transition to be a part of this growing movement towards globalization and modernization. The mission guidelines however identified that there is no universally accepted definition of a Smart City and it can vary from country to country. But the guidelines did articulate that the aim of the Smart Cities Mission is to “drive economic growth and improve the quality of life of people by enabling local area development and harnessing technology, especially technology that leads to Smart outcomes” (MoUD, 2015)1. The aim of the mission was to use Information and Communication Technologies (ICTs) to help cites make better use of their resources.
To achieve this, candidate cities were expected to propose two types of interventions. The first one is to focus on “area-based development” that will transform an existing area (retrofit and redevelop) and that should ultimately serve as an example for the entire city. The second form of intervention “pan-city” includes projects using smart technical solutions that will be rolled out throughout the city (video surveillance systems, integrated road traffic management, etc.). Given the challenges in developing smart cities, the government selected only ‘capable cities’ through multiple selection rounds. Therefore, 100 cities were selected through 4 rounds of competition based on the proposals submitted by each of the candidate cities. However later the list was updated to 110 cities. The increase in the number of cities allowed for
*Please note that the views expressed in this presentation are my own, and do not necessarily represent the opinion of the Centre for Policy Research.
Sama Khan is Research Associate at the Centre for Policy Research, New Delhi. Her areas of research include urban policy and its implementation across centrally sponsored schemes.
Sama Khan*
Research AssociateCentre for Policy Research
state capitals to enter the competition (Taraporevala, 2018)2.
1. Funding
A total investment of INR 201,981 crore (crore = ten million) has been proposed by the 99 cities under their smart city plans. The central government has allocated INR 48,000 crore over a period of five years, which represents an average of INR 100 crore per year and per city and an equal amount, on a matching basis, will have to be contributed by the State/Urban Local Body (ULB) (MoUD, 2015)3. Therefore INR 1,000 crore will be available for each smart city over a period of 5 years. While the centre and state contribution will only be a part of the project cost, the remaining funds will be mobilized from states/ULBs own resources from collection of user fees, beneficiary charges, loans etc., other central schemes like Swachh Bharat Mission (SBM), Atal Mission for Rejuvenation and Urban Transformation (AMRUT) etc., private sector through PPPs, innovative finance mechanisms like municipal bonds and borrowings from financial institutions (MoUD, 2015)4.
Moreover, the funds for the mission are channeled through a Special Purpose Vehicle (SPV) created under the Companies Act (2013) that will manage the implementation of projects under the Mission. The majority shareholding and control of the SPV rests with government bodies (MoUD, 2015)5. Therefore, the smart cities mission introduced parity in funding across city sizes, which was a major departure from previous urban development programs like the Jawaharlal Nehru National Urban Renewal Mission
Understanding the Smart Cities Mission in India
第2次モディ政権下のインドの行方
1 Ministry of Urban Development (2015). Smart Cities Mission Guidelines. New Delhi: Government of India.
2 Taraporevala, P. (2018). Demystifying the Indian Smart City: An Empirical Reading of the Smart Cities Mission. Working Paper, Centre for Policy Research, New Delhi.
3 Ministry of Urban Development (2015). Smart Cities Mission Guidelines. New Delhi: Government of India.
4 Ibid.5 Ibid.
76 81 109 125 146 196298
407
598 643
0
200
400
600
800
(number of projects)
Figure 1: Distribution of projects across sectors for top 60 cities under SCM
Source: CPR Smart Cities Database 2018
97 90 89 85 77 67 65 6527
3 10 11 15 23 33 35 3573
100
0
50
100
Non-IT IT
(%)
Figure 3: Share of IT and Non-IT projects across sectors for top 60 cities under SCM9
Source: CPR Smart Cities Database 2018
2,805 4,782 5,517 5,854 8,398
11,275 16,381
18,861 22,536
32,637
0
10,000
20,000
30,000
40,000
(INR in Crore)
Figure 2: Distribution of costs across sectors for top 60 cities under SCM
Source: CPR Smart Cities Database 2018
9 The Transport sector includes roads, parking and public transportation projects while the IT component under this sector includes projects on traffic systems and information systems in public transit. The Energy and Ecology sector focuses on renewable energy projects while the IT component under this sector includes projects on metering and smart poles etc. The Economy sector focuses on commercial and retail activity and market redevelopment projects. Whereas, Governance is the only sector that has the largest share of IT projects that include e-governance, communication and security surveillance projects. While the IT sector largely includes data and hardware projects.
30 31
特 集
(JNNURM) that was criticized for its disparity in funding across city sizes (Khan, 2017)6. The JNNURM was the largest urban development program that was launched in 2005 and covered infrastructural development in both big cities and small towns. With the change in government in 2014, the JNNURM was replaced by the Atal Mission for Rejuvenation and Urban Transformation (AMRUT) to focus on 500 class I cities (1 lakh and above population). Whereas the Smart Cities Mission was launched as a “bold, new initiative” to implement projects that accompanied smart technologies (MoUD, 2015)7. In this manner, it was supposed to be a departure from both the JNNURM and the AMRUT.
The article begins by analyzing the project details of the top 60 cities to reveal that the mission is a continuation of the city development strategy of the JNNURM and largely covers traditional infrastructure projects with few focusing on IT solutions. Therefore, there is also an overlap of objectives with other current urban schemes that are focusing on similar projects. Moreover, much like the JNNURM, the SCM also suffers from slow disbursement of central funds caused by similar roadblocks that are discussed later in the article.
2. Projects and Costs8
Figure 1 shows that the highest number of projects have been proposed under the Transport and Water and Sanitation sector that account for 643 (24%) and 598 (22%) projects respectively. Moreover, most of the projects proposed under the SCM (around 80%) are area-based projects that are concentrated in a particular area.
In terms of the costs proposed, Figure 2 shows that the top four sectors are transport, energy and ecology, water and sanitation and housing that account for INR 90,415 crore (70%) of proposed costs under the mission.
An interesting point to note here is that most of these
6 Khan, S. (2017). The Other Jawaharlal Nehru National Urban Renewal Mission: What Does It Mean for Small Town India? In Subaltern urbanisation in India (pp. 337-370). Springer, New Delhi.
7 Ministry of Urban Development (2015). Smart Cities Mission Guidelines. New Delhi: Government of India.
8 The article focuses on understanding the projects and financial progress under the Smart Cities Mission. For this, the fund release data for 110 smart cities was accessed from the Smart Cities Mission website as of 2018 (http://smartcities.gov.in/). The Sector and project wise details for the top 60 cities were accessed from the CPR Smart Cities Database 2018 that included project details collected from the smart city proposals and the Smart Cities Mission website.
特
集
The word ‘smart’ has come to be associated with urban governance in the early 2000s when having embraced the digital age, governments world over wanted to subsume it in governance and service provision as well. India specifically becomes a special case in this regard, with growing urbanization and an increasingly aspirational urban middle class that desires better services. The launch of the Smart Cities Mission (SCM) in 2015 was almost seen as a natural transition to be a part of this growing movement towards globalization and modernization. The mission guidelines however identified that there is no universally accepted definition of a Smart City and it can vary from country to country. But the guidelines did articulate that the aim of the Smart Cities Mission is to “drive economic growth and improve the quality of life of people by enabling local area development and harnessing technology, especially technology that leads to Smart outcomes” (MoUD, 2015)1. The aim of the mission was to use Information and Communication Technologies (ICTs) to help cites make better use of their resources.
To achieve this, candidate cities were expected to propose two types of interventions. The first one is to focus on “area-based development” that will transform an existing area (retrofit and redevelop) and that should ultimately serve as an example for the entire city. The second form of intervention “pan-city” includes projects using smart technical solutions that will be rolled out throughout the city (video surveillance systems, integrated road traffic management, etc.). Given the challenges in developing smart cities, the government selected only ‘capable cities’ through multiple selection rounds. Therefore, 100 cities were selected through 4 rounds of competition based on the proposals submitted by each of the candidate cities. However later the list was updated to 110 cities. The increase in the number of cities allowed for
*Please note that the views expressed in this presentation are my own, and do not necessarily represent the opinion of the Centre for Policy Research.
Sama Khan is Research Associate at the Centre for Policy Research, New Delhi. Her areas of research include urban policy and its implementation across centrally sponsored schemes.
Sama Khan*
Research AssociateCentre for Policy Research
state capitals to enter the competition (Taraporevala, 2018)2.
1. Funding
A total investment of INR 201,981 crore (crore = ten million) has been proposed by the 99 cities under their smart city plans. The central government has allocated INR 48,000 crore over a period of five years, which represents an average of INR 100 crore per year and per city and an equal amount, on a matching basis, will have to be contributed by the State/Urban Local Body (ULB) (MoUD, 2015)3. Therefore INR 1,000 crore will be available for each smart city over a period of 5 years. While the centre and state contribution will only be a part of the project cost, the remaining funds will be mobilized from states/ULBs own resources from collection of user fees, beneficiary charges, loans etc., other central schemes like Swachh Bharat Mission (SBM), Atal Mission for Rejuvenation and Urban Transformation (AMRUT) etc., private sector through PPPs, innovative finance mechanisms like municipal bonds and borrowings from financial institutions (MoUD, 2015)4.
Moreover, the funds for the mission are channeled through a Special Purpose Vehicle (SPV) created under the Companies Act (2013) that will manage the implementation of projects under the Mission. The majority shareholding and control of the SPV rests with government bodies (MoUD, 2015)5. Therefore, the smart cities mission introduced parity in funding across city sizes, which was a major departure from previous urban development programs like the Jawaharlal Nehru National Urban Renewal Mission
Understanding the Smart Cities Mission in India
第2次モディ政権下のインドの行方
1 Ministry of Urban Development (2015). Smart Cities Mission Guidelines. New Delhi: Government of India.
2 Taraporevala, P. (2018). Demystifying the Indian Smart City: An Empirical Reading of the Smart Cities Mission. Working Paper, Centre for Policy Research, New Delhi.
3 Ministry of Urban Development (2015). Smart Cities Mission Guidelines. New Delhi: Government of India.
4 Ibid.5 Ibid.
76 81 109 125 146 196298
407
598 643
0
200
400
600
800
(number of projects)
Figure 1: Distribution of projects across sectors for top 60 cities under SCM
Source: CPR Smart Cities Database 2018
97 90 89 85 77 67 65 6527
3 10 11 15 23 33 35 3573
100
0
50
100
Non-IT IT
(%)
Figure 3: Share of IT and Non-IT projects across sectors for top 60 cities under SCM9
Source: CPR Smart Cities Database 2018
2,805 4,782 5,517 5,854 8,398
11,275 16,381
18,861 22,536
32,637
0
10,000
20,000
30,000
40,000
(INR in Crore)
Figure 2: Distribution of costs across sectors for top 60 cities under SCM
Source: CPR Smart Cities Database 2018
9 The Transport sector includes roads, parking and public transportation projects while the IT component under this sector includes projects on traffic systems and information systems in public transit. The Energy and Ecology sector focuses on renewable energy projects while the IT component under this sector includes projects on metering and smart poles etc. The Economy sector focuses on commercial and retail activity and market redevelopment projects. Whereas, Governance is the only sector that has the largest share of IT projects that include e-governance, communication and security surveillance projects. While the IT sector largely includes data and hardware projects.
30 31
特 集
第2次モディ政権下のインドの行方
per Smart Cities Council India (SCCI), half of the 23 cities surveyed did not generate enough revenue internally to even pay for the salaries of their municipal staff. Although a third of municipal staff positions remain vacant (Khan, 2019)12. Similar issues were raised during the implementation of the JNNURM that highlighted the lack of municipal capacity and the excessive reliance on parastatal agencies as a major hindrance to project planning and implementation (Sivaramakrishnan, 2011)13. Similarly, even though the setting up of an SPV to implement and manage projects was meant to ease the burden of municipalities but the SPV is also largely controlled by state governments and reflects a deep mistrust of decentralization (Khan et al, 2018)14. Moreover, the structure of the SPV encourages the inclusion of external consultants with little provision for in-house technical staff that only adds external institutional presence instead of strengthening municipalities (Praharaj et al, 2018)15. Therefore the understanding that till cities can finance and govern themselves effectively, it will be challenging to execute any policy successfully holds true even today.
5. Conclusion
The Smart Cities Mission was a novel concept that challenged our traditional attitudes towards urban planning and development. But in execution, it is a continuation of the infrastructure development strategy of the JNNURM as it covers a larger share of conventional infrastructure projects and thereby reveals an overlap of objectives with other urban infrastructure development schemes. Moreover, the slow release of funds under the SCM points to similar roadblocks that were uncovered by the JNNURM highlighting the lack of municipal capacity in preparing cities to be financially and technically self-sufficient to implement and plan schemes that are bold and unique to the local mindset. A major principle
of the JNNURM was to build the inherent capacities of cities for management as cities have the financial and technical resources to rebuild themselves but it failed to do so and instead relied heavily on parastatal agencies for project implementation. Similarly, the structure of the SPV also reflects greater control of state governments. Whereas the Smart Cities Mission should have learnt from the drawbacks of the JNNURM to empower local governments instead of overriding their authority in local planning and development.
projects are basic infrastructure projects as shown in Figure 3. Figure 3 shows that around 33% of the projects in the water and sanitation sector have an IT component and are largely focused on water metering and sanitation ICTs. Whereas around 67% of the remaining projects are largely basic infrastructure projects already covered under urban schemes like the AMRUT for infrastructural development (water supply, sewerage) and the Swachh Bharat Mission (SBM) for solid waste management and toilet construction. Even under housing, many projects are traditional housing construction projects already admissible under the Pradhan Mantri Awas Yojana (PMAY) housing scheme for the urban poor.
3. Overlap of objectives across urban schemes
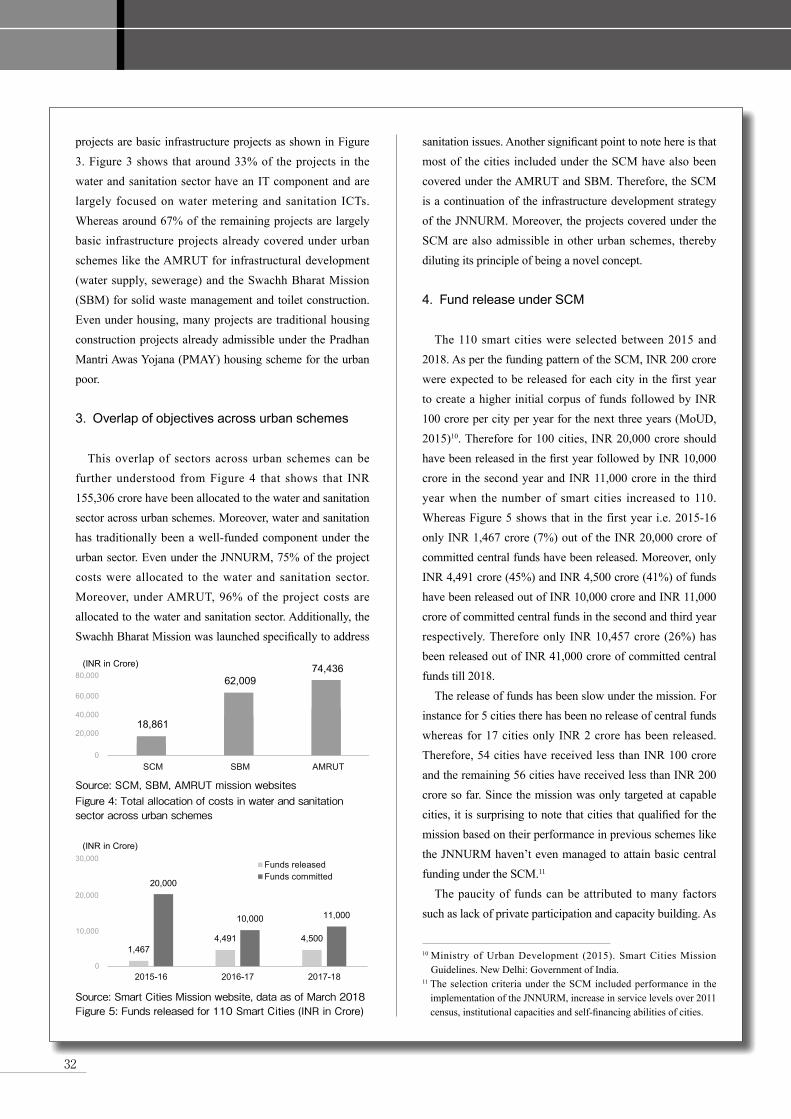
This overlap of sectors across urban schemes can be further understood from Figure 4 that shows that INR 155,306 crore have been allocated to the water and sanitation sector across urban schemes. Moreover, water and sanitation has traditionally been a well-funded component under the urban sector. Even under the JNNURM, 75% of the project costs were allocated to the water and sanitation sector. Moreover, under AMRUT, 96% of the project costs are allocated to the water and sanitation sector. Additionally, the Swachh Bharat Mission was launched specifically to address
sanitation issues. Another significant point to note here is that most of the cities included under the SCM have also been covered under the AMRUT and SBM. Therefore, the SCM is a continuation of the infrastructure development strategy of the JNNURM. Moreover, the projects covered under the SCM are also admissible in other urban schemes, thereby diluting its principle of being a novel concept.
4. Fund release under SCM
The 110 smart cities were selected between 2015 and 2018. As per the funding pattern of the SCM, INR 200 crore were expected to be released for each city in the first year to create a higher initial corpus of funds followed by INR 100 crore per city per year for the next three years (MoUD, 2015)10. Therefore for 100 cities, INR 20,000 crore should have been released in the first year followed by INR 10,000 crore in the second year and INR 11,000 crore in the third year when the number of smart cities increased to 110. Whereas Figure 5 shows that in the first year i.e. 2015-16 only INR 1,467 crore (7%) out of the INR 20,000 crore of committed central funds have been released. Moreover, only INR 4,491 crore (45%) and INR 4,500 crore (41%) of funds have been released out of INR 10,000 crore and INR 11,000 crore of committed central funds in the second and third year respectively. Therefore only INR 10,457 crore (26%) has been released out of INR 41,000 crore of committed central funds till 2018.
The release of funds has been slow under the mission. For instance for 5 cities there has been no release of central funds whereas for 17 cities only INR 2 crore has been released. Therefore, 54 cities have received less than INR 100 crore and the remaining 56 cities have received less than INR 200 crore so far. Since the mission was only targeted at capable cities, it is surprising to note that cities that qualified for the mission based on their performance in previous schemes like the JNNURM haven’t even managed to attain basic central funding under the SCM.11
The paucity of funds can be attributed to many factors such as lack of private participation and capacity building. As
10 Ministry of Urban Development (2015). Smart Cities Mission Guidelines. New Delhi: Government of India.
11 The selection criteria under the SCM included performance in the implementation of the JNNURM, increase in service levels over 2011 census, institutional capacities and self-financing abilities of cities.
12 Khan, Sobia (2019). Smart cities mission hit by funding blocks. Retrieved from Economic Times: https://economictimes.indiatimes.com/news/economy/infrastructure/smart-cities-mission-hit-by-funding-blocks/articleshow/71306563.cms?from=mdr
13 Sivaramakrishnan, K. C. (2011). Re-visioning Indian cities: The urban renewal mission. SAGE Publications India.
14 Khan, Sama. Taraporevala, Persis and Zérah, Marie-Hélène (2018) Mission Impossible: Defining Indian Smart Cities. Economic and political weekly, Vol. 53, Issue No. 49, 82-88
15 Praharaj, S., Han, J. H., & Hawken, S. (2018). Urban innovation through policy integration: critical perspectives from 100 smart cities mission in India. City, culture and society, 12, 35-43.
0
20,000
60,000
80,000
40,000
SCM SBM AMRUT
(INR in Crore)
18,861
62,009 74,436
Figure 4: Total allocation of costs in water and sanitation sector across urban schemes
Source: SCM, SBM, AMRUT mission websites
1,467 4,491 4,500
20,000
10,000 11,000
0
10,000
20,000
30,000
2015-16 2016-17 2017-18
Funds releasedFunds committed
(INR in Crore)
Source: Smart Cities Mission website, data as of March 2018Figure 5: Funds released for 110 Smart Cities (INR in Crore)
32 33

特 集
第2次モディ政権下のインドの行方
per Smart Cities Council India (SCCI), half of the 23 cities surveyed did not generate enough revenue internally to even pay for the salaries of their municipal staff. Although a third of municipal staff positions remain vacant (Khan, 2019)12. Similar issues were raised during the implementation of the JNNURM that highlighted the lack of municipal capacity and the excessive reliance on parastatal agencies as a major hindrance to project planning and implementation (Sivaramakrishnan, 2011)13. Similarly, even though the setting up of an SPV to implement and manage projects was meant to ease the burden of municipalities but the SPV is also largely controlled by state governments and reflects a deep mistrust of decentralization (Khan et al, 2018)14. Moreover, the structure of the SPV encourages the inclusion of external consultants with little provision for in-house technical staff that only adds external institutional presence instead of strengthening municipalities (Praharaj et al, 2018)15. Therefore the understanding that till cities can finance and govern themselves effectively, it will be challenging to execute any policy successfully holds true even today.
5. Conclusion
The Smart Cities Mission was a novel concept that challenged our traditional attitudes towards urban planning and development. But in execution, it is a continuation of the infrastructure development strategy of the JNNURM as it covers a larger share of conventional infrastructure projects and thereby reveals an overlap of objectives with other urban infrastructure development schemes. Moreover, the slow release of funds under the SCM points to similar roadblocks that were uncovered by the JNNURM highlighting the lack of municipal capacity in preparing cities to be financially and technically self-sufficient to implement and plan schemes that are bold and unique to the local mindset. A major principle
of the JNNURM was to build the inherent capacities of cities for management as cities have the financial and technical resources to rebuild themselves but it failed to do so and instead relied heavily on parastatal agencies for project implementation. Similarly, the structure of the SPV also reflects greater control of state governments. Whereas the Smart Cities Mission should have learnt from the drawbacks of the JNNURM to empower local governments instead of overriding their authority in local planning and development.
projects are basic infrastructure projects as shown in Figure 3. Figure 3 shows that around 33% of the projects in the water and sanitation sector have an IT component and are largely focused on water metering and sanitation ICTs. Whereas around 67% of the remaining projects are largely basic infrastructure projects already covered under urban schemes like the AMRUT for infrastructural development (water supply, sewerage) and the Swachh Bharat Mission (SBM) for solid waste management and toilet construction. Even under housing, many projects are traditional housing construction projects already admissible under the Pradhan Mantri Awas Yojana (PMAY) housing scheme for the urban poor.
3. Overlap of objectives across urban schemes
This overlap of sectors across urban schemes can be further understood from Figure 4 that shows that INR 155,306 crore have been allocated to the water and sanitation sector across urban schemes. Moreover, water and sanitation has traditionally been a well-funded component under the urban sector. Even under the JNNURM, 75% of the project costs were allocated to the water and sanitation sector. Moreover, under AMRUT, 96% of the project costs are allocated to the water and sanitation sector. Additionally, the Swachh Bharat Mission was launched specifically to address
sanitation issues. Another significant point to note here is that most of the cities included under the SCM have also been covered under the AMRUT and SBM. Therefore, the SCM is a continuation of the infrastructure development strategy of the JNNURM. Moreover, the projects covered under the SCM are also admissible in other urban schemes, thereby diluting its principle of being a novel concept.
4. Fund release under SCM
The 110 smart cities were selected between 2015 and 2018. As per the funding pattern of the SCM, INR 200 crore were expected to be released for each city in the first year to create a higher initial corpus of funds followed by INR 100 crore per city per year for the next three years (MoUD, 2015)10. Therefore for 100 cities, INR 20,000 crore should have been released in the first year followed by INR 10,000 crore in the second year and INR 11,000 crore in the third year when the number of smart cities increased to 110. Whereas Figure 5 shows that in the first year i.e. 2015-16 only INR 1,467 crore (7%) out of the INR 20,000 crore of committed central funds have been released. Moreover, only INR 4,491 crore (45%) and INR 4,500 crore (41%) of funds have been released out of INR 10,000 crore and INR 11,000 crore of committed central funds in the second and third year respectively. Therefore only INR 10,457 crore (26%) has been released out of INR 41,000 crore of committed central funds till 2018.
The release of funds has been slow under the mission. For instance for 5 cities there has been no release of central funds whereas for 17 cities only INR 2 crore has been released. Therefore, 54 cities have received less than INR 100 crore and the remaining 56 cities have received less than INR 200 crore so far. Since the mission was only targeted at capable cities, it is surprising to note that cities that qualified for the mission based on their performance in previous schemes like the JNNURM haven’t even managed to attain basic central funding under the SCM.11
The paucity of funds can be attributed to many factors such as lack of private participation and capacity building. As
10 Ministry of Urban Development (2015). Smart Cities Mission Guidelines. New Delhi: Government of India.
11 The selection criteria under the SCM included performance in the implementation of the JNNURM, increase in service levels over 2011 census, institutional capacities and self-financing abilities of cities.
12 Khan, Sobia (2019). Smart cities mission hit by funding blocks. Retrieved from Economic Times: https://economictimes.indiatimes.com/news/economy/infrastructure/smart-cities-mission-hit-by-funding-blocks/articleshow/71306563.cms?from=mdr
13 Sivaramakrishnan, K. C. (2011). Re-visioning Indian cities: The urban renewal mission. SAGE Publications India.
14 Khan, Sama. Taraporevala, Persis and Zérah, Marie-Hélène (2018) Mission Impossible: Defining Indian Smart Cities. Economic and political weekly, Vol. 53, Issue No. 49, 82-88
15 Praharaj, S., Han, J. H., & Hawken, S. (2018). Urban innovation through policy integration: critical perspectives from 100 smart cities mission in India. City, culture and society, 12, 35-43.
0
20,000
60,000
80,000
40,000
SCM SBM AMRUT
(INR in Crore)
18,861
62,009 74,436
Figure 4: Total allocation of costs in water and sanitation sector across urban schemes
Source: SCM, SBM, AMRUT mission websites
1,467 4,491 4,500
20,000
10,000 11,000
0
10,000
20,000
30,000
2015-16 2016-17 2017-18
Funds releasedFunds committed
(INR in Crore)
Source: Smart Cities Mission website, data as of March 2018Figure 5: Funds released for 110 Smart Cities (INR in Crore)
32 33