بسم الله الرحمن الرحيم. simulation of photon beam interaction with the zubal head...
TRANSCRIPT

بسم الله الرحمن الرحيم

Simulation of Photon Beam Interaction with the ZUBAL
Head Phantom
Presented by: Mostafa Hossni El-Soubki
Plan-UNC-Image plotter

Outline
1. Preparing the phantom and Converting to MCNP using the MATLAB software
2. Commissioning the geometry
3. Dealing with MATLAB GI to view the output data.
4. Transfer the phantom to plan-UNC, and compare the same plan with MCNP
5. Conclusion
6. References.

Preparing the Phantom
• Maximum number of cells allowed is 99999• (#cells x-axis * #cells y-axis* #cells z-axis)<99999

Preparing the Phantom
• The voxels outside the head have been excluded
Fig-4 (By image-j)

Preparing the Phantom
• The slice matrix has to be resized
Slice 23 after resizing from 59*40 to 50*37

Preparing the Phantom
• Material indexing has to be adjusted for MCNP.
Fig-5

Preparing the PhantomMaterial # Organ Material # Organ
1 outside phantom 86 medulla oblongata2 skin 23 fat3 brain 24 blood pool4 spinal cord 27 bone marrow5 skull 92 pons6 spine 30 trachea
71 dens of axis 31 cartilage72 jaw bone 100 uncus (ear bones)10 skeletal muscle 105 sinuses/mouth cavity75 lachrymal glands 107 optic nerve76 spinal canal 114 cerebral falx77 hard palate 120 eye78 cerebellum 122 lens79 tongue 123 cerebral aqueduct16 pharynx 126 teeth17 esophagus

Preparing the Phantom• Converting all slices to MCNP
Converting From material excel sheets to MCNP.

Validating the Geometry
Applied Beam:
• SSD =100cm
• Field size = 5x5 cm2.
• Photon Beam energy = 6 MV

Validation in a Water Phantom
Fig-11
Blue is air.
Blue sky is water
Primary collimator
Ion chambers
Light mirror
X-y jaws
Light field reticle (MYLER)
Voxel volume = 0.5*0.5*0.5 cm3
Phantom volume= 30* 30 * 30 cm3

Percent Depth Dose Comparison
Fig-21
PDD% for 6mv LINAK 5x5 cm2 at 100cm SSD
0.000
10.000
20.000
30.000
40.000
50.000
60.000
70.000
80.000
90.000
100.000
0 5 10 15 20 25 30 35
MCNP 5x5 cm2 6MV PDD%
ion chamber 6mv 5x5
Diference
dmax=1.5 cm

Percent Depth Dose Comparison
6mv PDD 5x5 cm2 100cm SSD
0.000
10.000
20.000
30.000
40.000
50.000
60.000
70.000
80.000
90.000
100.000
0 5 10 15 20 25
Depth cm
PD
D% MCNP 6MV 5x5 PDD %
planUNC PDD
Differnce
dmax=1.5cm
Fig-24

PDD Comparison
beam energy 6MV dmax=1.5 cm
field size cm2 depth cm PDD% ±ΔPDD
5*5 1.5 100 0.70
5*5 5 85 0.60
5*5 10 63.8 0.48
10*10 1.5 100 1.018
10*10 5 86.9 0.92
10*10 10 67.5 0.77

Beam Profile Comparison
6MV beam Profile for 5x5 cm2 at differnt depths
0.00
0.10
0.20
0.30
0.40
0.50
0.60
0.70
0.80
0.90
1.00
-20 -15 -10 -5 0 5 10 15 20
off axis cm
pro
file Profile at dmax 1.5cm
profile at 5cm depth
profile at 10cm depth

Measured and Simulated Profile at 1.5cm Depth (Field Size 5x5 cm2)
0
10
20
30
40
50
60
70
80
90
100
-5 -4 -3 -2 -1 0 1 2 3 4 5
pro
file
%
off axis
6MV measured profile% at dmax
MCNP 6MV profile at dmax depth
Difference %

Measured and Simulated Profile at 5 cm Depth (Field Size 5x5 cm2)
0.00
10.00
20.00
30.00
40.00
50.00
60.00
70.00
80.00
90.00
100.00
-5 -4 -3 -2 -1 0 1 2 3 4 5
pro
file
%
off axis cm
6MV measured profile% at 5cm depth
MCNP 6MV profile 5 cm depth
Diifernce %

Measured and Simulated Profile at 10 cm Depth (Field Size 5x5 cm2)
0.00
10.00
20.00
30.00
40.00
50.00
60.00
70.00
80.00
90.00
100.00
-5 -4 -3 -2 -1 0 1 2 3 4 5
pro
file
%
of axis cm
6MV measured profile% at 10cm depth
6MV MCNP profile% at 10 cm depth
Difference %

6 MV Beam Interaction with Head Phantom
Applied Beam:
• SSD =100 cm
• Field size =5x5 cm2
• Photon Beam energy = 6 Mev

Transverse Cross Section
Fig-25 slice-8 (MCNP- MATLAB GUI)

Coronal Cross Section

Transfer the Phantom to Plan-UNC
MCNP
Plan-UNC
converting to dicom
converting to excel sheets

Beam Setup of Head Phantom in Plan-UNC
SSD = 100 cm at slice number 8.Field size = 5 x 5 cm2.Photon Beam energy = 6 Mev

Central PDD
PDD% for 6mv LINAK 5x5 cm2 at 100cm SSD for slice-8
0.000
10.000
20.000
30.000
40.000
50.000
60.000
70.000
80.000
90.000
100.000
0 2 4 6 8 10 12 14 16 18
MCNP slice-8 6MV 5x5 PDD %
plan-UNC slice8 PDD
Differnce
Inhomogeneous region
Fig-27Central PDD of slice-8
Fig-28 the inhomogeneous region in slice 8
Skull bones at 2cm depth

Isodose Lines
Plan-UNC-Image plotter
MCNPPlan-UNC
ISO-Dose levels: [ 0.98 0.95 0.9 0.7 0.5 ]
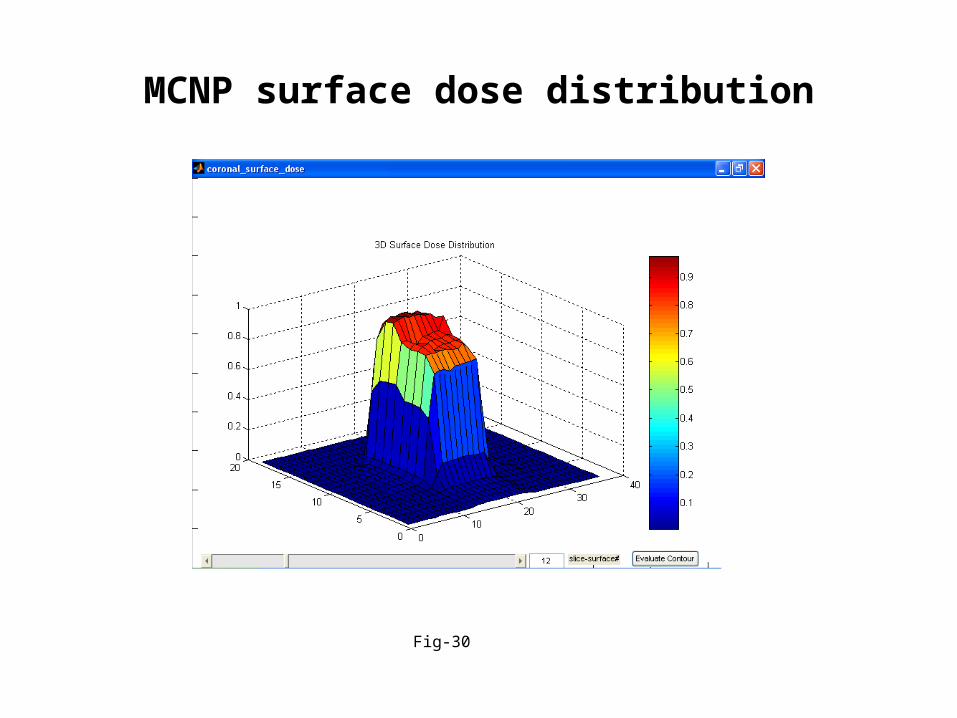
MCNP surface dose distribution
Fig-30

Conclusions
• Validation of geometry – Good agreement in PDD in decay region– Need better agreement in dose profiles in
penumbra region
• There is disagreement between MCNP and Plan UNC in the inhomogeneous regions (transition from bone to soft tissue
• Need for better quantitative methods to compare dose distribution in the phantom

References
• Visual Basic 6 MSDN library.
• Matlab7 Help.
• http://noodle.med.yale.edu/phantom/getdata.htm (ZUBAL phantom).

Thank you