| policy brief october 2017 poster child for healthy growth child for... · amia poster child for...
TRANSCRIPT
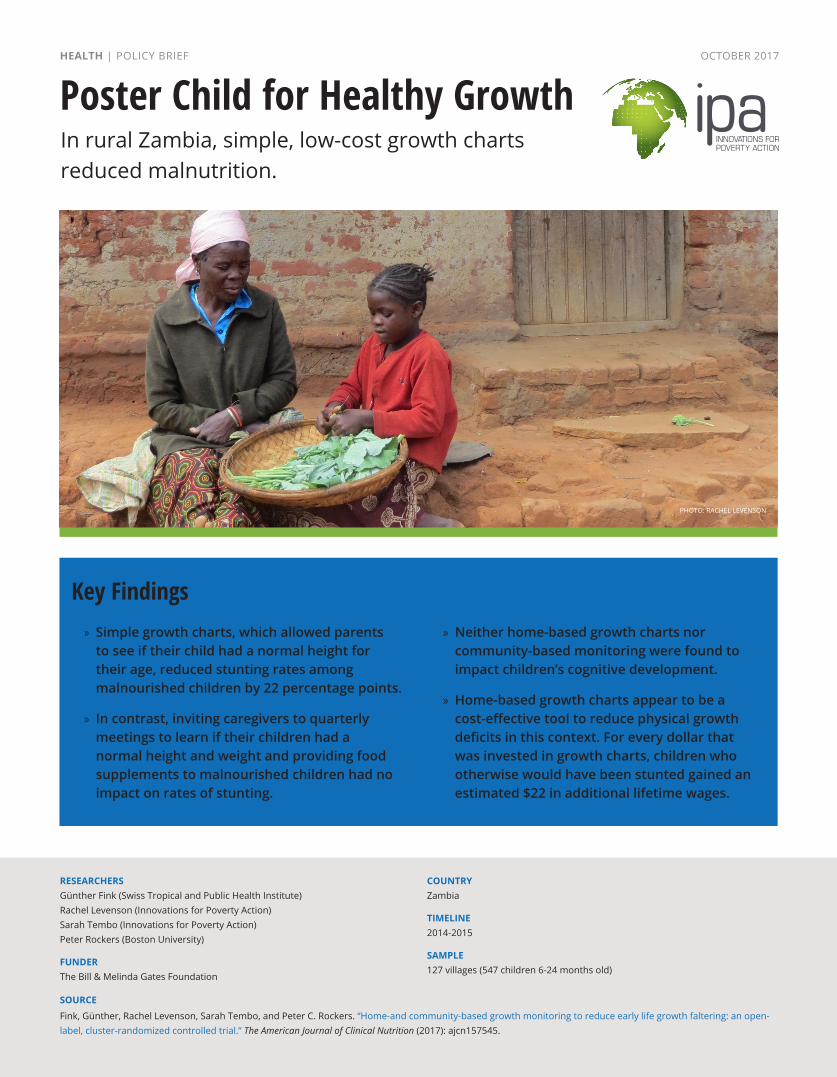
Poster Child for Healthy GrowthHEALTH | POLICY BRIEF
PHOTO: GLENNA GORDON
Key Findings » Simple growth charts, which allowed parents to see if their child had a normal height for their age, reduced stunting rates among malnourished children by 22 percentage points.
» In contrast, inviting caregivers to quarterly meetings to learn if their children had a normal height and weight and providing food supplements to malnourished children had no impact on rates of stunting.
» Neither home-based growth charts nor community-based monitoring were found to impact children’s cognitive development.
» Home-based growth charts appear to be a cost-effective tool to reduce physical growth deficits in this context. For every dollar that was invested in growth charts, children who otherwise would have been stunted gained an estimated $22 in additional lifetime wages.
RESEARCHERSGünther Fink (Swiss Tropical and Public Health Institute)Rachel Levenson (Innovations for Poverty Action) Sarah Tembo (Innovations for Poverty Action)Peter Rockers (Boston University)
FUNDERThe Bill & Melinda Gates Foundation
COUNTRYZambia
TIMELINE2014-2015
SAMPLE127 villages (547 children 6-24 months old)
In rural Zambia, simple, low-cost growth charts reduced malnutrition.
SOURCE
Fink, Günther, Rachel Levenson, Sarah Tembo, and Peter C. Rockers. “Home-and community-based growth monitoring to reduce early life growth faltering: an open-label, cluster-randomized controlled trial.” The American Journal of Clinical Nutrition (2017): ajcn157545.
PHOTO: RACHEL LEVENSON
OCTOBER 2017

Zambia: Poster Child for Healthy Growth Innovations for Poverty Action | 2
The Challenge Stunting is pervasive in ZambiaThe first 1,000 days of life comprise a critical period of physical and cognitive development. Children who experience normal physical growth and development in this period experience long-term benefits. As children they do better in school, and as adults they earn about 20 percent more in their jobs. They are also 10 percent more likely to own their own business.
Inadequate nutrition during this period can cause stunting and contribute to long-term developmental consequences that affect future productivity and well-being. According to the World Bank, the economic costs of stunting and related developmental deficits can be enormous, with countries losing up to 2 to 3 percent of their potential Gross Domestic Product (GDP) each year. Worldwide, about 167 million children under age five have stunted
growth, with prevalence rates more than 40 percent in several sub-Saharan African and South Asian countries.
The 2011 National Food and Nutrition Strategic Plan for Zambia identified as strategic priorities the prevention of stunting in children less than two years old and the early identification, treatment, and follow-up of severe acute malnutrition. The ultimate objective of the national strategy is to reduce stunting among children younger than age two from 45 percent to 30 percent, nationally.
This study took place in Chipata, in Zambia’s Eastern Province, which has traditionally been one of the poorest areas of Zambia, with an estimated 43 percent prevalence of stunting in 2013.
Community-based monitoringParents in these villages were invited to attend three community meetings, one every three months. During the community meetings—which were modeled on a standard program of community health workers—children’s height and weight were measured (pictured above) and parents received information about whether their children were below the reference measures established by the World Health Organization.
Three main messages were highlighted during the meetings: » the importance of feeding young children 4–5 times
a day, even if the quantities are not very large; » the importance of protein in children’s diet; » using roller meal (which contains some
protein) instead of the usual maize flour.
Parents of stunted children under the age of two were given micronutrient-rich food supplements, in the form of a powder called Yummy Soy, to mix into their children’s maize porridge.
Home-based growth chartsA simple growth chart poster was installed on the wall inside homes. The full-sized growth charts allowed parents to directly compare their children’s height to the expected height range for children of the same age and provided parents with information regarding the most suitable local foods.
Separate charts were designed for boys and for girls (pictured above), showing sex-specific reference standards and gender-specific healthy children on the poster. The same three key messages described above were highlighted on the charts themselves, but no supplements were distributed.
Staff installed the posters such that children standing (with support for younger children) in front of the chart could be measured relatively easily by the caregiver. To encourage routine measurement, measurement points were highlighted every 3 months starting at 9 months and ending at 30 months.
The ProgramsTwo approaches aimed at increasing parental awareness of growth deficits
2 year 6 months
__________
2 years 3 months
_________
2 years
_________
1 year 9 months
_________
1 year 6 months
_________
1 year 3 months
_________ 1 year
_________
9 months
_________
Ngati mwana wanu ali mugawo lofiira, chonde pitani naye ku chipatala chili pafupi ndi inu kapena munga tume lamya ku IPA Zambia pa nambala iyi 0976703901.
65
60
55
155
150
90
85
80
75
70
120
115
110
105
100
95
145
140
135
130
125
Satilani kakulidwe ka mwana kuti afike pa muyeso wake Kumbukani: • Nthawi zonse muyenera kusewenzesa ufa wa mgaiwa
kudyesa mwana wanu • Mwana wa thanzi ayenera kudya kanai kufikira kasanu (4-5)
pa tsiku • Ana a thanzi ndi mphavu ayenera zolimbitsa thupi, zomwe
apezamo muzakudya monga nsomba, nyama,mazira kapena soya beans
Sebenzesani zakudya zosiyana-siyana zomwe zipezeka kuno kwanu monga ndiwo za masamba, kapenta, kayela, shawa, kachamba, chinangwa, mapila, mpunga, mkaka wa fresh kapena mawisi, zipaso ndi mafuta ophikila.
PHOTO: RACHEL LEVENSON

Zambia: Poster Child for Healthy Growth Innovations for Poverty Action | 3
Results » Providing caregivers with basic growth charts in their homes significantly improved growth among malnourished children, relative to the comparison group. Villages that received growth charts experienced a 22 percentage point reduction in the prevalence of stunting among children stunted at baseline; in the comparison group, 94 percent of children who had been stunted were still stunted one year later, compared to 72 percent in the growth charts group.
» Community-based growth monitoring with nutritional supplements, on the other hand, did not reduce stunting. This finding does not seem to be due to a lack of parental interest in monitoring, as more than three-quarters of parents in the study, on average, attended the community meetings.
» Neither intervention was found to have significant impacts on child neurocognitive development. It is possible that long-term benefits may still occur—however, these benefits could not be detected in the relatively short study period.
» Caregivers in both the community monitoring and growth charts groups reported feeding their children more protein-rich foods than caregivers in the comparison group, but the growth charts program achieved larger impacts on all observed behaviors. This finding was surprising to researchers given that community meetings were held by trained health workers who reminded caregivers of the principles and importance of healthy nutrition in each session, while the caregivers in the growth charts program only received information through the posters in their homes.
» Similarly, parents who received growth charts were 15 percentage points more likely to opt for peanut butter than cash, relative to the comparison group. There was no statistically significant difference in the likelihood that parents in the community-based monitoring group would opt for peanut butter than those in the comparison group.
ARE PARENTAL ASPIRATIONS DRIVING THE IMPACTS?One of the main things caregivers said they liked about the chart was that it included an explicit focus on children who will be successful in later life. While researchers do not have data to test this directly, it is possible that the overall design of the poster increased parents’ aspirations and, in turn, their willingness to spend additional resources on their children’s nutrition. Further research is needed to better understand what is driving the impacts and the general relation between parental information, parental aspirations, and growth in early life.
The Evaluation How do the impacts of home- and community-based monitoring compare? This study took place in 127 rural, subsistence farming communities in Chipata District, in Zambia’s Eastern Province between 2014 and 2015. Five hundred and forty-seven children, between 6 and 24 months of age, were randomly assigned at the village level to either the community-based monitoring program, the home-based growth charts program, or a comparison group, which did not receive either program during the study period.
The research team measured the impact of the programs on children’s height-for-age and overall development. Trained staff members collected height, weight, and mid-upper arm circumference (MUAC) data—used to determine if someone is acutely malnourished—during the initial survey and during the follow-up survey 10 months later.
To assess the impact of the intervention on parents’ behavior when feeding their children, caregivers completed a detailed food questionnaire at the end of the study which covered child’s consumption of 1) roller meal, 2) standard flour, 3) protein and 4) breastmilk over the previous week. They also analyzed consumption of the Yummy Soy food supplements for children with stunted growth.
In addition, to test whether the interventions increased parental propensity to prefer nutritional food over cash, at the end of the study staff gave parents the choice between a small cash gift or a small jar of peanut butter (of equal value) for their children.
*statistically significant at the p < 0.05 level

Project Development: [email protected] | General Inquiries: [email protected] | www.poverty-action.org
Innovations for Poverty Action (IPA) is a research and policy non-profit that discovers and promotes effective solutions to global poverty problems. IPA designs, rigorously evaluates, and refines these solutions and their applications together with researchers and local decision-makers, ensuring that evidence is used to improve the lives of the world’s poor. Our well-established partnerships in the countries where we work, and a strong understanding of local contexts, enable us to conduct high-quality research. This research has informed hundreds of successful programs that now impact millions of individuals worldwide.
» Growth charts installed in homes appear to be a cost-effective tool to reduce stunting in Zambia and should be tested at scale.
» Further studies are needed to determine whether this intervention would work elsewhere. Although the study setting is representative of a large number of rural farming communities in South Asia and sub-Saharan Africa, the study covered only a relatively small spatial area in a single agricultural season. Further studies will be needed to verify that the growth charts are effective in other contexts and at scale.
» It is also important to investigate longer run impacts and to what extent the impacts extend into a leaner time of the agricultural cycle. The study period was relatively short—about 10 months—and ended during a period of relative abundance (after the harvest).
Policy Lessons
Writer: Laura Burke | Cost Effectiveness Analysis: Bethany Park | Designer: John Branch
A HIGH RETURN ON INVESTMENT
Given their relatively low cost, home-based growth charts appear to be a cost-effective tool to increase parental effort to reduce children’s physical growth deficits, particularly among children with stunted growth. For every dollar that was invested in growth charts,1 children who otherwise would have been stunted gained an estimated $22 in additional lifetime wages.2 Given the high cost of growth deficits to the child and to society, a low-cost tool like this is worth evaluating at scale.
1 Cost effectiveness analysis conducted by IPA according to the methodology found in Dhaliwal, I., Duflo, E., Glennerster, R., and Tulloch, C. 2012. “Comparative Cost-Effectiveness Analysis to Inform Policy in Developing Countries: A General Framework with Applications for Education.” Abdul Latif Jameel Poverty Action Lab (J-PAL), MIT. Cost data and calculations made available upon request.
2 Returns to reduced stunting calculated using data from Fink, G., Peet, E., Danaei, G., Andrews, K., Charles McCoy, D., Sudfeld, C. R., Smith, M. C., Ezzati, M., Fawzi, W. W. 2016. “Schooling and wage income lossess due to early-childhood growth faltering in developing countries: national, regional, and global estimates.” American Journal of Clinical Nutrition 104 no. 1 (July): 104-12.
PHOTO: RACHEL LEVENSONRead this evaluation’s full paper, published in The American Journal of Clinical Nutrition, here.