pna winter correlated with globally gridded temperatures (jan-feb-mar (jfm) averages 1950-2011)...
TRANSCRIPT
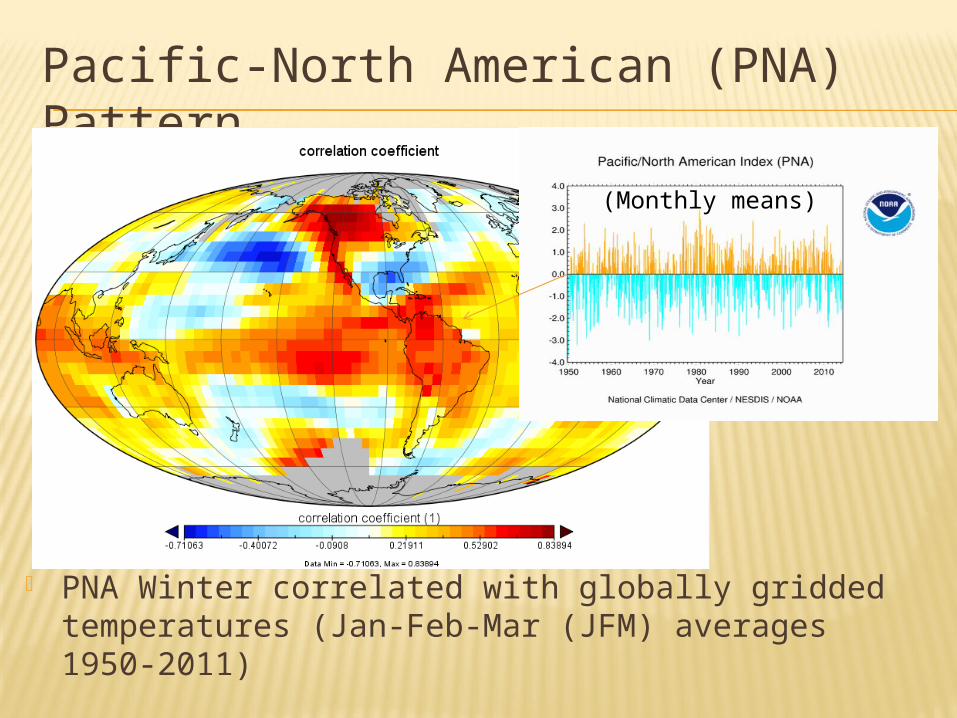
Pacific-North American (PNA) Pattern
PNA Winter correlated with globally gridded temperatures (Jan-Feb-Mar (JFM) averages 1950-2011)
(Monthly means)

The test for significant correlation
x
Calculated T-value
In this example the T value is conform with the null hypothesisthat there is no correlation. We accept H0 at the chosen twosided significance test-level of p (for example 0.05).

The test for significant correlation
x
Calculated T-value
In this example the T value is unusually far in the tails of the theoretical T-distribution for a zero correlation.We reject H0 at the chosen twosided significance test-level of p (for example 0.05)and say: there is a significant correlation at the (two-sided) 5-% significance level

Pacific-North American (PNA) Pattern
PNA Winter correlated with globally gridded temperatures (Jan-Feb-Mar (JFM) averages 1950-2011)
(Monthly means)
Masked out non-significant correlations (two-sided t-test at 5% level)

THE ROLE OF SAMPLE SIZE FOR SIGNIFICANCE TESTS (CORRELATION)
As can be seen, the test value T depends on the sample size T ~ => As n grows T becomes larger and any small correlation can become significant! Make sure that the correlation is still meaningful or useful in applications:
a correlation between x and y of r=0.3 can be significant.But using x to predict values of y (with linear regression) would only explain a tiny fraction of the variability in y
The significance test can be misleading if the samples x and y are not normally-distributed!
Independent sample pairs (x1,y1) (x2,y2) … (xn,yn) are assumed. In time series or spatial samples, sample points may not be independent and your effective sample size can be much lower than the actual sample size n. (this would result in too high degrees of freedom used in the t-test)

Time series analysis
ENSO Index:Tropical Pacific
Sea Surface Temperatures
Seasonal forcast outlook:El Nino is coming!

EXAMPLES OF TIME SERIES
Source: http://keelingcurve.ucsd.edu/ (retrieved 2014-04-30)
7 days

EXAMPLES OF TIME SERIES
Source: http://keelingcurve.ucsd.edu/ (retrieved 2014-04-30)
12 months1 week

EXAMPLES OF TIME SERIES
Source: http://keelingcurve.ucsd.edu/ (retrieved 2014-04-30)
60 years1 year

EXAMPLES OF TIME SERIES
Source: http://keelingcurve.ucsd.edu/ (retrieved 2014-04-30)
300 years60 years

EXAMPLES OF TIME SERIES
Source: http://keelingcurve.ucsd.edu/ (retrieved 2014-04-30)
800 ?

EXAMPLES OF TIME SERIES
Source: http://keelingcurve.ucsd.edu/ (retrieved 2014-04-30)
800,000 years300 years
Reconstructions from air bubbles trapped in Antarctic Ice Cores

SAMPLING RATES AND TIME SERIES LENGTH
Atmospheric Environmental sciences study processes on a wide range of time scales!
from tenth of seconds in turbulence
(or even less, e.g. lightning processes) Weather (hours to weeks) Seasonal variability (weeks to months) Climate variability (years-decades) Ice age cycles (10-100,000 years) Geological processes (plate tectonics) >
10,000,000yrs

SAMPLING RATES AND TIME SERIES LENGTH
Atmospheric Environmental sciences study processes on a wide range of time scales!
The sampling rate at which we observe these processes must match the typical time-scalesof the variations

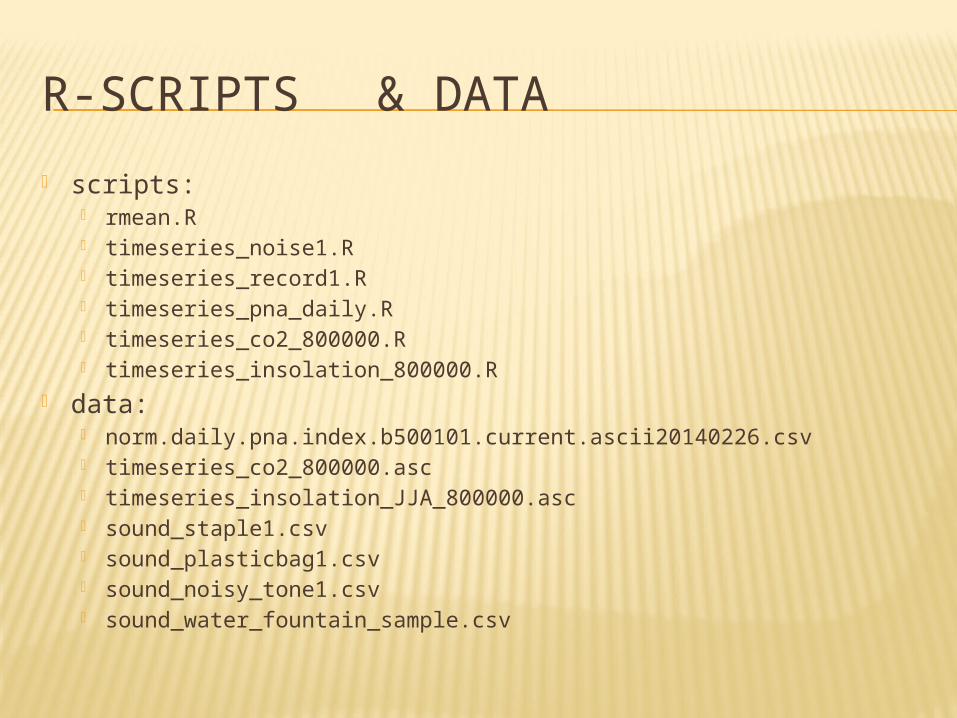
R-SCRIPTS & DATA
scripts: rmean.R timeseries_noise1.R timeseries_record1.R timeseries_pna_daily.R timeseries_co2_800000.R timeseries_insolation_800000.R
data: norm.daily.pna.index.b500101.current.ascii20140226.csv timeseries_co2_800000.asc timeseries_insolation_JJA_800000.asc sound_staple1.csv sound_plasticbag1.csv sound_noisy_tone1.csv sound_water_fountain_sample.csv