©istockphoto.com/hhakim onshore down under
TRANSCRIPT

Onshore down under
August 2013
Published by Edison Investment Research
Investment opportuni es in Australian onshore E&P
©iStockphoto.com/HHakim
Oil & gas sector

ACKNOWLEDGEMENT Robert Haberl

15 August 2013
The Australian onshore sector is in the early stages of transformational change. In the country that is itself a continent, the menu of potential oil and gas plays on offer is vast. Careful selection is critical. In this report, we undertake a detailed analysis of the onshore space down under and draw views on where we think value lies from a universe of 16 independents representing the full length of the exploration and production spectrum.
Australia: The next wave? The scale of investment currently being injected into the Australian oil and gas sector is staggering in both breadth and depth. However, with the current investment cycle now in its advanced stages, the question increasingly being asked is, “What next?” In our view, the next wave in Australia will look very different to the last. It is now the turn of the onshore sector to step forward.
Above ground as important as below Analogues from the North American sector are often held out to support Australian plays. In our view, many of these comparisons are overblown. While true that the raw scale of the resource may eventually be comparable, the differences in technical and market contexts are together enormous. This is particularly the case for gas-rich regions where the ability to monetise in-ground resource is as much a function of above-ground commercials as below-ground geology.
Investors: Something for everyone The onshore Australian sector is notable for the breadth of its player maturity profiles. The extents of size and prospectivity inherent in the Australian space make for investment extremes. Large local players dominate in mature but still highly prospective regions, while by comparison early-stage juniors typically hold massive but generally very early-stage tranches of frontier acreage. Added to this mix are at least 10 major and super-major companies, which have to date partnered with local players. The investment spectrum is absolute, presenting both challenges and opportunities to investors. Careful selection is critical.
Deep discounting the dominant theme Our analysis applies a blend of valuation tools, proxies and benchmarks toward concluding investment themes across the play and player spectrum. The dominant theme to emerge is of a financial market that is comfortable applying deep discounts to observed industry benchmarks. This is not unusual in the world of oil and gas and correlates with results we have previously observed and reported on in other regions. In our view, once the onshore sector can demonstrate further success in early-stage frontiers, value uplift will likely be both broad and deep. However, from our universe we are drawn to players that present high-quality assets and management backed by solid growth prospects. Using this yardstick in the emerging company space, we highlight Armour Energy, Buru Energy, Central Petroleum, and Strike Energy. Of those established players we analyse we highlight AWE, Linc Energy and Senex.
Onshore down under Australia ≠ North America. Not yet.
Companies profiled in this report Armour Energy
AWE
Buru Energy
Central Petroleum
Cooper Energy
Drillsearch
Empire Oil & Gas
Exoma Energy
Icon Energy
Linc Energy
Metgasco
New Standard Energy
Norwest
Petrofrontier
Senex Energy
Strike Energy
Analysts John Kidd +64 (0)4 8948 555
Ian McLelland +44 (0)20 3077 5756
Will Forbes +44 (0)20 3077 5749
Xavier Grunauer +44 (0)20 3077 5700
Peter Dupont +44 (0)20 3077 5741
Elaine Reynolds +44 (0)20 3077 5713
For Institutional enquiries contact:
Gareth Jones +44 (0)20 3077 5704

Onshore down under | 15 August 2013 1
Contents Investment summary: Selection critical down under ....................................................................... 2 Introduction ..................................................................................................................................... 7 Technical backdrop ......................................................................................................................... 8 Market backdrop ............................................................................................................................. 10 Around the traps ............................................................................................................................. 13 Case studies: Onshore sector deal baselines ................................................................................ 21 Investment thesis part 1: Framing the approach ............................................................................ 26 Investment thesis part 2: Our valuation proposal ........................................................................... 31 Company profiles ........................................................................................................................... 44
Armour Energy ....................................................................................................................... 45 AWE ....................................................................................................................................... 47 Buru Energy ............................................................................................................................ 49 Central Petroleum ................................................................................................................... 51 Cooper Energy ....................................................................................................................... 53 Drillsearch ............................................................................................................................... 55 Empire Oil & Gas .................................................................................................................... 57 Exoma Energy ........................................................................................................................ 59 Icon Energy ............................................................................................................................ 61 Linc Energy ............................................................................................................................. 63 Metgasco ................................................................................................................................ 65 New Standard Energy ............................................................................................................ 67 Norwest Energy ...................................................................................................................... 69 PetroFrontier ........................................................................................................................... 71 Senex Energy ......................................................................................................................... 73 Strike Energy .......................................................................................................................... 75

Onshore down under | 15 August 2013 2
Investment summary: Selection critical down under
“The next North America”? In oil and gas circles, Australia is often labelled as “the next North America” by those looking to the country’s vast acreage and portfolio of known petroleum systems as a basis for positing that the US shale boom of the last decade will be replicated. While it is understandable for an industry that thrives on analogues to want to draw such comparisons, in our view many are overblown. While below ground there are definite similarities (for a start, the physical onshore footprints of Australia and the lower 48 contiguous US states are identical at 7.66m km2), it is above ground where the starkest differences lie. The deeply mature North American sector is serviced by an infrastructure network and service sector that is unrivalled on the global stage. By contrast, despite its recent growth surge, the Australian sector remains in its physical and commercial infancy.
Exhibit 1: US vs Australian oil & gas sector metrics Metric Unit US Australia Australia as % of US Mainland area (US=lower 48) m km2 7.66 7.66 100.0% High-pressure gas pipeline network km 492,000 25,000 5.1% Oil pipeline network km 244,620 3,498 1.4% Gas production 2012 tcf 24.0 1.7 7.1% Gas reserves 2P tcf 300 133 44.3% Crude production 2012 mmbbl/d 8.9 0.5 5.6% Oil reserves 2P mmbbl 35,000 3,922 11.2% Shale oil estimated resource bnbbl 58.1 17.5 30.1% Shale gas estimated resource tcf 665 437 65.7% Rig count - onshore Rigs 1,694 12 0.7% Rig count - offshore Rigs 77 8 10.4% Source: EIA, APIA, BP Statistical Review of World Energy 2013, Baker Hughes, Edison Investment Research
Player universe: Full breadth of E&P life cycle on offer In this report, we have looked at 16 small- to mid-scale E&P companies selected for their involvement in the onshore Australian sector. The list spans companies at every point in the commercialisation chain, from frontier explorers with no production history through to companies with mature producing assets, including some with assets overseas. In aggregate, the players we profile are active in each of the 20 most important onshore Australian sedimentary basins. The market cap range in our catchment begins at A$6m (Exoma) and extends more than 100-fold to >A$600m (AWE, Linc and Senex).
Exhibit 2: Our onshore down under player universe Non-producing, large acreage footprint, frontier region explorers
Explorers with acreage footprints targeted at established regions
Frontier explorers, but with material conventional exploration success
Explorers with modest existing conventional producing bases in Australia or elsewhere
Large, international producers with material onshore Australian exploration interests
Large, established onshore producers
Armour Icon Buru Cooper Energy AWE Drillsearch Exoma Metgasco Central Petroleum Empire Linc Senex New Standard Norwest Strike Petrofrontier
Source: Edison Investment Research
The extreme early-stage nature of many parts of the onshore Australian oil and gas space is a critical feature in framing the investment thesis we have applied in this report. Our approach is framed squarely toward a commercialisation end game. The absence in most cases of bankable projects from which DCFs can be run is further compounded by a general lack of independently assessed resource estimates across frontier players. In such cases, reliance must be placed on observed market transactions to proxy for risk discounting.

Onshore down under | 15 August 2013 3
Below ground: Immense validation challenge still ahead Australia already boasts a strong onshore producing history dating back to at least the early-1950s, when an Ampol/Caltex JV struck oil with its Rough Range-1 well in the northern Carnarvon Basin. However, it was not until the 1960s when Santos discovered and then validated the Cooper Basin that the onshore sector became truly established. Tellingly, it was not until late-2012 that Australia’s first commercial production of shale gas was achieved, also by Santos, also from the Cooper Basin.
This backdrop provides an insight to the level of existing understanding of the Australian subsurface. Except in a small number of mature producing regions where geologic datasets are strong, subsurface understandings are generally at a very early stage. While seismic and drilling campaigns have served to lift understandings, many of the basin plays being progressed by companies featured in this report qualify squarely as genuine frontier regions, which require extremely time- and cost-intensive programmes to validate. In our view, this equation is exacerbated by a broad misperception that in some areas the level of validation activity going on is more extensive than it actually is. Investors need to understand that in many cases they will need to be extremely patient.
This does not detract from the potential size of the prize. In its recent updated assessment of global shale oil and gas reserves, the EIA estimated Australian technically recoverable shale oil and gas resources at 94bnboe – roughly the equivalent of four years’ global oil and gas demand at current levels. Unlike in North America where acreage is both small and expensive, in Australia it has been possible to secure entry to tenement positions totalling into tens of millions of acres at entry prices as low as US$10/acre. It is unsurprising that IOC majors and super-majors have been pegging out their own positions in Australia, thereby providing the ultimate endorsement of play plausibility and materiality. Nonetheless, IOCs are getting no more than what they pay for, being a suite of early-stage, high-risk frontier plays requiring many hundreds of millions of dollars of front-end investment to prove up.
Above ground: Infrastructure and regulation dominate
Infrastructure: The science of nearology
The scale of the Australian market context is staggering; such is its size that three separate regional wholesale gas markets operate in isolation from each other (there is no interconnecting pipeline). Plays located near to established handling, processing and transmission infrastructure sit at a substantial advantage compared to isolated plays that are remote and otherwise at risk of being stranded. Although the scale of some remote plays may be of an eventual magnitude sufficient to justify new infrastructure build, the timing of such new build is often beyond the direct control of the resource owner, and as a result, subject to substantial second-order elements of commercial risk.
It is not just in the availability of embedded, first-order infrastructure that access constraints are likely to weigh on sector activity and timelines. Another significant inhibitor of progress is the limited availability of specialist equipment necessary to support the timely development of the sector. In particular, the domestic stock of high-specification rigging and completion equipment remains shallow, making for lead times and cost curves that sit far in excess of those in North America.
Difficult, duplicative regulatory context, particularly in hotbed eastern states
A dominant feature of the sector over the past half-decade has been the emergence of public concern about issues of water management and quality. Protest movements have grown and been highly successful in capturing media, public and political attention. This is particularly the case in the populous Eastern states of NSW and VIC. Recent policy changes have imposed strict new controls and created what are now widely regarded as the strictest oversight regimes in the world. Despite this, both federal and state regulatory and policy environments remain fluid. In NSW, which

Onshore down under | 15 August 2013 4
imports 95% of its gas from other states, the state government has imposed severe land use curtailment measures, with the result that the coal seam gas (CSG) sector has largely surrendered by suspending their work programmes and slashing their corporate operations. The situation is similar in VIC, where a moratorium on hydraulic fracturing remains in place. With the forward-risk profiles they face, in our view there is a compelling basis to favour plays and players that operate away from hotbed Eastern regions.
Combining above- and below-ground risk profiles to infer unconventional oil and gas investment opportunities In an effort to cut through the player fog, in this report we present a risk-based screening methodology that serves as a proxy for below- and above-ground risk and applies outcomes to market-led benchmarks to arrive at risk-adjusted unconventional asset portfolio values across our 16-strong player universe.
Our analysis (see Exhibit 3) represents the journey that companies face in de-risking their asset and institutional offerings to investors. Higher-yield players find themselves nearer the origin, conveying higher discounting on both above- and below-ground measures. The challenge is for companies to graduate away from the origin and toward the top-right of the plot by de-risking both the resource base on which they sit and the institutional arrangements that underpin the current or future development of that resource. As this de-risking occurs, the market will move to reward progress by ascribing a higher dollar per barrel (or equivalent) of player oil and/or gas held.
Exhibit 3: Below- and above-ground risk screen outcomes
Source: Edison Investment Research
Our analysis concludes a consistent discounting theme across each of the life cycle stages we define, but particularly in the early- to mid-stages. What is clear is that financial markets have been willing to ascribe substantially less value to deal-backed assets than acquirers. In simple terms, IOCs and investors are in different ballparks when it comes to valuing onshore Australian assets. Although the sample set is shallow, our analysis suggests that markets are prepared to pay just 15% of the entry price that industry is prepared to pay for assets. The extent of this discount is deeper than results we have analysed in other oil and gas regions around the globe, where the willingness of investors to pay has tended to track at 20-30% of same asset farm-in benchmarks.
0%
10%
20%
30%
40%
50%
60%
70%
80%
90%
100%
1 5 25 125 625
Abov
e-gr
ound
: risk
ed E
MV/un
riske
dEMV
Below-ground: risked EMV per acre (log scale)
Empire
Metgasco
New Standard
Armour
Exoma
Petrofrontier
Central
Buru
Linc
AWE
Cooper
Norwest
Senex Drillsearch
IconStrike
Onshore down under | 15 August 2013 5
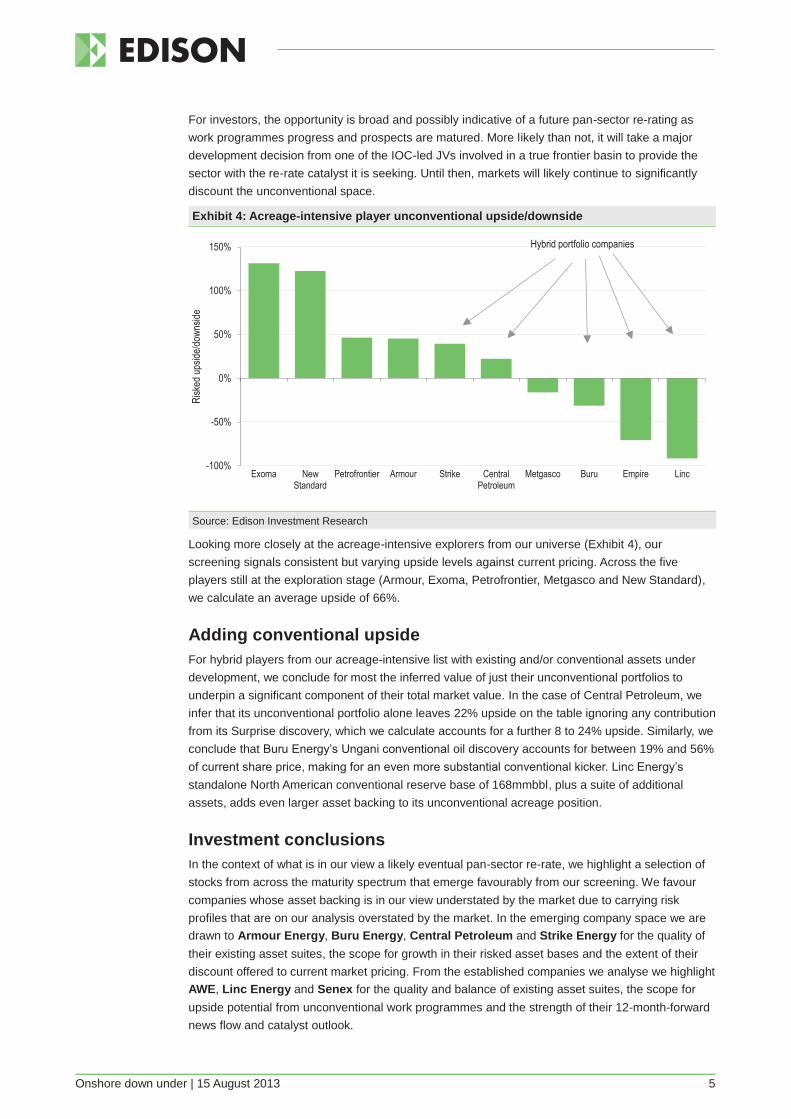
For investors, the opportunity is broad and possibly indicative of a future pan-sector re-rating as work programmes progress and prospects are matured. More likely than not, it will take a major development decision from one of the IOC-led JVs involved in a true frontier basin to provide the sector with the re-rate catalyst it is seeking. Until then, markets will likely continue to significantly discount the unconventional space.
Exhibit 4: Acreage-intensive player unconventional upside/downside
Source: Edison Investment Research
Looking more closely at the acreage-intensive explorers from our universe (Exhibit 4), our screening signals consistent but varying upside levels against current pricing. Across the five players still at the exploration stage (Armour, Exoma, Petrofrontier, Metgasco and New Standard), we calculate an average upside of 66%.
Adding conventional upside For hybrid players from our acreage-intensive list with existing and/or conventional assets under development, we conclude for most the inferred value of just their unconventional portfolios to underpin a significant component of their total market value. In the case of Central Petroleum, we infer that its unconventional portfolio alone leaves 22% upside on the table ignoring any contribution from its Surprise discovery, which we calculate accounts for a further 8 to 24% upside. Similarly, we conclude that Buru Energy’s Ungani conventional oil discovery accounts for between 19% and 56% of current share price, making for an even more substantial conventional kicker. Linc Energy’s standalone North American conventional reserve base of 168mmbbl, plus a suite of additional assets, adds even larger asset backing to its unconventional acreage position.
Investment conclusions In the context of what is in our view a likely eventual pan-sector re-rate, we highlight a selection of stocks from across the maturity spectrum that emerge favourably from our screening. We favour companies whose asset backing is in our view understated by the market due to carrying risk profiles that are on our analysis overstated by the market. In the emerging company space we are drawn to Armour Energy, Buru Energy, Central Petroleum and Strike Energy for the quality of their existing asset suites, the scope for growth in their risked asset bases and the extent of their discount offered to current market pricing. From the established companies we analyse we highlight AWE, Linc Energy and Senex for the quality and balance of existing asset suites, the scope for upside potential from unconventional work programmes and the strength of their 12-month-forward news flow and catalyst outlook.
-100%
-50%
0%
50%
100%
150%
Exoma NewStandard
Petrofrontier Armour Strike CentralPetroleum
Metgasco Buru Empire Linc
Risk
ed up
side/d
owns
ide
Hybrid portfolio companies

Onshore down under | 15 August 2013 6

Onshore down under | 15 August 2013 7
Introduction
The objective of this report is to provide investors with an understanding of the spectrum of oil and gas opportunities being progressed in the onshore Australian sector and to analyse a number of the most active E&P companies, highlighting where investment opportunities may lie. Our focus lies primarily on the unconventional oil and gas space, although we also analyse for conventional asset values for some players.
The main body of the report is in three sections: 1. Technical backdrop: a brief overview of the technical foundations of the conventional and
unconventional oil and gas space and their relevance below ground in Australia (page 8). 2. Market backdrop: examining the above-ground market value drivers that collectively define
the onshore Australian space (page 10). 3. Valuation: analysing issues of valuation and commercialisation as they relate to the onshore
Australian sector and its main players (page 26).
In addition, the report includes two-page profiles of 16 mid-scale ASX-listed E&P companies, which we have selected on the basis of the relative weight of their onshore Australian interests to their overall business.
Australia: The country that is a continent Australia is big. Very big. At nearly 36,000km, the length of Australia’s mainland coastline is within 10% of the length of the Earth’s circumference. What lies onshore is not only rich in minerals, but also oil and gas. Since the first large-scale conventional reservoir production was achieved from the Cooper Basin in the mid-1960s, the onshore space has emerged to become an increasingly important component of Australia’s producing back bone. More recently, the ongoing world-scale commercialisation of Queensland’s coal seam gas (CSG) resource is serving to internationalise East Coast energy markets and open the domestic gas market to global price and non-price drivers. On the West Coast, this transition was completed a couple of decades earlier, when Northwest shelf gas was brought to market for LNG export. The same applies in the North, where the Darwin LNG export terminal defines the gas market in that region. The result is that once the East Coast LNG projects come online, the entire Australian oil and gas sector will be fully internationalised.
Exhibit 5: Australian oil & gas production 2012
All Australia Onshore only (77.3mmboe)
Source: APPEA, Edison Investment Research
Offshore 438.6mmboe
85%
Onshore 77.3mmboe
15%
Crude 9.0mmboe
12%Condensate 1.8mmboe
2%
LPG 1.7mmboe
2%
Gas 21.7mmboe
28%
CSG 43.0mmboe
56%

Onshore down under | 15 August 2013 8
Technical backdrop
Conventionalising the unconventional The rise of the North American shale oil and gas sector has demonstrated the game-changing impact of unconventional hydrocarbons. Despite its proliferation, even now there remains substantial uncertainty among many investors as to where the line between conventional and unconventional oil and gas is drawn. Given there is no discrete dividing line that separates definitions, such confusion is entirely understandable. At its simplest, conventional hydrocarbons refers to oil and gas trapped within sandstone and carbonate rock formations with sufficient in situ geologic permeability and porosity to allow oil and gas to flow and be recovered. By contrast, unconventional petroleum refers to in situ hydrocarbons, which, due to low reservoir rock permeability and/or porosity, cannot normally be produced at commercial rates without employing specialist drilling and/or extraction treatments. In geological terms, whereas conventional oil and gas involves producing from reservoir rock of comparatively high (>10mD) permeability, unconventional oil and gas is produced from rock with comparatively very low (<0.1mD) permeability.
Exhibit 6: Petroleum resource pyramid
Source: Edison Investment Research, adapted from US Geological Survey
Although shale oil and gas has been the poster child of the unconventional E&P sector, shale is just one of a number of varietals of unconventional oil and gas to have been commercialised over the past decade. The other main two: low-permeability sandstones and carbonates (commonly referred to as ‘tight’ oil or gas); and coal beds (for coal seam gas), have each been equally significant in the extent of their impact on the global E&P sector.
Immense, world-scale unconventional endowment The IEA has recently estimated Australia’s shale endowment at 94bnboe, comprised of 17.5bn barrels of oil and 437tcf gas. This estimate relates only to shale and does not account for contributions from any other unconventional formats (CSG and tight oil/gas in particular), let alone conventional resources. Also notable is that most of the resource is concentrated in the Canning, Beetaloo, Cooper, and Perth basins. The EIA estimates are expressed in terms of risked oil/gas in
Bottom of resource pyramid not known
Good
Average
Poor Tight oil/gas
Shale oil/gas Hydrates
CSG
10mD
0.1mD
PRODUCTION HORIZONPresent
Future
Conventional
Unconventional
INCREASING:
Production costs, price, activation indexes, research, time
DECREASING:
Delivery speed, pore throat apertures.

Onshore down under | 15 August 2013 9
place resource, ie resource is considered technically recoverable using currently available technology, but no account is taken of the economic viability of extraction.
Exhibit 7: Australian shale oil & gas resource estimates Basin Formation Gas Oil mmboe Risked
in place (tcf)
Technically recoverable
(tcf)
Risked in place (bnbbl)
Technically recoverable
(bnbbl)
Risked in place (bnboe)
Technically recoverable
(bnboe) Cooper R-E-M (Nappamerri) 307 89 17 1.0 70.7 16.6
R-E-M Patchawarra) 17 4 9 0.4 12.0 1.1 R-E-M (Tennapera) 1 0 3 0.1 3.2 0.1
Maryborough Goodwood/Cherwell Mudstone 64 19 0 0.0 11.2 3.3 Perth Carynginia 124 25 0 0.0 21.7 4.4
Kockatea 44 8 14 0.5 21.7 1.9 Canning Goldwyer 1,227 235 244 9.7 458.7 50.8 Georgina L. Arthur Shale (Dulcie Trough) 41 8 3 0.1 10.2 1.5
L. Arthur Shale (Toko Trough) 27 5 22 0.9 26.7 1.8 Beetaloo M. Velkerri Shale 94 22 28 1.4 44.5 5.3
L. Kyalla Shale 100 22 65 3.3 82.5 7.2 2,046 437 405 17.5 763.1 93.9 Source: EIA, Edison Investment Research. Note: R-E-M = Roseneath-Epsilon-Murteree.
Important not to forget the conventional The weight of recent industry interest and attention in favour of unconventional formats has served to dilute the emphasis, and in our view, the relative importance of conventional producing formats. While CSG emerged from obscurity in the 1990s and now accounts for most of QLD gas production, it was not until October 2012 – less than a year ago – that Australia’s first commercial shale gas was produced.
It remains the case that conventional formats continue to dominate the Australian gas supply curve, largely through world-scale offshore gas-to-LNG projects. While this is changing, particularly as the QLD CSG-to-LNG projects come online, the weight of current supply remains skewed heavily in favour of conventional. It is also the case that many of the most promising plays present as conventional prospects, which if proved-up serve to substantially reduce commercialisation lead times, and therefore investment horizons.

Onshore down under | 15 August 2013 10
Market backdrop
‘Big gas’ focus, but with overlooked liquids kicker In the space of only a couple of decades, the Australian oil and gas sector has transformed from an inward-focused, subsistence farmer into a global, outward-looking conglomerate. This is particularly the case with the gas sector, which over the course of the past 20 years has grown to become one of the biggest players on the world LNG stage. This began with the West coast in the 1980s, when the development of the north-west shelf projects tipped the regional gas market into a structural net-long position, with the effect that the domestic WA gas sector internationalised on price and non-price terms. The East Coast has been a slower story, but is now on the cusp of reaching the same export-defined gas status.
An overlooked characteristic of the Australian sector is the often liquids-heavy composition of raw gas streams. In other words, in many plays well streams labelled simply as “gas” are in fact wet gas streams that contain often substantial measures of heavier (and more valuable) hydrocarbons. The separation and sale of liquids (condensate and LPGs) is often the difference between ‘good’ and ‘outstanding’ field economics.
The liquids sub-sector is less integrated and more reliant on discrete infrastructure installations. In a number of important cases, supply chains are extremely long, and as a result, expensive. A lack of existing pipeline infrastructure in most regions means it is not uncommon for produced crude or condensate to be trucked 1,500km or more for refining, at significant cost.
West-east gas market disconnection normalising A distinctive feature of the Australian gas sector has been its secularity. Despite its overall scale, the gas sector operates as three disconnected sub-markets to the west, north and east of the country, around high pressure pipeline systems of varying length and capacity. In the western and northern markets, connections to existing LNG export facilities are in place, leaving the local markets structurally net-long, and therefore as international price takers.
In our recent wrap of the 2013 conference of the Australian Petroleum Production and Exploration Association (APPEA) (see our 7 June 2013 report APPEA 2013: The next wave?), we highlighted the pending graduation of the eastern gas market to its own structural net-export position. This is the consequence of three world-scale CSG-to-LNG plants currently being built on Queensland’s Curtis Island, which, once they come onstream in 2014-15, will result in the eastern gas market tripling in size, from an existing internal baseline demand level of around 750bcf pa to significantly more than 2tcf pa.
Despite none of the CSG-to-LNG projects yet operating, the inevitable migration of the Eastern gas market to one of externally determined supply/demand equilibrium has already delivered a severe upward pricing adjustment path to the wholesale gas market. Whereas well head prices were stable at A$2-4/GJ before FIDs in 2009-10, those that are still able to contract gas are now reported to be paying A$6 to A$9/GJ for post-2015 gas. The emerging presence of oil-linked pricing structures in new wholesale GSAs supports our view that there is little to stand in the way of prices continuing their trajectory toward A$9-10/GJ, and possibly beyond.
Gas market evolution In our APPEA note, we also drew attention to the increasing likelihood of a demand-side overhang in the Eastern gas market, as downstream LNG operators move to strengthen their Surat and Bowen basin-intensive supply curves by diversifying and expanding their supply channels. This resulted in a series of significant new GSAs being struck between eastern state LNG majors (on the buy side) and upstream producers, with a particular focus on Cooper Basin supply lines.

Onshore down under | 15 August 2013 11
Exhibit 8: East Coast LNG projects under construction Project Source basin Capacity
mtpa
Gas draw capacity
bcf pa
Delivery pipeline
km
Capex budget
A$bn
First delivery
Lead Partners
QCLNG Surat 8.5 408 540 20.4 2014 BG CNOOC APLNG Surat+Bowen 9.0 432 520 24.7 2015 ConocoPhillips Origin, Sinopec Gladstone LNG Surat+Bowen 7.8 374 420 18.5 2015 Santos Petronas, Total,
KOGAS 25.3 1,214 1,480.0 63.6
Source: Company announcements, Edison Investment Research
One consequence of this has been that existing buyers in the wholesale gas market have been increasingly unable to renew forward supply contracts on economic terms. For major energy intensive industrial operators such as electricity generators and mine operators with substantial sunk-cost infrastructure already in the ground, the inability to contract fuel at a reasonable cost has been of deep concern. The effect is of LNG players crowding others out of the market, able to lean on integrated upstream-downstream market positions and gas price economics that link to international LNG markets, rather than legacy, lower-value domestic market conditions.
Exhibit 9: Sell-side GSAs struck with buy-side East Coast LNG players Seller Buyer Comment Beach Energy Origin Announced April 2013: Beach to sell up to 139PJ over eight years from its Cooper Basin interests.
Origin holds a two-year extension option, which would take the total amount to 173PJ. Gas to be delivered from the Moomba gas hub commencing in 2014-15 at annualised rate of up to 17PJ pa. Terms include an oil-linked pricing structure.
Origin Energy GLNG Announced May 2012: Binding HoA, under which Origin would sell the GLNG project up to 365PJ over 10 delivery years commencing in 2015. Terms include an oil-linked pricing structure.
Santos GLNG Announced October 2010: Santos to sell 750PJ of portfolio gas to GLNG over 15-year term commencing in 2014. Terms include an oil-linked pricing structure.
Source: Company announcements, Edison Investment Research
The improving state of sell-side gas market conditions is prompting increased action at the drill bit with a clear (albeit historically on-trend cyclical) rising baseline in drilling metrics. While onshore work slates continue to broaden and deepen as new and existing JVs firm their work programmes, we expect drilling activity (and therefore investor catalysts) to continue on an upwards tangent.
Exhibit 10: Onshore Australian drilling history
Source: APPEA, Edison Investment Research
Innovative commercial arrangements emerging This situation underpins our belief that the Eastern gas market is now entering a significant new stage of development. Whereas until very recently, it has been the domain of upstream majors to bankroll exploration programmes via fully funded farm-in agreements (a space we look at
-
50
100
150
200
250
300
350
400
450
0
50
100
150
200
250
300
1990 1992 1994 1996 1998 2000 2002 2004 2006 2008 2010 2012
Metres made kmWell
coun
t
Wildcat Appraisal Development Metres made

Onshore down under | 15 August 2013 12
specifically in the first of two deal-themed case studies later in this report), there is now clear evidence that downstream participants are prepared to compete in the same space toward the same end game: securing fuel for their process requirements. This trend began in 2007 with a A$40m funding deal between Buru Energy predecessor, ARC Energy, and major industrial gas user, Alcoa, to support ARC’s Canning Basin work programme. Strike Energy’s recent announcement of a breakthrough risk-sharing agreement with major mining services firm, Orica, is a deal that we think breaks significant new ground in the onshore space, and one we highlight in our second case study.
For downstream players opting to take this route, this represents a substantial capability step-out and deepening of their overall risk profile. However, equally it is a clear signal of their increased appetite to accept a component of field risk in their end-game quest for fuel security. It also signals that downstream users appear increasingly prepared to compete directly upstream.
Above ground: Regulation, policy and infrastructure dominate
Federal policy
While federal government policy settings have generally been viewed as accommodative in supporting the growth of the sector over the past decade, intensifying public debate about some E&P practices has seen government attitude to the onshore sector harden considerably over the past couple of years. Most of that hardening has been targeted at the onshore CSG sector in response to concerns over water quality. This was exemplified in March, when the federal government announced increased protection for water resources affected by proposed new CSG and coal mining developments.
Not all states created equal either
Much variation also exists in the regional political contexts that determine onshore oil and gas activity. Regulatory burden is very much steeper in the south-east of the country where the population is most concentrated. Whereas WA, SA, NT and QLD each have comparatively (but not without specific exceptions) benign regulatory frameworks, the regimes of NSW and VIC have in recent times shifted sharply against operators.
In NSW, following a moratorium on hydraulic fracturing imposed in May 2011 that saw exploration in NSW effectively stop for 15 intervening months, in October 2012 the NSW government released its Strategic Regional Land Use Policy (SRLUP) to regulate CSG activities. At the time, the SRLUP was said by the government to represent the “strictest controls in Australia” on the CSG industry and was the result of an extensive consultation process. Just five months later, in March 2013 the NSW government imposed a suite of new controls, including blanket no-go exclusion zones for the CSG industry. Notably, imposed exclusion zones included up to 2km of current and future residential zones and land used for viticulture and horse breeding. In Australia’s most populous state, the new conditions served to substantially undermine the activities and work programmes of some players. Unlike the case with the SRLUP, the new measures were said to have been devised and announced without any consultation with industry. As a result of the announcement, significant NSW CSG players including Metgasco and Dart Energy, have completely suspended their NSW work programmes. Major player, Santos, which had planned in 2011 to commence a major 1,100-well CSG development of its Gunnedah Basin acreage, has also shelved its plans.
In VIC, a moratorium on fracking was imposed in August 2012, ostensibly until the federal government finalised its CSG framework. Due in late-2012, the review is now well overdue, and the moratorium remains in place.

Onshore down under | 15 August 2013 13
Around the traps
The Australian onshore sector comprises around 30 mapped sedimentary basins varying from 15,000km2 to more than 1,000,000 km2 in size. Unlike North America, subsurface knowledge of most acreage remains at a very early stage. With the exception of those few basins that can point to established producing histories, most have had comparatively little exploration work undertaken on them. Even among relatively mature basins, such as the Cooper Basin, subsurface knowledge is concentrated heavily on the productive central regions, with work programmes only just now starting to explore and/or appraise peripheral areas.
In this section, we review the main onshore regions. In doing so, we have grouped plays into three sub-regions on the basis of infrastructure (particularly gas) proximity: 1. West: regions connected to or in the vicinity of existing WA gas market infrastructure. 2. North: regions connected to or in the vicinity of existing NT gas market infrastructure. 3. East: QLD, NSW, VIC, TAS and SA regions connected to or in the vicinity of existing eastern
gas market infrastructure.
Within this frame, we discuss each of the major onshore basins and plays. In doing so, we note there are a small number of cases where basins and/or plays span two regions (for example, the Officer and Georgina basins, which each stretch across state lines). In these cases, we group to the region where the basin/play is most geographically prevalent (for example, the Officer Basin falls into our west region), but our analysis and discussion refers to the basin/play in its entirety.
Exhibit 11: Major onshore Australia sedimentary basins and Edison segmentation
Source: Geoscience Australia, Edison Investment Research
Western region Northern region Eastern region
Onshore down under | 15 August 2013 14
1. West Our western zone comprises the state of West Australia (WA). It is Australia’s largest state and accounts for around one-third of its landmass. The West houses seven major sedimentary basins: Bonaparte, Browse, Canning, Northern Carnarvon, Southern Carnarvon, Officer and Perth. Of these, only the Browse Basin is located entirely offshore; each of the others lies either entirely onshore or has an onshore component.
WA is Australia’s largest oil and gas producing region, accounting for 75% of oil and condensate production in 2012 and 55% of all gas produced. Most of its producing base is from very large and established offshore oil and gas fields lying on the North West Shelf in the Northern Carnarvon Basin. This region supports a number of existing and under-construction world-scale LNG facilities, which dominate production and reserve statistics. In CY12, 35 WA fields produced nearly 3.5mmbbl oil/condensate and 22bcf of gas, mostly from offshore fields located on the North West Shelf in the Northern Carnarvon Basin.
The onshore sector is far smaller and accounts for a fraction of the WA region’s total numbers. Its modest success record to date reflects more on the shallowness of activity than prospectivity. Over its entire 110 recorded history, only 1,650 onshore wells have been drilled in WA – fewer than were drilled in the Bakken shale in CY12 alone. In 2012, just 11 wells were drilled onshore in WA.
Onshore, conventional production dates back to 1953, when an AMPOL/Caltex JV struck oil with its Rough Range-1 well in the Northern Carnarvon Basin – the first recorded exploration success in Australia. However, since WA’s onshore success record has been both lumpy and patchy, the most material conventional discoveries brought to production to date have been struck in the Perth Basin, with the Dongara gas-condensate field (c 500bcf) the largest.
In the unconventional space, in 2009 the Corybas-1 well in the North Perth Basin was successfully fractured and completed as WA’s first tight gas field. While there has been increasing recent focus on shale and tight plays elsewhere in the Perth, Canning and Officer basins, work programmes remain at a very early stage. Since 2005, only 15 wells have been drilled targeting unconventional gas, of which only seven have been fracked. Despite its infancy, the scale potential of unconventional resource in WA is enormous. IEA estimates that the Canning and Perth basins hold more than 270tcf of gas – more than IEA estimates for the rest of Australia combined. As is the case with a number of other early-stage Australian plays, a number of IOCs, including ConocoPhillips, Hess, Mitsubishi and Petrochina, have already moved to secure positions in WA targeting largely unconventional plays.
Infrastructure is a significant issue. While the central and southern coastline region is well serviced by a relatively young high-capacity gas transmission network, away from this ribbon there are substantial connectivity challenges. This is particularly the case in the remote northern and eastern reaches, where there is no local gas market to speak of and distances to existing pipelines can approach 1,000km. A new gas pipeline planned by Buru Energy to connect the highly prospective Canning Basin with the existing coastal network will stretch 250km. Oil handling is equally challenging. Most produced condensate is trucked to WA’s only refinery at Kwinana, south of Perth. For prospective Canning Basin producers, this involves a return trip of more than 5,000km, at very substantial cost to netbacks. Unsurprisingly, northern players are currently looking at options to improve the liquids logistics chain.
Access to services is also a substantial challenge for operators in the west. Rig availability has been particularly problematic. In 2011-12, typically only one to two rigs have been available to use in the region, and even these rigs are the subject of significant pull from more activity intense regions, such as the Cooper Basin. Competition among operators for slots has been fierce and costs high. Performance issues with some rigs in 2012 have also resulted in operator delay and overrun. Well completion costs in the west are also said to be the highest in Australia.

Onshore down under | 15 August 2013 15
Exhibit 12: Western zone onshore basin overviews Basin E&P profile Infrastructure profile Local players IOCs Bonaparte 250,000km2 basin, 80% of which lies offshore.
Offshore section houses the large Bayu-Undan field in the JPDA in the Timor Sea and the Blacktip gas field. An onshore 20,000km2 lobe to the south houses part of the southern Bonaparte Basin, which is known to house both conventional and unconventional (shale) gas in the Milligans and Lower Milligans Fms respectively.
502km undersea pipeline connecting the Bayu-Undan field to 3.2Mtpa LNG facility on Darwin harbour, passes onshore through the north of the Southern Bonaparte.
Advent Energy Beach Energy
None onshore
Canning 530,000km2 basin extending offshore for a further 110,000km2. Long exploration history dating back to 1920s yielding >25 conventional, typically oil-rich discoveries, mostly in the northern and central areas. Recorded history of c 300 wells drilled onshore. Basin geology holds three primary petroleum systems: Ungani oil trend (conventional oil); Laurel Fm (tight gas); and Goldwyer/Acacia Fm (shale oil/wet gas. Since 2010, activity has been led by Buru Energy producing multiple discoveries, including Valhalla (Laurel Fm wet gas) and Yulleroo (Laurel Fm, gas). A further conventional oil discovery in 2011, Ungani, was further tested in 2012. Buru is targeting initial production of 5,000b/d in CY14.
No existing gas network and generally undeveloped roading, particularly in remote central and southern areas. Oil is trucked to market via Broome. If Buru demonstrates commercially viable gas, it would need to submit a proposal to WA in 2016 for a new pipeline to connect with WA’s existing network. A c 250km link would likely be required to connect to the existing Pilbara pipeline at Port Hedland.
Buru Energy Green Rock Energy New Standard Energy Oil Basins Rey Resources
ConocoPhillips Hess Mitsubishi Petrochina
Southern Carnarvon
200,000km2 southern component of a larger basin, which extends to the north and into the Indian Ocean. Exploration history dates back to the 1930s, with >100 wells now drilled. No existing production exists and only a few valid tests for hydrocarbons recorded.
The Dampier to Bunbury high-pressure pipeline runs through the basin’s eastern flank.
Empire Oil & Gas New Standard Energy Torrens Energy
Officer 410,000km2 basin straddling the WA/SA border. Around three-quarters of the basin lies in WA. Weak exploration history with only 15,000km of 2D recorded and c 20 wells drilled sporadically during the 1960s-90s, a number of which registered hydrocarbon shows.
No production facilities of any kind exist in the Officer. The Goldfields high-pressure gas pipeline passes c 200km west of the basin, which would provide a direct connection to the WA gas market.
Perth 50,000km2 onshore component of a larger basin that comprises both onshore and offshore components. WA’s most established producing basin, with an exploration history dating back to the early 1950s. More than 300 onshore wells have since been drilled, producing 20 conventional commercial oil and gas fields. The largest to date is the mature Dongara gas-condensate field (508bcf+104mmbbl), which now sits with AWE. Despite positive hydrocarbon shows in the south, to date only the northern part of the basin has been commercialised. The Arrowsmith-2 well, drilled by operator Norwest with partners AWE and Bharat, was WA’s first dedicated shale well. The well delivered very positive results, striking gas and gas-condensate pay in separate sandstone, shale and tight gas formations.
The Parmelia onshore gas pipeline passes directly through the Perth Basin and within a few km of the Arrowsmith-2 well site. Liquids are trucked to the Kwinana refinery 30km south of Perth.
AWE Empire Oil & Gas Origin Norwest Titan Energy
Source: Edison Investment Research

Onshore down under | 15 August 2013 16
2. North Our northern zone captures the NT catchment and its key Amadeus, Georgina, McArthur and Pedirka onshore basins.
The NT’s only onshore producing oil field remains Santos’s conventional gas-condensate Mereenie field in the Amadeus Basin, discovered by Santos as a Paleozoic oil discovery in 1963, but not brought to market until 1984. Production from Mereenie has totalled 16mmbbl, peaking in 1986 at 1.25mmbbl but declining to 228mbbl in CY12. In early-2012, Central Petroleum announced a conventional oil discovery at its 100%-owned Surprise project in the north-western Amadeus Basin. The discovery was the first in the NT in almost 50 years. NT’s onshore gas supply base also centres on Mereenie and another smaller conventional field at Palm Valley, discovered in 1983. Gas production from these two fields peaked in the early-2000s at around 20bcf, most of which was from Mereenie, although since 2009 deliverability from both fields has fallen substantially and in CY12 production from both totalled just 1.5bcf. A further gas field, Dingo, was discovered in 1981 but remains undeveloped. In total, Mereenie has produced 240bcf. In a significant vote of confidence for the region, in Q213 Santos announced a A$100m drilling and appraisal programme on Mereenie intended to extend the field’s life beyond 2030.
The NT’s unconventional sector is the earliest stage of the three zones we define. Prospectivity is considered positive, but datasets are extremely light, requiring substantial future work programmes to be undertaken to prove-up. The potential materiality of the unconventional space has attracted a number of majors over the past one to two years, including Hess (Beetaloo with Falcon), Santos (Amadeus and Pedirka with Central Petroleum) and Total (Southern Georgina with Central Petroleum). However, in June Falcon announced it had refused a request from Hess for an extension to its drilling commitments, with the result that Hess is asserted by Falcon to have forfeited its farm-in rights to the permits, having already incurred c A$80m of spend.
The NT’s remoteness and the shallowness of its existing producing back bone makes for a shallow infrastructure profile. A single-train 3.7Mtpa LNG terminal, commissioned in 2006, is operated by ConocoPhillips near Darwin. A further two-trains for 8.4Mtpa plant, Ichthys, is currently under construction and is scheduled to enter service in 2016. A 1,628km pipeline connecting the Amadeus Basin to Darwin provides a long but low capacity gas transmission back bone from the south of the state to the coast. Rated currently to only c 85TJ/day, a new long-distance pipeline would be required to support a major new gas development in the south of the state, either by way of duplicating the route of the existing line or by a new line connecting the region with existing Cooper Basin infrastructure, and therefore the Eastern gas market. A 333km eastern spur to Xstrata’s McArthur River zinc mine near the Gulf of Carpenteria coast serves as a connection (albeit again low capacity) to the northern Georgina Basin fringe. The logistics of liquids handling is also extremely long and requires a round trip of c 3,000km to Santos’s refinery at Port Bonython on the SA coast.
Similarly to WA, access to oilfield services and capability is complicated by distance and sparsity. Southern operators tend to be placed more favourably, due largely to their better proximity to the Cooper Basin where the services sector is more heavily concentrated. Northern operators experience high mob and demob costs, as well as heightened land concentration challenges.

Onshore down under | 15 August 2013 17
Exhibit 13: Northern zone onshore basin overviews Basin E&P profile Infrastructure profile Local players IOCs Amadeus 170,000km2 basin of Neoproterozoic to late
Paleozoic. The most developed of NT basins, but still very lightly explored with c 40 wells drilled. Commercialised conventional discoveries have included Mereenie (gas-condensate) and Palm Valley (gas), while undeveloped conventional discoveries include Dingo (gas) and Surprise (oil). Unconventional prospectivity is not well understood, although initial testing has suggested the main formations as low potential gas shale candidates due to low organic content.
Existing but low-capacity gas pipeline connects the Amadeus with Darwin. A new high-capacity pipeline would be required to support a large-scale gas development. Liquids handling is significantly disadvantaged by distance; Santos trucks Mereenie oil c 1,500km south to its Port Bonython refinery on the SA coast.
Central Petroleum Magellan Santos
Georgina 330,000km2 Neoproterozoic to Paleozoic basin representing one of the few remaining largely unexplored sedimentary basins in the world. Very light drilling history and what little seismic data exist are both dated and poor quality. The southern Georgina is considered to have substantial potential as a regional shale oil play. Conventional oil and gas prospectivity is also likely. Recent drilling history has been concentrated in three Petrofrontier-led wells (MacIntyre-2H, Owen-3H and Baldwin-2HST1), each of which ran into operational difficulties, offering inconclusive results.
Very remote from existing infrastructure, gas or oil. A new-build pipeline would be required to support a development, with route options either to Darwin or to connect with the Eastern gas market, perhaps through Moomba. Liquids supply chain would be long.
Armour Baraka Petroleum Blue Central Petroleum Petrofrontier
Statoil Total
McArthur 180,000km2 basin presenting both conventional and unconventional plays, including multi-zoned, such as that reported by Armour Energy in the Batten Trough. The McArthur includes the Pre-Cambrian Beetaloo sub-basin. Very light exploration history, with only 11 wells recorded, most of which did not exceed 2,000m. However, results pointed to thick Mesoproterozoic source rocks of extreme age (c 1.4 billion years). Mapped plays include conventional sandstone reservoirs, tight gas and organic-rich shale.
Connection to the Amadeus to Darwin gas pipeline via a 333km eastern spur to Xstrata’s lead-zinc-silver mine, acknowledging that this pipeline would not offer sufficient capacity to support a large-scale development.
Armour Falcon Oil & Gas
Hess*
Pedirka 150,000km2 Permo–Carboniferous basin spanning the SA and NT borders, c 80% of which lies in NT. Bounded by the Amadeus Basin to the north-west, the Arckaringa Basin to the south-west and the Cooper Basin to the south-east. Light exploration history (c 10 wells) dating back to 1960s, many of which revealed oil and gas shows, but to date no commercial discoveries. Conventional interest remains on potentially large-scale carbonate play. Unconventional interest to date has tended to focus on CSG and shale prospectivity.
No existing oil or gas-handling infrastructure. A large-scale development would likely involve construction of connection to Moomba facilities in the Cooper Basin (500-1,000km).
Central Petroleum Santos Senex
Source: Edison investment Research. Note: *On 1 July 2013, Falcon Oil & Gas announced that it had declined a request from Hess to extend the deadline for Hess to drill five wells under its farm-in agreement, with the result that all title reverts to Falcon.

Onshore down under | 15 August 2013 18
3. East The eastern zone we define is a very large catchment, reflecting those plays either already connected or in the vicinity of the East Australian gas market. This spans six of Australia’s eight states: ACT, NSW, QLD, VIC, SA and TAS. Of these, the onshore lobes of the states of (in gas-ranking order) QLD, SA, VIC and NSW are by far the most important with respect to their relative importance as existing and prospective oil and gas plays.
Recent regulatory turbulence has been sharply felt in the Eastern region. In particular, VIC (outright moratorium on fracking) and NSW (land use limitations) have prompted some operators to fundamentally revisit their operations in affected regions.
The Eastern zone is by far the most mature of the three onshore regions we define. Its conventional producing history dates back to 1963, when Santos discovered the Gidgealpa field near Moomba, which underpinned the subsequent rapid development of the Cooper Basin in the 1960s and 1970s. From this development, major infrastructure including separate gas (Moomba to Adelaide in 1969, Moomba to Sydney in 1996 and Moomba to Brisbane in 1997) and oil (Moomba to Port Bonython) pipelines were built with a mix of private and public money.
The Eastern zone also houses the most mature of Australia’s unconventional oil and gas sector. By some distance at the front of this space is the Queensland CSG sector developed on the back of world-scale thermal coal endowments housed in the adjoining Surat and Bowen. CSG produced from these two basins has provided the supply back bone to the East Coast gas market since the late 1990s, and will be greatly expanded from 2014 to support three separate world-scale Curtis Island CSG-to-LNG projects. 2P reserves across the Surat and Bowen regions already exceeds 30tcf, with substantial further 3P upside. Work programmes focusing on coal beds in other regions are also being advanced, supplemented by an emerging focus on shale and tight oil and gas plays. In many cases, such as in the prolific Cooper Basin, unconventional plays overlay or underlay existing conventional plays. In Q412, Santos announced it had started production from Australia’s first shale gas well, Moomba-191, in the Cooper Basin.
The eastern zone’s existing infrastructure network is by a very long margin the most advanced of the three regions we define. A large Santos-owned gas plant at Moomba acts as a central receiving and processing facility for nearly 150 Cooper Basin oil and gas fields. The plant is currently thought to be operating at around two-thirds capacity. An extensive high-pressure gas network connects Moomba near the SA/QLD/NSW junction with the main Eastern and Southern Coast centres, notably including direct high-pressure connections to Adelaide, Brisbane and Sydney. Further connections stretch north to the central QLD port city of Gladstone and south to Melbourne. A separate leg, currently not connected to the rest of the Eastern network, runs 392km from Arrow Energy’s Moranbah CSG hub in the northern Bowen Basin northward to Townsville. Three separate new pipelines are currently being laid by JVs to connect Surat and Bowen basin gas-gathering networks with separate LNG projects currently being built on Curtis Island near Gladstone. In March, Arrow Energy received approval to build a further new pipeline to connect its Bowen Basin CSG fields around Moranbah to another proposed greenfield LNG terminal planned for Curtis Island. Liquids handling is also comparatively mature and includes a key 659km pipeline connecting Moomba to Santos’s Port Bonython refinery on the SA coast.
Due to the extent of concentration of activity in the region, the oilfield services sector is also the deepest in the country, and partly as a result of lower mob and demob timings, is the most economic. Due to the immense extent of their upstream development programmes, some CSG operators have opted to enter into long-term arrangements with drilling operators, which are reported to be starting to deliver significant cost savings.

Onshore down under | 15 August 2013 19
Exhibit 14: Eastern zone onshore basin overviews Basin E&P profile Infrastructure profile Local players IOCs Arckaringa 80,000km2 Permo-Carboniferous basin in the
northern reaches of SA in the vicinity of the mining hub of Coober Pedy. Very light exploration history (fewer than 20 petroleum and CSG wells drilled), but independently assessed to house very substantial conventional and unconventional potential. The main unconventional prospect is a marine shale oil play, where stratigraphic drilling has revealed c 70m of organic rich shale with high potential oil yields. Separate independent assessments commissioned by Linc Energy concluded unrisked prospective resource estimates of 103bnboe and 230bnboe. One of the reports concluded a further conventional resource estimate of 125bnboe.
Arguably the most remote of the main eastern zone plays. No existing gas network, which in the case of gas commercialisation would require a new connection to link with the Moomba to Adelaide line. Liquids would need to be initially trucked, likely to Port Bonython on the SA coast. If scale supports it, connection to the Moomba to Port Bonython pipeline may be a possibility.
Linc
Bowen 160,000km2 basin, which, in addition to containing Australia’s largest coal reserves, has yielded over 100 conventional discoveries. The Bowen is considered the birthplace of the Australian CSG sector, with first production achieved in 1996. Target source rock has been Permian coal measures at c 300m depth. Bowen and Surat (which underlies the southern half of the Bowen) CSG has since the mid-2000s underpinned mass development to support East Coast LNG projects. Total 2P Bowen reserves exceed 8tcf.
The Bowen already serves as the back bone of the QLD gas market and is well serviced by an existing pipeline network. The construction of further gathering and high-pressure pipelines to support Curtis Island LNG projects will see service infrastructure continue to improve.
Blue Comet Ridge Origin Santos Senex Westside
BG ConocoPhillips CNOOC KOGAS Mitsui Petrochina Petronas Shell Sinopec Total
Clarence Moreton
16,000km2 basin located in north-eastern NSW and south-eastern QLD comprising Jurassic and Cretaceous sedimentary source rocks and Triassic coal beds. Most recent attention has been on the basin’s CSG potential. The first well was drilled in 1997, with operator work programmes subsequently indicating coal depth and quality of a type conducive to potential CSG production. Also conventional potential, evidenced by discovery in 2009 by Metgasco of its Kingfisher gas field.
The Clarence Moreton is located in close proximity to the heavily populated northern NSW/southern Queensland area and, therefore, to a large industrial, consumer and residential market. Connection to the East Coast (including LNG) gas market.
Dart Metgasco
None
Cooper 130,000km2 Palaeozoic basin, Australia’s most mature and prolific conventional onshore oil & gas region with an E&P history dating to 1963, when Santos discovered the Gidgealpa gas-condensate field. The Cooper and the much larger Eromanga (1,200,000km2) Basin, which overlap, are often referred to together. A flurry of exploration followed Gidgealpa’s discovery, resulting in the discovery of the large and region-defining Moomba gas field in 1966. The central regions of the Cooper have since been the focus of much work, yielding around 200 gas fields and more than 100 oil fields. During the 1990s, Santos was required by SA administrators to relinquish large tranches of its dominant Cooper acreage holding, opening the way for new entrants. Focus continues to spread further from the central Moomba vicinity. While Cooper success to date has been under conventional formats, unconventional plays known to exist include shale gas (Roseneath-Epsilon-Murteree), tight gas (Nappamerri and Patchawarra troughs), CSG (the deep Patchawarra, Epsilon and Toolachee Fms). The commercial commencement of production in October 2012 from Santos’s Moomba-191 shale gas well (targeting Roseneath-Epsilon-Murteree) at a stabilised rate of 2.7mmscf/d was the Cooper’s (and Australia’s) first.
Most Cooper oil and gas production is handled through the Santos-controlled Moomba production plant where gas and liquid streams are separated. Gas is relayed via separate pipelines to either Adelaide, Sydney or (via Ballera) Brisbane. Liquids are dispatched via a 659km pipeline to Port Bonython on the SA coast. Separate plants at Ballera and Jackson, each also controlled by Santos, respectively process gas and oil from around 80 Cooper/Eromanga fields. All three facilities are connected by product pipelines and work closely together to integrate infrastructure. Moomba and Ballera also each have significant underground gas storage capacity.
Beach Cooper Energy Drillsearch Icon Origin Rawson Resources Santos Senex Strike
BG Chevron

Onshore down under | 15 August 2013 20
Basin E&P profile Infrastructure profile Local players IOCs Eromanga Very large 1m km2 Mesozoic basin, which stretches
across parts of QLD, NSW, NT and SA. The Eromanga overlies the Cooper Basin to the south-west and the Galilee Basin to the north-west. Contains what is regarded as Australia’s largest oil field, Jackson, discovered by Santos in 1981 and which has yielded 100mmbbl. Houses a number of other fields, including Stzelecki 40km east of Moomba. Beyond the Cooper region exploration history in the Eromanga is much lighter. Shale work programmes have included focus on the Cretaceous Toolebuc formation.
Produced oil and gas is handled mostly through Cooper Basin infrastructure. To the north, the small (1,250b/d) and remote Eromanga refinery lies in the central part of the basin and would handle liquids produced from any northern discoveries.
Beach Drillsearch Icon Origin Santos Senex Strike
BG Chevron
Galilee 247,000km2 Carboniferous to Triassic lightly explored basin known to present both conventional and unconventional plays. Conventional prospectivity largely Jurassic sandstone plays, both oil and gas, stratigraphic and structural. Unconventional work programmes have focused on CSG and shale. Coals in the Galilee are Permian and similar in age to those in the Bowen, although testing to date has been less conclusive than in the Bowen.
Not well serviced by existing oil or gas infrastructure. Gas development would require construction of a significant new gathering network. Local supply to a series of large new coal mines proposed for Galilee Basin a possibility. An existing 404km pipeline connects a 55MW CCGT at Barcaldine to the Eastern gas market, but duplication would likely be required. Oil would likely be trucked c 200km south to the Eromanga refinery.
AGL Blue Comet Ridge Exoma Galilee
CNOOC
Gippsland 41,000km2 Late Jurassic-Cainozoic basin of which around a third lies onshore with the balance offshore Bass Strait. Mature and prolific basin with exploration history dating to the 1920s, although nearly all basin production is sourced from offshore fields. Onshore plays span both conventional and unconventional, including shale oil, tight gas and CSG.
Located within 200km of Melbourne and in close proximity to an extensive network of oil and gas-handling and processing infrastructure, much of which services the numerous offshore fields in the basin.
Armour Beach Icon Lakes Oil Somerton
ExxonMobil
Gunnedah 15,000km2 basin adjacent to the north of the Sydney Basin and forming part of the Sydney-Gunnedah-Bowen system comprising Permian and Triassic rocks and significant coal measures. Recent focus has concentrated on the Gunnedah’s CSG potential. Local major Santos has booked 1,500PJ of 2P Gunnedah CSG reserves, and in 2011 it announced plans to drill 1,100 new CSG development wells. Those plans were shelved with the NSW moratorium on hydraulic fracturing.
A spur from the Moomba-Sydney high-pressure pipeline extends through the southern reaches of the Gunnedah to Tamworth. CSG already fires the 16MW Wilga Park power station near Narrabri, which has been operating since 2004. Both expansion and new build generation options exist.
Comet Ridge Dart Santos TRUenergy
Otway 60,000km2 onshore/offshore Late Jurassic-Cainozoic basin spanning the SA/VIC border, the majority of which lies offshore. Mature E&P history, comprising c 200 wells and production history dating to 1979. 19 onshore producing gas fields in VIC feeding three onshore gas plants, each <20bcf GIP. Unconventional focus lies on shale oil and gas potential of the Casterton Fm and the Upper and Lower Sawpit shales.
Located around halfway between the major cities of Melbourne and Adelaide with well-established existing infrastructure. Gas pipeline travels through the basin between the two cities.
Armour Cooper Beach Lakes Oil Origin
Surat 270,000km2 Jurassic to Cretaceous basin spanning southern QLD/northern NSW containing expansive coal measures typically in 300-600m depth window. Commercial CSG viability was demonstrated with QGC’s Argyle-1 well in 2000, with commercial production commencing 2006. Surat coal lies shallower than in the Bowen and is therefore less thermally mature, with lower gas saturation, although higher Surat coal permeability provides a significant offset. Surat 2P reserves now exceed 235tcf.
The Surat surrounds the Roma to Brisbane pipeline providing direct access to market. Three separate new c 500km high-pressure pipelines are being laid by operators of each of the three Curtis Island LNG projects, providing very substantial new export capacity.
Blue Icon Origin Santos Senex
BG ConocoPhillips CNOOC KOGAS Petronas Shell Sinopec Total
Sydney 64,000km2 (of which 36,000km2 onshore). Part of a larger basin system that stretches from the Bowen Basin in QLD to the Gunnedah Basin in NSW. Includes both onshore and offshore components, with a drilling history of more than 100 wells onshore. The Basin is prospective for both conventional and unconventional (CSG and shale) resource. AGL’s Camden CSG project has been producing since 2001 and remains the only producing resource in the Basin.
Sydney Basin lies beneath major West Coast centres, including Sydney, Newcastle and Wollongong, with extensive existing infrastructure. An expansion of the Camden project was suspended in early-2013 to address community concerns.
AGL
Source: Edison Investment Research

Onshore down under | 15 August 2013 21
Case studies: Onshore sector deal baselines
Having outlined the top-down technical and market contexts that define the Australian onshore sector, we now narrow our focus to bottom-up practical aspects of valuation. To inform a view on the potential fair value of the unconventional onshore components of Australian E&P player portfolios, it is necessary to analyse for relevant pricing benchmarks and proxies. To this end, in this section we present two case studies to highlight recent sector deal trends as we work toward establishing and applying our valuation framework.
Case study 1: The IOC equity farm-in boilerplate A dominant theme over the past two to three years has been a surge of IOC interest in, and entry to, the Australian onshore sector. At least 10 such deals have been completed (Exhibit 15). The conceptual merits of IOCs taking an Australian position are clear – in addition to ticking first-principle boxes of plausibility (the presence of a working hydrocarbon system) and materiality (of a scale sufficient to justify allocating highly mobile corporate labour and capital resource), Australia’s country risk profile presents as extremely appealing.
Exhibit 15: IOC/major player onshore frontier basin Australia farm-in deals Announced Entrant Vendor Play Deal outline Inferred
A$/acre Jun 2013 Statoil Petrofrontier Southern
Georgina Revised farm-in agreement to initial June 2012 agreement affording Statoil more favourable earn-in terms, in part reflecting PFC’s own funding challenges since H212.
16.5
Feb 2013 Petrochina Conoco Phillips
Canning Basin ConocoPhillips sell-down of 29% stake in its c 45,000km2 Canning Basin Goldwyer project for (reported by NSE) cash-only outlay of US$29m. Petrochina will likely fund its forward share of JV costs, hence lower entry price relative to that inferred by NSE cost carry.
9.8
Nov 2012 Total Central Petroleum
Southern Georgina
Total and CTP agree to US$190m work programme, of which Total will fund US$152m (80%). Deal includes Total funding first US$48m of Phase 1, with CTP the last US$12m.
41.0
Oct 2012 Santos Central Petroleum
Amadeus & Pedirka basins
Santos to spend up to A$150m in three milestone stages (A$30m+A$60m+A$60m) for maximum of 70% stake in 13 permits totalling c 80,000km2 (19.8m acres).
10.8
Sept 2012 Buru Gujarat NRE
Canning Basin Buru acquiring 90% stake in Fitzroy Blocks project from Gujarat for A$36m, following which it on-sold 37.5% and 15% stakes respectively to Mitsubishi and Rey Resources.
15.2
Jun 2012 Statoil Petrofrontier Southern Georgina
Statoil to fund US$210m toward US$230m JV work programme, subsequently superseded by June 2013 revised farm-in agreement (above).
24.3
Sept 2011 Conoco Phillips
New Standard
Canning Basin ConocoPhillips to fund US$109.5m work programme over four phases to earn a 75% stake in c 45,000km2 of NSE’s Canning permits. NSE receives A$1m plus full cost carry.
14.3
May 2011 Hess Falcon Oil & Gas
Beetaloo Hess to earn a 62.5% interest in c 25,200km2 of Falcon Beetaloo permits for a US$60m potential spend programme. In July 2013, Falcon informed that Hess had not met farm-in work commitment obligations and that as a consequence it had forfeited its rights under the agreement. Falcon therefore reclaims its starting 100% interest.
16.8
Dec 2010 CNOOC Exoma Galilee CNOOC to fund A$50m work programme, including full cost carry for Exoma to earn 50% stake in Exoma’s Galilee Basin permits.
15.1
Jun 2010 Mitsubishi Buru Canning Basin Mitsubishi to earn a 50% stake in Buru’s Canning permits for funding 80% of an agreed three-year A$178m work programme, including A$50m on development costs.
50.8
Source: Company announcements, Edison Investment Research
For IOCs (and, of course, their potential suitors) issues of deal structure and pricing are typically the two most defining deal elements. Each is extremely important, as the experiences in the Australian sector in recent years have shown.
1. Deal structure Deals in the Australian sector have to date shown a predictable tendency to reflect North American precedent, albeit with an unsurprisingly stronger emphasis on funded work programmes in place of cash-rich up-front entry payments. This is entirely sensible and in keeping with shared JV incentives to de-risk what are by comparison typically much earlier-stage plays. The deal recipe is usually of IOCs undertaking to commit to multi-staged contingent work programmes, which, if completed to their full pre-defined term, will deliver the new entrant a prescribed equity stake in the play. Withdrawal or non-performance against any milestone often results in the farminor relinquishing all contingent equity rights (‘part-performance’ is often not recognised in any progressive earning of equity), as well as any spend already incurred.
Onshore down under | 15 August 2013 22
Among deals already completed, we consider there are a number of key learnings and takeaways for junior players. Some are obvious, but have clearly been overlooked or underestimated in the course of JVs struck to date:
Own-funding: Deals completed to date have tended to include either a part or full cost-carry component. Where under a part-carry vendors are obliged to contribute capital to the JV, care must be taken to ensure funding arrangements are in hand. If funding becomes an issue that cannot otherwise be resolved, the farminee may face the unenviable prospect of needing to re-approach the farminor to renegotiate terms to provide for a greater carry component. Such a scenario is very likely to result in the farminee’s ability to extract more favourable buy-in terms than was the case under the initial deal. This is exactly the scenario that appears to have panned out with the recent renegotiation of commercial terms between Petrofrontier and Statoil, following Petrofrontier facing its pending inability to contribute its agreed (but still heavily subsidised) share of JV work programme funding in early-2013. This scenario unfolded within just six months of the original June 2012 farm-in deal with Statoil.
Third-party decision making: Do not discount the potential impact on deal execution and/or completion of “subject to” conditions that may fall beyond the decision-making mandate of direct counterparties. An example has been that of Exoma and CNOOC agreeing on two separate occasions for CNOOC to take a cash-backed equity cornerstone stake in Exoma, subject to Chinese overseas investment authority approvals. Despite CNOOC’s support for the proposal, in both cases approval from Chinese authorities was not received, meaning each deal fell over. Partly as a consequence, Exoma has been left hamstrung without the financial backing necessary to participate meaningfully in the substantial JV work programme still required to advance what remains very early-stage Galilee Basin acreage.
Operational delivery focus: In cases where junior farminees retain operatorship, it is critical that work programmes are delivered to JV time and cost expectations. Failure to do so risks farminor push back and with it the potential for renegotiation and/or IOC exit. There are multiple cases where JV expectations could not be met due to operational constraints, some of which are beyond the operator’s direct control such as severe availability constraints in some parts of Australia with regard to rigging and infrastructure.
2. Pricing Australian juniors routinely cite North American transaction metrics in promoting blue sky valuation scenarios. These comparisons look through the very many differences that exist between the two regions, to which we have already alluded. First principle issues of play viability, work programme intensity, infrastructure access, services access, operating cost base, partner capability and regulatory environments each differ greatly between geographies. If a direct comparison were made on any one of these criteria, we would argue that Australia would come a distant second. A steep discount to US analogues is entirely justified – the question is one of extent.
While entry deals on mature North American unconventional acreage have tended to fall within a US$5,000 to US$20,000/acre band (typically higher for liquids rich, lower for gas), completions on early-stage unconventional acreage have resulted in valuations closer to US$100-200/acre. This compares to analogous Australian deals, which tended to be in a range of US$10 to US$50/acre. The inference therefore is that of Australian acreage selling at a discount of between 50% and 95% to possibly comparable unconventional North American acreage.
Another analogue worth noting is the inferred valuations of IOC farm-ins to more mature Australian acreage. Two recent deals of note in this space have seen IOCs move to secure positions over the Nappamerri Trough basin centred gas accumulation in the Cooper Basin, inferring an entry value range of A$600 to A$1,200/acre (US$550 to US$1,100/acre). Therefore, the further inference is that Australian emerging (mature oil and gas region, but not play) unconventional acreage is trading at a premium of at least 10x and as much as 100x compared to Australian frontier acreage.
Onshore down under | 15 August 2013 23
Exhibit 16: IOC/major player Cooper Basin Australia farm-in deals Announced Farminor
Buyer Farminee Vendor
Play Deal outline Inferred A$/acre
Jul 2013 Santos Drillsearch PELs 106A&513 Santos to fund A$120m work programme across both permits for 60% stake in each. 449.0 Feb 2013 Chevron Beach PEL 218 Three-staged farm-in with Chevron funding a potential US$254m spend for 60% stake. 1,165.6 Feb 2013 Chevron Beach ATP 855P Two-staged farm-in with Chevron funding a potential US$95m spend for 36% stake. 695.4 Feb 2013 BG Drillsearch ATP 940P Three-staged farm-in with BG funding a potential A$130m JV spend for 60% stake. 485.6 Source: Company accounts, Edison Investment Research
Case study 2: Prepaid gas (PPG) as a funding instrument While IOC farm-ins have tended to account for most of the sector’s recent deal flow and headlines, another analogous but to date much less common funding structure is also finding increasing uptake in the Australian sector. While deal specifics again vary with each agreement, the basic concept involves large downstream gas users establishing bilateral funding relationships with upstream explorers in the shared objective of incentivising new gas to market. Due to the downstream party accepting a component of E&P risk with their funding exposure, the commercial relationship goes well beyond that of gas transacting. In most cases, physical gas may not flow until a number of years after the downstream buyer has actually ‘paid’ for some or all of that gas.
In the few deals completed to date, the common commercial theme is of downstream parties funding E&P work programmes for which they receive a discounted tariff on a pre-defined tranche of contingent, future-supplied gas. We refer to such gas parcels as Prepaid Gas (PPG).
The key terms of the three major deals completed to date are summarised in Exhibit 18. Notably, the downstream counterparties involved represent two of Australia’s industrial heavyweights, Alcoa (the world’s largest bauxite miner and aluminium refiner) and Orica (the world’s largest supplier of commercial explosives to the mining and infrastructure markets).
Exhibit 17: Farm-in vs Prepaid Gas deal architecture comparisons Variable Farm-in structure Prepaid Gas structure Funding structure Farminor typically part- or fully funds work
programmes agreed by permit JVs, providing cost carry to farminee on terms prescribed in farm-out agreement.
Downstream counterparty typically part- or fully funds work programmes agreed by permit JVs, providing cost carry to field explorer/developer on terms prescribed in PPG agreement
Consideration received by funding entity
On completion of work programme prescribed in farm-out agreement, farminor receives assignment from farminee of pre-determined equity stake in field JV.
On commissioning of production facilities, delivery of Prepaid Gas at discounted rate on terms prescribed in commercial supply agreements.
Commercial resource delineation
Ringfenced to permit specific, such that farm-out deal specifies land tenements to which equity title will apply.
Typically ringfenced to permit holdings. Potential also to broaden to corporate supply obligation if parties agree.
Timings Varies from extreme early stage (frontier, proof-of-concept focus, years from resource delineation/ commercialisation) through to nearer term (appraisal/development).
Usually short- to medium-term horizon, where proof-of-concept has been established and resource defined. Focus more on appraisal/development timeline, typically within a two- to four-year horizon.
Decision points Typically milestone-dependent with staged stop/go decisions providing for continuation and exit rights.
Typically milestone-dependent with staged stop/go decisions providing for continuation and exit rights.
Potential for claw back remedies on exploration failure
Typically none, reflecting farminor participation in JV, and therefore project risk.
Provision for repayment of funding if commitment by operator to develop the resource to which the funding relates is not made. Funder often secured fixed charge over project assets.
JV exit consequences Varies by deal, but typically farminor relinquishes all equity rights on election not to continue funding to amounts prescribed in farm-in agreement up to the point of completion, when title is released.
Varies by deal, but funding party typically has recourse to venture assets.
Source: Company announcements, Edison Investment Research
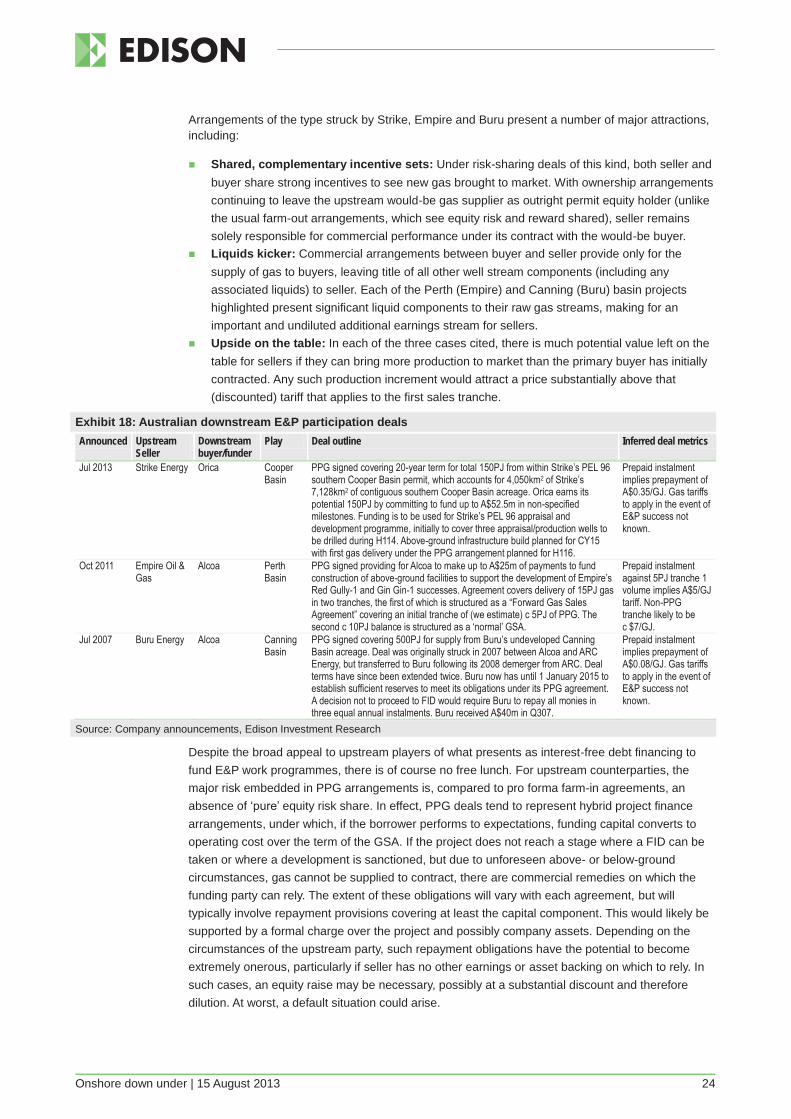
Onshore down under | 15 August 2013 24
Arrangements of the type struck by Strike, Empire and Buru present a number of major attractions, including:
Shared, complementary incentive sets: Under risk-sharing deals of this kind, both seller and buyer share strong incentives to see new gas brought to market. With ownership arrangements continuing to leave the upstream would-be gas supplier as outright permit equity holder (unlike the usual farm-out arrangements, which see equity risk and reward shared), seller remains solely responsible for commercial performance under its contract with the would-be buyer.
Liquids kicker: Commercial arrangements between buyer and seller provide only for the supply of gas to buyers, leaving title of all other well stream components (including any associated liquids) to seller. Each of the Perth (Empire) and Canning (Buru) basin projects highlighted present significant liquid components to their raw gas streams, making for an important and undiluted additional earnings stream for sellers.
Upside on the table: In each of the three cases cited, there is much potential value left on the table for sellers if they can bring more production to market than the primary buyer has initially contracted. Any such production increment would attract a price substantially above that (discounted) tariff that applies to the first sales tranche.
Exhibit 18: Australian downstream E&P participation deals Announced Upstream
Seller Downstream buyer/funder
Play Deal outline Inferred deal metrics
Jul 2013 Strike Energy Orica Cooper Basin
PPG signed covering 20-year term for total 150PJ from within Strike’s PEL 96 southern Cooper Basin permit, which accounts for 4,050km2 of Strike’s 7,128km2 of contiguous southern Cooper Basin acreage. Orica earns its potential 150PJ by committing to fund up to A$52.5m in non-specified milestones. Funding is to be used for Strike’s PEL 96 appraisal and development programme, initially to cover three appraisal/production wells to be drilled during H114. Above-ground infrastructure build planned for CY15 with first gas delivery under the PPG arrangement planned for H116.
Prepaid instalment implies prepayment of A$0.35/GJ. Gas tariffs to apply in the event of E&P success not known.
Oct 2011 Empire Oil & Gas
Alcoa Perth Basin
PPG signed providing for Alcoa to make up to A$25m of payments to fund construction of above-ground facilities to support the development of Empire’s Red Gully-1 and Gin Gin-1 successes. Agreement covers delivery of 15PJ gas in two tranches, the first of which is structured as a “Forward Gas Sales Agreement” covering an initial tranche of (we estimate) c 5PJ of PPG. The second c 10PJ balance is structured as a ‘normal’ GSA.
Prepaid instalment against 5PJ tranche 1 volume implies A$5/GJ tariff. Non-PPG tranche likely to be c $7/GJ.
Jul 2007 Buru Energy Alcoa Canning Basin
PPG signed covering 500PJ for supply from Buru’s undeveloped Canning Basin acreage. Deal was originally struck in 2007 between Alcoa and ARC Energy, but transferred to Buru following its 2008 demerger from ARC. Deal terms have since been extended twice. Buru now has until 1 January 2015 to establish sufficient reserves to meet its obligations under its PPG agreement. A decision not to proceed to FID would require Buru to repay all monies in three equal annual instalments. Buru received A$40m in Q307.
Prepaid instalment implies prepayment of A$0.08/GJ. Gas tariffs to apply in the event of E&P success not known.
Source: Company announcements, Edison Investment Research
Despite the broad appeal to upstream players of what presents as interest-free debt financing to fund E&P work programmes, there is of course no free lunch. For upstream counterparties, the major risk embedded in PPG arrangements is, compared to pro forma farm-in agreements, an absence of ‘pure’ equity risk share. In effect, PPG deals tend to represent hybrid project finance arrangements, under which, if the borrower performs to expectations, funding capital converts to operating cost over the term of the GSA. If the project does not reach a stage where a FID can be taken or where a development is sanctioned, but due to unforeseen above- or below-ground circumstances, gas cannot be supplied to contract, there are commercial remedies on which the funding party can rely. The extent of these obligations will vary with each agreement, but will typically involve repayment provisions covering at least the capital component. This would likely be supported by a formal charge over the project and possibly company assets. Depending on the circumstances of the upstream party, such repayment obligations have the potential to become extremely onerous, particularly if seller has no other earnings or asset backing on which to rely. In such cases, an equity raise may be necessary, possibly at a substantial discount and therefore dilution. At worst, a default situation could arise.
Onshore down under | 15 August 2013 25
Considerations in framing PPG arrangements We believe the following observations and conclusions are worthy of emphasis when considering the suitability and appropriateness of PPG arrangements:
Play confidence: PPG arrangements tend only to be appropriate where confidence in the play is sufficiently high to support a debt-based instrument. This would tend to infer that plays should at least be at the appraisal stage of development.
Route to market: To attract a potential downstream funding counterparty, any resource needs to have a visible route to market. Remote and disconnected regions are at a substantial disadvantage.
Betting the house: Would-be suppliers must be conscious of the downside scenario obligations that accompany development risk. With a small onshore gas-condensate plant typically drawing a capex budget of A$25-35m, if that amount is fully funded (and therefore fully recoverable under a downside outcome) under a PPG deal, a repayment obligation of this magnitude could prove unmanageable for a junior. Ideally, PPG arrangements should sit beside producing existing assets as part of a portfolio of producing and funding arrangements.
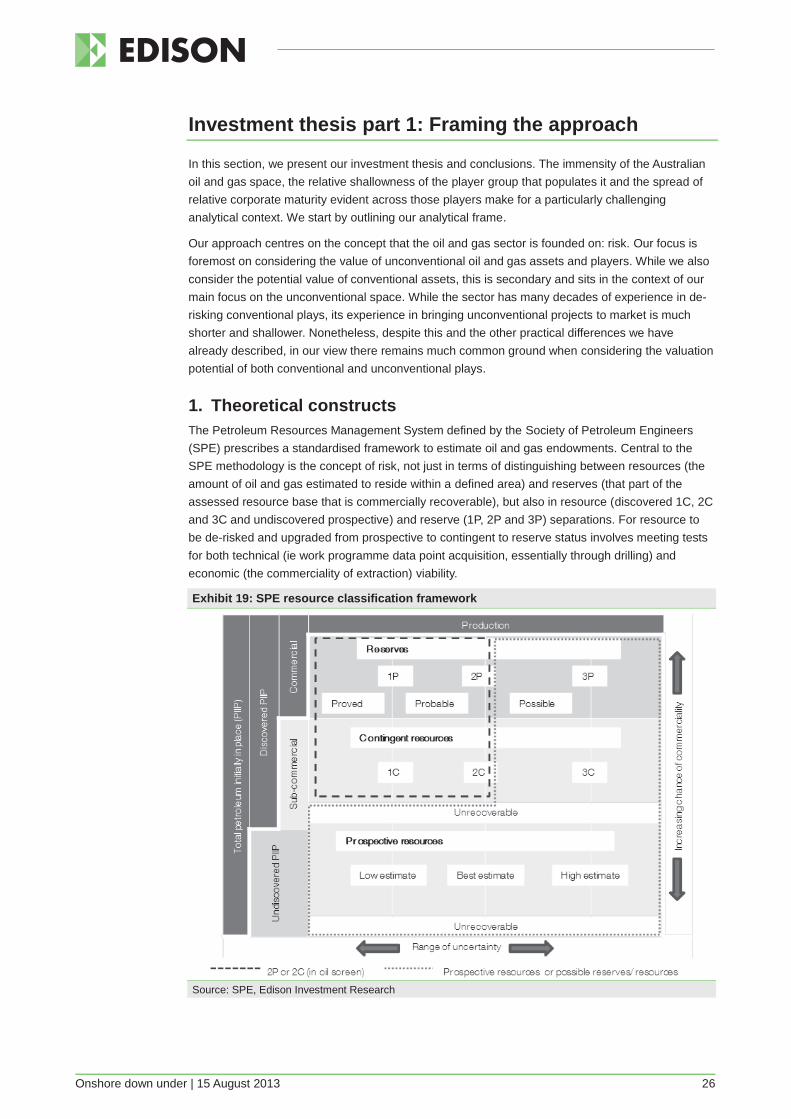
Onshore down under | 15 August 2013 26
Investment thesis part 1: Framing the approach
In this section, we present our investment thesis and conclusions. The immensity of the Australian oil and gas space, the relative shallowness of the player group that populates it and the spread of relative corporate maturity evident across those players make for a particularly challenging analytical context. We start by outlining our analytical frame.
Our approach centres on the concept that the oil and gas sector is founded on: risk. Our focus is foremost on considering the value of unconventional oil and gas assets and players. While we also consider the potential value of conventional assets, this is secondary and sits in the context of our main focus on the unconventional space. While the sector has many decades of experience in de-risking conventional plays, its experience in bringing unconventional projects to market is much shorter and shallower. Nonetheless, despite this and the other practical differences we have already described, in our view there remains much common ground when considering the valuation potential of both conventional and unconventional plays.
1. Theoretical constructs The Petroleum Resources Management System defined by the Society of Petroleum Engineers (SPE) prescribes a standardised framework to estimate oil and gas endowments. Central to the SPE methodology is the concept of risk, not just in terms of distinguishing between resources (the amount of oil and gas estimated to reside within a defined area) and reserves (that part of the assessed resource base that is commercially recoverable), but also in resource (discovered 1C, 2C and 3C and undiscovered prospective) and reserve (1P, 2P and 3P) separations. For resource to be de-risked and upgraded from prospective to contingent to reserve status involves meeting tests for both technical (ie work programme data point acquisition, essentially through drilling) and economic (the commerciality of extraction) viability.
Exhibit 19: SPE resource classification framework
Source: SPE, Edison Investment Research

Onshore down under | 15 August 2013 27
Importantly, there are substantial differences in the treatment of conventional and unconventional resources. As conventional reservoirs comprise discrete accumulations in defined traps, subsurface data typically provide a strong technical understanding of the deposit area. Unconventional reservoirs by contrast are laterally continuous at depth and often stretch over very large areas. As a result, the data collection process of proving the technical and commercial viability becomes a much more substantial forward proposition. In mature oil and gas provinces where there is a substantial and concentrated drilling history, such as in parts of the US and to a lesser extent parts of each of the Cooper, Surat and Bowen basins in Australia, the quantity and quality of datapoints support a high degree of confidence in resource estimates. In regions where there are far fewer datapoints, as is the case in most frontier regions of Australia, very much more exploration and appraisal work (and therefore time and expense) is required to build the databases necessary to de-risk initial assessments. In more mature regions it is not usually necessary for operators to go to the expense of completing the full extent of subsurface work required to upgrade resource to reserve, instead relying on subsurface conformity to conclude the necessary confidence that the pervasive conditions exist across the extent of the laterally mapped play.
2. Valuation constructs Conventional bottom-up oil and gas valuation methodologies rely on DCF modelling to analyse for the net economic value of player asset portfolios. This approach, which we set out in Edison’s Oil & gas research principles, separately models the present value contribution from producing assets (‘core NAV’, as we define it) and risk-weighted upside from exploration and early-stage appraisal activities (‘RENAV’). Quantitative modelling conclusions are integrated with our assessment against six qualitative evaluation criteria to determine our overall investment view. As we explain below, in mature market settings where there is a high degree of confidence in both below-ground and above-ground conditions, core NAV and RENAV conclusions can be extrapolated to produce top-down proxies to value undeveloped assets. Such proxies typically include $/boe for discrete (conventional) subsurface plays or $/acre for laterally continuous (unconventional) plays. This approach reflects the basis on which the North American unconventional sector has in recent times been priced, itself largely reflecting the maturity of the sector and the continuous nature of unconventional (particularly shale) plays.
De-risking also the central investment theme As is the case for how SPE guidelines address individual resource endowments, the key theme connecting bottom-up and top-down methodologies is de-risking. In the case of many of the companies in our universe, the current lack of below-ground knowledge and above-ground monetisation routes means there is no basis on which DCF modelling can reliably be framed. Even if a hypothetical DCF valuation scenario was framed, the risk discounting that would necessarily be applied would render results almost meaningless. However, this is not the case with our full universe. A number of companies can point to an asset portfolio, which comprises one or more projects that are well advanced to commercialisation. Further still, a number of companies have producing assets or a suite of assets with an established and successful production track record.
Catching the S-curve inflection As projects are de-risked, so do project valuations, reducing the dilution to unrisked valuations. For their owners, the de-risking process is a typically long and systematic process of technical and commercial proportions. However, for the markets, which act on imperfect information, newsflow is often episodic and can result in very concentrated periods of value uplift, particularly during the feasibility and appraisal stages (Exhibit 20). The challenge for investors is to front-run newsflow by analysing where a project or company is on its development path versus where the market is valuing it. To thoroughly assess this requires a deep analysis of the key above- and below-ground parameters of a player’s business, and a bottom-up view of its potential earnings outlook.

Onshore down under | 15 August 2013 28
Exhibit 20: Representative unconventional play/player maturation S-curve
Source: Edison Investment Research
3. Weaknesses in applying traditional boilerplate approaches When looking at standardised measures such as reserve and resource estimates, there is a natural tendency to compare top-down metrics across players to support analysis for where companies sit on their respective development curves. While this is a useful exercise, it is also one that must be treated with significant caution. To illustrate this, we highlight two examples where reliance on top-down benchmarks by markets can lead to shortsightedness when inferring market values across seemingly comparable assets and securities.
3.1 Deal-backed risk-based valuations largely ignored by the market
A number of the most active juniors in the onshore sector can reasonably be thought of currently as acreage plays. In other words, players that have established their business models around acquiring very large acreage positions, partly on the belief that unconventional plays may stretch across large areas within their tenements. In a number of cases, conventional plays have also been shown to exist within permit acreage. Acreage is infrequently traded, making for an illiquid valuation frame. Nonetheless, the presence of a number of recent and relevant bilateral deals (refer Exhibits 15 and 16) allows for valuation proxies to be drawn for acreage vendors. Exhibit 21 summarises the A$/acre multiples observed from each deal.
Exhibit 21: Deal-backed acreage valuations
Source: Company disclosures, Edison Investment Research
0%
5%
10%
15%
20%
25%
1 2 3 4 5 6 7 8 9 10 11 12 13 14 15 16 17 18 19Concept● geologic archive● seismic archive● resource focus
Concept● geologic archive● seismic archive● resource focus
Concept● geologic archive● seismic archive● resource focus
Concept● regional interp.● acquire acreage● desktop focus
Play
/play
er
matur
ityUn
conv
entio
nal v
aluati
onba
sis
(log s
cale)
Pre-Feasibility● resource focus● G&G● 2D seismic
Appraisal● horizontal well successs● pilot production● reserve certification
Production● facility dpvmt, mktg● steady state prdn● scale focus
North Americac A$15k-30k/acre
Frontier≤A$40/acre
Emergingc A$100/acre
Success-backed growthc A$1k/acre
Development● prdn well drilling● marketing● delivery focus
Proving-upc A$5k-A$10k/acre
Early-Stage Appraisal● vertical well success● 3D seismic● frack response
Feasibility● initial drilling● sampling & testing● interp.
Cann
ing
Amad
eus+
Pedir
ka
Cann
ing
Galile
e
Cann
ing
South
ern G
eorg
ina
Beeta
loo
Amad
eus+
Pedir
ka
South
ern G
eorg
ina
Cann
ing
Coop
er
Coop
er
Coop
er
Coop
er
1
10
100
1,000
10,000
Cono
co-P
etroc
hina
CTP-
Santo
s
NSE-
Cono
co
EXE-
CNOO
C
Gura
rat-B
RU
PFC-
Stato
il
Falco
n-He
ss
PFC-
Stato
il
CTP-
Total
BRU-
Mitsu
bishi
DLS-
STO
DLS-
BG
BPT-
Chev
ron
BPT-
Chev
ron
A$/ac
re (lo
g sca
le)

Onshore down under | 15 August 2013 29
Exhibit 22 presents our analysis for valuation discounts and/or premiums implied by completed IOC farm-in deals. In constructing this analysis, we have assumed:
deal-backed valuations consistent with completed IOC farm-outs; valuations for company acreage not covered by farm-out valued at 50% loading to A$/acre
implied by farm-out deals. Note where multiple deals apply (for example Central Petroleum’s separate Q412 deals with Total and Santos), a weighted average A$/acre metric is applied; and
net cash at 30 June 2013. No allowance made for G&A or other company specific adjustments.
The trend is clearly one of the financial markets steeply discounting transaction multiples that industry is willing to pay to enter acreage. This tallies closely our conclusions for other regions (eg for Africa, see Exhibit 23), where we concluded that the market tends to value acreage at only 20-30% of what industry is willing to ascribe. From our analysis, with one exception (Buru Energy, discussed below), the extent of discount observable in the onshore Australian space is even more severe. Although only a small sample set, we infer that across the acreage companies in our universe, excluding Buru, market valuations average just 15% of farm-out valuations. That some companies (Central Petroleum and Buru in particular) also offer firm NAV from as yet un-commercialised conventional discoveries, adds further weight to the discounting observation on acreage alone.
Exhibit 22: Onshore Australia farm-out valuations vs equities
Exhibit 23: Africa farm-out valuations vs equities
Source: Edison Investment Research Source: Edison Investment Research
3.2 Reserve assessments must also be treated with caution
Just as there are caveats and cautions involved in observing and applying deal-backed benchmarks, similar caution must be exercised in interpreting some industry backed benchmarks. In this space, investors are often drawn to headline reserve benchmarks as a first-cut materiality screen, with 2P reserves and 2C resources the most common starting reference point. The cases of two players (one positive, one negative) from our universe demonstrate the importance of looking beneath headline numbers to understand important second-order commercial drivers that affect value, and why deeper analysis is always prudent and important.
The downside 2P scenario: Metgasco
Metgasco presents a 2P CSG reserve base of 428PJ (71mmboe) and a 2C resource estimate of 2,511PJ (419mmboe), positioning it as a potentially major emerging Eastern market gas player. However, within its headline numbers is the fact that all Metgasco’s resource is delineated in NSW’s Clarence Moreton Basin. The rise in the CSG protest movement in NSW and a consequential loss in political support for the sector from the NSW state government over the past one to two years have resulted in a range of major new land-use constraints being imposed on CSG players in NSW. In Q113, Metgasco, along with other NSW CSG players, decided that the deterioration in operating
050
100150200250300350400
0 10 20 30 40 50
A$m
Acres m
Farm-out values Equity values
Trend: farm-out values
Trend: player EVs
0
50
100
150
200
250
0 1,000 2,000 3,000 4,000 5,000
US$m
Unrisked net resources, mmboeEquity values Farm-out values
Trend: player EVs
Trend: farm-out values

Onshore down under | 15 August 2013 30
conditions did not support the continuation of advancing its investment plans, and it has since ceased its NSW work programme. Thus, while Metgasco’s gas 2P gas resource may theoretically be worth perhaps A$3 billion in nominal revenue terms, it is effectively stranded and will stay in the ground for the foreseeable future.
See our Metgasco company profile for further background.
The upside 2P scenario: Linc Energy
Linc presents a 2P oil reserve base of 168mmbbl, meaning that its net 2P backing is equivalent in scale to the combined size of the three mature players we define in our Established category. All Linc’s 2P base is centred in an undeveloped oil field in Umiat, Alaska. In addition, Linc boasts an existing net producing base of more than 3,200b/d from a suite of Texan Gulf Coast assets and 100% of 17.5m acres of Arckaringa Basin frontier acreage independently assessed to hold more than 100bnboe. Linc also holds a suite of further assets, including underground coal and gas-to-liquids projects. It also holds a A$2/t revenue royalty related to coal assets it sold to Adani, an Indian conglomerate, which is now looking to develop a world-scale coal mining operation.
Despite the extent of its asset suite and what presents as deeply impressive growth prospects, Linc is trading on an EV/2P of just A$7.9/boe, which is more akin to what could be expected of a mature, low-growth producer. There are a number of potential reasons why the market could be discounting Linc to the apparent substantial extent. They could include investor concern about the likelihood of its Alaskan assets being developed, to concern over governance arrangements. In our view, the issues distil largely to the relative complexity of Linc’s asset suite, and therefore investment case and the difficulty investors have in ascribing value to different parts of Linc’s business. For example, our calculations suggest that the post-tax unrisked NPV10 of the potential royalty stream from Adani’s (as yet undeveloped) QLD coal project could on its own support half Linc’s current share price.
See our Linc company profile for further background.
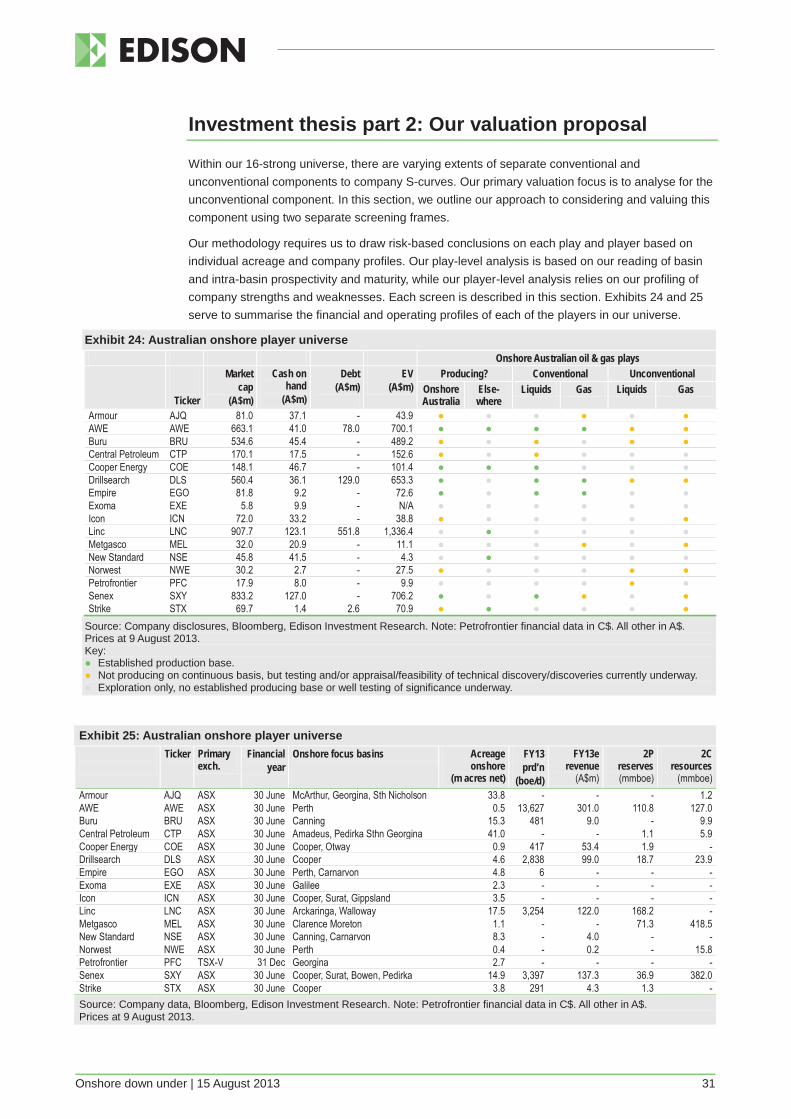
Onshore down under | 15 August 2013 31
Investment thesis part 2: Our valuation proposal
Within our 16-strong universe, there are varying extents of separate conventional and unconventional components to company S-curves. Our primary valuation focus is to analyse for the unconventional component. In this section, we outline our approach to considering and valuing this component using two separate screening frames.
Our methodology requires us to draw risk-based conclusions on each play and player based on individual acreage and company profiles. Our play-level analysis is based on our reading of basin and intra-basin prospectivity and maturity, while our player-level analysis relies on our profiling of company strengths and weaknesses. Each screen is described in this section. Exhibits 24 and 25 serve to summarise the financial and operating profiles of each of the players in our universe.
Exhibit 24: Australian onshore player universe Onshore Australian oil & gas plays
Ticker
Market cap
(A$m)
Cash on hand
(A$m)
Debt (A$m)
EV (A$m)
Producing? Conventional Unconventional Onshore Australia
Else-where
Liquids Gas Liquids Gas
Armour AJQ 81.0 37.1 - 43.9 ● ● ● ● ● ● AWE AWE 663.1 41.0 78.0 700.1 ● ● ● ● ● ● Buru BRU 534.6 45.4 - 489.2 ● ● ● ● ● ● Central Petroleum CTP 170.1 17.5 - 152.6 ● ● ● ● ● ● Cooper Energy COE 148.1 46.7 - 101.4 ● ● ● ● ● ● Drillsearch DLS 560.4 36.1 129.0 653.3 ● ● ● ● ● ● Empire EGO 81.8 9.2 - 72.6 ● ● ● ● ● ● Exoma EXE 5.8 9.9 - N/A ● ● ● ● ● ● Icon ICN 72.0 33.2 - 38.8 ● ● ● ● ● ● Linc LNC 907.7 123.1 551.8 1,336.4 ● ● ● ● ● ● Metgasco MEL 32.0 20.9 - 11.1 ● ● ● ● ● ● New Standard NSE 45.8 41.5 - 4.3 ● ● ● ● ● ● Norwest NWE 30.2 2.7 - 27.5 ● ● ● ● ● ● Petrofrontier PFC 17.9 8.0 - 9.9 ● ● ● ● ● ● Senex SXY 833.2 127.0 - 706.2 ● ● ● ● ● ● Strike STX 69.7 1.4 2.6 70.9 ● ● ● ● ● ●
Source: Company disclosures, Bloomberg, Edison Investment Research. Note: Petrofrontier financial data in C$. All other in A$. Prices at 9 August 2013. Key: ● Established production base. ● Not producing on continuous basis, but testing and/or appraisal/feasibility of technical discovery/discoveries currently underway. ● Exploration only, no established producing base or well testing of significance underway.
Exhibit 25: Australian onshore player universe
Ticker Primary exch.
Financial year
Onshore focus basins Acreage onshore
(m acres net)
FY13 prd’n
(boe/d)
FY13e revenue
(A$m)
2P reserves (mmboe)
2C resources
(mmboe) Armour AJQ ASX 30 June McArthur, Georgina, Sth Nicholson 33.8 - - - 1.2 AWE AWE ASX 30 June Perth 0.5 13,627 301.0 110.8 127.0 Buru BRU ASX 30 June Canning 15.3 481 9.0 - 9.9 Central Petroleum CTP ASX 30 June Amadeus, Pedirka Sthn Georgina 41.0 - - 1.1 5.9 Cooper Energy COE ASX 30 June Cooper, Otway 0.9 417 53.4 1.9 - Drillsearch DLS ASX 30 June Cooper 4.6 2,838 99.0 18.7 23.9 Empire EGO ASX 30 June Perth, Carnarvon 4.8 6 - - - Exoma EXE ASX 30 June Galilee 2.3 - - - - Icon ICN ASX 30 June Cooper, Surat, Gippsland 3.5 - - - - Linc LNC ASX 30 June Arckaringa, Walloway 17.5 3,254 122.0 168.2 - Metgasco MEL ASX 30 June Clarence Moreton 1.1 - - 71.3 418.5 New Standard NSE ASX 30 June Canning, Carnarvon 8.3 - 4.0 - - Norwest NWE ASX 30 June Perth 0.4 - 0.2 - 15.8 Petrofrontier PFC TSX-V 31 Dec Georgina 2.7 - - - - Senex SXY ASX 30 June Cooper, Surat, Bowen, Pedirka 14.9 3,397 137.3 36.9 382.0 Strike STX ASX 30 June Cooper 3.8 291 4.3 1.3 - Source: Company data, Bloomberg, Edison Investment Research. Note: Petrofrontier financial data in C$. All other in A$. Prices at 9 August 2013.

Onshore down under | 15 August 2013 32
Our first screen takes an asset perspective by benchmarking our analysis of each of the major onshore basin plays currently being progressed in the Australian space. To a significant extent, this first screen can be thought of as a below-ground test to identify which of the basin plays currently presents as the most prospective and time-scale advanced based on the apparent level of understanding and development in each.
Our second screen cross-sections this by taking a view on the relative risk profiles of each of the players in our universe (Exhibit 25). This screen has more of an above-ground focus by taking a relative view on the institutional strengths and weaknesses of the players working the basin plays highlighted in the first screen.
We then compound the scores from the separate screens and apply market-determined value estimates for plays of increasing maturity to enable risked EMVs to be derived. We then set conclusions on the resulting inferred market values versus where the market is pricing each stock.
Screen 1: Play benchmarking From our analysis of the main onshore basins in the onshore Australian space, we have taken a view as to the relative maturity stage each basin play has reached. Based on our reading of each basin’s overall profile, we have grouped each into the seven categories summarised in Exhibit 26. The criteria we use to define our groupings is summarised in Exhibit 26.
An important caveat is that we recognise that by pigeon-holing basins into one of the seven discrete categories, we implicitly over-simplify the maturation process at two important levels: 1. Intra-basin spread: Within basins there can be substantial differences in relative life cycle
stages across different plays. For example, the level of understanding about the southern flank of the Eromanga Basin (in the Cooper region) is substantially more advanced than is the case in its central and northern regions.
2. Transition: Similarly, pigeon-holing overlooks variations in intra-stage work programmes in the process of graduating from one level to the next.
We make adjustments in our methodology to account for each of these and other factors, which we outline below.
Exhibit 26: Unconventional play risk-screened life cycle assessments Group and price benchmark*
Criteria Unconventional oil/gas basin plays
1. Concept c A$10/acre
Regional analysis and interpretation Desktop focus
West: Southern Carnarvon, Officer East: Walloway
2. Pre-feasibility c A$10-20/acre
Committed proof of concept work programme Prospective resource delineation focus G&G work programme focus, 2D seismic
West: Bonaparte North: Amadeus, Georgina, McArthur, Pedirka East: Arckaringa, Gippsland, Otway
3. Feasibility c A$50-250/acre
Vertical exploration well success/failure 2C delineation focus Success-backed feasibility study
West: Canning East: Galilee*
4. Early-stage Appraisal c A$250-A$1k/acre
Drilling success/failure 3D seismic acquisition Vertical fracking success/failure
West: Perth
5. Appraisal c A$1kacre
Horizontal exploration well success/failure Pilot production, testing, 2P focus FID to initial development
East: Clarence Moreton*, Cooper-Eromanga
6. Development c A$5-10k/acre
Production well drilling Early-stage large-scale production FID to full regional development
East: Bowen*, Gunnedah*, Surat*, Sydney
7. Established c A$15-30k/acre
Full regional development Scale/rollout focus
Source: Edison Investment Research. Note: *Indicated value benchmarks reflect wet gas or oil play regions. We adjust to lower value benchmarks for regions where gas (particularly CSG) has to date been revealed as the main hydrocarbon play. These regions include the Bowen, Clarence Moreton, Galilee, Gunnedah and Surat basins.
Matur
ity

Onshore down under | 15 August 2013 33
We then score each basin play on the basis of whether it has attracted a substantive (IOC or local major) farm-in partner (Exhibit 27). We do so on the basis that in deciding to invest in a play the incoming investor has satisfied its own internal screening threshold tests for plausibility and materiality from the due diligence process that will have preceded its positive investment decision. We also take account of the regulatory and policy context in which the play sits to reflect that although some basin plays are relatively advanced on their development paths, the unfavourable policy environment in which some plays operate (particularly in NSW) is in many cases unlikely to be supportive of resource monetisation.
Exhibit 27: Australian onshore farm-in validation screen Farm-in validation ASX small- to mid-cap player interests Region Onshore basin Area
m acres Local IOC
West Bonaparte 61.8 Beach Advent
Canning 131.0 ConocoPhillips, Hess, Mitsubishi, Petrochina
Buru, Green Rock, New Standard, Oil Basins, Rey Resources
Sthn Carnarvon 49.4 New Standard, Torrens Officer 101.3 Perth 12.4 AWE, Origin AWE, Empire, Norwest, Titan North Amadeus 42.0 Santos Central Pet, Magellan Georgina 81.5 Statoil, Total Armour, Baraka, Blue, Central Pet, Petrofrontier McArthur 44.5 Armour, Falcon Pedirka 37.1 Santos Central Pet, Senex East Arckaringa 19.8 Linc
Bowen 39.5 Origin, Santos, Senex BG, ConocoPhillips, CNOOC, KOGAS, Mitsui, Petrochina, Petronas, Shell, Sinopec, Total
Comet Ridge, Senex, Westside
Clarence Moreton 4.0 Dart, Metgasco
Cooper 32.1 Beach, Drillsearch, Origin, Santos, Senex
BG, Chevron Drillsearch, Icon, Rawson, Senex, Strike
Eromanga 247.1 Beach, Drillsearch, Origin, Santos, Senex
BG, Chevron Drillsearch, Icon, Senex, Strike
Galilee 61.0 AGL CNOOC AGL, Blue, Comet Ridge, Galilee Gippsland 10.1 Beach ExxonMobil Armour, Cooper, Icon, Lakes Oil, Somerton Gunnedah 3.7 Santos Comet Ridge, Dart, TRUEnergy Otway 14.8 Beach, Origin Armour, Cooper, Lakes Oil
Surat 66.7 Origin, Santos, Senex BG, ConocoPhillips,
CNOOC, KOGAS, Petronas, Shell, Sinopec, Total
Blue, Icon, Senex
Sydney 15.8 AGL Source: Company data, Bloomberg, Edison Investment Research
We then apply outcomes from this screening to our estimate of pricing benchmarks from completed deals. For basins where there is a substantive farm-in partner, the undiluted A$/acre at 100% loading is applied. Importantly, from this full loading we then apply discounts to down-rate for a number of factors, including:
individual permit positions not to present a substantive farm-in partner; variations in hydrocarbon composition, reflecting that acreage held in gas-intensive basins is
less valuable than acreage in oil or wet gas regions (within this we note that CSG valuations are more commonly indexed to reserve-based [3P in particular] benchmarks than the acreage-based, NGL-present metrics we apply); and
variations within mature basins (particularly the Cooper, Surat and Bowen), discounting regions that lie outside or on flanks of central producing regions, on which assumed fully loaded metrics are applied.

Onshore down under | 15 August 2013 34
Exhibit 28: Player universe net acreage vs risked EMV/acre
Source: Edison Investment Research
From this process, a risked expected monetary value (EMV) is derived for each player’s unconventional portfolio, the results of which are shown in Exhibit 28. To assist with interpretation, we note:
The further away from the origin on the vertical axis, the higher we calculate the average risked value per acre across the player’s entire portfolio. To an extent, the measure can be thought of as a gauge of acreage maturity as a de-risking gauge across each player’s total portfolio.
A higher EV should not automatically be interpreted as ‘best’. As we pointed out with our S-curve, for growth-focused investors, selecting solely on the basis of strength of EV per acre may be shortsighted. It is more important to select on the scope of potential growth in average EV per acre.
Similarly, it would be easy to interpret the area to the top-right of the grid (high EV per acre and very large net acreage position) as the ‘promised land’, where every unconventional E&P company wants to be. While a valid conclusion, for investors it is the journey to that promised land that is likely to be more rewarding for them than entering the promised land directly.
Key conclusions to fall from this analysis: Acreage held in established regions (particularly the Cooper Basin) carries a substantially
higher EMV, as is apparent in the metrics of established Cooper players, Drillsearch and Senex. Note that the significant difference between Drillsearch and Senex on a EMV/acre basis is due to Senex’s substantial holding of Pedirka Basin acreage, which weighs on its average, whereas Drillsearch’s acreage lies exclusively within the Cooper Basin.
The largest portfolios of net acreage are held by Central Petroleum and Armour, although each portfolio carries a very low (< A$5/acre) overall EMV, reflecting the extent of risk discounting applied.
Most portfolios attract an EMV of less than A$50/acre. Excluding Drillsearch and Senex, we conclude an average EMV of A$23/acre and median of A$7/acre.
Smaller portfolios tend to attract stronger per-acre EMVs, reflecting that players with smaller onshore positions tend to be more advanced with their work programmes compared to companies that hold larger positions.
1
10
100
1,000
0 5 10 15 20 25 30 35 40 45
Risk
ed E
MV/ac
re (lo
g sca
le)
Net acreage (m)
Metgasco
Norwest
Armour
Icon
Petrofrontier
Central
Buru
Linc
Strike
SenexCooper
Drillsearch
New Standard
Empire
Exoma
AWE

Onshore down under | 15 August 2013 35
Screen 2: Player benchmarking Our second screen scores our universe of 16 players on four risk criteria (Exhibit 29), from which we have concluded an overall player-specific risk score. We acknowledge that a heavy reliance on judgments in any analysis of this nature is important to note. We have focused on scoring to distil aspects of institutional strength and weakness spanning management, portfolio and financial criteria. We then weight our raw scores to reflect the relatively (in our view) higher importance of endogenous factors (financial strength and quality of management and partnerships in particular) in favour of other risks (infrastructure in particular) which we consider to be of a more accepted nature in the investment screening (an element of ‘it is what it is’). From this adjustment process, we arrive at weighted risk assessments for each player (Exhibit 30).
Exhibit 29: Player risk assessments, unweighted Management &
operational partners
Portfolio balance / upside potential
Infrastructure Financial strength / discipline
Unweighted pan-risk screen score
Armour 10 AWE 5 Buru 8 Central Petroleum 9 Cooper Energy 6 Drillsearch 4 Empire 7 Exoma 11 Icon 7 Linc 9 Metgasco 11 New Standard 9 Norwest 9 Petrofrontier 10 Senex 4 Strike 7
Source: Edison Investment Research. Note: Assessment based on low risk/key strength, medium risk, high risk/weakness.
Exhibit 30: Player universe institutional risk screen outcomes, weighted
Source: Edison Investment Research. Note: Based on weighted aggregate of criteria risk assessments summarised in Exhibit 29.
0%
10%
20%
30%
40%
50%
60%
70%
80%
90%
100%
Exom
a
Metga
sco
Armo
ur
Norw
est
Linc
Petro
fronti
er
Centr
al
Empir
e
Icon
Strik
e
New
Stan
dard
Buru
Coop
er
AWE
Drills
earch
Sene
x
% of
base
line

Onshore down under | 15 August 2013 36
3. Bringing it together: Merging the screens Having described the theory and mechanics of each screen, before bringing them together it is prudent to recognise the application and limitations of doing so. Firstly, it is important to be mindful of what the screens represent: empirical but judgement-based tools to compare the relative below- and above-ground risk profiles of each acreage-based player. Analysis and conclusions are specific to pervasive, acreage-based plays and players intending to compare the status and maturity of unconventional development programmes with where the market is pricing those programmes. What the screening does not provide is contribution from either existing producing assets or traditional (high-permeability, high-porosity, trap and seal) conventional assets. This is particularly an issue for larger players with diverse asset bases spanning multiple plays, regions and countries (the ‘established players’ we refer to below) as acreage-based screening on its own does not recognise the very substantial value inherent in these additional assets. However, this is not to say that the analysis does not have application to the established players. What the screen does allow for is estimating the potential value of unconventional asset portfolios to players with established conventional asset bases. We discuss this in more detail below.
There are three categories of player in our analysis: 1. Acreage-intensive explorers: Typically, explorers with large acreage positions, which are not
yet commercially producing. Companies we include in this category are Armour, Exoma, Metgasco, New Standard and Petrofrontier.
2. Hybrid players: Players with large acreage positions and modest conventional producing base, or which can present discoveries that have yet to be commercialised. In this category we include Buru Energy, Central Petroleum, Cooper Energy, Empire Oil & Gas, Icon Energy, Norwest and Strike Energy.
3. Established players: Companies with significant established producing and/or reserve bases (in Australia or beyond) but which also have material onshore Australian acreage-based strategies. Players from our universe in this group are AWE, Drillsearch, Linc and Senex.
Exhibit 31: Below- and above-ground risk screen outcomes
Source: Edison Investment Research
Plotting our above- and below-ground EMV outcomes for each acreage player (Exhibit 31) represents nicely the journey that companies face in de-risking their asset and institutional offerings to investors. Higher-yield players find themselves nearer the origin, conveying higher discounting on both above- and below-ground measures. The challenge, as we have hopefully demonstrated, is for companies to migrate from the origin to the top-right of the plot by de-risking both the resource base on which they sit and the institutional arrangements that support the development of that
0%
10%
20%
30%
40%
50%
60%
70%
80%
90%
100%
1 5 25 125 625
Abov
e-gr
ound
: risk
ed E
MV/un
riske
dEMV
Below-ground: risked EMV per acre (log scale)
Empire
Metgasco
New Standard
Armour
Exoma
Petrofrontier
Central
Buru
Linc
AWE
Cooper
Norwest
Senex Drillsearch
IconStrike
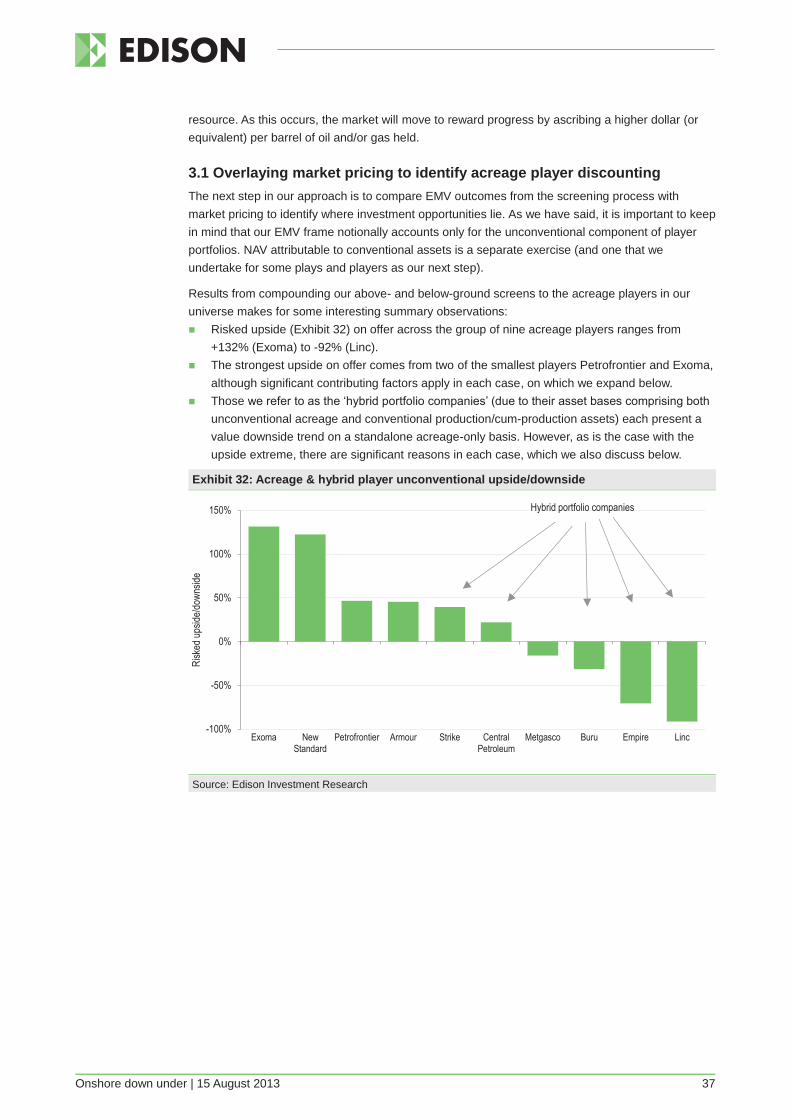
Onshore down under | 15 August 2013 37
resource. As this occurs, the market will move to reward progress by ascribing a higher dollar (or equivalent) per barrel of oil and/or gas held.
3.1 Overlaying market pricing to identify acreage player discounting The next step in our approach is to compare EMV outcomes from the screening process with market pricing to identify where investment opportunities lie. As we have said, it is important to keep in mind that our EMV frame notionally accounts only for the unconventional component of player portfolios. NAV attributable to conventional assets is a separate exercise (and one that we undertake for some plays and players as our next step).
Results from compounding our above- and below-ground screens to the acreage players in our universe makes for some interesting summary observations:
Risked upside (Exhibit 32) on offer across the group of nine acreage players ranges from +132% (Exoma) to -92% (Linc).
The strongest upside on offer comes from two of the smallest players Petrofrontier and Exoma, although significant contributing factors apply in each case, on which we expand below.
Those we refer to as the ‘hybrid portfolio companies’ (due to their asset bases comprising both unconventional acreage and conventional production/cum-production assets) each present a value downside trend on a standalone acreage-only basis. However, as is the case with the upside extreme, there are significant reasons in each case, which we also discuss below.
Exhibit 32: Acreage & hybrid player unconventional upside/downside
Source: Edison Investment Research
-100%
-50%
0%
50%
100%
150%
Exoma NewStandard
Petrofrontier Armour Strike CentralPetroleum
Metgasco Buru Empire Linc
Risk
ed up
side/d
owns
ide
Hybrid portfolio companies

Onshore down under | 15 August 2013 38
3.2 Adding in conventional NAV We have noted that a number of players present projects of varying descriptions, which serve to justify firmer and more positive valuation proxies being applied than would be the case for earlier-stage, acreage-only plays. Such projects mostly (but not exclusively) involve discrete conventional discoveries that are in the advanced stages of commercialisation. Players able to point to such qualifying projects include Central Petroleum with its Surprise-1 oil discovery, Buru Energy with its Ungani-1 oil discovery and Empire Oil & Gas with its Red Gully wet gas development.
Our experience with bottom-up modelling of the economics of conventional onshore Australian projects leads us to conclude that at US$80/bbl oil, a modest- to average-sized (1-5mmbbl, as is the implied case with Surprise) oil-heavy development is likely to indicatively offer between A$10/boe and A$30/boe of NPV10, with the extent of the range a reflection of the often very substantial variances in the opex and capex profiles of individual projects. We note this range would be significantly lower and wider than for comparable projects in North America, where substantially more favourable capital (particularly drilling and completion) and infrastructure (length of supply chain to market) cost and access profiles afford operators significantly greater value benefits. For larger fields (>10mmbbl, as appears likely the case at Ungani), significant scale economies are likely.
Our top-down screening of the Surprise and Ungani projects infers significant share price support for each project owner, but particularly for Buru with its comparatively large Ungani resource. On an unrisked basis, we infer Ungani’s value to support between 9% and 28% of Buru’s current share price. The key takeaway is that companies usually perceived as unconventional acreage players can also present substantial conventional-based NAV.
Exhibit 33: Inferred value uplift of conventional oil plays Company Project Size Variable Unit Unrisked NAV range mmbbl Lower Upper Central Petroleum Surprise 1.1 (2P) NPV10 A$m 11 33 NPV10/share A$/share 0.007 0.021 % of share price % 6.5% 19.4% Buru Energy Ungani 10.0 (estimate) NPV10 A$m 100 300 NPV10/share A$/share 0.17 0.51 % of share price % 9.4% 28.1% Source: Edison Investment Research. Note: Prices at 9 August 2013.
3.3 A different approach required for established players Our established player group comprises companies with a portfolio of multiple proven producing assets, spread across different fields and basins. In the case of AWE and Beach, portfolio diversity also stretches into other countries. Players in this group tend to present a suite of mature producing assets, stable financial and operating profiles and a comparatively predictable earnings base. These features tend to be overlaid with high-quality management and governance steerage.
To deduce themes across this sub-universe, we have analysed conventional investment metrics. We have also added to our sub-universe much larger players, Beach Energy (ASX:BPT, MCap A$1.6 bln) and Santos (ASX:STO, MCap A$13.3 bln), each of which also have significant onshore Australian businesses, but a portfolio that stretches far beyond AWE, DLS and SXY.

Onshore down under | 15 August 2013 39
Key conclusions as we read them: On an EV/2P measure, AWE presents as the cheapest entry at A$6.3/boe. DLS has the most
2P growth factored in at A$34.9/boe. On an EV/2C measure, SXY is lowest at A$1.8/boe largely due to its comparatively high 2C
number (SXY’s 2P/2C ratio is only 9.7% compared to the average of the four other players of 65.7%). DLS is highest at A$27.3/boe and a 2P/2C ratio of 85.0%.
On 2013 P/E, DLS pitches highest at 26.7x and 23.4x respectively against an average 21.3x. On 2013 EV/EBITDA, AWE and BPT each present multiples of less than 5.0x compared to the
peer average of 8.5x. DLS shows 14.2x and SXY 11.5x.
Exhibit 34: Established player fundamentals
Source: Bloomberg, Edison Investment Research
4. Investment conclusions As we have noted, the diversity in play and player maturity across our player universe means there is no single benchmarking frame that can be consistently applied across our universe. Just as there are a number of players that present substantial early-stage unconventional acreage as their main asset, there are a number of further players that can point to substantial existing conventional reserve and/or producing bases.
From the subset of emerging players within our universe, we look to companies that emerge as undervalued from our screening by presenting a favourable blend of prospective acreage, firm balance sheet footing, high-quality management and/or partnerships. We are also drawn to players that can offer conventional asset NAV to support unconventional EMV. Exhibit 35 presents the basis for our highlighting Armour Energy, Buru Energy, Central Petroleum and Strike Energy from our screening as our favoured emerging players.
From the four established players we have profiled, we favour those that present from our screening as favourably priced and with an attractive mix of established producing and/or reserve bases, to which unconventional upside would be material to their portfolios. We also place significant weight on the likelihood of material newsflow and catalyst triggers over the coming 12 months. Exhibit 36 presents the basis for our selecting AWE, Linc Energy and Senex as our favoured established players.
Despite each carrying respectively attractive underlying acreage-rich and 2P-rich assets, we are very cautious about Exoma and Metgasco due to the uncertainties that each currently faces. However, we recognise that if and when the funding (Exoma) and regulatory (Metgasco) situations of these companies become favourable, significant value uplift is likely.
AWE
AWE
AWE
AWE
AWE
DLS
DLS
DLS
DLS
DLS
SXY
SXY
SXY
SXY
SXYBP
T
BPT
BPT
BPT
BPT
STO
STO
STO
STO
STO
0
5
10
15
20
25
30
35
40
EV/2P EV/2C PE13 PE14 EV/EBITDA13

Onshore down under | 15 August 2013 40
Exhibit 35: Edison’s favoured emerging players Company Basis Armour Energy ASX:AJQ Price A$0.27 MCap A$81.0m
Among its peers AJQ is conspicuous for the absence of a substantive JV partner. This appears to have been a deliberate strategy to retain equity while it proves up what it regards as the most prospective parts of its massive 34m acres of (primarily) McArthur and Georgina Basin acreage. Initial results appear very encouraging. At current pricing, the market is valuing AJQ’s portfolio at just A$1.3/acre. At some point, it appears likely AJQ will seek to introduce a farm-in partner to share capital and risk, although with A$37m cash on hand and a full as well as fully funded H213 work programme, much more should become known about the potential nature and extent of its McArthur resource before further capital is needed.
Buru Energy ASX:BRU Price A$1.81 MCap A$534.7m
While our risked-acreage screen shows BRU presenting 32% downside to current share price, this takes no account of attribution from its conventional Ungani discovery. Our mid-point valuation of a 10mmbbl resource supports A$0.34/share. Adding this to our calculation for BRU’s risked-acreage value of A$1.24/share presents a combined A$1.58/share. We consider there to be scope for substantial further de-risking upside as BRU progresses its Canning work programme with JV partners, Mitsubishi and Petrochina. Further conventional upside as BRU appraises Ungani during H213 and beyond is a strong possibility. If Ungani proves up to a 20mmbbl resource, we infer a bundled valuation of A$1.92/share.
Central Petroleum ASX:CTP Price A$0.11 MCap A$170.1m
CTP emerges from our screen presenting 22% upside on an unconventional acreage basis alone. In our view, this leaves much further value on the table, at two discrete levels. Firstly, CTP is committed to rapidly developing its Surprise conventional oil discovery, which we assess to be worth c A1.5cps (mid-point) with further upside likely. Secondly and longer term more importantly, CTP’s separate farm-in deals with majors Santos and Total will ensure that two parallel, aggressive work programmes are undertaken on CTP’s frontier acreage over the coming few years. This will serve to substantially de-risk CTP’s acreage, and therefore value dilution, at little or no near-term outlay to CTP.
Strike Energy ASX:STX Price A$0.099 MCap A$69.9m
In addition to holding a portfolio of producing assets in separate Eagle Ford shale, Permian Basin and Eaglewood plays in the US, STX holds 3.8m net acres of early-stage but highly promising Cooper Basin acreage. Our acreage screen infers a risked EMV supportive of A$0.12/share, against the current share price of A$0.099/share. STX’s Eagle Ford assets, including an existing producing base of c 300boe/d, sit atop this valuation. A highly innovative risk-sharing agreement struck with major industrial gas user, Orica, in June and a just-completed share placement serve to eliminate funding constraints while retaining high equity position. In our view, STX’s Cooper Basin acreage has the potential to de-risk quickly, which if proved would serve to graduate value benchmarks rapidly upward.
Source: Bloomberg, Edison Investment Research
Exhibit 36: Edison’s favoured established players Company Basis AWE ASX:AWE Price A$1.27 MCap A$663.1m
AWE’s producing and reserve base assets span four countries presenting an impressive suite of existing oil (Cliff Head, Sugar Loaf Eagle Ford, Tui), gas-condensate (Bass Gas) and gas (Casino) assets as well as outright ownership of a 50mmbbl undeveloped oil field in Indonesia. On an EV/2P basis, AWE presents cheaply at A$6.3/boe. We infer AWE’s Perth Basin acreage at a risked A$0.07/share and consider this has scope to grow rapidly as its Senecio and Arrowsmith projects are de-risked over the next 12-18 months. AWE can point to a number of potentially significant H213 catalysts, including a multi-well exploration/appraisal drilling campaign at its Tui (AWE 42.5%) oil field in New Zealand and the likely farm-out and commercialisation of its Ande Ande Lamut (AWE 100%) Indonesian oil project. See our Quickview for more.
Linc Energy ASX:LNC Price A$1.75 MCap A$907.7m
LNC is a large and complex investment vehicle with numerous assets and threads to its business, one of which is its very large acreage position in the Arckaringa Basin. While our screen infers LNC’s Arckaringa position to support A$0.07/share, this reflects a confluence of basin down-rates to account for its early stage and LNC’s corporate profile. Put together with other LNC assets, including a c 3,200b/d net producing base from a suite of US Gulf Coast fields, a 168mmbbl 2P reserve base relating largely to an undeveloped Alaskan oilfield and a royalty held over an undeveloped QLD coal mine that on its own we value at an unrisked A$0.83/share, we consider LNC to be substantially undervalued on a SOTP basis. LNC’s likely farm-out of its Arckaringa acreage to what appears likely to be a IOC is likely to provide a potentially significant H213 catalyst.
Senex ASX:SXY Price A$0.73 MCap A$833.2m
SXY holds nearly 15m net acres of Cooper Basin acreage spanning the full spectrum of mapped plays, from conventional oil to unconventional gas. SXY can already point to a deeply impressive three-year growth run and has signalled further growth going forward. Current share price infers an average A$48/acre across its portfolio, which when considered alongside SXY’s 1.2mmbbl pa conventional producing base, we consider to be extremely cheap. Medium term, SXY’s large 382mmboe 2C base presents much appeal as a substantial foundation for 2P upgrade. A significant 8.2m acre tranche of Pedirka Basin acreage sits comfortably with SXY’s Cooper Basin portfolio and provides a possible catalyst for substantial longer-term upside. An intensive, continuous 12-month drilling campaign began in June, which should make for uninterrupted newsflow over the next year.
Source: Bloomberg, Edison Investment Research. Note: Prices at 9 August 2013.

Onshore down under | 15 August 2013 41
5. Investment précises (company by company) Armour Energy (AJQ) has one of the largest net-acreage positions in the onshore sector,
totalling 29m acres of remote McArthur, Georgina and South Nicholson Basin frontier territory. Noticeably absent to date of an IOC farm-in deal, AJQ retains 100% in all frontier permits. Egilabria-2, which struck gas pay in June on intersecting the mapped Lawn shale, will be fracked and tested in Q313. A$32m cash on hand ensures that a six-well 2013 programme will be fully-funded. EV/acre of A$1.3/acre is among the lowest of the sector’s acreage plays.
AWE (AWE) presents an EV/2P of A$6.3/boe placing it comfortably as the cheapest of our established group on that measure. EV/EBITDA of 4.4x is more akin to mature players (BPT, STO, WPL et al) with lower growth prospects. Nearest-term Australian catalyst is likely to be outcomes of Senecio feasibility study and Arrowsmith-2 testing, both in Perth Basin. Further afar, AWE is progressing the likely development of its offshore Indonesian Ande Ande Lamut project (AWE 100%, 2P reserves 50mmbbl). An H213 drilling campaign in New Zealand also lies ahead.
Buru Energy (BRU) focuses solely on the Canning Basin, where it holds nearly 16m gross acres. Unconventional potential has been supported by early conventional success with its Ungani-1 well where BRU is targeting 5,000b/d production from H114 progressing to 15,000b/d from 2015. Our top-down unconventional acreage benchmarking supports A$1.24/share, while Ungani at 10mmbbl infers an additional unrisked range of between A$0.17 and A$0.51/share.
Central Petroleum’s (CTP) separate breakthrough farm-out deals with Total and Santos late in Q412, which have added substantial validation to CTP’s acreage. The metrics of those deals alone, which together account for less than 40% of CTP’s total 70m acre portfolio, imply a premium to current share price. Its Surprise conventional oil discovery (2P reserves 1.1mmbbl) rests 100% with CTP and should generate cash flow from H114. We value an unrisked Surprise project in a band equivalent to A$0.007-0.021/share.
Cooper Energy (COE) is well advanced on a strategy to consolidate back to its Australian roots and exit a number of international ventures. A production base of c 400boe/d is concentrated in interests held in the northern and western Cooper Basin. A busy Q413 Cooper Basin appraisal/development work programme should serve to increase reserves. At EV/2P of A$54/boe, the market is pricing in reserve growth. Results from a Tunisian exploration well currently undergoing production testing should also serve to support value.
Drillsearch (DLS) has returned highly impressive organic growth over the past two years on the back of extensive interests held in western flank oil region of the Cooper Basin. EV/2P of A$35/boe implies the market expects DLS to continue building reserves and production, which appears highly likely on the back of recently commissioned infrastructure and a major work programme planned. Major separate but comparable farm-outs to BG and Santos attracted metrics of A$486/acre and A$449/acre respectively. Although together these account for only 7% of DLS’s net acreage, we infer the combined BG and STO deal metrics support 28% of DLS’s current share price.
Empire Oil & Gas (EGO) has a 20-year history exploring in the Perth and Carnarvon basins and recently graduated to producer status with its 100%-held Red Gully gas-condensate project. A prepaid gas agreement with industrial heavyweight, Alcoa, bankrolled most of the build cost. Although modest in size at 10TJ/d handling capacity, condensate strip of c 600bbl/d should see Red Gully return c A$15m pa of free cash flow to fund EGO’s Perth Basin work programme. A planned expansion of Red Gully would require further capital. Cash on hand is A$9m.
Exoma (EXE) despite currently holding 50% of 28,000km2 (to reduce by one-third with compulsory relinquishments at the end of August) of Galilee Basin acreage, EXE currently presents a negative EV. The non-completion of a major farm-out and equity deal with CNOOC early in Q113 has left EXE stranded with less than A$10m cash on hand and little ability to fund

Onshore down under | 15 August 2013 42
its 50% share of the significant forward work programme needed to progress its frontier Galilee acreage. EXE has downsized operations while it contemplates its future. A deal looks likely.
Icon Energy (ICN) is cashed up after exercising an option to sell a 4.9% stake in its ATP 855P Cooper Basin permits to Beach Energy (part of BPT’s own farm-out deal with Chevron), ICN realised a US$18m cash windfall to double its cash backing to A$33m. The deal also served to crystallise a valuation benchmark of A$950/acre and with it an inferred value of A$0.26/share for ICN’s residual 35.1% ATP 855P stake. ICN also holds a 33% stake in the post-Permian section of adjoining PEL218, the Permian section of which is held by the Beach Energy and Chevron JV.
Linc Energy’s (LNC) investment case has numerous layers, but is underwritten by an established multi-field producing base in Texas and a large (168mmbbl, LNC 100%) undeveloped oil field in Alaska. In Australia, LNC holds 100% of 17.5m acres of Arckaringa Basin acreage with a prospective resource base estimated at more than 100bnboe. Further yet, we calculate the PV of a royalty entitlement LNC holds over a world-scale QLD coal development being progressed toward FID as accounting for current share price value alone.
Metgasco (MEL) presents an impressive 2P CSG reserve base of 428PJ (71mmboe), but has been torpedoed by moves from the NSW state government to apply strict land use constraints on CSG players. MEL has announced the suspension of all NSW activities until the regulatory situation improves and has reduced its headcount to subsistence levels. Cash on hand is A$21m.
New Standard Energy (NSE) has had an operational year to forget, but can boast both ConocoPhillips and Petrochina as JV partners to its 11m gross acres of Canning Basin acreage. The deal that in Q113 served to introduce Petrochina to the JV was said to attract a value equivalent of US$9.00/acre, inferring NSE’s 25% enduring and fully carried stake to be worth A$27m or A$0.089/share.
Norwest Energy’s (NWE) acreage lies entirely within the Perth Basin, where its recent focus has been on the Arrowsmith-2 discovery well within EP413 (NWE 27.9%). Arrowsmith-2 revealed multiple stacked gas and gas-condensate pay zones spanning sandstone, shale andtight gas formations. Norwest has declared a busy work programme at Arrowsmith in H213 andinto 2014. With A$2.7m cash on hand, NWE will need to address funding to participate fully in adevelopment plan.
Petrofrontier (PFC) is an acreage player holding 2.7m net acres in the frontier Southern Georgina basin. Obligations under a breakthrough mid-2012 farm-out agreement with IOC Statoil proved difficult for PFC to meet following an abandoned associated capital raise. While a recent re-negotiation of its deal with Statoil resolves immediate funding issues by providing a full cost carry, it also reflects PFC value attrition. Nonetheless, the re-struck Statoil deal supports a PFC share price of C$0.75 versus current C$0.25. Cash on hand is C$8m.
Senex (SXY) presents an oil-only Cooper Basin producing back bone of c 3,400b/d, making it a major regional player. A 2P base of 37mmboe includes 157PJ (26mmboe) of Surat Basin CSG presents EV/2P of A$19.1/boe. Significant further medium-term reserve and production upside appears likely from DLS’s Cooper Basin gas projects, which are yet to be developed but the subject of a major forward work programme. A farm-out appears likely, which would serve to affirm gas value.
Strike Energy (STX) presents a highly attractive asset portfolio of top-tier Texan and Cooper Basin acreage. Two recent innovative funding deals have introduced c A$60m of work programme funding to support its Australian and US work programmes, most of which is focused on its Cooper acreage. Both arrangements will see STX retain full existing equity. On a standalone basis, ignoring any contribution from its Texan assets, STX’s current EV infers a value of less than A$19/acre across its 3.8m of net Cooper Basin acreage.

Onshore down under | 15 August 2013 43

Onshore down under | 15 August 2013 44
Company profiles

At more than 133,000km2, Armour has one of the largest portfolios in the onshore sector comprising a contiguous mosaic of 17 permits spanning the McArthur, Georgina and South Nicholson basins. In total, Armour’s acreage exceeds the combined size of the Barnett and Eagle Ford shale plays in Texas. Its challenge is squarely one of proving the commerciality of what is a very promising set of early results.
Year end Revenue (A$m)
EBITDA (A$m)
PBT (A$m)
Debt (A$m)
Net cash (A$m)
Capex (A$m)
06/11 0.0 (1.2) (1.2) 0.0 12.0 (0.6) 06/12 0.0 (2.6) (2.2) 0.0 61.3 (14.5) 06/13 0.0 N/A N/A 0.0 37.1 (22.9) 06/14e N/A N/A N/A N/A N/A N/A
Source: Company data, Bloomberg consensus
Assets: Northern frontier Armour’s activities focus on the onshore McArthur, Georgina and South Nicholson Basins straddling the northern NT/QLD border. Its aggregate position totals 133,288km2 (32.9m acres) and 100% equity in all permits. Independent studies have estimated a contingent gas resource of more than 19tcf in the western flank of its McArthur acreage across multiple zones of both conventional and unconventional reservoirs. Most of that resource has been assessed to lie in the Barney Creek shale formation. A further 22tcf has been estimated in the Lawn Shale in Armour’s eastern McArthur flank. Armour also holds equity and up-scale options in separate onshore permits in the Gippsland and Otway Basins in VIC.
Challenges: Validation, commercialisation With its cornerstone NT and QLD permits representing some of the earliest-stage and more remote acreage in the onshore Australian sector, the commercialisation challenge Armour faces is steep. Resource validation is its initial focus. To this end, Armour has split its 2013 six-well work programme towards each of the western and eastern flanks of its McArthur acreage. Its first eastern flank vertical well, Egilabria-2, shallow (1,900m TD), struck multi-zoned pay in June, including a 137m gas-charged interval of the Lawn shale. In late-July, Armour commenced a horizontal side track appraisal section from 1,300m and an eight-stage frack will be conducted on the well. The remaining eastern flank wells will then be drilled, followed by completion of the three-well western flank campaign.
Outlook: Full H213 drilling slate, all fully funded Armour has defined a three-staged commercialisation strategy that will, if successful, see it as a first stage producing 10PJ pa by 2016 for local supply to major industrial customers. Stage 3 targets producing sufficient gas within seven years to feed an LNG export terminal (~350PJ pa). In H213, focus will fall on the balance of its McArthur drilling programme, and particularly the flow rates achieved from the lateral section and fracking of Egilabria-2. With A$37m cash on hand, Armour’s 2013 programme is already fully funded. Activity in its two Otway and Gippsland basin permits will likely remain slow until the fracking ban in VIC is lifted.
Armour Energy Bigger than Texas. Almost.
Price A$0.27* Market cap A$81m
*as at 9 August 2013 Net cash at 30 June 2013 A$37m
Shares in issue 300.0m
Free float 70.9%
Code AJQ
Primary exchange ASX
Secondary exchange N/A
Share price performance
52-week high/low A$0.39 A$0.20
Business description
Armour Energy holds a substantial acreage position in the McArthur, South Nicolson and Georgina basins in NT and QLD. It also holds a stake in onshore acreage in the Gippsland and Otway basins in VIC and an 18.6% stake in fellow ASX-listed company, Lakes Oil.
Catalysts/next events
Egilabria-2 horizontal sidetrack, frack and flow testing
Q313
Glyde sub-basin wells x 2 Q413
Myrtle sub-basin well Q413
Analysts
John Kidd +64 (0)4 8948 555
Ian McLelland +44 (0)20 3077 5756
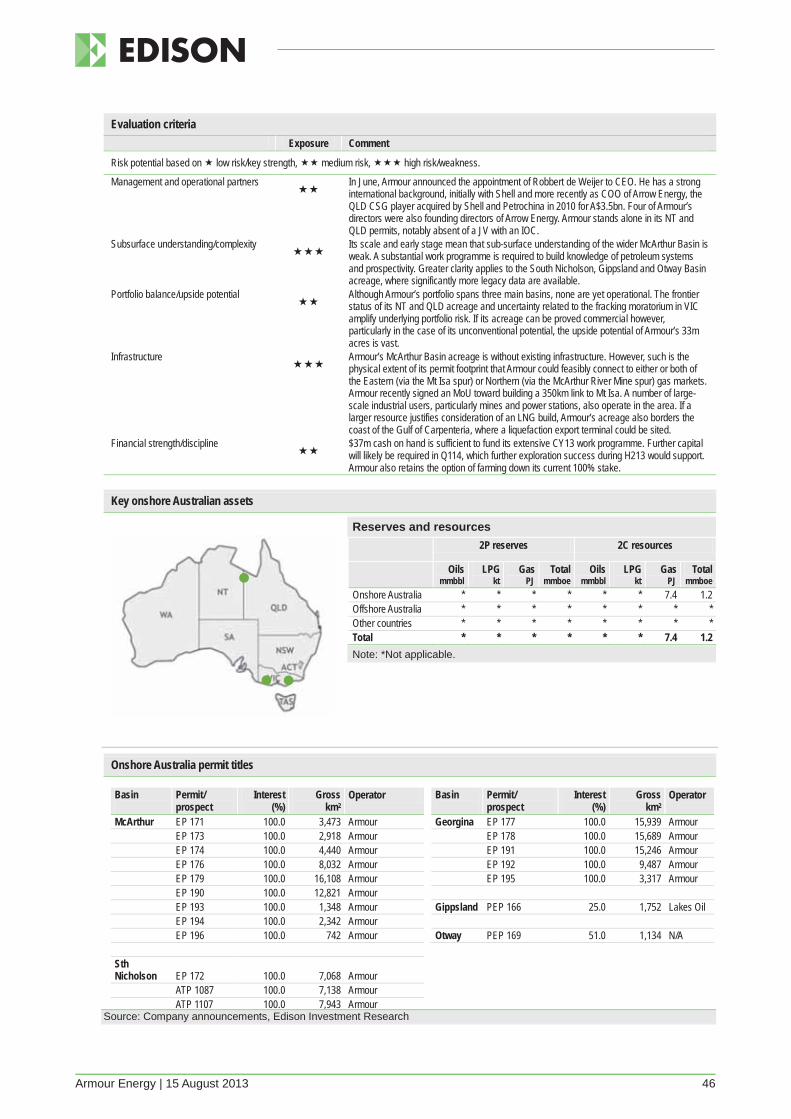
Armour Energy | 15 August 2013 46
Evaluation criteria Exposure Comment
Risk potential based on low risk/key strength, medium risk, high risk/weakness.
Management and operational partners
In June, Armour announced the appointment of Robbert de Weijer to CEO. He has a strong international background, initially with Shell and more recently as COO of Arrow Energy, the QLD CSG player acquired by Shell and Petrochina in 2010 for A$3.5bn. Four of Armour’s directors were also founding directors of Arrow Energy. Armour stands alone in its NT and QLD permits, notably absent of a JV with an IOC.
Subsurface understanding/complexity
Its scale and early stage mean that sub-surface understanding of the wider McArthur Basin is weak. A substantial work programme is required to build knowledge of petroleum systems and prospectivity. Greater clarity applies to the South Nicholson, Gippsland and Otway Basin acreage, where significantly more legacy data are available.
Portfolio balance/upside potential
Although Armour’s portfolio spans three main basins, none are yet operational. The frontier status of its NT and QLD acreage and uncertainty related to the fracking moratorium in VIC amplify underlying portfolio risk. If its acreage can be proved commercial however, particularly in the case of its unconventional potential, the upside potential of Armour’s 33m acres is vast.
Infrastructure
Armour’s McArthur Basin acreage is without existing infrastructure. However, such is the physical extent of its permit footprint that Armour could feasibly connect to either or both of the Eastern (via the Mt Isa spur) or Northern (via the McArthur River Mine spur) gas markets. Armour recently signed an MoU toward building a 350km link to Mt Isa. A number of large-scale industrial users, particularly mines and power stations, also operate in the area. If a larger resource justifies consideration of an LNG build, Armour’s acreage also borders the coast of the Gulf of Carpenteria, where a liquefaction export terminal could be sited.
Financial strength/discipline
$37m cash on hand is sufficient to fund its extensive CY13 work programme. Further capital will likely be required in Q114, which further exploration success during H213 would support. Armour also retains the option of farming down its current 100% stake.
Key onshore Australian assets
Reserves and resources 2P reserves 2C resources
Oils mmbbl
LPG kt
Gas PJ
Total mmboe
Oils mmbbl
LPG kt
Gas PJ
Total mmboe
Onshore Australia * * * * * * 7.4 1.2 Offshore Australia * * * * * * * * Other countries * * * * * * * * Total * * * * * * 7.4 1.2 Note: *Not applicable.
Onshore Australia permit titles
Basin
Permit/ prospect
Interest (%)
Gross km2
Operator
McArthur EP 171 100.0 3,473 Armour EP 173 100.0 2,918 Armour EP 174 100.0 4,440 Armour EP 176 100.0 8,032 Armour EP 179 100.0 16,108 Armour EP 190 100.0 12,821 Armour EP 193 100.0 1,348 Armour EP 194 100.0 2,342 Armour EP 196 100.0 742 Armour Sth Nicholson EP 172 100.0 7,068 Armour ATP 1087 100.0 7,138 Armour ATP 1107 100.0 7,943 Armour
Basin
Permit/ prospect
Interest (%)
Gross km2
Operator
Georgina EP 177 100.0 15,939 Armour EP 178 100.0 15,689 Armour EP 191 100.0 15,246 Armour EP 192 100.0 9,487 Armour EP 195 100.0 3,317 Armour Gippsland PEP 166 25.0 1,752 Lakes Oil Otway PEP 169 51.0 1,134 N/A
Source: Company announcements, Edison Investment Research

AWE presents a compelling portfolio of conventional and unconventional assets and an existing 2P reserve base of 110mmboe. From each of a viability, materiality and route-to-commercialisation perspective, in our view there is much to like about AWE’s Perth Basin acreage.
Year end Revenue (A$m)
EBITDA (A$m)
PBT (A$m)
Debt (A$m)
Net cash (A$m)
Capex (A$m)
06/11 304.9 (42.3) (160.5) 0.0 117.2 (128.6) 06/12 298.4 3.6 (63.1) (12.9) 42.8 (161.2) 06/13a/e 301.0 157.5e 56.0e (78.0) 41.0 (179.4e) 06/14e 330.6 176.2 58.4 (92.0) 0.0 (181.0)
Source: Company data, Bloomberg consensus
Assets: Perth Basin unconventional focus For an overview of AWE’s full portfolio see our 9 May 2013 QuickView. AWE’s onshore Australian assets centre on interests it holds in 2,950km2 (gross) in the northern Perth Basin. Stakes range from 100%-held permits through to JV holdings of between 33% and 81.5%. Its 33% stake in the Origin-operated Beharra Springs/Redback gas field provides c 2TJ/d (net) plus associated condensate. Three existing discovery wells (Senecio-2, Arrowsmth-2 and Woodada Deep-1) were fracked during Q312, each yielding positive results. In August, Arrowsmith-2 operator Norwest declared an independently assessed prospective resource estimate of 2.8tcf of gas and 15.7mmbbl of oil/condensate, for a total 485mmboe.
Challenges: Manageable below and above ground Drilling history in the Perth Basin dates back more than 50 years, providing a strong subsurface history and below-ground understanding. The main target formations are relatively well understood, comprising multi-zones of conventional (typically sandstone) formations and unconventional (tight sand, shale and coal) payzones. To a substantial extent, many of the usual above-ground challenges operators face toward commercialising remote assets do not apply to AWE’s Perth Basin acreage. In particular, proximity to existing and under-utilised gas processing and transmission capacity substantially improves field development economics.
Outlook: Pace to quicken AWE’s strategy continues to focus on broadening its E&P portfolio, largely within an Asia-Pacific frame. In the Perth Basin, near-term focus will rest on outcomes from a feasibility study to potentially develop the Senecio (net 2C existing resource 50bcf) tight gas field. Another one to two wells are likely in H213 as part of a staged Senecio development plan. A JV struck with ASX-listed minnow Green Rock Energy (ASX:GRK) will, if milestones are hit, see AWE and GRK undertake a deep (>4,500m) geothermal drilling programme targeting separately held but overlapping Perth Basin permits. AWE’s oil and gas target zones lie shallower (3,000-3,500m), which will provide it with significant further technical data. Significantly, GRK has already secured A$5.4m in renewable energy grant funding from the WA state government to offset drilling programme costs, and is targeting further funding.
AWE Perth Basin poised
Price A$1.27* Market cap A$663m
*as at 9 August 2013 Net debt at 30 June A$37m
Shares in issue 522.1
Free float 94.8%
Code AWE
Primary exchange ASX
Secondary exchange N/A
Share price performance
52-week high/low A$1.69 A$1.11
Business description
AWE is a Sydney-based E&P company with producing assets in Australia, New Zealand and the US. In addition to conventional exploration assets in Australia, NZ and Indonesia, AWE is advancing work programmes targeting tight gas and shale gas plays in the onshore Perth Basin.
Catalysts/next events
Senecio feasibility study outcomes +1-2 more wells, EP413
H213
Arrowsmith-2 recompletion and testing programme
H213
Drover-1 well, EP455 H114
Analysts
John Kidd +64 (0)4 8948 555
Ian McLelland +44 (0)20 3077 5756

AWE | 15 August 2013 48
Evaluation criteria Exposure Comment
Risk potential based on low risk/key strength, medium risk, high risk/weakness.
Management and operational partners
Strong board and executive with record of E&P success. Commercial arrangements include JVs with Origin Energy, Norwest and Bharat as well as outright ownership of five permits.
Subsurface understanding/complexity
Activity in the Perth Basin dates back to the 1960s, when WA’s first commercial gas field was discovered near Dongarra. Successful JV discoveries and then fracking of Senecio-2, Arrowsmth-2 and Woodada Deep-1 infer good reservoir understanding.
Portfolio balance/upside potential
AWE holds a portfolio of stakes in six producing assets, including three conventional offshore fields in Australia (the BassGas gas/condensate project in the Bass Strait, the Casino gas field in the Otway basin and the Cliff Head oil field in the Perth Basin) and one in New Zealand (the Tui oil field in the Taranaki Basin). AWE also holds a 10% gross interest in 24,000 acres in the oil-rich Sugarloaf area of the Texan Eagle Ford shale.
Infrastructure
AWE’s Perth Basin acreage sits typically within 15km of the Parmelia high-pressure export pipeline for gas carriage from the Perth Basin to customers in southwest WA. Produced gas is gathered for processing and separation at one of four gas plants. Main current prospects (eg Senecio) sit within 5km of the Parmelia pipeline. Oil/condensate is trucked to the Kwinana refinery south of Perth.
Financial strength/discipline
Strong and diverse backbone of established and long-dated conventional producing oil and gas assets providing strong and stable operating cash flow. More than A$220m of existing undrawn funding headroom to support the work programme.
Key onshore Australian assets
Reserves and resources 2P reserves 2C resources
Oils mmbbl
LPG kt
Gas PJ
Total mmboe
Oils mmbbl
LPG kt
Gas PJ
Total mmboe
Onshore Australia 0.0 0.0 11.4 1.9 1.2 0.0 39.6 7.8 Offshore Australia 7.5 357.4 157.3 37.8 12.8 280.1 145.5 40.3 Other countries 61.1 326.9 37.0 71.0 51.9 64.7 158.0 79.0 Total 68.6 684.3 205.6 110.8 65.9 344.8 343.0 127.0
Onshore Australia permit titles
Basin/ permit
Permit/ prospect
Interest (%)
Gross km2
Operator
Perth L1 50.0 336.0 AWE L2 50.0 293.0 AWE L4 100.0 372.0 AWE L5 100.0 297.0 AWE L7 100.0 149.8 AWE L11 33.0 75.0 Origin Energy L14 44.1 39.7 Origin Energy EP320 33.0 395.7 Origin Energy EP413 44.3 547.0 Norwest Energy EP455 81.5 445.3 AWE
Source: Company announcements, Edison Investment Research

Buru Energy offers an extensive acreage portfolio centred on the Canning Superbasin comprising a highly attractive suite of both unconventional and conventional prospects. Buru’s 12-month objective is to commercialise what looks to be a potentially sizeable conventional oil discovery at Ungani into a 5,000b/d producing backbone.
Year end Revenue
(A$m) EBITDA
(A$m) PBT
(A$m) Debt
(A$m) Net cash
(A$m) Capex (A$m)
06/11 1.5 (17.8) (10.3) 0.0 26.8 (1.2) 06/12 2.0 (14.8) (7.4) 0.0 62.4 (32.5) 06/13a/e 9.0 (11.5)e (9.0)e 0.0 45.4 (51.0) 06/14e 42.9 18.6 16.8 0.0 8.2 (32.0)
Source: Company data, Bloomberg consensus
Assets: Sole focus on the Canning Superbasin Buru Energy is the dominant acreage holder in the Canning Basin, with more than 64,000km2 under title. The Canning Basin presents substantial conventional and unconventional potential, recognised by the EIA, which has concluded a technically recoverable resource of more than 50bnboe. Under a farm-in deal struck with IOC Mitsubishi in mid-2010, Mitsubishi agreed to fund a A$152.4m work programme to earn a 50% interest in most of Buru’s permits, inferring that Buru’s interest at that time was worth the same amount.
Challenges: Ungani commercialisation priority At the drill bit, Buru’s most significant discovery came in 2011 when it discovered a conventional oil field in dolomite with its Ungani-1 well, from which initial peak flow rates of 1,600b/d were achieved. In mid-2012, Buru drilled Ungani North-1, which confirmed a 40m oil column. Buru has estimated the resource at 10-20mmbbl (gross). Buru’s development concept involves testing of Ungani North-1 during H213 toward achieving exit CY13 production of 1,000b/d. The intention is to tie in two to three new wells drilled during H213 to achieve production of 5,000b/d by mid-2014. With new discoveries and infrastructure, Buru is aiming toward 15,000b/d solely from Ungani during 2015. Beyond Ungani, Buru has also confirmed separate gas (Yulleroo) and gas-condensate (Valhalla) discoveries.
Outlook: Fully-funded E&P programme With Mitsubishi’s cost carry having matured, attention turns to Buru’s funding profile. In March, Buru announced a further deal with Mitsubishi and ASX-listed junior Rey Resources to sell-down its interests in two further Canning permits for A$21m cash, lifting Buru’s cash position to A$45m. In August, Buru closed an over-subscribed A$35m institutional share placement, which will provide sufficient backing to fully develop Ungani and to fully fund its 2013-14 work programme. Into 2014, Ungani cash flow should kick in, which at planned production rates should contribute A$60m pa. Further out, if Buru’s Laurel basin-centred gas programme proves commercial, a new 450km pipeline would need to be built to connect with Port Hedland for supply into the WA gas market.
Buru Energy Canning Superbasin focus
Price A$1.81* Market cap A$535m
*as at 9 August 2013 Net cash at 30 June 2013 (before closing A$35m institutional placement)
A$45m
Shares in issue (including institutional share placement)
295.4
Free float (estimated) 70.6%
Code BRU
Primary exchange ASX
Secondary exchange N/A
Share price performance
52-week high/low A$3.24 A$1.19
Business description
Buru Energy is a Perth-based, ASX-listed E&P company with a substantial net acreage position in the Canning Superbasin. Since it was established in 2008, Buru’s work programme has produced a series of gas, gas-condensate and oil discoveries, both conventional and unconventional.
Catalysts/next events
Forward drilling programme and rig confirmations
Q313
Ungani Phase 1, 1,000b/d H213
Ungani Phase 2: 5,000b/d H114
Analysts
John Kidd +64 (0)4 8948 555
Ian McLelland +44 (0)20 3077 5756

Buru Energy | 15 August 2013 50
Evaluation criteria Exposure Comment
Risk potential based on low risk/key strength, medium risk, high risk/weakness.
Management and operational partners
Board representation includes significant experience from Arc Energy, which merged with AWE in 2008. Buru was established from the Arc/AWE merger to house Arc’s Canning Basin assets. The JV with Mitsubishi, established in mid-2010, adds significant mass and credibility.
Subsurface understanding/complexity
Although still early stage, there is significant existing knowledge based on past drilling and G&G work. Buru has recommenced a 240km2 3D survey in the Ungani region, which it will follow with a 670km 2D shoot along the Ungani trend.
Portfolio balance/upside potential
Despite Buru’s focus lying exclusively on the early-stage Canning Superbasin, the presence of multiple plays, both conventional and unconventional, provides a significant positive offset. Buru’s conventional oil play at Ungani infers a potentially significant conventional producing backbone while the unconventional work programme is progressed.
Infrastructure
No existing gas network and generally undeveloped roading, particularly in remote central and southern areas. Oil is trucked to market via Broome. If Buru demonstrates commercially viable gas, it would need to submit a proposal to WA during 2016 for a new pipeline to connect with WA’s existing network. A c 250km link would likely be required to connect to the existing Pilbara pipeline at Port Hedland.
Financial strength/discipline
Having realised A$56m in new funding inflow since Q113, current cash backing will sit at c A$80m. With a A$30m debt facility recently secured and with a further A$47m due from its partners toward the JV work programme, Buru’s 2013-14 work programme will be fully funded. From Q413, Buru should start seeing cash flow from Stage 1 Ungani (to 1,000b/d), ramping up to c A$60m pa once Stage 2 (to 5,000b/d) kicks in during H114. Buru also holds further fall-back options including sell-down of further permit interests.
Key onshore Australian assets
Reserves and resources 2P reserves 2C resources
Oils mmbbl
LPG kt
Gas PJ
Total mmboe
Oils mmbbl
LPG kt
Gas PJ
Total mmboe
Onshore Australia * * * * 5.0 * * 5.0 Offshore Australia * * * * * * * * Other countries * * * * * * * * Total * * * * 5.0 * * 5.0 Note: *Not applicable.
Onshore Australia permit titles
Basin/ permit
Permit/ prospect
Interest (%)
Gross km2
Operator
Canning EP104 38.95 Buru R1 38.95 Buru L15 15.5 Buru EP371 50.0 Buru EP390 50.0 Buru EP391 50.0 Buru EP417 35.0 New Standard EP428 50.0 Buru EP431 50.0 Buru EP436 50.0 Buru EP438 5.0 Buru EP471 50.0 Buru
Basin/ permit
Permit/ prospect
Interest (%)
Gross km2
Operator
Canning EP474 100.0 Buru EP472 50.0 Buru EP476 50.0 Buru EP477 50.0 Buru EP478 100.0 Buru L17 100.0 Buru L6/L8/PL7 100.0 Buru EP129 100.0 Buru L10-7 100.0 Buru L10-8 100.0 Buru L11-1 100.0 Buru L11-2 100.0 Buru
Source: Company announcements, Edison Investment Research

Central Petroleum (CTP) boasts the largest onshore acreage holding in the Australian sector. Its Surprise conventional oil discovery in 2012 has been de-risked and looks set to be commercialised by early-2014. In Q412, major farm-in deals with each of Total and Santos were struck and are now fully operational. Together they will provide a major test of the prospectivity of central Australia’s lightly explored Paleozoic basins. We see plenty of scope for interesting news flow in the coming months.
Year end Revenue (A$m)
EBITDA (A$m)
PBT (A$m)
Debt (A$m)
Net cash (A$m)
Capex (A$m)
06/11 0.0 (37.4) (36.7) 0.0 9.5 (0.6) 06/12 0.0 (26.6) (26.4) 0.0 12.1 (1.2) 06/13 0.0 N/A N/A 0.0 1.3 (7.6) 06/14e N/A N/A N/A N/A N/A N/A
Source: Company data, Bloomberg consensus
Assets: 70 million acres, top-quality partners Until very recently, CTP was the outright holder of more than 270,000km2 of central Australian frontier acreage spanning the Amadeus, Pedirka, Southern Georgina and Wiso basins as well as the Lander Trough in NT. This changed in Q412, when CTP announced separate farm-in deals with majors Santos and Total. The Santos deal will involve a potential A$150m spend on a three-staged work programme targeting CTP’s Amadeus and Pedirka Basin permits, implying a valuation of A$10.8/acre. The Total deal also has three commitment stages for a potential US$190m (A$207m) spend on CTP’s Southern Georgina basin acreage, implying US$37.6/acre (A$41.0/acre). Importantly, the deal includes an initial full cost carry which should defer any CTP outlay until H214.
Challenges: Surprise development From the Santos deal CTP retains 100% ownership of around half its Amadeus acreage, which does not form part of the farm-in catchment. This is significant as within this area lies a conventional sandstone oil discovery, Surprise, made by CTP in early-2012. An independent report received by CTP late in Q113 concluded a 2P base of 1.1mmbbl and a 2C estimate of 5.9mmbbl. CTP intends to develop the field once a production permit has been issued by the NT authorities, following which it will also drill a further appraisal/production well to test for a likely eastern extension.
Outlook: Big activity ramp-up ahead Once CTP has confirmation of a production permit, expected in Q413, it anticipates moving quickly to construction. On an initial single-well development plan using existing infrastructure, capex should not exceed $5m. Completion of a A$10m placement at A10c/share and receipt of a A$5.9m R&D tax credit refund, both during July, will ensure CTP can fund the two-well development of Surprise without requiring further capital. Coupled with its two JVs, the next 12-18 months are shaping as a period of strong newsflow from CTP.
Central Petroleum Huge acreage, big programmes, small outlays
Price A$0.11* Market cap A$170m
*as at 9 August 2013 Net cash at 31 July 2013 (estimated)
$17m
Shares in issue 1,546.1m
Free float 88.3%
Code CTP
Primary exchange ASX
Secondary exchange N/A
Share price performance
52-week high/low A$0.20 A$0.07
Business description
Central Petroleum is an oil and gas junior focused on exploration and development in the basins of central Australia. It currently has exposure to four basins mainly located in the Northern Territory. During Q412, CTP established separate JVs with Santos and Total.
Catalysts/next events
Total + Santos work programmes H213
Issue of Surprise production licence Q413-Q114
Surprise facilities construction + commissioning
Q114-Q214
Analysts
John Kidd +64 (0)4 8948 555
Ian McLelland +44 (0)20 3077 5756
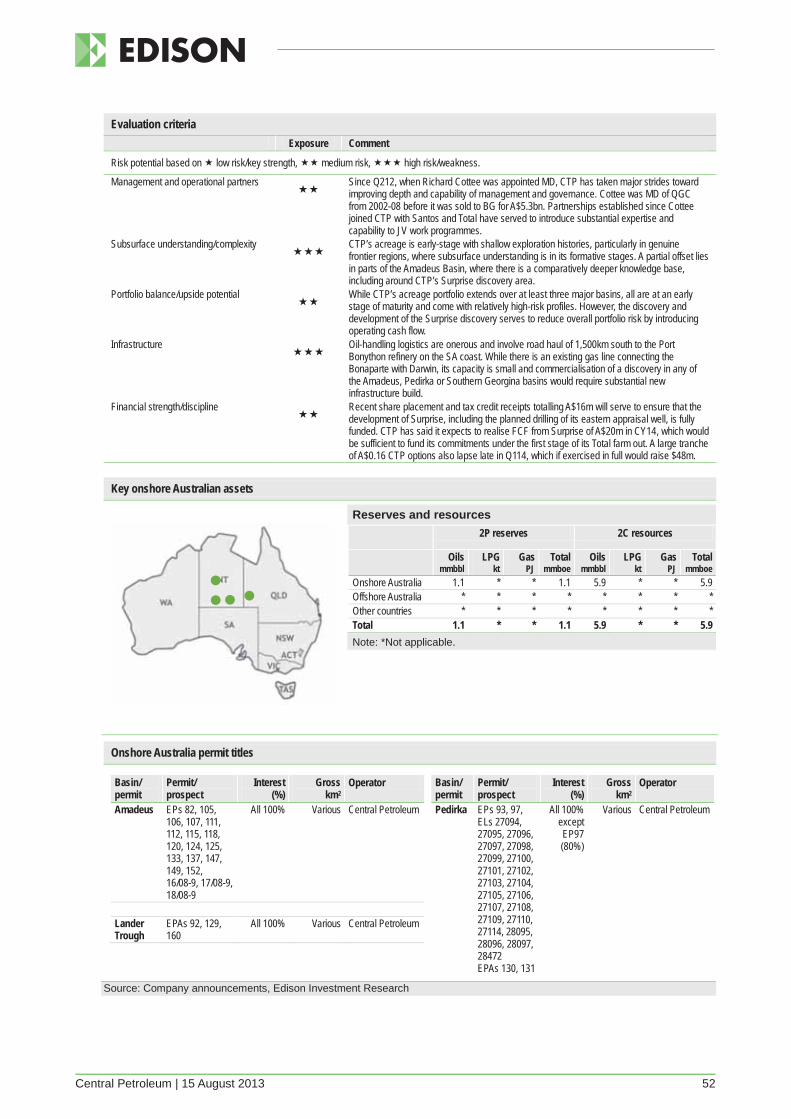
Central Petroleum | 15 August 2013 52
Evaluation criteria Exposure Comment
Risk potential based on low risk/key strength, medium risk, high risk/weakness.
Management and operational partners
Since Q212, when Richard Cottee was appointed MD, CTP has taken major strides toward improving depth and capability of management and governance. Cottee was MD of QGC from 2002-08 before it was sold to BG for A$5.3bn. Partnerships established since Cottee joined CTP with Santos and Total have served to introduce substantial expertise and capability to JV work programmes.
Subsurface understanding/complexity
CTP’s acreage is early-stage with shallow exploration histories, particularly in genuine frontier regions, where subsurface understanding is in its formative stages. A partial offset lies in parts of the Amadeus Basin, where there is a comparatively deeper knowledge base, including around CTP’s Surprise discovery area.
Portfolio balance/upside potential
While CTP’s acreage portfolio extends over at least three major basins, all are at an early stage of maturity and come with relatively high-risk profiles. However, the discovery and development of the Surprise discovery serves to reduce overall portfolio risk by introducing operating cash flow.
Infrastructure
Oil-handling logistics are onerous and involve road haul of 1,500km south to the Port Bonython refinery on the SA coast. While there is an existing gas line connecting the Bonaparte with Darwin, its capacity is small and commercialisation of a discovery in any of the Amadeus, Pedirka or Southern Georgina basins would require substantial new infrastructure build.
Financial strength/discipline
Recent share placement and tax credit receipts totalling A$16m will serve to ensure that the development of Surprise, including the planned drilling of its eastern appraisal well, is fully funded. CTP has said it expects to realise FCF from Surprise of A$20m in CY14, which would be sufficient to fund its commitments under the first stage of its Total farm out. A large tranche of A$0.16 CTP options also lapse late in Q114, which if exercised in full would raise $48m.
Key onshore Australian assets
Reserves and resources 2P reserves 2C resources
Oils mmbbl
LPG kt
Gas PJ
Total mmboe
Oils mmbbl
LPG kt
Gas PJ
Total mmboe
Onshore Australia 1.1 * * 1.1 5.9 * * 5.9 Offshore Australia * * * * * * * * Other countries * * * * * * * * Total 1.1 * * 1.1 5.9 * * 5.9 Note: *Not applicable.
Onshore Australia permit titles
Basin/ permit
Permit/ prospect
Interest (%)
Gross km2
Operator
Amadeus EPs 82, 105, 106, 107, 111, 112, 115, 118, 120, 124, 125, 133, 137, 147, 149, 152, 16/08-9, 17/08-9, 18/08-9
All 100% Various Central Petroleum
Lander Trough
EPAs 92, 129, 160
All 100% Various Central Petroleum
Basin/ permit
Permit/ prospect
Interest (%)
Gross km2
Operator
Pedirka
EPs 93, 97, ELs 27094, 27095, 27096, 27097, 27098, 27099, 27100, 27101, 27102, 27103, 27104, 27105, 27106, 27107, 27108, 27109, 27110, 27114, 28095, 28096, 28097, 28472 EPAs 130, 131
All 100% except EP97 (80%)
Various Central Petroleum
Source: Company announcements, Edison Investment Research
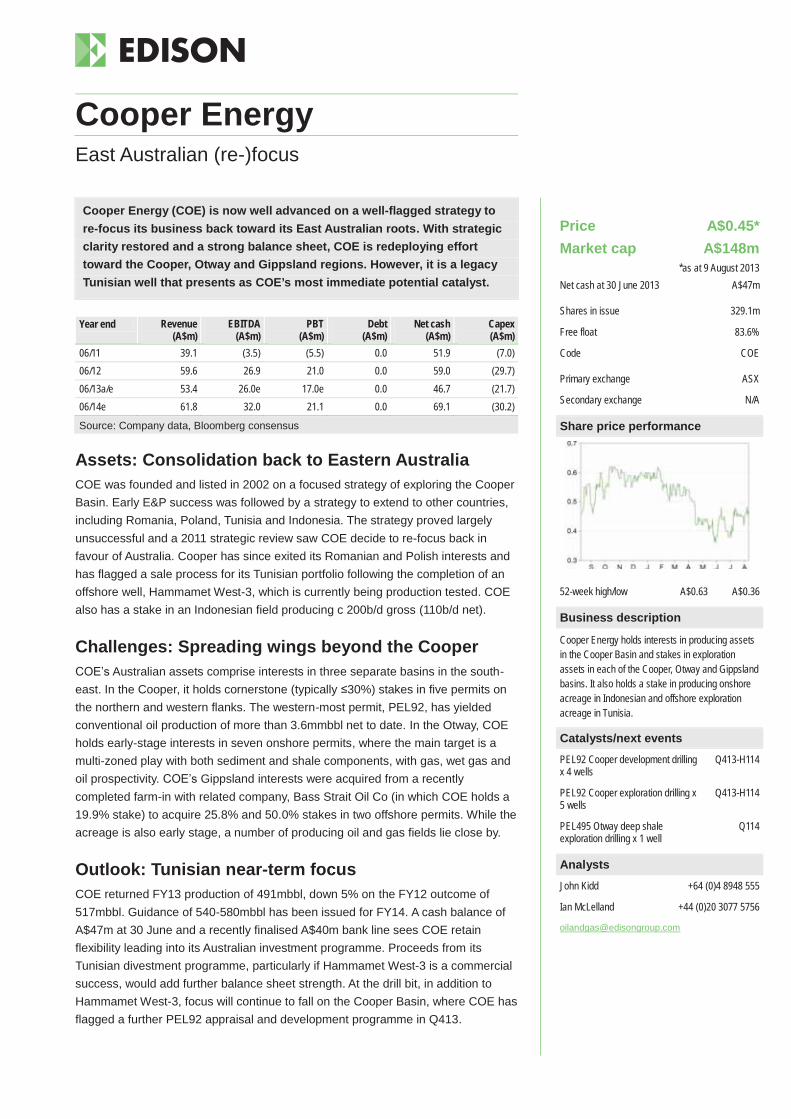
Cooper Energy (COE) is now well advanced on a well-flagged strategy to re-focus its business back toward its East Australian roots. With strategic clarity restored and a strong balance sheet, COE is redeploying effort toward the Cooper, Otway and Gippsland regions. However, it is a legacy Tunisian well that presents as COE’s most immediate potential catalyst.
Year end Revenue (A$m)
EBITDA (A$m)
PBT (A$m)
Debt (A$m)
Net cash (A$m)
Capex (A$m)
06/11 39.1 (3.5) (5.5) 0.0 51.9 (7.0) 06/12 59.6 26.9 21.0 0.0 59.0 (29.7) 06/13a/e 53.4 26.0e 17.0e 0.0 46.7 (21.7) 06/14e 61.8 32.0 21.1 0.0 69.1 (30.2)
Source: Company data, Bloomberg consensus
Assets: Consolidation back to Eastern Australia COE was founded and listed in 2002 on a focused strategy of exploring the Cooper Basin. Early E&P success was followed by a strategy to extend to other countries, including Romania, Poland, Tunisia and Indonesia. The strategy proved largely unsuccessful and a 2011 strategic review saw COE decide to re-focus back in favour of Australia. Cooper has since exited its Romanian and Polish interests and has flagged a sale process for its Tunisian portfolio following the completion of an offshore well, Hammamet West-3, which is currently being production tested. COE also has a stake in an Indonesian field producing c 200b/d gross (110b/d net).
Challenges: Spreading wings beyond the Cooper COE’s Australian assets comprise interests in three separate basins in the south-east. In the Cooper, it holds cornerstone (typically ≤30%) stakes in five permits on the northern and western flanks. The western-most permit, PEL92, has yielded conventional oil production of more than 3.6mmbbl net to date. In the Otway, COE holds early-stage interests in seven onshore permits, where the main target is a multi-zoned play with both sediment and shale components, with gas, wet gas and oil prospectivity. COE’s Gippsland interests were acquired from a recently completed farm-in with related company, Bass Strait Oil Co (in which COE holds a 19.9% stake) to acquire 25.8% and 50.0% stakes in two offshore permits. While the acreage is also early stage, a number of producing oil and gas fields lie close by.
Outlook: Tunisian near-term focus COE returned FY13 production of 491mbbl, down 5% on the FY12 outcome of 517mbbl. Guidance of 540-580mbbl has been issued for FY14. A cash balance of A$47m at 30 June and a recently finalised A$40m bank line sees COE retain flexibility leading into its Australian investment programme. Proceeds from its Tunisian divestment programme, particularly if Hammamet West-3 is a commercial success, would add further balance sheet strength. At the drill bit, in addition to Hammamet West-3, focus will continue to fall on the Cooper Basin, where COE has flagged a further PEL92 appraisal and development programme in Q413.
Cooper Energy East Australian (re-)focus
Price A$0.45* Market cap A$148m
*as at 9 August 2013 Net cash at 30 June 2013 A$47m
Shares in issue 329.1m
Free float 83.6%
Code COE
Primary exchange ASX
Secondary exchange N/A
Share price performance
52-week high/low A$0.63 A$0.36
Business description
Cooper Energy holds interests in producing assets in the Cooper Basin and stakes in exploration assets in each of the Cooper, Otway and Gippsland basins. It also holds a stake in producing onshore acreage in Indonesian and offshore exploration acreage in Tunisia.
Catalysts/next events
PEL92 Cooper development drilling x 4 wells
Q413-H114
PEL92 Cooper exploration drilling x 5 wells
Q413-H114
PEL495 Otway deep shale exploration drilling x 1 well
Q114
Analysts
John Kidd +64 (0)4 8948 555
Ian McLelland +44 (0)20 3077 5756

Cooper Energy | 15 August 2013 54
Evaluation criteria Exposure Comment
Risk potential based on low risk/key strength, medium risk, high risk/weakness.
Management and operational partners
COE’s Cooper Basin interests lie within JVs operated by high-quality operators Beach Energy and Senex, including in COE’s key PEL92, where Beach Energy has been leading the recent six-well programme. COE itself presents a board and executive with strong industry backgrounds, including senior executive and governance roles with a suite of major players like BHP Billiton, Beach Energy, BG, Woodside and Santos. MD David Maxwell was a senior executive with QGC leading into its alliance with and ultimate takeover by BG.
Subsurface understanding/complexity
The Cooper Basin is one of Australia’s longest-serving producing regions and as a result one of its most well understood. A 3D survey over PEL92 slated for H213 will serve to further define subsurface and to delineate future drill targets. Similarly, the Otway and Gippsland basins are each well established as conventional producing regions and are known also to contain unconventional prospects, such as the Otway’s Casterton shale. Further work slated during the next 12-18 months, including a 3D survey in Q413, will add to understanding.
Portfolio balance/upside potential
COE’s portfolio is underpinned by producing assets in its PEL92 and PEL93 Cooper Basin permits (c 1,300b/d net) and its Sukanati PSC in Indonesia (c 110b/d net). There remains clear upside potential in its Cooper Basin acreage. Work programmes targeting the Otway and Gippsland regions also hold both oil and gas potential, supported by ready access to market infrastructure.
Infrastructure
All Cooper’s permits lie in very close proximity to established oil and gas handling and transmission infrastructure. In particular, COE’s Cooper Basin acreage has an extensive gathering network that connects with oil and gas processing and transmission infrastructure.
Financial strength/discipline
With A$47m cash on hand, a further A$25m held as shares in ASX-listed Bass Straight Oil Co (ASX: BAS) and a A$40m corporate bank line recently secured, COE holds substantial financial flexibility and capacity to undertake its committed work programme. Existing production capacity from its Cooper Basin permits will provide a A$50m revenue base. Proceeds from the Tunisian sale process would provide a further buffer.
Key onshore Australian assets
Reserves and resources 2P reserves 2C resources
Oils mmbbl
LPG kt
Gas PJ
Total mmboe
Oils mmbbl
LPG kt
Gas PJ
Total mmboe
Onshore Australia 1.8 * * 1.8 * * * * Offshore Australia * * * * * * * * Other countries 0.1 * * 0.1 * * * * Total 1.9 * * 1.9 * * * * Note: *Not applicable.
Onshore Australia permit titles
Basin/ permit
Permit/ prospect
Interest (%)
Gross km2
Operator
Cooper PPL204 25.0% 2 Beach PPL205 25.0% 4 Beach PPL207 30.0% 6 Senex PPL220 25.0% 6 Beach PPL224 25.0% 2 Beach PEL90 25.0% 145 Senex PEL92 25.0% 1,897 Beach PEL93 30.0% 622 Senex PEL100 19.2% 297 Senex PEL110 20.0% 728 Senex
Basin/ permit
Permit/ prospect
Interest (%)
Gross km2
Operator
Otway PEL150 20.0% 3,212 Beach PEL151 75.0% 859 Cooper PEL168 50.0% 795 Beach PEL171 25.0% 1,974 Beach PEL186 33.0% 709 Cooper PEL495 65.0% 793 Beach
Source: Company announcements, Edison Investment Research

Drillsearch (DLS) is testament to the upside potential of the Cooper Basin. Having successfully executed a strategy to build a substantial producing oil and gas base from its conventional Western flank acreage, Drillsearch is now perfectly placed to push forward with its unconventional programme.
Year end Revenue (A$m)
EBITDA (A$m)
PBT (A$m)
Debt (A$m)
Net cash (A$m)
Capex (A$m)
06/11 14.3 (4.3) (7.0) 0.0 50.3 (12.9) 06/12 22.4 6.8 3.5 0.0 45.6 (37.5) 06/13a/e 99.3 45.9e 27.5e (129.0) 36.1 (108.1) 06/14e 236.9 150.1 109.2 (47.9) N/A (77.6)
Source: Company data, Bloomberg consensus
Assets: Exclusively Cooper Basin Since 2009, DLS has returned deeply impressive growth from a successful strategy that has comprised significant components of both exploration and acquisition. It now stands clearly as one (albeit the smallest) of the four Cooper Basin majors (Santos, Beach and Senex being the others). The commissioning in Q213 of a 47km, 10,000b/d pipeline linking its Bauer oil discovery made in Q311 has de-bottlenecked above-ground handling capacity and allowed the PEL91 Beach-led JV to register production of >12,600b/d gross (c 7,500b/d net DLS) for the month of June, up from c 3,200b/d in Q113 before the pipeline was commissioned.
Challenges: Backbone established, now for rollout DLS has defined a three-tiered strategy of near-term (conventional oil), medium-term (conventional wet gas) and long-term (unconventional oil and gas) objectives. With the first tier now very much in hand, focus is turning increasingly to the other two components, which are now underpinned by significant agreements with major companies. In July, DLS announced a deal with Santos, under which the latter will acquire a 60% stake in DLS’s Western Cooper Wet Gas Project for a A$120m commitment. A long-term agreement for Santos to buy produced DLS gas also formed part of the deal. A separate deal with BG in 2011 saw BG commit to a five-year A$130 exploration and appraisal programme for a 60% stake in ATP940P, which is prospective for both shale and tight gas. Both deals serve to supplement supply augmentation strategies into separate Santos- and BG-led LNG terminals on Curtis Island.
Outlook: Production plus upside focus On the back of its Bauer upswing DLS has provided FY13 guidance of 1,100-1,300mboe, three times the 390mboe FY12 outcome. With pipeline capacity expected to remain the key near-term production determinant, we would expect FY14 net production to exceed 2mmbbl. Including anticipated ramp-up of its wet gas project (just two of 19 discoveries have to date been commercialised) lifts this to c 3mmboe – a seven-fold increase in less than two years. Success with its unconventional programme would add very substantial further upside.
Drillsearch Cooper Basin bolter
Price A$1.31* Market cap A$560m
*as at 9 August 2013 Net debt at 30 June 2013 A$93m
Shares in issue 427.8
Free float 81.6%
Code DLS
Primary exchange ASX
Secondary exchange N/A
Share price performance
52-week high/low A$1.67 A$0.94
Business description
Drillsearch holds extensive interests in the prolific Cooper-Eromanga Basins. In addition to a significant conventional oil and wet gas-producing base in the Cooper’s Western and Northern flanks, Drillsearch’s acreage presents significant tight and/or shale gas potential.
Catalysts/next events
PEL106 Narrabeen-1 well July 2013
PRL18 Western Cooper Wet Gas Project Flax South-1 well
August 2013
ATP940P shale wells x 2 Q413
Analysts
John Kidd +64 (0)4 8948 555
Ian McLelland +44 (0)20 3077 5756

Drillsearch | 15 August 2013 56
Evaluation criteria Exposure Comment
Risk potential based on low risk/key strength, medium risk, high risk/weakness.
Management and operational partners
DLS can point to a compelling suite of high-quality partnerships with top-tier players. In addition to JVs with Cooper majors Santos and Beach, DLS has established broader strategic partnerships with Santos (wet gas) and BG (unconventional) targeting what would be very material upside opportunities. BG separately holds a 8.5% stake in DLS.
Subsurface understanding/complexity
Understanding of the Cooper flanks continues to grow with drilling and seismic led on each of DLS’s three strategic work programmes (conventional oil, wet gas, unconventional). DLS points to a 50% success rate on 3D seismic for conventional oil targets. Depth of knowledge of the unconventional prospectivity is less advanced, but is the subject of a major work programme under DLS’s JV with BG.
Portfolio balance/upside potential
DLS presents a portfolio compelling for its diversity and scale potential. Its existing conventional oil production base of c 7,500b/d is supplemented by a wet gas programme with significant near-term scalability and an unconventional gas programme, which, while longer dated, would provide a very substantial resource increment if commercial. Initial estimates suggest a prospective shale+tight gas resource of >32tcf.
Infrastructure
The Cooper Basin is one of Australia’s oldest producing regions and has the most established handling and transmission infrastructure of any onshore region. Included in this is direct connection with the Eastern gas market, stretching to the three LNG terminals currently being constructed on Curtis Island.
Financial strength/discipline
At 30 June, DLS held cash on hand of A$36m and had on issue US$125m of convertible bonds (coupon 6.0%, convertible before September 2018 at US$1.66/share). An undrawn A$50m revolving credit facility secured in July provides further funding capacity additional to cash on hand and forward-operating cash flows.
Key onshore Australian assets
Reserves and resources 2P reserves 2C resources
Oils mmbbl
LPG kt
Gas PJ
Total mmboe
Oils mmbbl
LPG kt
Gas PJ
Total mmboe
Onshore Australia 12.3 * 38.4 18.7 11.0 * 77.5 23.9 Offshore Australia * * * * * * * * Other countries * * * * * * * * Total 12.3 * 38.4 18.7 11.0 * 77.5 23.9 Note: *Not applicable.
Onshore Australia permit titles
Basin/ permit
Permit/ prospect
Interest (%)
Gross km2
Operator
Cooper PELs 91, 100, 101, 103, 106A, 106B, 107, 513
PRLs 14, 17, 18 PPLs 212, 239
PRLA 26 PELA 513
25.8% thru 100.0%
Various Drillsearch, Beach, Great
Artesian, Santos, Stuart
Eromanga ATPs 299P, 539P, 549P, 657P, 783P, 920P, 924P, 932P, 940P, 956P, 959P
11.0% thru 100.0%
Various Drillsearch, Great Artesian,
Australian Gasfields
Source: Company announcements, Edison Investment Research

Empire has recently commissioned a greenfield gas-condensate facility in one of its Perth Basin permits and thereby graduated from explorer to producer after a 20-year history in the region. Once final start-up issues are resolved, Empire appears well poised to extend its exploration programme, this time with a producing backbone on which to lean.
Year end Revenue (A$m)
EBITDA (A$m)
PBT (A$m)
Debt (A$m)
Net cash (A$m)
Capex (A$m)
06/11 0.0 (2.6) (2.6) 0.0 3.3 0.0 06/12 0.0 (2.3) (0.5) (0.3) 4.8 (6.8) 06/13a/e 0.0 (4.4)e (4.0)e 0.0 9.2 (22.1) 06/14e 0.0 4.7 3.0 0.0 N/A N/A
Source: Company data, Bloomberg consensus
Assets: Perth, Carnarvon focus Empire holds a portfolio of more than 20 exploration permits centred in the onshore Perth and Carnarvon basins. Established in 1994 and listed in 1998, to date Empire has raised c A$50m, which it has deployed toward its strategy of becoming a significant producer of natural gas in WA. Empire has drilled 13 exploration wells over this time, two of which (Gingin West-1 and Red Gully-1) were successes. In June, it commissioned a A$35m gas-condensate facility with a 10TJ/d-rated capacity. At a CGR of c 60bbl per TJ, inferred condensate capacity is 600b/d.
Challenges: Red Gully bed-in To fund the construction of its Red Gully facility, Empire struck a deal with major industrial gas user Alcoa, under which Alcoa would fund A$25m of Red Gully’s build cost in exchange for a long-term gas sales agreement (GSA). The A$25m served as a prepayment on an initial (we estimate) 3-5PJ tranche of gas under the GSA, with gas supplied beyond that to the GSA’s 15PJ maximum likely to attract a tariff of c A$7/GJ in real terms. The final build cost is nearly A$6m more than estimated at FID, of which Empire’s share is A$4m. To meet this, Empire completed a A1c/share share issue in Q213, raising A$7.3m and leaving Empire with A$9m on hand at 30 June. Once production is fully underway at anticipated rates, Red Gully’s condensate strip will provide a revenue stream of c A$20m pa, which after opex should leave Empire with c A$15m pa to support a work programme
Outlook: Post-production work programme focus Empire’s immediate task is to resolve the issues that are currently serving to delay acceptance of Red Gully condensate to BP’s Kwinana refinery. Until formal acceptance has been received, production will continue to be limited to Red Gully’s onsite storage capacity. Beyond this road bump, with its transition from explorer to producer now all but complete, focus will turn to Empire’s forward programme. To this end, Empire has begun preparations for three wells in separate North Perth Basin permits to be drilled in H213. Further capital would be required to execute Empire’s plans to double-handling capacity through its Red Gully plant.
Empire Oil & Gas Graduation time
Price A$0.013* Market cap A$82m
*as at 9 August 2013 Net cash at 30 June 2013 A$9m
Shares in issue 6,294.3m
Free float 94.1%
Code EGO
Primary exchange ASX
Secondary exchange N/A
Share price performance
52-week high/low A$0.29 A$0.13
Business description
Empire Oil & Gas is an E&P company with interests in 21 permits across the onshore Perth and Carnarvon basins. In 2010, it made two gas-condensate discoveries in one of its Perth Basin permits, which it commercialised by building its Red Gully processing plant in 2012 and H113.
Catalysts/next events
Kwinana refinery acceptance of produced condensate ex-Red Gully
August 2013
Dunnart-2 well, EP 437 H213
Black Arrow-1 well, EP 432 H213
Analysts
John Kidd +64 (0)4 8948 555
Ian McLelland +44 (0)20 3077 5756

Empire Oil & Gas | 15 August 2013 58
Evaluation criteria Exposure Comment
Risk potential based on low risk/key strength, medium risk, high risk/weakness.
Management and operational partners
Empire’s board comprises MD Craig Marshall, executive director Dr Bevan Wallis and two independents. Empire tends to carry controlling equity positions across most of its permit portfolio, with other JV participants tending to be junior explorers.
Subsurface understanding/complexity
The Perth and Carnarvon basins are each comparatively well understood, with (compared to comparable basins) a history of drilling and G&G baselines.
Portfolio balance/upside potential
Empire’s interests span the Perth and Carnarvon basins, totalling more than 20 permits. Its portfolio also includes EP 389 containing the Gingin and Red Gully discoveries.
Infrastructure
Each of the Perth and Carnarvon basins are very convenient to existing gas-handling infrastructure, notably the Dampier to Bunbury high-pressure pipeline providing a direct connection with the WA gas market. Condensate is trucked to the Kwinana refinery south of Perth.
Financial strength/discipline
Empire holds A$9m cash on hand with no debt. Condensate sales, once underway, should provide a baseline revenue flow of c A$5m/quarter, which will should support a modest forward exploration programme. More capital would be required to fund a planned expansion of Empire’s Red Gully facility.
Key onshore Australian assets
Reserves and resources 2P reserves 2C resources
Oils mmbbl
LPG kt
Gas PJ
Total mmboe
Oils mmbbl
LPG kt
Gas PJ
Total mmboe
Onshore Australia * * * * * * * * Offshore Australia * * * * * * * * Other countries * * * * * * * * Total * * * * * * * * Note: *Not applicable.
Onshore Australia permit titles
Basin/ permit
Permit/ prospect
Interest (%)
Gross km2
Operator
Perth EP 368 80.0 607 EP 389 76.4 1,578 EP 416 94.4 991 EP 426 46.9 2,428 EP 430 100.0 162 EP-432 (Area A) 47.2 911 EP-432 (Area B) 86.1 384 EP 437 35.0 1,639 EP 440 87.5 2,226 EP 454 50.0 991 EP 479 100.0 1,113 EP 480 40.0 1,376
Basin/ permit
Permit/ prospect
Interest (%)
Gross km2
Operator
Carnarvon EP 325 36.1 EP 359 76.7 EP 433 88.8 EP 434 90.0 EP 435 53.0 EP 439 69.2 EP 444 100.0 EP 460 68.6 EP 461 69.2 EP 466 100.0 L16 100.0
Source: Company announcements, Edison Investment Research

Despite having attracted CNOOC to a A$50m farm-in to work its huge footprint of Galilee and Eromanga basin acreage in 2010, followed by a second and deeper deal extension in 2012, Exoma now finds itself in limbo. Non-completion of the second leg of the deal leaves Exoma facing first-principle questions and decisions about its future.
Year end Revenue (A$m)
EBITDA (A$m)
PBT (A$m)
Debt (A$m)
Net cash (A$m)
Capex (A$m)
06/11 0.0 (4.9) (4.9) 0.0 11.3 0.0 06/12 0.0 (1.2) (1.2) 0.0 9.9 (0.3) 06/13 0.0 N/A N/A 0.0 9.9 (5.1) 06/14e N/A N/A N/A N/A N/A N/A
Source: Company data, Bloomberg consensus
Assets: Frontier central QLD Exoma holds a large acreage position in the Galilee and Eromanga basins in central QLD. Although early stage, its acreage has demonstrated both conventional and unconventional (principally shale and CSG) potential. In 2010, a farm-in deal, under which CNOOC would fund a A$50m work programme for a 50% stake, was announced. The work programme focused on building the JV’s knowledge of its acreage, focusing in particular on its Permian coals (for CSG) and the Toolebuc shale formation. By Q412, CNOOC’s spend commitment was ending, leaving Exoma needing to firm up further funding to support a forward programme.
Challenges: Navigating a future In September 2012, Exoma announced an extension of its partnership with CNOOC. In addition to extending its existing farm-in funding by A$12.7m, CNOOC agreed to take a further 13% stake in Exoma at 17.2c/share. In December, Exoma was advised by CNOOC that it had not received Chinese authority approval for the equity component, leaving Exoma in a state of strategic, financial and operational limbo. Irrespective of CNOOC’s own appetite and ability to proceed, without further funding arrangements for Exoma the JV is stranded. In Q113, Exoma undertook a major rationalisation to reduce its cost base, reducing headcount from 21 to 12. At 30 June, Exoma reported A$9.9m cash on hand.
Outlook: All options on the table Exoma’s programme to date has indicated low CSG gas content and saturation and shale readings that suggest insufficient maturity to support commercial production. Conventional oil and gas potential is more positive, as evidenced by Exoma’s technical (but not commercial) Katherine-1 success in 2012. The proposition is therefore one of mixed proportions for investors, including CNOOC, which must satisfy its own materiality tests. A number of options present as possible, ranging from CNOOC continuing to carry Exoma in the JV through to Exoma amalgamating its interests with another regional player. After six months of deep uncertainty, H213 should deliver investors some much-needed clarity.
Exoma Energy What Exoma did next
Price A$0.014* Market cap A$6m
*as at 9 August 2013 Net cash at 30 June A$9.9m
Shares in issue 417.5m
Free float 56.4%
Code EXE
Primary exchange ASX
Secondary exchange N/A
Share price performance
52-week high/low A$0.11 A$0.01
Business description
Exoma operates five exploration permits totalling 28,000km2 in the Galilee and Eromanga Basin in central Queensland. Compulsory relinquishments will shortly reduce this to 19,000km2. Successful applications for another four permits totalling 19,000km2 were withdrawn by Exoma in May 2013.
Catalysts/next events
Confirmation of Galilee work permit term extensions
Q313
Clarification of strategy and work programme
Q313
Analysts
John Kidd +64 (0)4 8948 555
Ian McLelland +44 (0)20 3077 5756

Exoma Energy | 15 August 2013 60
Evaluation criteria Exposure Comment
Risk potential based on low risk/key strength, medium risk, high risk/weakness.
Management and operational partners
CNOOC brings significant credibility and has twice shown an appetite to extend its exposure to the play and to Exoma. However, two abandoned deals have severely undermined the ability of CNOOC to execute. Following the latest false-start in January, Exoma reacted appropriately by reducing its cost base. Although serving to protect cash reserves, the move also significantly reduces in-house capability.
Subsurface understanding/complexity
Exoma’s Galilee acreage remains at an early stage. Substantial further work is required to understand the nature and extent of prospectivity, particularly in respect of continuous zone unconventional plays.
Portfolio balance/upside potential
Exoma’s portfolio comprises contiguous permits within the same wider region of the Galilee basin.
Infrastructure
As frontier acreage, Exoma’s permits are not well served by existing gas-handling infrastructure. A 55MW gas-fired plant operates at Baracaldine, 100km from Longreach, with a connecting pipeline to the QLD gas market. An oil discovery would likely involve road haul to the Eromanga refinery c 200km south.
Financial strength/discipline
With c A$9.9m cash, and following its cost-reduction programme, a substantially reduced cash burn, there is no immediate financial pressure. However, under current arrangements, there is insufficient financial backing on hand for Exoma to participate fully in a meaningful forward work programme.
Key onshore Australian assets
Reserves and resources 2P reserves 2C resources
Oils mmbbl
LPG kt
Gas PJ
Total mmboe
Oils mmbbl
LPG kt
Gas PJ
Total mmboe
Onshore Australia * * * * * * * * Offshore Australia * * * * * * * * Other countries * * * * * * * * Total * * * * * * * * Note: *Not applicable.
Onshore Australia permit titles
Basin/ permit
Permit/ prospect
Interest (%)
Gross km2
Operator
Galilee / Eromanga ATP 991P 50.0 3,928 Exoma ATP 996P 50.0 3,284 Exoma ATP 999P 50.0 4,122 Exoma ATP 1005P 50.0 4,427 Exoma ATP 1008P 50.0 3,111 Exoma
Note: Gross km2 incorporate mandatory one-third ATP relinquishments assumed to take effect from 31 August 2013. Source: Company announcements, Edison Investment Research

Having exercised an option in June to sell a 4.9% stake of its Cooper Basin permit to major Beach Energy, Icon has near-doubled its cash position to A$33m. That money is needed to fund its share of an extensive work programme to validate a potentially significant shale play in 2013-14.
Year end Revenue (A$m)
EBITDA (A$m)
PBT (A$m)
Debt (A$m)
Net cash (A$m)
Capex (A$m)
06/11 0.0 (7.8) (6.7) (3.7) 18.4 (3.1) 06/12 0.0 (5.6) (5.3) (3.5) 9.4 (6.3) 06/13a/e 0.0 (5.4)e (12.7)e 0.0 33.2 (4.7) 06/14e 0.0 (5.2) (14.2) N/A 5.8 N/A
Source: Company data, Bloomberg consensus
Assets: Cooper, Surat, Gippsland niche player Icon holds stakes in 13 exploration permits in the Cooper, Surat and Gippsland basins. Its main recent focus has been on its Cooper Basin interests, in particular ATP855P, where in October it drilled the Halifax-1 well with partner Beach Energy, discovering what the JV concluded to be the largest gas interval uncovered to date in Australia. Initial flow rates of up to 4.5mmscf/d sparked much optimism. However, a faulty wellhead temperature gauge resulted in flow being under-constrained during testing. Now remedied, flow rates have retreated to c 1.1mmscf/d. From Halifax, Icon plans to release a maiden 2C resource during Q313.
Challenges: Validating deep Cooper gas Halifax-1 is the first JV well to validate a basin-centred gas play in the Nappamerri Trough in ATP855P. In adjoining PEL218 operated by Beach, GIP has been estimated at 300tcf and a contingent resource of 1.3tcf booked. In February 2013, Beach announced the farm-in of Chevron to PEL218 and ATP855P in a US$349m deal structured over two stages and a number of years. In lieu of JV pre-emptives, Beach and Icon agreed a put option under which Beach would pay Icon US$18m cash for 4.9% of Icon’s existing 40% stake if Icon elected before 30 June 2013. In mid-June, Icon did so, triggering the put. The metrics of the option place the value of Icon’s residual 35.1% ATP855P stake at US$129m (A$141m).
Outlook: Cooper newsflow to dominate Although Beach and Chevron’s assessment of the play is clearly positive, much work remains to prove commerciality in what remains a promising but early-stage shale opportunity. The ATP855P JV has signalled a seven-well, 18-month drilling programme. The first two wells, Hervey-1 and Keppel-1, were recently completed and encountered gas. Each will likely be re-entered during H213. With c $33m cash on hand, Icon is well placed to fund its share of the programme. However, with the wells being deep (4-5km) and stimulation cycles planned for four of the wells, the full programme would account for much of current cash held. Elsewhere, Icon’s activities in the Gippsland Basin have been deferred while the moratorium on fracking in VIC remains in place. In the Surat, Icon’s JV partner advised in July of its intention to exit the permit, passing 100% ownership to Icon.
Icon Energy Riding the Cooper wave
Price A$0.135* Market cap A$72m
*as at 9 August 2013 Net cash at 30 June 2013 A$33m
Shares in issue 533.4m
Free float 83.5%
Code ICN
Primary exchange ASX
Secondary exchange N/A
Share price performance
52-week high/low A$0.29 A$0.13
Business description
Icon holds stakes in permits totalling 5.5m acres spanning the Cooper, Surat and Gippsland Basins. Its main current focus is its Cooper Basin interests, where it is in a JV with Beach Energy and Chevron.
Catalysts/next events
ATP855P 2C resource estimate Q313
Halifax-1 testing results H213
Hervey-1 & Keppel-1 re-entries H213
Analysts
John Kidd +64 (0)4 8948 555
Ian McLelland +44 (0)20 3077 5756

Icon Energy | 15 August 2013 62
Evaluation criteria Exposure Comment
Risk potential based on low risk/key strength, medium risk, high risk/weakness.
Management and operational partners
ATP855P JV partners Beach and Chevron bring with them exceptional depth of experience and capability with comparable shale plays, both in Australia and globally. Otherwise, Icon operates relatively independently with its other permits.
Subsurface understanding/complexity
Accepted exploration risk aside, the Cooper, Gippsland and Surat basins are each mature and well understood plays. Understanding of unconventional Cooper prospectivity (shale, tight) remains lower, but is the subject of an aggressive work programme.
Portfolio balance/upside potential
While production testing at Halifax-1 continues, Icon is not yet producing on a commercial basis. In mature basins, Icon’s plays are each at a relatively early stage. Offsetting this is the upside potential of Icon’s Cooper Basin play, particularly if the commerciality of the mapped Patchawarra, Murteree, Epsilon and Roseneath continuous formations is eventually proven.
Infrastructure
Each of Icon’s Cooper, Surat and Gippsland positions are very well serviced by existing processing, handling and transmission infrastructure.
Financial strength/discipline
With c $33m net cash on hand, Icon’s balance sheet is strong and well placed to fund its pro rata share of ATP855P deep gas programme through 2013-14.
Key onshore Australian assets
Reserves and resources 2P reserves 2C resources
Oils mmbbl
LPG kt
Gas PJ
Total mmboe
Oils mmbbl
LPG kt
Gas PJ
Total mmboe
Onshore Australia * * * * * * * * Offshore Australia * * * * * * * * Other countries * * * * * * * * Total * * * * * * * * Note: *Not applicable.
Onshore Australia permit titles
Basin/ permit
Permit/ prospect
Interest (%)
Gross km2
Operator
Cooper / Eromanga PEL218 33.3% 1,602 Beach ATP560 50.5% 86 Icon ATP549 33.3% 964 Drillsearch ATP794 60.0%
60.0% 75.0%
5,315 Icon
ATP594P 50.0% 1,538 Icon ATP855P 35.1% 1,674 Beach
Basin/ permit
Permit/ prospect
Interest (%)
Gross km2
Operator
Surat ATP626P 100.0% 2,224 Icon ATP849P 80.0% 3,854 Icon Gippsland PEP170 100.0% 804 Icon PEP172 100.0% 1,312 Icon PEP173 100.0% 1,220 Icon
Source: Company announcements, Edison Investment Research

Linc Energy owns and operates significant production (Gulf Coast) and exploration (Alaska) assets in the US, as well as a substantial and diverse portfolio of other energy assets and interests. Among these is outright title to a very large footprint of Arckaringa Basin acreage, recently assessed as holding a potential prospective resource of more than 100bnboe.
Year end Revenue (A$m)
EBITDA (A$m)
PBT (A$m)
Debt (A$m)
Net cash (A$m)
Capex (A$m)
06/11 3.2 (78.6) 432.3 (4.7) 310.3 (56.5) 06/12 57.1 (61.6) (89.7) (186.8) 25.7 (296.6) 06/13a/e 122.0 29.6e (44.5)e (551.8) 123.1 (196.6) 06/14e 179.5 85.4 22.7 N/A N/A N/A
Source: Company data, Bloomberg consensus
Assets: US production base in sharp ascent Linc’s portfolio centres on a suite of sizeable E&P interests in the US. With its onshore Gulf Coast assets, Linc achieved an exit production rate of 6,000b/d for CY12, up from 2,000b/d in CY11. Linc has issued updated exit guidance of 8,000-9,000b/d for 2013. It also produces 200b/d from acreage it holds in Wyoming, with plans to increase it to 10,000b/d. Longer term, Linc is progressing an onshore North Alaskan oil project in the Umiat region, where a 2P base (Linc 100%) of 155mmboe has been assessed. First production is planned for 2017 building toward a gross peak production target rate of 50,000boe/d.
Challenges: Arckaringa commercialisation Linc’s Australian interests centre on a 65,000km2 contiguous, outright (Linc 100%) position held in the Arckaringa Basin. Spanning eight permits, Linc’s Arckaringa acreage accounts for 80% of the basin. In January, Linc released the findings of two separate independent expert reports on the technical and commercial potential of its Arckaringa acreage, which separately concluded unrisked prospective unconventional (shale) resource estimates of 103bnboe and 230bnboe. The reports confirmed the likelihood of a liquids-rich shale play from multiple formations, with geological characteristics analogous to the prolific US Eagle Ford and Bakken plays. One of the reports concluded a further conventional resource of 125bnboe.
Outlook: All eyes on Arckaringa JV outcomes A slump in Linc’s share price since March has served to eliminate materially all the credit the market had attributed during Q113 following release of the Arckaringa reports. Linc has appointed a corporate advisor and has been in discussions with potential JV partners toward a work programme to develop its Arckaringa acreage. In Australia, Linc also holds an enduring A$2/t royalty on the large new-build Carmichael coal mine project in the Galilee Basin being progressed by Indian conglomerate Adani Group. Production is planned to start in 2016 and rise to 60Mtpa by 2022. On a simple NPV10 measure, we conclude the potential present value of that 20-year royalty stream alone to be worth an unrisked A$0.83/share.
Linc Energy US producing backbone plus Arckaringa kicker
Price A$1.75* Market cap A$908m
*as at 9 August 2013 Net debt at 30 June 2013 A$429m
Shares in issue 518.7m
Free float 56.6%
Code LNC
Primary exchange ASX
Secondary exchange N/A
Share price performance
52-week high/low A$2.95 A$0.53
Business description
Linc Energy operates a series of producing assets in the US and is progressing early-stage but potentially very large conventional and unconventional oil and gas projects in Australia, the US, South Africa and the Ukraine. Most of its Australian oil and gas acreage sits in the Arckaringa Basin.
Catalysts/next events
Arckaringa JV process outcomes Q313
Divestment of non-core coal assets H213
Adani submission of proposed Carmichael mine Environmental Impact Statement to QLD authorities
Q413
Analysts
John Kidd +64 (0)4 8948 555
Ian McLelland +44 (0)20 3077 5756

Linc Energy | 15 August 2013 64
Evaluation criteria Exposure Comment
Risk potential based on low risk/key strength, medium risk, high risk/weakness.
Management and operational partners
Although very successful since its establishment, Linc has pursued a strategy of maintaining very high (often outright) equity positions across its acreage portfolio and to operate all permits. This may change with outcomes from its Arckaringa discussions. The Linc board comprises CEO/MD Peter Bond (who holds 39% of LNC shares) and three non-executive directors.
Subsurface understanding/complexity
The estimates of the two Arckaringa independent reports are expressed as prospective resources, reflecting the early nature of the work programme and extent of current uncertainty. Substantial further G&G work would be required to firm to reserve or even resource status. Understanding is substantially stronger across its Gulf Coast and Alaskan acreage, where independently assessed 2P reserve bases have each been booked.
Portfolio balance/upside potential
Linc’s portfolio spans assets in the US Gulf Coast (Texas and Louisiana) producing at c 5,000b/d, ramp-up assets in Umiat (Alaska) and its pre-development Arckaringa (South Australia) acreage. It also includes a series of underground coal gasification interests and coal tenements in five continents.
Infrastructure
The Arckaringa Basin represents frontier territory absent of any existing route-to-market infrastructure. Most acreage lies more than 500km to the west of each of the existing Santos-controlled Moomba to Adelaide gas and Moomba to Port Bonython oil pipelines. Crude would likely need to be transported to the South Coast, possibly through the Port Bonython processing facility near Port Augusta, also controlled by Santos.
Financial strength/discipline
In March, Linc raised US$200m as convertible five-year bonds (coupon 7%, strike price A$3.40/share) to repay existing debt and provide forward working capital. The new funding will serve to significantly improve Linc’s negotiating position in discussions with potential JV partners relating to potential Arckaringa, Umiat and UCG partnerships. Depending on the outcomes from those negotiations, the new capital should ensure Linc is fully funded until at least the end of CY14.
Key onshore Australian assets
Reserves and resources 2P reserves 2C resources
Oils mmbbl
LPG kt
Gas PJ
Total mmboe
Oils mmbbl
LPG kt
Gas PJ
Total mmboe
Onshore Australia * * * * * * * * Offshore Australia * * * * * * * * Other countries 168.2 * * 168.2 * * * * Total 168.2 * * 168.2 * * * * Note: *Not applicable.
Onshore Australia permit titles
Basin/ permit
Permit/ prospect
Interest (%)
Gross km2
Operator
Arckaringa PEL117 100.0% 6,329 Linc PEL118 100.0% 7,400 Linc PEL119 100.0% 9,751 Linc PEL121 100.0% 6,415 Linc PEL122 100.0% 5,581 Linc PEL123 100.0% 9,646 Linc PEL124 100.0% 9,848 Linc PELa604 100.0% 9,454 Linc Walloway PEL120 100.0% 6,335 Linc
Source: Company announcements, Edison Investment Research

Metgasco has spent more than A$100m over a 10-year CSG work programme identifying a 2P reserve base of 428PJ in NSW’s Clarence Moreton basin. However, in March it announced the immediate suspension of all activities in response to the NSW government’s flagging of further changes to the NSW CSG policy regime. With c A$20m cash on hand and no debt, “where to from here?” for Metgasco is for now a very open question.
Year end Revenue (A$m)
EBITDA (A$m)
PBT (A$m)
Debt (A$m)
Net Cash (A$m)
Capex (A$m)
06/11 0.0 (5.8) (5.1) (0.3) 8.9 (0.4) 06/12 0.0 (6.0) (5.1) (0.3) 12.2 (6.7) 06/13 0.0 N/A N/A 0.0 20.9 (0.1) 06/14e N/A N/A N/A N/A N/A N/A
Source: Company data, Bloomberg consensus
Assets: Clarence Moreton focus Metgasco has a sole focus on the Clarence Moreton Basin in the north-eastern corner of NSW, where over a 10-year work programme it has undertaken extensive seismic and drilled nearly 50 wells. A 2P reserve base of 428PJ, a 2C resource base of 2,511PJ and Petroleum Initially in Place (PIIP) of 24tcf have each been defined. With the current resource estimates accounting for just 10% of its acreage holding, Metgasco had been targeting a potential reserve base of >5tcf. Metgasco had been scoping a 145km pipeline to connect its acreage with the Roma to Brisbane high pressure pipeline to connect with the East Australian gas market. As an initial stage, it had been planning to commence supplying gas to a local industrial customer during 2013 with plans for a larger-scale roll-out.
Challenges: Regulation show-stopper In February, the NSW government announced a tightening of restrictions on the CSG industry, including the prevention of all CSG activities within a 2km radius of residential areas. The announcement came as a deep surprise to industry, which had been working on the assumption that the Strategic Regional Land Use Policy announcement made just five months earlier served to establish a comprehensive and enduring CSG policy framework. Metgasco responded in March by indefinitely suspending all activities and substantially reducing its operating base.
Outlook: Fundamental recast ahead On 30 June, Metgasco reported cash on hand of A$21m, which approximates the amount raised from shareholders in Q412 via an institutional placement and share purchase plan, each at A$0.20/share. Restructuring costs associated with retrenching staff (21 of 27 positions have been made redundant) and costs associated with the decommissioning of wells and water storage infrastructure and facilities have now largely been incurred. The board has said it is considering options beyond the Clarence Moreton basin, although no further detail has to date been offered. More should be known in H213.
Metgasco Stranded NSW gas
Price A$0.071* Market cap A$32m
*as at 9 August 2013 Net cash at 30 June A$21m
Shares in issue 451.3
Free float 78.8%
Code MEL
Primary exchange ASX
Secondary exchange N/A
Share price performance
52-week high/low A$0.29 A$0.05
Business description
Metgasco holds outright title to three exploration permits in the NSW Clarence Moreton Basin, where it is exploring for both conventional and unconventional (CSG) gas. Its focus has been on advancing a CSG work programme to supply the East Australian gas market.
Catalysts/next events
Clarification of intended non-NSW investment strategy
H213
Analysts
John Kidd +64 (0)4 8948 555
Ian McLelland +44 (0)20 3077 5756

Metgasco | 15 August 2013 66
Evaluation criteria Exposure Comment
Risk potential based on low risk/key strength, medium risk, high risk/weakness.
Management and operational partners
The absence of an existing JV partner has left Metgasco holding a sole risk position. Having suspended all operations and shed most of its workforce, Metgasco’s corporate mass is a fraction of what it was. While its assets (principally its permit holdings) are intact, the reduced work programme agreed with authorities is essentially one of care and maintenance.
Subsurface understanding/complexity
Extensive drilling and seismic had served to de-risk acreage and allowed for a significant 2P reserve base to be booked. Further work is required to establish flow rates and commerciality.
Portfolio balance/upside potential
The Clarence Moreton is Metgasco’s only play. Its kneecapping has left the company heavily exposed, albeit possibly temporarily until such time as conditions improve sufficiently to recommence its work programme.
Infrastructure
The Clarence Moreton basin straddles the Sydney to Brisbane high-pressure gas pipeline and as such provides ready access to the East Australian gas market.
Financial strength/discipline
At 30 June, Metgasco reported cash on hand of A$21m with no debt. Having already taken steps to reduce its overhead base and shed operating staff, cash burn will fall substantially once restructurings have been completed and a subsistence programme fully implemented. The key question is how Metgasco will deploy its balance sheet to opportunities beyond the Clarence Moreton Basin (a strategy it has said it is actively looking at), and to what extent it intends to retain flexibility in case operations in the Clarence Moreton Basin can be re-started.
Key onshore Australian assets
Reserves and resources 2P reserves 2C resources
Oils mmbbl
LPG kt
Gas PJ
Total mmboe
Oils mmbbl
LPG kt
Gas PJ
Total mmboe
Onshore Australia * * 428 71 * * 2,511 419 Offshore Australia * * * * * * * * Other countries * * * * * * * * Total * * 428 71 * * 2,511 419 Note: *Not applicable.
Onshore Australia permit titles
Basin/ permit
Permit/ prospect
Interest (%)
Gross km2
Operator
Clarence Moreton PEL13 100.0% 900 Metgasco PEL16 100.0% 825 Metgasco PEL426 100.0% 2,850 Metgasco
Source: Company announcements, Edison Investment Research

New Standard Energy’s (NSE’s) large footprint of Canning Basin acreage has attracted both ConocoPhillips and Petrochina as top-tier JV partners. Despite this, NSE is emerging from 12 months of operational and strategic disappointment, which has seen it punished by the market. However, with management changes now complete and its stock trading only marginally beyond cash backing, the signs may be more positive for NSE into 2014.
Year end Revenue (A$m)
EBITDA (A$m)
PBT (A$m)
Debt (A$m)
Net cash (A$m)
Capex (A$m)
06/11 0.0 (1.7) (0.1) 0.0 4.5 6.6 06/12 0.0 (4.2) (3.5) 0.3 24.9 4.7 06/13 4.0 N/A N/A 0.0 41.5 2.1 06/14e N/A N/A N/A N/A N/A N/A
Source: Company data, Bloomberg consensus
Assets: Large acreage position, tier-1 partners NSE holds a gross acreage position totalling more than 56,000km2 in the Canning and Carnarvon basins. Its main focus is the Goldwyer Shale in the Canning Basin with a gross position of 45,000km2. The play’s potential was substantial enough to attract ConocoPhillips to a farm-in deal completed in 2011, which saw the new JV commit to a four-phase work programme totalling A$119m and ConocoPhillips provide NSE with a full carry and enduring 25% stake. NSE remains operator of the permits. In March, it was announced that as part of a deal involving multiple assets in the Asia-Pacific region, ConocoPhillips had sold down 29% of its 75% stake in the Goldwyer Southern Canning JV (SCJV) to fellow IOC Petrochina. The deal metrics reported by NSE inferred NSE’s stake to be worth US$25m.
Challenges: Recovery mode from an ugly 12 months Despite the Petrochina news, NSE’s share price has fallen 85% from its March 2012 peak, reflecting what has been a disappointing period for both the company and the wider junior resources sector. Most recently, NSE announced that a drill bit had become stuck at a depth of 2,894m while drilling the Gibb Maitland-1 well targeting the Goldwyer shale, resulting in drilling operations being abandoned before reaching target depth. In March, NSE announced that MD Sam Willis had stood down and existing non-executive director Phil Thick had been appointed MD.
Outlook: Balance sheet health Despite the disruption of the past year, NSE’s financial profile remains strong. A cash balance of A$41m and its SCJV cost carry leave it well placed as long as ConocoPhillips and Petrochina remain with the project. Beyond its SCJV work programme, NSE holds an outright 100% stake in its Merlinleigh (Carnarvon Basin conventional, shale and tight gas) project and majority interests in two Laurel Formation (Canning Basin tight gas) projects. NSE has flagged its interest in farming out both projects ahead of drilling in 2H13 and H114, confirmation of which could serve to stimulate a rebound in the shares.
New Standard Energy Bounce back needed
Price A$0.15* Market cap A$46m
*as at 9 August 2013 Net cash at 30 June 2013 A$41m
Shares in issue 305.3m
Free float 66.7%
Code NSE
Primary exchange ASX
Secondary exchange N/A
Share price performance
52-week high/low 0.57 0.11
Business description
New Standard Energy is focused on conventional and unconventional oil and gas exploration in the onshore Canning and Carnarvon Basins. It also holds interests in appraisal assets in onshore US and a 13.7% stake in ASX-listed company Elixir Petroleum.
Catalysts/next events
Merlinleigh farm-out Q313-Q413
Condon-1 Merlinleigh drilling Q413
Analysts
John Kidd +64 (0)4 8948 555
Ian McLelland +44 (0)20 3077 5756

New Standard Energy | 15 August 2013 68
Evaluation criteria Exposure Comment
Risk potential based on low risk/key strength, medium risk, high risk/weakness.
Management and operational partners
With NSE remaining operator of all permits, in which it holds interests, significant leverage to leadership remains. A highly disruptive 2012-13 has served to significantly undermine market confidence, from which it will take some time to recover. Recent MD change as yet unproven. ConocoPhillips and Petrochina participations add significant credibility to the SCJV. Despite the recency of Petrochina’s arrival to the JV, continuity risk remains.
Subsurface understanding/complexity
While neighbouring and/or on-trend permits provide analogues, existing subsurface datasets and understandings are not comprehensive. The SCJV’s Phase 1 programme is pitched squarely as a data acquisition exercise to understand the source rock potential of the Goldwyer Formation. With the Laurel project, an early-stage aerial gravity survey was completed during H113. A 2D seismic programme planned for H213 at Merlinleigh will support refinement of drilling targets for 2014.
Portfolio balance/upside potential
Asset holdings are concentrated to the Canning and Southern Carnarvon basins, both remaining in the early-stage exploration/appraisal stages. NSE’s assets include interests in two onshore Texas projects (net working interests of 32.5% and 36.0% respectively), which provide a small revenue flow.
Infrastructure
The Canning Basin is not well served by existing infrastructure, leaving a substantial barrier to overcome toward commercialising gas-rich resource. There would be a significant reliance on others (particularly Buru) to tie in to a new-build pipeline. In the Carnarvon, Merlinleigh would be able to patch in to the existing Dampier to Bunbury high-pressure line.
Financial strength/discipline
With c A$41m net cash on hand and the SCJV’s full cost carry to its name, NSE is very well positioned to fund the forward programme it has declared.
Key onshore Australian assets
Reserves and resources 2P reserves 2C resources
Oils mmbbl
LPG kt
Gas PJ
Total mmboe
Oils mmbbl
LPG kt
Gas PJ
Total mmboe
Onshore Australia * * * * * * * * Offshore Australia * * * * * * * * Other countries * * * * * * * * Total * * * * * * * * Note: *Not applicable.
Onshore Australia permit titles
Basin/ permit
Permit/ prospect
Interest (%)
Gross km2
Operator
Canning EP 417 50.0 3,139 New Standard EP 443 25.0 1,849 New Standard EP 450 25.0 12,951 New Standard EP 451 25.0 13,561 New Standard EP 456 25.0 12,862 New Standard STP-SPA-0017 100.0 3,111 New Standard STP-EPA-0092 100.0 3,505 New Standard App 1/09-0 100.0 2,187 New Standard App 2/09-0 100.0 1,095 New Standard App 5/09-0 100.0 5,690 New Standard Carnarvon EP 481 100.0 2,809 New Standard EP 482 100.0 2,663 New Standard
Source: Company announcements, Edison Investment Research

Norwest appears to have struck pay dirt with its Arrowsmith-2 well in the northern Perth Basin, in what it considers to be “the first successful test of the shale oil concept in WA”. Multiple zones of oil, condensate and gas charge below ground fit very nicely with proximity to above-ground infrastructure. Funding looks to be Norwest’s nearest-term challenge.
Year end Revenue
(A$m) EBITDA
(A$m) PBT
(A$m) Debt
(A$m) Net cash
(A$m) Capex (A$m)
06/11 0.6 (5.2) (4.7) 0.0 1.7 0.0 06/12 0.6 (3.3) (2.7) 0.0 2.4 0.0 06/13 0.2 N/A N/A 0.0 2.7 (3.9) 06/14e N/A N/A N/A N/A N/A N/A
Source: Company data, Bloomberg consensus
Assets: Early-stage Perth Basin Norwest’s focus is on a portfolio of six onshore Perth Basin permits totalling 4,368km2 of gross (1,648km2 net) acreage. Norwest’s attention has been focused on the western-most EP413 (Norwest 27.9%), which borders the Indian Ocean coastline. Norwest and JV partners AWE and Bharat Petroleum drilled (Q211) and tested (H212-Q113) the Arrowsmith-2 well, revealing multiple gas and gas-condensate pay zones, including separate sandstone (High Cliff), shale (Kockatea and Carynginia) and hybrid shale/tight gas (Irwin River coal measure, or IRCM) formations. Thicknesses across the four zones exceeded 1,050m. A five-stage frack completed in Q312 was successful in returning significant flow uplifts from each zone except the IRCM.
Challenges: Proving-up economic feasibility In August, Norwest released the results of an independent resource assessment of the Arrowsmith-2 area, which concluded a gross 2C estimate of 316bcf gas and 1.4mmbbl oil. The study also estimated a prospective gross recoverable resource of 485mmboe comprising 15.7mmbbl oil/condensate and 2.8tcf gas. Most of the gas resource was assessed to lie within the Irwin River and Carynginia formations, with smaller estimates for the High Cliff and Kockatea formations. Norwest has commissioned a well completion design for installation scheduled to commence in August that will allow pay zones to be fully tested. Norwest is planning a 3D programme at Arrowsmith during Q413 to assist with refining well locations, well spacing and trajectories, before further drilling in 2014.
Outlook: Arrowsmith and funding to watch Cash on hand at 30 June of A$2.7m would be sufficient to fund Norwest only until the end of CY13. A share purchase plan launched in early-August seeks to raise up to a further A$3.6m at A3c/share, which, if well supported, should provide sufficient new capital to extend until mid-2014. A decision to develop Arrowsmith would require significant further funding. Norwest’s other permits in WA and the UK are at a much earlier stage and while they may prove valuable in the longer-term, are not material in the same nearer-term context as EP413.
Norwest Energy Perth Basin multi-zone pay
Price A$0.031* Market cap A$30m
*as at 9 August 2013 Net cash at 30 June A$3m
Shares in issue 974.3m
Free float 94.2%
Code NWE
Primary exchange ASX
Secondary exchange N/A
Share price performance
52-week high/low A$0.09 A$0.02
Business description
Norwest Energy holds interests in three onshore permits in the Perth Basin with both conventional and unconventional oil and gas prospectivity. It also holds early-stage interests in permits on and around the Isle of Wight in the English Channel and in the Timor Sea.
Catalysts/next events
Arrowsmith-2 well completion August 2013
Arrowsmith-2 testing H213
Analysts
John Kidd +64 (0)4 8948 555
Ian McLelland +44 (0)20 3077 5756

Norwest Energy | 15 August 2013 70
Evaluation criteria Exposure Comment
Risk potential based on low risk/key strength, medium risk, high risk/weakness.
Management and operational partners
Including CEO/MD Peter Munachen, board comprises three directors with individually similar backgrounds spanning various junior oil and gas E&P players. Some offset provided by presence and expertise of high-quality partner AWE in EP413.
Subsurface understanding/complexity
While there is a reasonable subsurface dataset available on the Perth Basin’s conventional plays, there is little data available on its shale and tight play. Norwest had openly referred to Arrowsmith-2 as a proof-of-concept well intended to establish a dataset, which continues to build.
Portfolio balance/upside potential
Although Norwest’s acreage positions span multiple permit interests across two basins in two different countries, all permits except EP413 with its Arrowsmith discovery remain at an early exploration stage.
Infrastructure
The Perth Basin is well serviced with existing infrastructure, including the Parmelia high-pressure pipeline. As is the case with liquids production from other fields in the basin, condensate could be trucked to the Kwinana refinery south of Perth.
Financial strength/discipline
Cash backing of <A$3m will not support the work programme necessary to progress Arrowsmith toward and beyond commercial production. With a cash burn of A$1-1.5m/quarter, the share purchase plan recently announced is an important component to Norwest’s work programme into 2014. A decision by the Arrowsmith JV to develop the field would increase Norwest’s capital needs significantly.
Key onshore Australian assets
Reserves and resources 2P reserves 2C resources
Oils mmbbl
LPG kt
Gas PJ
Total mmboe
Oils mmbbl
LPG kt
Gas PJ
Total mmboe
Onshore Australia * * * * 0.4 * 92.6 15.8 Offshore Australia * * * * * * * * Other countries * * * * * * * * Total * * * * 0.4 * 92.6 15.8 Note: *Not applicable.
Onshore Australia permit titles
Basin/ permit
Permit/ prospect
Interest (%)
Gross km2
Operator
Perth EP 368 20.0 600 Empire EP 426 22.2 2,360 Empire EP 413 27.9 508 Norwest L 14 6.3 40 Origin SPA 0013 100.0 860 Norwest
Source: Company announcements, Edison Investment Research

For a company only four years old, PetroFrontier (PFC) has already achieved plenty. A breakthrough farm-in agreement struck with Statoil in mid-2012 remains in place, although recent amendments to that deal reflect the reality of what for PFC has since been a disappointing year.
Year end Revenue (C$m)
EBITDA (C$m)
PBT (C$m)
Debt (C$m)
Net cash (C$m)
Capex (C$m)
12/11 0.0 (9.6) (9.1) 0.0 26.9 (26.6) 12/12 0.0 (7.0) (6.7) 0.0 11.6 (14.9) 12/13e N/A N/A N/A N/A N/A N/A 12/14e N/A N/A N/A N/A N/A N/A
Source: Company data, Bloomberg consensus
Assets: Frontier play, big numbers Formed in Canada in 2009, PFC spent its first two years building a substantial 57,060km2 frontier acreage position in the western southern Georgina Basin. An independent report by Ryder Scott in 2010 estimated an unrisked, recoverable prospective resource across PFC’s permits of 27.5bnbbl, of which 26.4bnbbl was assessed to reside as a regional shale oil reservoir, with the 1.1bn balance in four conventional reservoir formations. In June 2012, PFC announced a farm-in deal with global IOC Statoil and a three-staged US$230m commitment for a potential 65% stake. In Q312, the JV drilled three horizontal wells, although two could not be tested due to operational problems. The third, Owen-3H, logged oil shows, although initial flow testing did not reveal hydrocarbons.
Challenges: After the party As well as the Statoil deal, PFC also announced a fully underwritten US$15m raising at C$1.00/share to fund its forward 2012/13 spend commitments under the new JV. Just two weeks later, it received notice of termination from the underwriter, ending the raising. In September, it completed a series of placements totalling C$10m at a heavily discounted C$0.65/share. While sufficient to fund the balance of its 2012 commitments, in December 2012 PFC acknowledged that it did not have sufficient backing to fund its 2013 programme, causing it to launch a strategic review to investigate its forward options. From that process came the announcement in June of an amended farm-in agreement with Statoil, which saw significant concessions from PFC. Although Statoil will now fund all forward costs, the potential spend commitment reduces to US$175m to secure an 80% stake.
Outlook: Playing the role of a passive JV traveller The amended farm-in agreement sees operatorship of the work programme pass from PFC to Statoil from 1 September 2013, but eliminates US$10m of further near-term funding, which PFC would have had to contribute to the JV. At 31 March, PFC had cash on hand of C$8m. With the pending shifting of operatorship and now a full cost carry from Statoil, PFC has implemented a cost reduction programme to reduce cash burn.
PetroFrontier Tough going in Southern Georgina
Price C$0.225* Market cap C$18m
*as at 9 August 2013 Net cash at 31 March 2013 C$8m
Shares in issue 79.4
Free float 71.9%
Code PFC
Primary exchange TSX-V
Secondary exchange N/A
Share price performance
52-week high/low A$0.80 A$0.11
Business description
PetroFrontier is a TSX-V listed company with dominant equity stakes in six frontier permits in the southern Georgina Basin. In mid-2010, it announced a major farm-in agreement with Statoil to explore the southern Georgina Basin. That agreement has recently been amended.
Catalysts/next events
385km 2D seismic programme Q313
4-6 vertical test wells under JV work programme
H213-H114
Analysts
John Kidd +64 (0)4 8948 555
Ian McLelland +44 (0)20 3077 5756
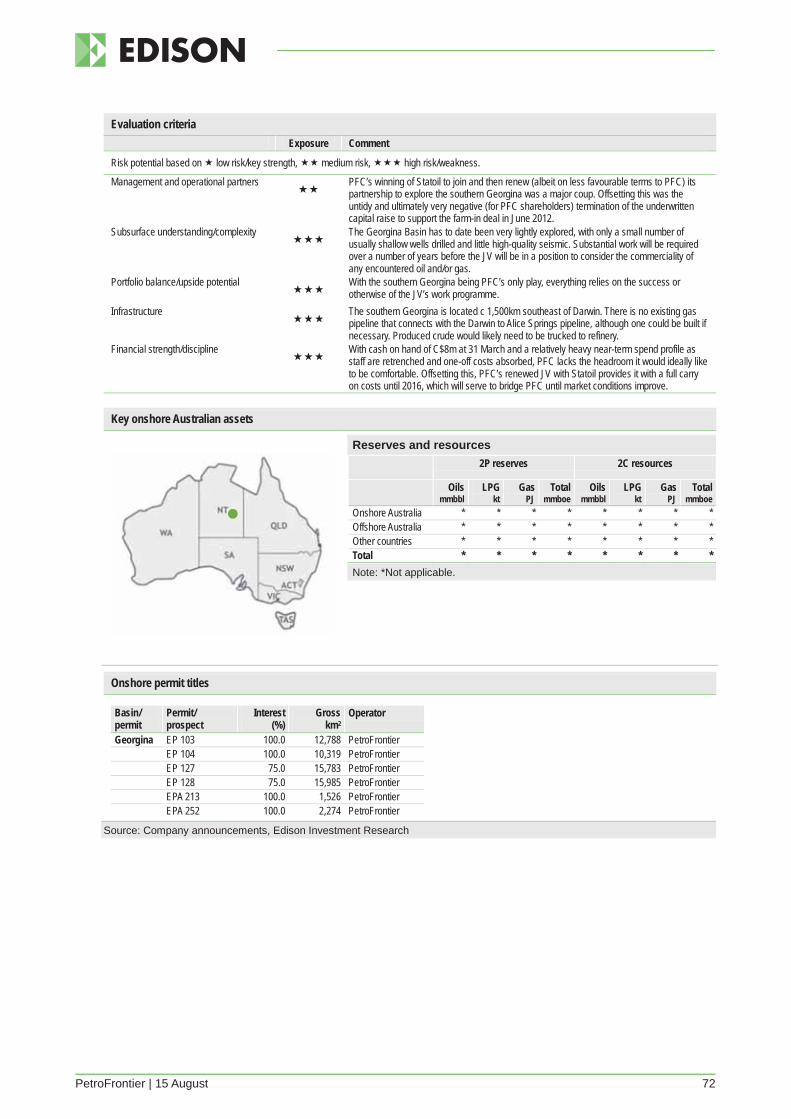
PetroFrontier | 15 August 72
Evaluation criteria Exposure Comment
Risk potential based on low risk/key strength, medium risk, high risk/weakness.
Management and operational partners
PFC’s winning of Statoil to join and then renew (albeit on less favourable terms to PFC) its partnership to explore the southern Georgina was a major coup. Offsetting this was the untidy and ultimately very negative (for PFC shareholders) termination of the underwritten capital raise to support the farm-in deal in June 2012.
Subsurface understanding/complexity
The Georgina Basin has to date been very lightly explored, with only a small number of usually shallow wells drilled and little high-quality seismic. Substantial work will be required over a number of years before the JV will be in a position to consider the commerciality of any encountered oil and/or gas.
Portfolio balance/upside potential
With the southern Georgina being PFC’s only play, everything relies on the success or otherwise of the JV’s work programme.
Infrastructure
The southern Georgina is located c 1,500km southeast of Darwin. There is no existing gas pipeline that connects with the Darwin to Alice Springs pipeline, although one could be built if necessary. Produced crude would likely need to be trucked to refinery.
Financial strength/discipline
With cash on hand of C$8m at 31 March and a relatively heavy near-term spend profile as staff are retrenched and one-off costs absorbed, PFC lacks the headroom it would ideally like to be comfortable. Offsetting this, PFC’s renewed JV with Statoil provides it with a full carry on costs until 2016, which will serve to bridge PFC until market conditions improve.
Key onshore Australian assets
Reserves and resources 2P reserves 2C resources
Oils mmbbl
LPG kt
Gas PJ
Total mmboe
Oils mmbbl
LPG kt
Gas PJ
Total mmboe
Onshore Australia * * * * * * * * Offshore Australia * * * * * * * * Other countries * * * * * * * * Total * * * * * * * * Note: *Not applicable.
Onshore permit titles
Basin/ permit
Permit/ prospect
Interest (%)
Gross km2
Operator
Georgina EP 103 100.0 12,788 PetroFrontier EP 104 100.0 10,319 PetroFrontier EP 127 75.0 15,783 PetroFrontier EP 128 75.0 15,985 PetroFrontier EPA 213 100.0 1,526 PetroFrontier EPA 252 100.0 2,274 PetroFrontier
Source: Company announcements, Edison Investment Research

In just three years, Senex (Victoria Petroleum until 2011) has emerged from relative obscurity to be counted as one of the Cooper Basin’s major players. Having established a significant conventional oil reserve and production base, Senex needs to establish the economic viability of what is a potentially substantial gas resource to take itself to the next level.
Year end Revenue (A$m)
EBITDA (A$m)
PBT (A$m)
Debt (A$m)
Net cash (A$m)
Capex (A$m)
06/11 10.6 (6.9) (15.5) 0.0 42.2 (15.1) 06/12 67.1 19.2 10.5 0.0 124.0 (37.4) 06/13a/e 137.3 61.6e 44.1e 0.0 127.0 (134.6) 06/14e 167.3 83.0 59.0 0.0 97.0 (82.0)
Source: Company data, Bloomberg consensus
Assets: Western flank oil growth back bone Senex’s operations are concentrated in the Cooper Basin, where it produces from 14 existing oil fields and participates in more than 30 JVs. Its focus is on two key plays: Western flank conventional oil and North+South flank gas. E&P success with its western flank programme and a shrewd acquisition programme during 2010-11 underpinned a period of sharp reserves and production growth. More recently, its focus on the unconventional gas (shale, tight and CSG) fairways that span each of the northern and southern flanks of the Cooper have drawn its closer attention.
Challenges: Economic viability of gas resource Senex’s Cooper Basin gas programme comprises both conventional and unconventional targets in separate northern and southern provinces. Drilling in H113 saw a number of multi-stage vertical fracks completed, the results of which saw Senex announce a significant 2C contingent resource of 1.95tcf across three fields: Hornet, Sasanof and Paning. Of these, the tight conventional Hornet field shows the strongest potential with a 2C estimate of 835bcf and a flow rate of 2.2mmscf/d, although significantly weaker flow rates from the other two fields (0.2mmscf/d and 0.09mmscf/d respectively) suggest there is still much work to do to establish economic viability.
Outlook: Continuous 12 drilling months ahead In June, Senex announced the start of a major drilling campaign, which will see it drill 30 wells in just the next 12 months. While the main focus will be on undertaking development and appraisal drilling of existing fields, a number of exploration wells are also slated. The first well in the programme, Warrior-8, was completed as a successful development well to extend the existing Warrior field. To support its programme, Senex has said it is looking to attract a partner to share capital and capability to advance its Cooper gas projects. Success in attracting a major player would serve as a significant endorsement of the resource it has defined to date. In the Surat Basin, work programmes led by JV partners BG and Arrow Energy will continue to focus on increasing 2P reserve bases (currently 157PJ net to Senex) and pilot testing. Senex has provided FY14 production guidance of 1.4-1.6mmbbl and reserve growth guidance of 4-6mmbbl.
Senex Energy 1mmbbl-plus pa Cooper Basin oil producer
Price A$0.73* Market cap A$833m
*as at 9 August 2013 Net cash at 30 June 2013 A$127m
Shares in issue 1,141.3m
Free float 70.3%
Code SXY
Primary exchange ASX
Secondary exchange N/A
Share price performance
52-week high/low A$0.84 A$0.49
Business description
Senex is an independent oil and gas producer and a significant player in the Cooper Basin, where it holds interests in 65 permits and produces from 14 different fields. It also holds stakes in four Surat Basin permits, where it has an active CSG work programme with its partners.
Catalysts/next events
2012-13 drilling campaign H213-H114
Cooper Basin gas farm-out H213
Analysts
John Kidd +64 (0)4 8948 555
Ian McLelland +44 (0)20 3077 5756
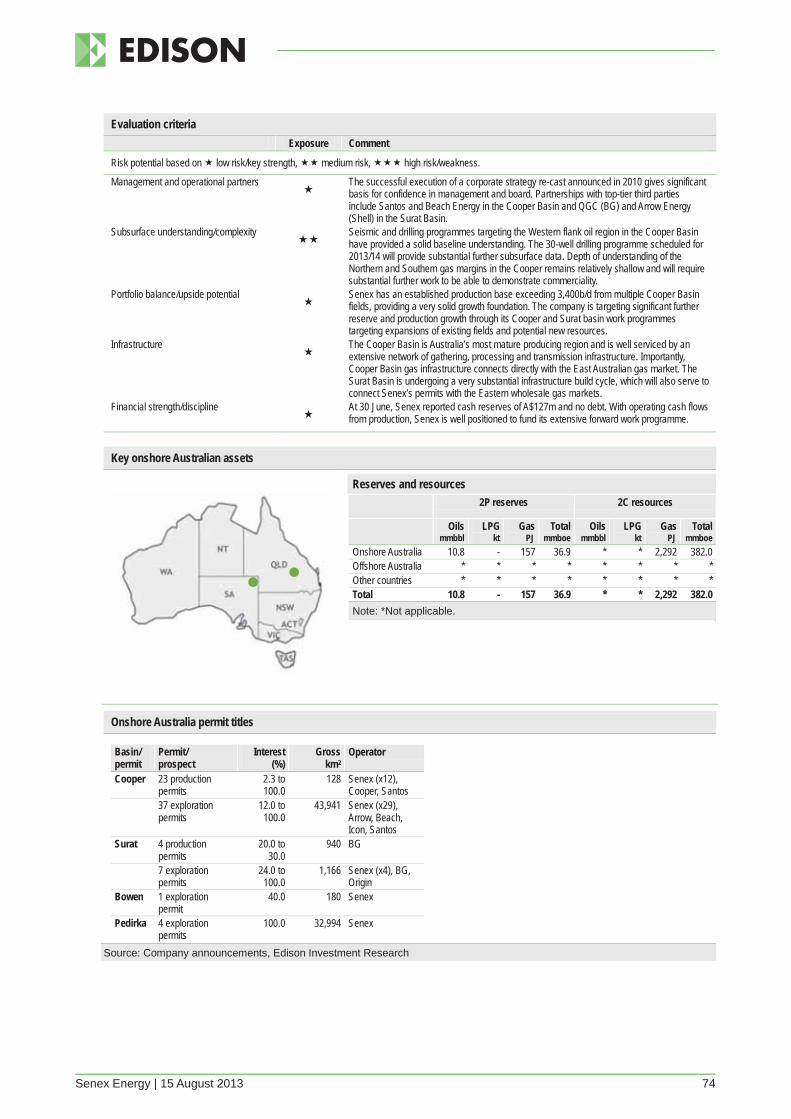
Senex Energy | 15 August 2013 74
Evaluation criteria Exposure Comment
Risk potential based on low risk/key strength, medium risk, high risk/weakness.
Management and operational partners
The successful execution of a corporate strategy re-cast announced in 2010 gives significant basis for confidence in management and board. Partnerships with top-tier third parties include Santos and Beach Energy in the Cooper Basin and QGC (BG) and Arrow Energy (Shell) in the Surat Basin.
Subsurface understanding/complexity
Seismic and drilling programmes targeting the Western flank oil region in the Cooper Basin have provided a solid baseline understanding. The 30-well drilling programme scheduled for 2013/14 will provide substantial further subsurface data. Depth of understanding of the Northern and Southern gas margins in the Cooper remains relatively shallow and will require substantial further work to be able to demonstrate commerciality.
Portfolio balance/upside potential
Senex has an established production base exceeding 3,400b/d from multiple Cooper Basin fields, providing a very solid growth foundation. The company is targeting significant further reserve and production growth through its Cooper and Surat basin work programmes targeting expansions of existing fields and potential new resources.
Infrastructure
The Cooper Basin is Australia’s most mature producing region and is well serviced by an extensive network of gathering, processing and transmission infrastructure. Importantly, Cooper Basin gas infrastructure connects directly with the East Australian gas market. The Surat Basin is undergoing a very substantial infrastructure build cycle, which will also serve to connect Senex’s permits with the Eastern wholesale gas markets.
Financial strength/discipline
At 30 June, Senex reported cash reserves of A$127m and no debt. With operating cash flows from production, Senex is well positioned to fund its extensive forward work programme.
Key onshore Australian assets
Reserves and resources 2P reserves 2C resources
Oils mmbbl
LPG kt
Gas PJ
Total mmboe
Oils mmbbl
LPG kt
Gas PJ
Total mmboe
Onshore Australia 10.8 - 157 36.9 * * 2,292 382.0 Offshore Australia * * * * * * * * Other countries * * * * * * * * Total 10.8 - 157 36.9 * * 2,292 382.0 Note: *Not applicable.
Onshore Australia permit titles
Basin/ permit
Permit/ prospect
Interest (%)
Gross km2
Operator
Cooper 23 production permits
2.3 to 100.0
128 Senex (x12), Cooper, Santos
37 exploration permits
12.0 to 100.0
43,941 Senex (x29), Arrow, Beach, Icon, Santos
Surat 4 production permits
20.0 to 30.0
940 BG
7 exploration permits
24.0 to 100.0
1,166 Senex (x4), BG, Origin
Bowen 1 exploration permit
40.0 180 Senex
Pedirka 4 exploration permits
100.0 32,994 Senex
Source: Company announcements, Edison Investment Research
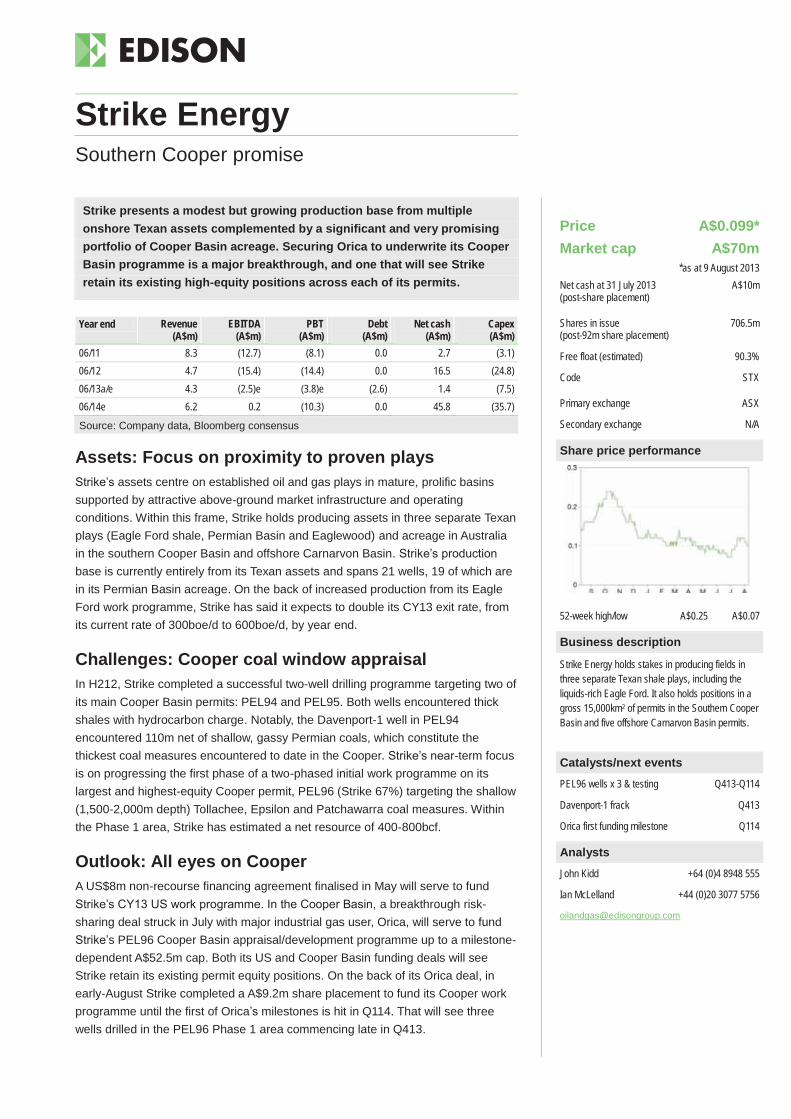
Strike presents a modest but growing production base from multiple onshore Texan assets complemented by a significant and very promising portfolio of Cooper Basin acreage. Securing Orica to underwrite its Cooper Basin programme is a major breakthrough, and one that will see Strike retain its existing high-equity positions across each of its permits.
Year end Revenue (A$m)
EBITDA (A$m)
PBT (A$m)
Debt (A$m)
Net cash (A$m)
Capex (A$m)
06/11 8.3 (12.7) (8.1) 0.0 2.7 (3.1) 06/12 4.7 (15.4) (14.4) 0.0 16.5 (24.8) 06/13a/e 4.3 (2.5)e (3.8)e (2.6) 1.4 (7.5) 06/14e 6.2 0.2 (10.3) 0.0 45.8 (35.7)
Source: Company data, Bloomberg consensus
Assets: Focus on proximity to proven plays Strike’s assets centre on established oil and gas plays in mature, prolific basins supported by attractive above-ground market infrastructure and operating conditions. Within this frame, Strike holds producing assets in three separate Texan plays (Eagle Ford shale, Permian Basin and Eaglewood) and acreage in Australia in the southern Cooper Basin and offshore Carnarvon Basin. Strike’s production base is currently entirely from its Texan assets and spans 21 wells, 19 of which are in its Permian Basin acreage. On the back of increased production from its Eagle Ford work programme, Strike has said it expects to double its CY13 exit rate, from its current rate of 300boe/d to 600boe/d, by year end.
Challenges: Cooper coal window appraisal In H212, Strike completed a successful two-well drilling programme targeting two of its main Cooper Basin permits: PEL94 and PEL95. Both wells encountered thick shales with hydrocarbon charge. Notably, the Davenport-1 well in PEL94 encountered 110m net of shallow, gassy Permian coals, which constitute the thickest coal measures encountered to date in the Cooper. Strike’s near-term focus is on progressing the first phase of a two-phased initial work programme on its largest and highest-equity Cooper permit, PEL96 (Strike 67%) targeting the shallow (1,500-2,000m depth) Tollachee, Epsilon and Patchawarra coal measures. Within the Phase 1 area, Strike has estimated a net resource of 400-800bcf.
Outlook: All eyes on Cooper A US$8m non-recourse financing agreement finalised in May will serve to fund Strike’s CY13 US work programme. In the Cooper Basin, a breakthrough risk-sharing deal struck in July with major industrial gas user, Orica, will serve to fund Strike’s PEL96 Cooper Basin appraisal/development programme up to a milestone-dependent A$52.5m cap. Both its US and Cooper Basin funding deals will see Strike retain its existing permit equity positions. On the back of its Orica deal, in early-August Strike completed a A$9.2m share placement to fund its Cooper work programme until the first of Orica’s milestones is hit in Q114. That will see three wells drilled in the PEL96 Phase 1 area commencing late in Q413.
Strike Energy Southern Cooper promise
Price A$0.099* Market cap A$70m
*as at 9 August 2013 Net cash at 31 July 2013 (post-share placement)
A$10m
Shares in issue (post-92m share placement)
706.5m
Free float (estimated) 90.3%
Code STX
Primary exchange ASX
Secondary exchange N/A
Share price performance
52-week high/low A$0.25 A$0.07
Business description
Strike Energy holds stakes in producing fields in three separate Texan shale plays, including the liquids-rich Eagle Ford. It also holds positions in a gross 15,000km2 of permits in the Southern Cooper Basin and five offshore Carnarvon Basin permits.
Catalysts/next events
PEL96 wells x 3 & testing Q413-Q114
Davenport-1 frack Q413
Orica first funding milestone Q114
Analysts
John Kidd +64 (0)4 8948 555
Ian McLelland +44 (0)20 3077 5756
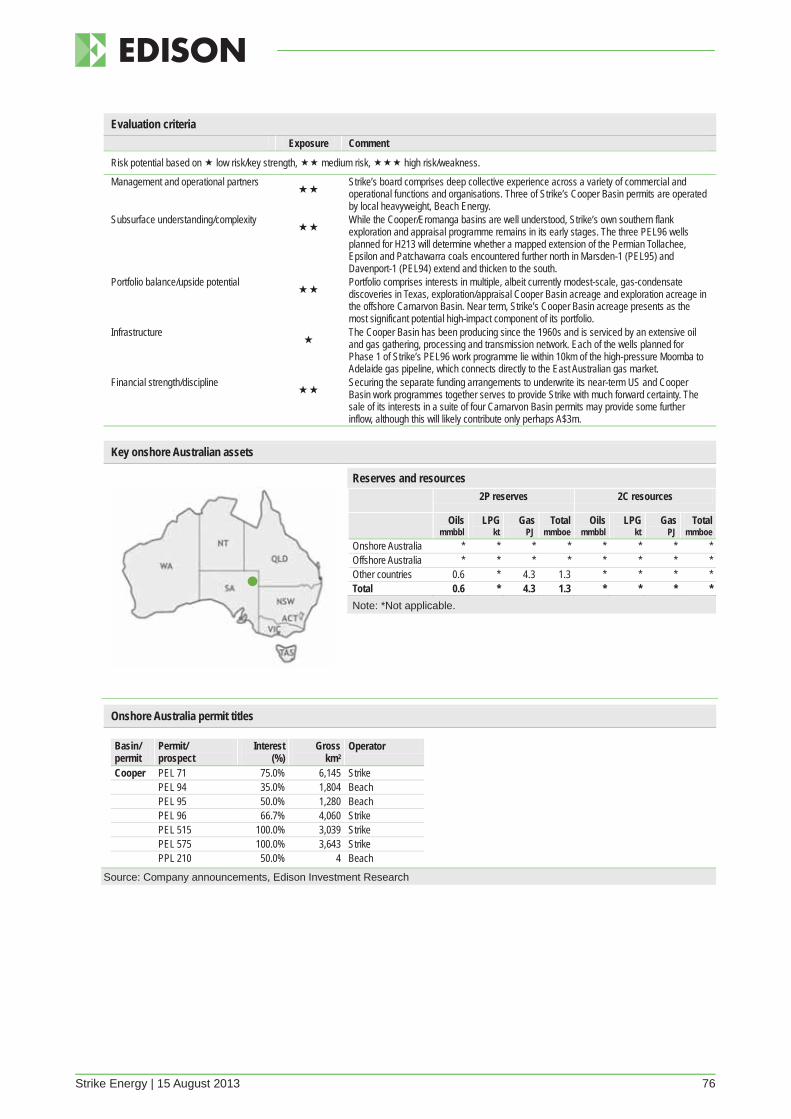
Strike Energy | 15 August 2013 76
Evaluation criteria Exposure Comment
Risk potential based on low risk/key strength, medium risk, high risk/weakness.
Management and operational partners
Strike’s board comprises deep collective experience across a variety of commercial and operational functions and organisations. Three of Strike’s Cooper Basin permits are operated by local heavyweight, Beach Energy.
Subsurface understanding/complexity
While the Cooper/Eromanga basins are well understood, Strike’s own southern flank exploration and appraisal programme remains in its early stages. The three PEL96 wells planned for H213 will determine whether a mapped extension of the Permian Tollachee, Epsilon and Patchawarra coals encountered further north in Marsden-1 (PEL95) and Davenport-1 (PEL94) extend and thicken to the south.
Portfolio balance/upside potential
Portfolio comprises interests in multiple, albeit currently modest-scale, gas-condensate discoveries in Texas, exploration/appraisal Cooper Basin acreage and exploration acreage in the offshore Carnarvon Basin. Near term, Strike’s Cooper Basin acreage presents as the most significant potential high-impact component of its portfolio.
Infrastructure
The Cooper Basin has been producing since the 1960s and is serviced by an extensive oil and gas gathering, processing and transmission network. Each of the wells planned for Phase 1 of Strike’s PEL96 work programme lie within 10km of the high-pressure Moomba to Adelaide gas pipeline, which connects directly to the East Australian gas market.
Financial strength/discipline
Securing the separate funding arrangements to underwrite its near-term US and Cooper Basin work programmes together serves to provide Strike with much forward certainty. The sale of its interests in a suite of four Carnarvon Basin permits may provide some further inflow, although this will likely contribute only perhaps A$3m.
Key onshore Australian assets
Reserves and resources 2P reserves 2C resources
Oils mmbbl
LPG kt
Gas PJ
Total mmboe
Oils mmbbl
LPG kt
Gas PJ
Total mmboe
Onshore Australia * * * * * * * * Offshore Australia * * * * * * * * Other countries 0.6 * 4.3 1.3 * * * * Total 0.6 * 4.3 1.3 * * * * Note: *Not applicable.
Onshore Australia permit titles
Basin/ permit
Permit/ prospect
Interest (%)
Gross km2
Operator
Cooper PEL 71 75.0% 6,145 Strike PEL 94 35.0% 1,804 Beach PEL 95 50.0% 1,280 Beach PEL 96 66.7% 4,060 Strike PEL 515 100.0% 3,039 Strike PEL 575 100.0% 3,643 Strike PPL 210 50.0% 4 Beach
Source: Company announcements, Edison Investment Research

Onshore down under | 15 August 2013 77
Edison, the investment intelligence firm, is the future of investor interaction with corporates. Our team of over 100 analysts and investment professionals work with leading companies, fund managers and investment banks worldwide to support their capital markets activity. We provide services to more than 400 retained corporate and investor clients from our offices in London, New York, Berlin, Sydney and Wellington. Edison is authorised and regulated by the Financial Services Authority (www.fsa.gov.uk/register/firmBasicDetails.do?sid=181584). Edison Investment Research (NZ) Limited (Edison NZ) is the New Zealand subsidiary of Edison. Edison NZ is registered on the New Zealand Financial Service Providers Register (FSP number 247505) and is registered to prov ide wholesale and/or generic financial adviser services only. Edison Investment Research Inc (Edison US) is the US subsidiary of Edison and is not regulated by the Securities and Exchange Commission. Edison Investment Research Limited (Edison Aus) [46085869] is the Australian subsidiary of Edison and is not regulated by the Australian Securities and Investment Commission. Edison Germany is a branch entity of Edison Investment Research Limited [4794244]. www.edisongroup.com DISCLAIMER Copyright 2013 Edison Investment Research Limited. All rights reserved. This report has been prepared and issued by Edison for publication globally. All information used in the publication of this report has been compiled from publicly available sources that are believed to be reliable, however we do not guarantee the accuracy or completeness of this report. Opinions contained in this report represent those of the research department of Edison at the time of publication. The securities described in the Investment Research may not be eligible for sale in all jurisdictions or to certain categories of investors. This research is issued in Australia by Edison Aus and any access to it, is intended only for "wholesale clients" within the meaning of the Australian Corporations Act. The Investment Research is distributed in the United States by Edison US to major US institutional investors only. Edison US is not registered as an investment adviser with the Securities and Exchange Commission. Edison US relies upon the "publishers' exclusion" from the definition of investment adviser under Section 202(a)(11) of the Investment Advisers Act of 1940 and corresponding state securities laws. As such, Edison does not offer or provide personalised advice. We publish information about companies in which we believe our readers may be interested and this information reflects our sincere opinions. The information that we provide or that is derived from our website is not intended to be, and should not be construed in any manner whatsoever as, personalised advice. Also, our website and the information provided by us should not be construed by any subscriber or prospective subscriber as Edison’s solicitation to effect, or attempt to effect, any transaction in a security. The research in this document is intended for New Zealand resident professional financial advisers or brokers (for use in their roles as financial advisers or brokers) and habitual investors who are “wholesale clients” for the purpose of the Financial Advisers Act 2008 (FAA) (as described in sections 5(c) (1)(a), (b) and (c) of the FAA). It is not intended for retail clients. This is not a solicitation or inducement to buy, sell, subscribe, or underwrite any securities mentioned or in the topic of this document. This document is provided for information purposes only and should not be construed as an offer or solicitation for investment in any securities mentioned or in the topic of this document. Edison has a restrictive policy relating to personal dealing. Edison Group does not conduct any investment business and, accordingly, does not itself hold any positions in the securities mentioned in this report. However, the respective directors, officers, employees and contractors of Edison may have a position in any or related securities mentioned in this report. Edison or its affiliates may perform services or solicit business from any of the companies mentioned in this report. The value of securities mentioned in this report can fall as well as rise and are subject to large and sudden swings. In addition it may be difficult or not possible to buy, sell or obtain accurate information about the value of securities mentioned in this report. Past performance is not necessarily a guide to future performance. Forward-looking information or statements in this report contain information that is based on assumptions, forecasts of future results, estimates of amounts not yet determinable, and therefore involve known and unknown risks, uncertainties and other factors which may cause the actual results, performance or achievements of their subject matter to be materially different from current expectations. For the purpose of the FAA, the content of this report is of a general nature, is intended as a source of general information only and is not intended to constitute a recommendation or opinion in relation to acquiring or disposing (including refraining from acquiring or disposing) of securities. The distribution of this document is not a “personalised service” and, to the extent that it contains any financial advice, is intended only as a “class service” provided by Edison within the meaning of the FAA (ie without taking into account the particular financial situation or goals of any person). As such, it should not be relied upon in making an investment decision. To the maximum extent permitted by law, Edison, its affiliates and contractors, and their respective directors, officers and employees will not be liable for any loss or damage arising as a result of reliance being placed on any of the information contained in this report and do not guarantee the returns on investments in the products discussed in this publication. FTSE International Limited (“FTSE”) © FTSE 2013. “FTSE®” is a trade mark of the London Stock Exchange Group companies and is used by FTSE International Limited under license. All rights in the FTSE indices and/or FTSE ratings vest in FTSE and/or its licensors. Neither FTSE nor its licensors accept any liability for any errors or omissions in the FTSE indices and/or FTSE ratings or underlying data. No further distribution of FTSE Data is permitted without FTSE’s express written consent.
Berlin +49 (0)30 2088 9525 Friedrichstrasse 95 10117 Berlin Germany
London +44 (0)20 3077 5700 280 High Holborn London, WC1V 7EE United Kingdom
New York +1 646 653 7026 245 Park Avenue, 39th Floor 10167, New York US
Sydney +61 (0)2 9258 1162 Level 33, Australia Square 264 George St, Sydney NSW 2000, Australia
Wellington +64 (0)4 8948 555 Level 15, 171 Featherston St Wellington 6011 New Zealand

Berlin +49 (0)30 2088 9525 Friedrichstrasse 95 10117 Berlin Germany
London +44 (0)20 3077 5700 280 High Holborn London, WC1V 7EE United Kingdom
New York +1 646 653 7026 245 Park Avenue, 39th Floor 10167, New York United States
Sydney +61 (0)2 9258 1162 Level 33, Australia Square 264 George St, Sydney NSW 2000, Australia
Wellington +64 (0)4 8948 555 Level 15, 171 Featherston St Wellington 6011 New Zealand
Edison Investment Research Limited is registered in England. Registered office: 280 High Holborn, London, WC1V 7EE. Company number 4794244. www.edisongroup.com