· october 23, 2015 via hand delivery and electronic mail luly e. massaro, clerk rhode island...
TRANSCRIPT

October 23, 2015
VIA HAND DELIVERY AND ELECTRONIC MAIL
Luly E. Massaro, Clerk Rhode Island Public Utilities Commission 89 Jefferson Boulevard Warwick, RI 02888 RE: Docket 4540 – National Grid’s FY 2016 Gas Infrastructure, Safety, and Reliability Plan
Risk Assessment Compliance Filing Dear Ms. Massaro:
I have enclosed ten copies of National Grid’s1 Risk Assessment Compliance Filing in compliance with the PUC’s Order No. 22046 in the above-referenced docket.
Thank you for your attention to this transmittal. If you have any questions, please contact me at
781-907-2121. Very truly yours,
Raquel J. Webster Enclosures cc: Docket 4540 Service List
Steve Scialabba Leo Wold, Esq. Jim Lanni Don Ledversis
1 The Narragansett Electric Company d/b/a National Grid (National Grid or the Company). 40 Sylvan Road, Waltham, MA 02451 T: [email protected] www.nationalgrid.com
Raquel J. Webster Senior Counsel

The Nd/b/a
Gas ISafetFY 2 Risk Filin Docke
October SubmitteRhode I
NarraganNationa
Infrastty and
2016
Assesng
et No. 45
r 23, 2015
ed to: Island Publ
nsett Elal Grid
tructuReliab
sment
540
5
lic Utilitie
ectric C
ure, bility P
Comp
s Commiss
Compan
Plan
pliance
sion
ny
e

The Narragansett Electric Company d/b/a National Grid
FY 2016 Gas Infrastructure, Safety, and Reliability Plan Risk Assessment Compliance Filing
Table of Contents
I. Company Response ................................................................................................................... 1
A. Distribution Integrity Management Plan (DIMP) ............................................................... 2
B. Identification, Evaluation, and Prioritization of Distribution Main Segments for
Replacement Procedure (ENG04030). ................................................................................ 3
C. System Integrity Report Gas Distribution Systems Trend-Based Integrity Report ............ 4
a. Gas Mains.............................................................................................................. 4
b. Gas Services .......................................................................................................... 6
II. Attachments .............................................................................................................................. 9

The Narragansett Electric Company d/b/a National Grid
FY 2016 Gas Infrastructure, Safety, and Reliability Plan Risk Assessment Compliance Filing
RIPUC Docket No. 4540 Page 1 of 9
I. Company Response
In Order No. 2046 in Docket No. 4540 (dated August 24, 2015) (Order), the Rhode Island Public Utilities Commission (PUC) instructed National Grid1 to “provide a report to the Commission and the Division detailing its methodology of assessing risk and quantifying the reduction of risk resulting from its replacement efforts . . . .”2 . In compliance with the Order, this report details National Grid’s methodology of assessing risk and quantifying the reduction of risk.
National Grid serves approximately 260,000 customers in Rhode Island through its gas distribution network. National Grid’s primary focus is on the safe and reliable delivery of natural gas throughout Rhode Island. The gas distribution system is a broad network of facilities and piping installed, operated, and maintained for more than 150 years. This network consists of 3,188 miles of gas distribution mains, 193,615 customer services, and approximately 200 custody transfer stations, pressure regulating facilities, and peak shaving plants in Rhode Island. National Grid has developed and implemented a comprehensive set of plans, programs, policies, procedures, standards, and practices to ensure the safe and reliable operation of the gas network. The primary elements that support assessing and quantifying risk across the distribution system include the following:
1) Distribution Integrity Management Plan (DIMP) Revision 4 09-01-15 - Attachment 1-1.
2) Identification, Evaluation and Prioritization of Distribution Main Segments for Replacement (ENG04030) Procedure Revision 2 – 09/04/15 - Attachment 1-2.
3) 2014 System Integrity Report Gas Distribution Systems Trend-Based Integrity Report – Rhode Island - Attachment 1-3.
These plans, procedures, and reports form the central elements for the Company’s identification and mitigation of risk associated with the gas network. These plans, procedures, and reports also provide for the identification, development and/or modification and implementation of plans and programs that are focused on further mitigating risks. Included in this process is input into the Company’s financial and operating plans.
1 The Narragansett Electric Company d/b/a National Grid (National Grid or Company). 2 Order at p. 18, paragraph 3.

The Narragansett Electric Company d/b/a National Grid
FY 2016 Gas Infrastructure, Safety, and Reliability Plan Risk Assessment Compliance Filing
RIPUC Docket No. 4540 Page 2 of 9
A. Distribution Integrity Management Plan (DIMP) The Company’s Distribution Integrity Management Plan (DIMP), implemented in August 2011, serves as the central component of the processes that focus on enhancing safety. The DIMP specifies the requirements for the identification and prioritization of gas distribution pipeline integrity risks. The DIMP also serves as the process for implementing measures to reduce risk and evaluate the effectiveness of the enacted measures. The Company’s DIMP was developed in response to the 2009 Pipeline and Hazardous Material Safety Administration (PHMSA) rule. The PHMSA rule requires operators of gas systems to address seven (7) areas, which are outlined in the graphic below. Each of these areas are further defined and addressed in the DIMP.
The program work flow outlined below reflect the tasks and activities that the Company carries out in support of implementation and execution of the DIMP along with the areas of responsibility for particular activities:

The Narragansett Electric Company d/b/a National Grid
FY 2016 Gas Infrastructure, Safety, and Reliability Plan Risk Assessment Compliance Filing
RIPUC Docket No. 4540 Page 3 of 9
The DIMP identifies the system risk at the asset class level as part of the Evaluation and Ranking of Risks. Asset classes are defined, in part, by asset type (e.g., mains, services), system pressure, pipe material, and size. Details regarding the delineation of asset classing and established risk ratings may be found in the DIMP Appendices on pages RI-20 through RI-28.
Section 8 of the DIMP includes “Identification and Implementation of Measure to Address Risk”. Among other things, section 8 of the DIMP recognizes the importance of the pro-active main and service program in reducing risk and the prioritization of gas main and service replacements through incorporation of “Identification, Evaluation and Prioritization of Distribution Main Segments for Replacement” procedure (ENG0430).
B. Identification, Evaluation, and Prioritization of Distribution Main Segments for Replacement Procedure (ENG04030).
The purpose of this procedure is to identify, evaluate, and prioritize specific distribution main segments and associated services for replacement. In prioritizing the replacement segments, the Company takes into account the deterioration of the main and services, the risk to public safety, and the DIMP factor for the asset. The procedure is used by National Grid engineers for the

The Narragansett Electric Company d/b/a National Grid
FY 2016 Gas Infrastructure, Safety, and Reliability Plan Risk Assessment Compliance Filing
RIPUC Docket No. 4540 Page 4 of 9
identification of main replacement candidates that are in the Company’s pro-active main replacement program in the Gas Infrastructure Safety & Reliability (ISR) Plan.
Specifically, the deterioration factor is determined by taking the following into account: main and service leak repair data for the prior 10 years, condition of main, open leaks on the main segment, and the length of main exhibiting leak activity. In addition, the risk to public safety component is developed by taking into account the population of leak classes and the types of buildings in the area (e.g., none, single family houses, small buildings, public buildings). The resulting factor is then combined with the DIMP risk score associated with that selected main segment’s asset type to develop the prioritization factor. Finally, additional adjustments may be applied based upon final expert review and judgment.
One significant change in procedure associated with main and service replacement prioritization has been the recent integration of service leak data into the prioritization algorithm. National Grid has recognized the need to enhance the targeting of areas where leak prone services are prevalent to provide for further service leak reduction. This has been incorporated in the most recent procedure revision (Attachment 1-2) and is scheduled for implementation on 12/15/2015.
C. System Integrity Report Gas Distribution Systems Trend-Based Integrity Report
The Company’s System Integrity Report also plays a key role in the DIMP with details of the report outlined in Section 5, “Knowledge of Facilities”, and further expounded on in Section 9, “Measurement of Performance, Monitoring Results and Evaluating Effectiveness” of the DIMP.
The System Integrity Report is updated and reviewed annually. The report evaluates and compares ten (10) prior years of key performance data. Trending analysis is developed around these key performance indicators to assess the effectiveness of the integrity and replacement programs. A key measure used to assess system safety and integrity is the change in system leaks and leak rates.
a. Gas Mains The following graphs, which are included in the System Integrity Report, provide cast iron and unprotected steel gas main inventory and leak trends by leak type and main leak repair rate for all distribution mains in Rhode Island. These trends show a clear reduction in leak repairs and leak rates over the past six years during which accelerated main and service replacement programs have been in place. Notably, long term trending is a key component to assessing and responding to risks given the annual impact resulting from variations in weather conditions, as

was evidthe attach
dent over the hed System I
6
6
7
7
8
8
9
9
Miles
400
450
500
550
600
650
700
750
Miles
past two wiIntegrity Rep
600
650
700
750
800
850
900
950
'05 '06
'05 '06 '
Unpro
inters. A broport.
'07 '08
Cast Iron
'07 '08 '0
otected S
FY 2016 Ga
oad set of tre
'09 '10
Year
n Main Inv
09 '10 '11Year
Steel Main
The
as InfrastructuRisk
ends are avai
'11 '12
ventory
1 '12 '13
n Invento
Narragansettd
ure, Safety, ak Assessment
RIPUC
ilable for fur
'13 '14
'14
ory
t Electric Comd/b/a Nationaand ReliabilityCompliance F
C Docket No.Page
rther review
mpany l Grid y Plan Filing . 4540 5 of 9
w in

The Narragansett Electric Company d/b/a National Grid
FY 2016 Gas Infrastructure, Safety, and Reliability Plan Risk Assessment Compliance Filing
RIPUC Docket No. 4540 Page 6 of 9
b. Gas Services The following graphs provide the unprotected steel service inventory and leak trends by leak type and service leak repair rate of all distribution services in Rhode Island. These trends show a reduction of leak repairs and leak rates since 2009 that have been relatively stable over the past five years during which the accelerated main and service replacement programs have been in place. Long term trending is a key component to assessing and responding to risks given the annual impact resulting from variations in weather conditions, as was evident over the past two winters. A broad set of trends are available for further review in the attached report.
2139 2183 22732517 2656
1871 1716 1663
1102 1216
0
500
1000
1500
2000
2500
3000
2005200620072008200920102011201220132014
Nu
mb
er o
f L
eaks
Years
Main Leaks Repaired by Type
Type 3
Type 2
Type 2A
Type 1
0.690.71 0.73
0.810.85
0.600.54 0.52
0.350.38
0.00
0.50
1.00
'05 '06 '07 '08 '09 '10 '11 '12 '13 '14
LEA
K R
EP
AIR
RA
TE
YEAR
Main Leak Repair Rate(Total Miles of Main)

The Narragansett Electric Company d/b/a National Grid
FY 2016 Gas Infrastructure, Safety, and Reliability Plan Risk Assessment Compliance Filing
RIPUC Docket No. 4540 Page 7 of 9
-
10,000
20,000
30,000
40,000
50,000
60,000
70,000
2005 2006 2007 2008 2009 2010 2011 2012 2013 2014
64,285 68,045 66,473 63,919 62,462 59,800
56,049 53,449 51,387 49,265 Coun
t of S
ervi
ces
RI Unprotected Steel Service Inventory by Year
Bare Steel Svc Inventory
544479
669 680
1019
708 677
567
722
838
0
300
600
900
1200
2005 2006 2007 2008 2009 2010 2011 2012 2013 2014
Nu
mb
er o
f L
eaks
Years
Service Leak Repairs by Type
Type 3
Type 2
Type 2A
Type 1

The Narragansett Electric Company d/b/a National Grid
FY 2016 Gas Infrastructure, Safety, and Reliability Plan Risk Assessment Compliance Filing
RIPUC Docket No. 4540 Page 8 of 9
The listed plans, procedures, and reports identified above provide a structured approach to risk identification and mitigation associated with the distribution network. These processes also aid in developing and refining the near and long term financial and operational programs, plans, and procedures. National Grid currently operates 1,289 miles of cast/wrought iron and unprotected steel gas mains and 49,265 unprotected steel services in its Rhode Island gas distribution network. The Company, working in conjunction with key stakeholders, has established a replacement rate of 20 years for replacement of all cast/wrought iron and unprotected steel pipe. The DIMP, along with the numerous practices, procedures and reports, provides for continuous assessment of risks and guidance in providing mitigation strategies and efforts on the gas distribution system. National Grid remains committed to operation of a safe and reliable gas network.
3.0 2.63.6
3.6
5.4
3.8 3.63.0
3.7 4.4
0.0
2.0
4.0
6.0
8.0
'05 '06 '07 '08 '09 '10 '11 '12 '13 '14
LE
AK
RE
PA
IR R
AT
E
YEAR
Service Leak Rates(Per 1000 Services)

The Narragansett Electric Company d/b/a National Grid
FY 2016 Gas Infrastructure, Safety, and Reliability Plan Risk Assessment Compliance Filing
RIPUC Docket No. 4540 Page 9 of 9
Attachments

National Grid Corporation
Gas Distribution
Integrity Management Plan
The Naragansett Electric Company d/b/a/ National Grid FY 2016 Gas ISR Risk Assessment Docket 4540 - Attachment 1-1 Page 1 of 122

Sept 01, 2015
i
Preface
The development of this Distribution Integrity Management program was initiated in 2009 as a
project involving the Northeast Gas Association, the Southern Gas Association, forty seven
utilities (including National Grid), and Structural Integrity Associates. These parties
collaborated to develop a best-in-class framework. Subsequent to the initial development,
National Grid retained Structural Integrity to assist in the customization of the National Grid
specific DIM Plan. Departments within National Grid that were directly involved in the Plan
development included Operations Regulatory Compliance and Distribution Engineering. A team
with representatives from these two groups was assigned the task of creating the National Grid
DIM Plan by August 2011 for the U.S. gas operations.
The Naragansett Electric Company d/b/a/ National Grid FY 2016 Gas ISR Risk Assessment Docket 4540 - Attachment 1-1 Page 2 of 122

Sept 01, 2015
ii
REVISION CONTROL SHEET
Title: National Grid Corporation Distribution Integrity Management Plan
Section Pages Revision Date Comments
1-12
1-12
1-12 & All
Appendices
1-12 & All
Appendices
1-12 & All
Appendices
All
All
All
All
All
0
1
2
3
4
8/2/2011
2/17/2012
8/29/2013
9/12/2014
09/01/2015
INITIAL RELEASE
REVISION 1 (Complete Re-evaluation)
REVISION 2 (Complete Re-evaluation)
REVISION 3 (Complete Re-evaluation)
REVISION 4 (Complete Re-evaluation)
The Naragansett Electric Company d/b/a/ National Grid FY 2016 Gas ISR Risk Assessment Docket 4540 - Attachment 1-1 Page 3 of 122

Sept 01, 2015
iii
Table of Contents
Section Page
1.0 COMPANY OVERVIEW .....................................................................................................1
2.0 SCOPE ....................................................................................................................................2
3.0 PURPOSE AND OBJECTIVES ...........................................................................................4
3.1 Company Roles ................................................................................................................5
3.1.1 Vice President, Gas Asset management .................................................................. 5
3.1.2 Manager, Distribution Engineering........................................................................ 5
3.2 DIM Program Administration ..........................................................................................6
3.3 How to Use this Plan........................................................................................................7
4.0 DEFINITIONS AND ACRONYMS .....................................................................................9
5.0 KNOWLEDGE OF FACILITIES ......................................................................................11
5.1 Policy & Procedures ......................................................................................................12
5.2 Overview of Past Design, Operating, Maintenance and Environmental Factors ..........15
5.2.1 Bare and Coated Steel Mains & Services ............................................................. 16
5.2.2 Cast Iron Mains .................................................................................................... 20
5.2.3 Plastic Pipe ........................................................................................................... 28
5.2.4 Copper Piping ....................................................................................................... 31
5.2.5 Instrumentation & Regulating Facilities .............................................................. 32
5.2.6 Construction Methods ........................................................................................... 34
5.2.7 Excess Flow Valves ............................................................................................... 34
5.2.8 Mechanical Fittings .............................................................................................. 35
5.3 Characteristics of Design, Operations and Environmental Factors ...............................35
5.3.1 Operating Pressures and Gas Quality .................................................................. 35
The Naragansett Electric Company d/b/a/ National Grid FY 2016 Gas ISR Risk Assessment Docket 4540 - Attachment 1-1 Page 4 of 122

Sept 01, 2015
iv
5.3.2 Reportable/Significant Gas Incidents ................................................................... 36
5.3.3 Gas Distribution Inventory and Repair Data ....................................................... 36
5.3.4 Environmental Factors ......................................................................................... 37
5.3.5 Gas Distribution Mains and Services Assets Analysis .......................................... 37
5.3.6 Gas Distribution Instrumentation & Regulation (I&R) Facilities Asset Analysis 39
5.4 Additional Data Needed .................................................................................................40
5.5 Data Capture for New Construction ..............................................................................43
5.6 Knowledge Capture – Subject Matter Experts ...............................................................43
6.0 THREAT IDENTIFICATION ...........................................................................................44
6.1 Means of Threat Identification .......................................................................................46
6.2 Monitoring Potential Threats .........................................................................................47
7.0 EVALUATION AND RANKING OF RISK .....................................................................49
7.1 Objective ........................................................................................................................49
7.2 Mains & Services ...........................................................................................................50
7.3 Instrumentation & Regulation........................................................................................53
8.0 IDENTIFICATION AND IMPLEMENTATION OF MEASURES TO ADDRESS RISKS............................................................................................................................................54
8.1 Corporate Culture Philosophy and Programs ................................................................54
8.2 Primary Threat Mitigation .............................................................................................62
9.0 MEASUREMENT OF PERFORMANCE, MONITORING RESULTS, AND EVALUATING EFFECTIVENESS ..........................................................................................63
9.1 Number of Hazardous Leaks either Eliminated or Repaired, per §192.703(c),
Categorized by Cause ................................................................................................................63
9.2 Number of Excavation Damages ...................................................................................63
9.3 Number of Excavation Tickets (received from the notification center) ........................64
9.4 Total Number of Leaks either Eliminated or Repaired, Categorized by Cause .............64
The Naragansett Electric Company d/b/a/ National Grid FY 2016 Gas ISR Risk Assessment Docket 4540 - Attachment 1-1 Page 5 of 122

Sept 01, 2015
v
9.5 Number of Hazardous Leaks Either Eliminated or Repaired, per §192.703(c),
Categorized by Material .............................................................................................................64
9.6 Additional Performance Measures .................................................................................64
10.0 PERIODIC EVALUATION AND IMPROVEMENT ....................................................65
10.1 Plan Updating and Documentation ................................................................................65
10.2 Effectiveness Review .....................................................................................................66
11.0 REPORTING RESULTS ...................................................................................................66
11.1 State & Federal Annual Reporting Requirements .........................................................66
12.0 DOCUMENT AND RECORD RETENTION ..................................................................67
APPENDICES FOR MASSACHUSETTS ..........................................................................MA-1
MASSACHUSETTS APPENDIX A – KNOWLEDGE OF FACILITIES .......................MA-2
MASSACHUSETTS APPENDIX B - THREAT IDENTIFICATIONMA-ERROR! BOOKMARK NOT DEF
MASSACHUSETTS APPENDIX C - EVALUATION AND RANKING OF RISKMA-ERROR! BOOKMA
MASSACHUSETTS APPENDIX D - IDENTIFICATION AND IMPLEMENTATION OF MEASURES TO ADDRESS RISKS ........... MA-ERROR! BOOKMARK NOT DEFINED.
MASSACHUSETTS APPENDIX E - MEASUREMENT OF PERFORMANCE, MONITORING RESULTS, AND EVALUATION EFFECTIVENESSMA-ERROR! BOOKMARK NOT DE
MASSACHUSETTS APPENDIX F - PERIODIC EVALUATION AND IMPROVEMENT…. ........................................... MA-ERROR! BOOKMARK NOT DEFINED.
MASSACHUSETTS APPENDIX G - CROSS REFERENCE OF 49 CFR PART 192, SUBPART P REQUIREMENTS TO THE DIM PLANMA-ERROR! BOOKMARK NOT DEFINED.
APPENDICES FOR NEW YORK ....................................................................................... NY-1
NEW YORK APPENDIX A – KNOWLEDGE OF FACILITIES .................................... NY-2
NEW YORK APPENDIX B - THREAT IDENTIFICATIONNY-ERROR! BOOKMARK NOT DEFINED.
NEW YORK APPENDIX C - EVALUATION AND RANKING OF RISKNY-ERROR! BOOKMARK NOT
NEW YORK APPENDIX D - IDENTIFICATION AND IMPLEMENTATION OF MEASURES TO ADDRESS RISKS ............ NY-ERROR! BOOKMARK NOT DEFINED.
The Naragansett Electric Company d/b/a/ National Grid FY 2016 Gas ISR Risk Assessment Docket 4540 - Attachment 1-1 Page 6 of 122

Sept 01, 2015
vi
NEW YORK APPENDIX E - MEASUREMENT OF PERFORMANCE, MONITORING RESULTS, AND EVALUATION EFFECTIVENESSNY-ERROR! BOOKMARK NOT DEFINED.
NEW YORK APPENDIX F - PERIODIC EVALUATION AND IMPROVEMENTNY-ERROR! BOOKMA
NEW YORK APPENDIX G - CROSS REFERENCE OF 49 CFR PART 192, SUBPART P REQUIREMENTS TO THE DIM PLANNY-ERROR! BOOKMARK NOT DEFINED.
APPENDICES FOR RHODE ISLAND ................................................................................. RI-1
RHODE ISLAND APPENDIX A – KNOWLEDGE OF FACILITIES ............................. RI-2
RHODE ISLAND APPENDIX B - THREAT IDENTIFICATION .................................... RI-7
RHODE ISLAND APPENDIX C - EVALUATION AND RANKING OF RISK ........... RI-19
RHODE ISLAND APPENDIX D - IDENTIFICATION AND IMPLEMENTATION OF MEASURES TO ADDRESS RISKS ............................................................................. RI-27
RHODE ISLAND APPENDIX E - MEASUREMENT OF PERFORMANCE, MONITORING RESULTS, AND EVALUATION EFFECTIVENESS .......................... RI-32
RHODE ISLAND APPENDIX F - PERIODIC EVALUATION AND IMPROVEMENT ................................................................................................................. .RI-42
RHODE ISLAND APPENDIX G - CROSS REFERENCE OF 49 CFR PART 192, SUBPART P REQUIREMENTS TO THE DIM PLAN .................................................... RI-45
The Naragansett Electric Company d/b/a/ National Grid FY 2016 Gas ISR Risk Assessment Docket 4540 - Attachment 1-1 Page 7 of 122

Sept 01, 2015 1 Section 1
1.0 COMPANY OVERVIEW
National Grid Corporation (“NGrid”) is one of the largest investor-owned utilities in the world
and is the largest distributor of natural gas in the Northeastern US, serving approximately 3.5
million customers in Massachusetts, New York and Rhode Island (See Figure 1-1).
Figure 1-1
At this time, NGrid makes annual reports to The U.S. Department of Transportation Pipeline and
Hazardous Materials Safety Administration (PHMSA) under the following Operator IDs:
Operator ID 4547 – Massachusetts (MA), Essex Operator ID 11856 – Massachusetts (MA), Colonial Lowell Operator ID 2066 – Massachusetts (MA), Colonial Cape Operator ID 1640 – Massachusetts (MA), Boston Operator ID 13480 – New York, Upstate (UNY) Operator ID 1800 – New York City (NYC) Operator ID 11713 – New York, Long Island (LI) Operator ID 13480 – Rhode Island (RI)
The Naragansett Electric Company d/b/a/ National Grid FY 2016 Gas ISR Risk Assessment Docket 4540 - Attachment 1-1 Page 8 of 122

Sept 01, 2015 2 Section 2
2.0 SCOPE
The U.S. Department of Transportation Pipeline and Hazardous Materials Safety Administration
(PHMSA) amended the Federal Pipeline Safety Regulations on December 4, 2009 to require
operators of gas distribution pipelines to develop and implement a distribution integrity
management (DIM) program that includes a written integrity management plan. NGrid’s written
integrity management plan will also comply with Code of Massachusetts Regulations 220 CMR
99 (Dig Safe Rules), 220 CMR 100.00 through 113.00 (Gas Distribution Code), New York
Code, Rules and Regulations 16 NYCRR§ 255 (Transmission and Distribution of Gas), and
Rhode Island Division of Public Utilities Rules and Regulations Prescribing Standards for Gas
Utilities, Master Meter Systems and Jurisdictional Propane Systems.
The purpose of the DIM program is to enhance safety by identifying and reducing gas
distribution pipeline integrity risks. Operators must integrate reasonably available information
about their pipelines to inform their risk decisions. The DIM approach was designed to promote
improvement in pipeline safety by identifying and implementing risk control measures beyond
those previously established in PHMSA regulatory requirements, when warranted.
This written DIM Plan addresses the DIM Rule which requires operators to develop and
implement a DIM program that addresses the following elements:
• Knowledge
• Identify Threats
• Evaluate and Rank Risks
• Identify and Implement Measures to Address Risks
• Measure Performance, Monitor Results, and Evaluate Effectiveness
• Periodic Evaluation and Improvement
• Report results
Because of the significant diversity among distribution pipeline operators and pipelines, the
requirements in the DIM Rule are high-level and performance-based. The DIM Rule specifies
the required program elements but does not prescribe specific methods of implementation.
The Naragansett Electric Company d/b/a/ National Grid FY 2016 Gas ISR Risk Assessment Docket 4540 - Attachment 1-1 Page 9 of 122

Sept 01, 2015 3 Section 2
This written Integrity Management Plan applies to gas distribution pipelines operated by NGrid
Corporation. Gas distribution pipelines include the mains, services, service regulators, customer
meters, valves, regulator stations, and other gas carrying appurtenance attached to the pipe. This
Integrity Management Plan also applies to transmission pipelines that are not covered by the
NGrid Transmission Integrity Management Program (IMP). Figure 2-1 below summarizes
which NGrid piping systems (mains) are covered by the Transmission Integrity Management
Program and which are covered by the DIM program.
Pipeline System
Approximate Miles of Mains as of
2014 PHMSA Report*
Asset Family
Integrity Program
Pipeline Attributes
NGrid Managemen
t Plans
Covered DOT Transmission
290 miles Transmission IMP = or >20% SMYS
and in HCA
Assessment, Preventive &
Mitigative Measures
Non Covered DOT
Transmission** 195 miles Transmission DIMP
= or >20% SMYS and NOT in HCA
Preventive, Mitigative & Performance
Measures Local
Transmission (Distribution per §192.3)
493 miles Transmission DIMP <20% SMYS >124 psi NYS > 200 psi NE
Preventive, Mitigative & Performance
Measures
Distribution About 35,000 miles
Distribution DIMP < or = 124 psi
NYS < or = 200 psi NE
Preventive, Mitigative & Performance
Measures * Provided for illustrative purposes, see Annual PHMSA Report for current mileage.
** Managed as Local Transmission under DIMP.
Figure 2-1
This Plan also acknowledges NGrid’s responsibilities relative to Oxbow Farm’s master meter
system in Middletown, RI in accordance with its Agreement with RI on Oxbow Farms
Apartments (Docket# D-06-54). NGrid recognizes its ownership, operation and maintenance of
the natural gas pipelines downstream of the Oxbow Farms master meter system. This includes
performing walking leak survey on a 3 year cycle and the cathodic protection of steel facilities.
The Naragansett Electric Company d/b/a/ National Grid FY 2016 Gas ISR Risk Assessment Docket 4540 - Attachment 1-1 Page 10 of 122

Sept 01, 2015 4 Section 3
All piping was included in its respective asset category for threat identification, risk ranking, risk
mitigation, and all other requirements as identified in 49CFR, Part 192.1015.
This plan does not cover:
Customer owned lines – piping downstream of the service line (as defined in Section 4.0).
Gathering lines –NGrid does not currently own or operate gas gathering lines.
Transmission lines covered under the NGrid IMP
Liquefied Natural Gas (LNG) Plant Facilities – the pipe, vessels, tanks, valves and
appurtenances used in liquefied natural gas peak shaving facilities are designed, constructed,
operated and maintained in accordance with the requirements established in 49CFR, Part 193.
3.0 PURPOSE AND OBJECTIVES
The purpose of the DIM program is to enhance safety by identifying and reducing gas
distribution pipeline integrity risks. Managing the integrity and reliability of the gas distribution
pipeline has always been a primary goal for NGrid; with design, construction, operations and
maintenance activities performed in compliance with or exceeding the requirements of the Code
of Federal Regulations (CFR) and as well as the following where applicable: Code of
Massachusetts Regulations 220 CMR 99 and 100.00 through 113.00, New York Code, Rules and
Regulations 16 NYCRR§ 255 (Transmission and Distribution of Gas), and Rhode Island
Division of Public Utilities Rules and Regulations Prescribing Standards for Gas Utilities,
Master Meter Systems and Jurisdictional Propane Systems.
The objective of this DIM Plan is to establish the requirements to comply with 49CFR §
192.1005, 192.1007, 192.1009, 192.1011, and 192.1013 (and 192.1015 for the master meter
system in Middletown, RI) pertaining to integrity management for gas distribution pipelines.
NGrid does not currently propose to reduce the frequency of periodic inspections and tests as
allowed by 192.1013, but may submit such proposals for consideration and concurrence by
regulators in the future.
The Naragansett Electric Company d/b/a/ National Grid FY 2016 Gas ISR Risk Assessment Docket 4540 - Attachment 1-1 Page 11 of 122

Sept 01, 2015 5 Section 3
The DIM Plan is comprised of seven elements depicted in Figure 3-1 (DIM Plan Section
reference also provided).
Figure 3-1 DIM Plan Elements
In addition to the key elements shown in Figure 3-1, the DIM Plan also establishes requirements
for reporting of mechanical fitting failures (Section 11.2) and maintaining records (Section 12).
All elements of this DIM Plan shall be implemented by no later than August 2, 2011.
3.1 Company Roles
The purpose of this section is to describe key roles within the organization.
3.1.1 Vice President, Gas Asset Management
The Vice President of Gas Asset Management has overall responsibility to assure that the DIM
Plan processes are implemented by the organization in accordance with this DIM Plan and
associated regulatory requirements. The Vice President of Gas Asset Management may delegate,
in writing, some or all of these responsibilities to others within the organization.
3.1.2 Manager, Distribution Engineering
The Manager of Distribution Engineering has the responsibility for day-to-day program
oversight, integrity policy, facility replacement priorities, and responsibility to assure that the
plan is implemented effectively and is integrated with the Company’s operating procedures.
This Plan assigns authority to the Manager of Distribution Engineering for approval of the DIM
The Naragansett Electric Company d/b/a/ National Grid FY 2016 Gas ISR Risk Assessment Docket 4540 - Attachment 1-1 Page 12 of 122

Sept 01, 2015 6 Section 3
Plans. The Manager of Distribution Engineering may delegate some or all of these
responsibilities.
3.2 DIM Program Administration
Table 3-1 provides an overview of the actions that may be necessary to administer the DIM
Program.
The Naragansett Electric Company d/b/a/ National Grid FY 2016 Gas ISR Risk Assessment Docket 4540 - Attachment 1-1 Page 13 of 122

Sept 01, 2015 7 Section 3
Table 3-1: DIM Program Administration
Plan Section Role / Responsibility Responsible Position *
3.1 Overall Program Implementation and Oversight Vice President, Gas Asset Management
5.1, 5.2, 5.3 Appendix A
Updates to Appendix A Manager, Distribution
Engineering
5.4 Update Action Plans for Gaining Additional Knowledge Manager, Distribution
Engineering
5.6, Appendix A Appendix B
Conduct and Record SME Interviews as necessary for input into Appendix A (Knowledge) and Appendix B (Threat Identification)
Manager, Distribution Engineering
6.0, 6.1, Appendix B
Update Threat Identification (Appendix B) as new or modified threats are known or recognized
Manager, Distribution Engineering
7.1 Update the Risk Assessment and Ranking process and/or algorithms
Manager, Distribution Engineering
Appendix C Perform and document updates to the Risk Assessment & Ranking Results.
Manager, Distribution Engineering
8.1, 8.2, Appendix D
Ongoing updates to Mitigation Measures to Address Risks Manager, Distribution
Engineering
9.1 thru 9.6, Appendix E
Maintain Performance Measures (updates to actual performance as well as the associated baselines)
Manager, Distribution Engineering
10.1, Appendix F
Periodic Updates to the Plan Manager, Distribution
Engineering 10.2,
Appendix F Conduct and document the Annual Effectiveness Review
Manager, Distribution Engineering
10.1, Appendix F
Conduct the Program Re-evaluation Manager, Distribution
Engineering
11.1 Prepare and submit the annual report to PHMSA and the State Pipeline Safety Authority
Manager, Distribution Engineering
12.0 Maintain DIM Program Records and Files as required by Retention Policy
Manager, Distribution Engineering
* or designee
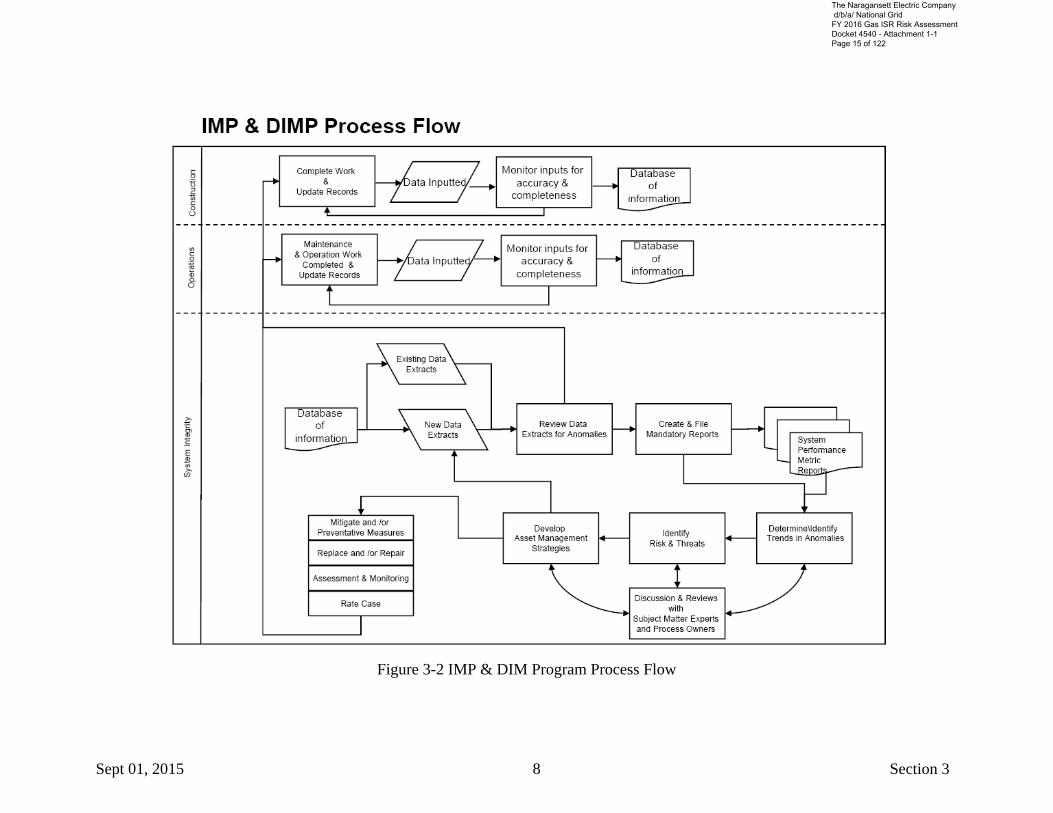
3.3 How to Use this Plan
This DIM Plan is intended to be a resource and decision making guide for implementing the
DIM Program at NGrid. The 12-section general Plan applies to all NGrid jurisdictions. There is
also a state-specific Appendix for each of the three states in which NGrid operates. The general
IMP and DIM Program workflow is outlined in Figure 3-2.
The Naragansett Electric Company d/b/a/ National Grid FY 2016 Gas ISR Risk Assessment Docket 4540 - Attachment 1-1 Page 14 of 122
Sept 01, 2015 8 Section 3
Figure 3-2 IMP & DIM Program Process Flow
The Naragansett Electric Company d/b/a/ National Grid FY 2016 Gas ISR Risk Assessment Docket 4540 - Attachment 1-1 Page 15 of 122

Sept 01, 2015 9 Section 4
4.0 DEFINITIONS AND ACRONYMS
The definitions provided in 49 CFR, §192.3 and §192.1001 shall apply to this DIM Plan. The
following definitions and acronyms shall apply to this DIM Plan.
Baseline: A value established for the purposes of evaluating the ongoing results of a
performance measure. Baselines are established as a matter of judgment and can change and
evolve over time.
COF: Consequence of Failure
D.I.R.T.: Damage Information Reporting Tool – a secure, national web application for the
collection, analysis and reporting of underground facility damage information for all
stakeholders. More information on D.I.R.T. may be found at the Common Ground Alliance’s
(CGA’s) website at www.cga-dirt.com.
Distribution Integrity Management Plan (DIM Plan): a written explanation of the
mechanisms or procedures the operator will use to implement its integrity management program
and to ensure compliance with subpart P of 49 CFR Part 192 (reference §192.1001)
Distribution Integrity Management Program (DIM Program): an overall approach used by
an operator to ensure the integrity of its gas distribution system (reference §192.1001)
Distribution Integrity Management Program Files: Operator records, databases, and/or files
that contain either material incorporated by reference in the Appendices of the DIM Plan or
outdated material that was once contained in the DIM Plan Appendices but is being retained in
order to comply with record keeping requirements.
DIM Rule: 49 CFR, Part 192, Subpart P
Distribution Line: a pipeline other than a gathering or transmission line (reference §192.3)
EFV: Excess Flow Valve. An Excess Flow Valve is a safety device that is designed to shut off
flow of natural gas automatically if the service line breaks
Excavation damage: a physical impact that results in the need to repair or replace an
underground facility due to a weakening, or the partial or complete destruction of the facility
The Naragansett Electric Company d/b/a/ National Grid FY 2016 Gas ISR Risk Assessment Docket 4540 - Attachment 1-1 Page 16 of 122

Sept 01, 2015 10 Section 4
including, but not limited to, the protective coating, lateral support, cathodic protection, or the
housing for the line device or facility (reference §192.1001)
Hazardous Leak: a leak that represents an existing or probable hazard to persons or property,
and requires immediate repair or continuous action until the conditions are no longer hazardous
(reference §192.1001)
HDPE: High Density Polyethylene
FOF: Frequency of Failure; synonymous with Likelihood of Failure
Integrity Management Program (IMP): A program used to manage gas transmission pipeline
integrity in compliance with Subpart O of 49CFR, Part 192.
Main: a distribution line that serves as a common source of supply for more than one service line
(reference §192.3)
MDPE: Medium Density Polyethylene
Mechanical fitting – As defined in the instructions for completing Form PHMSA F7100.1-1;
includes Stab Type Mechanical Fittings, Nut Follower Type Mechanical Fittings, Bolted Type
Mechanical Fittings and other types as may be specified by PHMSA.
NTSB: The National Transportation Safety Board
PHMSA: The U.S. Department of Transportation Pipeline and Hazardous Materials Safety
Administration
Pipeline: all parts of those physical facilities through which gas moves in transportation,
including pipe, valves, and other appurtenances attached to pipe, compressor units, metering
stations, regulator stations, delivery stations, holders, and fabricated assemblies (reference
§192.3)
Region: areas within a distribution system consisting of mains, services, and other appurtenances
with similar characteristics and reasonably consistent risk. The term Region may also apply to a
geographic area within the operator’s system.
Risk: a relative measure of the likelihood of a failure associated with a threat and the potential
consequences of such a failure
The Naragansett Electric Company d/b/a/ National Grid FY 2016 Gas ISR Risk Assessment Docket 4540 - Attachment 1-1 Page 17 of 122

Sept 01, 2015 11 Section 5
Risk Model: the integration of facility data, operational data, SME input, and established
algorithms to estimate the relative risk associated with a gas distribution system threat
Service Line: a distribution line that transports gas, or is designed to transport gas, from a
common source of supply to an individual customer, to two adjacent or adjoining residential or
small commercial customers, or to multiple residential or small commercial customers served
through a meter header or manifold. A service line ends at the outlet of the customer meter or at
the connection to a customer’s piping, whichever is furthest downstream, or at the connection to
customer piping if there is no meter. In New York State, under 16 NYCRR § 255.3, a service
line ends at the first accessible fitting inside a wall of the customer's building where a meter is
located within the building, or at the building wall if the meter is located outside the building.
SME: Subject Matter Expert. An SME is an individual who is judged by the operator to have
specialized knowledge based on their expertise or training.
Sub-Threat: a threat type within one of the primary threat categories specified in §192.1007(b)
Ticket: a notification from the one-call notification center to the operator providing information
of pending excavation activity for which the operator is to locate and mark its facilities
5.0 KNOWLEDGE OF FACILITIES
The objective of this section is to assemble and demonstrate as complete of an understanding of
the company’s infrastructure as possible using reasonably available information from past and
ongoing design, operations and maintenance activities. In addition, this plan identifies what
additional information is being sought for the program and provides a plan for gaining that
information over time through normal activities.
NGrid has a long history of systematically managing its distribution systems. The Company
actively participates in committees of the American Gas Association (AGA), the Northeast Gas
Association (NGA), the American Society of Mechanical Engineers (ASME), and the National
Association of Corrosion Engineers (NACE).
The Naragansett Electric Company d/b/a/ National Grid FY 2016 Gas ISR Risk Assessment Docket 4540 - Attachment 1-1 Page 18 of 122

Sept 01, 2015 12 Section 5
The NGrid Distribution Engineering Department is responsible for the development and
implementation of Integrity Management Programs for Gas Distribution facilities and pipelines.
Data analysis is an important component of Integrity Management. The department compiles and
analyzes system and operating data, files annual reports to the Department of Transportation
(DOT) and State regulators, generates periodic bulletins, and prepares various Integrity Reports
and Analyses. System performance, analysis, risk, threats, asset management, replacement
strategies and rate case support are all performed. These engineering and operational activities
require knowledge of the system inventory, age, and annual performance, as well as performance
trends over time.
5.1 Policy & Procedures
NGrid has a number of existing policies and procedures that are related to integrity management
and asset management of its gas distribution system. Table 5.1 below has been prepared to
summarize which procedures exist to cover the elements as outlined in §192.1007. Procedures
that are local to specific regions or are pending will be developed into enterprise wide documents
over time.
For example: NGrid follows the nine (9) elements contained within the published PHMSA
Damage Prevention Assistance Program (DPAP). The Company has been actively involved in
mark outs and damage prevention for over 25 years and these processes are covered under
numerous legacy operating procedures and test instructions. Mark out and damage prevention
statistics are tracked and the company expects to develop a single enterprise wide policy
document to include all the data elements required under the rule.
Section 10, Periodic Evaluation and Improvement, will identify any areas, policy or procedures
that will require changes to comply with the rule or to improve the process over time.
The Naragansett Electric Company d/b/a/ National Grid FY 2016 Gas ISR Risk Assessment Docket 4540 - Attachment 1-1 Page 19 of 122

Sept 01, 2015 13 Section 5
Table 5-1: Policy Documents Related to Integrity Management for Distribution
Category 192.1007 Procedure Procedure Title Element
Asset Information Elements A1 NA Miscellaneous Legacy Records Demonstrating
Knowledge
Asset Information Elements A1
& A5 NA Miscellaneous Legacy Records
Demonstrating Knowledge
Annual SI Gas Distribution Report
Elements A1, A2, A4, B, C,
& F NA Miscellaneous Legacy Records
Demonstrating Knowledge,
Identified Threats & Periodic Evaluation
Improving Knowledge
Element A3 NA IM Plan Identify
Additional information
Asset Information Elements A1
& A5 GEN03002
Processing Gas Main Work Packages
Demonstrating Knowledge
Asset Information Elements A1
& A5 CNST06020
Completion and Processing of Gas Service Record Cards
Demonstrating Knowledge
Asset Information Elements A1
& A5 CNST01005
Preparation of Gas Facility Historical Records
Demonstrating Knowledge
Risk Scoring Procedure
Element C GEN 01002 Risk Scoring Procedure Ranking Risk
Annual DOT Reports
Element B & G
GEN 01020
Preparation and Filing of the DOT Annual Report for the
Gas Transmission and Distribution Systems
Identify Threats & Reporting Results
Problematic Materials
Elements A & B
GEN 01009 Reporting Non-Conforming
Materials
Demonstrating Knowledge &
Identifying Threats
Damage Prevention Policy
Element D DAM01011 Damage Prevention Policy Mitigate Risk
System Operation Procedures
Element D GCON02001 System Operating Procedure
(SOP) Mitigate Risk
Welding Policy Element D CNST05002 Welding Policy Mitigate Risk
Operator Qualification Plan
Element D GEN01100 Operator Qualification Plan Mitigate Risk
Asset Information Elements A1, A2, A3 & A5
ENG01001 Design of Gas Regulator
Stations Mitigate Risk
Corrosion Design Criteria
Element D COR01100 Corrosion Design Criteria Mitigate Risk
Leakage Survey Element D CNST02001 Leakage Survey Policy Mitigate Risk
Leakage Survey Element D CNST02002 Leakage Surveys Mitigate Risk
Leakage Survey Element D CNST 02003 Building of Public Assembly Inspections/Leakage Surveys
Mitigate Risk
The Naragansett Electric Company d/b/a/ National Grid FY 2016 Gas ISR Risk Assessment Docket 4540 - Attachment 1-1 Page 20 of 122

Sept 01, 2015 14 Section 5
Category 192.1007 Procedure Procedure Title Element
Special Winter Operations
Element D CNST 02004 Winter Leak Operations Mitigate Risk
Corrosion Control Element D COR 02100 Corrosion Inspection, Testing
and Repair Mitigate Risk
Atmospheric Corrosion
Inspections Element D COR 02010
Atmospheric Corrosion Inspection of Services
Mitigate Risk
Corrosion Control Element D COR 03002 Measuring Pipe-To-Soil
Potential Mitigate Risk
Valve Inspection Policy
Element D CNST 04009 Valve Inspection Policy Mitigate Risk
Classifying Gas Leaks
Element D CNST 02009 Classifying Gas Leaks Evaluating Risk
Eliminating Gas Leaks
Element D CNST 02010 Leak Response and Repair Mitigate Risk
Surveillance of Gas Leaks
Element D CNST 02011 Surveillance of Classified
Leaks Mitigate Risk
First Responder Element D CNST02013 First Responder Evaluating Risk
Odorization Monitoring
Element D INR 06001 Odorization Monitoring and
Control Mitigate Risk
Regulator Station Inspection
Element D INR 03001 Regulator Station Monthly
Inspection Policy Mitigate Risk
Regulator Station Inspection
Element D INR 03003 Regulator Station Annual
Inspection Policy - NE Mitigate Risk
Asset Management Strategy
Element D ENG04030
Identification, Evaluation and Prioritization of Distribution
Main Segments for Replacement
Mitigate Risk
Survey & Inspection
Element D CNST 02005 Patrolling Transmission
Pipelines Mitigate Risk
Asset Management Strategy
Element D CNST06001 Inactive Gas Services – all
areas Mitigate Risk
Asset Management Strategy
Element D CNST 06005 Inspection and Abandonment of Inactive Services – all areas
Mitigate Risk
Regulators Element D ENG02001 Farm Taps Mitigate Risk
Purging Operations Element D CNST03006 Direct Displacement Mitigate Risk
Purging Operations Element D CNST03007 Complete Inert Gas Fill Mitigate Risk
Purging Operations Element D CNST03008 Slug Method Mitigate Risk
Cast Iron Management
Element D
DAM01007-UNY-LI
Cast Iron Encroachment Policy Mitigate Risk
Cast Iron Management
Element D DAM01008-
MA-RI Cast Iron Encroachment Policy Mitigate Risk
The Naragansett Electric Company d/b/a/ National Grid FY 2016 Gas ISR Risk Assessment Docket 4540 - Attachment 1-1 Page 21 of 122

Sept 01, 2015 15 Section 5
Category 192.1007 Procedure Procedure Title Element
Cast Iron Management
Element D DAM01009-
NYC Cast Iron Encroachment Policy Mitigate Risk
These documents are subject to revision or replacement at any time. It is not practical to issue
DIM Plan revisions for every policy/procedure change or update. Table 5-1 will be updated
whenever a full Plan revision occurs. See current documents available on the Standards and
Policies Gas Procedures intranet site for the most current information. Some procedures may not
have been in effect in all NGrid regions at the time of this publication. In those cases, the
enterprise-wide procedure(s) should list any currently active state-specific policies and the
date(s) that the enterprise-wide procedure(s) are expected to take effect. Also, during the
transition to enterprise-wide procedures, some aspects of the Rhode Island Operations and
Maintenance Manual (including specifications and procedures for Construction and Maintenance
(CM documents) and Customer Field Services (CFS documents)) will continue to be in effect.
5.2 Overview of Past Design, Operating, Maintenance and Environmental Factors
NGrid owns and operates approximately 35,000 miles of cast iron, steel (non IMP Transmission)
and plastic distribution mains at various pressures from low to high throughout its service
territory, as well as the associated services, connection equipment, instrumentation and
regulation, and other appurtenances. The Company has sought and obtained regulatory approval
to upgrade, replace and maintain the distribution systems needed to reduce risk and to address
threats to its system and the customers it serves. Since annual system performance statistics can
easily vary due to external conditions (e.g. weather), programs and plans must be based on the
performance of the system over time. Identifying trends and evaluating data requires an
understanding of the science of past designs, operating and maintenance histories. NGrid’s
knowledge of its gas distribution system is supported by the Company’s gas industry experience
and data.
NGrid separates its gas distribution system into two primary asset classes; Mains & Services
which includes associated connection equipment, and Instrumentation & Regulation. NGrid also
divides assets into sub-classes (regions) which include distinctions by factors such as material,
size, vintage, pressure, construction method, and location.
The Naragansett Electric Company d/b/a/ National Grid FY 2016 Gas ISR Risk Assessment Docket 4540 - Attachment 1-1 Page 22 of 122

Sept 01, 2015 16 Section 5
5.2.1 Bare and Coated Steel Mains & Services
The modes and mechanisms of failure associated with bare-steel corrosion are well understood
by corrosion experts and documented in a number of texts on the topic. It is a known fact that
non-cathodically protected bare steel pipe, buried in the earth where there is moisture in the soil
and without cathodic protection, will corrode over time. This corrosion may occur over the
entire surface of the pipe and it may take many years before the first corrosion leak occurs.
However, once the first leak on a pipeline segment occurs, there are other points on the pipe
where the pipe is losing metal and where corrosion pits are becoming deeper. As the corrosion
pitting continues and the pipes continue to lose metal, these pipes will increasingly experience
additional leaks. Eventually many additional points of corrosion may result in an unmanageable
leak rate.
The deterioration mentioned above is a function of time in the ground and is also influenced by
the particular environment. This fact is evidenced by the fact that the USDOT has not allowed
the installation of unprotected or bare steel for gas service since 1971. Furthermore, an early
scientific reference regarding the failure rate of buried steel pipe was given in the book “Soil
Corrosion and Pipe Line Protection” by Scott Ewing Ph.D., published in 1938. In the text, the
performance of the service pipes in the Philadelphia Gas Works System was plotted and showed
that corrosion leak occurrences over time on bare steel pipe increased at an exponential rate.
This graph is shown below in Figure 5-1. When this text was written the natural gas industry
was still in its infancy and high performance materials such as plastic and well-coated and
cathodically protected steel were not available or well understood.
The Naragansett Electric Company d/b/a/ National Grid FY 2016 Gas ISR Risk Assessment Docket 4540 - Attachment 1-1 Page 23 of 122

Sept 01, 2015 17 Section 5
Figure 5-1 - Chart from 1938 text showing exponential leak rates for bare steel pipe in gas service
This very same finding is corroborated today in more modern texts. One such text that is
considered by many to be a foundational book for the study of corrosion is: “Peabody’s Control
of Pipeline Corrosion” by A.W. Peabody, published by the National Association of Corrosion
Engineers International, the Corrosion Society (Second Edition 2001). This text, published more
than 60 years after the Ewing text, reaffirms the fact that leak incidents on unprotected bare pipe
will occur at an exponentially increasing rate. In the Peabody text, this is shown as an example
plotted on semi log paper. A copy of the graph used to describe this in the Peabody text (Figure
15.1 in Peabody) is shown in Figure 5-2 below.
The Naragansett Electric Company d/b/a/ National Grid FY 2016 Gas ISR Risk Assessment Docket 4540 - Attachment 1-1 Page 24 of 122

Sept 01, 2015 18 Section 5
Figure 5-2 - Chart from 2001 text showing exponential leak rates for bare-steel pipe in gas service.
As shown on this graph, no leakage occurs during the initial life of the pipe (first leak occurred 4
years after placing the piping in service). Then, in the next 4 years, 1.5 new leaks occurred.
Then, in the next 4 years, 4.5 new leaks occurred. Then, in the next 4 years, 11 new leaks
occurred. This accelerating occurrence of leaks continues at a rate that places the cumulative
leak count off the scale, past the 23rd year, with more than 100 cumulative leaks occurring.
What is important to note is not that the leaks are occurring, but that they are occurring at an ever
increasing frequency as a function of time (once the corrosion process has reached the point to
produce the initial leak). Although NGrid’s inventory of main and services contains many pipes
that have exceeded the 23 years noted, not all of these pipes have begun to leak at the same
initial time.
The Naragansett Electric Company d/b/a/ National Grid FY 2016 Gas ISR Risk Assessment Docket 4540 - Attachment 1-1 Page 25 of 122

Sept 01, 2015 19 Section 5
This exponential growth of leak occurrences on bare-steel pipe is scientifically documented as
indicated in the text above. This exponential growth of leak occurrences on bare steel pipe is
also well known by experienced gas system operators who perform bare-steel repairs and find
themselves installing multiple leak repair sleeves on sections of corroding pipe.
This ever increasing frequency of leak incidents is evident based on the corrosion mechanisms.
Bare steel pipe is undergoing continuous deterioration by corrosion. In some locations, the
deterioration is more aggressive than in other locations. In many cases, although the wall
thickness is penetrated at only a single point, it can be seen that the entire pipe may have been
degraded to the point where future leaks will occur at an ever increasing rate. This is visually
obvious by viewing the piece of corroded pipe shown from the USDOT website in Figure 5-3.
In this picture, there may be only a few points of actual leakage, but the pipe shows apparent
signs of distress along the entire wall thickness.
Figure 5-3 - Illustration from U.S. Department of Transportation Website1
Wrought iron pipes, while less brittle than cast-iron mains and service lines, are subject to
corrosion. The corrosion of wrought iron is similar to bare steel in its exponential leak rate
growth.
1 http://www.phmsa.dot.gov/staticfiles/PHMSA/DownloadableFiles/Files/3%20-%20Guidance%20Manual%20for%20Operators%20of%20Small%20Natural%20Gas%20Systems-2002.pdf
The Naragansett Electric Company d/b/a/ National Grid FY 2016 Gas ISR Risk Assessment Docket 4540 - Attachment 1-1 Page 26 of 122
Sept 01, 2015 20 Section 5
Coated steel mains and services, when cathodically protected against corrosion, are an excellent
and well-performing gas distribution material. They resist corrosion and have significantly
higher strength than plastic. All underground steel pipe installed after July 31, 1971 is required
by federal code (per 49 CFR 192, Subpart I) to be coated and cathodically protected and is
regularly tested to ensure an adequate level of protection and compliance. In many cases, steel
pipe installed before 1971 is also coated, cathodically protected, and regularly tested. However,
coated steel mains and services that are unprotected can undergo accelerated corrosion if the
coating is breached – either by damage or disbonding. Such mains are currently viewed by
NGrid as not protectable and are considered to be ineffectively coated and subject to the same
risks as bare unprotected steel.
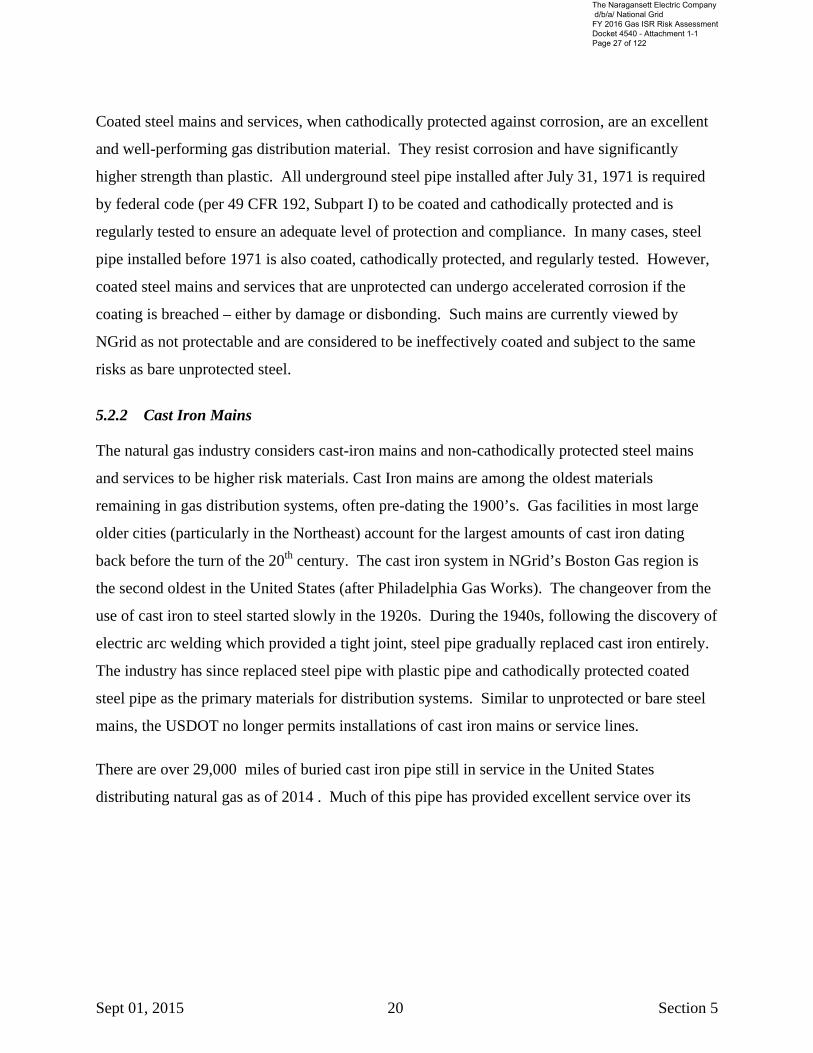
5.2.2 Cast Iron Mains
The natural gas industry considers cast-iron mains and non-cathodically protected steel mains
and services to be higher risk materials. Cast Iron mains are among the oldest materials
remaining in gas distribution systems, often pre-dating the 1900’s. Gas facilities in most large
older cities (particularly in the Northeast) account for the largest amounts of cast iron dating
back before the turn of the 20th century. The cast iron system in NGrid’s Boston Gas region is
the second oldest in the United States (after Philadelphia Gas Works). The changeover from the
use of cast iron to steel started slowly in the 1920s. During the 1940s, following the discovery of
electric arc welding which provided a tight joint, steel pipe gradually replaced cast iron entirely.
The industry has since replaced steel pipe with plastic pipe and cathodically protected coated
steel pipe as the primary materials for distribution systems. Similar to unprotected or bare steel
mains, the USDOT no longer permits installations of cast iron mains or service lines.
There are over 29,000 miles of buried cast iron pipe still in service in the United States
distributing natural gas as of 2014 . Much of this pipe has provided excellent service over its
The Naragansett Electric Company d/b/a/ National Grid FY 2016 Gas ISR Risk Assessment Docket 4540 - Attachment 1-1 Page 27 of 122

Sept 01, 2015 21 Section 5
life. However, aging cast-iron mains have experienced gradual deterioration and are susceptible2
to breaks, cracks, and other failures such as joint leaks.
As the owner and operator of nearly 20 percent of all the cast iron distribution main in the United
States, NGrid has unparalleled experience in dealing with cast iron mains in a safe and reliable
manner. Extensive research has been done throughout the years by NGrid’s legacy companies
and NGrid’s cast iron replacement programs have been carefully designed to continue cost-
effective operation in the safest and most reliable way possible.
In 2013, National Grid also participated in the development of an AGA white paper to Congress
entitled “Managing the Reduction of the Nation’s Cast Iron Inventory”, which is incorporated
here by reference.
Experience from companies3 that operate greater mileage of cast iron has identified certain
parameters associated with higher leak and failure rates. Many of these parameters are useful to
evaluate in identifying pipe segments more prone to failure. The predominant among these are:
• Pipe graphitization history
• Manufacture and original wall thicknesses, sometimes associated with vintage pipe
diameter size and flexural resistance
• Loading and stresses associated with:
o Operating pressures
o Weather induced loads such as depth of winter frost penetration and frost action
o Traffic loads
o Construction impacts
o Block supports
2 Other environmental effects, including methods used to support the pipe, frost, and vehicle loads that impose additional stress on the pipe, thus further reducing its useful life, exacerbate the deterioration caused by graphitization. 3 A number of studies of cast-iron and factors affecting their service life have been made. A number of these studies and evaluations were made by ZEI, Inc. (formerly Zinder Eng Inc) Ann Arbor Michigan, including articles written; see Gas Industries, February 1986. The Department referred to this report in its February 28, 1991 Order concerning its investigation into proposed rules for cast iron.
The Naragansett Electric Company d/b/a/ National Grid FY 2016 Gas ISR Risk Assessment Docket 4540 - Attachment 1-1 Page 28 of 122
Sept 01, 2015 22 Section 5
o Settlement
o Undermining
o Washouts
o Direct impact
Under research contracts with Cornell University that started in the early 1980’s, the former
Brooklyn Union (now part of NGrid) and other NY Gas Group companies sponsored research
that has developed a library of technical papers on CI main condition, performance and
evaluation. NGrid’s Cast Iron related policies are informed by those studies, the most recent of
which was prepared in 2008. NGrid’s New York City Cast Iron system (the former Brooklyn
Union Gas - which accounts for nearly 30% of all the Cast Iron in NGrid) dates from before
1895 through approximately 1950. After approximately 1930, centrifugally cast pipe
predominates over pit-cast cast iron. Pit cast pipe was less uniform than later pipe, though out-of-
spec wall thickness is rare. French cast iron piping of approximately WWI vintage has been
reported to be overly brittle. Centrifugally cast pipe is theoretically more prone to stress crack
corrosion according to UK studies, but that has not been recognized on the New York City
system.
5.2.2.1 Cast Iron Graphitization
NACE4, in its Introduction to Corrosion Basics, 1984, pg. 216, states that the corrosion rate of
cast iron is comparable to that of steel in a soil. The iron is removed from the metal, leaving a
network of carbon particles by the de-alloying phenomenon termed graphitization. The residual
carbon retains the form of the pipe, and unless the weakened pipe is fractured, the graphitized
pipe will continue to transport gas. Once the cast-iron is graphitized, the exterior becomes an
extremely noble electrode in any galvanic couple. Thus uncoated or unprotected cast-iron or
steel will act as the anode in contact with this “noble” pipe.
4 National Association of Corrosion Engineers.
The Naragansett Electric Company d/b/a/ National Grid FY 2016 Gas ISR Risk Assessment Docket 4540 - Attachment 1-1 Page 29 of 122

Sept 01, 2015 23 Section 5
It should be noted that graphitization is still relatively infrequent within NGrid and only included
here to demonstrate the Company’s knowledge base. Experience shows that the soils in New
York City and Long Island are the most benign with respect to graphitization. Upstate and New
England soils appear to be somewhat more aggressive, though there does not appear to be much
of a difference in the resulting frequency of graphitization.
Graphitization occurs when cast iron is exposed to certain types of corrosive environments over
time. The resultant graphitization causes the beam strength to weaken and the pipe to become
brittle and contributes to rates of broken mains. In its 1971-72 study of cast iron, the New York
Gas Operations Advisory Committee report stated that its experience indicated graphitization
was limited to certain specific localized environments. These were areas where there were
localized salt water exposures or extreme stray current discharges (such as at substations and
electrified rail transit systems).
Cast iron contains carbon, in the form of graphite, in its molecular structure. It is composed of a
crystalline structure as are all metals (i.e., it is a heterogeneous mass of crystals of its major
elements iron, manganese, carbon, sulfur and silicon). In the presence of acid rain and/or
seawater, the stable graphite crystals remain in place, but the less stable iron becomes converted
to insoluble iron oxide (rust). The result is that the cast iron piece retains its shape and
appearance but becomes weaker mechanically because of the loss of iron.
Graphitization is not a common problem. It generally will occur only after bare metal is left
exposed for extended periods, or where joints allow the penetration of acidic rainwater to
internal surfaces. Therefore there is a time dependency for graphitization to occur, and
excluding other factors, the expectation would be that older pipes will have experienced deeper
graphitic penetration and disintegration. Soil moisture is normally enough to provide a
conducting solution. This corrosion process is galvanic, with the carbon present acting as the
noblest (least corrosive) element and the iron acting as the least noble (most corrosive) element.
The composition or microstructure of the iron affects the durability of the object because the rate
of corrosion is dependent upon the amount and structure of the graphite present in the iron.
The Naragansett Electric Company d/b/a/ National Grid FY 2016 Gas ISR Risk Assessment Docket 4540 - Attachment 1-1 Page 30 of 122

Sept 01, 2015 24 Section 5
Graphitic corrosion or graphitization5 is a form of de-alloying or parting caused by selective
dissolution of iron from cast iron (usually gray cast iron). It proceeds uniformly inward from the
surface, leaving a porous matrix of the remaining alloying element, carbon. Graphitization
occurs in salt water, acidic mine water, dilute acids, and soils, especially those containing
sulfates and sulfate reducing bacteria. There is no outward appearance of damage, but the
affected metal loses weight, and becomes porous and brittle. The porous residue may retain
appreciable tensile strength and have moderate resistance to erosion. For example, a completely
buried cast-iron pipe may hold gas under pressure until jarred by a worker’s shovel. Sulfates and
sulfate-reducing bacteria in soil stimulate this form of attack.
5.2.2.2 Cast Iron Pipe Support
A number of methods were used to install cast iron pipe sections. The most common method
involved support of individual lengths of pipe with wooden or concrete blocks near each end.
The blocks served to both support the main during construction and slope the pipe for proper
drainage of manufactured gas liquids. Some installations included support near the center,
placing pipe on mounds of earth instead of blocks, and still others directly on the trench bottom.
Placing pipe on the trench bottom actually provides the greatest life expectancy as it minimized
unsupported lengths of pipe, increased ability to withstand superimposed loads, and reduced
beam action. Installation on wooden blocks has been seen to cause increased instances of
graphitization at the point of contact between the cast iron and wood. There are no records
indicating the method of installation; though at times, it can be inferred from the condition of the
pipe. Block supports may also be detrimental when they cause pipe sections to behave as beams.
All of these factors result in regionally higher break rates, which are used for identifying system
replacement.
5 NACE defines graphitic corrosion in its Introduction to Corrosion Basics 1984, at page 107.
The Naragansett Electric Company d/b/a/ National Grid FY 2016 Gas ISR Risk Assessment Docket 4540 - Attachment 1-1 Page 31 of 122

Sept 01, 2015 25 Section 5
5.2.2.3 Cast Iron Pipe Size – Diameter and Flexural Resistance
Cast iron is more brittle and relatively weak as compared to steel. Sections of cast iron pipe
supported at their ends on blocks experience loading and act as a beam. Flexural stress is created
by the weight of the soil overburden, by the weight of the pipe itself, and by forces such as frost
heave and other loads. Results of one study6 to identify those main sizes that experience the
highest failure rates revealed that 4”, 6” and 8” diameter pipe accounted for 90% of the
incidences of breaking and cracking. Said another way, the beam strength is much less for
smaller diameters of cast iron pipe than for larger diameter pipe. There is an increase in relative
beam strength for cast iron pipe with diameters equal to or greater than 10”, providing some
higher relative safety. In its system integrity analyses, NGrid regularly tracks the cast iron
breakage “rates” on all of its systems and has found similar results.
While NGrid has not experienced extensive cast iron graphitization, it should be noted that cast
iron pipe was installed bare and cannot be adequately protected by cathodic protection.
Graphitization reduces wall thickness and thus reduces flexural resistance. An evaluation of
flexural resistance (which is directly related to the “section modulus”7) demonstrates that a wall
loss of 0.2 inch will result in a change in the relative section modulus of 4” through 8” diameter
cast iron of between 52% and 45%. This reduced flexural resistance demonstrates that the
smaller size pipes are far more susceptible to breakage than the larger size pipes.
Research performed by Cornell University identified 2000 microstrain as a critical level for cast
iron pipe. For the purposes of replacement decisions related to parallel trench construction, 600-
800 microstrain (0.06-0.08%) was selected as the replacement criteria. The condition of the cast
iron pipe tested supported those levels as a proper margin of safety, which has been proven out
by field experience under New York State PSC waiver and Massachusetts regulation.
When cast-iron main was originally installed as low pressure piping, its bell and spigot joints
were filled with compacted jute backing and sealed with molten lead and lead caulking or
6 2007 Final Report on Peoples Gas Light and Coke Cast Iron Main Replacement – Kiefner and Associates, Inc. 7 Section Modulus is a function of outside diameter, inside diameter, and wall thickness.
The Naragansett Electric Company d/b/a/ National Grid FY 2016 Gas ISR Risk Assessment Docket 4540 - Attachment 1-1 Page 32 of 122

Sept 01, 2015 26 Section 5
cement. After years of service and switching from wet manufactured gas to natural gas, the jute
has dried out and reduced in volume, weakening the seal within the joint. Additionally, exterior
loads impact and flex the pipe and disturbing the seal. Loads adversely impacting cast iron mains
result from traffic, seasonal weather, vibration and soil movements due to nearby construction
activities; causing these joints to leak. Cornell observed that depending upon the diameter of the
pipe, the joint contributed more or less to the flexibility of the pipe. Lead and jute joints were
found to flex more than cement jointed pipe, which is common on Staten Island in New York
City. Lead joints were also seen to leak when flexed, and later creep and seal again in low
pressure applications.
5.2.2.4 Cast Iron Bell Joints
Cast Iron and Ductile Iron gas mains are constructed with bell and spigot joints. These joints
were most often sealed with jute and lead, cement, or encased in concrete in order to make the
joint leak free and rigid. In many cases, bell joints have been retrofitted with mechanical bell
joint clamps or bell joint encapsulation as a means of addressing bell joint leaks. In the New
York City operating area (formerly Brooklyn Union), all joints on cast iron pipe operating at a 15
psig MAOP have been sealed with mechanical clamps or elastomers. A majority of the low
pressure joints are sealed as well.
NGrid has used a number of methods to seal cast iron joints in past years. These methods fall
into five broad categories and are listed below:
• Metallic Joint Clamps – A two-part clamp secured by bolts and designed to force a steel
ring over the bell and spigot joint. Pressure from a rubber gasket presses on the
circumferential lead face of the bell joint. One problem caused by this method of repair
is that the steel clamp can become anodic to the cast iron, resulting in corrosion.
• Shrink Sleeves – Rubber/plastic materials used have varied as have the shrinking
methods (electrical or thermal). A sleeve is fitted over a cleaned bell and spigot joint as
well as a short section of pipe beyond the joint. The material is then essentially shrink fit
to seal the joint. Extensive cleaning of the joint area is required and if performed
incorrectly it can cause these to fail over time.
The Naragansett Electric Company d/b/a/ National Grid FY 2016 Gas ISR Risk Assessment Docket 4540 - Attachment 1-1 Page 33 of 122

Sept 01, 2015 27 Section 5
• Anaerobic Seals - These have had the advantage of exposing only the top part of the
joint. A hole is drilled into the bell and an anaerobic sealant injected into the jute
backing. The sealant material wicks into the jute and joint surfaces sealing the joint.
• Encapsulants - Also commonly called boots or muffs, encapsulate the face of the joint.
This method is more effective than shrink sleeves and not subject to corrosion or gasket
failure as is common with metallic clamps, nor are they as susceptible to improper
installation.
• Internal sealing methods - There have been a few approaches used over the years,
including internal clamping of the joint, fogging of the main, spraying the inside of the
joint with an atomized sealer, mechanically applying a sealant of the joint and the internal
pipe surface from within the pipe as well as pipe lining with a type of “innertube”.
Metallic Joint Clamps and Shrink Sleeves are no longer used, though metallic clamps that were
properly coated are often found to be in good condition. Anaerobic seals are often selected when
a large excavation is undesirable, exposing the entire joint is difficult or impossible, or in high
water tables where it is difficult or disruptive to effectively encapsulate the joint. The current
internal sealing method used is known as "CISBOT" and it has diameter, length and other
limitations. Internal Lining is an expensive process, but adds other benefits. The best
application for internal liners is on stretches of main without tie-ins or large numbers of services.
Encapsulating bell joints is generally the most effective of the methods and the most commonly
used. Many thousands of cast-iron joints are sealed every year in response to leaks. While this
creates a high cost of operating and maintaining this class of asset material, leaking joints have
rarely led to incidents.
5.2.2.5 Cast Iron Loading and Impact
Cast-iron is much more brittle than steel and is susceptible to cracks or breaks due to loading and
impact. Main breaks are a major concern due to the large amount of gas that may be released in
such instances. This is made worse when the driving force behind the cast-iron main leak is the
operating pressure. Medium or high pressure cast iron aggravates the safety threat posed by cast-
iron mains.
The Naragansett Electric Company d/b/a/ National Grid FY 2016 Gas ISR Risk Assessment Docket 4540 - Attachment 1-1 Page 34 of 122

Sept 01, 2015 28 Section 5
Cast iron breaks are often more severe than the typical corrosion leak. A cracked main may leak
at a high rate, quickly saturating the area around the break with natural gas, migrating and
entering conduits and following the path of other utilities to homes or other confined spaces such
as utility vaults and sewers. Cast iron main breaks are of particular concern during periods of
cold temperatures when frost actions may cause additional stresses on these mains and when
frost caps create an impermeable barrier of the earth’s surface, preventing leaking gas from
safely venting to the atmosphere. Such leaks may be difficult to pinpoint as they can cause high
gas readings at appreciable distances from the actual leak site. The difficulty of leak
investigation is aggravated under frost conditions and with depth of frost penetration. The
inability of the gas to safely escape increases the risk to near-by residents, as gas follows the path
of least resistance, often to nearby habitable structures.
The inventory of small diameter cast iron in NGrid’s service territory varies. Small diameter cast
iron (8” and less) is most susceptible to bending stress and impact. NGrid policies define the
replacement criteria for sound cast iron adjacent to parallel trenches or exposed due to crossing
excavations. Additional consideration is given to conditions such as system performance and
removal of pavement over shallow cast iron mains during road reconstruction.
5.2.3 Plastic Pipe
Plastic pipe has a more recent but yet almost 50 year history. Various plastic piping materials
were developed and introduced into the gas industry in the late 1960’s and early 1970’s. The
industry became more focused on the corrosion and performance concerns with unprotected
piping following the 1968 “National Gas Pipeline Safety Act”. This required Federal regulations
on Gas Transmission & Distribution systems in the U.S. and placed them under the jurisdiction
of the Department of Transportation. Table 5-2 below is a summary of the plastic pipe materials
that have been manufactured and marketed to the gas industry with a notation as to whether or
not they are known to exist on the NGrid system.
The Naragansett Electric Company d/b/a/ National Grid FY 2016 Gas ISR Risk Assessment Docket 4540 - Attachment 1-1 Page 35 of 122

Sept 01, 2015 29 Section 5
Table 5-2 Plastic Pipe Material Summary
Plastic Material Type
Known to Exist in
the NGrid Gas
System? PVC – Polyvinyl Chloride No ABS – Acrylonitrile Butadiene Styrene No CAB – Cellulose Acetate Butyrate* No PB – Polybutylene** Yes PP – Polypropylene No PA – Polyamide No Century MDPE 2306 No Aldyl-A (1972 and Prior) PE 2306 Yes Aldyl-A (Post 1972) PE 2306 Yes Aldyl-A (1973 and After) PE 2406 Yes Aldyl 4A (green) PE 2306 Yes MDPE 2406 Yes MDPE 2708 Yes HDPE 3306 Yes HDPE 3406 Yes
HDPE 3308 No
HDPE 3408 Yes
HDPE 4710 Yes
* A limited number of 1-inch clear CAB services were installed in Upstate New York but have been reported to have been removed. ** Rhode Island only NOTE: Fiberglass main was once used in MA, but has been completely removed to the best of our knowledge.
Table 5-3 below provides a summary of the currently approved plastic material types.
Table 5-3 Currently Approved Plastic Pipe Material Summary
Current Approved Plastic Material Type Region(s)
PE 2708/PE 2406 NYC/LI PE 4710 LI PE 4710 UNY PE 4710 RI PE 2708/PE 2406 MA PE 4710 MA
The Naragansett Electric Company d/b/a/ National Grid FY 2016 Gas ISR Risk Assessment Docket 4540 - Attachment 1-1 Page 36 of 122
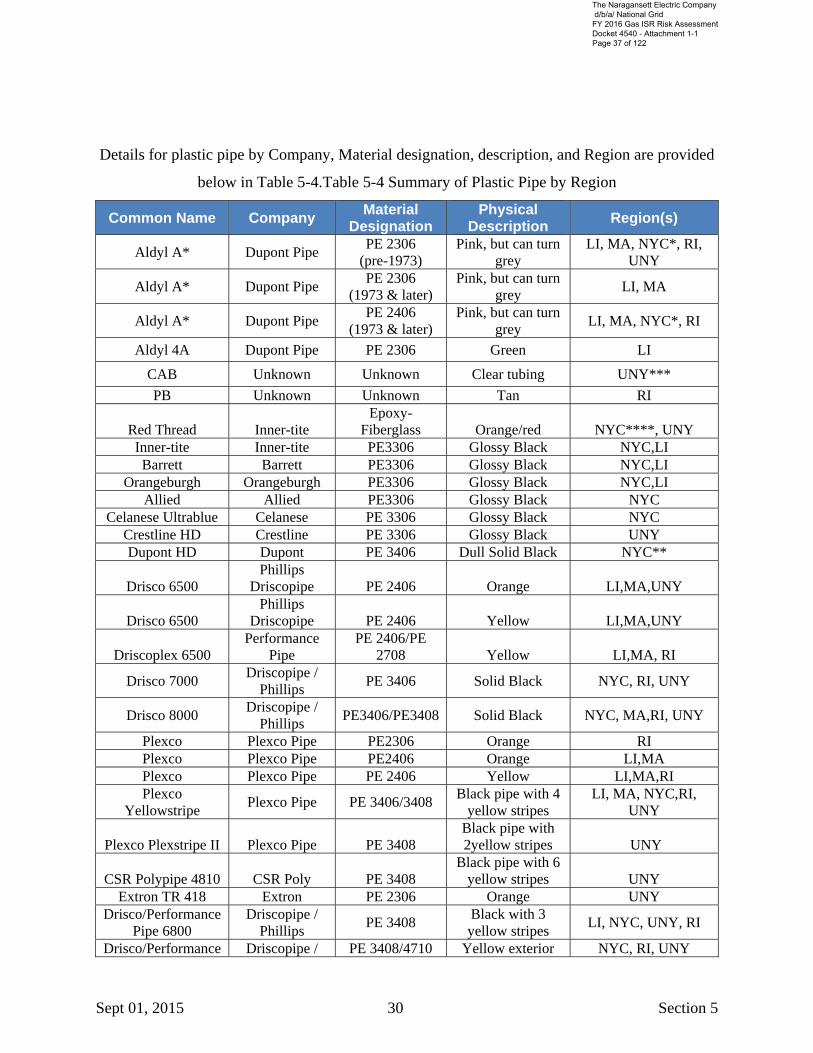
Sept 01, 2015 30 Section 5
Details for plastic pipe by Company, Material designation, description, and Region are provided
below in Table 5-4.Table 5-4 Summary of Plastic Pipe by Region
Common Name Company Material
Designation Physical
Description Region(s)
Aldyl A* Dupont Pipe PE 2306
(pre-1973) Pink, but can turn
grey LI, MA, NYC*, RI,
UNY
Aldyl A* Dupont Pipe PE 2306
(1973 & later) Pink, but can turn
grey LI, MA
Aldyl A* Dupont Pipe PE 2406
(1973 & later) Pink, but can turn
grey LI, MA, NYC*, RI
Aldyl 4A Dupont Pipe PE 2306 Green LI
CAB Unknown Unknown Clear tubing UNY***
PB Unknown Unknown Tan RI
Red Thread Inner-tite Epoxy-
Fiberglass Orange/red NYC****, UNY Inner-tite Inner-tite PE3306 Glossy Black NYC,LI Barrett Barrett PE3306 Glossy Black NYC,LI
Orangeburgh Orangeburgh PE3306 Glossy Black NYC,LI Allied Allied PE3306 Glossy Black NYC
Celanese Ultrablue Celanese PE 3306 Glossy Black NYC Crestline HD Crestline PE 3306 Glossy Black UNY Dupont HD Dupont PE 3406 Dull Solid Black NYC**
Drisco 6500 Phillips
Driscopipe PE 2406 Orange LI,MA,UNY
Drisco 6500 Phillips
Driscopipe PE 2406 Yellow LI,MA,UNY
Driscoplex 6500 Performance
Pipe PE 2406/PE
2708 Yellow LI,MA, RI
Drisco 7000 Driscopipe /
Phillips PE 3406 Solid Black NYC, RI, UNY
Drisco 8000 Driscopipe /
Phillips PE3406/PE3408 Solid Black NYC, MA,RI, UNY
Plexco Plexco Pipe PE2306 Orange RI Plexco Plexco Pipe PE2406 Orange LI,MA Plexco Plexco Pipe PE 2406 Yellow LI,MA,RI Plexco
Yellowstripe Plexco Pipe PE 3406/3408
Black pipe with 4 yellow stripes
LI, MA, NYC,RI, UNY
Plexco Plexstripe II Plexco Pipe PE 3408 Black pipe with 2yellow stripes UNY
CSR Polypipe 4810 CSR Poly PE 3408 Black pipe with 6
yellow stripes UNY Extron TR 418 Extron PE 2306 Orange UNY
Drisco/Performance Pipe 6800
Driscopipe / Phillips
PE 3408 Black with 3 yellow stripes
LI, NYC, UNY, RI
Drisco/Performance Driscopipe / PE 3408/4710 Yellow exterior NYC, RI, UNY
The Naragansett Electric Company d/b/a/ National Grid FY 2016 Gas ISR Risk Assessment Docket 4540 - Attachment 1-1 Page 37 of 122

Sept 01, 2015 31 Section 5
Pipe 8100 Phillips black pipe Performance Pipe
8300 Performance
Pipe PE 3408/4710
Black with 4 yellow stripes
LI, RI, UNY
US Poly UAC 3600 (formerly DuPont) US Poly
PE 3408/ PE 3710
Black with 3 yellow stripes
LI, MA, NYC, RI, UNY,
US Poly UAC 3700 (formerly DuPont) US Poly PE 3408/4710
Black with 3 yellow stripes
LI, MA, NYC, RI, UNY,
JM Eagle UAC 3700 (formerly US
Poly) JM Eagle PE3408/PE4710
Black with yellow stripes
LI, MA, NYC**, RI, UNY
UPONOR UAC 2000 DuPont PE 2406 Yellow
LI, MA, NYC**, UNY
US Poly UAC 2000 -Formerly UPONOR US Poly
PE 2406/PE 2708 Yellow LI, MA, NYC, UNY
JM Eagle UAC 2000 (formerly US
Poly) JM Eagle PE 2406/PE
2708 Yellow LI, MA, NYC, UNY
Charter Plastics Inc Charter
Plastics Inc PE 2406/PE
2708 Yellow LI, MA, NYC
Charter Plastics Inc Charter
Plastics Inc PE 3408/ PE
3608/ PE 4710 Black with 3
Yellow stripes LI, MA, NYC, RI,
UNY Endot Bi-modal
MDPE Endot PE 2406/PE
2708 Yellow LI, MA, NYC,
Endot Endot PE 3408/ PE
4710 Black with 3
Yellow stripes LI, MA, NYC, RI,
UNY * A very limited amount of Aldyl A exists due to a trial installation in New York City. ** limited to Staten Island *** A limited number of 1-inch clear CAB services were installed in Upstate New York but have been reported to have been removed **** Limited to Greenpoint Area Only - RETIRED
5.2.4 Copper Piping
Copper pipe was used for gas service lines in many service territories throughout the United
States. Within NGrid’s service territory, copper was predominantly used for service renewal by
inserting copper inside of deteriorated steel services. In a much more limited manner, copper
services were occasionally direct buried.
Copper services may be subject to leakage caused by corrosion. In particular, direct buried
copper services may be subject to advanced rates of corrosion in the presence of dissolved salts
in the soil (e.g., deicing salts to melt ice and snow on road surfaces).
The Naragansett Electric Company d/b/a/ National Grid FY 2016 Gas ISR Risk Assessment Docket 4540 - Attachment 1-1 Page 38 of 122

Sept 01, 2015 32 Section 5
Copper tubing is far less of a corrosion risk than steel. NGrid’s corrosion experience with over
161,000 copper services indicates that approximately 1% of all corrosion leaks are associated
with copper. When inserted in older steel services, the steel provides corrosion protection since
the steel is more anodic than the copper. The older steel also protects the copper pipe from
excavation, natural forces, and other damage. Corrosion on NGrid’s copper services has been
limited to locations where it was connected to dissimilar metal without insulating joints to
provide isolation between the two dissimilar metals. The dissimilar metal is anodic to the copper
and corrodes. The most common situation for this exists where copper is joined to an iron or
bronze service tee (the iron tees are the most susceptible). Records of where and when these
dissimilar metals were installed do not exist.
5.2.5 Instrumentation & Regulating Facilities
The Instrumentation & regulating assets family includes regulating stations, transfer stations,
heaters, control lines and all ancillary equipment. NGrid has over 1,800 instrumentation &
regulating facilities within its service territory. Over the years there have been various designs,
manufacturers and styles of stations. These include single stage with relief, double stage with
either a working or open monitor. In addition, they may be above grade, below grade, in the
same vault, or in separate vaults. Stations may have one single run or multiple runs. Each station
is specifically designed for the upstream and downstream pressures and the intended capacity.
The regulating facilities have been designed for continuity of supply and peak performance
during normal and critical gas demand periods. They have been designed for specific load and
pressure requirements. The following design philosophy has been utilized:
• Stations are designed using corporate engineering guidelines for flow capacity and
pressure control with consideration given to other factors such as the required footprint,
security, noise, operation, maintenance, community impact and the potential for third-
party damage.
• Stations are designed in accordance with applicable state and federal codes to help ensure
safe and continuous supply of natural gas to our customers and the community we serve.
The Naragansett Electric Company d/b/a/ National Grid FY 2016 Gas ISR Risk Assessment Docket 4540 - Attachment 1-1 Page 39 of 122

Sept 01, 2015 33 Section 5
During the annual performance test, any minor maintenance issues are corrected. Any major
repairs requiring parts replacement and calibrations are rescheduled. By the time all work is
completed and the station is ready for the next season, the operating condition of that particular
regulating station will be back to 100%.
A good asset management program consists of systematic and coordinated activities and
practices through which NGrid optimally manages its assets, performance, risks and expenditure.
The evaluation process will identify two key questions, what we expect the asset to do and what
are we actually doing to maintain it.
NGrid is committed to managing and investing in our system to protect the future of our
business. This is done through proactively managing existing and future risks as well as
contributing to the economic growth of the region in which we operate through the provision of
safe, high quality and dependable services.
NGrid achieved PAS-55 accreditation on February 11, 2009. The PAS-55 asset management
certification program has been designed to enable organizations to demonstrate, by a certification
process, that its asset management program is robust. It indicates to stakeholders and investors
that the organization has a method of protecting and maximizing benefits from its assets and
investment. NGrid’s certification was valid through February 28, 2012, and may be refreshed in
the future at the discretion of senior management.
The Naragansett Electric Company d/b/a/ National Grid FY 2016 Gas ISR Risk Assessment Docket 4540 - Attachment 1-1 Page 40 of 122
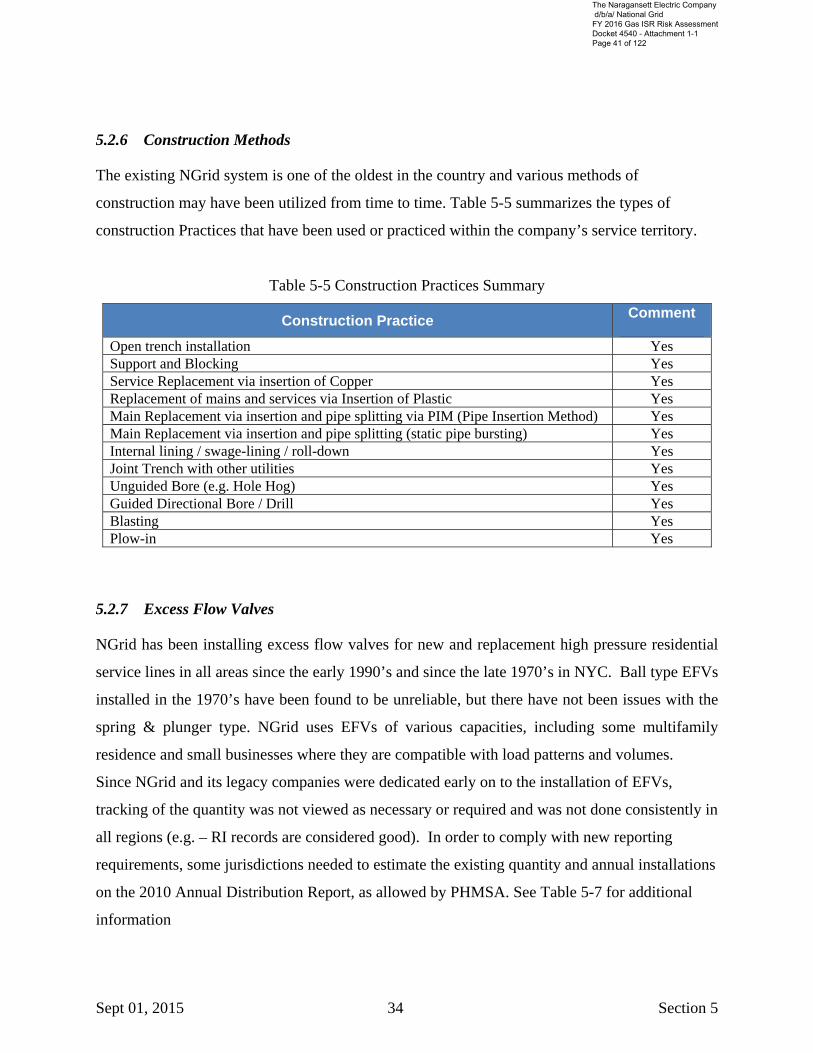
Sept 01, 2015 34 Section 5
5.2.6 Construction Methods
The existing NGrid system is one of the oldest in the country and various methods of
construction may have been utilized from time to time. Table 5-5 summarizes the types of
construction Practices that have been used or practiced within the company’s service territory.
Table 5-5 Construction Practices Summary
Construction Practice Comment
Open trench installation Yes Support and Blocking Yes Service Replacement via insertion of Copper Yes Replacement of mains and services via Insertion of Plastic Yes Main Replacement via insertion and pipe splitting via PIM (Pipe Insertion Method) Yes Main Replacement via insertion and pipe splitting (static pipe bursting) Yes Internal lining / swage-lining / roll-down Yes Joint Trench with other utilities Yes Unguided Bore (e.g. Hole Hog) Yes Guided Directional Bore / Drill Yes Blasting Yes Plow-in Yes
5.2.7 Excess Flow Valves
NGrid has been installing excess flow valves for new and replacement high pressure residential
service lines in all areas since the early 1990’s and since the late 1970’s in NYC. Ball type EFVs
installed in the 1970’s have been found to be unreliable, but there have not been issues with the
spring & plunger type. NGrid uses EFVs of various capacities, including some multifamily
residence and small businesses where they are compatible with load patterns and volumes.
Since NGrid and its legacy companies were dedicated early on to the installation of EFVs,
tracking of the quantity was not viewed as necessary or required and was not done consistently in
all regions (e.g. – RI records are considered good). In order to comply with new reporting
requirements, some jurisdictions needed to estimate the existing quantity and annual installations
on the 2010 Annual Distribution Report, as allowed by PHMSA. See Table 5-7 for additional
information
The Naragansett Electric Company d/b/a/ National Grid FY 2016 Gas ISR Risk Assessment Docket 4540 - Attachment 1-1 Page 41 of 122

Sept 01, 2015 35 Section 5
5.2.8 Mechanical Fittings
A summary of the known mechanical fittings currently in service is detailed below in Table 5-6.
Table 5-6 Mechanical Fittings
Mechanical Fitting Manufacturer
Type Region
Perfection Stab Fitting All Lyco Stab Fitting LI, RI
AMP Fittings Stab Fitting All Reynolds Nut-Follower RI
ContinentalFittings Stab Fitting MA Chicago Fittings Nut-Follower MA
ContinentalFittings Nut-Follower MA Mueller w/ Dresser End Nut-Follower All
Normac Nut-Follower All Dresser Nut-Follower All Dresser Bolted All Eastern Bolted All Plidco Bolted LI, NYC, MA
Mueller Bolted All Smith Blair Bolted All
CSI Bolted All Dresser Posi-Hold Hydraulic All
5.3 Characteristics of Design, Operations and Environmental Factors
The characteristics of the pipeline’s design, operations and environmental factors that are
necessary to assess the applicable threats and risks are summarized in the following sections as
well as Appendix A.
5.3.1 Operating Pressures and Gas Quality
The NGrid gas distribution pipeline system operates at various pressures from low to high
throughout its service territory. Sources of gas include LNG and gas produced from natural
underground reservoirs. Gas Quality is monitored and managed via NGrid’s Transmission
Integrity Management Program.
The Naragansett Electric Company d/b/a/ National Grid FY 2016 Gas ISR Risk Assessment Docket 4540 - Attachment 1-1 Page 42 of 122
Sept 01, 2015 36 Section 5
5.3.2 Reportable/Significant Gas Incidents
Detailed summaries of recent DOT reportable gas incidents are provided in Appendix A,
Section-1 and were given the highest influence in the risk evaluation and prioritization. Table A-
1 summarizes incidents by year for the past 30 years – with consequences. Table A-2
summarizes incidents by year for the past 30 years – by cause. Additionally, details of last 10
years reportable incidents are provided in Table A-3 and the asset-threat combinations of all
integrity-related incidents in that table were given a superseding influence in the risk ranking and
prioritizations for that region.
5.3.3 Gas Distribution Inventory and Repair Data
NGrid’s Distribution Engineering Department is responsible for the development and
implementation of Integrity Management Programs for Gas Transmission & Distribution
facilities pipelines. The department compiles and analyzes system and operating data, files
annual reports to the Department of Transportation (DOT) and State regulators, generates
periodic bulletins, and prepares various Integrity Reports and Analyses. System performance,
analysis, risk, threats, asset management, replacement strategies and rate case support are all
performed. The former Brooklyn Union committed to continuing to perform these sorts of
analyses in an MOU issued to the New York State PSC in 1989 (although they were already a
well established routine by that time). These engineering and operational activities require
knowledge of the system inventory, age, annual performance as well as performance trends over
time.
A complete system inventory by material and size as well as leak repair data by cause is updated
annually and submitted on the Annual DOT reports. Copies of the reports are available on the
Distribution Engineering web page along with comparisons reports for each region over time.
Annual DOT reports are publicly available on PHMSA’s website. NGrid Operator IDs are
provided in Section 1.0.
The Naragansett Electric Company d/b/a/ National Grid FY 2016 Gas ISR Risk Assessment Docket 4540 - Attachment 1-1 Page 43 of 122

Sept 01, 2015 37 Section 5
5.3.4 Environmental Factors
NGrid operates gas distribution piping in some of the most populated regions of the country and
where extremes of all four seasons are experienced. As such, all these factors are considered in
the design, operation and maintenance of the gas system. As previously noted in this section
(Knowledge of Facilities) there are many different policies, piping materials and construction
methods utilized. NGrid utilizes, where appropriate, the characteristics of the distribution
system, design, operating, environmental, performance and physical testing and inspections to
assess the applicable threats and risk to its gas distribution assets. The actual performance,
testing and observed condition of the asset is directly related to the environmental conditions
encountered. Other attributes that are considered in the risk can include asset class (main, service
or I&R facility), material, size, pressure, construction method, or meter location (sub-classes).
Environmental factors that have been considered in threat identification (see Appendix B)
include seismic activity, earth movement, frost heave, heat sources, and flooding. Population
density and other location-specific conditions are considered in NGrid's secondary, more
detailed, risk ranking efforts at the segment level via the estimate of potential human exposure
(in the building types and usage), following the preliminary assessment by asset class and
subclass (region). NGrid’s leak survey and surveillance practices take into account
environmental factors such as susceptibility to leak migration (wall-to-wall paving or seasonal
frost cap) and proximity to buildings of public assembly. Valves are located in a variety of
environments, including areas of paved streets. Valves are operated and maintained in
accordance with Policy CNST04009.
5.3.5 Gas Distribution Mains and Services Assets Analysis
Gas mains and services comprise the bulk of the NGrid gas distribution system and were
constructed with the materials and methods described above. The company reduces risk and
threats by replacing the riskiest leak prone piping where appropriate and through prudent
operating and maintenance that includes a number of Preventative and Mitigative measures as
noted in Table 5-1
The Naragansett Electric Company d/b/a/ National Grid FY 2016 Gas ISR Risk Assessment Docket 4540 - Attachment 1-1 Page 44 of 122

Sept 01, 2015 38 Section 5
The NGrid annual System Integrity Report is incorporated by reference into the DIM Plan and
typically provides the following:
• Overall Regional Distribution Integrity Assessment Summary
• Total Leak Receipts – Current Year and Previous 5 Years
• Leak Receipts as a Function of Total System Pipe Mileage – Current Year
• Leak Receipts by Discovery Source (Excluding Damages) - Current Year and Previous 5 Years
• Leak Receipts by Original Classification (Excluding Damages) - Current Year and Previous 5 Years
• Year-End Workable (excludes Type 3) Leak Backlogs - Current Year and Previous 5 Years
• Year-End Open Type 3 Leak Inventories - Current Year and Previous 5 Years
• Performance Measure (Workable Backlog / Miles of System Pipe) - Current Year and Previous 5 Years
• Performance Measure (Type 3 Inventory / Mile of System Pipe) - Current Year and Previous 5 Years
• Main Inventory by regional Company- Current Year and Previous 5 Years
• Main age analysis by region - Current Year and Previous 5 Years
• Leak-prone pipe and Main replacement program - Current Year and Previous 5 Years
• Percentage of Leak-Prone Pipe - Current Year and Previous 5 Years
• Rate Case Supported Leak-Prone Main Replacement Levels
• Total Main Leak Repairs (Including Damages) - Current Year and Previous 5 Years
• Total Main Inventory by Material vs. Total Main Leak Repairs (incl. damages) by Material – Current Year
• All Main Leak Repairs by Material (Excluding Damages) - Current Year and Previous 5 Years
• All Main Leak Repairs (Including Damages) by Cause – Current Year
• Total Main Leak Rates (repairs per total mile of main) Including Damages - Current Year and Previous 5 Years
• Total Main Leak Rates (repairs per mile of total main) Including Damages - Current Year
• Main Leak Rates (Excluding Damages) by Material - Current Year and Previous 5 Years
• Current Year Main Leak Rates (Excluding Damages) – All Region Comparison by Material
• Main Leak Repairs – Material-Cause Matrix – Current Year
• 10-Year Cast Iron Main Inventory and Attrition Rate – All Region Comparison
• Total Cast Iron Main Breaks - Current Year and Previous 5 Years
• Cast Iron Main Break Rates – All Region Comparison by Diameter – Current Year
• 10-Year Bare/Unprotected Steel Main Inventory and Attrition Rate– All Region Comparison
• Main Corrosion Leak Rates - Current Year and Previous 5 Years
• Service Inventory by regional Company- Current Year and Previous 5 Years
• Total Service Leak Repairs (Including Damages) - Current Year and Previous 5 Years
• Total Service Inventory by Material vs. Total Service Leak Repairs by Material – Current Year
• All Service Leak Repairs (Excluding Damages) by Material - Current Year and Previous 5 Years
• All Service Leak Repairs (Including Damages) by Cause – Current Year
The Naragansett Electric Company d/b/a/ National Grid FY 2016 Gas ISR Risk Assessment Docket 4540 - Attachment 1-1 Page 45 of 122

Sept 01, 2015 39 Section 5
• Total Service Leak Rates (Including Damages) - Current Year and Previous 5 Years
• Total Service Leak Rates (Excluding Damages) by Material - Current Year and Previous 5 Years
• All Region Service Leak Rates (Excluding Damages) Comparison by Material – Current Year
• Service Leak Repairs Material-Cause Matrix – Current Year
• Distribution DOT Report data Comparisons – Current Year & Previous Year.
• System Integrity Report Analysis (Findings and Explanations)
The company has developed a procedure for selecting main segments for replacement.
ENG04030: Identification, Evaluation, and Prioritization of Distribution Main Segments for
Replacement. This procedure details the attributes that are considered and utilized and they
include but are not limited to Design, Operations and Environmental factors.
NGrid Damage Prevention metrics are also incorporated by reference into the DIM Plan and
provide the following:
• Total Damages per 1000 Tickets
• Excavator Error Damages per 1000 Tickets
• Damages due to No-Calls per 1000 Tickets
• Damages due to Mismarks per 1000 Tickets
• Damages due to Company & Company Contractors per 1000 Tickets (Note that “tickets” refers to all “one-call” requests, and not actual mark outs performed) 5.3.6 Gas Distribution Instrumentation & Regulation (I&R) Facilities Asset Analysis
As previously noted above, I&R facilities are inspected annually and immediate or scheduled
repairs are made to ensure continued operation. Observed conditions are noted and used to assess
and risk rank the facilities. The risk ranking methodology is viewed as a high level assessment
that goes beyond the annual PT to capture overall residual risks. The assessment process guides
and validates the organization’s activities.
The I&R risk ranking method consists of four primary factors: impact to the Company,
effectiveness of technical controls, effectiveness of location specific controls, and the likelihood
of an asset failure. These factors are weighted, averaged, and multiplied to make up the risk
score. This risk score is utilized to risk rank and capture the overall condition of the station and
compare it to the other stations.
The Naragansett Electric Company d/b/a/ National Grid FY 2016 Gas ISR Risk Assessment Docket 4540 - Attachment 1-1 Page 46 of 122

Sept 01, 2015 40 Section 5
The company has several programs related to integrity of I&R facilities:
• Reactive program – for operations to handle immediate parts & equipment changes
• Proactive Station Program - for planned station upgrades / replacements based on
assessment, risk and threats
• Proactive Heater Program - for planned heater upgrades / replacements based on
assessment, risk and threats
• Proactive Control Line Program - for planned control line upgrades / replacements based
on assessment, risk and threats
Inspection data is collected and stored locally within operations and some regions have migrated
to electronic data collection and storage. The risk ranking data is stored electronically and
maintained by Pressure Regulating Engineering.
5.4 Additional Data Needed
Additional information needed that will be obtained over time through normal activities
conducted on the pipeline is described in Table 5-7.
The Naragansett Electric Company d/b/a/ National Grid FY 2016 Gas ISR Risk Assessment Docket 4540 - Attachment 1-1 Page 47 of 122

Sept 01, 2015 41 Section 5
Table 5-7 Additional Information
Area of incomplete records or Knowledge
Can it be acquired over time through normal
activities?
Does
Action Plan
Exist? Y / N
Scope Schedule Responsible Departments
Estimate number of EFVs
• In system at CY end
• Installed during the year on residential services only
Yes Yes • Interim - Estimate annual based on usage and totals calculations based on other available / reasonable data
• Long term - through Electronic Reporting and GIS
• Interim for annual 2010 – 2012 DOT reporting estimates
• Long term 3-5 years
• Distribution Engineering
Above grade hazardous leak repair data on services
Yes Yes Not previously included in DOT reporting. These leaks now need to be reported per latest OPS ruling
• Completed (2012 Annual DOT reporting)
• Distribution Engineering
Above grade leak repair data on I&R facilities
Yes Yes Not previously included in DOT reporting unless leak tickets and leak numbers are generated. These leaks now need to be reported per latest OPS ruling
• Completed (2012 Annual DOT reporting)
• Distribution Engineering
Leak repair data on Mechanical fittings
Yes Yes • Interim - Issued forms and bulletins
• Long Term- Electronic Reporting
• Interim – Regulatory & Technical Bulletins issued 12/12/2010
• Long Term – 3-5 years
• Distribution Engineering
Incorrect or Incomplete Facilities Records – Maps and
Yes Yes • Employees may submit corrections to the AMMS system via Field Data Capture unit or the Maps &
• Continuous • Maps and Records
The Naragansett Electric Company d/b/a/ National Grid FY 2016 Gas ISR Risk Assessment Docket 4540 - Attachment 1-1 Page 48 of 122

Sept 01, 2015 42 Section 5
Scanned Records – MA
Records Data Correction Form.
• Appropriate changes are made in ArcFM & SPIPE. Sketches are added to the Scanned Records system
Incorrect or Incomplete Facilities Records – Maps and Scanned Records – LI and NYC
Yes Yes • Employees may submit change requests through the Feedback tool in NRG.
• Appropriate changes are made in NRG and Fortis. Sketches are added to the Fortis system.
• Continuous • Maps and Records
Incorrect or Incomplete Facilities Records – Maps and Scanned Records – UPSTATE NY
Yes Yes • Employees may submit a corrected service card or GFDR.
• Appropriate changes are made in Smallworld. Sketches are added to the GasCar system.
• Continuous • Work Support
• Asset Replacement
Incorrect or Incomplete Facilities Records – Maps and Scanned Records – RI
Yes Yes • Employees may submit corrections when inconsistencies are found.
• Appropriate changes are made in Smallworld. Sketches are added to the Scanned Records system.
• Continuous • Damage
Prevention
• Maps and Records
The Naragansett Electric Company d/b/a/ National Grid FY 2016 Gas ISR Risk Assessment Docket 4540 - Attachment 1-1 Page 49 of 122

Sept 01, 2015 43 Section 5
5.5 Data Capture for New Construction
The requirement for data capture for the location where any new pipeline is installed and
the material of which it is constructed is contained in various standards as summarized in
Table 5-8 below. The legacy procedures that exist are expected to be replaced by an
updated enterprise wide procedure over time.
Table 5-8 Data Capture Requirements
STANDARD NYC UNY LI MA RI
GEN03002 Processing Gas Main and New Service Work Packages
x x x x x
CNST06020 Completion and Processing of Gas Service Record
Cards x x x x x
CNST01005 Preparation of Gas Facility Historical Records
x x x x x
Construction Documentation Specifications
x
5.6 Knowledge Capture – Subject Matter Experts
In addition to existing enterprise wide data, information, and reporting, NGrid has
conducted additional interviews and discussions with process owners and regional groups
of Subject Matter Experts (SME’s) to determine if there are undocumented risks that
could impact system performance. SME’s are individuals who have specialized
knowledge based on their experience or training. SME’s were used to supplement
existing, incomplete, or missing records and may be the only or best source of
information in subjects such as historical operations, maintenance, and construction
practices. SME interviews were also utilized to ensure that all threats have been
identified. All SME interviews have been documented and stored in the Distribution
Integrity Management Program files.
The Naragansett Electric Company d/b/a/ National Grid FY 2016 Gas ISR Risk Assessment Docket 4540 - Attachment 1-1 Page 50 of 122

Sept 01, 2015 44 Section 6
It should be noted that, due to the extent of NGrid’s gas delivery systems over eight (8)
legacy companies, SME interviews needed to be limited in order to accomplish
implementation of the Plan within the necessary time frame. SMEs were selected based
on experience and knowledge of general regions. It was not possible to include
operations personnel from all geographic locations in each legacy company. To ensure
that all reasonable threats were identified and evaluated, the summary SME data was
carefully reviewed after the first issuance of the Plan. If anything was believed to be
incorrect by the engineering SME panel or any regulator, that information was corrected
in the current revision. Furthermore, after the Plan is audited by regulators in all states, a
more detailed rollout will be conducted with Operations and feedback will be solicited
and incorporated into a future revision, as appropriate.
6.0 THREAT IDENTIFICATION
The objective of this section of the plan is to identify existing and potential threats to the
gas distribution pipeline. The following categories of threats shall be considered for each
gas distribution pipeline:
• Corrosion
• Natural Forces
• Excavation Damage
• Other Outside Force
• Material, Weld or Joint Failure
• Equipment Failure
• Incorrect Operation
• Other concerns that could threaten the integrity of the pipeline.
In addition to the above categories established by §192.1007(b), NGrid may collect and
assess threats by other additional categories to evaluate the system, trends and risk.
NGrid Leak Cause categories and definitions are summarized below.
The Naragansett Electric Company d/b/a/ National Grid FY 2016 Gas ISR Risk Assessment Docket 4540 - Attachment 1-1 Page 51 of 122

Sept 01, 2015 45 Section 6
Corrosion
Only to be used when gas is leaking from a hole, crack or porosity in the pipe or other
gas-carrying member AND that condition was caused by corrosion (or graphitization for
cast iron). [NOTES: Corrosion of valves and couplings (not the pipe) or metallic risers
are “Equipment” leaks. Corrosion of metallic CI joint clamps is “Other” leaks.]
Excavation
To be used when the leak is directly caused by physical damage (impact) that can be
attributed to someone. It can be Company personnel, contractors working for the
Company or a third party.
Equipment
To be used for leaks caused by malfunction of control/relief equipment (including valves,
regulators or other instrumentation); stripped threads or broken pipe, couplings on
nipples, valves or mechanical couplings; or seal failures on gaskets, O-rings or seal/pump
packing, etc. [Corrosion of valves and couplings (not the pipe) or metallic risers are
“Equipment” leaks. Failures of previous cast iron joint sealing methods are “Other”leaks]
Materials and Welds/Fuses (All Materials, Including Plastic)
To be used for leaks occurring on faulty material (such as faulty bends, faulty field
welds/fuses or material damaged in transportation or during installation); on originally
sound material that was subjected to dents, gouges, excessive stress, etc.; or for leaks
resulting from a defect in pipe material, component, fabrication or faulty weld seams. Do
not use this for material that was fine but has deteriorated.
Other
To be used ONLY for leaks that are the result of deterioration (NOT corrosion) such as
exceeding the normal service life or any other cause not covered above. USE THIS
CAUSE FOR ALL CAST IRON JOINT LEAKS – Including those which re-occurred
because a failed joint clamp or seal.
Natural Forces
To be used when the leak is directly caused by undermining, earth movement, lightning,
floods, washouts, frost heave, frozen components, etc. It is a damage that was caused by
The Naragansett Electric Company d/b/a/ National Grid FY 2016 Gas ISR Risk Assessment Docket 4540 - Attachment 1-1 Page 52 of 122

Sept 01, 2015 46 Section 6
nature rather than by a person. All broken mains that were not damaged by anyone and
were not the direct result of corrosion/graphitization should be scored as Natural Forces.
Other Outside Force
To be used only when the leak is directly caused by fire, explosion, or a deliberate/willful
act such as vandalism. USE THIS CAUSE FOR ALL ELECTRIC BURN-THROUGHS.
Operations (RARELY USED)
To be used for a leak caused by operator error, inadequate safety practices/procedures or
failure to follow procedures.
6.1 Means of Threat Identification
NGrid’s legacy records and employees provide the basis of information regarding the
system assets and material. The cause categories noted above are the threats for gas
distribution pipelines. The 5 year summary of the annual DOT reports by operator
identification is incorporated by reference into this DIM Plan.
In an effort to gain additional information about the gas system and to identify potential
unknown threats, Subject Matter Expert (SME) interviews were conducted and are
summarized in Appendix B. Subsequent threats shall be identified as they are
discovered or identified and reviewed by Integrity Engineering for inclusion in the
program.
A review of information gathered for Section 5 shall be conducted periodically to identify
existing and potential threats. Threats (including material performance concerns) shall
subsequently be identified by personnel who are knowledgeable of the NGrid system,
operations and the Distribution Integrity Management Program. This is accomplished
through the annual system integrity report that is prepared and issued by Distribution
Engineering and is incorporated by reference into the DIM Plan. An annual review of the
system performance combined with knowledge of the facilities, design, materials science,
engineering, operation and maintenance histories, construction methods, environmental
factors and an understanding of reportable/significant gas incidents provides NGrid with
a sound indication of the threats to its system.
The Naragansett Electric Company d/b/a/ National Grid FY 2016 Gas ISR Risk Assessment Docket 4540 - Attachment 1-1 Page 53 of 122

Sept 01, 2015 47 Section 6
6.2 Monitoring Potential Threats
Potential Threats include those that are not currently evident based on NGrid gas
distribution system failures, leak, or incident data. NGrid routinely monitors information
from sources that may include:
• National Transportation and Safety Board (NTSB) Reports and Recommendations
applicable to Pipeline Accidents.
Reports may be found at:
http://www.ntsb.gov/investigations/reports_pipeline.html
Recommendation Letters may be found at:
http://www.ntsb.gov/recsletters/
• Department of Transportation Pipeline and Hazardous Materials Safety
Administration (PHMSA) Advisory Bulletins:
http://www.phmsa.dot.gov/pipeline/regs/advisory-bulletin
• Membership in a local, regional, or national gas association (e.g. American Gas
Association, Northeast Gas Association, NACE, ASME, etc.) and involvement in
Association workshops and forums that share knowledge regarding distribution
pipeline threats
• Review of trade journals and magazines that publish material regarding gas
distribution
• Incident Analysis (IA’s) or Near Miss Reviews
• Leak Repair Data
• Mechanical Coupling / Fitting failure reports
• Process Safety Reporting
• All Failure Analysis Reports from the Materials, Standards and Testing Group
(MS&T - which includes the Materials Testing Lab) are reviewed by Distribution
Engineering and key failure data is entered into a Failure Analysis Database,
which is used to identify any potential systemic integrity issues. Whenever an
The Naragansett Electric Company d/b/a/ National Grid FY 2016 Gas ISR Risk Assessment Docket 4540 - Attachment 1-1 Page 54 of 122

Sept 01, 2015 48 Section 6
issue is discovered, even if it is not attributable to any asset subclass in the risk
ranking (eg – common substandard conditions, fittings, etc.), appropriate
mitigative measures are developed and implemented regionally or
organizationally (depending on the nature of the issue). To further enhance the
accuracy of the Failure Analysis Database, details of plastic leak data from all
regions are scanned quarterly to identify any failures that may not have been sent
in for analysis.
For Mechanical Fitting Failures resulting in hazardous leaks, the following requirements
have been incorporated into the gas operating procedure GEN01009, Reporting
Nonconforming Material:
• Operations and Construction will complete the "Mechanical Fitting Field Failure
– US DOT Report" and send it, with the fitting (if removed from service), to
MS&T for evaluation.
• Operations and Construction will notify Distribution Engineering immediately if
the failure is potentially systemic in nature, requiring immediate follow-up.
• MS&T will review the form, examine the material, perform any necessary
testing, notify manufacturers and/or vendors when applicable, issue any necessary
technical bulletins, product advisories or reports containing their findings,
recommendations and required follow-up actions.
• MS&T will make all necessary filings with the AGA, PPDC and Public Service
Commission.
• MS&T will forward the form and report to Distribution Engineering for
appropriate filing with PHMSA and advise Distribution Engineering if the
investigation deems that immediate or scheduled removal of in-service material is
warranted.
The Naragansett Electric Company d/b/a/ National Grid FY 2016 Gas ISR Risk Assessment Docket 4540 - Attachment 1-1 Page 55 of 122

Sept 01, 2015 49 Section 7
• Also under "Reporting Nonconforming Material GEN01009 ", other potential
threats (beyond mechanical fitting failures) are reported to and investigated by
MS&T and the follow-up is similar.
7.0 EVALUATION AND RANKING OF RISK
7.1 Objective
Risk analysis is an ongoing process of understanding what factors affect the risk posed by
threats to the gas distribution system and where they are relatively more important than
others. The primary objectives of the evaluation and ranking of gas distribution risk are:
• Consider each applicable current and potential threat
• Consider the likelihood of failure associated with each threat
• Consider the potential consequences of such a failure
• Estimate and rank the risks (i.e. determine the relative importance) posed to
the system
• Consider the differences in the relevance of threats in areas among the various
regions
For the purposes of risk assessment, NGrid has separated its gas distribution system into
two broad (and very different) asset categories; Mains & Services and Instrumentation &
Regulation Facilities. Separate models have been developed to estimate and relatively
rank the risks for each of the assets (by sub-category). The models are different and
completely independent of one another. The models and the results of these models are
maintained by Distribution Engineering and Pressure Regulation Engineering and are
used to develop NGrid’s Asset Management Strategies by State and by Operator ID.
The Naragansett Electric Company d/b/a/ National Grid FY 2016 Gas ISR Risk Assessment Docket 4540 - Attachment 1-1 Page 56 of 122

Sept 01, 2015 50 Section 7
7.2 Mains & Services
For mains and services (with service lines including all equipment upstream of customer-
owned piping, with “service line” as defined in Section 4.0), because of their sheer
volume and non-homogenous nature, NGrid has elected to divide these assets into
“regions” (segments of the system with similar characteristics and reasonably consistent
risk for which similar actions would be effective in reducing risk). For purposes of the
mains and services model, the “regions” will be the asset subclasses. The asset is first
broken into two general facilities – mains or services. Each facility is further broken
down by such factors as material (including active/inactive status, pipe coating, and
cathodic protection status), inside vs. outside meter set (for services), pressure and
diameter (for mains).
Diameters for pipe are classified by the following diameter ranges: up to 4-inch (small
fractional wall thickness), over 4-inch and up to 8-inch (nominally ¼-inch wall), and over
8-inch (0.375-inch wall). For iron pipe (cast and wrought), diameters are classified by
the following diameter ranges: less than 4-inch (with a higher break rate), 4-inch to 8-
inch, and greater than 8-inch (with a lower break rate).
All plastic pipe evaluated in the model is assumed to be Polyethylene. As covered in
Section 5.2.3, there may be small quantities of CAB in Upstate NY and PB in RI. To
address any potential risk associated with these materials, company policy requires that
all integrity-related plastic pipe failures be reported to the MS&T lab for evaluation and
monitoring for possible systemic issues.
A relative risk score is calculated for each asset subclass (with the main and service
facilities ranked independently) for each of the eight defined threat categories. The risk
ranking method for each asset subclass and threat consists of 4 parts: likelihood of failure
and release of gas, likelihood of the release resulting in ignition, reduction controls and
the potential consequences of such an event.
A separate score is calculated for each asset subclass and threat category. The highest
scores (separately for mains and services) are identified for each region and then
reviewed by an engineering SME panel in order to validate/adjust the model results.
Some asset subclass/threat category scores were removed if the panel concluded that the
The Naragansett Electric Company d/b/a/ National Grid FY 2016 Gas ISR Risk Assessment Docket 4540 - Attachment 1-1 Page 57 of 122

Sept 01, 2015 51 Section 7
high scores were the result of known data anomalies. Additionally, some asset
subclass/threat categories with lower scores were added if the SME panel felt that the
potential risk or exposure was not adequately represented by the calculations. Further,
any asset subclass/threat category that experienced a reportable integrity-related incident
within the prior ten (10) calendar years had its score changed in its respective region to
“Known Incident”. (If the asset subclass/threat was not among the top risks listed, it was
added to the list with a score of “Known Incident”.) All scores labeled “Known Incident”
were then accelerated to the top of the risk rankings. The resulting final main and service
lists of the highest risks for each region appear in Appendix C. The model and these lists
will be updated annually based on the inventory and performance data for the previous
calendar year.
It is not possible for NGrid to utilize operating environment factors such as known soil
conditions, frost heave susceptibility, depth of cover, potential "other outside force
damage" sources, potential "natural force damage" sources, geological conditions,
paving, population density, building types, substandard conditions, etc. in its primary risk
rankings (beyond the overall asset subclass general susceptibilities to "natural force" and
"other outside force" damages); as these are very specific to geographic areas and can
vary widely within even a small geographic region. As a result, NGrid's DIM Plan ranks
risk by dividing it's mains and services into "regions" with similar characteristics (as
previously described), These types of factors, when known, are all considered when
evaluating and prioritizing assets for proactive replacement as a mitigative measure.
NGrid utilizes a secondary methodology for replacement qualification and prioritization
(ENG04030) (see Section 5.3.4) that is risk-based and applied on a segment-by-segment
level. Wherever possible, this methodology allows for accounting of environmental and
other location-specific factors in the qualification and prioritization algorithms. These
algorithms also include a “DIMP Factor” (which is based on the highest risk scores for
that region in the DIM Plan) to increase the scoring for those asset subclasses and
subsequently accelerate their attrition.
The parts (or “factors”) used for risk ranking have been carefully designed to take
advantage of known differences in the asset subclasses, extensive experience in failure
modes and subsequent events, actual current performance data for the asset subclasses
The Naragansett Electric Company d/b/a/ National Grid FY 2016 Gas ISR Risk Assessment Docket 4540 - Attachment 1-1 Page 58 of 122

Sept 01, 2015 52 Section 7
and threat categories, subject matter expert opinion on assets and failures experienced
throughout the history of the company, existing system operational procedures, and
populations affected by each threat. Some of these factors are variable (and will be
updated on an annual basis), while others are relatively fixed. The factors and their
components are detailed as follows:
• Likelihood of Failure and Release of Gas – There are two components to this.
The first is the actual failure frequency (or leak repair rate) for the most recent
calendar year. This is a variable factor that will be updated annually. The second
is a rating applied from the results of subject matter expert interviews. This
strengthens the likelihood calculation because it accounts for infrequent failures
that may not occur on a consistent basis. It also was derived from extensive
questioning on not only each threat category, but of all the known sub-threats for
each category. This is a comparatively fixed factor.
• Likelihood of the Release Resulting in an Ignition – There are 2 components to
this factor as well. The first involves the hazardous nature of all failures. This
will be determined by the percentage of all leak discoveries that are Type 1
(hazardous). This varies widely within NGrid’s companies. This will be a
variable factor and will be updated on an annual basis. The second component
will be a failure mode factor, which will be a fixed score assigned based on the
most common mode of asset failure.
• Separate failure mode factor scores were identified by an engineering SME panel
and will be assigned based on the asset and threat category.
o Additionally, reduction factors were included to this category for
“controls” that are in place to reduce the likelihood of a release resulting
in ignition. Extreme care was utilized not to include any controls that
would have already been accounted for by the actual failure frequencies
(leak rates). There was one control reduction factor applied to select
services and one to select mains:
SERVICES – A reduction factor was applied to all non-LP
services to account for the likelihood reduction due to the presence
The Naragansett Electric Company d/b/a/ National Grid FY 2016 Gas ISR Risk Assessment Docket 4540 - Attachment 1-1 Page 59 of 122

Sept 01, 2015 53 Section 7
of excess flow valves (EFVs). The factor was different for each
region, based on the percentage of those services which had been
equipped with an EFV.
MAINS – A set of reduction factors was also applied to all Local
Transmission mains. These factors are the same for each region,
but vary by threat category. They were applied to account for the
fact that these mains were designed and constructed as
Transmission mains and are operated, maintained and monitored as
Transmission mains as well; thereby reducing the likelihood.
• Potential Consequences – The Health & Safety consequence is given a weight of
60% of the total consequence score, while Customer Interruption is given a
weight of 20% and Regulatory & Reputational Impact and Asset Impact
consequences are weighted at 10% each.
The data used in the mains & services risk assessment is consistent with the data reported
to PHMSA in NGrid’s Annual Gas Distribution Reports.
7.3 Instrumentation & Regulation
NGrid utilizes a risk model to evaluate and risk rank the 1,892 Take and Regulating
Stations across the service territory. Using data from the annual Performance Test,
Cathodic Protection testing, and on-site inspections technical assessments are conducted
for each station taking into account pipe and equipment condition, regulator performance,
corrosion data, heater, and scrubber performance. This information, combined with the
potential customer impact resulting from a station outage, is used to prioritize mitigation.
Data to support the risk assessment and ranking was gathered throughout 2012 during
routine testing and analysis of that data was used to prioritize the work for the
2013/2014 work plan.
Initial data analysis for each station asset has been completed and will be updated as
necessary. An updated listing of the highest risk-ranked facilities is maintained by
Pressure Regulation Engineering and is available at all times. This listing is not being
The Naragansett Electric Company d/b/a/ National Grid FY 2016 Gas ISR Risk Assessment Docket 4540 - Attachment 1-1 Page 60 of 122

Sept 01, 2015 54 Section 8
physically incorporated into Appendix C of the Plan, as it is very dynamic – changing
whenever retirements or replacements occur; but is incorporated by reference in its most
updated form.
8.0 IDENTIFICATION AND IMPLEMENTATION OF MEASURES TO
ADDRESS RISKS
The objective of this section of the DIM Plan is to describe existing and proposed
measures to address the risks that have been evaluated and prioritized in section 7. NGrid
has a number of Corporate and Gas Business programs and initiatives to minimize risk to
the company, the customers and the public.
8.1 Corporate Culture Philosophy and Programs
NGrid recognizes that the energy it provides is essential to today’s society, but that it has
inherent risk which cannot be completely eliminated. The risk can however be managed
and kept as low as reasonably possible. These programs and initiatives, in most cases,
exceed existing gas safety regulations and position NGrid to be a premier energy
company. These programs and initiatives include but are not limited to the following:
• Asset Management – NGrid has obtained independent asset management
certification to Publicly Available Standard 55 (PAS 55). An Audit was
conducted by Lloyds Register to certify NGrid’s compliance with this standard
for managing its gas assets.
• Damage Prevention - NGrid follows the nine (9) elements contained within the
published PHMSA Damage Prevention Assistance Program (DPAP). The
Company has been actively involved in mark outs and damage prevention for
over 25 years. NGrid also participates in the Common Ground Alliance DIRT
program.
The Naragansett Electric Company d/b/a/ National Grid FY 2016 Gas ISR Risk Assessment Docket 4540 - Attachment 1-1 Page 61 of 122

Sept 01, 2015 55 Section 8
• Gas Emergency Procedure Manual – A Gas US manual that includes plans
specifically developed to provide for a rapid emergency response. The program is
designed to minimize the extent of an emergency.
• Incident Analysis – this is the process necessary to ensure that injuries and serious
incidents are analyzed thoroughly and promptly to avoid reoccurrence. This is a
NGrid Safety Procedure J-1001.
• Leak Management Program – NGrid’s leak management program (see Table 5-1
for specific procedures) adheres to the following principles:
• Locate the leaks (leak response and leak survey)
• Evaluate the actual or potential hazards associated with these leaks
• Act appropriately to mitigate these hazards (including leak surveillance)
• Keep records; and
• Self-assess to determine if additional actions are necessary to keep people
and property safe
• Material Standards & Testing (MS&T) - NGrid maintains its own materials lab
that tests gas materials for compliance with standards and for suitability for its gas
system. The lab also performs root cause analysis of materials failures and
investigates issues with materials and tools. Findings often generate changes in
manufacturers’ products and QA/QC procedures. MS&T’s role in investigating
mechanical fitting failures and other non-conforming materials is described in
Section 6.2.
• Operator Qualifications (OQ) – Representatives of The New England Gas
Association, the regional trade association for 26 distribution companies operating
in the 6 New England states, and the New York Gas Group, a regional trade
association for 10 distribution companies operating in the state of New York,
formed a consortium in 1999 to develop a operator qualification written plan.
Those trade associations merged, and are now the Northeast Gas Association. The
NGrid OQ committee has met monthly to ensure the effectiveness of the OQ
The Naragansett Electric Company d/b/a/ National Grid FY 2016 Gas ISR Risk Assessment Docket 4540 - Attachment 1-1 Page 62 of 122

Sept 01, 2015 56 Section 8
program. NGrid participates in meetings with all State Commission Staffs through
the Northeast Gas Association’s OQ Working Group (offspring of the two
organizations mentioned previously).
• Personnel and Job Site Safety – This includes a core belief and commitment to
Believe in Zero accidents, Employee Safety Handbooks, Trusted to Work
Responsibly Documents, the Golden Rules of Safety, and Safe and Unsafe Acts
(SUSA) Program.
• Plastic Pipe Data Collection (PPDC) Initiative – NGrid participates in the
national effort to track plastic material failures and use that information to assess
risk on plastic systems.
• Proactive Main and Service Replacement Programs – NGrid recognizes that over
31% of the mains and 21% of the services are made up of leak prone materials.
Significant replacement plans are in place to reduce the inventory and thus the
risk associated with leaks and cast iron breaks.
• Additionally, ENG04030 has been revised (Revision 1, effective
9/15/2013) to better address systemic issues on vintage plastic pipe,
and the extent of replacement under such conditions:
• When Distribution Engineering determines that a systemic issue
exists in a specific main segment due to improper fusion or other
construction defects, the entire affected section of main will be
qualified as an automatic prioritization calculation of 12 and
scheduled for replacement within two/three years (based on
region).
• When Distribution Engineering determines that a systemic issue
exists in a specific main segment due to slow crack growth
resulting from prior squeeze offs, point loading failures, material
deterioration, etc.; the entire affected section of main will be
The Naragansett Electric Company d/b/a/ National Grid FY 2016 Gas ISR Risk Assessment Docket 4540 - Attachment 1-1 Page 63 of 122

Sept 01, 2015 57 Section 8
qualified as an automatic prioritization calculation of 12 and
scheduled for replacement within two/three years (based on
region).
• Process Safety – This program is based upon practices of the chemical industry
and the Baker Panel investigation of the BP Texas City incident. It seeks to
understand and manage the risk of low frequency high consequence events (i.e.
fires and explosions). In addition to internal measures and the review of incidents
and near misses, events external to the company are also reviewed (e.g., sewer
cross-bore incidents, compression coupling failures, etc.). Over 100 Process
Safety Key Performance Indicators (KPIs) are tracked and reported to the Board
of Directors, covering the following twelve Elements of Process Safety.
• Process Safety Leadership
• Plant design and
modifications
• Operational procedures
• Workforce competence
• Human factors
• Emergency arrangements
• Protective devices,
instrumentation and alarms
• Inspection and maintenance
• Permit to work
• Asset records and data
quality
• Third party activities
• Audit, review and closeout
The Naragansett Electric Company d/b/a/ National Grid FY 2016 Gas ISR Risk Assessment Docket 4540 - Attachment 1-1 Page 64 of 122

Sept 01, 2015 58 Section 8
• Flooding – National Grid has begun identifying its vulnerable facilities in flood-prone
regions on both 100-year and 500-year flood surge maps, and will consider any
appropriate safety and reliability improvements to those facilities.
• Storm Hardening – National Grid is currently evaluating various potential storm
hardening measures.
• Process Ownership - NGrid has established process owners for various safety and
management tasks to reduce risk by ensuring that best practices are reviewed and there is
consistent reporting and tracking across all territories.
• QA/QC – NGrid has a Quality Assurance and Quality Control (QA/QC) group which
monitors compliance with all gas regulatory requirements, as well as applicable NGrid
construction, maintenance, service and safety policies. This effort involves:
Field inspection and assessment of NGrid personnel and contractors who
routinely perform gas construction, maintenance and service activities;
Performing process audits involving Federal and State gas regulations;
Conducting additional audits for gas related activities on a regional basis, as
well as those identified by the PAS 55 Steering Committee for having potential
adverse risk to the Company’s gas assets;
Utilize the Six Sigma process methodology to address companywide projects
that require a detailed focus for inter related departmental issues;
Re-Dig program - this program targets post inspection results of completed gas
facility installation and repair activities across NGrid’s U.S. Gas Operations.
• System Integrity Reporting – Distribution Engineering tracks and produces regulatory
reports for compliance with annual DOT and State reporting requirements. In addition,
various in-depth reports on the system’s performance are created to provide trending
The Naragansett Electric Company d/b/a/ National Grid FY 2016 Gas ISR Risk Assessment Docket 4540 - Attachment 1-1 Page 65 of 122

Sept 01, 2015 59 Section 8
data. These reports are also used to measure and monitor the performance of existing
programs.
• Corrosion Control – NGrid has established enterprise wide corrosion control standards,
test instructions and policies covering the design, installation, surveys inspections, testing
and monitoring of the cathodic protection on its gas system. These provide the
preventative and mitigative actions necessary to address the threat of corrosion.
• Special Patrols – The local and non-IMP transmission lines are covered under this DIM
plan. NGrid has established enterprise wide patrol policy CNST02005, Patrolling
Transmission Pipelines. The policy covers the DOT transmission system and local
transmission lines.
• The Standards, Policies & Codes area of National Grid’s Network Strategy organization
has developed a Pipeline Public Awareness (PPA) program as a result of the Pipeline
Safety Improvement Act of 2002. The program encompasses all of National Grid’s gas
transmission and distribution facilities across New York, Massachusetts and Rhode
Island. The goal of the program is to educate the general public about pipeline safety,
including topics such as:
How to recognize possible leaks in gas pipelines and what to do if a leak is
suspected
How to contact the pipeline operator in an emergency
The presence of buried gas pipelines in the communities served
The necessity to call before excavation – Know What’s Below; Call Before
you Dig – Call 811
The significant role the public/excavators can take in helping to prevent third-
party damage accidents as well as how they should respond.
The proper actions emergency response agencies and first responders should
take in response to a pipeline emergency
The Naragansett Electric Company d/b/a/ National Grid FY 2016 Gas ISR Risk Assessment Docket 4540 - Attachment 1-1 Page 66 of 122

Sept 01, 2015 60 Section 8
The means to assess the effectiveness of the communications used by the PPA
Program, in order to improve the Program’s effectiveness over time.
• The PPA program is managed within the Operations, Codes & Policies area of Network
Strategy. There is a Committee that provides oversight to the program made up of:
Customer Communications
Community & Customer Management
Damage Prevention
Emergency Planning
Gas Work Methods
Learning & Development
Network Strategy
Safety
• The PPA program has four key stakeholders:
• Affected Public: Residents along a transmission pipeline right-of-way, places
of congregation, near gas storage & operational facilities, along gas
distribution lines as well as all National Grid customers should be educated on
the appropriate actions and precautions to take while living in proximity of
gas pipelines. This will in turn create a safer environment and allow for more
reliable service.
• Emergency Officials: Fire departments, police departments, Local Emergency
Planning Management Agencies (EMA) and 911 call centers must be aware
and educated on the safety measures and company plans while dealing
directly with a gas pipeline emergency.
The Naragansett Electric Company d/b/a/ National Grid FY 2016 Gas ISR Risk Assessment Docket 4540 - Attachment 1-1 Page 67 of 122

Sept 01, 2015 61 Section 8
• Local Public Officials: Mayors & administrators, zoning boards, public works
officials, licensing & permitting departments, building code enforcement
departments and public officials must be educated and work along side
National Grid to ensure the safety and cooperation of the public.
• Excavators: Employees from construction, blasting, directional drilling and
landscaping companies as well as farmers, sprinkler system installers and
demolition teams all need to be aware of and educated on pipeline safety. This
increased awareness and education will likely reduce the number of pipeline
damages and accidental leaks.
National Grid’s PPA Program communicates to these key stakeholder groups in a number
of ways:
Pipeline Public Awareness brochures included in customer bills
Public service announcements
Paid advertising
Direct mailings with letters and safety brochures
National Grid websites
Links to other pipeline safety information sites
• On-line training programs for first responders and contractors dealing
with natural gas and electric
• Education materials for elementary school teachers and students
regarding natural gas and electric.
Liaison meetings with emergency and local public officials
Attendance at community events
The Naragansett Electric Company d/b/a/ National Grid FY 2016 Gas ISR Risk Assessment Docket 4540 - Attachment 1-1 Page 68 of 122

Sept 01, 2015 62 Section 8
• National Grid also participates in collaborative outreach to key stakeholders through the
Northeast Gas Association using radio and cable television spots.
• The PPA program also communicates natural gas and pipeline safety information by
direct mail outreach to excavators and in conjunction with the local Call Before You Dig
call centers like Dig Safely, New York 811 and Dig Safe to provide natural gas safety
and damage prevention information and training sessions.
8.2 Primary Threat Mitigation
NGrid worked with the American Gas Association (AGA) and the American Gas Foundation
(AGF) on the development of an AGF Study on Distribution Integrity. This study was based on
an analysis of gas distribution incidents in the DOT / OPS Database for the years 1990-2002.
The study concluded that the top five (5) processes having the greatest impact on distribution
integrity were:
• One Call / Mark Outs Systems to reduce third party damage
• Operator Qualifications to reduce operator error
• Cathodic Protection to reduce potential corrosion leaks or wall loss
• Leak Management to reduce the potential for leaks to cause an incident
• Proactive Replacement to reduce the inventory of problematic materials or components
NGrid also included construction activities in Operator Qualifications program early in its
development. Additional or accelerated actions that have been taken or are being planned in
order to reduce the risks from failure of the gas distribution pipeline are documented in
Appendix D. These mitigation efforts address each of the primary threat types: corrosion,
natural forces, excavation damage, other outside force, material or weld failure, equipment
failure, incorrect operation, and other causes. NGrid’s Distribution Engineering Department
continuously monitors system performance in order to evaluate threats and also monitors gas
The Naragansett Electric Company d/b/a/ National Grid FY 2016 Gas ISR Risk Assessment Docket 4540 - Attachment 1-1 Page 69 of 122

Sept 01, 2015 63 Section 9
industry best practices. As necessary, the Distribution Engineering Department will work with
the Standards & Policy Department to update or issue new policies and procedures to mitigate
threats.
9.0 MEASUREMENT OF PERFORMANCE, MONITORING RESULTS, AND
EVALUATING EFFECTIVENESS
The objective of this section of the plan is to establish performance measures that shall be
monitored from an established baseline in order to evaluate the effectiveness of the DIM
program. The performance measures detailed in Sections 9.1 through 9.6 have been established
in order to monitor performance and assist in the ongoing evaluation of threats. Distribution
Engineering shall aggregate data from various legacy data sources (and successor data systems)
as necessary to track each performance measure.
9.1 Number of Hazardous Leaks either Eliminated or Repaired, per §192.703(c),
Categorized by Cause
NGrid has been tracking all leaks by material and cause since 2005, consistently monitoring
trends. The baseline and ongoing performance of the number of hazardous leaks either
eliminated or repaired, per §192.703(c), categorized by cause, shall be documented, or included
by reference, in Appendix E, Section 1. The baseline for this performance measure shall be 2010
recorded performance. Recent improvements in data scrubbing and validation make 2010
performance the best baseline from which to monitor ongoing performance.
9.2 Number of Excavation Damages
Excavation Damage was defined in §192.1001 in December of 2009 with the publishing of the
Final Distribution Integrity Management Rule. NGrid has been tracking and trending leaks
associated with excavation damage since 2004; however the new definition of excavation
damage goes beyond just leaks. Thus, the baseline for this performance measure will be 2010
performance. The baseline and ongoing performance of the number of excavation damages shall
be documented, or included by reference, in Appendix E, Section 2.
The Naragansett Electric Company d/b/a/ National Grid FY 2016 Gas ISR Risk Assessment Docket 4540 - Attachment 1-1 Page 70 of 122

Sept 01, 2015 64 Section 9
9.3 Number of Excavation Tickets (received from the notification center)
The baseline and ongoing performance of the number of excavation tickets received from the
notification center(s) shall be documented, or included by reference, in Appendix E, Section 3.
The baseline for this performance metric will be 2010 performance.
9.4 Total Number of Leaks either Eliminated or Repaired, Categorized by Cause
NGrid has been tracking all leaks by material and cause since 2004, consistently monitoring
trends. Recent improvements in data scrubbing and validation make 2010 performance the best
baseline from which to monitor ongoing performance. The baseline and ongoing performance of
the total number of leaks either eliminated or repaired, categorized by cause, shall be
documented, or included by reference, in Appendix E, Section 4.
9.5 Number of Hazardous Leaks Either Eliminated or Repaired, per §192.703(c),
Categorized by Material
NGrid has been tracking all leaks by material and cause since 2004, consistently monitoring
trends. The baseline and ongoing performance of the number of hazardous leaks either
eliminated or repaired, per §192.703(c), categorized by material, shall be documented, or
included by reference, in Appendix E, Section 5. The baseline for this performance measure
shall be 2010 recorded performance. Recent improvements in data scrubbing and validation
make 2010 performance the best baseline from which to monitor ongoing performance.
9.6 Additional Performance Measures
As it is determined that additional performance measures are needed to evaluate the effectiveness
of the DIM Program in controlling an identified threat, the performance measures shall be
documented, or included by reference, in Appendix E, Section 6.
Additional performance measures initially established include:
• Workable Leak Backlog at the End of Year (known system leaks scheduled for repair)
• Total Excavation Damages per 1000 Tickets
• Main Leak Rates by Material Excluding Damages
The Naragansett Electric Company d/b/a/ National Grid FY 2016 Gas ISR Risk Assessment Docket 4540 - Attachment 1-1 Page 71 of 122

Sept 01, 2015 65 Section 10
• Service Repairs per 1000 Services by Material, Excluding Damages
• Total Leak Receipts
• Response Time Performance
NGrid monitors many other metrics in the course of conducting and monitoring operations and
process safety. Extensive investigation/research, monitoring and improvement works are being
performed on some special projects like Farm Tap investigation and design upgrade to new
Process Safety Standards, Inner-Tite fitting Inspection etc. All the reports are incorporated by
reference in its most updated form. Additional performance measures may be added to Section
9.6 when warranted to control threats.
10.0 PERIODIC EVALUATION AND IMPROVEMENT
The objective of this section of the plan is to periodically re-evaluate threats and risks on the
entire pipeline and periodically evaluate the effectiveness of its program.
10.1 Plan Updating and Documentation
This written integrity management plan shall be reviewed periodically and updated as required to
reflect changes and improvements that have occurred in process, procedures and analysis for
each element of the program. NGrid performs extensive trending and analysis annually and
documents it in the System Integrity Report. Additionally, NGrid will update risk assessment
and ranking by asset class on an annual basis. In addition to the annual efforts, a complete
program re-evaluation shall be completed, at a minimum, every five years. The complete
program re-evaluations shall address:
• Frequency of the next complete program re-evaluation based on the complexity of the system and changes in factors affecting the risk of failure
• Verification of general information • Incorporation of new system information • Re-evaluation of threats and risk • Review the frequency of the measures to reduce risk • Review the effectiveness of the measures to reduce risk • Modification of the measures to reduce risk and refine/improve as needed
The Naragansett Electric Company d/b/a/ National Grid FY 2016 Gas ISR Risk Assessment Docket 4540 - Attachment 1-1 Page 72 of 122

Sept 01, 2015 66 Section 11
• Review performance measures, their effectiveness, and necessary improvements
Form F-1 in Appendix F may be used to document Periodic Review and Updating. All changes
to the written plan, inclusive of material from the appendices, shall be recorded on the Revision
Control Sheet on page ii. However, changes to material in the appendices that is included by
reference need not be recorded on the Revision Control Sheet. This plan shall reside on the
NGrid intranet with the accompanying change-management. Any significant update or major
change to the plan will be informed to the appropriate regulatory agency.
10.2 Effectiveness Review
An assessment of the performance measures described in Sections 9.1 through 9.5 shall be
performed periodically. The NGrid System Integrity Report shall be prepared annually. The
evaluation of threats and risks shall be performed annually. Other discretionary measures
(mitigation beyond minimum code requirements) may be necessary and shall be assessed at the
discretion of management. An emerging threat in one or more location shall be evaluated for
relevance to other areas. If the reviews described above demonstrate significant changes to
threats or system performance, a complete program re-evaluation may be completed in a shorter
timeframe than five years. Form F-1 in Appendix F may be used to document Effectiveness
Reviews.
11.0 REPORTING RESULTS
11.1 State & Federal Annual Reporting Requirements
The following shall be reported annually, by March 15, to PHMSA as part of the annual report
required by 49 CFR, § 191.11:
• Number of hazardous leaks either eliminated or repaired (or total number of leaks if all leaks are repaired when found), per § 192.703(c), categorized by cause
• Number of excavation damages
• Number of excavation tickets (receipt of information by the underground facility operator from the notification center)
• Total number of leaks either eliminated or repaired, categorized by cause
The Naragansett Electric Company d/b/a/ National Grid FY 2016 Gas ISR Risk Assessment Docket 4540 - Attachment 1-1 Page 73 of 122

Sept 01, 2015 67 Section 12
• Information related to failure of mechanical fittings, excluding those that result only in non-hazardous leaks, shall be reported to PHMSA on the Gas Distribution Mechanical Fitting Failure Form (PHMSA F-7100.1-2).
These measures, as well as any others that may be required by the State, shall also be reported to
the appropriate State Agency as per GEN01020 (incorporated by reference). A copy of the
reports shall be maintained in the Distribution Integrity Management Program files.
12.0 DOCUMENT AND RECORD RETENTION
The following records shall be retained in the Distribution Integrity Management Program files.
• The most current as well as prior versions of this written DIM Plan and its Appendices
• Documents supporting Knowledge of Facilities (material supporting Appendix A of the
DIM Plan as well as the annual System Integrity Report)
• Documents supporting threat identification (material supporting Appendix B of the DIM
Plan)
• Documents supporting the identification and implementation of measures to address risks
(material supporting Appendix D of the DIM Plan)
• Annual Reports to PHMSA (as required by §191.11) and State pipeline safety authorities
• Mechanical fitting Failure Reports
Documentation demonstrating compliance with the requirements of 49 CFR, Part 192, Subpart P
shall be retained for at least 10 years.
The Naragansett Electric Company d/b/a/ National Grid FY 2016 Gas ISR Risk Assessment Docket 4540 - Attachment 1-1 Page 74 of 122

Sept 01, 2015 RI-1
APPENDICES FOR RHODE ISLAND
The Naragansett Electric Company d/b/a/ National Grid FY 2016 Gas ISR Risk Assessment Docket 4540 - Attachment 1-1 Page 75 of 122

Sept 01, 2015 RI-2 Appendix A
RHODE ISLAND APPENDIX A – KNOWLEDGE OF FACILITIES
The Naragansett Electric Company d/b/a/ National Grid FY 2016 Gas ISR Risk Assessment Docket 4540 - Attachment 1-1 Page 76 of 122

Sept 01, 2015 RI-3 Appendix A
A summary of PHMSA Reportable Gas Incidents (reported on PHMSA F7100-1) as well as details of
recent incidents are provided in Tables A-1, A-2 and A-3 below.
The Naragansett Electric Company d/b/a/ National Grid FY 2016 Gas ISR Risk Assessment Docket 4540 - Attachment 1-1 Page 77 of 122

Sept 01, 2015 RI-4 Appendix A
Table A-1: Reportable Gas Incidents by Year
Year Number
of Incidents
Fatalities Injuries Property Damage
2014 0 0 0 -
2013 1 0 0 $29,184
2012 1 0 0 $133,377
2011 0 0 0 -
2010 0 0 0 -
2009 1 0 2 $100,000
2008 0 0 0 -
2007 0 0 0 -
2006 0 0 0 -
2005 0 0 0 -
2004 2 0 2 $118,000
2003 1 0 0 $100,000
2002 0 0 0 -
2001 0 0 0 -
2000 2 0 0 $250,000
1999 0 0 0 -
1998 0 0 0 -
1997 0 0 0 -
1996 1 0 0 $250,000
1995 0 0 0 -
1994 1 0 1 $100,000
1993 1 0 0 $300,000
1992 2 0 1 $142,500
1991 0 0 0 -
1990 0 0 0 -
1989 0 0 0 -
1988 0 0 0 -
1987 1 0 2 -
1986 0 0 0 -
1985 2 0 0 $26,000
Total 16 0 8 $1,549,061
The Naragansett Electric Company d/b/a/ National Grid FY 2016 Gas ISR Risk Assessment Docket 4540 - Attachment 1-1 Page 78 of 122

Sept 01, 2015 RI-5 Appendix A
Table A-2: Reportable Gas Incidents by Cause
Year Corrosion Natural Forces
Excavation Damage
Outside Force
Material or Weld Failure
Equip. Failure
Incorrect Operation
Other
2014 0 0 0 0 0 0 0 0
2013 0 0 1 0 0 0 0 0
2012 0 0 0 1 0 0 0 0
2011 0 0 0 0 0 0 0 0
2010 0 0 0 0 0 0 0 0
2009 0 0 0 1 0 0 0 0
2008 0 0 0 0 0 0 0 0
2007 0 0 0 0 0 0 0 0
2006 0 0 0 0 0 0 0 0
2005 0 0 0 0 0 0 0 0
2004 0 2 0 0 0 0 0 0
2003 0 1 0 0 0 0 0 0
2002 0 0 0 0 0 0 0 0
2001 0 0 0 0 0 0 0 0
2000 0 0 0 0 0 0 0 2
1999 0 0 0 0 0 0 0 0
1998 0 0 0 0 0 0 0 0
1997 0 0 0 0 0 0 0 0
1996 0 0 1 0 0 0 0 0
1995 0 0 0 0 0 0 0 0
1994 1 0 0 0 0 0 0 0
1993 0 0 1 0 0 0 0 0
1992 0 1 1 0 0 0 0 0
1991 0 0 0 0 0 0 0 0
1990 0 0 0 0 0 0 0 0
1989 0 0 0 0 0 0 0 0
1988 0 0 0 0 0 0 0 0
1987 1 0 0 0 0 0 0 0
1986 0 0 0 0 0 0 0 0
1985 0 1 0 0 0 0 0 1 30-Year
Total 2 5 4 2 0 0 0 3
The Naragansett Electric Company d/b/a/ National Grid FY 2016 Gas ISR Risk Assessment Docket 4540 - Attachment 1-1 Page 79 of 122

Sept 01, 2015 RI-6 Appendix A
New Table A-3: 10-YEAR INCIDENT HISTORY DETAILS
YEAR Facility Asset
Class/Subclass Street Town Leak Cause Details
2009 SERVICE
(@ METER
SET)
Protected
Coated Steel -
LP - Outside
Set
Rugby St Providence Other
Outside
Force
Vehicular
Damage
2012 I&R Valve Purgatory
Road
Middletown Other
Outside
Force
Vandalism,
Contractor
working for St.
George’s School
hit an
underground gas
main, forcefully
entered into
NG’s District
Regulator
building &
closed a valve
which caused
483 service
outage.
2013 MAIN Protected
Coated Steel –
8” – HP(35#)
Rocky Hill
Road &
Rte-116
Providence Excavation Mechanical
Puncture on Gas
Main by
Excavator
The Naragansett Electric Company d/b/a/ National Grid FY 2016 Gas ISR Risk Assessment Docket 4540 - Attachment 1-1 Page 80 of 122

Sept 01, 2015 RI-7 Appendix B
RHODE ISLAND APPENDIX B THREAT IDENTIFICATION
The Naragansett Electric Company d/b/a/ National Grid FY 2016 Gas ISR Risk Assessment Docket 4540 - Attachment 1-1 Page 81 of 122

Sept 01, 2015 RI-8 Appendix B
In February thru April of 2011, groups of Subject Matter Experts (SMEs) were brought together, each
having knowledge of threats in the various communities served by NGrid. Details on SME qualifications
as well as copies of their interview records are located in the Distribution Integrity Management Program
files. A summary of the threats identified are presented below in Tables B-1 and B-2.
Table B-1: Summary of Applicable Threats
Primary Threat Category
SME’s to Consider the Following Rhode Island
Corrosion
Is there known evidence of Corrosion on the system? Yes
Is there a known history of leakage on the system due to Corrosion? Yes Threat Applicable? Yes
Natural Force
Is there known evidence of damage or failures on the system due to natural forces?
Yes Is there a known history of leakage on the system due to Natural forces? Yes Threat Applicable? Yes
Excavation Damage
Is there known evidence of damage or failures on the system due to Excavation Damage?
Yes Is there a known history of leakage on the system due to Excavation Damage?
Yes Threat Applicable? Yes
Other Outside Forces
Is there known evidence of damage or failures on the system due to Other Outside Forces?
Yes Is there a known history of leakage on the system due to Other Outside Forces?
Yes Threat Applicable? Yes
Material or Weld Failure
Is there known evidence of damage or failures on the system due to Material or Weld Failure?
Yes Is there a known history of leakage on the system due to Material or Weld Failure?
Yes Threat Applicable? Yes
The Naragansett Electric Company d/b/a/ National Grid FY 2016 Gas ISR Risk Assessment Docket 4540 - Attachment 1-1 Page 82 of 122

Sept 01, 2015 RI-9 Appendix B
Primary Threat Category
SME’s to Consider the Following Rhode Island
Equipment Failure
Is there known evidence of damage or failures on the system due to Equipment Failure?
Yes Is there a known history of leakage on the system due to Equipment Failure?
Yes Threat Applicable? Yes
Incorrect Operations
Is there known evidence of damage or failures on the system due to Incorrect Operations?
Yes Is there a known history of leakage on the system due to Incorrect Operations?
Yes Threat Applicable? Yes
Others
Is there known evidence of damage or failures on the system due to others reasons?
Yes Is there a known history of leakage on the system due to other reasons? Yes Threat Applicable? Yes
The Naragansett Electric Company d/b/a/ National Grid FY 2016 Gas ISR Risk Assessment Docket 4540 - Attachment 1-1 Page 83 of 122

Sept 01, 2015 RI-10 Appendix B
Table B-2: Summary of SME Interview Responses for Threat Identification
Primary Threat Category
Material or Sub-Threat
SME’s to Consider the Following Rhode Island
Corrosion
Cast Iron Pipe Does Cast Iron pipe exist in the system? Yes
Is there a known history of body-of-pipe leaks, fractures, or graphitization?
Yes
Bare Steel or Wrought Iron Pipe (with no CP other than Localized hot spotting with
anodes)
Do bare (uncoated) steel main or services exist in the system that are not under CP?
Yes
Is there known evidence of external corrosion on bare steel or wrought iron pipes not under CP?
Yes
Is there a history of leakage on bare steel or wrought iron pipes not under CP?
Yes
Bare Steel or Wrought Iron Pipe (with CP other than just localized hot spotting with
anodes)
Do bare (uncoated) steel main or services exist in the system that are under CP?
No
Is there known evidence of external corrosion on bare steel pipes under CP?
No
Is there a known history of leakage on bare steel pipes under CP? No
Coated Steel with CP
Is there known evidence of external corrosion on coated steel pipe with CP?
Yes
Is there a known history of leakage on coated steel pipe with CP? Yes
Are some CP systems frequently down (not achieving the required level of protection); more than 10% of the time?
Yes
Coated Steel w/o CP
Is there known evidence of external corrosion on coated steel pipe without CP?
Yes
Is there a known history of leakage on coated steel pipe without CP? Yes
Copper Services
Are direct buried or inserted copper services known to exist in the system?
Yes
Is there a known history of leakage on copper services? Yes
Stray Current Do distribution facilities exist near DC transit systems, high voltage DC transmission systems or other known sources of DC current?
Yes
The Naragansett Electric Company d/b/a/ National Grid FY 2016 Gas ISR Risk Assessment Docket 4540 - Attachment 1-1 Page 84 of 122

Sept 01, 2015 RI-11 Appendix B
Primary Threat Category
Material or Sub-Threat
SME’s to Consider the Following Rhode Island
Are any facilities known to be impacted by sources of stray DC current that has or may result in corrosion?
Yes
Internal Corrosion
Are liquids known to exist within any portions of the distribution system? Yes
Is there known evidence of internal corrosion on steel pipe? No
Is there a known history of leakage caused by internal corrosion of steel pipe?
No
Atmospheric Corrosion on above ground
facilities
Do above ground distribution facilities exist in areas exposed to marine atmosphere, high humidity, atmospheric pollutants or agricultural chemicals?
Yes
Is there known evidence of external atmospheric corrosion on exposed steel pipe, equipment or fittings?
Yes
Is there a known history of leakage caused by atmospheric corrosion of steel pipe?
Yes
Atmospheric Corrosion of facilities in
Vaulted areas underground
Do gas distribution facilities exist underground in vaulted areas? Yes
Is there known evidence of external atmospheric corrosion on exposed steel pipe, equipment or fittings?
Yes
Is there a known history of leakage caused by atmospheric corrosion of steel pipe in vaults?
Yes
Corrosion of carrier pipe in
Cased Crossing
Do steel carrier pipes exist within cased crossings? Yes
Are there any existing known contacts between carrier pipes and casings?
No
Is there known evidence of past or active external corrosion on cased steel pipe?
No
Is there a known history of leakage caused by corrosion on cased steel pipe?
NO
Other Corrosion Are there other corrosion threats? wall piece, at dis-similar metals & isolated
fittings
The Naragansett Electric Company d/b/a/ National Grid FY 2016 Gas ISR Risk Assessment Docket 4540 - Attachment 1-1 Page 85 of 122

Sept 01, 2015 RI-12 Appendix B
Primary Threat Category
Material or Sub-Threat
SME’s to Consider the Following Rhode Island
Natural Forces Seismic Activity Are there any seismically active zones or fault lines that exist in the area?
Yes
Is there a history of leakage associated with Seismic activity? No
Earth Movement / Landslide
(Unstable Soil)
Are there any areas susceptible to earth movement or landslide in the area?
No
Is there a known history of leakage associated with landslide or earth movement?
No
Frost Heave Are there any areas susceptible to frost heave that exist in the area? Yes
Is there a known history of leakage resulting from frost heave? Yes
Flooding Are there any areas within the gas system that are subject to flooding? Yes
Is there a known history of leakage or damage associated with flooding?
Yes
Over-pressure due to snow/ice
blockage
Are pressure control equipment vents subject to ice blockage during the winter?
Yes
Is there a known history of over-pressure events as a result of snow/ice blockage?
Yes
Tree Roots Is there a known history of leakage to pipe or fittings as a result of tree root damage?
Yes
Other Natural Forces
Is there a known history of leakage or damage due to other natural force causes; including but not limited to lightning, wild fire or high winds (tornados)?
Lightning
Excavation Damage
Improper Excavation
Practice
Has damage requiring repair or replacement occurred on properly marked facilities due to the failure of the excavator to follow proper excavation rules and procedures?
Yes
Facility not located or marked
Has damage requiring repair or replacement occurred due to failure to locate a valid and timely locate request?
Yes
The Naragansett Electric Company d/b/a/ National Grid FY 2016 Gas ISR Risk Assessment Docket 4540 - Attachment 1-1 Page 86 of 122

Sept 01, 2015 RI-13 Appendix B
Primary Threat Category
Material or Sub-Threat
SME’s to Consider the Following Rhode Island
One-call notification center error
Has damage requiring repair or replacement occurred due to an error made at the one-call notification center?
No
Mis-Marked Facilities
Has damage requiring repair or replacement occurred due to the mis-marking of facilities?
Yes
Threat Applicable? Yes Incorrect Facility
Records Has damage requiring repair or replacement occurred due incorrect facility records?
Yes
Other Excavation
Damage
Has damage requiring repair or replacement occurred due other causes?
Yes
Blow off Riser Damage
Has damage requiring repair or replacement occurred due mapping, marking and contractor communication issue?
Yes
Other Outside Force Damage
Vehicle Damage to Riser/Meter
Are existing risers and/or meters exposed to damage from vehicular damage that do not have barriers or other protection conforming to current design requirements?
Yes
Has known leakage occurred due to vehicle damage to risers/meters. Yes
Vehicle Damage to
above-ground equip/station
Are regulator stations or other above ground station equipment exposed to damage from vehicular damage that do not have barriers or other protection conforming to current design requirements?
Yes
Has known leakage occurred due to vehicle damage to above ground stations or equipment?
No
Vandalism Are gas valves or station equipment susceptible to damage by vandalism that has the potential to pose a risk to employees or the public?
Yes
Has leakage or other unsafe condition been created by vandalism?
Yes
Structure Fire Is there a history of damage to gas meters or other equipment due to structure fires?
Yes
The Naragansett Electric Company d/b/a/ National Grid FY 2016 Gas ISR Risk Assessment Docket 4540 - Attachment 1-1 Page 87 of 122

Sept 01, 2015 RI-14 Appendix B
Primary Threat Category
Material or Sub-Threat
SME’s to Consider the Following Rhode Island
Other Outside Force Damage
Has damage requiring repair or replacement occurred due other outside forces?
Falling ice, Heat ground contamination, down
electric lines
Material or Weld Failure
Century Products
(MDPE 2306)
Is Century Products (MDPE 2306) pipe (Tan) known to exist in the system?
No
Is there a history of leakage of Century Products (MDPE 2306) pipe due to material failure?
No
Aldyl A (MDPE 2306)
Is pre-1973 Aldyl A pipe (Tan, but can turn grey) known to exist in the system?
Yes
Has pre-1973 Aldyl A pipe been known to leak due to brittle-like failure from rock impingement or other stresses?
Yes
Is there a history of leakage of pre-1973 Aldyl A pipe due to material failure?
Yes
Aldyl AAAA (MDPE 2306) Green Aldyl
Is Green Aldyl pipe known to exist in the system? No
Is there a history of brittle like failures of Green Aldyl pipe? No
Is there a history of leakage of Green Aldyl pipe due to material failure?
No
PVC – Polyvinyl Chloride
Is PVC pipe known to exist in the system? No
Is there a history of leakage of PVC pipe due to material failure? No
ABS – Acrylonitrile Butadiene Styrene
Is ABS pipe known to exist in the system? No
Is there a history of leakage of ABS pipe due to material failure? No
CAB – Cellulose Acetate Butyrate
Is CAB pipe known to exist in the system? No
Is there a history of leakage of CAB pipe due to material failure? No
PB – Polybutylene
Is PB pipe known to exist in the system? Yes
Is there a history of leakage of PB pipe due to material failure? Yes
PP – Polypropylene
Is PP pipe known to exist in the system? No
The Naragansett Electric Company d/b/a/ National Grid FY 2016 Gas ISR Risk Assessment Docket 4540 - Attachment 1-1 Page 88 of 122

Sept 01, 2015 RI-15 Appendix B
Primary Threat Category
Material or Sub-Threat
SME’s to Consider the Following Rhode Island
Is there a history of leakage of PP pipe due to material failure? No
Polyamide - PA Is PA pipe known to exist in the distribution system? No
Is there a history of leakage of PA pipe due to material failure? No
PE Fusion failure
Is there a history of PE Fusion Failures or leakage in the system? Yes
Are any types of PE fusion (type, material, size, age, process, geographic area) more prone to leakage or failure?
Yes
Pre-1940 Oxy-Acetylene Girth
Weld
Do pre-1940 Oxy-Acetylene Girth Welds exist on pipe greater than 4 inch?
Yes
Is there a history of pre-1940 Oxy-Acetylene Girth Weld failures or leakage in the system due to material failure?
Yes
Other Do other material failures occur that present a possible current or future risk?
No
Equipment Failure
Plexco Service Tee Celcon
Caps
Are Plexco Service Tee Celcon Caps known to exist in the system? No
Is there a history of leakage of Plexco Service Tee Celcon Caps due to material failure?
No
PP – Delrin Insert Tap Tees
Are Delrin Insert Tap Tees known to exist in the system? Yes
Is there a history of leakage of Delrin Insert Tap Tees? No
Stab Type Mechanical
Is there a history of Stab Type Mechanical Fitting failures or leakage in the system due to pullout?
No
Is there a history of Stab Type Mechanical Fitting failures or leakage in the system due to seal leakage?
Yes
Other Equipment
Failure
What Types and Manufactures of Stab Type Mechanical Fittings have you seen used in the System?
Perfection LYCO & AMP
Are any types of Stab Type Mechanical Fitting (type, material, size, age, manufacturer, geographic area) more prone to leakage or failure?
LYCO
The Naragansett Electric Company d/b/a/ National Grid FY 2016 Gas ISR Risk Assessment Docket 4540 - Attachment 1-1 Page 89 of 122

Sept 01, 2015 RI-16 Appendix B
Primary Threat Category
Material or Sub-Threat
SME’s to Consider the Following Rhode Island
Nut Follower Type
Mechanical Fittings
Is there a history of Nut Follower Type Mechanical Fitting failures or leakage in the system due to pullout?
No
Is there a history of Nut Follower Type Mechanical Fitting failures or leakage in the system due to seal leakage?
No
What Types and Manufactures of Nut Follower Type Mechanical Fittings have you seen used in the System?
Dresser, Normac, Innertite, Kerotest
Are any types of Nut Follower Type Mechanical Fitting (type, material, size, age, manufacturer, geographic area) more prone to leakage or failure?
Kerotest
Bolted Type Mechanical
Fittings
Is there a history of Bolted Type Mechanical Fitting failures or leakage in the system due to pullout?
No
Is there a history of Bolted Type Mechanical Fitting failures or leakage in the system due to seal leakage?
Early vintage
What Types and Manufactures of Bolted Type Mechanical Fittings have you seen used in the System?
Dressers, Smith Blair, & CSI
Are any types of Bolted Type Mechanical Fitting (type, material, size, age, manufacturer, geographic area) more prone to leakage or failure?
Early vintage smith Blair
Other Type Mechanical
Fittings
Is there a history of other types of Mechanical Fitting failures or leakage in the system due to pullout?
No
Is there a history of other types of Mechanical Fitting failures or leakage in the system due to seal leakage?
No
What other types and manufactures of Mechanical Fittings have you seen used in the System (other than Stab, Nut-follower, or bolted type?)
Dresser 700 posi lock
The Naragansett Electric Company d/b/a/ National Grid FY 2016 Gas ISR Risk Assessment Docket 4540 - Attachment 1-1 Page 90 of 122

Sept 01, 2015 RI-17 Appendix B
Primary Threat Category
Material or Sub-Threat
SME’s to Consider the Following Rhode Island
Of the "other mechanical fittings" listed above, are any types of Mechanical Fitting (type, material, size, age, manufacturer, geographic area) more prone to leakage or failure?
No
Valves Are valves inoperable, inaccessible and or paved over without timely identification and repairs?
Yes
Are certain types or makes of valves more likely to leak? Kerotest
Service Regulators
Is there a history of service regulator failures that present a threat to the public or employees?
No
Are certain types or makes of service regulator more likely to create a risk?
Farm Taps & Mercury
Meters Is there a history of meter failures that present a threat to the public or employees?
No
Are certain types or makes of meters more likely to create a risk? No
Control/Relief Station
Equipment
Is there a history of control or relief station equipment failures that present a threat to the public or employees?
No
Are certain types or makes of station equipment more likely to create a risk?
No
Other Equipment
Failure
Is there a history of other equipment failures that present a threat to the public or employees?
Single Stage stations
Are certain types or makes of other equipment more likely to create a risk?
No
Incorrect Operations
General Have inadequate procedures or safety practices, or failure to follow correct procedures, or other operator error resulted in an incident that created a risk to the gas distribution system?
Yes
Gas lines bored through Sewers
Have pipes been installed via unguided or guided bore without proper procedures to ensure other facilities are not damaged?
Yes
The Naragansett Electric Company d/b/a/ National Grid FY 2016 Gas ISR Risk Assessment Docket 4540 - Attachment 1-1 Page 91 of 122

Sept 01, 2015 RI-18 Appendix B
Primary Threat Category
Material or Sub-Threat
SME’s to Consider the Following Rhode Island
Have pipes unknowingly bored through sewer lines been damaged by sewer line cleaning operations?
Yes
Other Bell Joint Leakage
Does Cast Iron pipe exist in the system? Yes
Is there a history of bell joint leaks? Yes Are certain diameters or parts of the system known to be more prone to bell joint failure or leakage than others?
No
Inserted Copper Puncture
Do copper services inserted in steel exist in the system? Yes
Is there a history of leakage of copper services due to puncture by a deteriorated steel outer casing?
No
Copper Sulfide Have any safety incidents occurred as a result of copper sulfide in copper services or service regulators?
No
Construction over gas mains
& services
Have others constructed over gas facilities or taken other action that prevents effective leak survey and other maintenance?
Yes
When identified, is construction that impacts required maintenance corrected in a timely manner?
Yes
Other Are there any other known threats to the Gas Distribution system that we need to be aware of?
gas mains in Catch basins, Vibration
equipment, Anaerobic sealants
The Naragansett Electric Company d/b/a/ National Grid FY 2016 Gas ISR Risk Assessment Docket 4540 - Attachment 1-1 Page 92 of 122

Sept 01, 2015 RI-19 Appendix C
RHODE ISLAND APPENDIX C EVALUATION AND RANKING OF RISK
The Naragansett Electric Company d/b/a/ National Grid FY 2016 Gas ISR Risk Assessment Docket 4540 - Attachment 1-1 Page 93 of 122

Sept 01, 2015 RI-20 Appendix C
HIGHEST RANKED RISKS
STATE: RHODE ISLAND REGION: ALL
FACILITY: MAINS
Mitigation Will Be As Per Appendix D, Except As Otherwise Indicated In Notes
Material Pressure Diameter Mileage Risk Score Threat Category Additional Mitigation Notes
Protected Coated Steel HP Over 8" 27.05 KNOWN
INCIDENT EXCAVATION
Unprotected Bare Steel > 60 PSI,Not T Upto 4" 1.52 4.16 CORROSION
An additional factor will be applied to the replacement qualification and prioritization algorithm to account for this asset’s DIMP risk ranking
Unprotected Bare Steel > 60 PSI,Not T Over 4" Thru 8" 0.81 4.16 CORROSION
An additional factor will be applied to the replacement qualification and prioritization algorithm to account for this asset’s DIMP risk ranking
Unprotected Bare Steel > 60 PSI,Not T Over 8" 1.90 4.16 CORROSION
An additional factor will be applied to the replacement qualification and prioritization algorithm to account for this asset’s DIMP risk ranking
Cast Iron HP Under 4" 0.01 3.66 NATURAL FORCE
An additional factor will be applied to the replacement qualification and prioritization algorithm to account for this asset’s DIMP risk ranking
Wrought Iron HP Under 4" 0.11 3.66 NATURAL FORCE
An additional factor will be applied to the replacement qualification and prioritization algorithm to account for this asset’s DIMP risk ranking
Unprotected Bare Steel HP Upto 4" 163.80 3.28 CORROSION
An additional factor will be applied to the replacement qualification and prioritization algorithm to account for this asset’s DIMP risk ranking
Unprotected Bare Steel HP Over 4" Thru 8" 27.38 3.28 CORROSION
An additional factor will be applied to the replacement qualification and prioritization algorithm to account for this asset’s DIMP risk ranking
Unprotected Bare Steel HP Over 8" 3.71 3.28 CORROSION
An additional factor will be applied to the replacement qualification and prioritization algorithm to account for this asset’s DIMP risk ranking
The Naragansett Electric Company d/b/a/ National Grid FY 2016 Gas ISR Risk Assessment Docket 4540 - Attachment 1-1 Page 94 of 122

Sept 01, 2015 RI-21 Appendix C
Material Pressure Diameter Mileage Risk Score Threat Category Additional Mitigation Notes
Cast Iron HP 4" Thru 8" 8.43 3.07 NATURAL FORCE
An additional factor will be applied to the replacement qualification and prioritization algorithm to account for this asset’s DIMP risk ranking
Ductile Iron HP Over 4" Thru 8" 0.80 2.90 NATURAL FORCE
An additional factor will be applied to the replacement qualification and prioritization algorithm to account for this asset’s DIMP risk ranking
Cast Iron LP Under 4" 7.50 2.89 NATURAL FORCE
An additional factor will be applied to the replacement qualification and prioritization algorithm to account for this asset’s DIMP risk ranking
Wrought Iron LP Under 4" 1.15 2.89 NATURAL FORCE
An additional factor will be applied to the replacement qualification and prioritization algorithm to account for this asset’s DIMP risk ranking
Plastic > 60 PSI,Not T Upto 4" 48.64 2.62 EXCAVATION
Plastic > 60 PSI,Not T Over 4" Thru 8" 22.62 2.62 EXCAVATION
Plastic > 60 PSI,Not T Over 8" 0.16 2.62 EXCAVATION
Plastic > 60 PSI,Not T Upto 4" 48.64 2.59 O. O. FORCE
Plastic > 60 PSI,Not T Over 4" Thru 8" 22.62 2.59 O. O. FORCE
Plastic > 60 PSI,Not T Over 8" 0.16 2.59 O. O. FORCE
Cast Iron LP 4" Thru 8" 680.55 2.35 NATURAL FORCE
An additional factor will be applied to the replacement qualification and prioritization algorithm to account for this asset’s DIMP risk ranking
Wrought Iron LP 4" Thru 8" 0.14 2.35 NATURAL FORCE
An additional factor will be applied to the replacement qualification and prioritization algorithm to account for this asset’s DIMP risk ranking
The Naragansett Electric Company d/b/a/ National Grid FY 2016 Gas ISR Risk Assessment Docket 4540 - Attachment 1-1 Page 95 of 122

Sept 01, 2015 RI-22 Appendix C
Material Pressure Diameter Mileage Risk Score Threat Category Additional Mitigation Notes
Unprotected Coated Steel > 60 PSI,Not T Upto 4" 1.56 2.34 CORROSION
An additional factor will be applied to the replacement qualification and prioritization algorithm to account for this asset’s DIMP risk ranking
Unprotected Coated Steel > 60 PSI,Not T Over 4" Thru 8" 1.41 2.34 CORROSION
An additional factor will be applied to the replacement qualification and prioritization algorithm to account for this asset’s DIMP risk ranking
Unprotected Coated Steel > 60 PSI,Not T Over 8" 4.20 2.34 CORROSION
An additional factor will be applied to the replacement qualification and prioritization algorithm to account for this asset’s DIMP risk ranking
Unprotected Bare Steel LP Upto 4" 49.75 2.30 CORROSION
An additional factor will be applied to the replacement qualification and prioritization algorithm to account for this asset’s DIMP risk ranking
unprotected Bare Steel LP Over 4" Thru 8" 44.31 2.30 CORROSION
An additional factor will be applied to the replacement qualification and prioritization algorithm to account for this asset’s DIMP risk ranking
unprotected Bare Steel LP Over 8" 3.21 2.30 CORROSION
An additional factor will be applied to the replacement qualification and prioritization algorithm to account for this asset’s DIMP risk ranking
unprotected Bare Steel > 60 PSI,Not T Upto 4" 1.52 2.28 EXCAVATION
unprotected Bare Steel > 60 PSI,Not T Over 4" Thru 8" 0.81 2.28 EXCAVATION
Ductile Iron LP Upto 4" 6.77 2.25 NATURAL FORCE
An additional factor will be applied to the replacement qualification and prioritization algorithm to account for this asset’s DIMP risk ranking
Cast Iron HP Over 8" 15.95 2.25 NATURAL FORCE
An additional factor will be applied to the replacement qualification and prioritization algorithm to account for this asset’s DIMP risk ranking
unprotected Bare Steel > 60 PSI,Not T Upto 4" 1.52 2.24 NATURAL
FORCE
An additional factor will be applied to the replacement qualification and prioritization algorithm to account for this asset’s DIMP risk ranking
unprotected Bare Steel > 60 PSI,Not T Over 4" Thru 8" 0.81 2.24 NATURAL
FORCE
An additional factor will be applied to the replacement qualification and prioritization algorithm to account for this asset’s DIMP risk ranking
Plastic > 60 PSI,Not T Upto 4" 48.64 2.23 MATERIAL/WELD An additional factor will be applied to the replacement qualification and prioritization algorithm to account for this asset’s DIMP risk ranking
The Naragansett Electric Company d/b/a/ National Grid FY 2016 Gas ISR Risk Assessment Docket 4540 - Attachment 1-1 Page 96 of 122

Sept 01, 2015 RI-23 Appendix C
Material Pressure Diameter Mileage Risk Score Threat Category Additional Mitigation Notes
Plastic > 60 PSI,Not T Over 4" Thru 8" 22.62 2.23 MATERIAL/WELD An additional factor will be applied to the replacement qualification and prioritization algorithm to account for this asset’s DIMP risk ranking
Plastic > 60 PSI,Not T Over 8" 0.16 2.23 MATERIAL/WELD An additional factor will be applied to the replacement qualification and prioritization algorithm to account for this asset’s DIMP risk ranking
Ductile Iron LP Over 4" Thru 8" 7.65 2.17 NATURAL FORCE
An additional factor will be applied to the replacement qualification and prioritization algorithm to account for this asset’s DIMP risk ranking
Plastic HP Upto 4" 813.74 2.11 EXCAVATION
Plastic HP Over 4" Thru 8" 183.70 2.11 EXCAVATION
Plastic HP Over 8" 4.36 2.11 EXCAVATION
Ductile Iron HP Over 4" Thru 8" 0.80 1.79 CORROSION An additional factor will be applied to the replacement qualification and prioritization algorithm to account for this asset’s DIMP risk ranking
Protected Coated Steel Local T Upto 4" 0.13 2.08 EXCAVATION Patrolled as Transmission Weekly (Class 4) &
Quarterly (Class 1,2,3)
Protected Coated Steel Local T Over 4" Thru 8" 0.01 2.08 EXCAVATION Patrolled as Transmission Weekly (Class 4) &
Quarterly (Class 1,2,3)
Protected Coated Steel Local T Over 8" 0.35 2.08 EXCAVATION Patrolled as Transmission Weekly (Class 4) &
Quarterly (Class 1,2,3)
The Naragansett Electric Company d/b/a/ National Grid FY 2016 Gas ISR Risk Assessment Docket 4540 - Attachment 1-1 Page 97 of 122

Sept 01, 2015 RI-24 Appendix C
HIGHEST RANKED RISKS
STATE: RHODE ISLAND REGION: ALL
FACILITY: SERVICE (Active & Inactive)
Mitigation Will Be As Per Appendix D, Except As Otherwise Indicated In Notes
Facility Material Pressure Meter Set Quantity Risk Score Threat Category Additional Mitigation Notes
Service Protected Coated Steel LP Outside 944 KNOWN
INCIDENT O. O. FORCE
Service Unprotected Bare Steel > 60 PSI,Not T Inside 69 7.32 CORROSION
Service Unprotected Bare Steel > 60 PSI,Not T Outside 198 7.32 CORROSION
Service Unprotected Bare Steel HP Inside 997 7.08 CORROSION
Service Unprotected Bare Steel LP Inside 34,403 5.98 CORROSION
Service Unprotected Bare Steel HP Outside 2,003 5.67 CORROSION
Svc-Inactive Unprotected Bare Steel HP n/a 9 5.67 CORROSION
Review And (If Warranted) Schedule Cut Off When Exposed Or Within Public Works
Service Unprotected Bare Steel LP Outside 2,168 4.49 CORROSION
The Naragansett Electric Company d/b/a/ National Grid FY 2016 Gas ISR Risk Assessment Docket 4540 - Attachment 1-1 Page 98 of 122

Sept 01, 2015 RI-25 Appendix C
Facility Material Pressure Meter Set Quantity Risk Score Threat Category Additional Mitigation Notes
Svc-Inactive Unprotected Bare Steel LP n/a 76 4.49 CORROSION
Review And (If Warranted) Schedule Cut Off When Exposed Or Within Public Works
Service Unprotected Coated Steel > 60 PSI,Not T Inside 15 3.29 CORROSION
Service Unprotected Coated Steel > 60 PSI,Not T Outside 131 3.29 CORROSION
Service Plastic HP Inside 6,389 3.20 EXCAVATION
Service Plastic > 60 PSI,Not T Inside 94 3.20 EXCAVATION
Service Plastic > 60 PSI,Not T Outside 5,138 3.20 EXCAVATION
Service Unprotected Coated Steel HP Inside 2,836 3.19 CORROSION
Service Cast Iron HP Inside 5 3.08 NATURAL FORCE
Service Cast Iron LP Inside 132 2.93 NATURAL FORCE
Service Wrought Iron LP Inside 5 2.93 NATURAL FORCE
Service Plastic LP Inside 22,786 2.90 EXCAVATION
Service Unprotected Coated Steel LP Inside 2,114 2.87 CORROSION
The Naragansett Electric Company d/b/a/ National Grid FY 2016 Gas ISR Risk Assessment Docket 4540 - Attachment 1-1 Page 99 of 122

Sept 01, 2015 RI-26 Appendix C
Facility Material Pressure Meter Set Quantity Risk Score Threat Category Additional Mitigation Notes
Service Plastic HP Outside 71,898 2.58 EXCAVATION
Service Unprotected Coated Steel HP Outside 4,099 2.55 CORROSION
Service Cast Iron HP Inside 5 2.48 EXCAVATION
Svc-Inactive Plastic HP n/a 58 2.48 EXCAVATION Review And (If Warranted) Schedule Cut Off When Exposed Or Within Public Works
Service Plastic > 60 PSI,Not T Inside 94 2.33 MATERIAL/WELD
Service Plastic > 60 PSI,Not T Outside 5,138 2.33 MATERIAL/WELD
Service Cast Iron LP Outside 28 2.22 NATURAL FORCE
Service Wrought Iron LP Outside 5 2.22 NATURAL FORCE
Service Plastic LP Outside 26,577 2.18 EXCAVATION
Svc-Inactive Plastic LP n/a 85 2.18 EXCAVATION Review And (If Warranted) Schedule Cut Off When Exposed Or Within Public Works
Service Unprotected Coated Steel LP Outside 163 2.15 CORROSION
Service Plastic LP Inside 22,786 2.13 MATERIAL/WELD
The Naragansett Electric Company d/b/a/ National Grid FY 2016 Gas ISR Risk Assessment Docket 4540 - Attachment 1-1 Page 100 of 122

Sept 01, 2015 RI-27 Appendix D
RHODE ISLAND APPENDIX D IDENTIFICATION AND IMPLEMENTATION OF MEASURES TO ADDRESS RISKS
The Naragansett Electric Company d/b/a/ National Grid FY 2016 Gas ISR Risk Assessment Docket 4540 - Attachment 1-1 Page 101 of 122

Sept 01, 2015 RI-28 Appendix D
Primary Threat
Category Sub-Threat
Existing Mitigation or Additional/Accelerated Actions
Rhode Island
Corrosion Cast Iron Pipe Graphitization (including risk of crack or break due to becoming brittle)
Proactive leak surveys, Proactive Leak Prone Pipe replacement program, reactive pipe replacement program and Leak management programs
Bare Steel or Wrought Iron Pipe
Proactive leak surveys, Proactive Leak Prone Pipe replacement program, reactive pipe replacement program and Leak management programs
Coated Steel w/o CP
Proactive leak surveys, Proactive Leak Prone Pipe replacement program, reactive pipe replacement program and Leak management programs
Copper Services Proactive leak surveys, service tees replaced with main replacements and leak management programs
Stray Current Design, Proactive leak surveys, Proactive Corrosion Control inspections
Internal Corrosion
Proactive leak surveys, Proactive Leak Prone Pipe replacement program, reactive pipe replacement program and Leak management programs
Atmospheric Corrosion on above ground facilities
Design, Proactive leak surveys, Proactive Corrosion Control inspections
Atmospheric Corrosion of facilities in Vaulted areas underground
Design, Proactive leak surveys, Proactive I&R and Corrosion Control inspections
Corrosion of Buried Farm Tap Equipment
Proactive leak surveys, Proactive Corrosion Control inspections, Pressure Tests
Corrosion of Service Fittings on cast iron mains that are not cathodically protected.
Proactive leak surveys, services associated with main replacement programs are replaced, proactive high pressure service replacement program and leak management program
The Naragansett Electric Company d/b/a/ National Grid FY 2016 Gas ISR Risk Assessment Docket 4540 - Attachment 1-1 Page 102 of 122

Sept 01, 2015 RI-29 Appendix D
Primary Threat
Category Sub-Threat
Existing Mitigation or Additional/Accelerated Actions
Rhode Island
Grounds installed on risers making CP ineffective
Cathodic Protection Monitoring
Corrosion of carrier pipe in Cased Crossing
Cathodic Protection Monitoring
Natural Forces Earth Movement / Landslide(Unstable Soil)
Proactive Leak Survey Programs
Frost Heave Proactive Leak Survey Programs / Winter Operations
Flooding (including Coastal) Proactive Leak Survey Programs
Tree Roots Proactive Leak Survey Programs
Over-pressure due to snow/ice blockage or freeze up.
Design, Proactive Leak Survey Programs
Other Natural Forces (Lightning, High winds)
Design, Proactive Leak Survey Programs
Excavation Damage
Improper Excavation Practice (including mitigation for high-risk tickets)
Damage Prevention Monitoring, Design, EFV's, training and emergency response
Facility not located or marked
Damage Prevention Monitoring, Design, EFV's, training and emergency response
One-call notification center error
Damage Prevention Monitoring, Design, EFV's, training and emergency response
Mis-Marked Facilities Damage Prevention Monitoring, Design, EFV's, training and emergency response
The Naragansett Electric Company d/b/a/ National Grid FY 2016 Gas ISR Risk Assessment Docket 4540 - Attachment 1-1 Page 103 of 122

Sept 01, 2015 RI-30 Appendix D
Primary Threat
Category Sub-Threat
Existing Mitigation or Additional/Accelerated Actions
Rhode Island
Incorrect Facility Records Damage Prevention Monitoring, Design, EFV's, training and emergency response (see Table 5-7)
Shallow Mains - reduced cover
Damage Prevention Monitoring, Design, training and emergency response
Plastic without tracer wire that cannot be located
Damage Prevention Monitoring, Design, EFV's, training and emergency response
Other Outside Force Damage Vehicle Damage to
Riser/Meter Design, Proactive Leak Survey Programs
Vehicle Damage to above-ground equip/station
Design, Proactive Leak Survey Programs
Vandalism Design, EFV's Proactive Leak Survey Programs
Structure Fire Design, EFV's, training and emergency response
Material or Weld Failure
Pre-1973 Aldyl A (Tan MDPE 2306)
Proactive Leak Survey Continue to monitor leak rates. Not currently an increased threat.
1973 and later Aldyl A (Tan MDPE 2406)
Proactive Leak Survey Continue to monitor leak rates. Not currently an increased threat.
Aldyl 4A (Green MDPE 2306)
Not Applicable.
PE other than Aldyl A & 4A Proactive Leak Survey Continue to monitor leak rates. Not currently an increased threat.
Delrin Insert Tap Tees Proactive Leak Survey Continue to monitor leak rates. Not currently an increased threat.
Plexco Service Tee Celcon Caps
Not Applicable
PE Fusion failure Proactive Leak Survey Continue to monitor leak rates. Not currently an increased threat.
The Naragansett Electric Company d/b/a/ National Grid FY 2016 Gas ISR Risk Assessment Docket 4540 - Attachment 1-1 Page 104 of 122
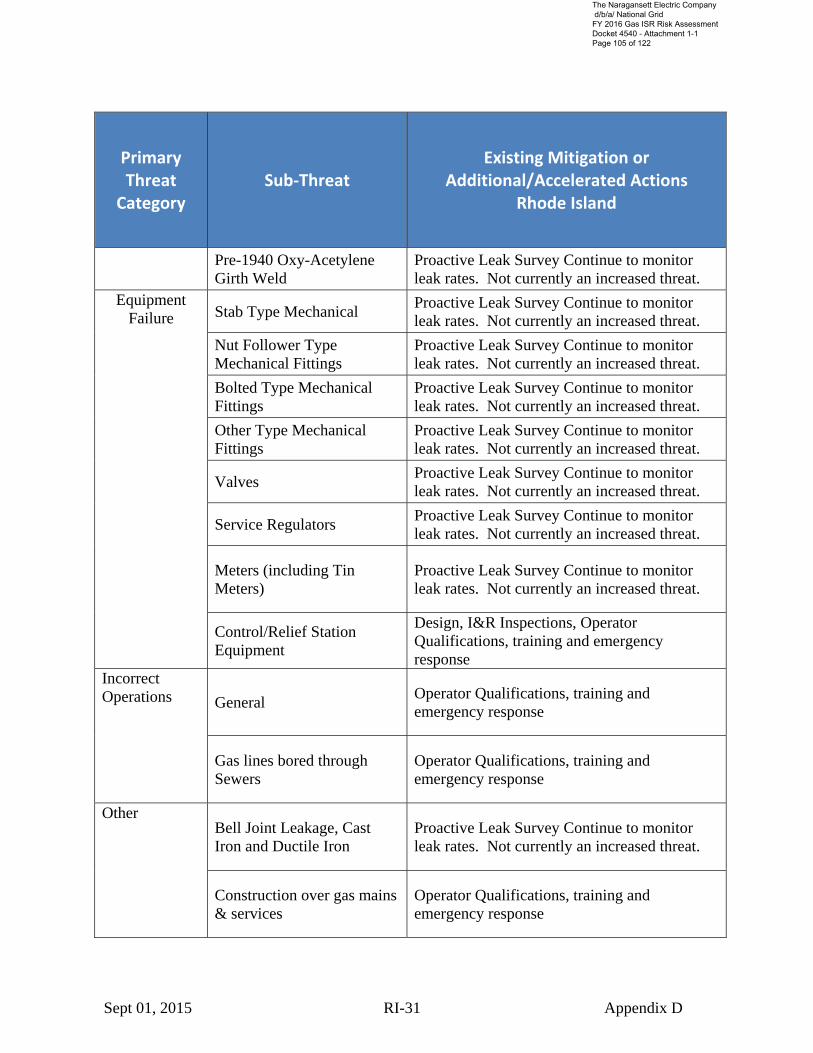
Sept 01, 2015 RI-31 Appendix D
Primary Threat
Category Sub-Threat
Existing Mitigation or Additional/Accelerated Actions
Rhode Island
Pre-1940 Oxy-Acetylene Girth Weld
Proactive Leak Survey Continue to monitor leak rates. Not currently an increased threat.
Equipment Failure Stab Type Mechanical
Proactive Leak Survey Continue to monitor leak rates. Not currently an increased threat.
Nut Follower Type Mechanical Fittings
Proactive Leak Survey Continue to monitor leak rates. Not currently an increased threat.
Bolted Type Mechanical Fittings
Proactive Leak Survey Continue to monitor leak rates. Not currently an increased threat.
Other Type Mechanical Fittings
Proactive Leak Survey Continue to monitor leak rates. Not currently an increased threat.
Valves Proactive Leak Survey Continue to monitor leak rates. Not currently an increased threat.
Service Regulators Proactive Leak Survey Continue to monitor leak rates. Not currently an increased threat.
Meters (including Tin Meters)
Proactive Leak Survey Continue to monitor leak rates. Not currently an increased threat.
Control/Relief Station Equipment
Design, I&R Inspections, Operator Qualifications, training and emergency response
Incorrect Operations General
Operator Qualifications, training and emergency response
Gas lines bored through Sewers
Operator Qualifications, training and emergency response
Other Bell Joint Leakage, Cast Iron and Ductile Iron
Proactive Leak Survey Continue to monitor leak rates. Not currently an increased threat.
Construction over gas mains & services
Operator Qualifications, training and emergency response
The Naragansett Electric Company d/b/a/ National Grid FY 2016 Gas ISR Risk Assessment Docket 4540 - Attachment 1-1 Page 105 of 122
Sept 01, 2015 RI-32 Appendix E
RHODE ISLAND APPENDIX E MEASUREMENT OF PERFORMANCE, MONITORING RESULTS, AND
EVALUATION EFFECTIVENESS
The Naragansett Electric Company d/b/a/ National Grid FY 2016 Gas ISR Risk Assessment Docket 4540 - Attachment 1-1 Page 106 of 122

Sept 01, 2015 RI-33 Appendix E
Appendix E, Section 1 – Number of Hazardous Leaks Either Eliminated or Repaired, Categorized by Cause
The baseline and ongoing performance of the number of Hazardous(Type 1) Leaks for Main and Service combined Either Eliminated or Repaired, Categorized by Cause is provided below:
Cause 2008 2009 2010 2011 2012 2013 2014 2015
Corrosion Actual 644 705 310 504 458 376 545
Baseline Rolling average since 2008 + 0.5 standard deviation (576 for 2008-2013)
Natural Forces Actual 3 4 17 72 22 59 123
Baseline Rolling average since 2008 + 0.5 standard deviation (44 for 2008-2013)
Excavation Damage Actual 139 27 140 107 130 114 92
Baseline Rolling average since 2008 + 0.5 standard deviation (131 for 2008-2013)
Other Outside Force Actual 2 0 0 1 0 2 9
Baseline Rolling average since 2008 + 0.5 standard deviation (1 for 2008-2013)
Material or Welds Actual 2 1 2 0 1 15 25
Baseline Rolling average since 2008 + 0.5 standard deviation (6 for 2008-2013)
Equipment Failure Actual 64 32 34 83 76 72 107
Baseline Rolling average since 2008 + 0.5 standard deviation ( 71 for 2008-2013)
Incorrect Operations Actual 3 0 1 0 0 0 0
Baseline Rolling average since 2008 + 0.5 standard deviation (1 for 2008-2013)
Other Actual 425 737 736 346 234 449 308
Baseline Rolling average since 2008 + 0.5 standard deviation (591 for 2008-2013)
Total Actual 1,282 1,506 1,240 1,113 921 1,087 1,209
Baseline Rolling average since 2008 + 0.5 standard deviation (1,291 for 2008-2013)
The Naragansett Electric Company d/b/a/ National Grid FY 2016 Gas ISR Risk Assessment Docket 4540 - Attachment 1-1 Page 107 of 122

Sept 01, 2015 RI-34 Appendix E
Appendix E, Section 2 – Number of Excavation Damages
The baseline and ongoing performance of the number of excavation damages is provided below:
2010 2011 2012 2013 2014 2015 2016 2017
Excavation Damages Actual 158 80 88 76 80
Baseline 2010 Actual Performance will be the Baseline
The Naragansett Electric Company d/b/a/ National Grid FY 2016 Gas ISR Risk Assessment Docket 4540 - Attachment 1-1 Page 108 of 122

Sept 01, 2015 RI-35 Appendix E
Appendix E, Section 3 – Number of Excavation Tickets
The baseline and ongoing performance of the number of excavation tickets is provided below:
2010 2011 2012 2013 2014 2015 2016 2017
Excavation Tickets Actual 46,808 50,463 51,461 54,714 61,384
Baseline 2010 Actual Performance will be the Baseline
The Naragansett Electric Company d/b/a/ National Grid FY 2016 Gas ISR Risk Assessment Docket 4540 - Attachment 1-1 Page 109 of 122

Sept 01, 2015 RI-36 Appendix E
Appendix E, Section 4 – Total Number of Leaks Either Eliminated or Repaired, Categorized by Cause
The baseline and ongoing performance of the number of Leaks for Main and Service combined Either Eliminated or Repaired, Categorized by Cause is provided below:
Cause 2008 2009 2010 2011 2012 2013 2014 2015
Corrosion Actual 1,265 1,318 707 630 653 588 819
Baseline Rolling average since 2008 + 0.5 standard deviation (1,029 for 2008-2013)
Natural Forces Actual 60 5 22 77 26 59 137
Baseline Rolling average since 2008 + 0.5 standard deviation (55 for 2008-2013)
Excavation Damage Actual 141 28 140 107 133 115 92
Baseline Rolling average since 2008 + 0.5 standard deviation (132 for 2008-2013)
Other Outside Force Actual 7 0 0 2 1 2 9
Baseline Rolling average since 2008 + 0.5 standard deviation (3 for 2008-2013)
Material or Welds Actual 3 2 11 0 2 18 30
Baseline Rolling average since 2008 + 0.5 standard deviation (10 for 2008-2013)
Equipment Failure Actual 216 70 50 96 154 128 159
Baseline Rolling average since 2008 + 0.5 standard deviation (149 for 2008-2013)
Incorrect Operations Actual 2 0 3 2 0 0 0
Baseline Rolling average since 2008 + 0.5 standard deviation (2 for 2008-2013)
Other Actual 1,503 2,252 1,646 1,479 1,261 914 807
Baseline Rolling average since 2008 + 0.5 standard deviation (1,731 for 2008-2013)
Total Actual 3,197 3,675 2,579 2,393 2,230 1,824 2053
Baseline Rolling average since 2008 + 0.5 standard deviation (2,987 for 2008-2013)
The Naragansett Electric Company d/b/a/ National Grid FY 2016 Gas ISR Risk Assessment Docket 4540 - Attachment 1-1 Page 110 of 122

Sept 01, 2015 RI-37 Appendix E
Appendix E, Section 5 – Number of Hazardous Leaks Either Eliminated or Repaired, Categorized by Material (Excluding Excavation Damage Leaks)
The baseline and ongoing performance of the number of Leaks for Main and Service combined Either Eliminated or Repaired, Categorized by Material (excluding excavation damage leaks) is provided below:
Cause 2008 2009 2010 2011 2012 2013 2014 2015
Cast Iron / Wrought Iron Actual 373 388 322 324 303 393 481
Baseline Rolling average since 2008 + 0.5 standard deviation (370 for 2008-2013)
Unprotected Bare Actual 420 624 470 404 389 477 515
Baseline Rolling average since 2008 + 0.5 standard deviation (507 for 2008-2013)
Unprotected Coated Actual 75 88 71 54 41 49 40
Baseline Rolling average since 2008 + 0.5 standard deviation (72 for 2008-2013)
Protected Bare Actual 0 0 0 0 0 0 0
Baseline Rolling average since 2008 + 0.5 standard deviation (0 for 2008-2013)
Protected Coated Actual 0 0 0 0 0 0 0
Baseline Rolling average since 2008 + 0.5 standard deviation (0 for 2008-2013)
Plastic Actual 247 364 223 208 40 51 78
Baseline Rolling average since 2008 + 0.5 standard deviation (251 for 2008-2013)
Copper Actual 2 0 1 0 1 1 0
Baseline Rolling average since 2008 + 0.5 standard deviation (1 for 2008-2013)
Other Actual 11 15 13 16 17 2 3
Baseline Rolling average since 2008 + 0.5 standard deviation (15 for 2008-2013)
Total Actual 1,128 1,479 1,110 1,006 791 973 1,117
Baseline Rolling average since 2008 + 0.5 standard deviation (1,196 for 2008-2013)
The Naragansett Electric Company d/b/a/ National Grid FY 2016 Gas ISR Risk Assessment Docket 4540 - Attachment 1-1 Page 111 of 122

Sept 01, 2015 RI-38 Appendix E
Appendix E, Section 6 – Additional Performance Measures
The baseline and ongoing performance of the number of known system leaks at the end of the year scheduled for repair is provided below:
2008 2009 2010 2011 2012 2013 2014 2015
Workable Backlog Actual 264 77 15 33 54 26 38
Baseline Rolling average since 2008 + 0.5 standard deviation (125 for 2008-2013) The baseline and ongoing performance of total damages per 1000 tickets is provided below:
2010 2011 2012 2013 2014 2015 2016 2017
Total Damages per 1000 Tickets
Actual 3.38 1.58 1.71 1.39 1.30 Baseline 2010 Actual Performance will be the Baseline
The baseline and ongoing performance of Total Leak Receipts is provided below:
2008 2009 2010 2011 2012 2013 2014 2015
Total Leak Receipts Actual 3,134 3,652 2,624 2,502 2,417 2,252 2,753
Baseline Rolling average since 2008 + 0.5 standard deviation (3,028 for 2008-2013)
The Naragansett Electric Company d/b/a/ National Grid FY 2016 Gas ISR Risk Assessment Docket 4540 - Attachment 1-1 Page 112 of 122

Sept 01, 2015 RI-39 Appendix E
The baseline and ongoing performance of the Response Time Performance are provided below:
Regular Day
Response Time 2008 2009 2010 2011 2012 2013 2014 2015
30 Minutes Actual 95.6% 95.3% 96.1% 96.1% 95.4% 95.6% 95.0%
Baseline 94.10% as established by NGrid
Nights & Weekends
Response Time 2008 2009 2010 2011 2012 2013 2014 2015
45 Minutes Actual 96.3% 95.8% 95.8% 96.5% 97.0% 96.4% 96.3%
Baseline 94.38% as established by NGrid
The Naragansett Electric Company d/b/a/ National Grid FY 2016 Gas ISR Risk Assessment Docket 4540 - Attachment 1-1 Page 113 of 122

Sept 01, 2015 RI-40 Appendix E
The baseline and ongoing performance of the main leak rates (leak repairs by mile of main) by Material excluding Damages are provided below:
Main Leak Rates (leak repairs by mile of main) by Material Excluding Damages Rhode Island 2008 2009 2010 2011 2012 2013 2014
Cast Iron Actual 1.54 1.65 1.10 1.09 1.13 0.93 1.19 Baseline Rolling average since 2008 + 0.5 standard deviations (1.38 for 2008-2013 )
All Steel Actual 0.63 0.75 0.51 0.42 0.53 0.25 0.21 Baseline Rolling average since 2008 + 0.5 standard deviations (0.60 for 2008-2013 )
Plastic Actual 0.28 0.25 0.19 0.18 0.01 0.01 0.00 Baseline Rolling average since 2008 + 0.5 standard deviations (0.21 for 2008-2013 )
The baseline and ongoing performance of the service leak rates (leak repairs by 1000 services) by Material excluding Damages are provided below:
Service Leak Rates (leak repairs per 1000 services) by Material Excluding Damages Rhode Island 2008 2009 2010 2011 2012 2013 2014
Copper Actual 11.24 0.00 5.85 0.00 4.81 4.83 0.00 Baseline Rolling average since 2008 + 0.5 standard deviations (6.55 for 2008-2013)
All Steel Actual 5.08 8.98 6.35 6.41 6.72 9.33 11.39 Baseline Rolling average since 2008 + 0.5 standard deviations (7.97 for 2008-2013)
Plastic Actual 1.81 2.88 1.61 1.58 0.36 0.42 0.69 Baseline Rolling average since 2008 + 0.5 standard deviations (1.92 for 2008-2013)
The Naragansett Electric Company d/b/a/ National Grid FY 2016 Gas ISR Risk Assessment Docket 4540 - Attachment 1-1 Page 114 of 122

Sept 01, 2015 RI-41 Appendix E
Extensive investigation/research, monitoring and improvement works are being performed on some special projects listed below and
all the reports are incorporated by reference in its most updated form.
1. Inner-Tite Inspection Program.
2. Bowling Lane, Westerly RI Incidence Analysis.
3. Removal of pre-1974 Aldyl-A 60 psig main from Union St and Miller St, Warrren RI.
4. Water Intrusion relay: Hope St. in Bristol. This job was NOT begun Fall of 2014 due to difficulty in obtaining the permit to open
the road along a RIPTA bus route.
The Naragansett Electric Company d/b/a/ National Grid FY 2016 Gas ISR Risk Assessment Docket 4540 - Attachment 1-1 Page 115 of 122

Sept 01, 2015 RI-42 Appendix F
RHODE ISLAND APPENDIX F PERIODIC EVALUATION AND IMPROVEMENT
The Naragansett Electric Company d/b/a/ National Grid FY 2016 Gas ISR Risk Assessment Docket 4540 - Attachment 1-1 Page 116 of 122

Sept 01, 2015 RI-43 Appendix F
2014 REGIONAL DISTRIBUTION INTEGRITY ASSESSMENT
Distribution Engineering has reviewed all of the findings in the annual Trend-Based Distribution System Integrity
Analysis (System Integrity Report) in accordance with our Distribution Integrity Management Plan, and found leak
receipts and repairs went up in 2014. These changes are believed to be the result of some recent incidents which
increased public awareness, two consecutive years of severe weather condition and LPP deteriorating performance.
National Grid has accelerated LPP replacement program to address this issue. There are no immediate causes for
concern that would warrant changes to DIMP. Some anomalies were found and either explained as non-systemic or
set up for continued research and/or monitoring.
Below is a summary of the individual key integrity measure results for the following federal (PHMSA) filing entity
that constitutes National Grid-US.
NationalGrid-RI 2014System Integrity Report Summary
REGIONS RI
ITEMS • Leak Receipts • Workable Leak Backlog • LPP Main and Service Inventories • Overall Main Leak Rate • Cast Iron Main Break Rate • Steel Main Corrosion Leak Rate • Service Leak Rate
Rhode Island (RI)
• Leak receipts increased . • Workable leak backlog increased slightly . • Leak prone main and service inventories continue to decline steadily. • Overall main leak rate and Cast iron main break rate increased. Steel main corrosion leak rate remain
steady . • Service leak rate increased.
The Naragansett Electric Company d/b/a/ National Grid FY 2016 Gas ISR Risk Assessment Docket 4540 - Attachment 1-1 Page 117 of 122

Sept 01, 2015 RI-44 Appendix F
Form F-1: Periodic Updating and Review
Annual Evaluation of Performance Measures that Exceeded Baseline
Performance Measure
Actual Performance for Year __2014___
Established Baseline
Are additional measures beyond minimum code
requirement necessary?
Has an engineering evaluation been completed and documented?
Leak Receipts 2,753 3,028 NO Annual System Integrity Report
Workable leak Backlog 38 125 NO Annual System Integrity Report
LPP Main Inventory 1,305 miles 1,356 miles (2013) NO Annual System Integrity Report
Overall Main Leak Rate 0.37 0.66 NO Annual System Integrity Report
Cast Iron Main Break Rate 0.17 0.09 NO Annual System Integrity Report
Steel main Corrosion Leak Rate 0.21 0.41 NO Annual System Integrity Report
Service Leak Rate 3.97 4.01 NO Annual System Integrity Report
Existing Date for Complete Program re-evaluation:___YES_______ Is a shorter timeframe for complete program re-evaluation warranted? : __NO____
Required frequency Program Re-evaluation Element Date Completed
Required Annually Evaluate Performance Measures 07/24/2015
As needed Update Knowledge of System Characteristics, Environmental Factors and Threats 07/24/2015
As needed Update General Information 07/24/2015
As needed Update Threat Identification 07/24/2015
As needed Update Risk Evaluation and Ranking Process 07/24/2015
Required Annually Update Risk Evaluation and Ranking of Risks 07/24/2015
As needed Update Risk Evaluation and Ranking Validation 07/24/2015
As needed Update Risk Evaluation and Ranking Process Improvement Action Plans 07/24/2015
As needed Update Action Plans
The Naragansett Electric Company d/b/a/ National Grid FY 2016 Gas ISR Risk Assessment Docket 4540 - Attachment 1-1 Page 118 of 122

Sept 01, 2015 RI-45 Appendix G
RHODE ISLAND APPENDIX G CROSS REFERENCE OF 49 CFR PART 192, SUBPART P REQUIREMENTS TO THE
DIM PLAN
The Naragansett Electric Company d/b/a/ National Grid FY 2016 Gas ISR Risk Assessment Docket 4540 - Attachment 1-1 Page 119 of 122

Sept 01, 2015 RI-46 Appendix G
The table below provides a cross reference between 49 CFR Part 192, Subpart P (Gas Distribution Pipeline Integrity Management) and this Gas Distribution Integrity Management Plan.
49 CFR Part 192, Subpart P DIM Plan Reference
§192.1005 No later than August 2, 2011 a gas distribution operator must develop and implement an integrity management program that includes a written integrity management plan as specified in § 192.1007.
3.0
§192.1007 A written integrity management plan must contain procedures for developing and implementing the following elements:
§192.1007 (a) Knowledge. An operator must demonstrate an understanding of its gas distribution system developed from reasonably available information.
5.0, 5.1, 5.2, 5.3, 5.4, 5.5
§192.1007 (a) (1) Identify the characteristics of the pipeline’s design and operations and the environmental factors that are necessary to assess the applicable threats and risks to its gas distribution pipeline.
5.3
§192.1007 (a) (2) Consider the information gained from past design, operations, and maintenance.
5.2
§192.1007 (a) (3) Identify additional information needed and provide a plan for gaining that information over time through normal activities conducted on the pipeline (for example, design, construction, operations or maintenance activities).
5.4
§192.1007 (a) (4) Develop and implement a process by which the IM program will be reviewed periodically and refined and improved as needed.
10.1, 10.2
§192.1007 (a) (5) Provide for the capture and retention of data on any new pipeline installed. The data must include, at a minimum, the location where the new pipeline is installed and the material of which it is constructed.
5.5
§192.1007 (b) Identify threats. The operator must consider the following categories of threats to each gas distribution pipeline: corrosion, natural forces, excavation damage, other outside force damage, material, weld or joint failure, equipment failure, incorrect operation, and other concerns that could threaten the integrity of the pipeline.
6.0
§192.1007 (b) An operator must consider reasonably available information to identify existing and potential threats. Sources of data may include, but are not limited to, incident and leak history, corrosion control records, continuing surveillance records, patrolling records, maintenance history, and excavation damage experience.
5.1, 6.0,
§192.1007 (c) Evaluate and rank risk. An operator must evaluate the risks associated with its distribution pipeline. In this evaluation, the operator must determine the relative importance of each threat and estimate and rank the risks posed to its pipeline. This evaluation must consider each applicable current and potential threat, the likelihood of failure associated with each threat, and the potential consequences of such a failure.
7.1, 7.2, 7.3
§192.1007 (c) An operator may subdivide its pipeline into regions with similar characteristics (e.g., contiguous areas within a distribution pipeline consisting of mains, services and other appurtenances; areas with common materials or environmental factors), and for which similar actions likely would be effective in reducing risk.
Non-Mandatory
The Naragansett Electric Company d/b/a/ National Grid FY 2016 Gas ISR Risk Assessment Docket 4540 - Attachment 1-1 Page 120 of 122

Sept 01, 2015 RI-47 Appendix G
49 CFR Part 192, Subpart P DIM Plan Reference
§192.1007 (d) Identify and implement measures to address risks. Determine and implement measures designed to reduce the risks from failure of its gas distribution pipeline. These measures must include an effective leak management program (unless all leaks are repaired when found).
8.1, 8.2
§192.1007 (e) (1) Measure performance, monitor results, and evaluate effectiveness. Develop and monitor performance measures from an established baseline to evaluate the effectiveness of its IM program. …... These performance measures must include the following: (i) Number of hazardous leaks either eliminated or repaired, per § 192.703(c), categorized by cause; (ii) Number of excavation damages; (iii) Number of excavation tickets (receipt of information by the underground facility operator from the notification center); (iv) Total number of leaks either eliminated or repaired, categorized by cause; (v) Number of hazardous leaks either eliminated or repaired per § 192.703(c), categorized by material; and (vi) Any additional measures the operator determines are needed to evaluate the effectiveness of the operator’s IM program in controlling each identified threat.
9.1 – 9.6
§192.1007 (e) (1) Measure performance, monitor results, and evaluate effectiveness. …. An operator must consider the results of its performance monitoring in periodically re-evaluating the threats and risks.
10.2
§192.1007 (f) Periodic Evaluation and Improvement. An operator must re-evaluate threats and risks on its entire pipeline and consider the relevance of threats in one location to other areas.
7.1, 10.1
§192.1007 (f) Each operator must determine the appropriate period for conducting complete program evaluations based on the complexity of its system and changes in factors affecting the risk of failure. The operator must conduct a complete program reevaluation at least every five years. The operator must consider the results of the performance monitoring in these evaluations.
10.2
§192.1007 (g) Report results. Report, on an annual basis, the four measures listed in paragraphs (e)(1)(i) through (e)(1)(iv) of this section, as part of the annual report required by § 191.11. An operator also must report the four measures to the state pipeline safety authority if a state exercises jurisdiction over the operator’s pipeline.
11.1
§192.1009 Each operator must report, on an annual basis, information related to failure of mechanical fittings, excluding those that result only in nonhazardous leaks, as part of the annual report required by §191.11 beginning with the report submitted March 15, 2011. This information must include, at a minimum, location of the failure in the system, nominal pipe size, material type, nature of failure including any contribution of local pipeline environment, coupling manufacturer, lot number and date of manufacture, and other information that can be found in markings on the failed coupling. An operator also must report this information to the state pipeline safety authority if a state exercises jurisdiction over the operator’s pipeline.
11.1
§192.1011 An operator must maintain records demonstrating compliance with the requirements of this subpart for at least 10 years. The records must include copies of superseded integrity management plans developed under this subpart.
12.0
The Naragansett Electric Company d/b/a/ National Grid FY 2016 Gas ISR Risk Assessment Docket 4540 - Attachment 1-1 Page 121 of 122

Sept 01, 2015 RI-48 Appendix G
49 CFR Part 192, Subpart P DIM Plan Reference
§192.1013 (a) An operator may propose to reduce the frequency of periodic inspections and tests required in this part on the basis of the engineering analysis and risk assessment required by this subpart. (b) An operator must submit its proposal to the PHMSA Associate Administrator for Pipeline Safety or, in the case of an intrastate pipeline facility regulated by the State, the appropriate State agency. The applicable oversight agency may accept the proposal on its own authority, with or without conditions and limitations, on a showing that the operator’s proposal, which includes the adjusted interval, will provide an equal or greater overall level of safety. (c) An operator may implement an approved reduction in the frequency of a periodic inspection or test only where the operator has developed and implemented an integrity management program that provides an equal or improved overall level of safety despite the reduced frequency of periodic inspections.
Not covered by DIM Plan
§192.1015 (a) (a) General. No later than August 2, 2011 the operator of a master meter system or a small LPG operator must develop and implement an IM program that includes a written IM plan as specified in paragraph (b) of this section. The IM program for these pipelines should reflect the relative simplicity of these types of pipelines. (b) Elements. A written integrity management plan must address, at a minimum, the following elements: (1) Knowledge. The operator must demonstrate knowledge of its pipeline, which, to the extent known, should include the approximate location and material of its pipe-line. The operator must identify additional information needed and provide a plan for gaining knowledge over time through nor-mal activities conducted on the pipeline (for example, design, construction, operations or maintenance activities). (2) Identify threats. The operator must consider, at minimum, the following categories of threats (existing and potential): Corrosion, natural forces, excavation damage, other outside force damage, material or weld failure, equipment failure, and incorrect operation.(3) Rank risks. The operator must evaluate the risks to its pipeline and estimate the relative importance of each identified threat. (4) Identify and implement measures to mitigate risks. The operator must determine and implement measures designed to reduce the risks from failure of its pipeline. (5) Measure performance, monitor results, and evaluate effectiveness. The operator must monitor, as a performance measure, the number of leaks eliminated or repaired on its pipe-line and their causes. (6) Periodic evaluation and improvement. The operator must determine the appropriate period for conducting IM program evaluations based on the complexity of its pipeline and changes in factors affecting the risk of failure. An operator must re-evaluate its entire pro-gram at least every five years. The operator must consider the results of the performance monitoring in these evaluations. (c) Records. The operator must maintain, for a period of at least 10 years, the following records: (1) A written IM plan in accordance with this section, including superseded IM plans; (2) Documents supporting threat identification; and (3) Documents showing the location and material of all piping and appurtenances that are installed after the effective date of the operator's IM program and, to the extent known, the location and material of all pipe and appurtenances that were existing on the effective date of the operator's program.
2.0
The Naragansett Electric Company d/b/a/ National Grid FY 2016 Gas ISR Risk Assessment Docket 4540 - Attachment 1-1 Page 122 of 122

Gas Work Method Doc.# ENG04030
Design of Mains and Distribution Systems Page 1 of 7 Identification, Evaluation and Prioritization of Distribution Main Segments for Replacement
Revision 2 – 09/15/2015
PRINTED COPIES ARE NOT DOCUMENT CONTROLLED. © National Grid Gas plc 2015– All Rights Reserved FOR THE LATEST AUTHORIZED VERSION PLEASE REFER TO THE APPROPRIATE DEPARTMENT WEBSITE OR DOCUMENTUM™.
FILE: ENG04030 Identification, Evaluation and Prioritization of Distribution Main Segments for Replacement
ORIGINATING DEPARTMENT: STANDARDS, POLICIES AND CODES
SPONSOR: ROSS TURRINI
Identification, Evaluation and Prioritization of Distribution Main Segments for Replacement ENG04030Purpose
1. Purpose
This procedure describes and details the identification, evaluation, and prioritization of distribution main segments for replacement, and prescribes methods to be used for corrective action.
Potential areas of active corrosion are identified using leakage surveys in conjunction with an analysis of the corrosion and leak history records.
2. Responsibilities
Distribution Engineering or designee shall be responsible to: Gather and evaluate gas facility and leak data, and determine required calculations. Determine qualification and prioritization procedure and remedial action for active corrosion,
non-active continuing corrosion, and other systemic integrity issues.
Main and Service Replacement or designee shall be responsible for: Identifying main segments for replacement and prioritizing them according to this procedure.
3. Personal & Process Safety
All required PPE shall be worn or utilized in accordance with the current National Grid Safety Policy when performing tasks associated with this document.
4. Operator Qualification Required Tasks [Qualified or Directed & Observed]
None
5. Content
5.1 Identification of Main Segments for Replacement a. Main segment candidates are identified through four avenues:
1) Field Requests, which will be reviewed throughout the year. 2) Mains located in Public Improvement Job Areas, which will also be reviewed throughout
the year, as requested by Field Operations and/or Public Works employees. 3) Annual screenings by Main and Service Engineering, as deemed appropriate. Screenings
will vary among the regions, based on the data and tools available for the systems. 4) Lab failure analysis reports reviewed by Distribution Engineering for systemic issues. 5) IM prioritization factor as found in National Grid’s Distribution Integrity Management
Program (DIMP) listed in attachment 1.
IM factor is applied in order to help accelerate the attrition of mains which belong to an asset group which is known to have a higher likelihood of incident or is of a high relative risk.
6) b. All identified main segment candidates shall be evaluated and prioritized by Main and Service
Engineering in accordance with the criteria set forth in this procedure. Minimum segment lengths for screening and engineering review will vary among the regions; however, no
The Naragansett Electric Company d/b/a/ National grid FY 2016 Gas ISR Risk Assessment Docket 4540 -Attachment 1-2 Page 1 of 7

Gas Work Method Doc.# ENG04030
Design of Mains and Distribution Systems Page 2 of 7 Identification, Evaluation and Prioritization of Distribution Main Segments for Replacement
Revision 2 – 09/15/2015
PRINTED COPIES ARE NOT DOCUMENT CONTROLLED. © National Grid Gas plc 2015– All Rights Reserved FOR THE LATEST AUTHORIZED VERSION PLEASE REFER TO THE APPROPRIATE DEPARTMENT WEBSITE OR DOCUMENTUM™.
FILE: ENG04030 Identification, Evaluation and Prioritization of Distribution Main Segments for Replacement
ORIGINATING DEPARTMENT: STANDARDS, POLICIES AND CODES
SPONSOR: ROSS TURRINI
Engineering review is required for O&M replacements up to 50 feet. Segments identified by Distribution Engineering for systemic integrity issues will be replaced and prioritized as determined appropriate by Distribution Engineering.
5.2 Evaluation/Prioritization of Steel Main Segments for Replacement a. Data Collection - Minimum Data Required:
1) All Repaired Corrosion Leaks on Main Segment for the last 10 years 2) All repaired corrosion leaks on services for last 10 years. (In order to consider service
leaks in main prioritization calculation, there should be main leaks) 3) All Open Leaks that are believed to be on the actual Main Segment
b. For all applicable leaks, the following data is required: 1) Leak Number 2) Date (date found for open leaks, date repaired for repaired leaks) 3) Leak Class (original class for open leaks, repaired class for repaired leaks) 4) For repaired leaks, the following additional data is also required:
i. Number of Clamps Installed to Repair and specific clamp locations ii. Condition of Main When Repaired iii. Address Based Leak Location iv. Length of segment exhibiting significant leak activity (i.e. from first leak to last leak). v. Building Types in Area of Main Segment (None, Single Family Houses, Small
Buildings, Public Buildings) c. Calculate a main deterioration factor (“D”) using the formula:
D = N x 500 / L(calc)
Where: L(calc) = Length of Segment exhibiting significant leak activity (i.e. first leak to last leak).
The segment length used in calculations is not necessarily the total length being considered for replacement. “L” should be determined by the evaluating engineer as the length of the segment exhibiting significant leak activity. In no case should the length used for calculations extend beyond the locations of the leaks).
and
N = Repair Factor (within the defined “Lcalc”).
1) If the leak was repaired with 1 clamp, by another method, is still open, or associated service corrosion leak repair, N=1
2) If the leak was repaired with 2-3 clamps, N=2 3) If the leak was repaired with 4-5 clamps, N=3 4) If the leak was repaired with 6-7 clamps, N=4 5) If the leak was repaired with >7 clamps, N=5
The Naragansett Electric Company d/b/a/ National grid FY 2016 Gas ISR Risk Assessment Docket 4540 -Attachment 1-2 Page 2 of 7

Gas Work Method Doc.# ENG04030
Design of Mains and Distribution Systems Page 3 of 7 Identification, Evaluation and Prioritization of Distribution Main Segments for Replacement
Revision 2 – 09/15/2015
PRINTED COPIES ARE NOT DOCUMENT CONTROLLED. © National Grid Gas plc 2015– All Rights Reserved FOR THE LATEST AUTHORIZED VERSION PLEASE REFER TO THE APPROPRIATE DEPARTMENT WEBSITE OR DOCUMENTUM™.
FILE: ENG04030 Identification, Evaluation and Prioritization of Distribution Main Segments for Replacement
ORIGINATING DEPARTMENT: STANDARDS, POLICIES AND CODES
SPONSOR: ROSS TURRINI
THE SUM OF ALL THE “N”s FOR EACH LEAK IS PLUGGED INTO THE FORMULA
This method estimates the deterioration according to the actual number of physical repairs and normalizes it for the length of the segment.
d. Calculate an incident probability factor (“P”) using the formula:
P = {[(# Class1 Leaks/0.5) + (# Class2A Leaks/1.5) + (# Class2 Leaks/2) + (# Class3 Leaks/3)] x 500} / L(calc)
This method estimates public safety incident probability by weighting each leak based on how far the gas migrated toward buildings, again normalized according to the segment length. (Note – If leak class is unknown, Class 2A will be assumed).
e. Calculate a risk factor (“R”) using the formula:
R = P x C
Where: P = Probability Factor Calculated in previous step. C = Consequence Factor
1) If there are no buildings in the area, C = 0 2) If there are only single family homes, C = 1 3) If there are small buildings (multi-family, strip mall, etc), C = 1.2 4) If there are public buildings (school, church, hospital, etc) C = 1.5
This is the standard Risk Analysis calculation where Risk is defined as the product of the likelihood of an event and the potential consequence of that event. Consequences increase with building size and number of people affected.
f. Calculate the preliminary prioritization factor (“Pr”) using the formula:
Pr = D + R + IM
Where: D = Deterioration Factor Calculated in ”c”. R = Risk Factor Calculated in ”e”.
The prioritization calculation takes into account both the deterioration of the main and the risk to public safety.
g. The following adjustments may be needed: 1) Before making a final determination and prioritization of a main segment replacement, the
details of the job are reviewed and “engineering judgment” is applied where appropriate. This application may result in the following types of adjustments: i. Changing the priority of the job
The Naragansett Electric Company d/b/a/ National grid FY 2016 Gas ISR Risk Assessment Docket 4540 -Attachment 1-2 Page 3 of 7

Gas Work Method Doc.# ENG04030
Design of Mains and Distribution Systems Page 4 of 7 Identification, Evaluation and Prioritization of Distribution Main Segments for Replacement
Revision 2 – 09/15/2015
PRINTED COPIES ARE NOT DOCUMENT CONTROLLED. © National Grid Gas plc 2015– All Rights Reserved FOR THE LATEST AUTHORIZED VERSION PLEASE REFER TO THE APPROPRIATE DEPARTMENT WEBSITE OR DOCUMENTUM™.
FILE: ENG04030 Identification, Evaluation and Prioritization of Distribution Main Segments for Replacement
ORIGINATING DEPARTMENT: STANDARDS, POLICIES AND CODES
SPONSOR: ROSS TURRINI
ii. Increasing or decreasing the job length/scope iii. Breaking the job into smaller segments iv. Merging several segments into one job
2) These adjustment may be made based on the following types of information, if available and applicable: i. Analysis of the age of the leaks and any increasing frequency of leak occurrences ii. Pipe vintage and service insert activity associated with the main iii. Service leaks at the main connection due to corrosion iv. Adjustments based on very long or very short segments v. Observed pipe condition from leak repair data vi. Observed pipe condition from recent field exposure vii. Clustering of repairs and/or clamps along the segment viii. Other replacement jobs in the vicinity ix. Cathodic protection systems in place x. Specific locations of intersections, fittings, material transitions, diameter transitions,
etc. xi. Customer complaints, Executive complaints, Regulatory Agency complaints xii. Corporate good will xiii. Unusual hazards or exposure in the area xiv. Proximity to gas regulating equipment xv. Proximity to transmission main xvi. Unusual difficulty or expense of repairs xvii. Main location xviii. Identification of outdated construction methods or problematic materials or fittings xix. Depth of cover and soil conditions xx. High open leak counts xxi. Water intrusion or other geographic considerations xxii. Any special or unusual conditions or considerations identified by Field Operations xxiii. Any other safety, integrity, operational or economic factors that are available and
deemed appropriate
Segments that qualify based on their preliminary prioritization calculation may not be disqualified by adjustments.
h. Qualification of job for replacement: 1) Jobs will be approved and prioritized based on the calculated Prioritization Factor “Pr” and
applied adjustments. Enough jobs should be approved to accommodate the replacement levels determined by the model(s) in use at the time.
Some jobs will be mandatory to replace.
The Naragansett Electric Company d/b/a/ National grid FY 2016 Gas ISR Risk Assessment Docket 4540 -Attachment 1-2 Page 4 of 7

Gas Work Method Doc.# ENG04030
Design of Mains and Distribution Systems Page 5 of 7 Identification, Evaluation and Prioritization of Distribution Main Segments for Replacement
Revision 2 – 09/15/2015
PRINTED COPIES ARE NOT DOCUMENT CONTROLLED. © National Grid Gas plc 2015– All Rights Reserved FOR THE LATEST AUTHORIZED VERSION PLEASE REFER TO THE APPROPRIATE DEPARTMENT WEBSITE OR DOCUMENTUM™.
FILE: ENG04030 Identification, Evaluation and Prioritization of Distribution Main Segments for Replacement
ORIGINATING DEPARTMENT: STANDARDS, POLICIES AND CODES
SPONSOR: ROSS TURRINI
2) In general, a condition of “Active Corrosion” will be determined when the preliminary Prioritization Factor (“Pr”) calculation is equal to or greater than 15 (Pr ≥15).
3) Each region will be further responsible for declaring jobs as “Active Corrosion” by modifying this criterion based on specific regional operating conditions as required, in order to comply with any more stringent definitions provided by the regulators in the State(s) in which the region operates.
4) Any unprotected bare steel main containing “Active Corrosion” must be replaced within two years in NY and three years in MA – unless extenuating circumstances make it unfeasible to do so, in which case, other appropriate mitigative measures are to be taken ( Conduct a leakage survey of the segment once a year as a minimum).
5) Any unprotected coated steel main containing “Active Corrosion” must have cathodic protection engineered and installed within one year or be replaced within two years in NY and three years in MA - unless extenuating circumstances make it unfeasible to do so, in which case, other appropriate mitigative measures are to be taken (Conduct a leakage survey of the segment once a year as a minimum) .
6) Any cathodically protected main containing “Active Corrosion” must be brought up to acceptable cathodic protection within one year or replaced within two years in NY and three years in MA - unless extenuating circumstances make it unfeasible to do so (An example of such a circumstance may be when a street is under guarantee or a moratorium from excavation), in which case, other appropriate mitigative measures are to be taken. (Conduct a leakage survey of the segment once a year as a minimum).
7) In NYC and LI, another label is given to each job to provide a macro view as to the type of work to be performed throughout the year. i. A “TS 300” label is associated with any job with a preliminary Prioritization Factor
(“Pr”) calculation of 15 or more (Pr ≥ 15), known as “Active Corrosion”. This label is also given to both cast iron and plastic jobs, however it is known that main segment is not actively corroding and there is no mandated timetable to replace.
ii. A TS 900 label is given to any job which has received additional points from Public Works considerations (as described below).
iii. A TS 800 label is given to the remainder of the jobs in which the preliminary Prioritization Factor (“Pr”) calculation is less than 15 (Pr < 15) and will be replaced according to resources and replacement level recommendations.
i. Impact Identification: 1) Every approved job should be processed through the Planning and Corrosion areas of
Gas Systems Engineering for: i. Sizing (determining the appropriate replacement material and diameter). ii. Determining if the replacement will have any impact on existing cathodic protection
systems. iii. Determining if abandonment is an appropriate option over replacement. iv. Determining if a system uprating is an appropriate option as part of the replacement.
5.3 Evaluation/prioritization of cast iron main segments for replacement
The Naragansett Electric Company d/b/a/ National grid FY 2016 Gas ISR Risk Assessment Docket 4540 -Attachment 1-2 Page 5 of 7

Gas Work Method Doc.# ENG04030
Design of Mains and Distribution Systems Page 6 of 7 Identification, Evaluation and Prioritization of Distribution Main Segments for Replacement
Revision 2 – 09/15/2015
PRINTED COPIES ARE NOT DOCUMENT CONTROLLED. © National Grid Gas plc 2015– All Rights Reserved FOR THE LATEST AUTHORIZED VERSION PLEASE REFER TO THE APPROPRIATE DEPARTMENT WEBSITE OR DOCUMENTUM™.
FILE: ENG04030 Identification, Evaluation and Prioritization of Distribution Main Segments for Replacement
ORIGINATING DEPARTMENT: STANDARDS, POLICIES AND CODES
SPONSOR: ROSS TURRINI
a. Cast Iron Main Segments will be evaluated in a similar manner as Steel Main segments, where the Prioritization factor will be the sum of the Deterioration Factor,Risk factor and DIMP factor (Pr = D + R + IM).
b. Candidates are reviewed based primarily on breakage and/or graphitization history; and all segments that contain 2 or more breaks and/or graphitization repairs within 400 ft. must be reviewed.
c. If the candidate segment has had 2 or more breaks and/or graphitization repairs within 400 ft. and the MAOP is greater than six inches of water column – the segment has automatic approval for replacement. The Prioritization score will automatically be set at 15 (TS300)
d. If the candidate segment doesn’t have at least 2 breaks and/or graphitization repairs or if the pressure is six inches of water column or less – approval will be based on the Prioritization calculation
i. If “Pr” is equal to or greater than 15 (Pr ≥ 15), replacement will be required (however, a cast iron segment is not deemed active corrosion)
ii. If “Pr” is less than 15 (Pr < 15), prioritize and replace according to resources and replacement level recommendations
e. The Repair Factor “N” (as defined 5.2 – c for steel evaluation), will be assigned for each leak, as follows:
1) For cast iron – main breaks, graphitization (corrosion of cast iron) and joint leak repairs are examined.
i. If the leak is still open or associated service corrosion leak repair, N = 1 ii. If the leak was repaired only by joint sealing, N = 0.5 iii. If the leak was a break,crack or graphitization, N = 3
f. Engineering judgment should also be applied to both the prioritization and determination of the
segment length to be replaced based on the pressure, diameter, dates of failures, surrounding areas, etc.
5.4 Evaluation/prioritization of plastic main segments for replacement
a. Vintage Plastic Main Segments shall be evaluated by Distribution Engineering based on Lab Failure Analysis Reports that are reviewed for systemic issues.
I. If Distribution Engineering determines that a systemic issue exists in a specific main segment due to improper fusion or other construction defects, the entire affected section of main will be forwarded to Main and Service Replacement Group for prioritization and expedited replacement.
b. Plastic Main Segments (including non-vintage plastic) will be evaluated in a similar manner as Steel Main segments, where the Prioritization factor will be the sum of the Deterioration Factor, Risk factor and DIMP factor (Pr = D + R + IM).
c. For plastic pipe segments in “b”, above, the following criteria shall apply: 1) For plastic – previous squeeze-offs, point loading failures (e.g. – rock impingement) and
material defects (e.g. – cracking) and construction defect failures (e.g. – butt fusion joint) are examined.
Where:
The Naragansett Electric Company d/b/a/ National grid FY 2016 Gas ISR Risk Assessment Docket 4540 -Attachment 1-2 Page 6 of 7

Gas Work Method Doc.# ENG04030
Design of Mains and Distribution Systems Page 7 of 7 Identification, Evaluation and Prioritization of Distribution Main Segments for Replacement
Revision 2 – 09/15/2015
PRINTED COPIES ARE NOT DOCUMENT CONTROLLED. © National Grid Gas plc 2015– All Rights Reserved FOR THE LATEST AUTHORIZED VERSION PLEASE REFER TO THE APPROPRIATE DEPARTMENT WEBSITE OR DOCUMENTUM™.
FILE: ENG04030 Identification, Evaluation and Prioritization of Distribution Main Segments for Replacement
ORIGINATING DEPARTMENT: STANDARDS, POLICIES AND CODES
SPONSOR: ROSS TURRINI
N = Repair Factor (within the defined “L”)
i. If the leak is still open, N = 1 ii. If the leak was the result of an improper squeeze-off, N = 2 x (the number known
squeeze-offs on ALDYL-A pre 1985 pipe) iii. If the leak was the result of a point loading failure, N = 2 iv. If the leak was a the result of a construction defect or material defect, N = 3 v.
5.5 Reinforcements and Jobs in public improvement areas
a. Additional adjustments may be applied for candidate segments in public works areas or for which reinforcement opportunities have been identified - by the addition of a Public Works (PW) and/or Reinforcement (RI) factor to the Prioritization calculation:
Pr = D + R + PW + RI
1) For Road Resurfacing, PW = 2.4 2) For Road Reconstruction, PW = 4.2 3) For Size-Pressure Upgrade Reinforcement, RI = 2.5
These factors are applied because of potential cost savings in combining main replacements with other work, as well as anticipated avoidance of performing work on protected streets that were recently improved.
.
a.
6. Knowledge Base & References (Click here)
Knowledge Base References 1 - Compliance History 5 - Job Aid 1 - Regulatory – Codes 2 - Data Capture 6 - Learning & Development 2 - Technical Documents 3 - Definitions 7 - Standard Drawings 3 - Tools Catalog 4 - Document History 8 - Tools & Equipment
7. Attachments
Attachment 1: DIMP Factor List 2014
The Naragansett Electric Company d/b/a/ National grid FY 2016 Gas ISR Risk Assessment Docket 4540 -Attachment 1-2 Page 7 of 7

2014 SYSTEM INTEGRITY REPORT
RI
Irfaan Ally, Sr. Engineer Gas Distribution Engineering
Network Strategy – Gas Systems Engineering
CONTACT: Mohammad A Islam (516) 545-2363 Sr. Engineer – Gas Distribution Engineering
Saadat Khan (516) 807-2335 Manager – Gas Distribution Engineering
Enterprise
Gas Distribution Systems
Trend-Based Integrity Analysis
The Naragansett Electric Company d/b/a/ National Grid FY 2016 Gas ISR Risk Assessment Docket 4540 - Attachment 1-3 Page 1 of 64

2014 SYSTEM INTEGRITY REPORT
1
LEAK
MANAGEMENT
ANALYSIS
The Naragansett Electric Company d/b/a/ National Grid FY 2016 Gas ISR Risk Assessment Docket 4540 - Attachment 1-3 Page 2 of 64

2014 SYSTEM INTEGRITY REPORT
2
TOTAL LEAK RECEIPTS
3061 3273
2639
3134
3652
2624 2502 2417
2252
2753
0
1000
2000
3000
4000
5000
2005 2006 2007 2008 2009 2010 2011 2012 2013 2014
Nu
mb
er o
f L
ea
ks
Year
RI
INCLUDES ALL TYPE 1, 2A, 2 and 3 LEAKS DISCOVERED - EXCLUDING DAMAGES
The Naragansett Electric Company d/b/a/ National Grid FY 2016 Gas ISR Risk Assessment Docket 4540 - Attachment 1-3 Page 3 of 64

2014 SYSTEM INTEGRITY REPORT
3
TOTAL LEAK RECEIPTS
12527 12087
10313 9721 10292 8640
9539 8508 8064
10134
8749 8311 7720 7318
9480 8384 7946
5979 6424 7248
3061 3273 2639 3134 3652 2624 2502 2417 2252 2753
24337 23671
20672 20173
23424
19648 19987
16904 16740
20135
0
6000
12000
18000
24000
30000
2005 2006 2007 2008 2009 2010 2011 2012 2013 2014
Nu
mb
er o
f L
ea
ks
Year
NY State
MA
RI
US-NGrid
INCLUDES ALL TYPE 1, 2A, 2 and 3 LEAKS DISCOVERED - EXCLUDING DAMAGES
The Naragansett Electric Company d/b/a/ National Grid FY 2016 Gas ISR Risk Assessment Docket 4540 - Attachment 1-3 Page 4 of 64

2014 SYSTEM INTEGRITY REPORT
Average Monthly Temperature
4
0
5
10
15
20
25
30
35
40
45
50
Dec Jan Feb Mar
2009
2010
2012
2011
2013
2014
2015
Tem
per
atu
re (
F)
The Naragansett Electric Company d/b/a/ National Grid FY 2016 Gas ISR Risk Assessment Docket 4540 - Attachment 1-3 Page 5 of 64

2014 SYSTEM INTEGRITY REPORT
5
Company
46% Public
54%
Company
63%
Public
37%
RI
2014 LEAK RECEIPTS
BY DISCOVERY SOURCE (EXCLUDING DAMAGES)
Company
34% Public
66%
NY State
US-NGrid
Company
57% Public
43%
MA State
The Naragansett Electric Company d/b/a/ National Grid FY 2016 Gas ISR Risk Assessment Docket 4540 - Attachment 1-3 Page 6 of 64

2014 SYSTEM INTEGRITY REPORT
6
2005 - 2014 LEAK RECEIPTS
By Discovery Source (Excluding damages) 22
14
2572
1965
2540
2510
1578
1559
1422
1238
1730
847
701
674
594
1142
1046
943
995
1014
1023
0
1000
2000
3000
4000
Nu
mb
er
of
Le
ak
s
Company
Public
The Naragansett Electric Company d/b/a/ National Grid FY 2016 Gas ISR Risk Assessment Docket 4540 - Attachment 1-3 Page 7 of 64

2014 SYSTEM INTEGRITY REPORT
7
Total Leaks Receipts
COMPARISON BY SOURCE Leaks
Discovered
625
519 483
922
746
867
760 706
853
648
828
667 696
499 454
506
423
0
100
200
300
400
500
600
700
800
900
1000
2011Q1
2012Q1
2013Q1
2014Q1
2015Q1
2011Q2
2012Q2
2013Q2
2014Q2
2011Q3
2012Q3
2013Q3
2014Q3
2011Q4
2012Q4
2013Q4
2014Q4
Winter Patrol
Walking Survey
Re-check
Public
Mobile Survey
Manhole Inspections
Facility Locating
The Naragansett Electric Company d/b/a/ National Grid FY 2016 Gas ISR Risk Assessment Docket 4540 - Attachment 1-3 Page 8 of 64

2014 SYSTEM INTEGRITY REPORT
8
Total Leaks Receipts
COMPARISON BY Facility Leaks
Discovered
625
519 483
922 867
760 726
853
648
828
667 696
499 454
506 496
0
100
200
300
400
500
600
700
800
900
1000
2011Q1
2012Q1
2013Q1
2014Q1
2011Q2
2012Q2
2013Q2
2014Q2
2011Q3
2012Q3
2013Q3
2014Q3
2011Q4
2012Q4
2013Q4
2014Q4
Main
Main/Service
Service
The Naragansett Electric Company d/b/a/ National Grid FY 2016 Gas ISR Risk Assessment Docket 4540 - Attachment 1-3 Page 9 of 64

2014 SYSTEM INTEGRITY REPORT
781 892 889 1142
1511 1074 1005
792 922 1,150
14 20 37
155
227
120 135 154 79
89
1650 1484 1101
862
887
573 503 512 370
577
616 877
615
975
1027
857 859
959 881
937
3061 3273
2642
3134
3652
2624 2502 2417 2252
2753
0
1000
2000
3000
4000
5000
2005 2006 2007 2008 2009 2010 2011 2012 2013 2014
Nu
mb
er
of
Le
ak
s
Years
Type 3
Type 2
Type 2A
Type 1
9
LEAK RECEIPTS By ORIGINAL Type
(Excluding damages)
The Naragansett Electric Company d/b/a/ National Grid FY 2016 Gas ISR Risk Assessment Docket 4540 - Attachment 1-3 Page 10 of 64

2014 SYSTEM INTEGRITY REPORT
970 1053 1104 1267 1506
1240 1113 921
1087 1,210
0 0 3
172
246
179 171
172 68
160
1492 1349 1455
1275
1442
860
702
651 383
522
221 260
380 483
481
300
407 486
286
162
2683 2662 2942
3197
3675
2579 2393
2230
1824 2054
0
1000
2000
3000
4000
2005 2006 2007 2008 2009 2010 2011 2012 2013 2014
Nu
mb
er
of
Le
ak
s
Years
Type 3
Type 2
Type 2A
Type 1
10
LEAKS REPAIRED By REPAIRED Type
(Including damages)
The Naragansett Electric Company d/b/a/ National Grid FY 2016 Gas ISR Risk Assessment Docket 4540 - Attachment 1-3 Page 11 of 64

2014 SYSTEM INTEGRITY REPORT
11
YEAR-END WORKABLE LEAK BACKLOGS
829
1076
787
264
77 15 33 54 26 38
0
300
600
900
1200
1500
2005 2006 2007 2008 2009 2010 2011 2012 2013 2014
Nu
mb
er o
f L
eak
s
Year
RI
The Naragansett Electric Company d/b/a/ National Grid FY 2016 Gas ISR Risk Assessment Docket 4540 - Attachment 1-3 Page 12 of 64

2014 SYSTEM INTEGRITY REPORT
12
YEAR-END WORKABLE LEAK BACKLOGS US NGrid
360 349 226
149
135 47 30 54 20
37
919
856
797
196 178 197 205 161 176 212
829
1076
787
264
77 15 33 54 26 38
2108 2281
1810
609
390 259 268 269 222 287
0
600
1200
1800
2400
3000
2005 2006 2007 2008 2009 2010 2011 2012 2013 2014
Nu
mb
er o
f L
eak
s
Year
NY
MA
RI
US-NGrid
The Naragansett Electric Company d/b/a/ National Grid FY 2016 Gas ISR Risk Assessment Docket 4540 - Attachment 1-3 Page 13 of 64

2014 SYSTEM INTEGRITY REPORT
13
1093
1784
1997
2652 2613 2737
2841 2988
3306
3087
0
800
1600
2400
3200
4000
2005 2006 2007 2008 2009 2010 2011 2012 2013 2014
Nu
mb
er o
f L
eak
s
Year
RI
YEAR-END OPEN TYPE 3
The Naragansett Electric Company d/b/a/ National Grid FY 2016 Gas ISR Risk Assessment Docket 4540 - Attachment 1-3 Page 14 of 64

2014 SYSTEM INTEGRITY REPORT
14
US NGrid
13094
15204 16211
17623 19260 18701 19352 19291 18541
17077
13564 13352 13119 12935 12963 12867 12942 12294 12415 11341
1093 1784 1997 2652 2613 2737 2841 2988 3306 3087
27751
30340 31327
33210 34836 34305 35135 34573 34262
31505
0
8000
16000
24000
32000
40000
2005 2006 2007 2008 2009 2010 2011 2012 2013 2014
Nu
mb
er o
f L
eak
s
Year
NY
MA
RI
US-NGrid
YEAR-END OPEN TYPE 3
The Naragansett Electric Company d/b/a/ National Grid FY 2016 Gas ISR Risk Assessment Docket 4540 - Attachment 1-3 Page 15 of 64

2014 SYSTEM INTEGRITY REPORT
15
MAIN
INVENTORY
ANALYSIS
The Naragansett Electric Company d/b/a/ National Grid FY 2016 Gas ISR Risk Assessment Docket 4540 - Attachment 1-3 Page 16 of 64

2014 SYSTEM INTEGRITY REPORT
PROT'D
STEEL
39%
UNPROT
STEEL
5%
CAST
IRON
2%
PLASTIC
54%
OTHER
0%
16
PROT'D
STEEL
595
19%
UNPROT'D
STEEL
483
15%
CAST
IRON
806
25%
PLASTIC
1,287
40%
OTHER
16
1%
PROT'D
STEEL
2,649
24%
UNPROT'D
STEEL
1,372
12%
CAST
IRON
2,127
19%
PLASTIC
4,916
45%
PROT'D
STEEL
5,832
28%
UNPROT'D
STEEL
3,686
18%
CAST
IRON
2,426
12%
PLASTIC
8,764
42%
MA
National Grid-US
11,064 MILES
34,960 MILES
PROT'D
STEEL
9,076
26%
UNPROT'
D STEEL
5,541
16%
CAST
IRON
5,358
15%
PLASTIC
14,968
43%
OTHER
16
0%
NY 20,708 MILES
Rhode Island 3,188 MILES
SUMMARY – All States
MAIN INVENTORY
2013 PHMSA Average
The Naragansett Electric Company d/b/a/ National Grid FY 2016 Gas ISR Risk Assessment Docket 4540 - Attachment 1-3 Page 17 of 64

2014 SYSTEM INTEGRITY REPORT
17
NATIONAL GRID MAIN REPLACEMENT
1. Leaks per mile of total main excludes Excavation leaks. 2. Leaks per mile of Leak-Prone main (LPP) excludes Excavation leaks and Plastic leaks. (Also, all non-Excavation Steel leaks are assumed to have occurred on Unprotected Steel) 3. Leak-Prone Pipe = Unprotected steel (Bare & Coated) + CI/WI + Aldyl-A (MD, 1985 and prior) + Other. 4. Miles of Leak-Prone main replaced includes all Proactive programs ( Main Replacement program & System Reinforcement) and all
Reactive programs (Public Works, Water Intrusion & Leak/reactive). 5. Annual planned and actual replacement miles are CY. 6. Data sources are 2014 & 2015 US Gas Leak Prone Pipe Replacement Programs monthly reports from Gas Resource Management CMS.
Note:
Region
2014 Total Main
(Miles)
2014 Leak Prone
Main (Miles)
Leaks/Miles of Total
Main (Repair rate)
Leaks/Miles of Leak
Prone Main (Repair rate)
(5) 2014
Annual "Planned"
Replacement (Miles)
Planned Replacement % of Leak
prone system
(5) 2014
Annual "Actual"
Replacement (Miles)
Actual Replacement % of Leak
prone system
(5) 2015
Annual "Planned"
Replacement (Miles)
Years to LPP Main
Elimination based on
"Current" annual plan
NYC 4,134 1,900 0.75 1.57 43.0 2.3% 42.8 2.3% 42.0 45 LI 7,931 3,860 0.13 0.25 62.0 1.6% 51.5 1.3% 80.8 48 Upstate NY 8,643 757 0.08 0.85 43.0 5.7% 42.0 5.5% 43.1 17
RI 3,188 1,305 0.37 0.84 64.1 4.9% 28.8 2.2% 71.5 17
BGC & EGC 7,206 3,236 0.71 1.53 142.0 4.4% 110.0 3.4% 146.6 22
CCC & CLW 3,858 263 0.06 0.79 52.8 20.1% 48.6 18.5% 48.6 5
Rate Case Supported “Leak-Prone” Main Replacement Levels
The Naragansett Electric Company d/b/a/ National Grid FY 2016 Gas ISR Risk Assessment Docket 4540 - Attachment 1-3 Page 18 of 64

2014 SYSTEM INTEGRITY REPORT
18
MAIN LEAK
REPAIR
ANALYSIS
The Naragansett Electric Company d/b/a/ National Grid FY 2016 Gas ISR Risk Assessment Docket 4540 - Attachment 1-3 Page 19 of 64

2014 SYSTEM INTEGRITY REPORT
19
2139 2183 2273
2517
2656
1871
1716 1663
1102 1216
0
600
1200
1800
2400
3000
'05 '06 '07 '08 '09 '10 '11 '12 '13 '14
MAIN
LEAK
REPAIRS
YEAR
RI
TOTAL MAIN LEAK REPAIRS
INCLUDING Damages
The Naragansett Electric Company d/b/a/ National Grid FY 2016 Gas ISR Risk Assessment Docket 4540 - Attachment 1-3 Page 20 of 64

2014 SYSTEM INTEGRITY REPORT
20
6649 5977
5407
4265 4198 3965
4665
3441
3572
5063
8286
7146 6620 7083
8681
6424 6484
4831 4592 5471
2139 2183 2273 2517 2656
1871 1716 1663 1102 1216
17074
15306 14300
13865 15535
12260 12865
9935 9266
11750
0
4000
8000
12000
16000
20000
'05 '06 '07 '08 '09 '10 '11 '12 '13 '14
MAIN
LEAK
REPAIRS
YEAR
NY State
MA
RI
US - NGrid
TOTAL MAIN LEAK REPAIRS
NOTE: Cast Iron Leaks Count Total Individual Joint Repairs
INCLUDING Damages
The Naragansett Electric Company d/b/a/ National Grid FY 2016 Gas ISR Risk Assessment Docket 4540 - Attachment 1-3 Page 21 of 64

2014 SYSTEM INTEGRITY REPORT
21
CAST
IRON *
80%
PLASTIC
1%
ALL
STEEL
19%
PROT'D
STEEL
19%
UNPROT'D
STEEL
15%
CAST IRON
25%
PLASTIC
40%
OTHER
1%
TOTAL MAIN INVENTORY
BY MATERIAL
TOTAL MAIN LEAK REPAIRS
BY MATERIAL
2014 TOTAL
MAIN LEAKS REPAIRS
1,204 LEAKS (including damages) 3,188 MILES
NOTE: (*) CI Leaks include Other material Leaks. Leak Count Totals Individual Repairs.
The Naragansett Electric Company d/b/a/ National Grid FY 2016 Gas ISR Risk Assessment Docket 4540 - Attachment 1-3 Page 22 of 64

2014 SYSTEM INTEGRITY REPORT
675 701 601 732 661 653 578 499 544 605
0 0 2
157 219 160 142
141 47 121
1273 1251 1345
1189 1330
776
626 568
278
367
191 231 325
439 446
282
370 455
233
123
2139 2183 2273 2517
2656
1871 1716 1663
1102 1216
0
500
1000
1500
2000
2500
3000
2005 2006 2007 2008 2009 2010 2011 2012 2013 2014
Nu
mb
er
of
Le
ak
s
Years
Type 3
Type 2
Type 2A
Type 1
22
(Including damages)
LEAKS REPAIRED By REPAIRED Type MAIN
The Naragansett Electric Company d/b/a/ National Grid FY 2016 Gas ISR Risk Assessment Docket 4540 - Attachment 1-3 Page 23 of 64

2014 SYSTEM INTEGRITY REPORT
23
2005 -2014 MAIN LEAK REPAIRS
All Main Leak Repairs by Material
(Excluding damages)
1227 1238 1381 1382 1456
968 956 974 777
960
492 563
487 608
748
499 385
490
225
180
132 98
119
175
167
112
100
109
52
42
214 233
196
270
254
202
196 14
7
5
23 7
34
16
20
9
11 10
6
6
2088 2139 2217 2451
2645
1790 1648 1597
1067 1193
0
600
1200
1800
2400
3000
2005 2006 2007 2008 2009 2010 2011 2012 2013 2014
Other
Plastic
Coated Steel
Bare Steel
Cast Iron
NUMBER OF MAIN
LEAK REPAIRS
YEAR
The Naragansett Electric Company d/b/a/ National Grid FY 2016 Gas ISR Risk Assessment Docket 4540 - Attachment 1-3 Page 24 of 64

2014 SYSTEM INTEGRITY REPORT
24
MAIN LEAKS REPAIRED
COMPARISON BY LEAK CAUSES
LEAK REPAIRS
(Excluding damages)
1,06
7
47
51
0 0
118
1
855
1,01
2
30
44
2 0
138
0
957
922
85
56
2 1
141
1
1,06
5
843
55
66
5 0
154
1
1,39
3
768
5 11
0 2
45
0
1,82
5
482
19 81
0 7 35
3
1,24
4
299
53
68
1 0
39
2
1,25
4
357
22 66
1 1
86
0
1,13
0
228
54
35
1 3
49
0
732
222
131
23
4 15 49
0
772
0
500
1000
1500
2000
Corrosion Natural Forces Excavation Other OutsideForce
Material or Welds Equipment Operations Other
LEAK CAUSE
2005200620072008200920102011201220132014
The Naragansett Electric Company d/b/a/ National Grid FY 2016 Gas ISR Risk Assessment Docket 4540 - Attachment 1-3 Page 25 of 64

2014 SYSTEM INTEGRITY REPORT
25
MAIN LEAKS REPAIRED
COMPARISON BY LEAK CAUSES
LEAK REPAIRS
NGRID 5,
006
4,04
1
732
65
710
286
16
6,21
8
4,88
8
2,43
5
574
139 45
4
572
31
6,21
3
3,96
7
2,69
3
466
113
623
617
12
5,80
9
3,97
5
2,27
0
382
135
773
564
13
5,75
3
4,72
7
2,52
7
324
98
734
307
19
6,79
9
3,21
8
739
368
86
156
716
8
6,96
9
2,84
9
944
328
51
77
838
2
7,77
6
2,20
7
447
290
23
67
682
0
6,21
9
1,83
1
743
300
18
69
829
2
5,47
4
2,08
9
1,06
6
261
28
93
881
1
7,33
1
0
2000
4000
6000
8000
10000
Corrosion Natural Forces Excavation Other OutsideForce
Material or Welds Equipment Operations Other
LEAK CAUSE
2005200620072008200920102011201220132014
The Naragansett Electric Company d/b/a/ National Grid FY 2016 Gas ISR Risk Assessment Docket 4540 - Attachment 1-3 Page 26 of 64

2014 SYSTEM INTEGRITY REPORT
26
2014 MAIN LEAK “RATES”
Total Main Leak Repairs (incl. damages) / Mile of Total Main
0.24
0.49 0.38 0.34
0.0
0.2
0.4
0.6
0.8
1.0
NY MA RI NATIONAL GRID
NGRID MAIN LEAK RATES BY STATE
The Naragansett Electric Company d/b/a/ National Grid FY 2016 Gas ISR Risk Assessment Docket 4540 - Attachment 1-3 Page 27 of 64

2014 SYSTEM INTEGRITY REPORT
27
0.69 0.71
0.73
0.81
0.85
0.60
0.54 0.52
0.35 0.38
0.00
0.50
1.00
'05 '06 '07 '08 '09 '10 '11 '12 '13 '14
LE
AK
R
EP
AIR
S P
ER
T
OT
AL M
ILE
S O
F M
AIN
YEAR
RI
TOTAL MAIN LEAK “RATES”
COUNTING EACH INDIVIDUAL REPAIR AS A LEAK
INCLUDING Damages
PERCENTAGES SHOWN ARE PERCENT OF LEAK-PRONE PIPE
51% 52% 51%
50% 50%
47%
46% 44%
42% 40%
The Naragansett Electric Company d/b/a/ National Grid FY 2016 Gas ISR Risk Assessment Docket 4540 - Attachment 1-3 Page 28 of 64

2014 SYSTEM INTEGRITY REPORT
28
0.33 0.30
0.27
0.21 0.21 0.19
0.23
0.17 0.17
0.24
0.75
0.66
0.61
0.65
0.80
0.59
0.59
0.44
0.42
0.49
0.69
0.71 0.73
0.81
0.85
0.60
0.54
0.52
0.35 0.38
0.49
0.45
0.41 0.40
0.44
0.35 0.36
0.29 0.27
0.34
0.00
0.50
1.00
'05 '06 '07 '08 '09 '10 '11 '12 '13 '14
LE
AK
R
EP
AIR
S P
ER
T
OT
AL
M
IL
ES
O
F M
AIN
YEAR
NY
MA
RI
US-NGrid
TOTAL MAIN LEAK “RATES”
INCLUDING Damages
PERCENTAGES SHOWN ARE PERCENT OF LEAK-PRONE PIPE
37%
35% 36%
36%
33% 33%
32%
31%
37%
42%
41% 40% 38%
37%
36%
34%
51%
52% 51%
50% 50%
47%
46%
44%
38% 40% 39% 38%
37%
35%
33%
34%
30%
32%
33%
42%
30%
40%
32%
31%
The Naragansett Electric Company d/b/a/ National Grid FY 2016 Gas ISR Risk Assessment Docket 4540 - Attachment 1-3 Page 29 of 64

2014 SYSTEM INTEGRITY REPORT
1.33
0.49
0.24
0.68
1.36
0.53
0.25
0.69
1.53
0.49
0.21
0.71
1.54
0.63
0.28
0.78
1.65
0.75
0.25
0.85
1.10
0.51
0.19
0.57
1.09
0.42
0.18
0.52
1.13
0.53
0.01
0.50
0.93
0.25
0.01
0.34
1.18
0.21
0.00
0.37
0
0.5
1
1.5
2
2.5
3
CAST IRON ALL STEEL PLASTIC ALL MAINSMATERIAL
2005200620072008200920102011201220132014
29
MAIN LEAK “RATES”
COMPARISON BY MATERIAL
LEAK REPAIRS
PER MILE OF MAIN
EXCLUDING Damages
The Naragansett Electric Company d/b/a/ National Grid FY 2016 Gas ISR Risk Assessment Docket 4540 - Attachment 1-3 Page 30 of 64

2014 SYSTEM INTEGRITY REPORT
1.66
0.33
0.04
0.48
1.43
0.31
0.04
0.44
1.45
0.27
0.04
0.41
1.40
0.27
0.04
0.39
1.57
0.32
0.04
0.44
1.28
0.25
0.03
0.34
1.44
0.24
0.03
0.36
1.15
0.19
0.01
0.28
1.15
0.16
0.01
0.26
1.60
0.18
0.01
0.33
0
0.5
1
1.5
2
2.5
3
CAST IRON ALL STEEL PLASTIC ALL MAINSMATERIAL
2005200620072008200920102011201220132014
30
MAIN LEAK “RATES”
COMPARISON BY MATERIAL
LEAK REPAIRS
PER MILE OF MAIN
US-NGrid EXCLUDING Damages
The Naragansett Electric Company d/b/a/ National Grid FY 2016 Gas ISR Risk Assessment Docket 4540 - Attachment 1-3 Page 31 of 64

2014 SYSTEM INTEGRITY REPORT
31
A CLOSER LOOK AT
CAST IRON MAINS
The Naragansett Electric Company d/b/a/ National Grid FY 2016 Gas ISR Risk Assessment Docket 4540 - Attachment 1-3 Page 32 of 64

2014 SYSTEM INTEGRITY REPORT
32
0
100
200
300
400
500
600
700
800
900
1000
'05 '06 '07 '08 '09 '10 '11 '12 '13 '14
Miles
Year
CAST IRON ATTRITION RATE
0
10
20
30
'05 '06 '07 '08 '09 '10 '11 '12 '13 '14
4 14 8
4 11 8
3 16
28 25
Miles/Yr
Year
Avg 10-Yr Attrition Rate: 12.00 Miles/Year ( 1.37%)
DOT- Reported Pipe Inventories
CAST IRON MAIN INVENTORY
The Naragansett Electric Company d/b/a/ National Grid FY 2016 Gas ISR Risk Assessment Docket 4540 - Attachment 1-3 Page 33 of 64

2014 SYSTEM INTEGRITY REPORT
33
0
1000
2000
3000
4000
5000
6000
7000
'05 '06 '07 '08 '09 '10 '11 '12 '13 '14
Miles
Year
CAST IRON ATTRITION RATE
0
50
100
150
200
'05 '06 '07 '08 '09 '10 '11 '12 '13 '14
93 69 57 79
126 152
109 143
167 167
Miles/Yr
Year
Avg 10-Yr Attrition Rate: 116.30 Miles/Year ( 1.94%)
US-NGrid DOT- Reported Pipe Inventories
CAST IRON MAIN INVENTORY
The Naragansett Electric Company d/b/a/ National Grid FY 2016 Gas ISR Risk Assessment Docket 4540 - Attachment 1-3 Page 34 of 64

2014 SYSTEM INTEGRITY REPORT
34
TOTAL CAST IRON
MAIN BREAKS
136
39
53 58
86
58
85
40
70
140
0
50
100
150
200
'05 '06 '07 '08 '09 '10 '11 '12 '13 '14
BREAKS
YEAR
RI
The Naragansett Electric Company d/b/a/ National Grid FY 2016 Gas ISR Risk Assessment Docket 4540 - Attachment 1-3 Page 35 of 64
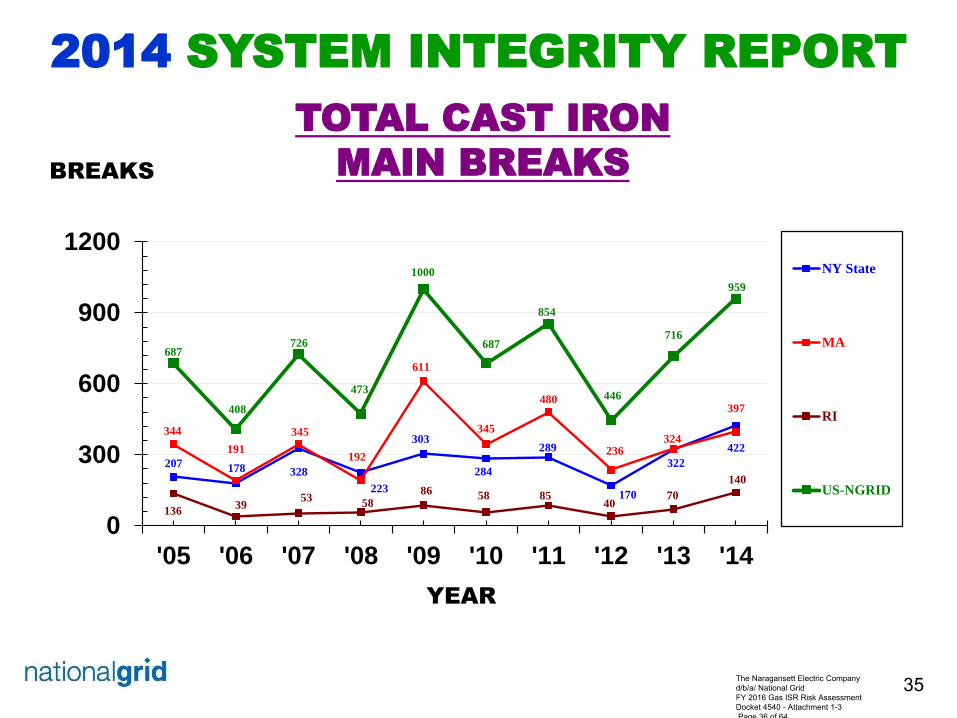
2014 SYSTEM INTEGRITY REPORT
35
TOTAL CAST IRON
MAIN BREAKS
207 178 328
223
303
284
289
170
322
422
344
191
345
192
611
345
480
236 324
397
136 39
53 58
86 58 85 40
70
140
687
408
726
473
1000
687
854
446
716
959
0
300
600
900
1200
'05 '06 '07 '08 '09 '10 '11 '12 '13 '14
BREAKS
YEAR
NY State
MA
RI
US-NGRID
The Naragansett Electric Company d/b/a/ National Grid FY 2016 Gas ISR Risk Assessment Docket 4540 - Attachment 1-3 Page 36 of 64
2014 SYSTEM INTEGRITY REPORT
36
A CLOSER LOOK AT
STEEL MAINS
The Naragansett Electric Company d/b/a/ National Grid FY 2016 Gas ISR Risk Assessment Docket 4540 - Attachment 1-3 Page 37 of 64

2014 SYSTEM INTEGRITY REPORT
37
UNPROTECTED
STEEL MAIN INVENTORY
UNPROTECTED STEEL ATTRITION RATE
-100
-50
0
50
100
'05 '06 '07 '08 '09 '10 '11 '12 '13 '14
9
-71
32 16
-10
82 12 46 26 25
Miles/Yr
Year
Avg 10 -Yr Attrition Rate: 16.60 Miles/Year (3.06%)
0
100
200
300
400
500
600
700
800
'05 '06 '07 '08 '09 '10 '11 '12 '13 '14
Miles
Year
DOT- Reported Pipe Inventories
NOTE: In RI, Attrition is due to both replacement and “added” cathodic protection. The Naragansett Electric Company d/b/a/ National Grid FY 2016 Gas ISR Risk Assessment Docket 4540 - Attachment 1-3 Page 38 of 64

2014 SYSTEM INTEGRITY REPORT
38
UNPROTECTED
STEEL MAIN INVENTORY
UNPROTECTED STEEL ATTRITION RATE
-550
-350
-150
50
250
450
'05 '06 '07 '08 '09 '10 '11 '12 '13 '14
281.9
-483.5
196.8 164.7 197.9 229.8 194.7 225.6 148.0 154
Miles/Yr
Year
Avg 10 -Yr Attrition Rate: 131.00 Miles/Year (2.15%)
0
1000
2000
3000
4000
5000
6000
7000
8000
'05 '06 '07 '08 '09 '10 '11 '12 '13 '14
Miles
Year
US-NGrid DOT- Reported Pipe Inventories
NOTE: In US-NGrid ( MA & RI) Attrition is due to both replacement and “added” cathodic protection. The Naragansett Electric Company d/b/a/ National Grid FY 2016 Gas ISR Risk Assessment Docket 4540 - Attachment 1-3 Page 39 of 64

2014 SYSTEM INTEGRITY REPORT
39
MAIN CORROSION LEAK “RATES”
CORROSION Leak Repairs Per Mile of “TOTAL” Steel
0.85
0.81
0.74
0.68
0.63
0.40
0.26
0.32
0.21 0.21
0.00
0.25
0.50
0.75
1.00
2005 2006 2007 2008 2009 2010 2011 2012 2013 2014
LE
AK
RE
PA
IRS
PE
R M
ILE
YEAR
RI
INCLUDES ALL CORROSION LEAKS, REGARDLESS OF MAIN MATERIAL
The Naragansett Electric Company d/b/a/ National Grid FY 2016 Gas ISR Risk Assessment Docket 4540 - Attachment 1-3 Page 40 of 64

2014 SYSTEM INTEGRITY REPORT
40
MAIN CORROSION LEAK “RATES”
CORROSION Leak Repairs Per Mile of “TOTAL” Steel
0.16
0.14 0.11 0.09 0.10 0.09
0.11 0.09 0.07
0.09
0.52 0.55
0.44
0.51
0.69
0.42
0.34
0.24
0.22 0.25
0.85 0.81
0.74
0.68
0.63
0.40 0.26
0.32
0.21 0.21
0.31 0.31
0.25 0.25
0.31
0.21 0.19
0.15 0.12 0.14
0.00
0.25
0.50
0.75
1.00
2005 2006 2007 2008 2009 2010 2011 2012 2013 2014
LE
AK
RE
PA
IRS
PE
R M
ILE
YEAR
NY State
MA
RI
US-NGrid
INCLUDES ALL CORROSION LEAKS, REGARDLESS OF MAIN MATERIAL
The Naragansett Electric Company d/b/a/ National Grid FY 2016 Gas ISR Risk Assessment Docket 4540 - Attachment 1-3 Page 41 of 64

2014 SYSTEM INTEGRITY REPORT
41
SERVICE
INVENTORY
ANALYSIS
The Naragansett Electric Company d/b/a/ National Grid FY 2016 Gas ISR Risk Assessment Docket 4540 - Attachment 1-3 Page 42 of 64
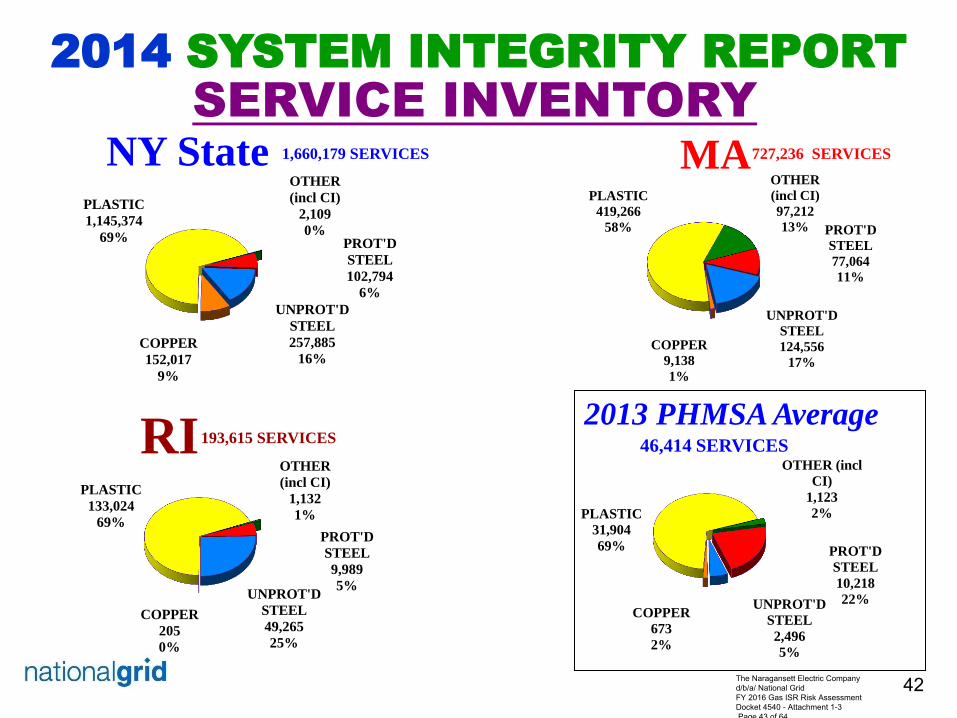
2014 SYSTEM INTEGRITY REPORT
42
PROT'D
STEEL
9,989
5% UNPROT'D
STEEL
49,265
25%
COPPER
205
0%
PLASTIC
133,024
69%
OTHER
(incl CI)
1,132
1%
SERVICE INVENTORY
NY State 1,660,179 SERVICES MA 727,236 SERVICES
RI 193,615 SERVICES
PROT'D
STEEL
102,794
6%
UNPROT'D
STEEL
257,885
16% COPPER
152,017
9%
PLASTIC
1,145,374
69%
OTHER
(incl CI)
2,109
0% PROT'D
STEEL
77,064
11%
UNPROT'D
STEEL
124,556
17%
COPPER
9,138
1%
PLASTIC
419,266
58%
OTHER
(incl CI)
97,212
13%
PROT'D
STEEL
10,218
22% UNPROT'D
STEEL
2,496
5%
COPPER
673
2%
PLASTIC
31,904
69%
OTHER (incl
CI)
1,123
2%
2013 PHMSA Average 46,414 SERVICES
The Naragansett Electric Company d/b/a/ National Grid FY 2016 Gas ISR Risk Assessment Docket 4540 - Attachment 1-3 Page 43 of 64

2014 SYSTEM INTEGRITY REPORT
43
SERVICE
LEAK REPAIR
ANALYSIS
The Naragansett Electric Company d/b/a/ National Grid FY 2016 Gas ISR Risk Assessment Docket 4540 - Attachment 1-3 Page 44 of 64

2014 SYSTEM INTEGRITY REPORT
44
544
479
669 680
1019
708 677
567
722
838
0
300
600
900
1200
'05 '06 '07 '08 '09 '10 '11 '12 '13 '14
SERVICE
LEAK
REPAIRS
YEAR
RI
TOTAL SERVICE LEAK REPAIRS
INCLUDING Damages
The Naragansett Electric Company d/b/a/ National Grid FY 2016 Gas ISR Risk Assessment Docket 4540 - Attachment 1-3 Page 45 of 64

2014 SYSTEM INTEGRITY REPORT
45
6022
5222
4689
3789 3722 3727 3915 3674 3993
4784
4013 4057
3497 3447 3647 3768
3393
2808 3010 3145
544 479 669 680
1019 708 677 567 722 838
10579
9758
8855
7916
8388 8203 7985
7049
7725
8767
0
3500
7000
10500
14000
'05 '06 '07 '08 '09 '10 '11 '12 '13 '14
SERVICE
LEAK
REPAIRS
YEAR
NY State
MA
RI
US-NGrid
TOTAL SERVICE LEAK REPAIRS
INCLUDING Damages
The Naragansett Electric Company d/b/a/ National Grid FY 2016 Gas ISR Risk Assessment Docket 4540 - Attachment 1-3 Page 46 of 64
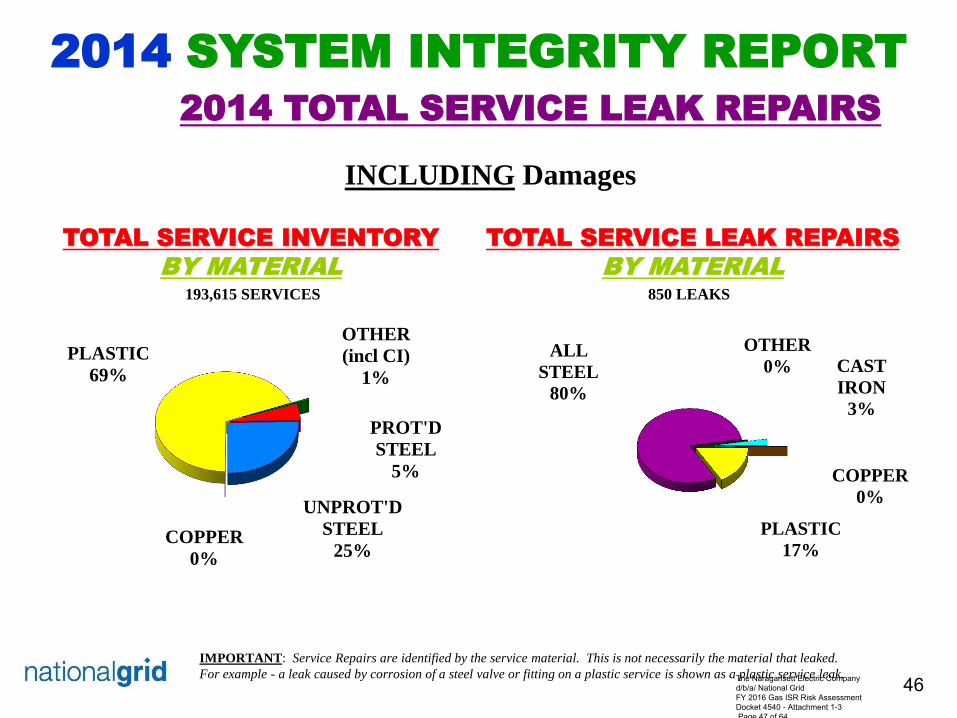
2014 SYSTEM INTEGRITY REPORT
46
COPPER
0%
PLASTIC
17%
ALL
STEEL
80%
OTHER
0% CAST
IRON
3% PROT'D
STEEL
5%
UNPROT'D
STEEL
25% COPPER
0%
PLASTIC
69%
OTHER
(incl CI)
1%
TOTAL SERVICE INVENTORY
BY MATERIAL
TOTAL SERVICE LEAK REPAIRS
BY MATERIAL
850 LEAKS
2014 TOTAL SERVICE LEAK REPAIRS
IMPORTANT: Service Repairs are identified by the service material. This is not necessarily the material that leaked.
For example - a leak caused by corrosion of a steel valve or fitting on a plastic service is shown as a plastic service leak.
193,615 SERVICES
INCLUDING Damages
The Naragansett Electric Company d/b/a/ National Grid FY 2016 Gas ISR Risk Assessment Docket 4540 - Attachment 1-3 Page 47 of 64

2014 SYSTEM INTEGRITY REPORT
47
COPPER
6% PLASTIC
28%
ALL
STEEL
65%
OTHER
0%
CAST
IRON
1%
PROT'D
STEEL
7%
UNPROT'D
STEEL
17% COPPER
6%
PLASTIC
66%
OTHER
(incl CI)
4%
TOTAL SERVICE INVENTORY
BY MATERIAL
TOTAL SERVICE LEAK REPAIRS
BY MATERIAL
US-NGrid
8,779 LEAKS
2014 TOTAL SERVICE LEAK REPAIRS
IMPORTANT: Service Repairs are identified by the service material. This is not necessarily the material that leaked.
For example - a leak caused by corrosion of a steel valve or fitting on a plastic service is shown as a plastic service leak.
2,581,030 SERVICES
INCLUDING Damages
The Naragansett Electric Company d/b/a/ National Grid FY 2016 Gas ISR Risk Assessment Docket 4540 - Attachment 1-3 Page 48 of 64

2014 SYSTEM INTEGRITY REPORT
295 352
503 535
845
587 535
422 543
605 0 0
1 15
27
19 29
31
21
39
219 98
110 86
112
84 76
83
105
155
30
29
55 44
35
18 37
31
53
39
544 479
669 680
1019
708 677
567
722
838
0
300
600
900
1200
2005 2006 2007 2008 2009 2010 2011 2012 2013 2014
Nu
mb
er
of
Le
ak
s
Years
Type 3
Type 2
Type 2A
Type 1
48
(Including damages)
LEAKS REPAIRED By REPAIRED Type SERVICE
The Naragansett Electric Company d/b/a/ National Grid FY 2016 Gas ISR Risk Assessment Docket 4540 - Attachment 1-3 Page 49 of 64

2014 SYSTEM INTEGRITY REPORT
49
2005 -2014 SERVICE LEAK REPAIRS
All Service Leak Repairs by Material
(Excluding damages)
0 0 0 0 1 0 1 11 6 0
243 265 300
338
593
407 390 402
534
642
22 28
47 48
69
44 36
26
40
33
127 84
152
198
323
186 192
46
55
92
0 0
2
2
0
1 0
0
1
0
9 18
27
19
16
11 19
14
6
1
401 395
528 605
1002
649 638
499
642
768
0
300
600
900
1200
2005 2006 2007 2008 2009 2010 2011 2012 2013 2014
Other
Copper
Plastic
Coated Steel
Bare Steel
Cast Iron
YEAR
NUMBER OF SVC
LEAK REPAIRS
The Naragansett Electric Company d/b/a/ National Grid FY 2016 Gas ISR Risk Assessment Docket 4540 - Attachment 1-3 Page 50 of 64

2014 SYSTEM INTEGRITY REPORT
50
2005 -2014 SERVICE LEAK REPAIRS
All Service Leak Repairs by Material
(Excluding damages)
15 17 20 24 30 49 31 31 32 48
4471 4654 4063
3454 3887
3549 3475 3146
3409 3,947
1493 1063
1011
879
915
826 976
804
1091
1,444
1078 1280
1154
1199
1385
1363 1161
997
1058
1266
562 417
362
229
239
268 345
259
421
500
457 371
403
552
702
540 533
310
70
19
8076 7802 7013
6337
7158 6595 6521
5547 6081
7224
0
2000
4000
6000
8000
10000
2005 2006 2007 2008 2009 2010 2011 2012 2013 2014
US NGrid
Other
Copper
Plastic
Coated Steel
Bare Steel
Cast Iron
YEAR
NUMBER OF SVC
LEAK REPAIRS
The Naragansett Electric Company d/b/a/ National Grid FY 2016 Gas ISR Risk Assessment Docket 4540 - Attachment 1-3 Page 51 of 64

2014 SYSTEM INTEGRITY REPORT
51
SERVICE LEAKS REPAIRED
COMPARISON BY LEAK CAUSES
LEAK REPAIRS
374
1
143
0 0
26
0 0
306
1
84
1 1
37
0
49
397
10
141
0 0
59
1
61
422
5
75
2 3
62
1
110
550
0
17
0 0
25
0
427
225
3
59
0 4 15
0
402
331
24 39
1 0
57
0
225
300
8
67
1 3
70
0
148
360
5
80
1
15
79
0
182
597
8
70
5 13
110
0
35
0
100
200
300
400
500
600
700
Corrosion Natural Forces Excavation Other OutsideForce
Material or Welds Equipment Operations Other
LEAK CAUSE
2005200620072008200920102011201220132014
The Naragansett Electric Company d/b/a/ National Grid FY 2016 Gas ISR Risk Assessment Docket 4540 - Attachment 1-3 Page 52 of 64

2014 SYSTEM INTEGRITY REPORT
52
SERVICE LEAKS REPAIRED
COMPARISON BY LEAK CAUSES
LEAK REPAIRS
NGRID 3,
994
996
2,50
3
78
565
398
6
2,03
9
3,97
8
736
1,95
6
264
166
1,00
3
15
1,64
0
3,65
1
635
1,84
2
238
164
1,00
5
22
1,29
8
3,34
6
491
1,57
9
149 27
3
914
20
1,14
4
3,69
9
508
1,23
0
148 23
1
799
11
1,76
2
3,36
1
194
1,60
8
80
336
1,54
3
4
1,07
7
3,44
2
231
1,46
4
94
98
1,90
9
0
747
3,08
5
186
1,50
2
111
81
1,67
7
5
473
3,03
7
175
1,64
4
92 16
5
1,97
4
1
637
3,65
4
368
1,54
3
67
103
2,39
2
3
637
0
900
1800
2700
3600
4500
Corrosion Natural Forces Excavation Other OutsideForce
Material or Welds Equipment Operations Other
LEAK CAUSE
2005200620072008200920102011201220132014
The Naragansett Electric Company d/b/a/ National Grid FY 2016 Gas ISR Risk Assessment Docket 4540 - Attachment 1-3 Page 53 of 64

2014 SYSTEM INTEGRITY REPORT
53
3.8 3.3
2.9
2.4 2.3 2.3
2.4 2.2
2.4
2.9
5.8
5.9
5.0 4.9
5.2
5.4
4.8
4.0
4.2 4.3
3.0 2.6
3.6
3.6
5.4
3.8 3.6
3.0
3.7
4.4
4.3 4.0
3.6
3.2 3.4 3.3
3.2 2.8
3.0 3.4
0.0
2.0
4.0
6.0
8.0
'05 '06 '07 '08 '09 '10 '11 '12 '13 '14
LEAK REPAIRS PER 1000 SERVICES
YEAR
NY State
MA
RI
US-NGrid
TOTAL SERVICE LEAK “RATES”
INCLUDING Damages
The Naragansett Electric Company d/b/a/ National Grid FY 2016 Gas ISR Risk Assessment Docket 4540 - Attachment 1-3 Page 54 of 64

2014 SYSTEM INTEGRITY REPORT
54
2.88
4.32 4.33
3.40
0
1
2
3
4
5
6
NY MA RI NGRID
Lea
ks P
er 1
000
Svc
NATIONALGRID SERVICE LEAK RATE BY STATE
2014 SERVICE LEAK “RATES” Total Service Leak Repairs (incl. damages) / 1,000 Total Services
The Naragansett Electric Company d/b/a/ National Grid FY 2016 Gas ISR Risk Assessment Docket 4540 - Attachment 1-3 Page 55 of 64

2014 SYSTEM INTEGRITY REPORT
55
TOTAL SERVICE LEAK “RATES”
COMPARISON BY MATERIAL
EXCLUDING Damages LEAK REPAIRS
PER 1000 SERVICES
0.00
3.29
1.24
2.17
0.00
3.70
0.80
2.12
11.1
1
4.46
1.43
2.83
11.2
4
5.08
1.81
3.24
0.00
8.98
2.88
5.34
5.85
6.35
1.61
3.44
0.00
6.41
1.58
3.36
4.81
6.72
0.36
2.61
4.83
9.33
0.42
3.33
0.00
11.3
9
0.69
3.97
0
5
10
15
20
COPPER ALL STEEL PLASTIC ALL SERVICESMATERIAL
2005200620072008200920102011201220132014
The Naragansett Electric Company d/b/a/ National Grid FY 2016 Gas ISR Risk Assessment Docket 4540 - Attachment 1-3 Page 56 of 64

2014 SYSTEM INTEGRITY REPORT
56
TOTAL SERVICE LEAK “RATES”
COMPARISON BY MATERIAL US-NGrid EXCLUDING Damages
LEAK REPAIRS
PER 1000 SERVICES
3.12
7.82
0.81
3.29
2.34
7.37
0.93
3.16
2.04
6.61
0.82
2.83
1.30
5.72
0.84
2.55
1.38
6.62
0.93
2.86
1.57
6.26
0.89
2.63
2.03
6.54
0.74
2.58
1.54
5.99
0.62
2.18
2.55
7.03
0.64
2.37
3.10
8.67
0.75
2.80
0
5
10
15
20
COPPER ALL STEEL PLASTIC ALL SERVICESMATERIAL
2005
2006
2007
2008
2009
2010
2011
2012
2013
2014
The Naragansett Electric Company d/b/a/ National Grid FY 2016 Gas ISR Risk Assessment Docket 4540 - Attachment 1-3 Page 57 of 64

2014 SYSTEM INTEGRITY REPORT
57
NATIONAL GRID-US
2014 GAS DISTRIBUTION
SYSTEM STATISTICS
The Naragansett Electric Company d/b/a/ National Grid FY 2016 Gas ISR Risk Assessment Docket 4540 - Attachment 1-3 Page 58 of 64

2014 SYSTEM INTEGRITY REPORT
58
CAUTION:
This chart is for comparative-illustrative purposes only. The data is not audited & many assumption have been made. Inventory data is from the CY 2014 Annual DOT/PHMSA Distribution Reports.
Customer data is from the Gas Customer Data base, Active Gas Accounts as of End of January 2015.
Sendout data is from the sendouts for the 12-month period ending 6/30/14, used to calculate UFG for the DOT Reports.
STATE LEGACY
Miles of Main # of Services
Avg Service Length (ft/svc)
Miles of Services
TOTAL Distribution
PipelineResidential Customers
Commercial and
Industrial Customers
TOTAL Customers
Sendout (MDT)
NYC 4,134 568,913 45 4,849 8,983 1,155,286 70,296 1,225,582 174,246LI 7,931 535,580 65 6,593 14,524 515,408 59,661 575,069 104,622UPSTATE 8,643 555,686 73 7,662 16,305 556,507 46,039 602,546 136,368
ALL NEW YORK STATE 20,708 1,660,179 61 19,104 39,812 2,227,201 175,996 2,403,197 415,236
BOSTON 6,342 495,167 46 4,333 10,675 579,026 52,559 631,585 121,354ESSEX 863 43,215 78 641 1,504 47,683 4,952 52,635 7,490CAPE 2,462 113,534 76 1,623 4,085 102,487 9,509 111,996 12,376LOWELL 1,396 75,320 72 1,030 2,426 82,795 9,281 92,076 15,732
ALL MASSACHUSETTS 11,064 727,236 55 7,627 18,691 811,991 76,301 888,292 156,952
RHODE ISLAND 3,188 193,615 66 2,423 5,611 236,671 24,599 261,270 43,381
TOTAL NGRID-US 34,960 2,581,030 60 29,154 64,114 3,275,863 276,896 3,552,759 615,569
2014 GAS DISTRIBUTION SYSTEM STATISTICS2014 PIPELINE / CUSTOMER / SENDOUT STATISTICS
The Naragansett Electric Company d/b/a/ National Grid FY 2016 Gas ISR Risk Assessment Docket 4540 - Attachment 1-3 Page 59 of 64

2014 SYSTEM INTEGRITY REPORT
59
STATE LEGACY
% of Main
% of Service
s
% of Distrib- ution
Pipeline
% of Custo- mers
% of Sendout
Service Density (Svcs /
Mile Main)
Meter Density (Custo- mers /
Service)
Customer Density
(Customers / Mile Total Pipeline)
Main Capacities
Used (Sendout
MDT / Mile Main)
Service Capacities
Used (Sendout
MDT/ Service)
Pipeline Capacities
Used (Sendout
MDT / Mile Total Pipe)
Customer Usage
(Sendout MDT /
Customer)
NYC 11.8% 22.0% 14.0% 34.5% 28.3% 138 2.2 136.4 42.15 0.31 19.40 0.142LI 22.7% 20.8% 22.7% 16.2% 17.0% 68 1.1 39.6 13.19 0.20 7.20 0.182UPSTATE 24.7% 21.5% 25.4% 17.0% 22.2% 64 1.1 37.0 15.78 0.25 8.36 0.226
ALL NEW YORK STATE 59.2% 64.3% 62.1% 67.6% 67.5% 80 1.4 60.4 20.05 0.25 10.43 0.173
BOSTON 18.1% 19.2% 16.7% 17.8% 19.7% 78 1.3 59.2 19.13 0.25 11.37 0.192ESSEX 2.5% 1.7% 2.3% 1.5% 1.2% 50 1.2 35.0 8.68 0.17 4.98 0.142CAPE 7.0% 4.4% 6.4% 3.2% 2.0% 46 1.0 27.4 5.03 0.11 3.03 0.111LOWELL 4.0% 2.9% 3.8% 2.6% 2.6% 54 1.2 37.9 11.27 0.21 6.48 0.171
ALL MASSACHUSETTS 31.6% 28.2% 29.2% 25.0% 25.5% 66 1.2 47.5 14.19 0.22 8.40 0.177
RHODE ISLAND 9.1% 7.5% 8.8% 7.4% 7.0% 61 1.3 46.6 13.61 0.22 7.73 0.166
TOTAL NGRID-US 100% 100% 100% 100% 100% 74 1.4 55.4 17.61 0.24 9.60 0.173
2014 GAS DISTRIBUTION SYSTEM STATISTICSPERCENTAGES OF NGRID-US SYSTEM ASSET RATIOS GAS CONSUMPTION RATIOS
The Naragansett Electric Company d/b/a/ National Grid FY 2016 Gas ISR Risk Assessment Docket 4540 - Attachment 1-3 Page 60 of 64

2014 SYSTEM INTEGRITY REPORT
60
NOTES:
Leak-Prone Main includes Cast Iron/Wrought Iron, Unprotected Steel , Aldyl-A and Other Material.
Leak-Prone Service includes Cast Iron/Wrought Iron and Unprotected Steel.
STATE LEGACY
Leak - Prone Main (miles)
% of TOTAL Main
Leak - Prone Services (#)
% of TOTAL Services
Miles of Leak - Prone Services
TOTAL Leak - Prone Pipe (in miles)
% of NG-US Leak - Prone Main (miles)
% of NG-US Leak - Prone Services (#)
% of NG-US TOTAL Leak - Prone Pipe
NYC 1,900 46.0% 24,450 4.3% 208 2,108 16.8% 5.6% 12.8%LI 3,860 48.7% 104,003 19.4% 1,280 5,140 34.1% 23.9% 31.3%UPSTATE 757 8.8% 131,541 23.7% 1,814 2,571 6.7% 30.2% 15.7%
ALL NEW YORK STATE 6,517 31.5% 259,994 15.7% 3,302 9,819 57.6% 59.7% 59.8%
BOSTON 3,135 49.4% 111,733 22.6% 978 4,113 27.7% 25.7% 25.0%ESSEX 101 11.7% 4,836 11.2% 72 173 0.9% 1.1% 1.1%CAPE 97 3.9% 4,092 3.6% 59 156 0.9% 0.9% 0.9%LOWELL 166 11.9% 5,424 7.2% 74 240 1.5% 1.2% 1.5%
ALL MASSACHUSETTS 3,499 31.6% 126,085 17.3% 1,182 4,681 30.9% 29.0% 28.5%
RHODE ISLAND 1,305 40.9% 49,439 25.5% 619 1,924 11.5% 11.4% 11.7%
TOTAL NGRID-US 11,321 32.4% 435,518 16.9% 5,103 16,424 100% 100% 100%
SEPARATE LEAK-PRONE PIPE ANALYSIS
2014 LEAK-PRONE PIPE INVENTORY LEAK-PRONE PIPE %'s
The Naragansett Electric Company d/b/a/ National Grid FY 2016 Gas ISR Risk Assessment Docket 4540 - Attachment 1-3 Page 61 of 64

2014 SYSTEM INTEGRITY REPORT
61
NOTES:
TOTAL Leak Receipts (Main & Service) data excludes Excavation Leaks.
TOTAL Leak Repairs (Main & Service) data includes Excavation Leaks.
TOTAL Leak Repairs (Main & Service) data excludes Above Ground Leaks.
STATE LEGACY
TOTAL Leak Receipts (Main & Service)
TOTAL Leak Repairs (Main & Service)
Year-End Workable Leak Backlog
TOTAL Repairs + Workable Leaks
TOTAL Leak Receipts / Mile TOTAL Pipe
TOTAL Leak Receipts / Mile Leak-Prone Pipe
TOTAL Leak Repairs / Mile TOTAL Pipe
TOTAL Leak Repairs / Mile Leak-Prone Pipe
Repairs + Workables / Mile TOTAL Pipe
Repairs + Workable / Mile Leak-Prone Pipe
NYC 4,984 4,923 24 4,947 0.6 2.4 0.5 2.3 0.6 2.3LI 3,350 3,067 8 3,075 0.2 0.7 0.2 0.6 0.2 0.6UPSTATE 1,800 1,857 5 1,862 0.1 0.7 0.1 0.7 0.1 0.7
ALL NEW YORK STATE 10,134 9,847 37 9,884 0.3 1.0 0.2 1.0 0.2 1.0
BOSTON 6,240 7,563 212 7,775 0.6 1.5 0.7 1.8 0.7 1.9ESSEX 294 280 - 280 0.2 1.7 0.2 1.6 0.2 1.6CAPE 390 496 - 496 0.1 2.5 0.1 3.2 0.1 3.2LOWELL 324 277 - 277 0.1 1.3 0.1 1.2 0.1 1.2
ALL MASSACHUSETTS 7,248 8,616 212 8,828 0.4 1.5 0.5 1.8 0.5 1.9
RHODE ISLAND 2,753 2,054 38 2,092 0.5 1.4 0.4 1.1 0.4 1.1
TOTAL NGRID-US 20,135 20,517 287 20,804 0.3 1.2 0.3 1.2 0.3 1.3
2014 LEAK DATA
LEAK AND REPAIR ANALYSIS
LEAK RATE RATIOS
The Naragansett Electric Company d/b/a/ National Grid FY 2016 Gas ISR Risk Assessment Docket 4540 - Attachment 1-3 Page 62 of 64

2014 SYSTEM INTEGRITY REPORT
62
Overall Regional
Gas Distribution Integrity
Assessment Summary
The Naragansett Electric Company d/b/a/ National Grid FY 2016 Gas ISR Risk Assessment Docket 4540 - Attachment 1-3 Page 63 of 64

2014 SYSTEM INTEGRITY REPORT
63
Distribution Engineering has reviewed all of the findings in the annual Trend-Based Distribution System Integrity Analysis (System
Integrity Report) in accordance with our Distribution Integrity Management Plan(DIMP), and finds leak receipts and repairs went up in 2014. This changes are believed to be the result of some recent incidents which increased public awareness, two consecutive years of severe weather condition and LPP deteriorating performance. National Grid has accelerated LPP replacement program to address this issue. There are no immediate causes for concern that would warrant changes to DIMP. Some anomalies were found and either explained as non-systemic or set up for continued research and/or monitoring. These will be explained in notes to this report. It is noted here that CI main break rates increased in every region and this is believed to be weather dependent.
Below is a summary of the individual key integrity measure results for the eight (8) federal (PHMSA) filing entities that constitute
National Grid-US.
Overall Regional Distribution Integrity Assessment Summary
REGIONS KEDNY KEDLI NMPC BGC EGC CCC CLW RI
ITEMS
• Leak Receipts
• Workable Leak Backlog
• LPP Main and Service Inventories
• Overall Main Leak Rate
• Cast Iron Main Break Rate No CI
• Steel Main Corrosion Leak Rate
• Service Leak Rate
Increase Slight Increase No Change Decrease
2014 System Integrity Report Summary
NATIONAL GRID
The Naragansett Electric Company d/b/a/ National Grid FY 2016 Gas ISR Risk Assessment Docket 4540 - Attachment 1-3 Page 64 of 64