# n00014-91-j-1360 conceptual structure research inquiry ... · july 12, 1993 final report 01/25/91...
TRANSCRIPT
July 12, 1993 Final Report 01/25/91 to 09/39/93
OSystem Dynamics and Computer Modeling Expertise: A AN # N00014-91-J-1360Conceptual Structure Research Inquiry.
MARK E. SIEGEL
University of the District of Columbia4200 Connecticut Avenue, N. W.Washington, D. C. 20008
Cognitive Science Program XCOffice of Naval Research, Department of the Navy D 1Arlington, VA 22217-5660 40
None -
Approved for public release; Distribution unlimited.
This research examined the conceptual structures of 22
expert system dynamists from 10 countries in order to investigate the extent towhich representations of their knowledge revealed similarities in conceptualstructure properties. The results revealedless similarity than has been found inexperts from other fields. It was hypothesized that the hetrogenity of the samplecombined with the fact that the filed itself is still developing were the majorcontributor factors that produced the results. The methodology was then employedwith graduate students to examine shifts in their conceptual structures as theyacquired system dynamics knowledge. The results were reported in an appendix tothe main study.
Conceptual structures; expertise; system dynamics; computer 62modeling and simularion.
Unclassified Unclassified Unclassified SAR

'p :7
July 12, 1993 Final Report 01/25/91 to 09/39/93
0 System Dynamics and Computer Modeling Expertise: A GRANT # N00014-9l-J-l360(D • Conceptual Structure Research Inquiry.
000MARK E. SIEGEL
University of the District of ColumbiaI - 4200 Connecticut Avenue, N. W.
Washington, D. C. 20008
Cognitive Science Program XCOffice of Naval Research, Department of the Navy
800 N. Q~uincy Street II 'Arlington, VA 22217-5660 ID
None
Approved for public release; Distribution unlimited.
This research examined the conceptual structures of 22expert system dynamists from 10 countries in order to investigate the extent towhich representations of their knowledge revealed similarities in conceptualstructure properties. The results revealedless similarity than has been found inexperts from other fields. It was hypothesized that the hetrogenity of the samplecombined with the fact that the filed itself is still developing were the majorcontributor factors that produced the results. The methodology was then employedwith graduate students to examine shifts in their conceptual structures as theyacquired system dynamics knowledge. The results were reported in an appendix tothe main study.
Conceptual structures; expertise; system dynamics; computer 62modeling and simularion.
Unclassiv4e, Unclassified Unclassified SAR

1 1
• •flvnODucTYO• "rU VWOT1 OR TN P&RT TS PERMTTTEDY FOR AWl PURPOSE /
V Or ¶!WE flN!Tfl STkTS GOV•.nnWWET
CONCEPTUAL STRUCTURES OF EXPERT SYSTEM
DYNAMISTS1 Acceý-on For
NTIS C.RA&-
DTI' Ti3ABMark Everet Siegel2 U'ionno.:nced J
University of the District of ColumbiaBy
0' i.t b-hty C:e
Avj-1 a •, cr
INTRODUCTION
Learning to be a scientist entails the acquisition and use of
different paradigms or ways of understanding that are counterintuitive to
common experience. This viewpoint applied as a pedagogical principle
rests on several assertions. First, it is essential for science students to
develop causal reasoning skills to understand complex dynamic
problems. Second, students require an organizing framework which
'This research was sponsored by the Cognitive Science Program,
Office of Naval Research, under Grant No. N00014-91-J-1360. Approvedfor public release; distribution unlimited. CD
2 The author wishes to acknowledge the advice and assistance of NN-Drs.Tim Goldsmith and Roger Schvaneveldt for their help with graph theoryand the Pathfinder software; Dr. Richard Colker for programing of the I
PathPrep software tools; Drs. Steve Peterson and George Richardson as 0)expert advisors on System Dynamics theory and concept selection; and Dr.Susan Chipman for her encouragement and support.
3
£ 2
emphasizes analytic, analogical, and synthetic cognitive processing for
achievement in advanced knowledge acquisition. Third, the ability to
represent dynamic causal problems as computational models and to run
exploratory simulation experiments with the models, Is a crucial step
toward achieving an in-depth understanding of causal problems. Forth,
an interactive learning environment is most suitable for
learningcomputer modeling/simulation skills. Fifth, the knowledge
domain associated with generative computer modeling/simulation has
structural properties with distinctive patterns indicative of expertise
level. Sixth, shifts In novice conceptual structures can be used to
diagnose knowledge acquisifion and guide the presentation of
subsequent instructional messages.
Accepting the validity of assertions one through four, the goal of
this research is to investigate empirically the fifth claim, and in particular
the similarity of conceptual structures of expert system dynamists. This
is necessary in order to provide what Goldsmith and Teague (1993) and
Johnson, Acton, and Goldsmith (1993) mean by a "referent -based"
evaluation standard on which to judge students' knowledge acquisition.
The report begins with a discussion of paradigm shifts, and then
outlines in some detail a theory of advanced knowledge acquisition
which this author believe explains the difficulty students experience
3
learning to construct their own models from text descriptions. Next,
there is a review of conceptual structure methodology and Issues useful
in deciding graph/network similarity. The research activity Is then
described followed by an analysis and summary section. Included in the
appendix are examples of conceptual structures and Stella II models.
The author acknowledges his debt to those whose work has been
influential, and will report extensively on that work to make clear the
basis for the present basic research effort.
Paradigm Shifts:
A necessary condition for the achievement of deep understanding
is prior knowledge that serves as a foundation for new learning
(Bransford, 1979). In addition, there Is a widely held view that schemata
comprise the "basic units" of knowledge structures. Rumelhart and
Norman (1981a) extend this idea by listing three ways in which existing
schemata are modified by experience. Accretion refers to a resultant
change in knowledge structure through the gradual accumulation of facts
within existing schemata. Tuning pertains to changes in the categories
used to interpret Information so that the accuracy of the schema Is in
consort with the data. Restructuring applies to changes in the
knowledge that Involves the creation of new structures, whose purpose
Is to reinterpret prior information or to explain new Information.
According to Vosniadou and Brewer (1987), "Restructuring represents
* 4
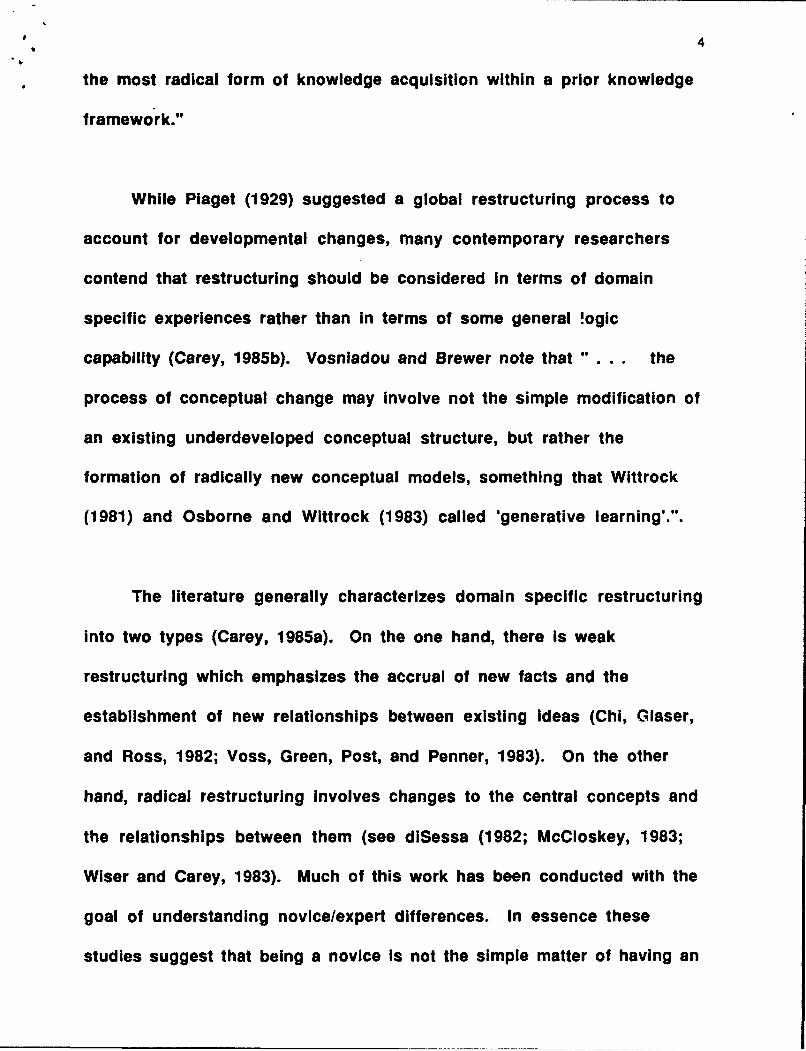
the most radical form of knowledge acquisition within a prior knowledge
framework."
While Piaget (1929) suggested a global restructuring process to
account for developmental changes, many contemporary researchers
contend that restructuring should be considered in terms of domain
specific experiences rather than in terms of some general !ogic
capability (Carey, 1985b). Vosnladou and Brewer note that " . .. the
process of conceptual change may involve not the simple modification of
an existing underdeveloped conceptual structure, but rather the
formation of radically new conceptual models, something that Wittrock
(1981) and Osborne and Wittrock (1983) called 'generative learning'.".
The literature generally characterizes domain specific restructuring
into two types (Carey, 1985a). On the one hand, there Is weak
restructuring which emphasizes the accrual of new facts and the
establishment of new relationships between existing Ideas (Chi, Glaser,
and Ross, 1982; Voss, Green, Post, and Penner, 1983). On the other
hand, radical restructuring involves changes to the central concepts and
the relationships between them (see diSessa (1982; McCloskey, 1983;
Wiser and Carey, 1983). Much of this work has been conducted with the
goal of understanding novice/expert differences. In essence these
studies suggest that being a novice is not the simple matter of having an
I 5
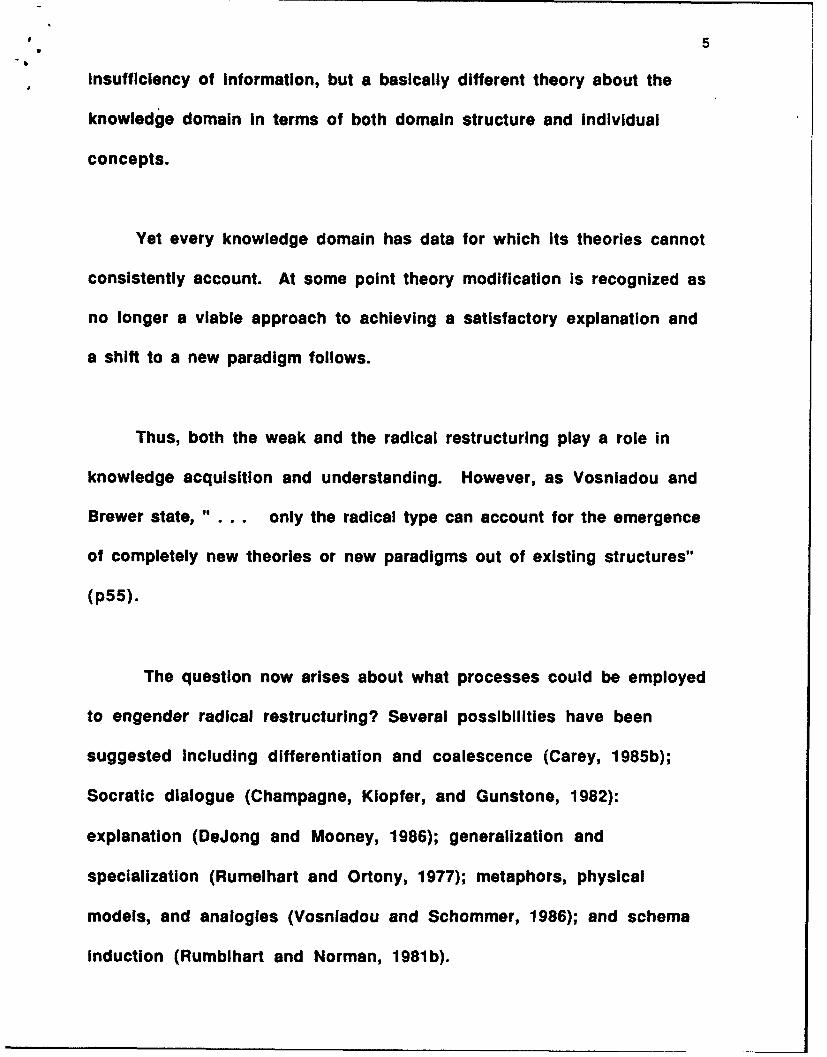
Insufficiency of Information, but a basically different theory about the
knowledge domain In terms of both domain structure and Individual
concepts.
Yet every knowledge domain has data for which its theories cannot
consistently account. At some point theory modification is recognized as
no longer a viable approach to achieving a satisfactory explanation and
a shift to a new paradigm follows.
Thus, both the weak and the radical restructuring play a role in
knowledge acquisition and understanding. However, as Vosnladou and
Brewer state, ".... only the radical type can account for the emergence
of completely new theories or new paradigms out of existing structures"
(p55).
The question now arises about what processes could be employed
to engender radical restructuring? Several possibilities have been
suggested Including differentiation and coalescence (Carey, 1985b);
Socratic dialogue (Champagne, Klopfer, and Gunstone, 1982):
explanation (DeJong and Mooney, 1986); generalization and
specialization (Rumelhart and Ortony, 1977); metaphors, physical
models, and analogies (Vosnladou and Schommer, 1986); and schema
induction (Rumblhart and Norman, 1981b).
6
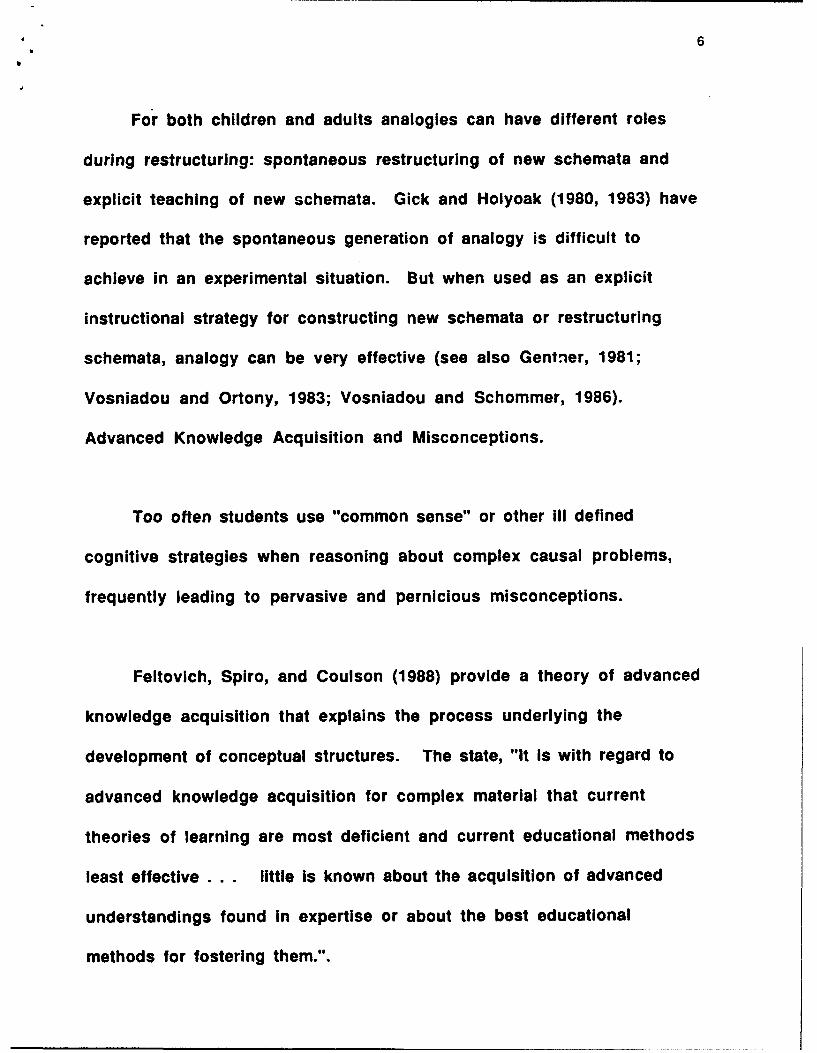
For both children and adults analogies can have different roles
during restructuring: spontaneous restructuring of new schemata and
explicit teaching of new schemata. Gick and Holyoak (1980, 1963) have
reported that the spontaneous generation of analogy is difficult to
achieve In an experimental situation. But when used as an explicit
instructional strategy for constructing new schemata or restructuring
schemata, analogy can be very effective (see also Gentner, 1981;
Vosniadou and Ortony, 1983; Vosniadou and Schommer, 1986).
Advanced Knowledge Acquisition and Misconceptions.
Too often students use "common sense" or other ill defined
cognitive strategies when reasoning about complex causal problems,
frequently leading to pervasive and pernicious misconceptions.
Feltovich, Spiro, and Coulson (1988) provide a theory of advanced
knowledge acquisition that explains the process underlying the
development of conceptual structures. The state, "It Is with regard to
advanced knowledge acquisition for complex material that current
theories of learning are most deficient and current educational methods
least effective . . . little Is known about the acquisition of advanced
understandings found In expertise or about the best educational
methods for fostering them.".

7
Feitovich, Spiro, and Coulson argue that the errors In
understanding are most likely not to result from a single source. The
Multiplicity factor refers to that complex of Influences ranging from those
associated with the learner, the educational process, and even the
research literature itself. The Interdependency factor refers to
misconceptions as reciprocating networks of faulty component ideas that
are mutually reinforcing and therefore support the general
misconception. The Oversimplification factor pertains to complex
knowledge being aggregated to the extent that the essential information
is unavailable. Thus, an extensive analysis of the knowledge domain is
a necessary condition for understanding students' problems in achieving
deep understanding, and In being able to rectify such problems.
Turning to the matter of why concepts are "difficult," Feltovitch,
Spiro, and Coulson believe that unusual demands are made on the
person's cognitive system. These demands may be categorized four
ways: 1) unusual demands on working memory; 2) unusual demands on
formal representation"; 3) unusual demands on "intuition" or prior
knowledge; and 4) unusual demands on notions of regularity. There
emerges in this theory the important notion of reciprocation among
families of related ideas which may explain difficulties students have
learning complex phenomena.
8
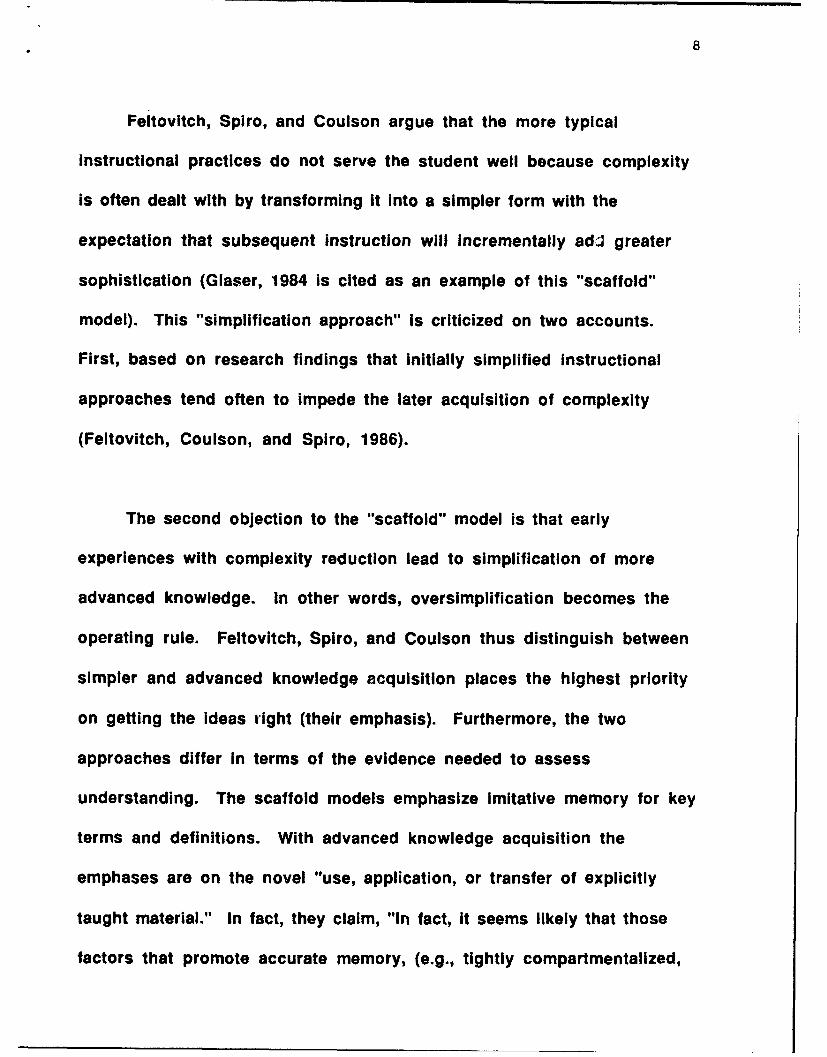
Feitovitch, Spiro, and Coulson argue that the more typical
instructional practices do not serve the student well because complexity
is often dealt with by transforming it into a simpler form with the
expectation that subsequent Instruction will incrementally ada greater
sophistication (Glaser, 1984 is cited as an example of this "scaffold"
model). This "simplification approach" is criticized on two accounts.
First, based on research findings that initially simplified instructional
approaches tend often to impede the later acquisition of complexity
(Feltovitch, Coulson, and Spiro, 1986).
The second objection to the "scaffold" model is that early
experiences with complexity reduction lead to simplification of more
advanced knowledge. In other words, oversimplification becomes the
operating rule. Feltovitch, Spiro, and Coulson thus distinguish between
simpler and advanced knowledge acquisition places the highest priority
on getting the ideas right (their emphasis). Furthermore, the two
approaches differ in terms of the evidence needed to assess
understanding. The scaffold models emphasize imitative memory for key
terms and definitions. With advanced knowledge acquisition the
emphases are on the novel "use, application, or transfer of explicitly
taught material." In fact, they claim, "In fact, it seems likely that those
factors that promote accurate memory, (e.g., tightly compartmentalized,
. 9
Insular mental representations are antithetical (their emphasis) to the
development of usable/applicable knowledge." In this framework,
understanding is conceived as a process by which what is learned at
one time Influences subsequent learning about that idea at another time.
The expert-novice literature, to which I now turn, reveals important
differences between these two groups vis-a-vis knowledge. As
summarized by Schvaneveldt, Durso, Goldsmith, Breen, Cooke, Tuchker,
and DeMalo (1985) expert cognitive characteristics include superior
performance on recall tasks in which meaningful material Is used
(although there are no differences when the same material is recalled in
random order), increases in experience leads to higher intragroup
agreement among experts In relation to memory structure and
organization, and experts have larger chunk sizes and more chunks.
This and other evidence indicate that there are major cognitive changes
that occur during the transition from novice to expert. This author
believe that such changes manifest themselves througn alterations in
the structural properties of concept networks and can be measured using
the methodology discussed below.
System Dynamics and Computer Modeling.
Until the arrival of powerful personal computers, modeling and
simulation required expert programming knowledge and access to
10
expensive hardware resources. Undergraduate students and faculty
outside computer science departments had almost no experience with
modeling as a pedagogicel technology.
Yet computer modeling is more than a technique. Its purpose is to
improve understanding through the study of Interrelationships among a
problem's parts in terms that require every relevant assumption to be
specified operationally. Models are not truth. They are paths to insight.
This is their value in education.
The basic premise of Systems Dynamics (the systems theory
adopted here) is that phenomena which change over time can be
understood by focusing on the structures that find the relationships
among the relevant components, rather than on discrete instances
associated with their functioning (i.e. localized symptoms). Phenomena
are composed of components which have specific functions, and when
viewed collectively, have some common goal or purpose. By employing
formalisms which enable the student to represent his/her problem of
study in Increasingly abstract terms, students acquire a variety of
cognitive skills Important to the development of causal reasoning and
understanding. Students learn how to make explicit their mental models
of phenomena using a vocabulary through which both qualitative and
quantitative Ideas can be expressed. This leads to effective
11
communication In both Instructive and collaborative learning
experiences.
Forrester (1976), who set forth the initial theoretical framework of
modern System Dynamics, wrote a programmed text Introduction to the
field. Roberts, Anderson, Deal, Garet, and Shaffer (1983) wrote the first
introductory level text (with an extensive workbook) to teach system
dynamics using a microcomputer (Apple Tm I!). One of the most widely
used special purpose mainframe modeling languages available was
DynamoTM and Its contemporary versions (for both large and small
computers) remains a favored choice by many people. Richmond and
Peterson (1985) developed the modeling language, STELLA*"
(Structural Thinking Experimental Learning Laboratory with Animation)
which takes advantage of many user oriented features such as Icons,
interactive graphics, and animation of the MacintoshTm computer. With
STELLATM students are not confined to writing equations as the only
means of model construction. Rather, they utilize menu tools and Icons
to represent the system structure. The basic forms of the needed
equations are generated concurrently by STELLATM. (Examples of
StellaTM features are provided in the Appendix).
One series of studies on teaching systems dynamics and computer
modeling to Improve causal reasoning has been conducted by
12
Mandinach (1989, )88a, 1988b, 1987). The Systems Training and
Curriculum Innovation (STACl) Project looked at both domain knowledge
acquisition and problem solving skills development in high school
students who received systems dynamics and StellaTm Instruction
integrated into their curricula. Bear in mind that this series of research
was not conducted in the context of an interactive learning laboratory.
Five subject areas were selected: (general physical science, biology,
physics, chemistry, and a special history course). With the exception of
the latter, there were "systems" and "traditional" classes for each topic.
Several test instruments were used to assess students' content and
problem solving knowledge.It is not the purpose here to review, in
depth, all of the aspects of this research. There are, however,
implications relevant to the purposes of this proposal. While the data
did not provide conclusive evidence that major cognitive restructuring
occurred for either content acquisition or problem solving skills, the
authors suggest that a longer term research effort may be needed to
show such results. Nevertheless, they conclude, "There were, however,
qualitative differences in the way systems and traditional students
approached problems" (pp 32). For example, the systems group focused
on the components of a system's behavior that changed over time
whereas the traditionally taught students concentrated on terminology.
Another very Important result to emerge from these studies Is the
recognition that the development of systems thinking occurs slowly, that
13
explic!* connections between domain content and systems theory must
be made; that students had difficulty modeling problems even with a
basic understanding of systems theory; and that teachers selectively
emphasized various aspects of systems theory resulting in students from
different classes having different degrees of systems theory
understanding. As will is noted below, the achievement of expert level
knowledge requires a great deal of practice over extend time periods. In
discussions with some members of the research team, and after a review
of their publications, it is the Interpretation here that the crucial variable
in determining student success is the knowledge and commitment of the
teacher to integrate systems theory and modeling into the course. The
classroom teacher can achieve what the Interactive system cannot
achieve, meeting specific individual needs.
GRAPH THEORY AND CONCEPTUAL STRUCTURES:
A useful metaphor for a domain of knowledge is as a related
collection of concepts represented by a node-link graph. When a metric
is applied to a graph's links the graph becomes a network and
mathematical transformations can be employed which extract structural
Information (Chartrand,1977). Schvaneveldt (1990) presents both a
theoretical framework and supporting research on the use of
graph/network analyses to the assessment of knowledge structure. This
work should be consulted by the interested reader particularly regarding
14
the PathfinderTM conceptual structure analysis software which will play a
crucial role in this project.
There is no absolute standard for comparing network structure
representations. With regard to Pathfinder networks, two different
approaches have been used with the goal of applying rules or functions
to obtain a real number indicative of similarity. A real number that
indicates multigraph similarity may be useful in assessing the status of
student' knowledge vis-a-vis the instructor, possible sources of
misconceptions, or as a guide to the next instructional message that will
be provided.
Each graph has a particular arrangement of its node-link
components. One view of structure starts with the idea of primitive
relations. The more complex node-link patterns are combinations of the
primitive relations and constitute higher order relations. For example, in
system dynamics theory, the primitive relation "flow" (or rate) is a basic
building block for the higher order relation " compounding process". The
higher the order of a relation the more it provides information about a
particular structure. In this framework structure is an emergent property.
The alternative approach Goldsmith and Davenport discuss is to
view structure as an entity, a collection of sub-objects. Components P
and 0 together form the larger component R.
15
The entity versus emergent property viewpoints determines the
methodology, the evidence collected, and the conclusions reached
regarding structural similarity, in the entity case, one might partition the
edges until a common subgraph is achieved (Ulam's Method(see
Graham, 1987)). This method assumes that the graphs' nodes are
unlabeled, which is usually not the case for knowledge domains.
The alternative, which Goldsmith and Davenport adopt, is to use
two higher order property relations (distance and neighborhood) as the
basis for similarity assessment. The neighborhood for any given node is
those nodes within a path length of one unit of the target node,
excluding the target Itself.
One analysis strategy employed by compute the correlation
coefficient of two graphs distance vectors3(An example for Pathfinder
networks can be found in Schvaneveldt, Durso, Goldsmith, Breen,
Cooke, Tucker, and DeMaio,1985).
The nodes which form a neighborhood make up a set. To achieve
a ratio of shared elements to total elements between the same
3 Adjacency and distance matrices of undirected graphs arecomposed of two triangles that mirror each other and share a commonhypotenuse of zero cell entries indicative of judging a node with itself.Thus the vector of n nodes will have (n2-n)/2 distances.
16
neighborhoods of different graphs, intersection, union, and cardinality
are determined.
Goldsmith and Davenport offer the following rule for assessing
graph similarity. They state, ".... an Index of similarity for a common
node in two graphs is the cardinality of the Intersection of the node
neighborhoods divided by the cardinality of the union of the
neighborhoods. One measure of overall graph similarity is the mean of
these n values. This measure will vary from zero to one with higher
values indicating greater similarity(p78).
There is no "best" approach for determining similarity. Path
distance involves node pairs and graphs are compared using this unit.
On the other hand, neighborhood analysis is based only on nodes of the
same unit distance, and a real number index for inter-graph comparisons
is based on set theory. Thus, the specific hypothesis determines the
methodology to be employed. If the question about the knowledge
domain centers on the psychological distance between concepts, path
analysis is the method of choice. On the other hand, if the question
concerns the relationships among concepts in terms of the configural
structure of the knowledge domain, the neighborhood method seems
better suited.
Current Funded Research
17
M.S., who will be the Principal Investigator Is at present the
Principal Investigator of a sponsored research project funded by the
Cognitive Sciences Program of the Office of Naval Research. That
project will be completed no later than September 30, 1993. Its purpose
was to investigate the similarities of the cognitive structures of expert
system dynamists. A software tool was developed (PathPrep) which aids
experts of any field to select subsets of "core or central" concepts from a
larger set that comprises a body of knowledge. PathPrep then uses that
information to solicit pairwise judgment data from subjects. The output
is placed in a file used by Pathfinder to analyze the data. Concepts
terms provided in the Appendix were derived by system dynamists
advising the ONR project. Twenty two expert subjects in ten countries
were sent PathPrep disks and returned similarity data. These results
were processed by Pathfinder and are at present in the analysis stage.
The PathPrep/Pathfinder combination has proven its usefulness in
cognitive structure research.
The data analysis yielded similarity scores (.31) lower than the
usual range obtained from experts of other fields. A consultant
(Goldsmith) has suggested that the data reflect the heterogeneity of the
sample (Ss were from ten countries in North America, Europe, and Asia).
In virtually every other study of this type, the subjects were from the
MSA%18
same departments, schools, or cultures. This author know of no other
research In system dynamics that is either cross-cultural vis-a-vis
experts or comparing novices with experts In terms of building computer
models. Nor is anything known about conceptual structure shifts and
interactive learning environments.
RESULTS
The data were first examined with a frequency distribution of
subject by scale response choice to determine the pattern of subjects
use of the 9 point values available to them. As with the subsequent
analyses, the following code scheme was employed.
TABLE #1Code Scheme

MSAJDC19
# Concept Terms# Subject
1 ACCUMULATION2 AGGREGATION 1 CA093 BOUNDARY 2 CA204 CAUSATION 3 GR295 COMPENSATING FEEDBACK 4 IN286 CONTROL STRUCTURE 5 ISll7 DOMINANCE SHIFTS 6 NE268 DYNAMIC HYPOTHESIS 7 NE279 DYNAMIC THINKING 8 N015
10 ENDOGENOUS VIEW 9 N03011 EXPONENTIAL DECAY 10 T11912 EXPONENTIAL GROWTH 11 TR04Y1 3 EXTREME CONDITIONS TEST 12 UK0514 LEVEL (STOCK) VARIABLE 13 UK2415 NEGATIVE FEEDBACK 14 UK2516 NONLINEAR RELATIONSHIP 15 US0717 OPERATIONAL THINKING 16 US0818 OSCILLATION 17 USIO19 OVERSHOOT AND COLLAPSE 18 US1420 PARAMETER INSENSITIVITY 19 US1721 POSITIVE FEEDBACK 20 US1822 RATE (FLOW) VARIABLE 21 US2123 ROBUSTNESS 22 US2324 SENSITIVITY TESTING25 SIGMOIDAL GROWTH

MSAM20
The first task was to examine the frequency distribution of eachsubject's 300 ratings over the nine point rating scale. Table 2 shows thefrequency distribution of the raw ratings values for each subject alongwith an overall frequency distribution across all subjects andall pairs.
Table 2. Frequency distribution of the raw ratings values by subject.
Similarity Rating ValuesSubject 1 2 3 4 5 6 7 8 9
1 3 30 26 2 32 20 51 120 162 14 24 14 5 6 39 62 72 643 2 8 24 56 108 35 35 15 174 70 67 15 4 33 20 26 43 225 11 3 29 35 47 65 65 32 136 11 30 38 25 56 56 57 19 87 0 75 58 42 30 25 61 9 08 21 31 25 28 61 48 51 23 129 15 14 22 17 25 53 61 69 24
10 10 47 29 3 9 56 56 46 4411 55 87 27 29 23 23 21 19 1612 26 56 10 4 78 7 44 47 2813 25 53 33 15 44 22 27 40 4114 81 52 38 17 26 33 28 16 915 130 76 35 17 15 16 6 3 216 3 35 32 15 76 24 45 28 4217 5 60 55 30 32 30 25 32 3118 0 6 28 73 69 57 39 23 518 7 28 50 20 16 40 81 42 1620 8 8 45 53 20 36 54 28 4821 110 40 17 6 9 26 43 36 1322 16 34 36 25 14 46 48 17 64
Sum 623 864 686 521 829 777 986 779 535Frequency 0.094 0.131 0.104 0.079 0.126 0.118 0.149 0.118 0.081
MSAPP21
With the exception of subjects 7 and 18, the remaining 20 people
used all nine values of the rating scale. The general form of the
distribution tended to be normally distributed or rectilinear, although
subject 15's distribution was highly skewed with proportionately many
more pairs assigned low similarity values.
Scope:
The scope of a concept is defined by the number of other concepts
that are seen to be related to It. High scope terms are generally
category labels or other abstract terms. High scope concepts also have
many connections in Pathfinder networks.
The scope of a concept Is operationally defined by the number of
other concepts seen to be related to it. To determine the number of
related concepts from a multi-value scale (e.g., 1 to 9), it is necessary to
define a rating score to serve as a cutoff mark whose purpose is to
define operationally the related and unrelated scale values. Rather
than selecting a single value and applying
It to all subjects, a score for each Individual subject was selected based
on his/her cumulative frequency distribution of rating values. This
method allows for Individual differences in subjects' use of the scale.
The score closest to the 25th percentile of relatedness was selected as
the cutoff value. Similarity values equal to or greater than this score are
MSA"22
presumed to be related and values below this cutoff score are presumed
to be unrelated.
The cutoff value was then used to transform the similarity values for
every subject. Each subject's set of 1 to 9 similarity values was
transformed
into a set of O's (unrelated) and l's (related). From these 0/1 matrices,
the number of subjects who rated each pair as related was counted.
Table 3 shows
the results of this analysis. It is clear from Table 3 that some of the
terms
were seen to be related to many other concepts, whereas other terms
had fewer associates.
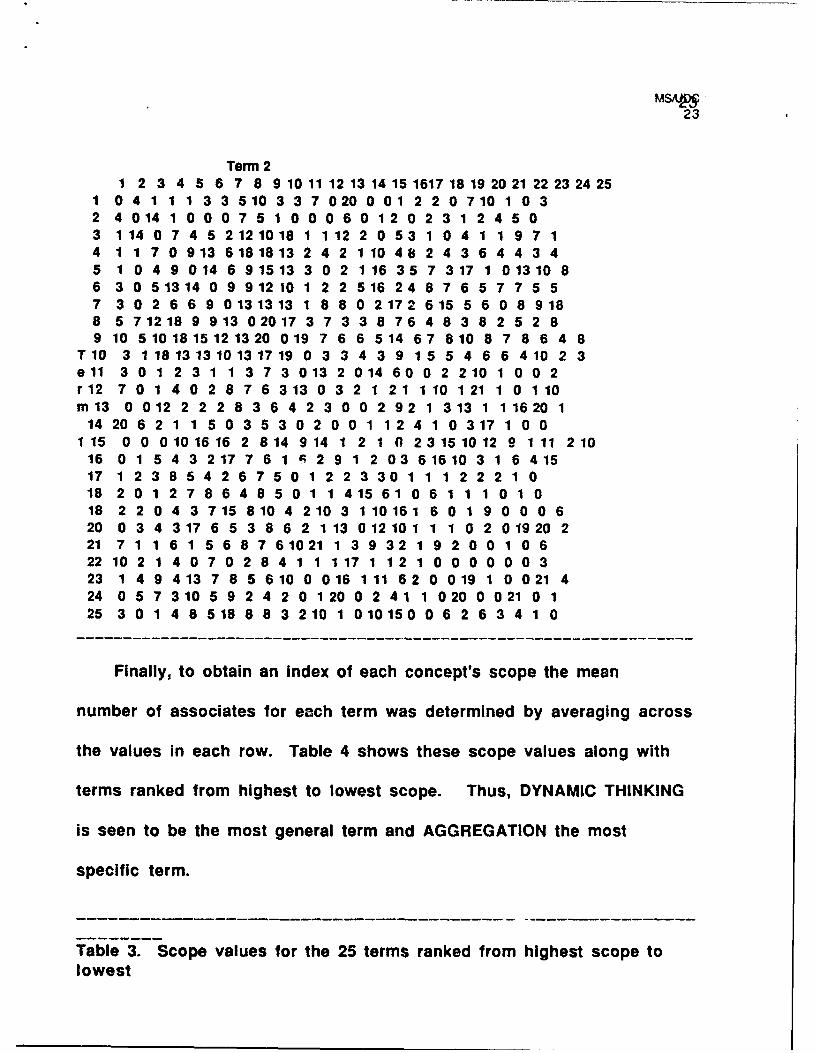
Table 3. The number of subjects (out of 22) who rated Term 1 as relatedtoTerm 2, where related was defined by each subject's 25th percentilescore.
MS~t23
Term 21 2 3 4 5 6 7 8 910111213141516171819202122232425
1 0 4 1 1 1 3 3 510 3 3 7 020 0 01 2 2 0 710 1 0 32 4014 1 00 07 5 1 00060 1202 3 1 2 4 503 114 0 7 4 5 2121018 1 112 2 0 53 1 0 4 1 1 9 7 14 1 1 7 0 913 6181813 2 4 2 110 48 2 4 3 6 4 4 3 45 1 0 4 9 014 6 91513 3 0 2 116 35 7 317 1 01310 86 3 0 51314 0 9 91210 1 2 2 516 24 8 7 6 5 7 7 5 57 3 0 2 6 6 9 0131313 1 8 8 0 2172 615 5 6 0 8 9188 5 71218 9 913 02017 3 7 3 3 8 76 4 8 3 8 2 5 2 89 10 5101815121320 019 7 6 6 514 67 810 8 7 8 6 4 8
TI1 3 118131310131719 0 3 3 4 3 9 15 5 4 6 6 410 2 3e11 3 0 1 2 3 1 1 3 7 3 013 2 014 60 0 2 210 1 0 0 2r12 7 0 1 4 0 2 8 7 6 313 0 3 2 1 21 110 121 1 0 110m 13 0 012 2 2 2 8 3 6 4 2 3 0 0 2 92 1 313 1 11620 1
14 20 6 2 1 1 5 0 3 5 3 0 2 0 0 1 12 4 1 0 317 1 0 0115 0 0 0101616 2 814 914 1 2 10231510129 111 210
16 0 1 5 4 3 217 7 6 1 0 2 9 1 2 03 61610 3 1 6 41517 123854267501223301112221018 2012786485011415610611101018 2 2 0 4 3 715 810 4 210 3 110161 6 0 1 9 0 0 0 620 0 3 4 317 6 5 3 8 6 2 113 012101 1 1 0 2 01920 221 71161568761021139321920010622 10 2 1 4 0 7 0 2 8 4 1 1 1 17 1 1 2 1 0 0 0 0 0 0 323 1 4 9 413 7 8 5 610 0 016 111 62 0 019 1 0 021 424 0 5 7 310 5 9 2 4 2 0 120 0 2 41 1 020 0 021 0 125 3 0 1 4 8 518 8 8 3 210 1 010150 0 6 2 6 3 4 1 0
Finally, to obtain an index of each concept's scope the mean
number of associates for each term was determined by averaging across
the values in each row. Table 4 shows these scope values along with
terms ranked from highest to lowest scope. Thus, DYNAMIC THINKING
is seen to be the most general term and AGGREGATION the most
specific term.
Table 3. Scope values for the 25 terms ranked from highest scope tolowest

MSA#W24
scope.# Term Scope9 DYNAMIC THINKING 9.678 DYNAMIC HYPOTHESIS 7.7910 ENDOGENOUS VIEW 7.297 DOMINANCE SHIFTS 7.0815 NEGATIVE FEEDBACK 7.005 COMPENSATING FEEDBACK 6.676 CONTROL STRUCTURE 6.5423 ROBUSTNESS 6.174 CAUSATION 6.1320 PARAMETER INSENSITIVITY 5.7916 NONLINEAR RELATIONSHIP 5.423 BOUNDARY 5.0419 OVERSHOOT AND COLLAPSE 5.0024 SENSITIVITY TESTING 4.9225 SIGMOIDAL GROWTH 4.9221 POSITIVE FEEDBACK 4.8313 EXTREME CONDITIONS TEST 4.7112 EXPONENTIAL GROWTH 4.381 ACCUMULATION 3.6318 OSCILLATION 3.3814 LEVEL (STOCK) VARIABLE 3.2511 EXPONENTIAL DECAY 3.1722 RATE (FLOW) VARIABLE 2.7517 OPERATIONAL THINKING 2.672 AGGREGATION 2.42
Coherence
The coherence of each subject's proximity file was next assessed.
Coherence Is a measure of the Internal consistency or internal
connectedness of a set of pairwise relations. The basic Idea is that if two
concepts are seen to be related, then how they in turn relate to still other
concepts should be similar. To the extent that such agreement occurs

MUM
25
across a set of pairwise relations, the relations are coherent.
Coherence is calculated by first computing a derived score for each
pair of terms. This derived score is based on some measure of
agreement between the two terms' patterns of relations to the remaining
terms.
The notion behind an inferred distance (hence a derived score) is
the possibility of predicting the existence of an edge between two nodes
based on the other edges In the graph. The inferred distance is
computed between two nodes by examining the similarity of the two
nodes' connections to other nodes. A
node's connections to other nodes is called its neighborhood set. In the
case of graphs, a neighbor is defined to be any node that is within some
path distance, exclusive of the node itself. Typically, a path distance of
one edge is used to define neighbors. The Jaccard index is then used
to compute the similarity of the two neighborhood sets. The Jaccard
index is the ratio of the cardinality of the Intersection of the sets to the
cardinality of the union of the sets. Neither of the two nodes themselves
is allowed to occur in the Intersection set or union set. The Jaccard
Index ranges from zero to one. The inferred graph distance is one minus
the Jaccard value.

26
Once the derived scores have been calculated for each pair, the
correlation between derived scores and original scores Is computed.
This correlations is the coherence. In other words, coherence is the
correlation between the original graph distances and the inferred
distances.
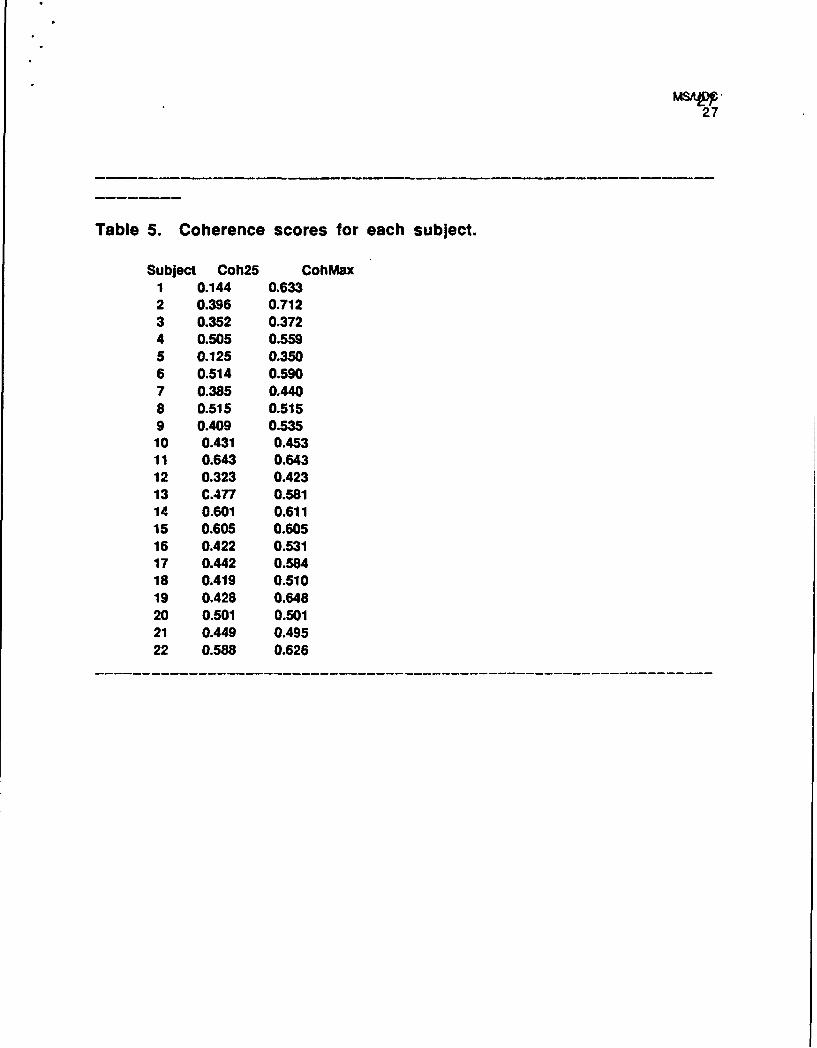
The coherence of each subject's set of proximity scores was computed
two ways. The first method employed a 25th percentile cutoff score to
determine which scores were related and which were unrelated. This is
exactly the procedure used above to compute scope. This coherence Is
called Coh25. The second
method computed coherence separately using, in turn, all of the
similarity values as cutoffs to compute the derived scores. A subject's
coherence was the maximum of this set of coherences. This coherence
is called CohMax. Table 5 gives both of these coherence values for each
subject.
27
Table 5. Coherence scores for each subject.
Subject Coh25 CohMax1 0.144 0.6332 0.396 0.7123 0.352 0.3724 0.505 0.5595 0.125 0.3506 0.514 0.5907 0.385 0.4408 0.515 0.5159 0.409 0.53510 0.431 0.45311 0.643 0.64312 0.323 0.42313 C.477 0.58114 0.601 0.61115 0.605 0.60516 0.422 0.53117 0.442 0.58418 0.419 0.51019 0.428 0.64820 0.501 0.50121 0.449 0.49522 0.588 0.626
MSAM28
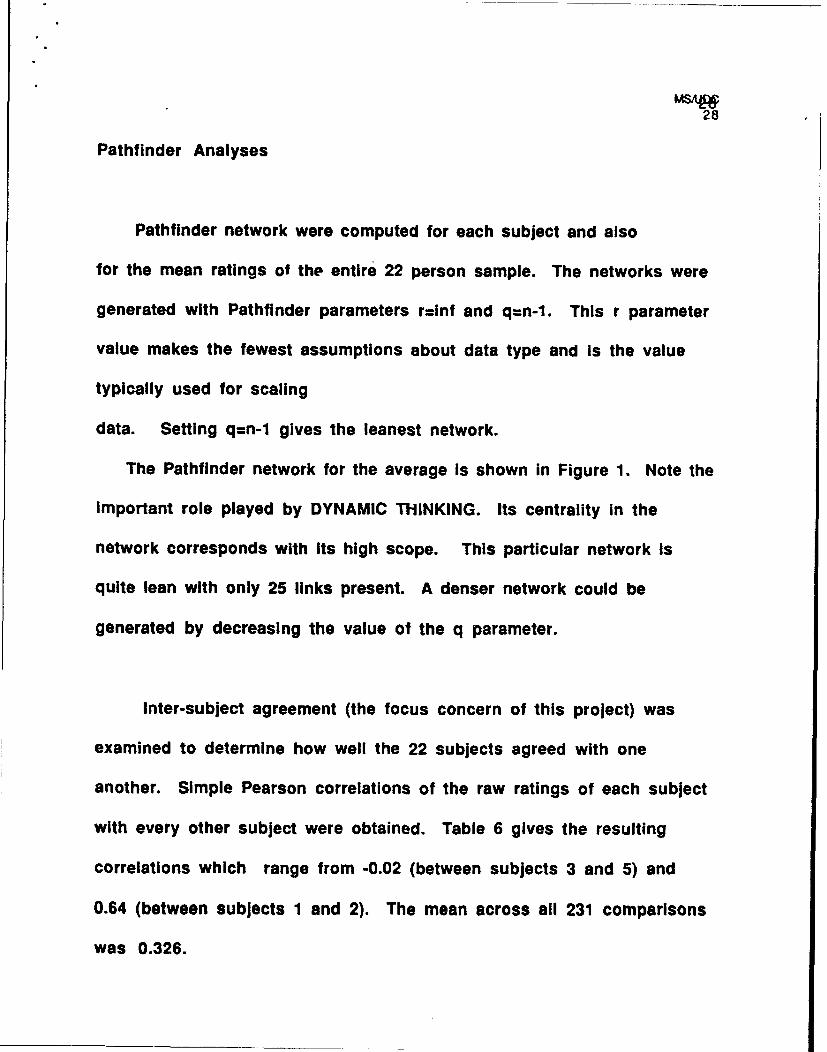
Pathfinder Analyses
Pathfinder network were computed for each subject and also
for the mean ratings of the entire 22 person sample. The networks were
generated with Pathfinder parameters r=lnf and q=n-1. This r parameter
value makes the fewest assumptions about data type and is the value
typically used for scaling
data. Setting q=n-1 gives the leanest network.
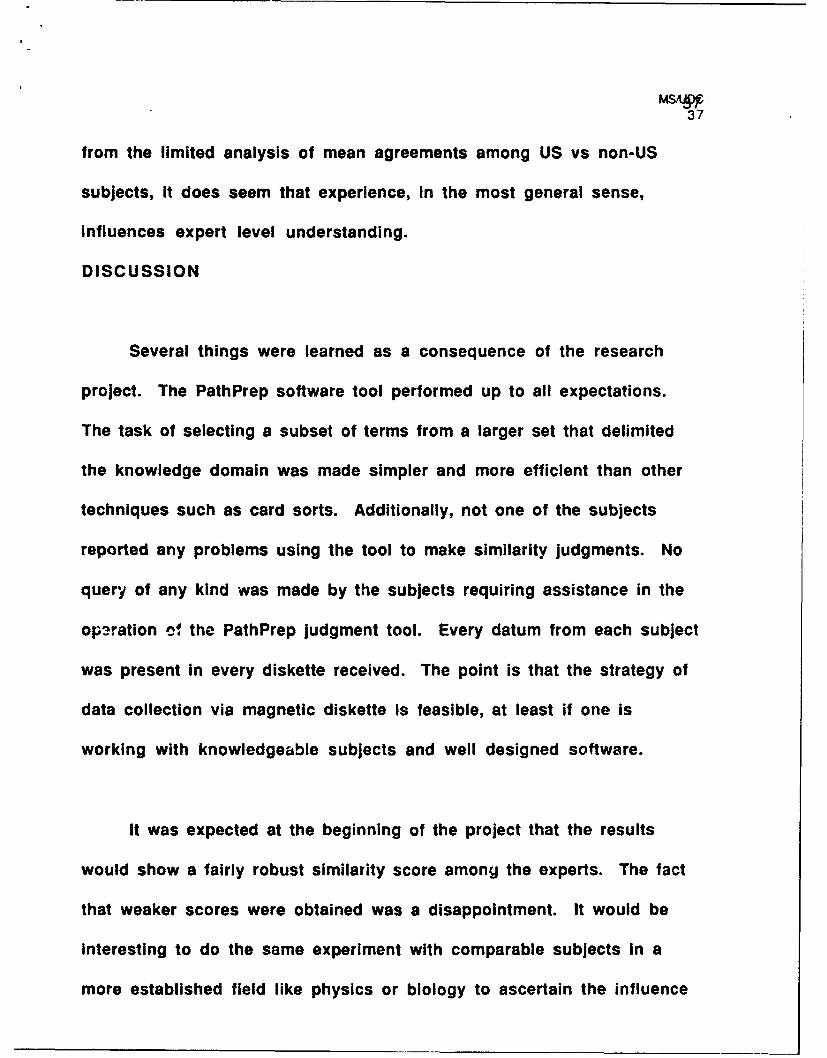
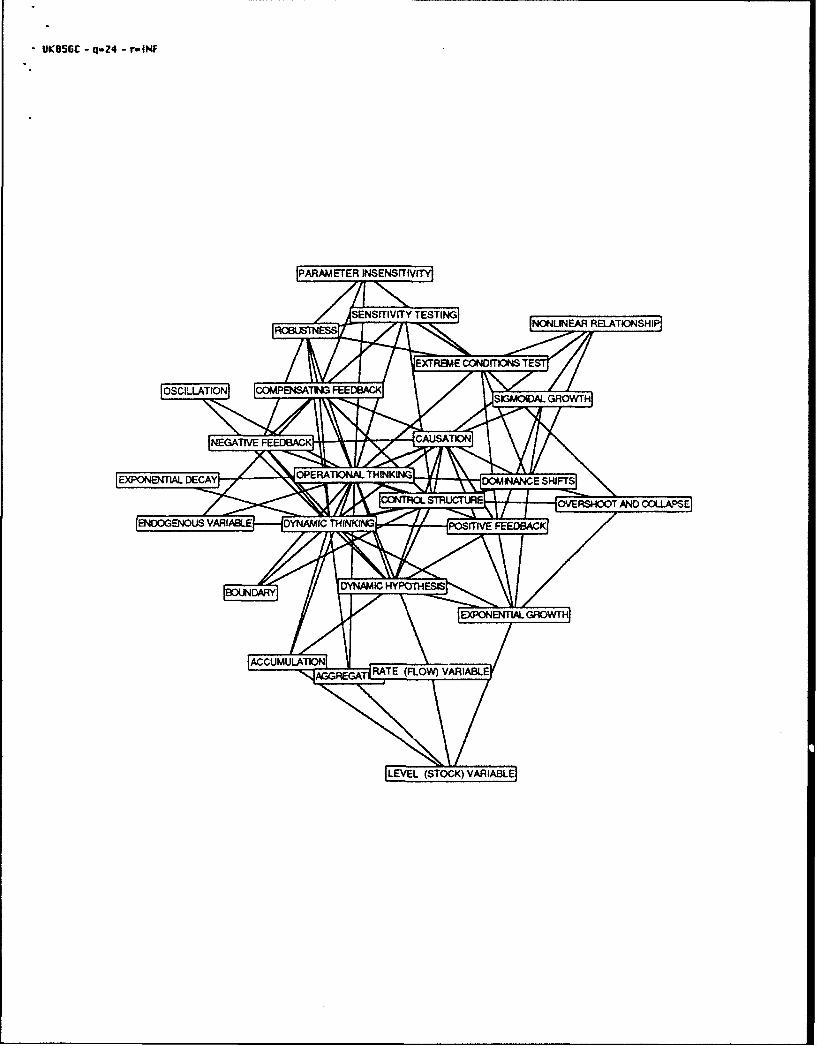
The Pathfinder network for the average is shown in Figure 1. Note the
important role played by DYNAMIC THINKING. Its centrality in the
network corresponds with its high scope. This particular network Is
quite lean with only 25 links present. A denser network could be
generated by decreasing the value of the q parameter.
Inter-subject agreement (the focus concern of this project) was
examined to determine how well the 22 subjects agreed with one
another. Simple Pearson correlations of the raw ratings of each subject
with every other subject were obtained. Table 6 gives the resulting
correlations which range from -0.02 (between subjects 3 and 5) and
0.64 (between subjects 1 and 2). The mean across all 231 comparisons
was 0.326.

MSA"29
Table 6. Inter-subject correlations based on the raw similarity rating
values.
SubjectSubject 2 3 4 5 6 7 8 9 10 11 12 13 14 15 16 17 18 19 20 21 22
1 64 17 21 13 47 40 29 27 17 36 37 43 41 26 47 33 19 38 24 3827
2 37 15 06 47 39 19 26 17 41 28 44 41 30 45 35 22 35 18 39 243 12 -02 28 31 17 30 16 35 20 20 26 42 32 30 26 37 20 28 354 40 20 28 50 32 53 29 45 29 51 28 15 51 28 28 49 31 365 14 22 26 06 23 09 26 30 20 07 10 21 05 13 27 18 136 39 11 31 18 46 34 40 42 35 39 37 23 40 19 51 237 20 25 27 44 37 45 36 31 37 34 20 37 34 39 388 28 46 32 26 16 43 27 20 42 36 18 49 19 409 28 36 26 32 40 43 28 36 21 39 35 32 44
10 33 27 26 37 28 16 45 32 22 53 23 5111 37 26 41 56 44 58 46 39 46 43 5712 40 48 24 32 39 28 32 35 41 4413 41 25 44 35 21 37 24 38 2614 36 34 47 32 40 43 50 4515 39 54 35 44 35 29 4716 34 25 34 29 40 4117 3731 46366118 3032294119 25453520 245121 36

MSA
30
The agreement of the subjects based on their Individual Pathfinder
networks was computed. This was accomplished by correlating
corresponding graph distances from pairs of the networks. The
correlations are shown in Table 7.
The correlations range from -0.10 to 0.55 with a mean of 0.20.
Table 7. Inter-subject correlations based on the 25th percentiletransformedratings.
SubjectSubject 2 3 4 5 6 7 8 9 10 11 12 13 14 15 16 17 18 19 20 21 22
1 38 21 19 15 14 13 38-04 17 19 12 18 34 08-04 11 21 31 23 3331
2 29 09 14 29 17 13 12 27 27 07 37 31 04-10 26 13 22 27 39 353 -02 04 05-07 03 13 16 19 13 13 15 24 04 22 08 23 06 21 254 1831 28 28 03 43 36 34 28 21 09 27 47 16 24 21 39 355 12 27 01 12 16-02 20 20 20 03 02 23-07 18-02 09 096 09 18 16 37 25 23 26 20-05 17 33 03-02 14 10 327 10 21 17 18 14 42 25 05 03 20 09 32 15 14 158 03 28 43 19 01 18 20 26 19 41 28 34 16 399 -03 23 00 12 09 16-01 16 00 09 10 10 14
10 28 40 27 24 03 34 44 27 29 24 18 4711 25 20 22 38 18 47 35 30 36 43 4612 20 40 02 30 41 112707202213 29 09 12 28 03 38 11 31 1914 09 03 28 08 34-06 32 2215 14 33 13 50 11 21 3416 18 23 15 12 15 2117 093719345518 2440283419 27354520 354221 41
MSAV31
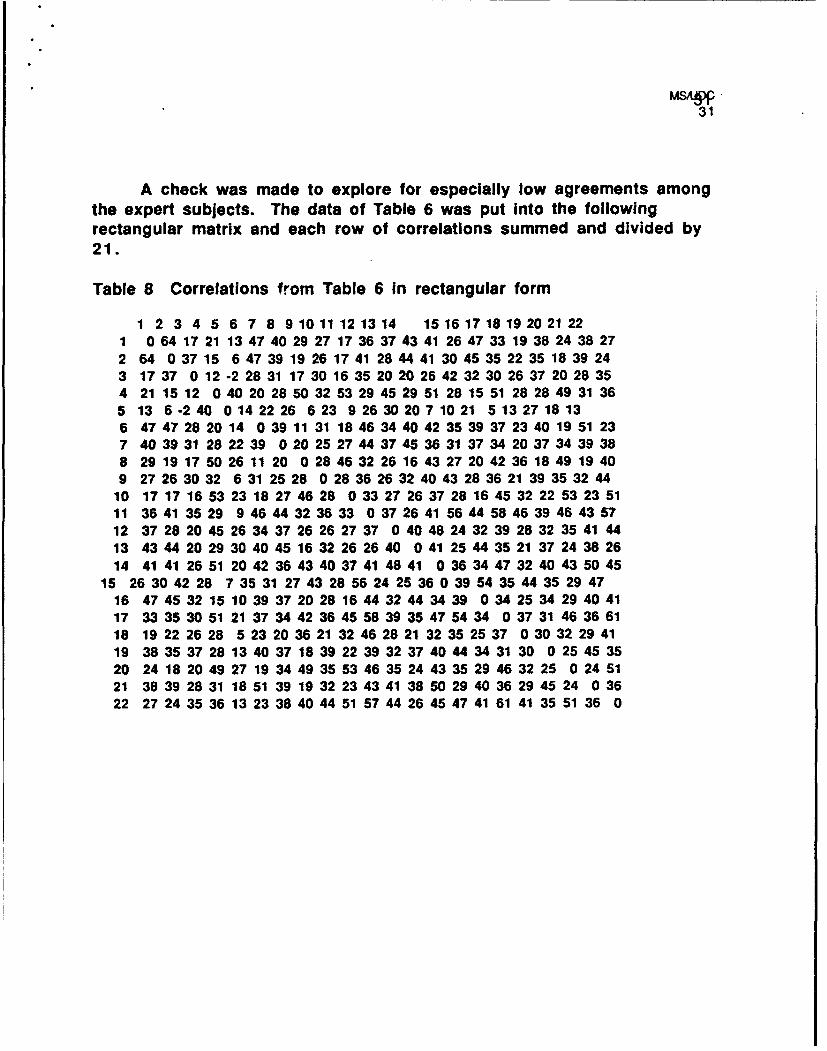
A check was made to explore for especially low agreements amongthe expert subjects. The data of Table 6 was put into the followingrectangular matrix and each row of correlations summed and divided by21.
Table 8 Correlations from Table 6 in rectangular form
1 2 3 4 5 6 7 8 9 10 11 12 13 14 15 16 17 18 19 20 21 221 0 64 17 21 13 47 40 29 27 17 36 37 43 41 26 47 33 19 38 24 38 272 64 0 37 15 6 47 39 19 26 17 41 28 44 41 30 45 35 22 35 18 39 243 17 37 0 12-2 28 31 17 30 16 35 20 20 26 42 32 30 26 37 20 28 354 21 15 12 0 40 20 28 50 32 53 29 45 29 51 28 15 51 28 28 49 31 365 13 6-240 0 14 22 26 6 23 9 26 30 207 10 21 5 1327 18 136 4747 28 20 14 0 39 11 31 18 46 34 40 42 35 39 37 23 40 19 51 237 40 39 31 28 22 39 020 25 27 44 37 45 36 31 37 34 20 37 34 39 388 29 19 17 50 26 11 20 0 28 46 32 26 16 43 27 20 42 36 18 49 19 409 27 26 30 32 6 31 25 28 0 28 36 26 32 40 43 28 36 21 39 35 32 44
10 17 17 16 53 23 18 27 46 28 0 33 27 26 37 28 16 45 32 22 53 23 5111 36 41 35 29 9 46 44 32 36 33 0 37 26 41 56 44 58 46 39 46 43 5712 37 28 20 45 26 34 37 26 26 27 37 0 40 48 24 32 39 28 32 35 41 4413 43 44 20 29 30 40 45 16 32 26 26 40 0 41 25 44 35 21 37 24 38 2614 41 41 26 51 20 42 36 43 40 37 41 48 41 0 36 34 47 32 40 43 50 45
15 26 30 42 28 7 35 31 27 43 28 56 24 25 36 0 39 54 35 44 35 29 4716 47 45 32 15 10 39 37 20 28 16 44 32 44 34 39 0 34 25 34 29 40 4117 33 35 30 51 21 37 34 42 36 45 58 39 35 47 54 34 0 37 31 46 36 6118 19 22 26 28 5 23 20 36 21 32 46 28 21 32 35 25 37 0 30 32 29 4119 38 35 37 28 13 40 37 18 39 22 39 32 37 40 44 34 31 30 0 25 45 3520 24 18 20 49 27 19 34 49 35 53 46 35 24 43 35 29 46 32 25 0 24 5121 38 39 28 31 18 51 39 19 32 23 43 41 38 50 29 40 36 29 45 24 0 3622 27 24 35 36 13 23 38 40 44 51 57 44 26 45 47 41 61 41 35 51 36 0
MSA"32
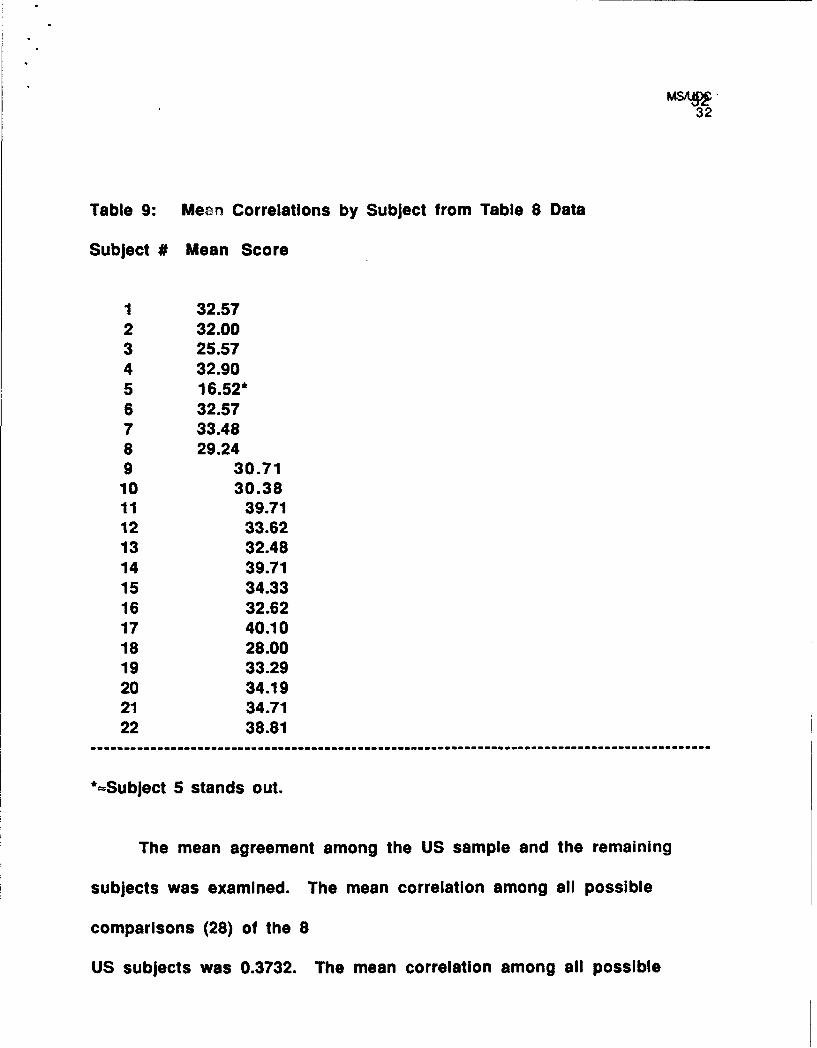
Table 9: Mean Correlations by Subject from Table 8 Data
Subject # Mean Score
1 32.572 32.003 25.574 32.905 16.52*6 32.577 33.488 29.249 30.7110 30.3811 39.7112 33.6213 32.4814 39.7115 34.3316 32.6217 40.1018 28.0019 33.2920 34.1921 34.7122 38.81
*-Subject 5 stands out.
The mean agreement among the US sample and the remaining
subjects was examined. The mean correlation among all possible
comparisons (28) of the 8
US subjects was 0.3732. The mean correlation among all possible

M&4"33
comparisons (91) of the remaining 14 subjects was 0.3057.
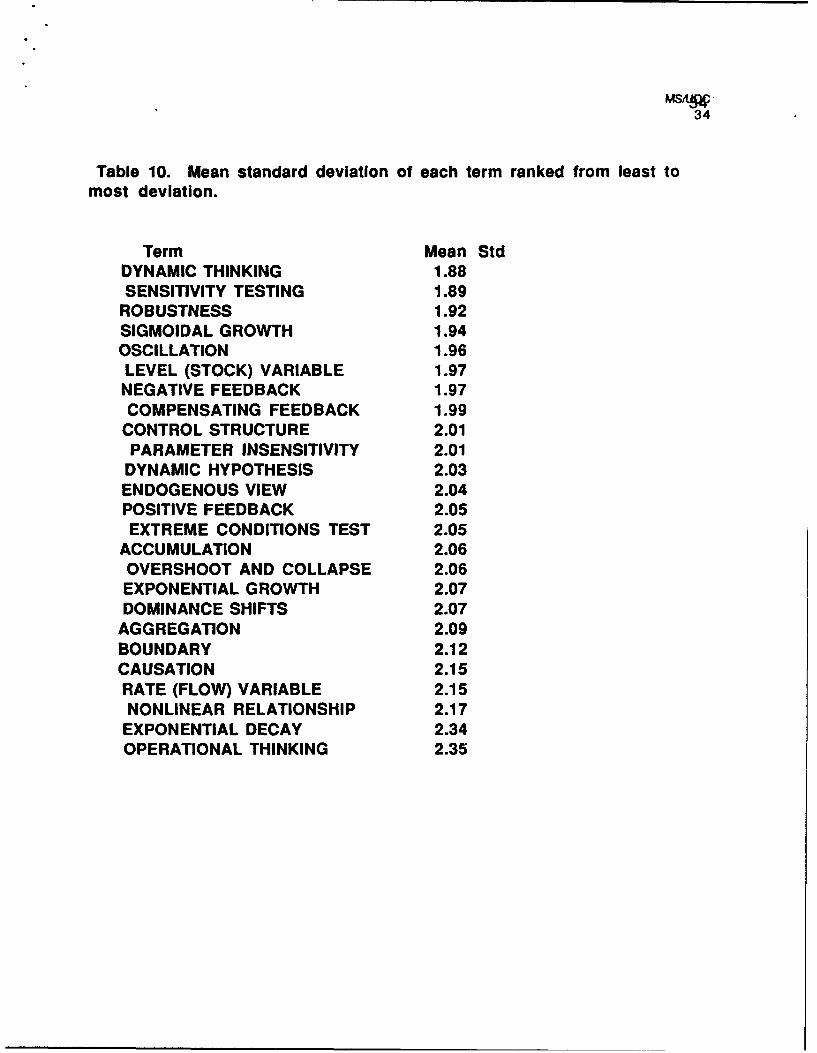
The mean and standard deviation for each pair of terms across the 22
subjects was computed and is provided in the Appendix. Finally, the
mean standard deviation for each term was calculated by averaging the
standard deviations of those pairs of terms that contained the term in
question. These values are reported in Table 10.
This Information identifies which of the terms the experts tended to
agree on (i.e., showed low variability in their ratings with other terms)
and which of the terms produced the most disagreement. The raw
ratings by pair for the 22 subjects are
are provided in the Appendix along with mean and standard
deviation.
MSA"34
Table 10. Mean standard deviation of each term ranked from least tomost deviation.
Term Mean StdDYNAMIC THINKING 1.88SENSITIVITY TESTING 1.89
ROBUSTNESS 1.92SIGMOIDAL GROWTH 1.94OSCILLATION 1.96LEVEL (STOCK) VARIABLE 1.97
NEGATIVE FEEDBACK 1.97COMPENSATING FEEDBACK 1.99
CONTROL STRUCTURE 2.01PARAMETER INSENSITIVITY 2.01
DYNAMIC HYPOTHESIS 2.03ENDOGENOUS VIEW 2.04POSITIVE FEEDBACK 2.05EXTREME CONDITIONS TEST 2.05
ACCUMULATION 2.06OVERSHOOT AND COLLAPSE 2.06EXPONENTIAL GROWTH 2.07DOMINANCE SHIFTS 2.07
AGGREGATION 2.09BOUNDARY 2.12CAUSATION 2.15RATE (FLOW) VARIABLE 2.15NONLINEAR RELATIONSHIP 2.17EXPONENTIAL DECAY 2.34OPERATIONAL THINKING 2.35
MSA4"35
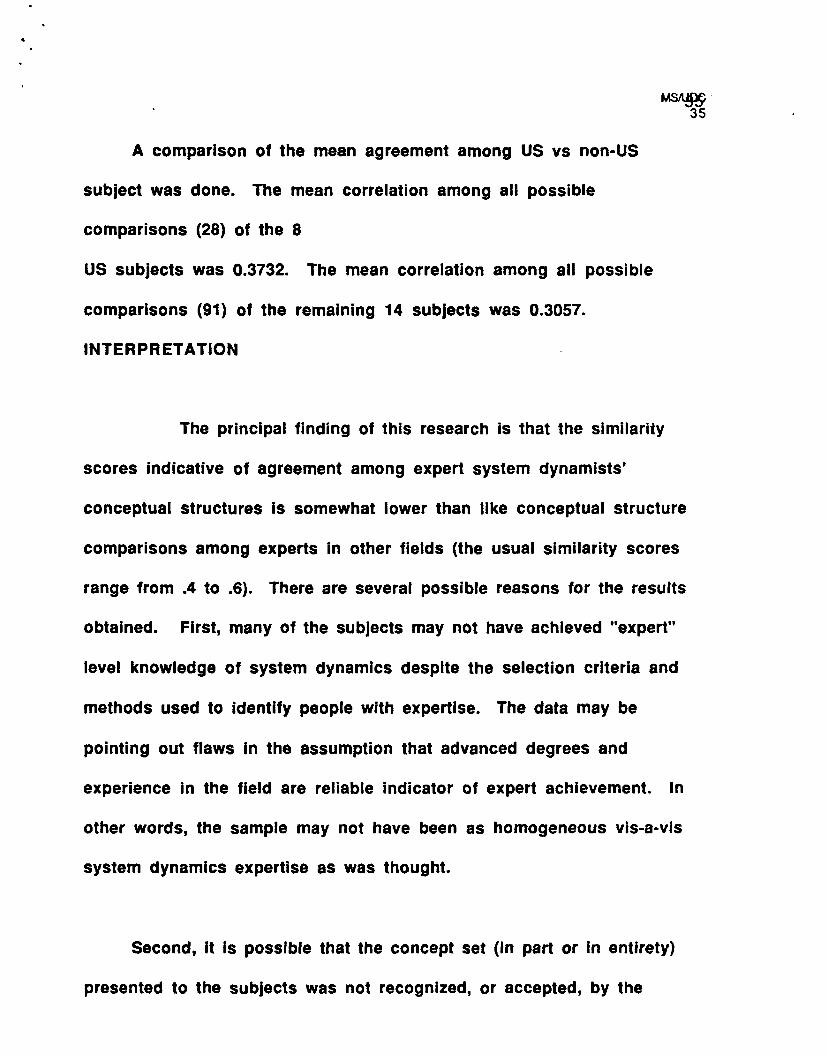
A comparison of the mean agreement among US vs non-US
subject was done. The mean correlation among all possible
comparisons (28) of the 8
US subjects was 0.3732. The mean correlation among all possible
comparisons (91) of the remaining 14 subjects was 0.3057.
INTERPRETATION
The principal finding of this research is that the similarity
scores indicative of agreement among expert system dynamists'
conceptual structures Is somewhat lower than like conceptual structure
comparisons among experts in other fields (the usual similarity scores
range from .4 to .6). There are several possible reasons for the results
obtained. First, many of the subjects may not have achieved "expert"
level knowledge of system dynamics despite the selection criteria and
methods used to identify people with expertise. The data may be
pointing out flaws in the assumption that advanced degrees and
experience in the field are reliable indicator of expert achievement. In
other words, the sample may not have been as homogeneous vis-a-vis
system dynamics expertise as was thought.
Second, it is possible that the concept set (in part or In entirety)
presented to the subjects was not recognized, or accepted, by the
MSA56
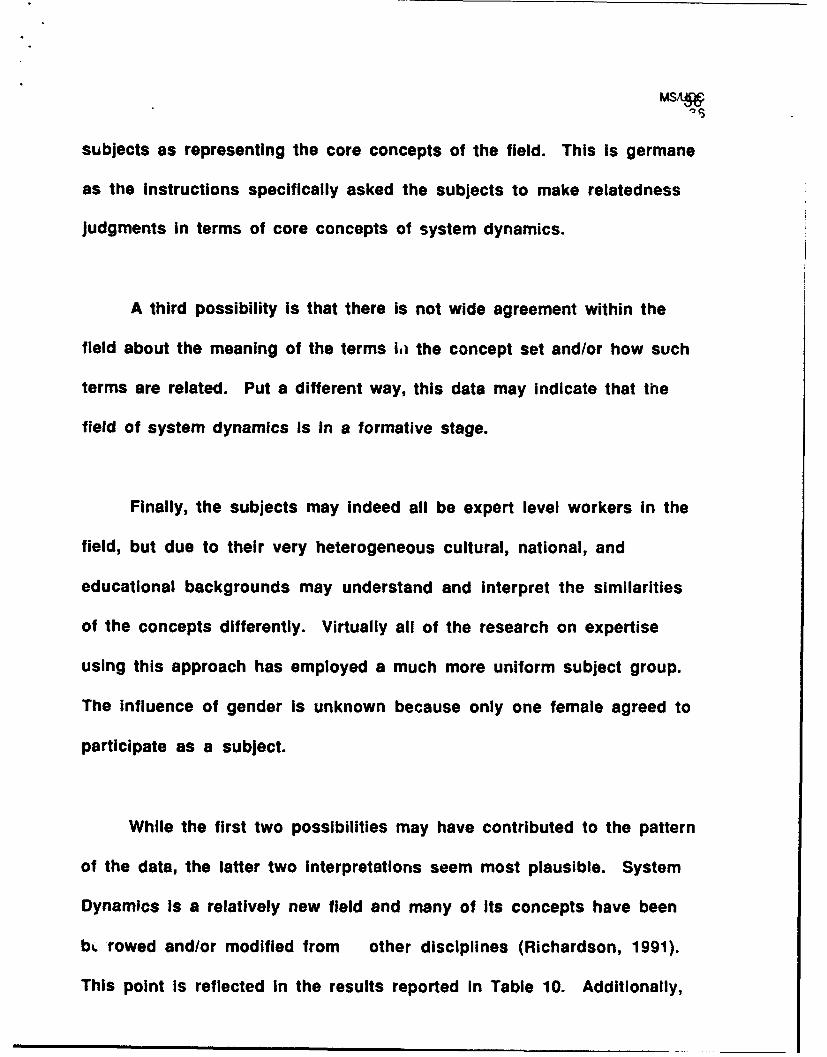
subjects as representing the core concepts of the field. This Is germane
as the Instructions specifically asked the subjects to make relatedness
judgments in terms of core concepts of system dynamics.
A third possibility Is that there Is not wide agreement within the
field about the meaning of the terms Ila the concept set and/or how such
terms are related. Put a different way, this data may indicate that the
field of system dynamics is In a formative stage.
Finally, the subjects may indeed all be expert level workers in the
field, but due to their very heterogeneous cultural, national, and
educational backgrounds may understand and Interpret the similarities
of the concepts differently. Virtually all of the research on expertise
using this approach has employed a much more uniform subject group.
The influence of gender Is unknown because only one female agreed to
participate as a subject.
While the first two possibilities may have contributed to the pattern
of the data, the latter two interpretations seem most plausible. System
Dynamics Is a relatively new field and many of Its concepts have been
b# rowed and/or modified from other disciplines (Richardson, 1991).
This point is reflected in the results reported In Table 10. Additionally,
MSAf"
37
from the limited analysis of mean agreements among US vs non-US
subjects, It does seem that experience, In the most general sense,
influences expert level understanding.
DISCUSSION
Several things were learned as a consequence of the research
project. The PathPrep software tool performed up to all expectations.
The task of selecting a subset of terms from a larger set that delimited
the knowledge domain was made simpler and more efficient than other
techniques such as card sorts. Additionally, not one of the subjects
reported any problems using the tool to make similarity judgments. No
query of any kind was made by the subjects requiring assistance in the
operation ef the PathPrep judgment tool. Every datum from each subject
was present in every diskette received. The point is that the strategy of
data collection via magnetic diskette Is feasible, at least if one is
working with knowledgeable subjects and well designed software.
It was expected at the beginning of the project that the results
would show a fairly robust similarity score among the experts. The fact
that weaker scores were obtained was a disappointment. It would be
Interesting to do the same experiment with comparable subjects In a
more established field like physics or biology to ascertain the influence

38
of the knowledge domain per so on subjects' judgments. Given the lack
of research on this question, a lesson from this study is to take a
conservative approach to sample selection and investigate expert
conceptual structure properties among a more homogeneous group.
This research was presented In a more general context having to
do with measuring changes in knowledge domains which change the
way students view the world. The Idea was to see if a general standard
existed which could be used as a criterion base to judge students'
knowledge acquisition, particularly in a computer based interactive
learning environment. The answer is a probable no and a likely yes.
It is no to the extent that, at least for system dynamics, reasonable
experts do differ in the way they organize their knowledge and hence
understand their field. This might explain why people can develop quite
different models of problems which nonetheless achieve their goals.
The answer is a tentative yes if It is the conceptual structure of a
particular teacher that is used as the standard of comparison against
which student conceptual structures are assessed. Such comparisons
may serve as a method to diagnose misconceptions and to determine
what the next Instructional message ought to be. Such

39
"snapshots",taken periodically, might reveal patterns of knowledge
acquisition during the student's progress from novice toward expertise.
This use of conceptual structure analyses is still a matter for
investigation, but the early indications are promising.
SUMMARY AND CONCLUSIONS
This project Investigated the extent to which a diverse group of
expert system dynamists had similar conceptual structures of core
concepts of their discipline. The data were derived by having subjects
make judgments of 25 terms presented randomly and assigning to each
pair a value within the range of one to nine based on the criterion of
relatedness. The data were analyzed as Pathfinder networks which
emphasize structural properties of the graphs which are assumed to
depict the relationships among the various concepts. The similarities
found were lower than previous research on experts of other fields had
achieved. Some suggestions for Interpreting the findings were offered
along with possible pedagogical applications.

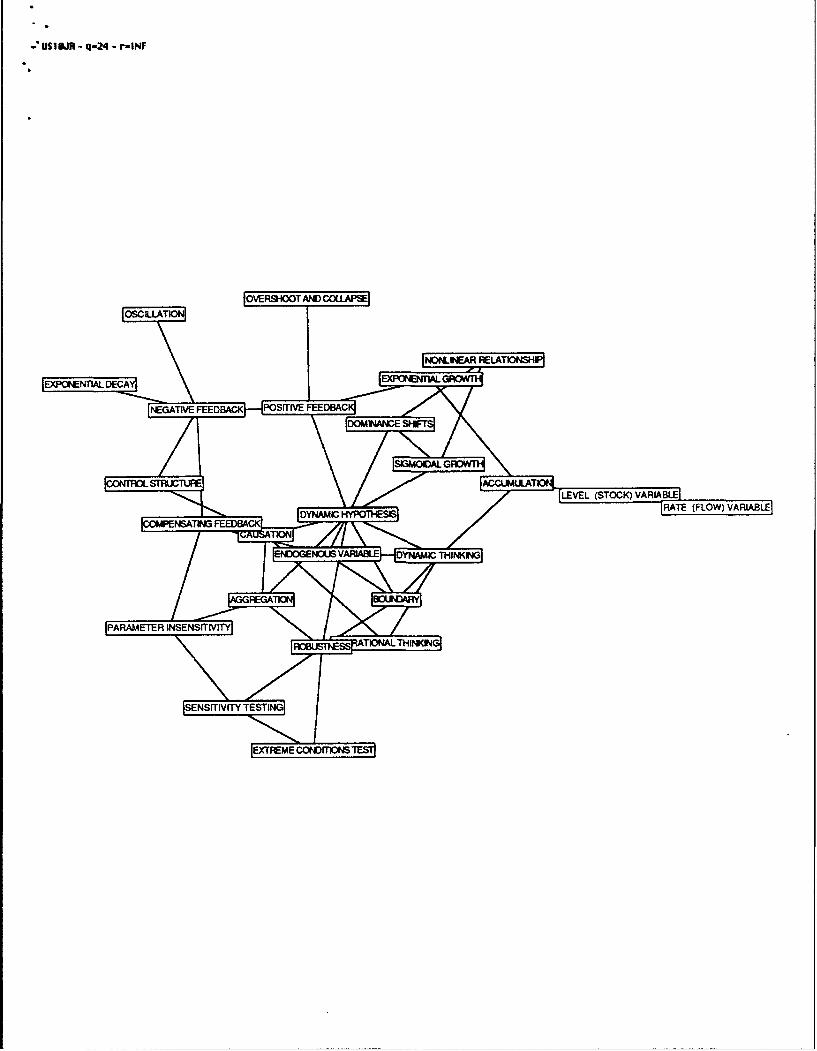
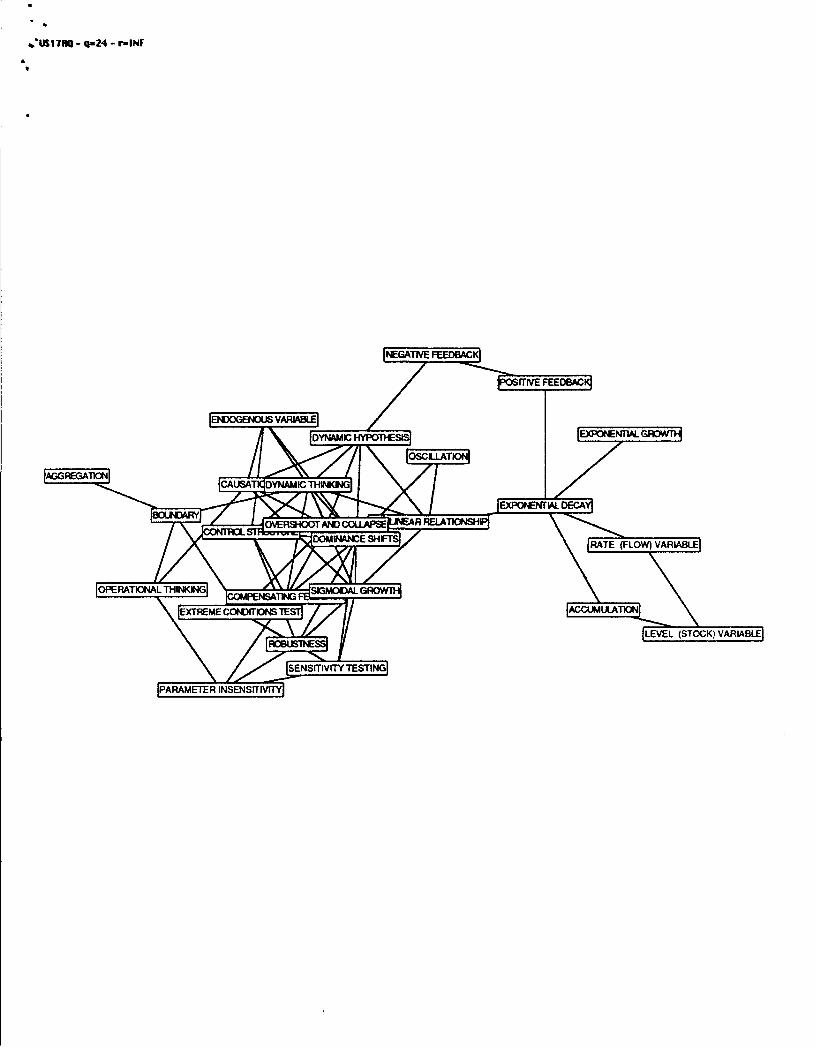
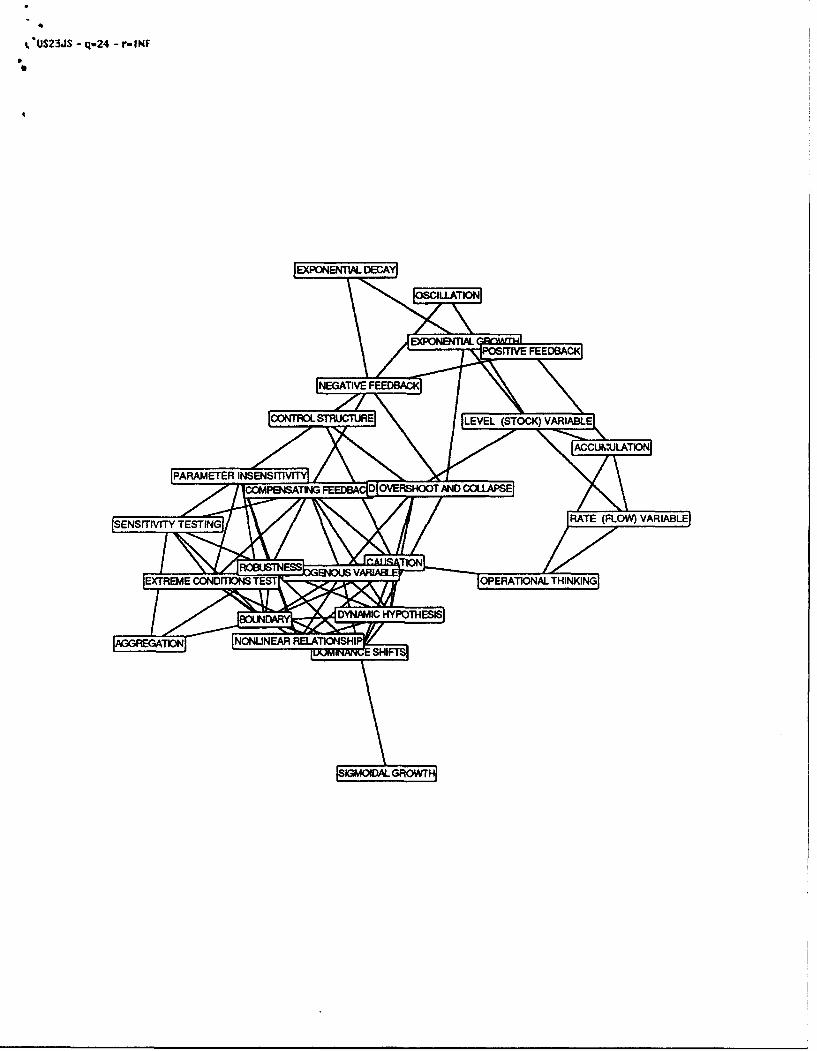
"-• -• APPENDIX
Pathfinder Graphs ofSubjects' Conceptual Structures
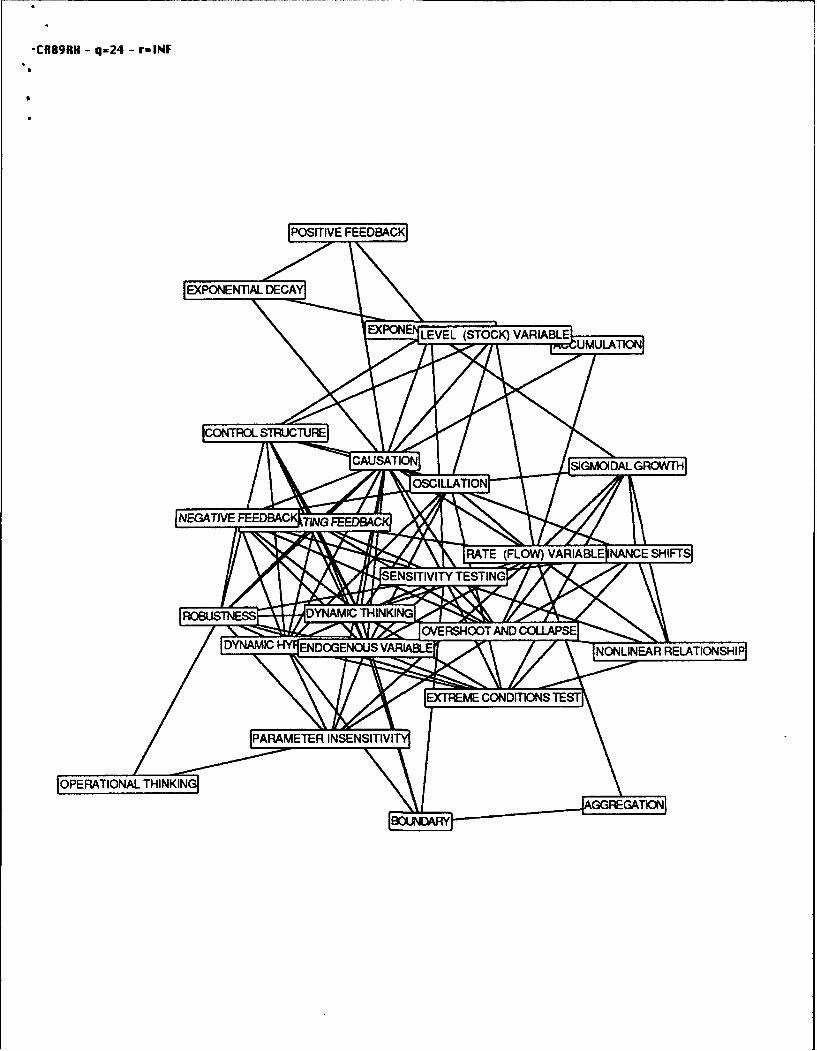
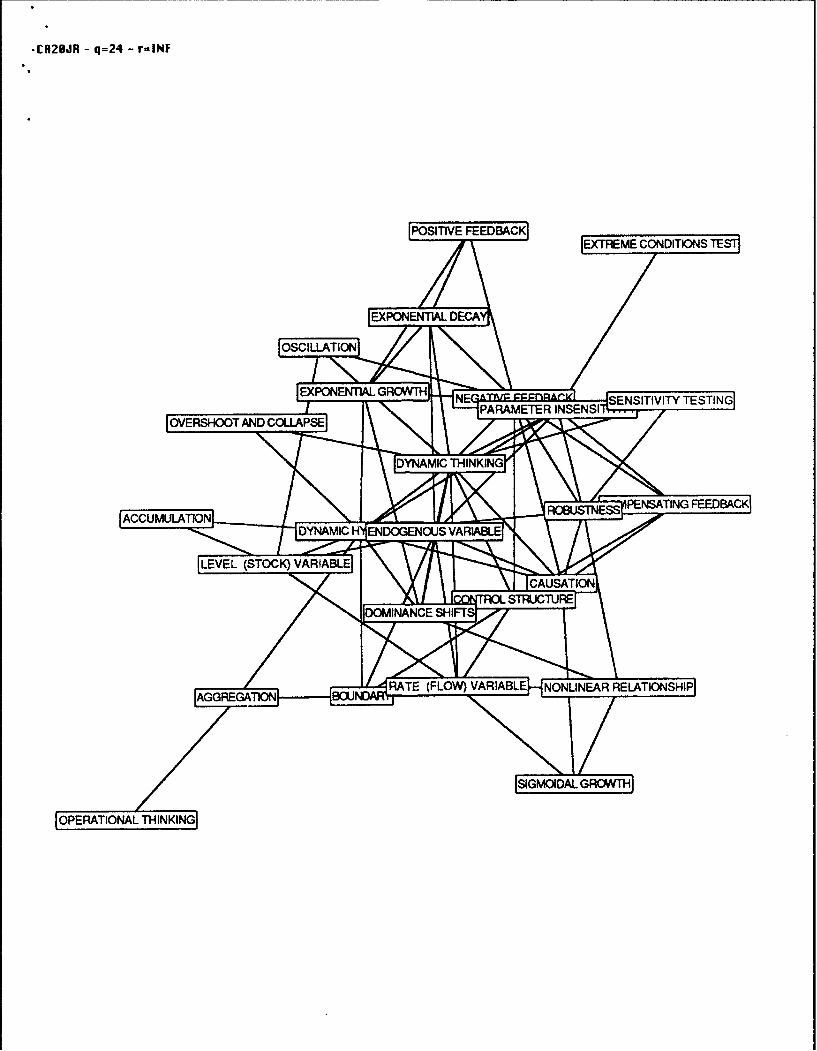
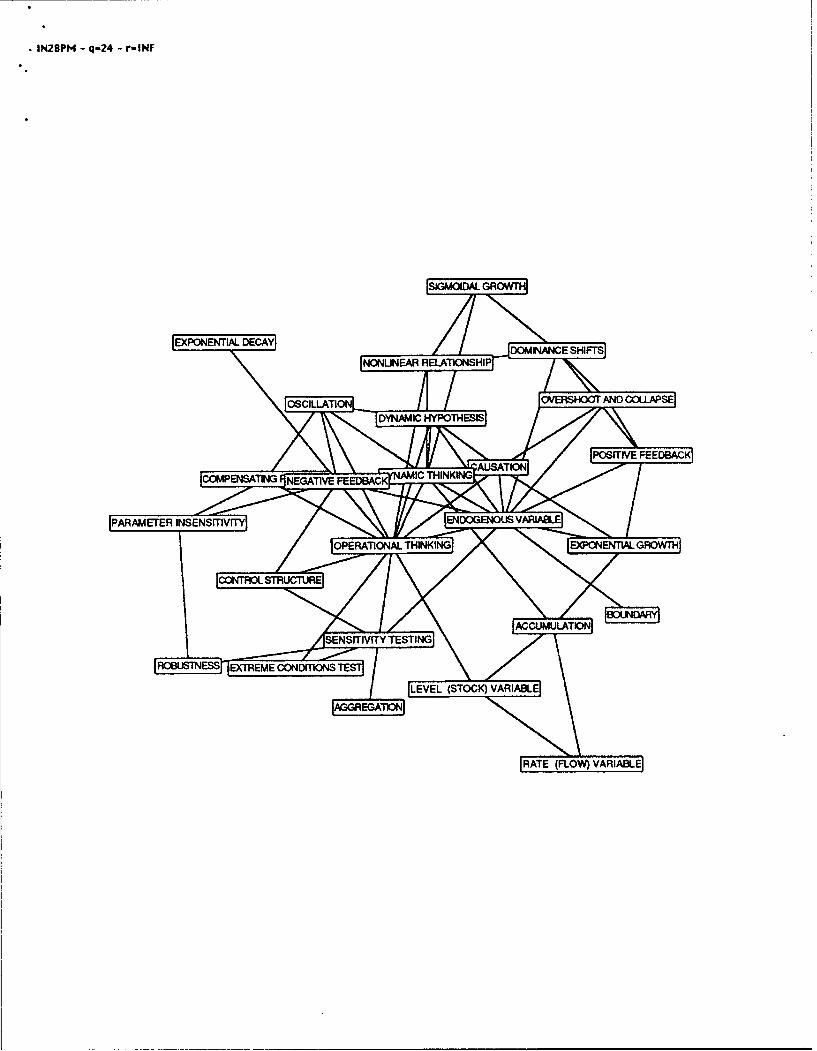
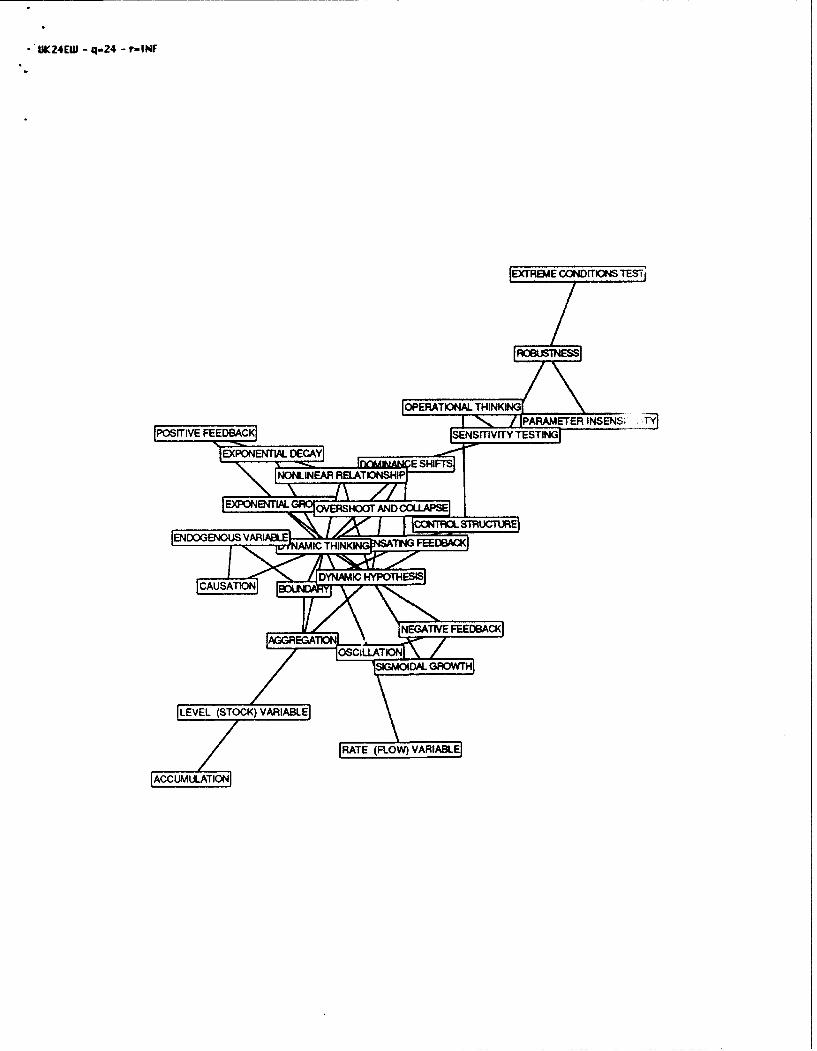
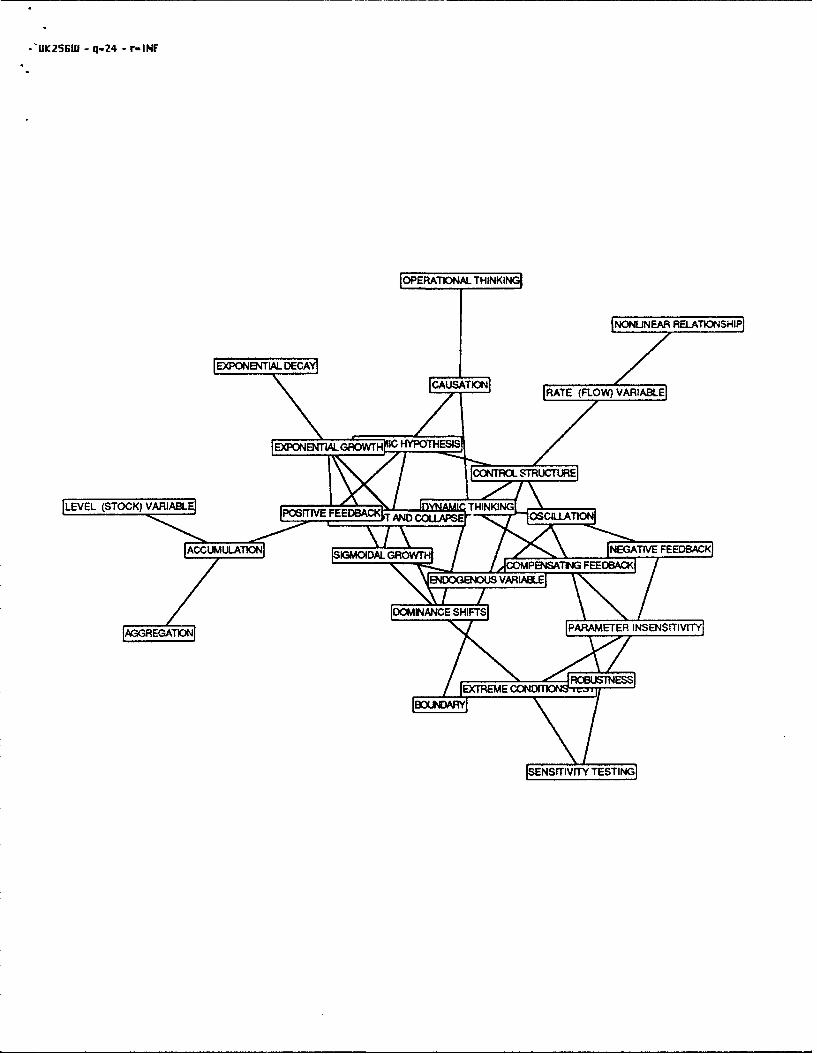
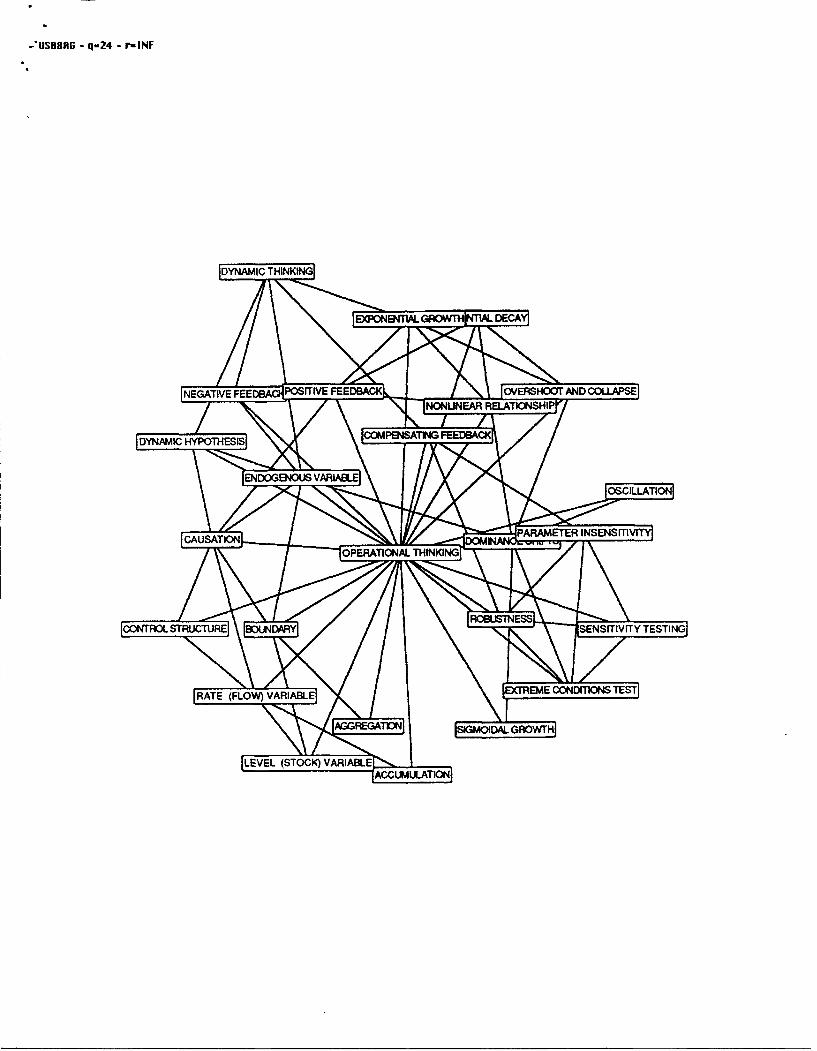
The length of the links of the Pathfinder graphs are not accuratedepictions of distances between nodes. They represent the mostefficient way to display the graph on the computer monitor. However, theneighborhood depictions are meaningful and Indicate significantassociations among concepts. The Similarity between the graphs ispresented in Tables 6 (p29) and 8 (p31)..
-CR09RH - q-24 - r-INF
jPOSrrrVE FEEDBACKI
EXPONENTIAL DECAY
EXPON LEVEL (STOCK) VARIABLE UMULAMON
ICONTROL STRUCTURE
CAUSATI N SIGMOIDAL GROWTH]
OSCILLATION
NEGATIVE FEEDBAC TUyCl EDa4
RATE (FLOW) VARIABLEPNANCE sHiFrl
SENSITIVITY TESTING
JROBUSTNESS DYNAMIC THINKING
x JOVERSHOOT AND COLLAPSEI DYNAMIC HYqENDOGENOUS VARK13LE INONLINEAR RELATION§kl]P
EXTREME CONDITIONS TEST
IPARAMETER INSENSITIVITY1
fOPEFýA-TIONAL THINKING
AGGREBOUNDARY
-CR2BJR - q=24 - r=INF
POSIIVE EEDBCK] EXTREME CONDITIONS TESTJ
EXPONENTIAL- DEC

SR29PM q-24 - r,-INF
JOPERATIONAL THINKING)
DYNAMIC THINKI
ILEVEL (STOCK) VARIABLE HYPOTHESIS NEGATIVE FEEDBACKI ACCUM
RATE (FLOW) VARIABLE] EXPONENTIAL
[POSITIVE FEEDBACKI
JENDOGENOUS VARIAELE 1PARAMETER INSENSM EXPONENTIAL
CONTROL STRUCTURE]
FC A-U-'i i T 10 N DOMINANCE SHIFTS ro-s-cý SILU
ENSITIVITY TESTING IGMOIDAL GR
FEEDBACK
BOMDARY
ROBUSTNESS
RELATIONSH OVERSHOOT AND COLLAPSE]
JEXTREMECONDTTIONSTEýý
IN28PM q-24 - r-INF
IGMOM G
1EXPONENTIAL DECAY 7! 1DOMWMA-WESHIFIrsiINONUNEAR RELATIONStf
F0`SC-l-LLA-Tl-0-Nj OVERSHOOT AND COIAPSE
DYNAMIC HYPOTHESIS1
POSITIVE FE EEDBACKAUSATION
lcompENsATNG NEGA-nvEFEEDBACKr AMICTHINK
IPARAMETER INSENSITIVFTJY ENDOGENOUSVARIABLE
JOPERATIONAL THINKING E*"ENTLALGROWTH
JCONTROLSTRU07URE
ACCUMU IONSENSITIVITY T STING
ESS E)(TREME CON
FLE-VEL (STOCK) VAR-IA-BL-El
AGGREGATION
RATE (FLOW) VARIABLEJ

ISIICJ-q-24-r-INF
INONLINEAR RELATIONSHI
IERDOGENOUS
EXPONENTIAL DE POSITIVE FEEDBACK, 'OPERATIONAL
ACCUMULATIONNEGATIVE FEEDBACK JOVERSHOOT AND COLLAPSE
I ýý ENTIAL LEVEL (STOCK) VARIABLE!
jCOMPeMTING FEED-B-A&I
CAUSATION YN IC THI
CONTROL DYNAmr, HmTHEsisRATE (FLOW) VARIABLE
JOSCI ION
FE5FrFEmEcoN E!l JSIGMODAL GiýEW7THSENSITIVITY TESTING1
Bom um7y
IDOMINANCE SHIFTS
FP-OWTNESS FWý7M-ETER INSENsm-yrr-yj
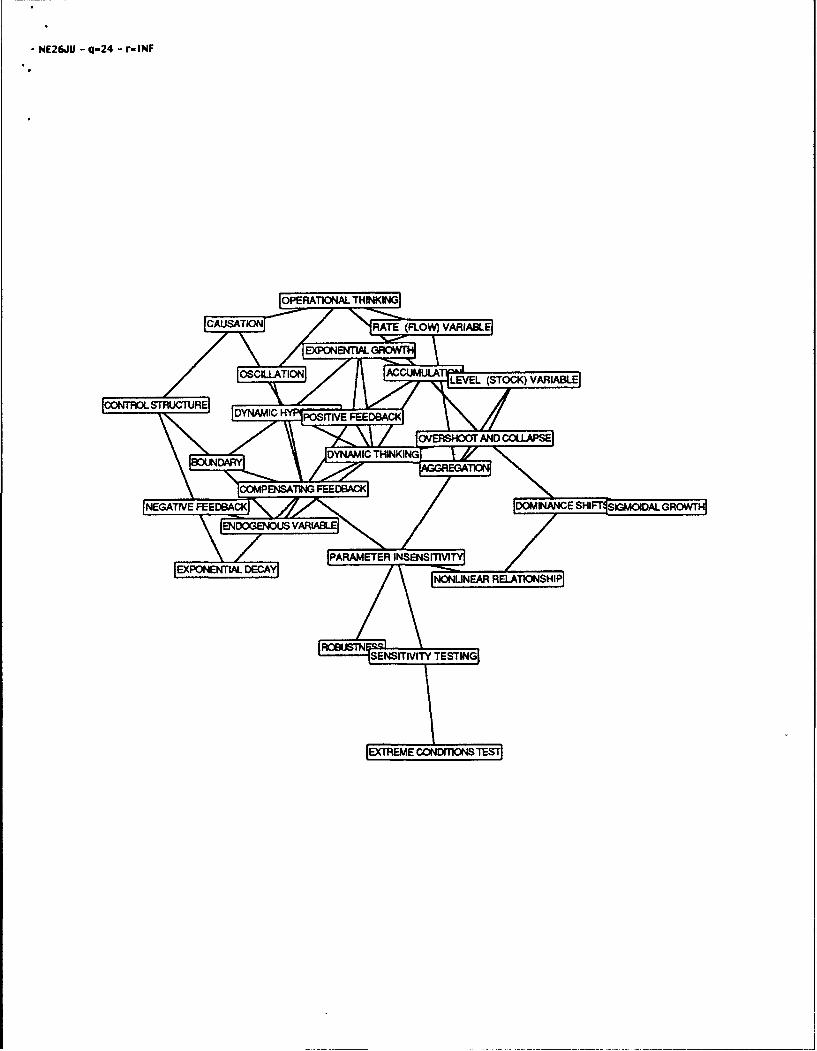
NE2fkJU - q-24 INF
OPERATIONAL THINKING
CAUSATION RATE (FLOW) VARIABLE
EXPONENTIALGROWTH
OSCILLATION ACCUM LEVEL (STOCK) VARIABLE1
ICOWFIOLSTMCRAEc)YNAmI0 Hynposrrivii FEEDBACKI
\1 / jOVU&i=AND=lAPSE
DYNAMICTHWING
N. ----icompe4SATING FEEDBACK
INEGATIVE FEEý DOM ESH 9IG4AOfDALGR3-w-r-H1
JENDOGe4OUSVARIABLEj
IPARAMETER INS5z-rn-w-iyl1EXPONENTIAL DECAY]
INONLINEAR RELATIONSHIP1
Coe
isSENSr\rlVITY TESTING1
ID(TREME cotemoNs TEST

NE27WW - q-24 - r-INF
OPERAT
ILEVEL (STOCK) VARLABL
WE FEEDBAION
0YNAMIC'THH(
1EXPON&MAL GROWTH ENCUS VARIABLE OSCILLATIONPosrr)VEFEEDBAC ENCLSVARIABLE
DYNAMC HYPOTHES'
EXTREME CONDrrIONS TEST
IRATE (FLOW) VAR NONLINEAR RELATIO61SHI
PENSATING FEEDBACK SENSITIVITY TESTI
V DOMINANCE SHIFTS1
dOlDAL. GRO"
IPARAMETER INSE
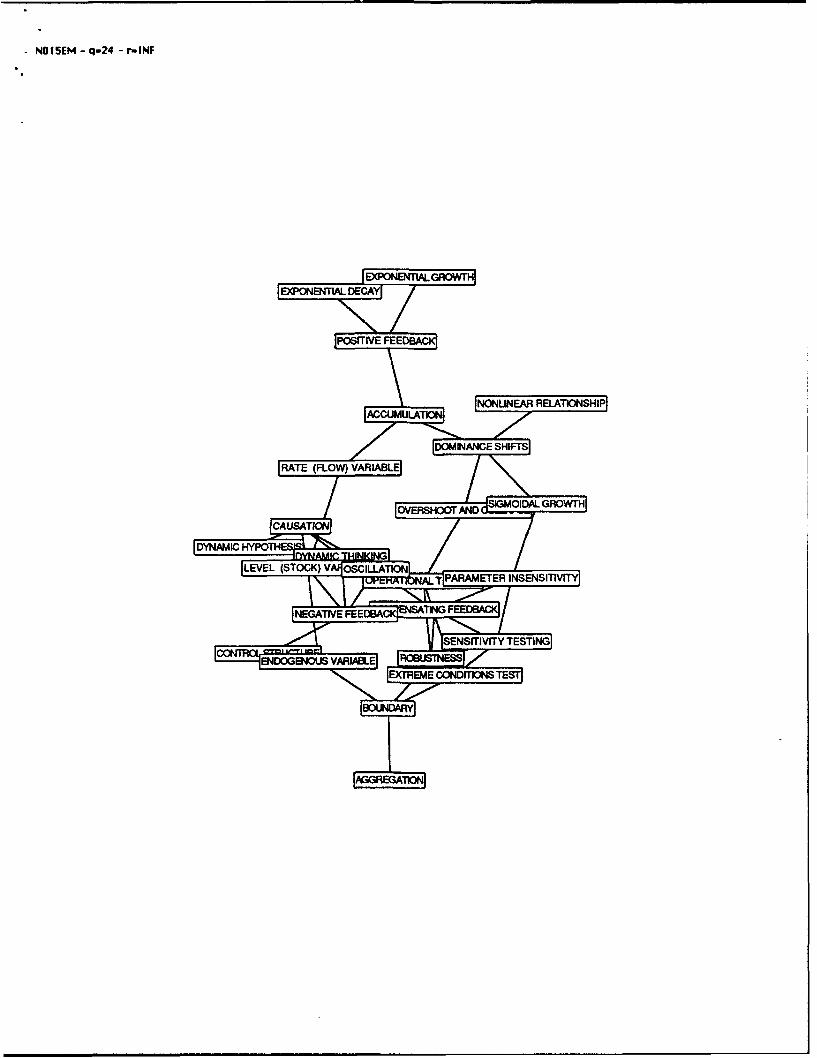
NOISEM - q-24 - r-INF
EXPONENTI&=eipmemAL DENY
POSITIVE
ACCUMULATION NONLINEAR RED 7T10-NS-Hl-Pj
DOMINANCESHIFTS
IRATE (FLOW) VARIABLg
1WERSHOOTAND OIDAL
CAUSATION
DYNAMIC HYPOTH -
ILEVEL (STOCK) VAqOSCILLATIONALT PARAMETER INSENSITIVI
NEGATIVE FEEDBACK ENSATING,
ENSITIVrTYTESTING1
ENDOGENOUS VARL48LE ROBUSTNESS
EXTREME CONDITIONS TESTI
BOUNDARY
JAGGR

N03SPO - q-24 - r-INF
CONTROL
COMPENSATING FEEDBACK
E FEEDBACK
IDOMINANCE SHIFTS W01DALGROWTH CIS
ICAUSATION ELATIONSHI POSITIVE
JOVERSHOOT AND COLLAPSEDYNAMIC HYPOTHESIS
JOPERATIONAL THINKING AMICTHINKING
N
EXPONE
rg-ATE (FLOW) VARIABLE ACCUMULATIONL JEXPONenALDECAYj
FL-EVEL (STOCK
ERFREME CONDITIONS TESýT
PARAMETER INSENSITIV17TY
BOLIN \
ROBUSTNE SENSITIVITY TESTING1
JENDOGB40US VARIABLE]
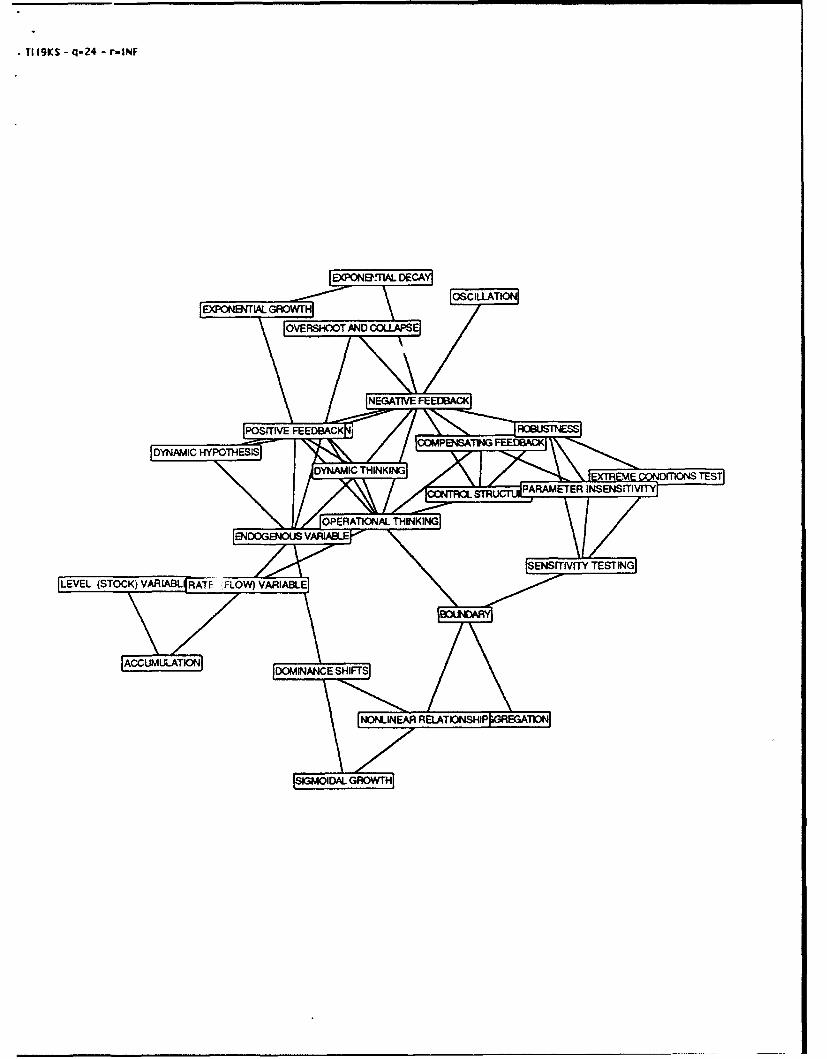
TI 19KS - q-24 INF
I E)PONe.TlAL DECAY1
E*oNefnx GROWTH OSCILLAMON
D COUAPSEJOVEW"ý)OTAN
1 7
NEGATIVE FEEDBACK
jPOSrrlVE FEEDBACKENSATING FEEDBACK
DYNAMIC HYPO ESZJ I
)DYNAMIC THINKING1 1EXTREME gQt TEST___ _222GPARAMETER INSENSITivi-tyl
OPERATIONAL THINKINGJENDOGENOUS VARIABLE
\V
jSENSrTIV
[LEVEL (STOCK) VARLABL RATE -FLOM VARIABLE
JACCUMULATION IDOMINANCE SHIFTS
NONLINEAR RELATIONS
IDAL GROWTH
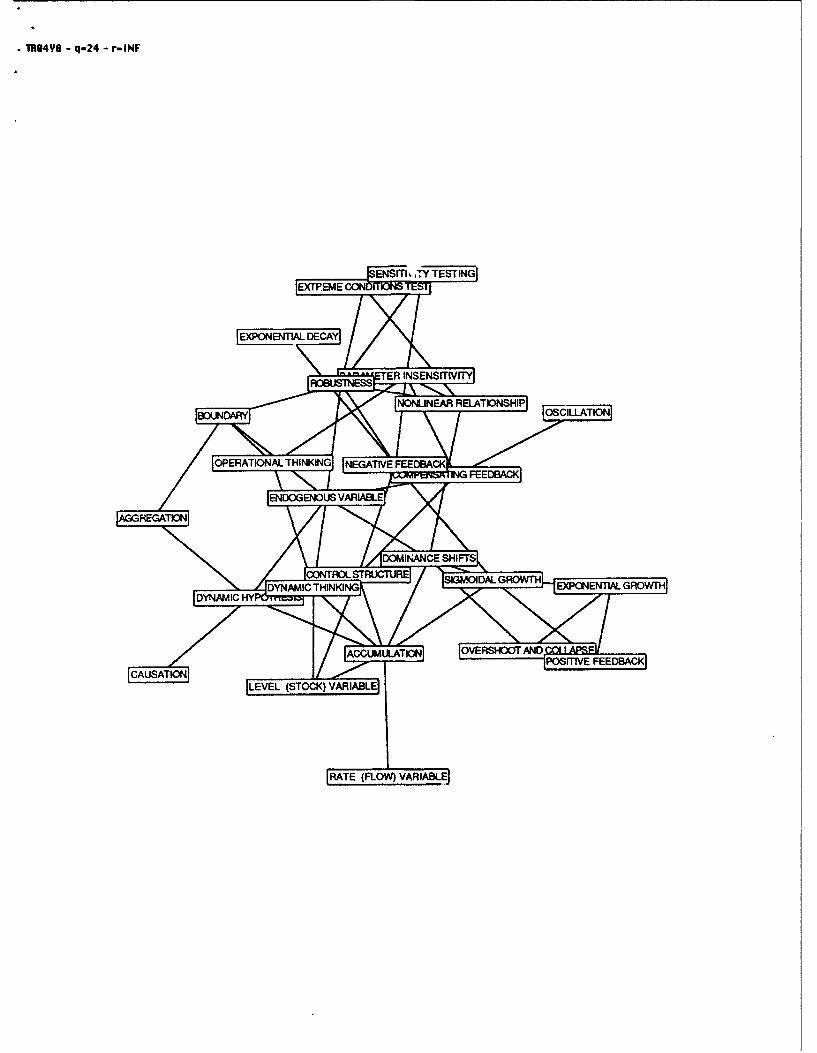
T R94YB q-24 - r-INF
-FS-ENSITI~ ý.-Y -TESTIN-GJEXTFPEME CONWOSET
EXPONE(NOWIAL DECAE
UK65GC - q-24 - r-INF
1PARAMETER INSENSrTfwV
SENSITIVITY TESTING NONLINEM RELATIONSHIP1I-ROBUMNESS
z EXTREME CONDITIONS TE
Fo-S-C-jL-L-A-TjO--Nj JCOMPENSA7M FEEDBACKI S GROWTHI
NEGATIVE FEEDBACK CAUSATION
EXPONENTIAL DECAY OPERATIONALTHINKING DC*AINANCE SHFTSj
CONTROL STRUCTURE OVERSkWT AND 0OLLAPS7E
ENýENOUS VARIABLE IC THfNK 'POSITIVE FEEDBACKI
DYNAMIC HYPO114ESISS,
E)PONENTIALGPOWTHI
jAccumuLATioNjAGG RATE (FLOW) IABLE
LýIEVEL (STOCK) VARIA78LE
-'UK24EW - q-24 - r-INF
lExTREmE CONDITIONS TES-ij
P40BUSTNESS
-'oýJOPERATIONALTHINKING _ __ --iýlN.,, / 1PARAMETER INSENS'lF-FrIVE FEEýýCK NSrTIVrrY TESTING[-----
JEXPONENTX DE75ýYj E " SHINONLINEAR REIATIKONS +P
LOLý ,
JENDOGENOUS VARIAeLE
r
AM
_ IVARIA"
E AMIC THIWINGM!ýtTýff-
FEEýýg
'C
THINK"
DYNAMIC HYPOTHESISICAUSATIOqN
NEGATIVE FEEDBACKI
GA NEGATIVE
FE6AGGRE.A
IOSCiLLATIONTH4T I %ON
jSrMOIDAL GROWTH)
LEVEL (STOCK) VARIABLE
IRATE (FLOW) ýVARI ýE
ACCUMULATION
-'UK2SGW - q-24 - r-INF
JOPERATIONAL THINKING1
ILEVL (TOC) VRIALE OSIIVEFEEBAC AND CO0LLAPSE THNIG OSCLLATION

-'USSNF - q-24 - r-lNF
IRATE (FLOW) VARIABLg
ILEVEL (STOCK) VARIABý
IDMONENTIAL DECAY LNULATION
[NEGATIVE FEEDBACKe!!I& GROWTHI
\ - - Z \pOSrrjVE FEEDBACK CE SHIFTS[
GROWTH AN
Is DAL \ 7 DCOLLAPSE1
(NONLINEAR RELAT HIPII Zbb -
IPARAMETER INSENSITIVayýUN
)I-..- -- ,/ \
j
ENSITIVITY TESTING1 -
[OPERATIONAL THINKING rHESIS ENSATING FEEDBACK
9ýiF
IMMSMESS1
ENDOGENOWVARIABI.Effpý
IDYNAMIC THINKING1
-'US8886 - q-24 - INF
DYNAMIC THINKING1
EXPONIENTALGA(WTH DE60M
NEGATIVEF EDBA POSITIVE FEEDBACK FO-VERSHOOT AND Ca-LAPSE]NONLINEAR RELATIONSHIP
DYNAMIC HYPOTHESIS COMPENSATING FEEDBACK
ENWGB40LIS VARIABLEOSCILLATION
CAUSATION DOM PARAMETER INSENSITIVITY]
OPERATIONAL THINKING[-T-
[CONT STRUCTURE BDUNDARY ROBUSTNESS SENSITIVITY
[RATE (FLOW) VARIABL EXTREME CONDITICNS TESTI
P&-R-E-G-AT-10--Nj D A L 9; 5 -wrTHj
(LEWL (STOCK) VARIABLEC-ý,.^A;UMULAllU"j
-USII8JR- q-24 - r-INF
JOVRSI-1OTAND COLLAPSEOSCILLATq
INONWIEAR FLATIONSHI~
JEXPOtNENTIAL DECA EXPONENTIAL
WEGAT1VE FEEDBAC POSFTIVE FEEDBACDOMINANCE
SISMOIDAL
COTCSTRJCTLJEACUtACONTOLSRUCTRE CCUMLAT LEVEL (STOCK) VARIABLE
lCOMENSAING EEDBCK YNAMC KYOTHEOLRýATE (FLOýW) VARIABLEI

-'US14NM q-24 - r-INF
JACCLIMULATIONI
LEVEL (STOCK) VARKSLE
IRATE (FLOM VARIABLEI
7 OSCILLATK)N
JOYNAMIC THINK7tNG] INONLINEAR RELATIONSNPI
12AHOOT AND C LAPSEJ
/,Lc!rvýNEGATIVE FEEDBACKJ--j
ENDOGENOUS VARLABLEN I ENTIAL DECAY
JCOMPOZý ýTM FEEDBACK
DARY
x ROBLZTNESS
f5PERATMALTHINKINGI
IDOMINANCE SHlffý
: ':mIN'
EA:RAMETTER INSENsrrivrTY]REGATK)N
Eq
Z Z JEXTREME COMMONS TE GROWrH
D
I POSMVE FEEDBACK
FFNAMIC HYPO ESIS EnýZ 7PENsrnvITY
FOPMEWI&GROWTHI
%hUS17no - 4-24 - r-INF
FIEGATM J~~CAUISATI DYNAMIC TH SLAKN
1EXPONENTLAL.DC
DOM kC SHRATE (FLOW) VARLABLEJ
EXTREE CODIT )N~lS~l ACCUIMLILAT)Nj
ILEVEL (STOCK) VARAL

*US I8M4R - q-24 - rINF
flTMVE F
IE*GO~NT1ADECA
NEGATIV FEEDBACK

k US21JRt - q-24 - r-INF
1POSITIVE FEEDBACK)
1PARRATEE (FLOW)SVAIIATY
%'US23JS- q-24 -r-INF
JID(PONENTIAL DECAY
JOSCILLATION1
POSITIVE FEEDBACKI
INEGATIVE FEEDBACK
1-1017STRUCTURE LEVEL (STOCK) VARIABLE
ACCUMULATIONJ
SENSITIVITYJCOKAPENSATING FE D OVERSHOOT AND COLLAPSE
!VARIABLE)
ISENSITivrry TESTING RATE (FLOM
ROBUSTNESS ENOUS VARIABLE ION /-.,ZEXTREME CONDITIONS TE OPERATIONAL THINKING
BOUNDARY IC HYPOTHESIS
JAGGREGATION1 [NONLINEAR RELATIONSHIP.100MINAME SHIffis
ISGMOIDALG