-monthly market review - nse · between an observation of low volatility and crises making ex ante...
TRANSCRIPT

June 2018
-Monthly Market Review

National Stock Exchange of India Limited – Jun 2018 1
Global Regulatory Scanner
US Federal Reserve releases note on ‘Low Risk as a Predictor of Financial Crises’
Most empirical literature on early warning indicators (EWIs) of financial crises, has the view
that likelihood of crises increases along with measured risk, typically measured by ex-post
outcomes in financial markets--price movements or volatility, VIX, CDS spreads, volumes and
other activity measures like SRISK (Acharya et. al 2012) and the ECB systemic risk composite
indicator. The theoretical literature suggests that such EWIs are likely to be of limited use.
They signal high risk once a crisis is underway, but do not provide much in terms of ex ante
prediction, limiting their usefulness.
Economic theory suggests that perceptions of risk, especially when they deviate from what
economic agents have come to expect--affect risk taking behavior. This leads to the instability
hypothesis, where economic agents observing low financial risk are induced to increase risk-
taking, which in turn may lead to a crisis. One of the ways that stability can be destabilizing is
as follows:
At the start, economic agents observe that volatility is lower than what they have come to
expect. This fuels optimism, making the agents more willing to take more risk. This is
manifested within the banking sector, which will both lend more than it did before and also
make riskier loans. Eventually, loan defaults mount, a banking crisis ensues, at which time
volatility increases sharply. This chain of events implies that a considerable time passes
between an observation of low volatility and crises making ex ante prediction possible. An
observation of high volatility directly results from a crisis, implying that by the time volatility
peaks, it is too late to react--a drawback of ex post measures.
In the aftermath of the 2008 crisis, policymakers are actively searching for signals of future
financial and economic instability and developing policy tools to mitigate the crisis. Most EWI
of crises are founded on ex-post market data, typically volatility in some form or another, where
increasing volatility indicates the financial system has become more risky, and a crisis is
therefore more likely. However, an observation of high risk is the consequence of a stress event
where financial instructions are in difficulties, not the cause. It will be more fruitful to search
for EWIs amongst the fundamental drivers of financial instability. A major cause of financial
crises is excessive risk-taking by economic agents when they perceive a low risk environment
and are endogenously incentivized to take more risk, which ultimately culminates in a crisis.
With help of data, the authors confirm this view. The policy authorities and private institutions
would consequently benefit from using low volatility as a crisis indicator since an observation
of current low volatility implies that a future crisis is more likely.
For more details see:
https://www.federalreserve.gov/econres/notes/feds-notes/low-risk-as-a-predictor-of-financial-
crises-20180509.htm

2 National Stock Exchange of India Limited – Jun 2018
Global News
China’s manufacturing Purchasing Managers Index (PMI) slips in June 2018 amid
escalating trade conflict with the US
The key highlights of the report published by National Bureau of Statistics of China:
China’s manufacturing PMI stood at 51.5% in June as compared 51.9% in May, a
decrease of 0.4%.
The PMI of large-sized enterprises was 52.9%, a decrease of 0.2% from last month,
whereas the PMI for medium-sized enterprises was 49.9%, a decrease of 1.1 % over
the same period.
However, the PMI for small-sized enterprises increased 0.2% from last month to
49.8%.
The production sub-index fell to 53.6% in June from 54.1% in May, while the new
orders sub-index declined to 53.2% from 53.8% indicating slowdown in the growth of
manufacturing.
The new export orders sub-index fell to 49.8% from 51.2% in May, indicating
weakening demand from other countries.
Main raw materials inventory sub-index was 48.8%, a decrease of 0.8% from last
month, and was lower than the threshold, indicating decline in the inventory levels of
manufacturing industry.
Employed person sub-index was 49.0%, a decrease of 0.1% from last month, lower
than the threshold, indicating a decrease in the labour employment in the
manufacturing enterprises.
The non-manufacturing PMI, covering services and construction, rose to 55% in June
as compared to 54.9% in May and 0.2% higher than the average of the first half of the
year, indicating steady expansion in the non-manufacturing sector.
The composite PMI Output index covering manufacturing and services activity stood
at 54.4% in June, a decrease of 0.2% from last month but higher than the average for
the first half of the year.
For more details see:
http://www.stats.gov.cn/english/PressRelease/201807/t20180704_1607714.html
Key circular issued by SEBI in June 2018
Review of Investment by Foreign Portfolio Investors (FPI) in Debt (SEBI: June 15, 2018)
In accordance with RBI circular A.P. (DIR Series) Circular No. 31 dated June 15, 2018, the
changes to operational aspects of FPI investment in debt are set forth below:
It has been decided to withdraw minimum residual maturity restriction of three years
for investment by FPIs in G-Secs and SDLs. Further, the auction process being carried
out by BSE/ NSE shall be discontinued from the date of this circular.
Till date, depositories were monitoring the G-Sec/ SDLs utilisation limits and reporting
to SEBI. Henceforth, the overall monitoring of G-Sec/ SDLs will be done by Clearing
Corporation of India Ltd.(CCIL)

3 National Stock Exchange of India Limited – Jun 2018
Thus, any circular previously issued by SEBI from time to time for monitoring of G-
Sec and SDLs stands withdrawn and hence, shall not be applicable to FPIs for
investments in G-Secs and SDLs from June 1, 2018. However, FPIs may be guided by
RBI circular dated June 15, 2018 referred above for the requirements of G-Secs and
SDLs.
Further, revised requirements for FPIs investments in corporate debt securities are
placed as Annexure (see circular link for details).
It is clarified that the primary responsibility of complying with monitoring the corporate
debt investment limits is with the FPIs on whose behalf depositories will monitor the
investment limits. As the depositories are maintaining the data on investor group level,
depositories shall monitor the investments at the investor group level. Custodians shall
be responsible for monitoring their own clients.
At the time of monitoring the corporate debt investment limits, depositories shall
identify the FPIs in breach and inform to their respective custodians who in turn shall
advise their FPI clients for the needful. For the monitoring of G-Secs/ SDLs utilisation
limits by CCIL, depositories shall share the investor group data with RBI and CCIL on
a monthly basis.
The stock exchanges and depositories shall put in place the necessary systems for the
online monitoring of the investment limits
To view the circular, please refer to: https://www.sebi.gov.in/legal/circulars/jun-2018/review-
of-investment-by-foreign-portfolio-investors-fpi-in-debt_39284.html

4 National Stock Exchange of India Limited – Jun 2018
Performance of Broad Market Asset Class
Exchange Current Month
Previous Month
MOM Change
YOY Change
Mar’18 -Current
YTD Change
(Jan – current) EQUITY
NIFTY 50 NSE 10714.30 10736.15 -0.20% 12.53% 5.94% 1.74%
NIFTY BANK NSE 26364.20 26956.20 -2.20% 13.58% 8.66% 3.23%
NIFTY IT NSE 13989.50 13666.00 2.37% 37.76% 11.81% 19.92%
INDIA VIX NSE 12.94 13.22 -2.16% 10.27% -17.90% 2.11%
DOWJONE NYSE 24271.41 24415.84 -0.59% 13.69% 0.70% -1.81%
NASDAQ NASDAQ 7510.30 7442.12 0.92% 22.31% 6.33% 8.79%
FTSE 100 CFD 7636.93 7678.20 -0.54% 4.43% 8.22% -0.66%
HANGSENG CFD 28955.11 30468.56 -4.97% 12.38% -3.78% -3.22%
NIKKEI CFD 22304.51 22201.82 0.46% 11.34% 5.41% -2.02%
COMMODITY
GOLD CFD 1251.30 1300.10 -3.75% 0.85% -5.41% -4.21%
SILVER CFD 16.10 16.40 -1.82% -2.80% -0.73% -5.60%
COPPER CFD 2.95 3.06 -3.50% 9.34% -2.25% -10.03%
ZINC CFD 2856.75 3103.25 -7.94% 3.56% -12.84% -13.91%
ALUMINIUM CFD 2131.75 2291.50 -6.97% 11.04% 6.33% -6.32%
NICKEL CFD 14950.00 15292.50 -2.24% 59.51% 11.73% 18.16%
CRUDE- WTI CFD 74.15 67.04 10.61% 61.06% 14.18% 22.72%
CRUDE- BRENT CFD 79.44 77.59 2.38% 65.78% 13.05% 18.80%
NATGAS CFD 2.92 2.95 -0.95% -3.66% 6.99% -0.98%
CURRENCY
USDINR Real Time FX 68.46 67.43 1.53% 5.94% 5.14% 7.24%
EURUSD Real Time FX 1.17 1.17 -0.06% 2.27% -5.02% -2.61%
USDJPY Real Time FX 110.68 108.82 1.71% -1.51% 3.99% -1.78%
GBPUSD Real Time FX 1.32 1.33 -0.68% 1.40% -5.76% -2.26%
US Dollar Index Real Time FX 94.35 93.96 0.42% -1.12% 5.06% 2.74%
MONEY MARKET
10Y US BOND NSE 2.86 2.86 0.00% 24.13% 4.34% 18.92%
10Y IND BOND NYSE 7.90 7.83 0.98% 21.38% 6.83% 7.99%
Source: in.investing.com

5 National Stock Exchange of India Limited – Jun 2018
Primary Market Statistics
Capital Raised
Capital Raised in the Month Rs Mn USD Mn
Newly issued shares (IPOs)- 986.58 14.39
FPOs 0.00 0.00
Public issue of NCDs 109447.86 1596.02
Further Issues (FIs) 238327.16 3475.41
Total 3,48,761.60 5085.82
Main Board Listing of the Month - Adani Green Energy Limited
Sector Energy
Market Capitalisation (INR Crores) 4926.64
No of times subscribed -
Listing Gains -
SME Listing of the Month - Accuracy Shipping Limited
Sector Logistics
Market Capitalisation (INR Crores) 130
No of times subscribed 1
Listing Gains 4.76%
IPO Listed during the month
Sr. No. Listing Date Symbol Company Name Series
1 04-Jun-2018 SUULD Suumaya Lifestyle Limited SM 2 04-Jun-2018 SVLL Shree Vasu Logistics Limited SM 3 05-Jun-2018 DSML Debock Sales And Marketing Limited SM 4 05-Jun-2018 LATTEYS Latteys Industries Limited SM 5 14-Jun-2018 SONAMCLOCK Sonam Clock Limited SM 6 18-Jun-2018 ADANIGREEN Adani Green Energy Limited BE 7 20-Jun-2018 OSWALSEEDS ShreeOswal Seeds And Chemicals ltd SM 8 21-Jun-2018 PRITI Priti International Limited SM 9 22-Jun-2018 ACCURACY Accuracy Shipping Limited SM 10 27-Jun-2018 SOLARA Solara Active Pharma Sciences ltd BE 11 28-Jun-2018 GAYAHWS Gayatri Highways Limited BE 12 29-Jun-2018 TALWGYM Talwalkars Lifestyles Limited BE

6 National Stock Exchange of India Limited – Jun 2018
Secondary Market Statistics
Institutional Flows 1. Institutional Flows- CM Gross
Broad Category Buy Value (Rs Crs) Sell Value (Rs Crs) Net (Rs Crs)
DII 71921.28 58817.17 13104.11
FII 97330.03 108784.77 -11454.74
2. Institutional Flows- F&O Gross
Broad Category Buy Value (Rs Crs) Sell Value (Rs Crs) Net (Rs Crs)
DII 76099.49 81152.78 -5053.29
FII 2194620.22 2173660.89 20959.33
3. Institutional Flows- CDS Gross
Broad Category Buy Value (Rs Crs) Sell Value (Rs Crs) Net (Rs Crs)
DII 10202.26 8649.52 1552.74
FII 46423.53 40974.77 5448.77
Flagship Index “NIFTY 50” Statistics
Number of constituents : 51
Derivatives available : YES
ETFs available : 14
PE 25.90
PB 3.61
Div Yield
1.22

7 National Stock Exchange of India Limited – Jun 2018
Average Daily Turnover (INR Crores)
4. Equity Market
Product Current Month
Previous Month
Change Previous FY
Current FY
YTD
Cash Market 28180.57 31823.78 -11.45% 29416.08 30210.41 32122.44
Exchange Traded Funds 146.63 137.13 6.93% 126.42 137.69 150.49
SME EMERGE 23.36 25.12 -7.00% 22.49 25.35 28.89
Sovereign Gold Bonds 0.39 0.30 30.45% 0.35 0.40 0.43
InvITs 4.55 7.02 -35.14% 16.57 5.41 7.00
Mutual Funds (Close Ended) 2.75 0.08 3193.73% 0.30 1.26 0.95
5. Equity Derivatives - Index Futures
Product Current Month
Previous Month
Change Previous FY
Current FY
YTD
BANKNIFTY 10282.75 9178.20 12.03% 8031.17 9545.66 9859.06
NIFTY 11976.57 11065.29 8.24% 11477.95 11467.22 13370.36
NIFTYCPSE 0.00 0.00 0.00 0.01 0.00 0.00
NIFTYINFRA 0.00 0.00 0.00 0.01 0.00 0.00
NIFTYIT 26.67 35.17 -24.19% 18.27 36.97 33.01
NIFTYPSE 0.01 0.00 0.00 0.01 0.00 0.00

8 National Stock Exchange of India Limited – Jun 2018
6. Equity Derivatives - Index Options
Product Current Month
Previous Month
Change Previous FY
Current FY YTD
BANKNIFTY 1247.12 1101.30 13.24% 741.07 1105.91 1083.58
NIFTY 1131.29 1044.71 8.29% 1131.48 1092.97 1322.82
NIFTYCPSE 0.00 0.00 -100.00% 0.00 0.00 0.00
NIFTYINFRA 0.00 0.00 0.00 0.00 0.00 0.00
NIFTYIT 0.00 0.00 0.00 0.00 0.00 0.00
NIFTYPSE 0.00 0.00 0.00 0.00 0.00 0.00
7. Currency Derivatives- Futures
Product Current Month
Previous Month
Change Previous FY
Current FY
YTD
EURINR 839.30 837.89 0.17% 663.91 810.30 833.53
EURUSD 374.28 497.36 -24.75% 340.39 350.89 348.24
GBPINR 955.78 909.21 5.12% 803.35 964.28 988.20
GBPUSD 188.96 159.61 18.39% 280.20 172.30 199.60
JPYINR 263.33 183.00 43.89% 190.85 216.22 228.16
USDINR 14519.96 15739.12 -7.75% 9012.42 14587.17 12637.93
USDJPY 8.96 9.43 -5.01% 18.31 10.34 12.36
8. Currency Derivatives- Options
Product Current Month
Previous Month
Change Previous FY
Current FY
YTD
EURINR 0.06 0.10 -40.28% 0.19 0.10 0.12
EURUSD 0.00 0.00 0.00 0.00 0.00 0.00
GBPINR 0.03 0.05 -39.67% 0.02 0.06 0.05
GBPUSD 0.00 0.00 0.00 0.00 0.00 0.00
JPYINR 0.01 0.01 45.06% 0.01 0.01 0.01
USDINR 42.12 44.83 -6.04% 31.18 40.73 35.54
USDJPY 0.00 0.00 0.00 0.00 0.00 0.00
9 National Stock Exchange of India Limited – Jun 2018
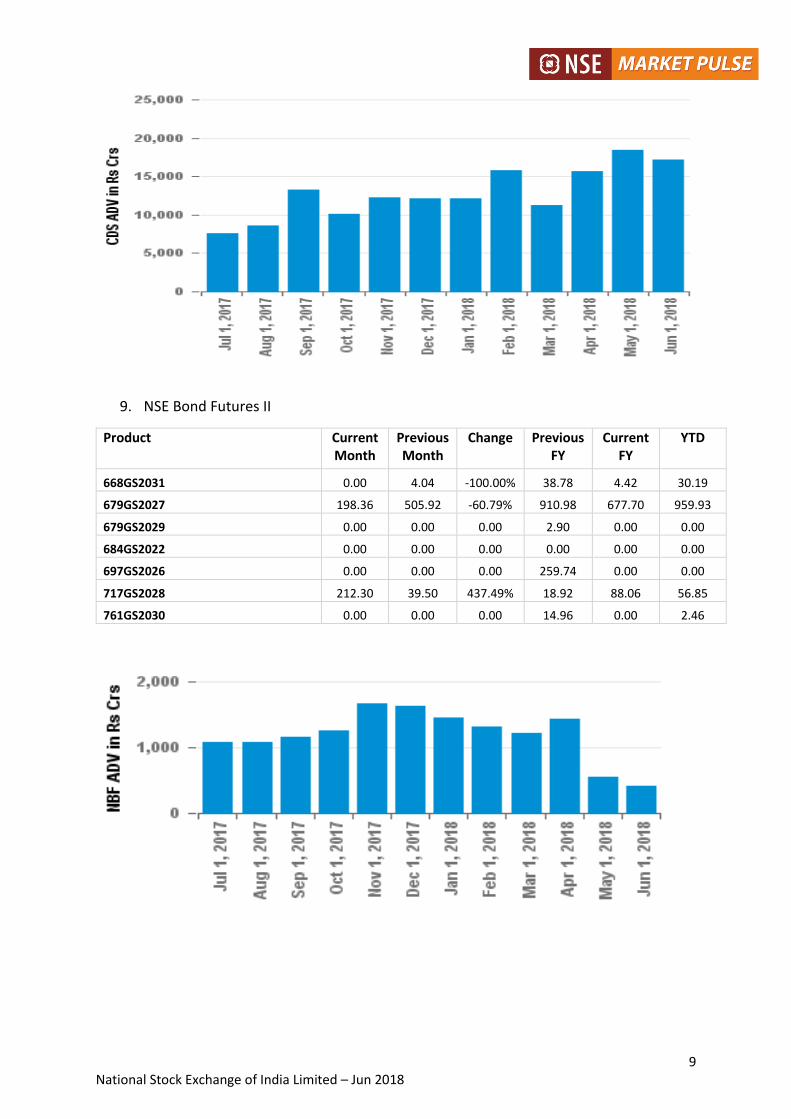
9. NSE Bond Futures II
Product Current Month
Previous Month
Change Previous FY
Current FY
YTD
668GS2031 0.00 4.04 -100.00% 38.78 4.42 30.19
679GS2027 198.36 505.92 -60.79% 910.98 677.70 959.93
679GS2029 0.00 0.00 0.00 2.90 0.00 0.00
684GS2022 0.00 0.00 0.00 0.00 0.00 0.00
697GS2026 0.00 0.00 0.00 259.74 0.00 0.00
717GS2028 212.30 39.50 437.49% 18.92 88.06 56.85
761GS2030 0.00 0.00 0.00 14.96 0.00 2.46
10 National Stock Exchange of India Limited – Jun 2018
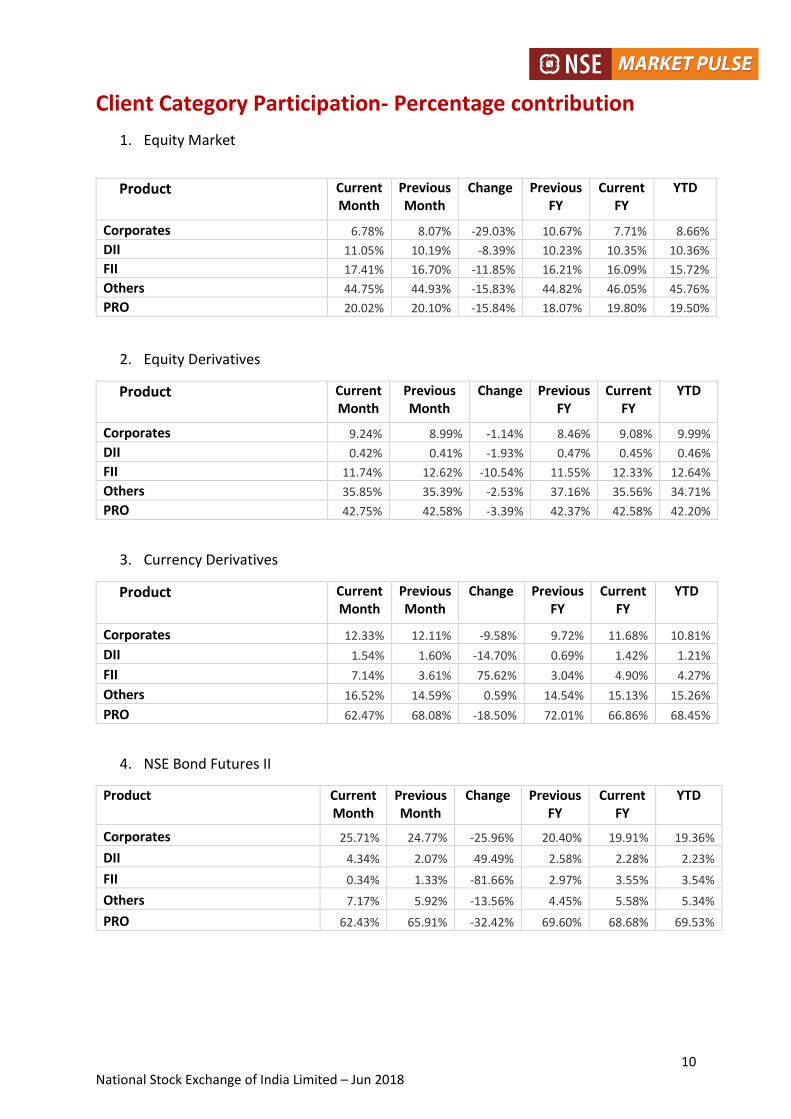
Client Category Participation- Percentage contribution
1. Equity Market
Product Current Month
Previous Month
Change Previous FY
Current FY
YTD
Corporates 6.78% 8.07% -29.03% 10.67% 7.71% 8.66%
DII 11.05% 10.19% -8.39% 10.23% 10.35% 10.36%
FII 17.41% 16.70% -11.85% 16.21% 16.09% 15.72%
Others 44.75% 44.93% -15.83% 44.82% 46.05% 45.76%
PRO 20.02% 20.10% -15.84% 18.07% 19.80% 19.50%
2. Equity Derivatives
Product Current Month
Previous Month
Change Previous FY
Current FY
YTD
Corporates 9.24% 8.99% -1.14% 8.46% 9.08% 9.99%
DII 0.42% 0.41% -1.93% 0.47% 0.45% 0.46%
FII 11.74% 12.62% -10.54% 11.55% 12.33% 12.64%
Others 35.85% 35.39% -2.53% 37.16% 35.56% 34.71%
PRO 42.75% 42.58% -3.39% 42.37% 42.58% 42.20%
3. Currency Derivatives
Product Current Month
Previous Month
Change Previous FY
Current FY
YTD
Corporates 12.33% 12.11% -9.58% 9.72% 11.68% 10.81%
DII 1.54% 1.60% -14.70% 0.69% 1.42% 1.21%
FII 7.14% 3.61% 75.62% 3.04% 4.90% 4.27%
Others 16.52% 14.59% 0.59% 14.54% 15.13% 15.26%
PRO 62.47% 68.08% -18.50% 72.01% 66.86% 68.45%
4. NSE Bond Futures II
Product Current Month
Previous Month
Change Previous FY
Current FY
YTD
Corporates 25.71% 24.77% -25.96% 20.40% 19.91% 19.36%
DII 4.34% 2.07% 49.49% 2.58% 2.28% 2.23%
FII 0.34% 1.33% -81.66% 2.97% 3.55% 3.54%
Others 7.17% 5.92% -13.56% 4.45% 5.58% 5.34%
PRO 62.43% 65.91% -32.42% 69.60% 68.68% 69.53%

11 National Stock Exchange of India Limited – Jun 2018
Asset Category wise Open Interest
1. Equity Derivatives
Product Current Month
Previous Month
Change Previous FY Current FY YTD
FUTSTK 5414902025.90 5500805711.68 -1.56% 4961728948.47 5425660923.16 5470899320.60
OPTSTK 1561264161.57 1809721328.05 -13.73% 1623063742.87 1606804599.16 1709121857.28
2. Equity Derivatives - Index Futures
Product Current Month
Previous Month
Change Previous FY Current FY YTD
BANKNIFTY 2707072.38 3101032.73 -12.70% 508419.67 1954238.13 2423855.81
NIFTY 24687567.86 25507288.64 -3.21% 4388614.94 16868738.67 26528276.61
NIFTYCPSE 0.00 0.00 0.00 0.00 0.00 0.00
NIFTYINFRA 0.00 0.00 0.00 0.00 0.00 0.00
NIFTYIT 44566.67 58515.91 -23.84% 9037.60 34738.28 43541.53
NIFTYPSE 19.05 0.00 0.00 1.63 6.25 3.23
3. Equity Derivatives - Index Options
Product Current Month
Previous Month
Change Previous FY Current FY YTD
BANKNIFTY 23050889.52 20908796.36 10.24% 3837651.22 14750971.88 20128312.58
NIFTY 121377276.19 131322098.86 -7.57% 22105727.54 84968890.23 139880709.07
NIFTYCPSE 0.00 34.09 -100.00% 3.05 11.72 22.18
NIFTYINFRA 0.00 0.00 #DIV/0! 0.00 0.00 0.00
NIFTYIT 0.00 0.00 #DIV/0! 0.00 0.00 6.05
NIFTYPSE 0.00 0.00 #DIV/0! 0.00 0.00 0.00
4. Currency Derivatives- Futures
Product Current Month
Previous Month
Change Previous FY Current FY YTD
EURINR 104108.10 116932.41 -10.97% 133745.66 127059.45 151486.00
EURUSD 29681.38 28943.18 2.55% 16166.76 26149.97 23624.10
GBPINR 54109.05 65732.41 -17.68% 66993.99 74107.13 81135.75
GBPUSD 6963.43 9414.14 -26.03% 7937.71 8508.79 8364.30
JPYINR 33854.76 27645.00 22.46% 31363.55 30133.29 35994.12
USDINR 3447165.71 3968342.77 -13.13% 2070109.54 3383564.06 2845621.24
USDJPY 1634.71 2209.95 -26.03% 3077.71 2155.34 2388.71

12 National Stock Exchange of India Limited – Jun 2018
5. Currency Derivatives- Options
Product Current Month
Previous Month
Change Previous FY Current FY YTD
EURINR 7499.76 14452.09 -48.11% 17169.62 13006.37 14059.72
EURUSD 0.00 0.91 -100.00% 88.10 77.31 80.04
GBPINR 3532.86 7827.86 -54.87% 1144.67 6090.39 4839.06
GBPUSD 0.00 0.00 #DIV/0! 10.86 0.00 2.75
JPYINR 2472.81 2851.14 -13.27% 7705.33 2723.63 3984.06
USDINR 2466152.24 2760756.41 -10.67% 3075539.38 2560891.90 2482093.50
USDJPY 0.00 0.00 #DIV/0! 0.90 0.00 0.23
6. NSE Bond Futures II
Product Current Month
Previous Month
Change Previous FY
Current FY
YTD
668GS2031 0.00 1250.00 -100.00% 5747.07 443.84 4032.21
679GS2027 41788.90 60092.82 -30.46% 66951.66 56890.68 72100.42
679GS2029 0.00 0.00 0.00 151.84 0.00 0.00
684GS2022 0.00 0.00 0.00 0.00 0.00 0.00
697GS2026 0.00 0.00 0.00 27007.49 0.00 0.00
717GS2028 17452.43 10450.77 67.00% 2099.39 10912.56 6934.94
Internet Based Trading Turnover
1. Equity Market
Product Current Month
Previous Month
Change Previous FY
Current FY YTD
Cash market 4285.89 4782.93 -10.39% 4126.08 4625.86 4838.25
Equity Derivatives 131643.87 129567.42 1.60% 92016.81 124481.94 119084.75
Currency Derivatives 2211.45 2095.49 5.53% 1235.54 1989.31 1769.71
NBFII 9.51 13.03 -27.01% 22.88 22.31 20.21
Record Statistics
Instrument Turnover Rs. Crs Turnover USD Mn Date
Equity Turnover 59242.80 7625.21 31, May, 2018
Index Futures 58105.67 8933.27 29, September, 2016
Stock Futures 195433.08 30046.24 25, January, 2018
Index Options Premium 6443.05 990.57 06, February, 2018
Stock Options Premium 1297.90 199.54 25, October, 2017
13 National Stock Exchange of India Limited – Jun 2018
Important Links –
Mode of Trading Cash Market -
https://nseindia.com/products/content/equities/equities/mode_of_trading.htm
Mode of Trading Equity Derivative Market –
https://nseindia.com/products/content/derivatives/equities/mode_of_trading.htm
Disclaimer:
Market conditions can lead to substantial profit or loss. Investors are advised to seek adequate
product and market knowledge as well as proper investment advice before trading. The material
provided here is for general information purposes only. While care has been taken to ensure
accuracy, the information furnished to reader with no warranty as to accuracy or completeness of its
contents and on condition that any changes, omissions or errors shall not be made the basis for any
claim, demand or cause for action.