: minutes of the meeting ofthe crop weather watch …
TRANSCRIPT

Directorate of Economics & Statistics
F. No. 3-1/ 2020-21-CFCC-ES GOVERNMENT OF INDIA
MINISTRY OF AGRICULTURE AND FARMERS WELFARE
DEPARTMENT OF AGRICULTURE, COOPERATION AND FARMERS WELFARE
(CROP FORECAST COORDINATION CENTRE)
Room No. 443, Krishi Bhawan, New Delhi
Dated: 17.08.2021
SUBJECT: MINUTES OF THE MEETING OFTHE CROP WEATHER WATCH GROUP
HELD 13.08.2021.
Summary
All-India level rainfall during the week, 05 August 2021 to 11 August 2021, has been 35% lower
than the Long Period Average (LPA). Among the four broad geographical divisions of the country,
against the LPA the rainfall has been:
- Lower by 54% in Central India.
- Lower by 34% in South Peninsula,
- Lower by 27% in North West India,
- Lower by 2% in East & North East India,
Cumulative rainfall during Monsoon season, 01 June 2021 to 11 August 2021, has been 6%
lower than the LPA. Among the four broad geographical divisions, seen against the LPA the
rainfall has been:
- Higher by 7% in South Peninsula,
- Lower by 13% in East & North East India,
- Lower by 8% in Central India.
- Lower by 2% in North West India,
Out of 36 MET sub-divisions in the country, rainfall received has been:
- Large excess/ excess in 9 MET sub-divisions constituting 26% of total area,
- Normal in 18 MET sub-division constituting 48% of total area,
- Deficient/large deficient in 09 MET sub-divisions constituting 26% of total area
Central Water Commission (CWC) monitors 130 major reservoirs in the country which have total
live storage capacity of 174.23 Billion Cubic Meters (BCM) at Full Reservoir Level (FRL).
- Out of these, 105 reservoirs with FRL capacity of 129.21 BCM have irrigation potential.
- Live storage in 130 major reservoirs as on 12 August 2021 was 103.52 BCM, which is:
- 112% of last year’s storage on the same day (12 August 2020) of 92.18 BCM.
- 109% of last 10 year’s average storage (normal) of 95.31 BCM.
During the current Kharif season 2021(as on 13.08.2021), 997.08 lakh ha. area has been sown as
compared to the 1015.15 Lakh ha during corresponding period of last year.
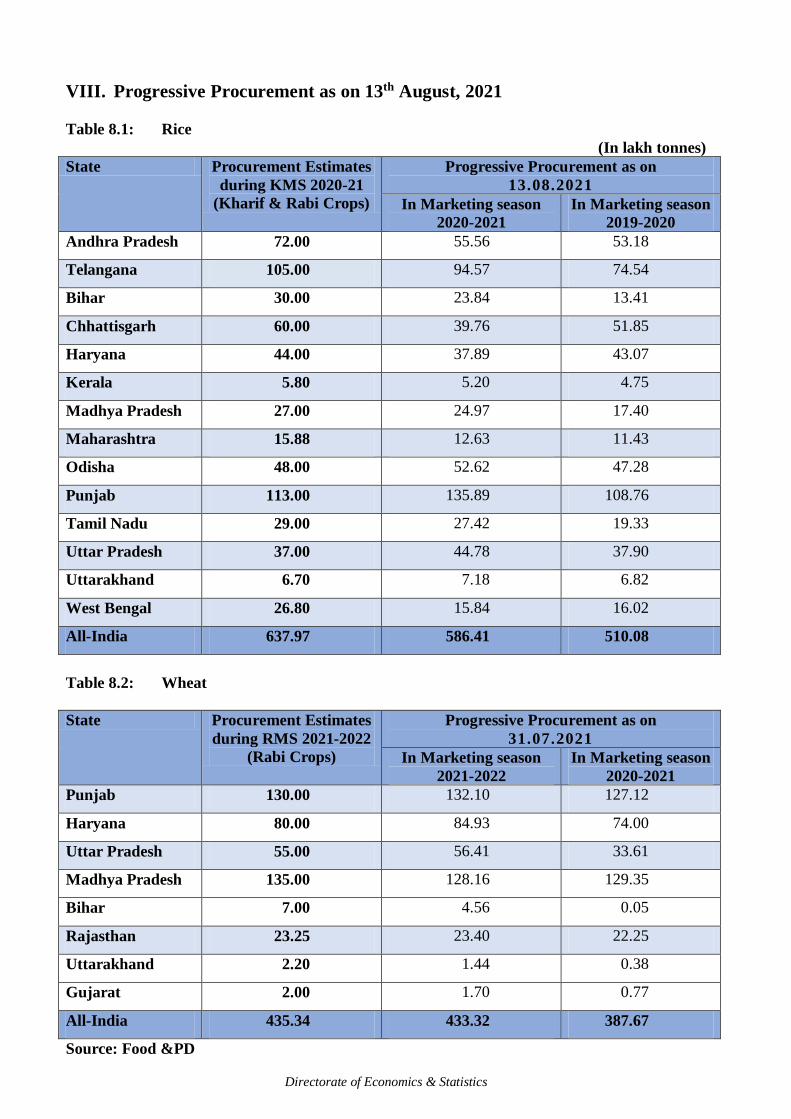
Current Marketing Season RMS 2021-22 has concluded in wheat procuring states and till date (As
on 31.07.2021) 433.32 LMT procurement has been done for central pool, (which is all time high),

Directorate of Economics & Statistics
whereas corresponding Wheat procurement during RMS 2020-21 was 387.67 LMT. About 49.15
Lakh farmers have already been benefitted from ongoing RMS procurement.
As on 13 August 2021, during KMS 2020-21, Progressive Procurement of Rice was 586.41 lakh
MT as compared to 510.08 lakh MT procured during corresponding period of KMS 2019-20.
About 128.90 Lakh farmers have been benefitted from ongoing KMS procurement.

Directorate of Economics & Statistics
MONSOON RAINFALL STATUS (June – September) during the week ending
11 August, 2021
1.1 Rainfall
Rainfall during the week (05 August to 11 August 2021): Rainfall was large excess/excess in
04 met sub-divisions, normal in 10 sub-divisions and deficient/large deficient in 22 sub-
divisions. (Sub-Division wise weekly and seasonal rainfall distribution is in Annex-I).
Cumulative rainfall (01 June 2021 to 11 August 2021): Rainfall was large excess/excess in
09 met sub-divisions, normal in 18 sub-division, deficient/large deficient in 09 sub-divisions.
(Sub-division wise seasonal rainfall distribution is in Annex-II).
Table 1.1: Weekly and Cumulative Rainfall in four regions of the country: Region of India Week Ending (11.08.2021) Cumulative (01.06.21 to 11.08.2021)
(in mm) Deviation (%)
Category (in mm) Deviation (%)
Category
Actual Normal Actual Normal
North-West 35.5 49.0 -27 D 357.5 366.0 -2 N
Central 35.4 77.4 -54 D 566.1 614.5 -8 N
South Peninsula 29.8 44.8 -34 D 479.0 448.9 7 N
East & North-East 71.3 72.4 -2 N 785.6 898.5 -13 N
Country as a whole 40.0 61.5 -35 D 519.8 550.8 -6 N
LE: Large Excess, E: Excess, N: Normal, D: Deficient, LD: Large Deficient, NR: No Rain.
Source: India Meteorological Department, New Delhi
Table 1.2: Category-wise Comparative Distribution of Sub-Division (Cumulative Rainfall) and
All-India Percentage Rainfall Departure for last 5 years since 01 June 2021 to 11 August 2021
No. of Sub-Divisions with
rainfall
For the period from 1 June to
10 AUG
2016
09 AUG
2017
08 AUG
2018
14 AUG
2019
12 AUG
2020
11 AUG
2021
Large Excess
Excess Normal
Total
-
10 21
31
01
03 25
29
00
00 28
28
01
07 20
28
02
08 20
30
01
08 18
27
Deficient
Large Deficient
Scanty No rain
Total
05
-
00 00
05
07
00
- 00
07
08
00
- 00
08
08
00
- 00
08
06
00
- 00
06
09
00
- 00
09
Data Inadequate 00 00 00 00 00 00
TOTAL 36 36 36 36 36 36
All-India % Rainfall Deviation 3% (-) 3% (-) 10% 1% 1% (-) 6%
Source: IMD
`

Directorate of Economics & Statistics
1.2 Weather Forecast
Week 1 (12 to 18 August)
The Monsoon trough lies to the north of its normal position. Western end of the monsoon
trough is very likely to remain north of its normal position during next 5 days. However, its
Eastern end is likely to shift gradually southwards from 15th August onwards.
A cyclonic circulation lies over west Bihar & neighbourhood at lower tropospheric levels. It
is likely to persist during next 48 hours and become less marked thereafter.
Strong lower level southwesterly winds from the Bay of Bengal to Northeast India are likely
to continue during next 4 days.
Subdued rainfall very likely over rest parts of the country during next 5 days and Increase
thereafter except northwest India & Gujarat state.
Week 2 (19 to 25 August)
There is likely increase in rainfall activity over most parts of the country as compare to
week 1.
The monsoon trough is very likely to be near normal position during most days of the week.
Fairly widespread to widespread rainfall activity with isolated heavy falls very likely over
most parts of south Peninsular & central India during most of the days.
Light/moderate scattered to fairly widespread rainfall likely over rest parts of country except
most parts of Western Himalayan Region, Gangetic West Bengal and Andaman & Nicobar
Islands.
Overall normal to above normal rainfall activity likely over the country except most parts of
Western Himalayan Region, Gangetic West Bengal and Andaman & Nicobar Islands, where
below normal rainfall activity is likely.

Directorate of Economics & Statistics
II. Reservoir Status (For the week ending on 12 August 2021)
Central Water Commission monitors the live storage capacity of 130 important/major
reservoirs, having capacity at Full Reservoir Level (FRL) of 174.23 BCM, which is about
67.58% of total reservoir capacity of 257.81 BCM in the country.
Live Storage in 130 major reservoirs increased to 103.52 BCM from the previous week’s
level of 98.90 BCM. Current year’s storage position is higher than last year’s storage
position of 92.18 BCM and average of last 10 year’s storage position of 95.31 BCM.
Table 2.1: For 130 major reservoirs of the country
Source: CWC
There were 99 reservoirs with more than 80% of normal storage, 17 reservoirs with storage
between 51% to 80%, 13 reservoirs with storage between 31% to 50% and 01 reservoir with
storage upto 30%.
Source: Central Water Commission
State-wise details (Reservoir Position) are given in Annex IV.
Period Storage as % of
FRL
Storage as % of
Last Year
Storage as % of
10 Year’s Average Level
Current Week 59 112 109
Last Week 57 130 121
The percentage to live capacity at FRL was 53% on 12.08.2020, 59% on 12.08.2019, 49% on
12.08.2018 and 46% on 12.08.2017.

Directorate of Economics & Statistics
III. Fertilizer Position:
Table 3.1: Requirement, Receipt, Availability, Sales and Stock position of Major Fertilizers
(UREA, DAP, MOP, Complex and SSP) during Kharif 2021 (As on 13.08.2021)
(in ‘000 tonnes)
Availability/Sale/Closing Stock Urea DAP MOP Complex/
NPK
SSP
Opening Stock as on 01.04.2021 341 131 97 617 152
Requirement for Apr. 2021 to Sept 2021 17503 6518 2024 6187 2646
Estimated Requirement during August 2021 3573 1086 365 1206 484
Cumulative Receipt upto 13.08.2021 10655 3259 874 4126 1820
Cumulative Availability upto 13.08.2021 10996 3390 971 4743 1972
Cumulative Sales upto 13.08.2021 10825 3157 826 4269 1831
Closing Stock as on 13.08.2021 171 233 145 474 141
Source: Fertilizer Division (DAC&FW)/Department of Fertilizer
IV. Pest & Diseases:
Fall Army Worm (30 hectare area on maize), Pink boll worm (2 hectare area on cotton)
and Leaf mosaic (2 hectare area on black gram) are reported at above ETL in Amravati
district of Maharashtra.
Rugose Spiraling Whitefly reported at Low to moderate intensity in 220 hectare of
Coconut in Thanjavur district of Tamil Nadu.
Grass hopper, Blast and Brown leaf spot reported at Trace to moderate intensity in 75
hectare of Paddy in Mon district of Nagaland.
Overall intensity of pests and diseases remained below Economic Threshold Level.
V. Seeds:
There is sufficient availability of certified/quality seeds of all major Kharif crops for Kharif-
2021 except maize, minor millets, soybean and jute which will meet from National Seed
Corporation Ltd, Farm Saved Seed and Private Seed Companies.
Total availability of certified/quality seed is 165.08 lakh quintals against the requirement of
154.50 lakh quintals for Kharif-2021 season in the country. There is overall surplus of 10.58
lakh quintals seeds.
VI. Mandi Functioning
PRICE COMPARISON WITH MSP (on 11 August, 2021)
Agri produce sold below MSP: Wheat, Paddy, Bajra, Maize, Jowar, Arhar, Gram,
Moong and Safflower.
Agri produce sold above MSP: Barley, Ragi, Urad, Masur, Copra, Mustard,
Sesamum, Soyabean, Groundnut, Sunflower, Cotton and Jute.

Directorate of Economics & Statistics
VII. All-India Crop Situation Kharif (2021-22) as on 13-08-2021
Table 7.1
(In lakh ha.)
Crop Name
Normal Area
for whole
Kharif Season
Area sown reported Absolute
Change
This Year
2021
% of Normal
for whole
season
Last Year
2020
Rice 395.66 349.24 88.3 351.52 -2.28
Jowar 19.52 13.64 69.9 14.13 -0.49
Bajra 73.43 59.55 81.1 64.12 -4.57
Maize 74.68 78.81 105.5 77.06 1.75
Total Coarse Cereals 183.59 163.04 88.8 167.00 -3.96
Total Cereals 579.24 512.28 88.4 518.52 -6.24
Tur 45.64 46.88 102.7 45.18 1.70
Urad 37.96 35.52 93.6 35.50 0.02
Moong 33.48 32.52 97.1 32.93 -0.41
Kulthi 2.18 0.30 13.8 0.25 0.05
Others 16.70 11.75 70.4 11.20 0.55
Total Pulses 135.95 126.98 93.4 125.06 1.92
Total Foodgrains 715.20 639.26 89.4 643.58 -4.32
Groundnut 41.70 46.87 112.4 49.63 -2.76
Soyabean 112.88 116.33 103.1 118.76 -2.43
Sunflower 1.42 1.41 99.2 1.01 0.40
Sesamum 16.48 12.16 73.8 12.07 0.09
Nigerseed 2.04 0.39 19.3 0.67 -0.27
Castorseed 8.98 2.89 32.1 3.22 -0.34
Total Oilseeds 183.50 180.14 98.2 185.45 -5.31
Cotton 123.59 116.17 94.0 125.48 -9.31
Sugarcane 47.53 54.52 114.7 53.69 0.83
Jute & Mesta 7.33 6.99 95.3 6.95 0.03
All- Crops 1077.15 997.08 92.6 1015.15 -18.07
Source: Crops Divisions, DAC&FW
Directorate of Economics & Statistics
VIII. Progressive Procurement as on 13th August, 2021
Table 8.1: Rice
(In lakh tonnes)
State Procurement Estimates
during KMS 2020-21
(Kharif & Rabi Crops)
Progressive Procurement as on
13.08.2021
In Marketing season
2020-2021
In Marketing season
2019-2020
Andhra Pradesh 72.00 55.56 53.18
Telangana 105.00 94.57 74.54
Bihar 30.00 23.84 13.41
Chhattisgarh 60.00 39.76 51.85
Haryana 44.00 37.89 43.07
Kerala 5.80 5.20 4.75
Madhya Pradesh 27.00 24.97 17.40
Maharashtra 15.88 12.63 11.43
Odisha 48.00 52.62 47.28
Punjab 113.00 135.89 108.76
Tamil Nadu 29.00 27.42 19.33
Uttar Pradesh 37.00 44.78 37.90
Uttarakhand 6.70 7.18 6.82
West Bengal 26.80 15.84 16.02
All-India 637.97 586.41 510.08
Table 8.2: Wheat
State Procurement Estimates
during RMS 2021-2022
(Rabi Crops)
Progressive Procurement as on
31.07.2021
In Marketing season
2021-2022
In Marketing season
2020-2021
Punjab 130.00 132.10 127.12
Haryana 80.00 84.93 74.00
Uttar Pradesh 55.00 56.41 33.61
Madhya Pradesh 135.00 128.16 129.35
Bihar 7.00 4.56 0.05
Rajasthan 23.25 23.40 22.25
Uttarakhand 2.20 1.44 0.38
Gujarat 2.00 1.70 0.77
All-India 435.34 433.32 387.67
Source: Food &PD

Directorate of Economics & Statistics

Directorate of Economics & Statistics

Directorate of Economics & Statistics
Annexe-III/p-1
Sub-division wise weekly rainfall Forecast for week 12 – 18 August, 2021 for 36 Met Sub-Divisions:
METEOROLOGICAL SUB-DIVISIONWISE WEEKLY RAINFALL FORECAST -2021
Sr. No MET.SUB-DIVISIONS 12 AUG 13 AUG 14 AUG 15 AUG 16 AUG 17 AUG 18 AUG
1 ANDAMAN & NICO.ISLANDS WS● WS WS WS WS SCT SCT
2 ARUNACHAL PRADESH WS●● WS●● WS●● FWS● FWS FWS FWS
3 ASSAM & MEGHALAYA WS●●● WS●●● WS●● WS● FWS FWS WS
4 NAGA.MANI.MIZO.& TRIPURA WS● WS● WS● FWS● FWS WS WS
5 SUB-HIM.W. BENG. & SIKKIM WS●●● WS●● WS●● WS● WS● FWS WS
6 GANGETIC WEST BENGAL WS● WS FWS FWS FWS SCT SCT
7 ODISHA SCT● SCT FWS● FWS● WS●● FWS FWS
8 JHARKHAND FWS● FWS FWS FWS FWS● WS WS
9 BIHAR WS●● WS● FWS● FWS FWS SCT FWS
10 EAST UTTAR PRADESH FWS●● SCT● SCT● SCT● SCT SCT SCT
11 WEST UTTAR PRADESH ISOL ISOL ISOL ISOL ISOL ISOL ISOL
12 UTTARAKHAND SCT FWS FWS● ISOL● ISOL SCT FWS
13 HARYANA CHD. & DELHI ISOL ISOL ISOL ISOL ISOL DRY DRY
14 PUNJAB ISOL ISOL ISOL ISOL ISOL DRY DRY
15 HIMACHAL PRADESH SCT FWS FWS● FWS SCT ISOL ISOL
16 JAMMU & KASHMIR AND LADAKH ISOL SCT FWS FWS ISOL ISOL ISOL
17 WEST RAJASTSAN DRY DRY DRY DRY DRY DRY DRY
18 EAST RAJASTSAN DRY DRY ISOL ISOL ISOL ISOL ISOL
19 WEST MADHYA PRADESH ISOL ISOL ISOL ISOL ISOL FWS FWS
20 EAST MADHYA PRADESH ISOL ISOL ISOL ISOL SCT FWS FWS
21 GUJARAT REGION ISOL ISOL ISOL ISOL ISOL ISOL ISOL
22 SAURASTRA & KUTCH ISOL ISOL ISOL DRY DRY ISOL ISOL
23 KONKAN & GOA WS FWS WS WS WS WS WS
24 MADHYA MAHARASHTRA ISOL ISOL ISOL SCT ISOL ISOL ISOL
25 MARATHAWADA ISOL ISOL ISOL SCT SCT SCT SCT
26 VIDARBHA ISOL ISOL ISOL ISOL FWS FWS WS
27 CHHATTISGARH FWS SCT SCT SCT FWS● WS WS
28 COASTAL ANDHRA PR. & YANAM FWS SCT SCT FWS● FWS● SCT ISOL
29 TELANGANA ISOL ISOL ISOL SCT FWS WS SCT
30 RAYALASEEMA FWS SCT SCT SCT SCT SCT SCT
31 TAMIL. PUDU. & KARAIKAL FWS● SCT● SCT● ISOL ISOL ISOL ISOL
32 COASTAL KARNATAKA WS WS WS WS WS WS WS
33 NORTH INTERIOR KARNATAKA SCT SCT SCT SCT SCT SCT SCT
34 SOUTH INTERIOR KARNATAKA FWS SCT SCT SCT SCT SCT SCT
35 KERALA & MAHE WS WS WS FWS FWS FWS FWS
36 LAKSHADWEEP FWS FWS FWS FWS FWS WS WS
LEGENDS:
WS - WIDE SPREAD / MOST PLACES (76-100%) FWS - FAIRLY WIDE SPREAD / MANY PLACES (51% to 75%)
SCT - SCATTERED / FEW PLACES (26% to 50%) ISOL - ISOLATED (up to 25%) D / DRY - NO RAINFALL
● Heavy Rainfall (64.5-115.5 mm) ●● Heavy to Very Heavy Rainfall (115.6-204.4 mm) ●●● Extremely Heavy Rainfall (204.5 mm or more)

Directorate of Economics & Statistics
Annex-III/ P.2
Sub-division-wise 5 days rainfall forecast from 13 – 17 August 2021:

Directorate of Economics & Statistics