© mining consultancy services (pty) ltd. 2016
TRANSCRIPT

Productivity
Optimisation
© Mining Consultancy Services (Pty) Ltd. 2016
REF: 0367
Content
© Mining Consultancy Services (Pty) Ltd. 2016
– Brief company background
– Productivity Optimisation Project (POP) methodology
through two case studies:
– Underground case study
– Opencast case study
– Technology (hardware and software) currently in operation
and commercially available
MCS Introduction
© Mining Consultancy Services (Pty) Ltd. 2016
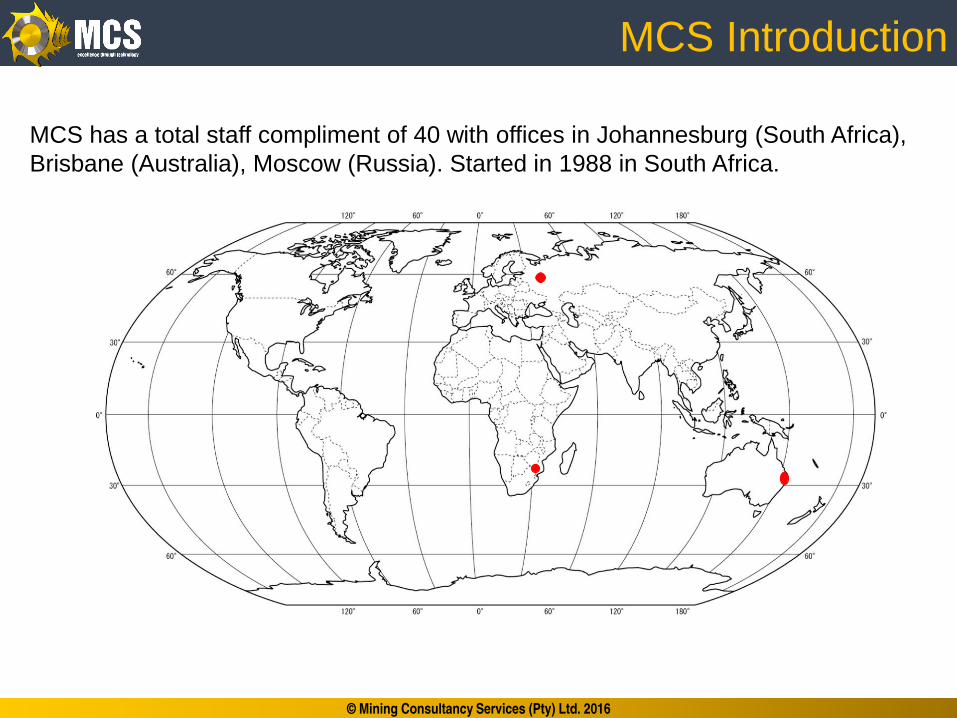
MCS has a total staff compliment of 40 with offices in Johannesburg (South Africa),
Brisbane (Australia), Moscow (Russia). Started in 1988 in South Africa.

SA Project Examples - Optimization
© Mining Consultancy Services (Pty) Ltd. 2016
Project Client Description
Greenside AATCFirst Productivity Optimisation Project done using the combination of machine monitoring and process based
management
Greenside AATCAimed at optimisation new sections and taking productivity from 1 million tonnes per annum per CM section to 1.4
million tonnes per CM section
Waterval Anglo Platinum Aimed at optimising production from the mine
Townlands Anglo Platinum Oversee new mechanisation projects
Goedehoop - Vlaklaagte shaft AATC POP Project on 5 sections
Goedehoop - Hope shaft AATC POP Project on 5 sections
Bank Colliery AATC POP Project on 3 sections
New Denmark AATC POP Project on 3 sections
Kriel Colliery AATC POP Project on 2 sections
Anglo Coal AATCOptimisation of all CM's collieries where POP's was done. This includes 23 fully mechanised sections over 7 shafts on
4 mines
Arthur Taylor Colliery Xstrata Coal SA POP on 4 sections and support contract
Tavistock Colliery Xstrata Coal SA POP on 3 sections and support contract
Boschmans Colliery Xstrata Coal SA POP on 5 sections and support contract
South Witbank Colliery Xstrata Coal SA POP on 3 sections and support contract
5-Seam Xstrata Coal SA POP on 2 sections and support contract
Douglas Colliery BHP Billiton Energy Coal Series of 3 POP projects on 7 sections and support contract
Khutala Colliery BHP Billiton Energy Coal Series of 4 POP projects on 14 sections and support contract
Gloria (Koornfontein) Colliery BHP Billiton Energy Coal Two sections
Middelbult Colliery Sasol Mining POP on 9 section and support contract
Syferfontein Colliery Sasol Mining POP on 10 sections and support contract
Bosjesspruit Colliery Sasol Mining POP on 11 sections and support contract
Brandspruit Colliery Sasol Mining POP on 9 sections and support contract
Twistdraai Colliery Sasol Mining POP on 11 sections and support contract
Sigma Colliery Sasol Mining POP on 4 sections and support contract
Sasol Wide Sasol Mining POP and support contact work on all sections
Kangra Kangra Coal Holdings POP on 5 sections
Mooiplaats Coal of Africa Limited POP on 5 sections
Tweefontein Glencore Open cast monitoring and optimisation
Our Mission
© Mining Consultancy Services (Pty) Ltd. 2016
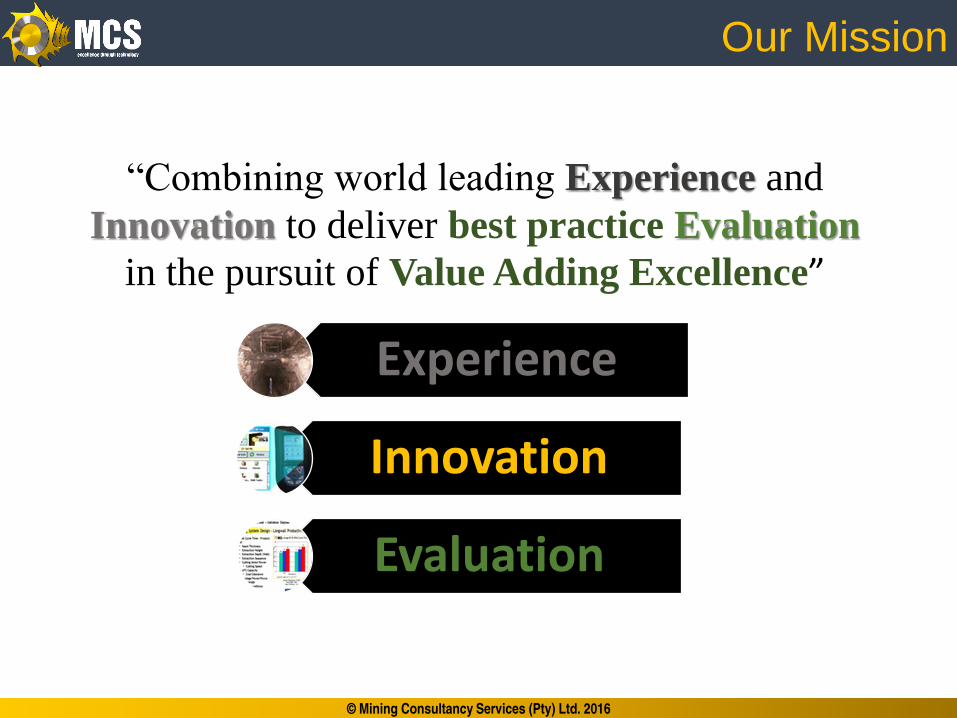
“Combining world leading Experience and
Innovation to deliver best practice Evaluation
in the pursuit of Value Adding Excellence”
Experience
Innovation
Evaluation

Case study approval
© Mining Consultancy Services (Pty) Ltd. 2016
Our sincerest thanks to Glencore Tweefontein division for
allowing us to use their reports for the underground and
opencast Productivity Optimisation Project case studies.
Sustainable KPI Improvement
© Mining Consultancy Services (Pty) Ltd. 2016
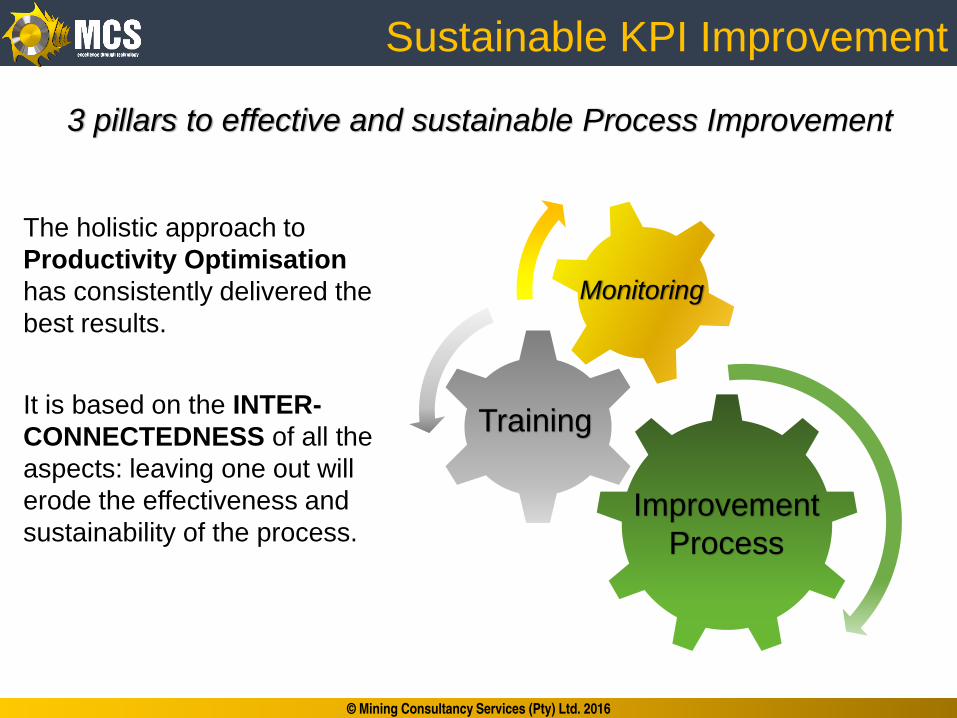
3 pillars to effective and sustainable Process Improvement
The holistic approach to
Productivity Optimisation
has consistently delivered the
best results.
It is based on the INTER-
CONNECTEDNESS of all the
aspects: leaving one out will
erode the effectiveness and
sustainability of the process.
Monitoring
Training
Improvement
Process
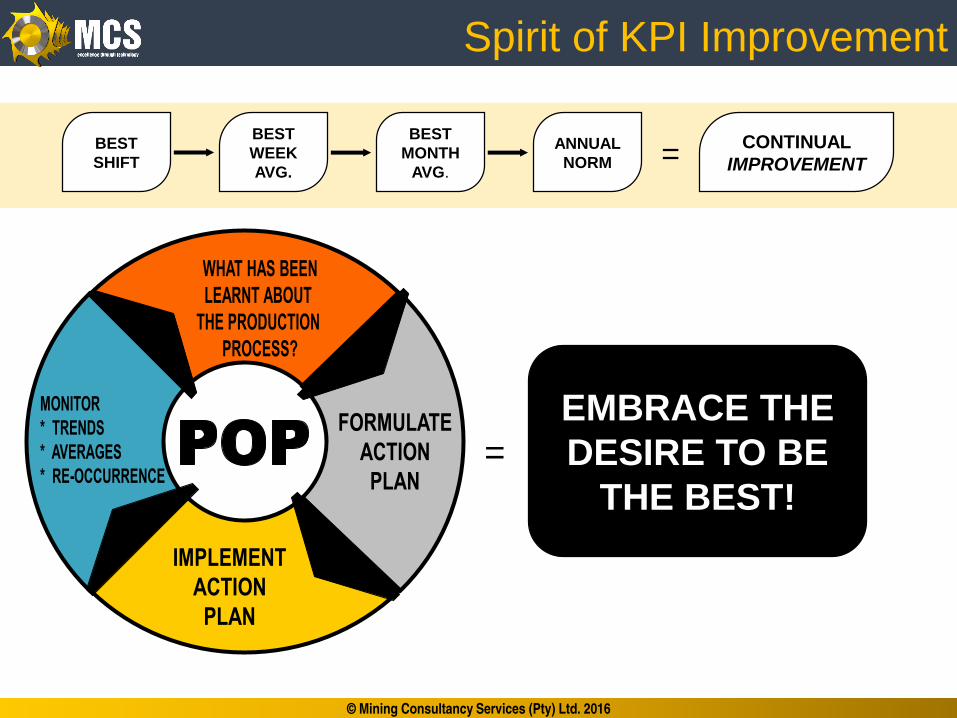
Spirit of KPI Improvement
© Mining Consultancy Services (Pty) Ltd. 2016
BEST
SHIFT
BEST
WEEK
AVG.
BEST
MONTH
AVG.
ANNUAL
NORM =CONTINUAL
IMPROVEMENT
EMBRACE THE
DESIRE TO BE
THE BEST!
=

Standardized KPI’s
© Mining Consultancy Services (Pty) Ltd. 2016
When KPI’s are understood and trusted by all
personnel - they start driving sustainable
behavioural (process) change.
Daily feedback is required to ensure gains
that have been made are sustained.
Since everybody is measured on the same
basis it creates competition and PEER
PRESSURE to improve

U/G Case study
© Mining Consultancy Services (Pty) Ltd. 2016
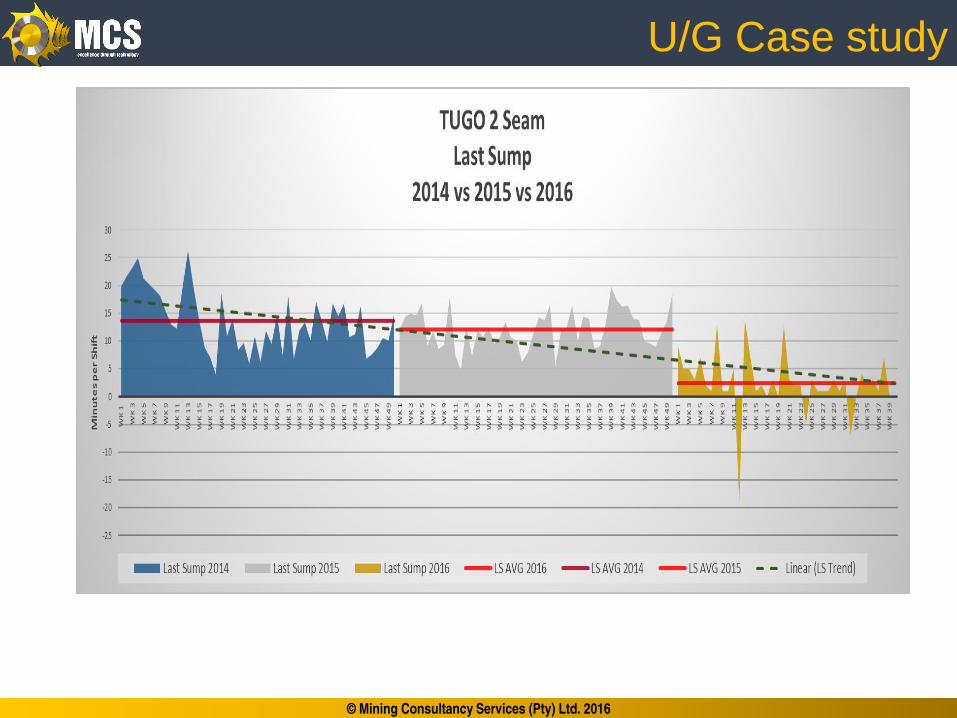
U/G Case study
© Mining Consultancy Services (Pty) Ltd. 2016
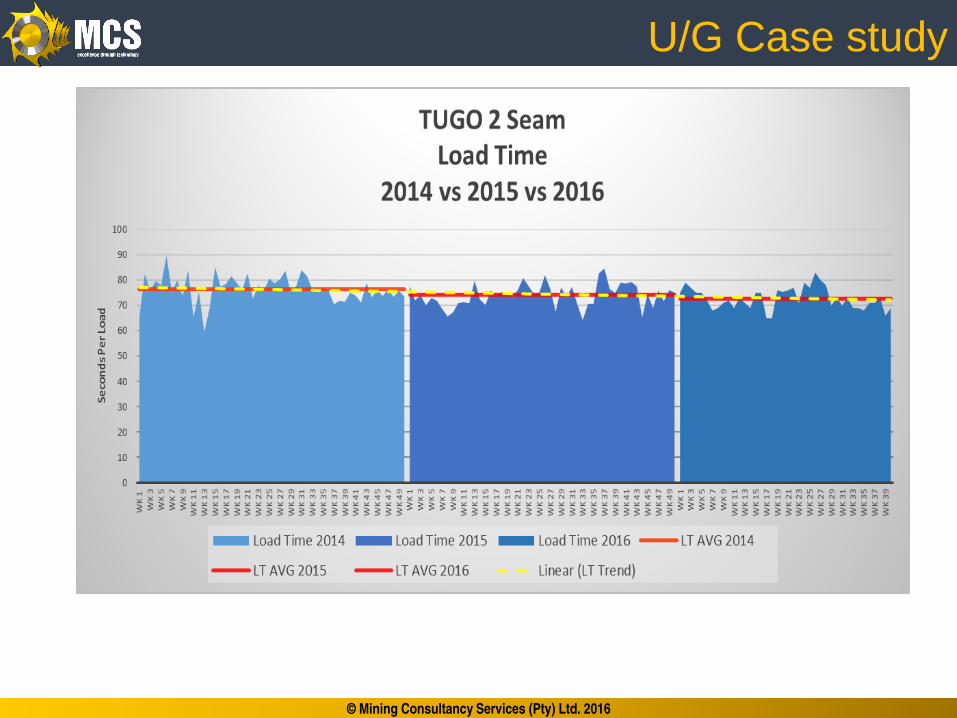
U/G Case study
© Mining Consultancy Services (Pty) Ltd. 2016
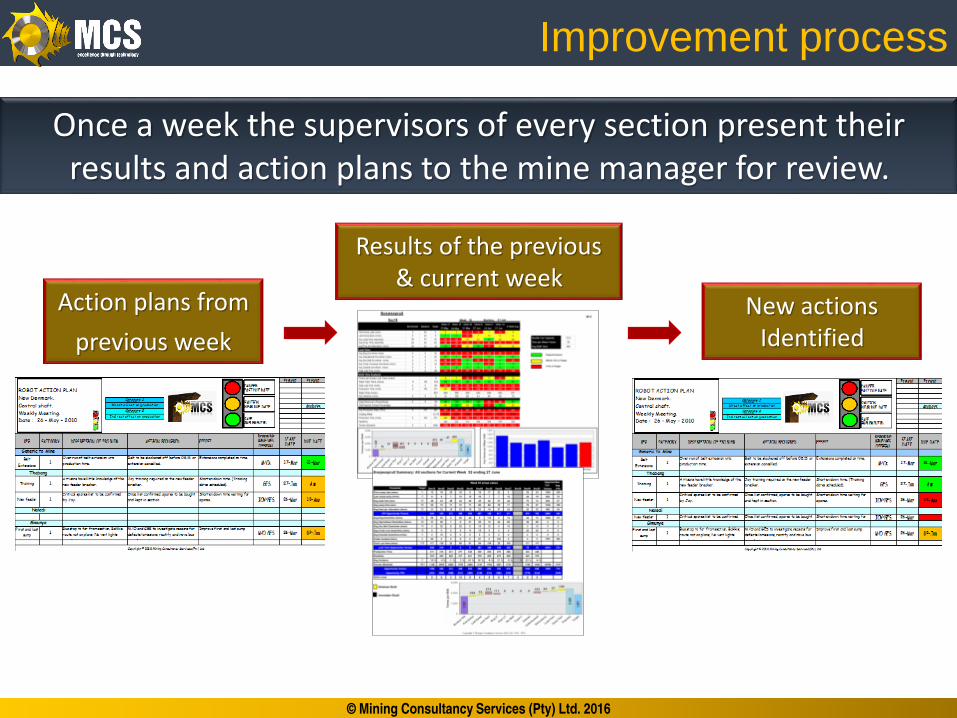
Improvement process
© Mining Consultancy Services (Pty) Ltd. 2016
Once a week the supervisors of every section present their results and action plans to the mine manager for review.
Action plans from
previous week
New actions Identified
Results of the previous & current week

U/G data acquisition
© Mining Consultancy Services (Pty) Ltd. 2016

Section KPI’s for the week
© Mining Consultancy Services (Pty) Ltd. 2016
Production KPI's Avarage 2014 Avarage 2015 Ngala Rhinos Inyathi Tigers w k avg Sisonke shifts
First sump late 9 10 2 -7 -6 0 -3 30
Last sump early 15 15 0 -1 0 -1 0 -5
Avg load time (sec) 82 77 77 77 53 72 69 81
Avg aw ay time (sec) 78 73 97 67 85 72 80 71
Avg relocation time (min) 22 17 18 19 16 13 16 17
Avg no. of relocs per shift 3,8 3,7 3,5 3,2 5,3 4,8 4,2 2,8
Avg TTPMC 3,77 2,6 3,28 1,98 2,81 2,26 2,6 1,07
Production rate 360 384 372 450 470 450 435 426
Time summary
Production time 186 224 191 196 164 247 197 100
Total tram time 142 78 101 79 117 116 103 86
FS/LS total lost time 24 25 2 -8 -6 -1 -3 25
Total dow ntime 200 137 149 153 96 63 118 207
Total minutes 359 378 443 420 371 425 415 445
Variance -192 -45 21 45 76 35 44 -38
Shifts w ith usable data 10 10 10 8 6 4
Avg booked tonnes per shift 1160 1484 1162 1458 1299 1892 1429 648
Dow ntime summary
Engineering DT 68 41 71 72 61 7 55 52
Operational DT 85 57 42 58 27 46 43 20
Section Belt DT 12 6 14 0 6 3 6 0
Trunk Belt DT 24 19 22 23 2 3 13 0
Shaft Belt DT 0 0 0 0 0 0 0 0
Outside DT 11 14 0 0 0 4 1 135
Total Dow ntime 200 137 149 153 96 63 118 207149
0
14
15
2
61
57
840
291
-140
36
149
139
107
349
2,2
3,43
75
29
21
90
Avarage 2013
15
Week report - Week 40 2 seam
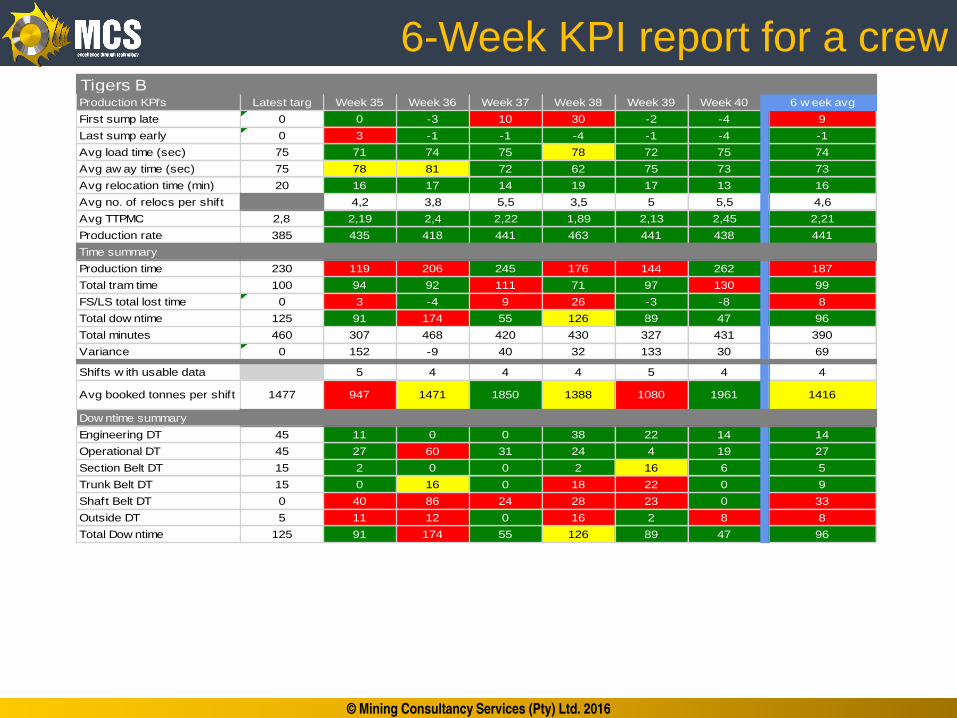
6-Week KPI report for a crew
© Mining Consultancy Services (Pty) Ltd. 2016
Tigers BProduction KPI's Latest targ Week 35 Week 36 Week 37 Week 38 Week 39 Week 40 6 w eek avg
First sump late 0 0 -3 10 30 -2 -4 9
Last sump early 0 3 -1 -1 -4 -1 -4 -1
Avg load time (sec) 75 71 74 75 78 72 75 74
Avg aw ay time (sec) 75 78 81 72 62 75 73 73
Avg relocation time (min) 20 16 17 14 19 17 13 16
Avg no. of relocs per shift 4,2 3,8 5,5 3,5 5 5,5 4,6
Avg TTPMC 2,8 2,19 2,4 2,22 1,89 2,13 2,45 2,21
Production rate 385 435 418 441 463 441 438 441
Time summary
Production time 230 119 206 245 176 144 262 187
Total tram time 100 94 92 111 71 97 130 99
FS/LS total lost time 0 3 -4 9 26 -3 -8 8
Total dow ntime 125 91 174 55 126 89 47 96
Total minutes 460 307 468 420 430 327 431 390
Variance 0 152 -9 40 32 133 30 69
Shifts w ith usable data 5 4 4 4 5 4 4
Avg booked tonnes per shift 1477 947 1471 1850 1388 1080 1961 1416
Dow ntime summary
Engineering DT 45 11 0 0 38 22 14 14
Operational DT 45 27 60 31 24 4 19 27
Section Belt DT 15 2 0 0 2 16 6 5
Trunk Belt DT 15 0 16 0 18 22 0 9
Shaft Belt DT 0 40 86 24 28 23 0 33
Outside DT 5 11 12 0 16 2 8 8
Total Dow ntime 125 91 174 55 126 89 47 96
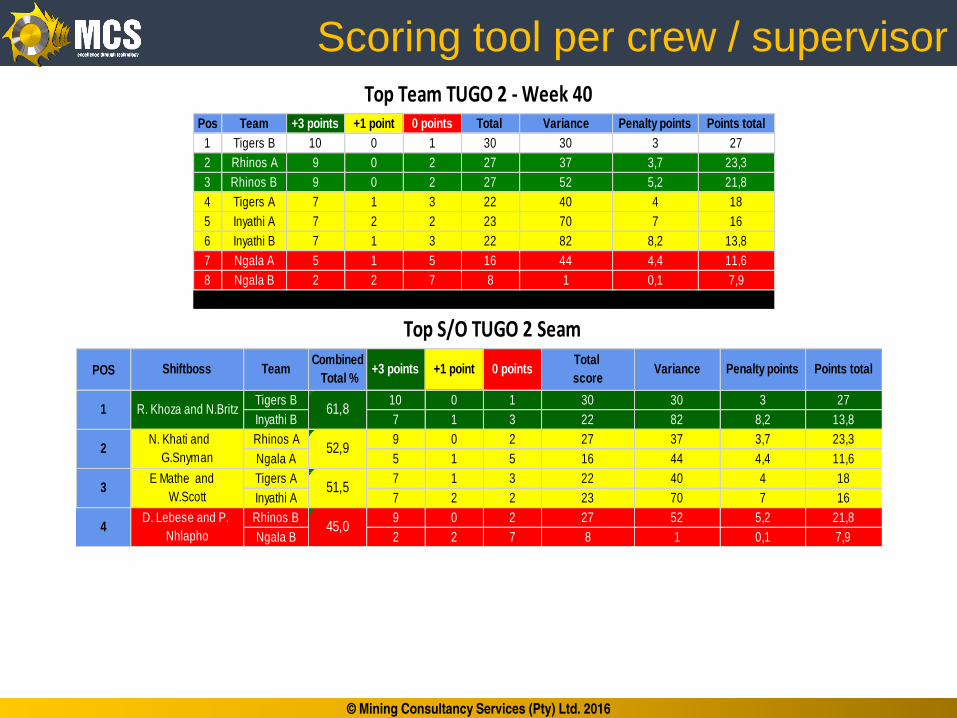
Scoring tool per crew / supervisor
© Mining Consultancy Services (Pty) Ltd. 2016
Pos
1
2
3
4
5
6
7
8
POS
7,92 2 7 8 1 0,1
2N. Khati and
G.Snyman52,9
3E Mathe and
W.Scott51,5
Top S/O TUGO 2 Seam
ShiftbossCombined
Total %
1 R. Khoza and N.Britz 61,8
52 5,2 21,8
Top Team TUGO 2 - Week 40
2 23 70 7 16
Rhinos B 9 0 2 27
Inyathi A 7 2
4D. Lebese and P.
Nhlapho45,0
Ngala B
4,4 11,6
Tigers A 7 1 3 22 40 4 18
23,3
Ngala A 5 1 5 16 44
82 8,2 13,8
Rhinos A 9 0 2 27 37 3,7
3 27
Inyathi B 7 1 3 22
Total
scoreVariance Penalty points Points total
Tigers B 10 0 1 30 30
Team +3 points +1 point 0 points
0,1 7,9Ngala B 2 2 7 8 1
8,2 13,8
Ngala A 5 1 5 16 44 4,4 11,6
Inyathi B 7 1 3 22 82
4 18
Inyathi A 7 2 2 23 70 7 16
Tigers A 7 1 3 22 40
3,7 23,3
Rhinos B 9 0 2 27 52 5,2 21,8
Rhinos A 9 0 2 27 37
Penalty points Points total
Tigers B 10 0 1 30 30 3 27
Team +3 points +1 point 0 points Total Variance

Combines Shift Overseer scores
© Mining Consultancy Services (Pty) Ltd. 2016

Individual shift overseer score
© Mining Consultancy Services (Pty) Ltd. 2016

Opencast data acquisition
© Mining Consultancy Services (Pty) Ltd. 2016
MonitoringDragline
Report
Excavator
ReportTruck Report

Primary fleet currently included
© Mining Consultancy Services (Pty) Ltd. 2016
Primary Machines
Loading Area(Bin)
Trucks
Processing(Plant)
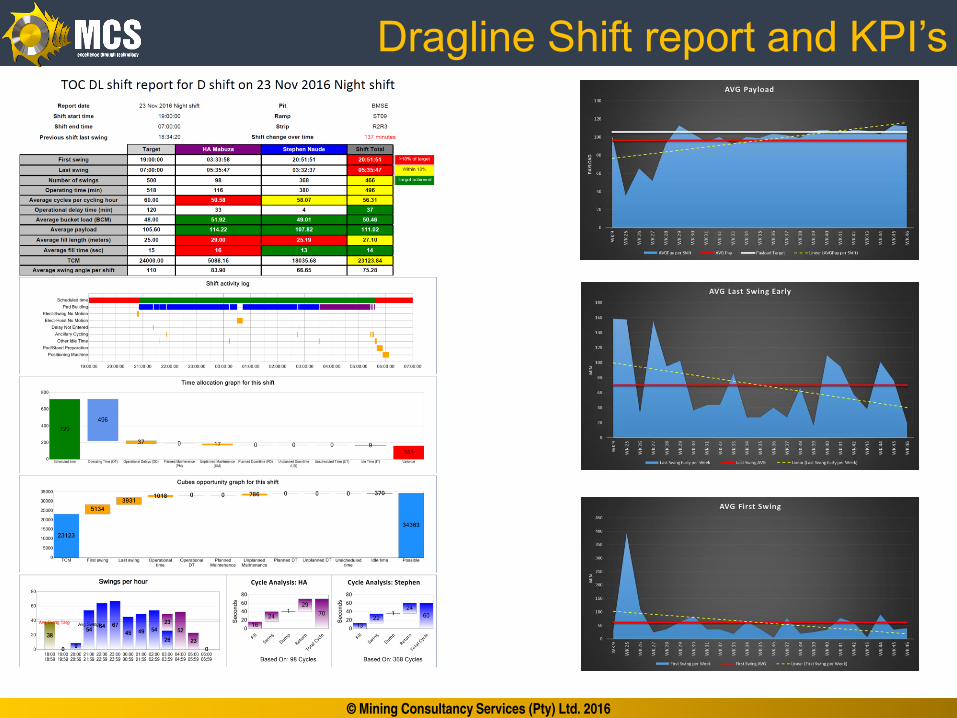
Dragline Shift report and KPI’s
© Mining Consultancy Services (Pty) Ltd. 2016
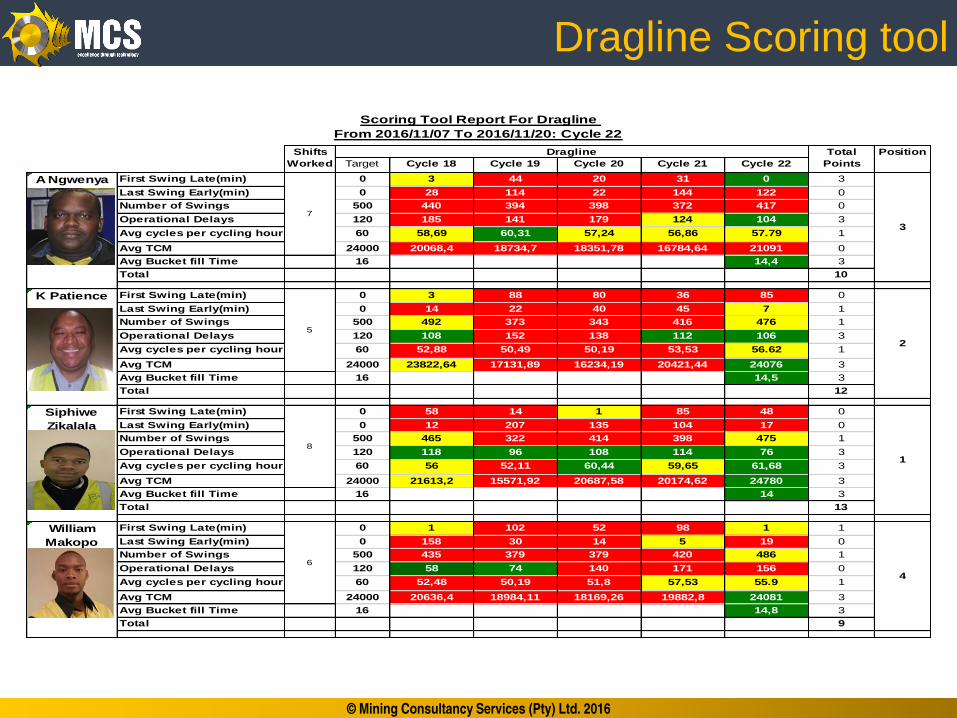
Dragline Scoring tool
© Mining Consultancy Services (Pty) Ltd. 2016
Target Cycle 18 Cycle 19 Cycle 20 Cycle 21 Cycle 22
First Swing Late(min) 0 3 44 20 31 0 3
Last Swing Early(min) 0 28 114 22 144 122 0
Number of Swings 500 440 394 398 372 417 0
Operational Delays 120 185 141 179 124 104 3
Avg cycles per cycling hour 60 58,69 60,31 57,24 56,86 57.79 1
Avg TCM 24000 20068,4 18734,7 18351,78 16784,64 21091 0
Avg Bucket fill Time 16 14,4 3
Total 10
First Swing Late(min) 0 3 88 80 36 85 0
Last Swing Early(min) 0 14 22 40 45 7 1
Number of Swings 500 492 373 343 416 476 1
Operational Delays 120 108 152 138 112 106 3
Avg cycles per cycling hour 60 52,88 50,49 50,19 53,53 56.62 1
Avg TCM 24000 23822,64 17131,89 16234,19 20421,44 24076 3
Avg Bucket fill Time 16 14,5 3
Total 12
First Swing Late(min) 0 58 14 1 85 48 0
Last Swing Early(min) 0 12 207 135 104 17 0
Number of Swings 500 465 322 414 398 475 1
Operational Delays 120 118 96 108 114 76 3
Avg cycles per cycling hour 60 56 52,11 60,44 59,65 61,68 3
Avg TCM 24000 21613,2 15571,92 20687,58 20174,62 24780 3
Avg Bucket fill Time 16 14 3
Total 13
First Swing Late(min) 0 1 102 52 98 1 1
Last Swing Early(min) 0 158 30 14 5 19 0
Number of Swings 500 435 379 379 420 486 1
Operational Delays 120 58 74 140 171 156 0
Avg cycles per cycling hour 60 52,48 50,19 51,8 57,53 55.9 1
Avg TCM 24000 20636,4 18984,11 18169,26 19882,8 24081 3
Avg Bucket fill Time 16 14,8 3
Total 9
2
1
4
7
5
8
6
Dragline
K Patience
Siphiwe
Zikalala
William
Makopo
Scoring Tool Report For Dragline
From 2016/11/07 To 2016/11/20: Cycle 22
Shifts
Worked
Total
Points
Position
A Ngwenya
3

TOC – Pit …. With 2 Excavators
© Mining Consultancy Services (Pty) Ltd. 2016
Target Cycle 18 Cycle 19 Cycle 20 Cycle 21 Cycle 22 Target Cycle 18 Cycle 19 Cycle 20 Cycle 21 Cycle 22
First Load Late(min) 7:30 0 67 70 154 106 7:30 4 83 37 144 70 88Last Load Early(min) 18:30 -1 233 167 91 91 18:30 21 42 113 175 235 163Loads per hour 14,25 13,53 0,69 0,91 2,78 15,4 18,62 9,89 12,98 5,72 3,46 20,7 18,05Operational Delays 120 13 11 0 0 110 120 24 18 12 69 80 95Number of loads 114 137 7 10 30 123,5 149 102 120 61 33 165,8 144,65Avg eBCM 6061 6203 326 450 1377 1485 8030 4615 5415 2781 1492 472 978,5
Total 9 9 18
First Load Late(min) 7:30 47 16 12 36 139 7:30 62 63 114 6 26 82,5Last Load Early(min) 18:30 66 10 244 25 125 18:30 72 46 98 125 228 176,5Loads per hour 14,25 8,31 9,84 5,27 2 8,5 18,62 6,28 3,37 5,57 3,86 16,4 12,45Operational Delays 120 0 0 29 0 132 120 19 0 24 11 77 104,5Number of loads 114 88 98 48 20 68,4 149 65 35 50 35 131,4 99,9Avg eBCM 6061 3997 4447 2187 933 795 8030 2947 1582 2250 1607 585 690
Total 1 3 4
First Load Late(min) 7:30 -10 0 189 75 52 7:30 8 39 43 71 108 80Last Load Early(min) 18:30 78 68 9 2 48 18:30 -1 100 25 82 0 24Loads per hour 14,25 12,1 5,38 6,6 6,32 16,9 18,62 13,6 9,49 5,92 4,43 19,8 18,35Operational Delays 120 34 19 79 54 172 120 33 63 53 43 94 133Number of loads 114 107 56 59 62 135,9 149 116 85 48 40 158,3 147,1Avg eBCM 6061 4837 2558 2655 2817 3127 8030 5231 3841 2160 1800 4792 3959,5
Total 6 12 18
First Load Late(min) 7:30 126 80 54 -3 52 7:30 16 67 65 65 12 32Last Load Early(min) 18:30 1 4 162 50 10 18:30 16 80 139 7 0 5Loads per hour 14,25 11,8 7,75 5,59 4,66 18,5 18,62 10,62 9,66 8,01 11,34 20,6 19,55Operational Delays 120 51 21 19 69 117 120 65 115 7 113 75 96Number of loads 114 106 70 43 43 148,6 149 97 81 57 92 165 156,8Avg eBCM 6061 4770 3183 1968 1962 2550 8030 4380 3667 2565 4149 5310 3930
Total 10 12 22
Scoring Tool Report For EX301 & EX302
From 2016/11/07 To 2016/11/20
2
4
2
16
Thomas
Ditshele
Dan
Hlabangwane
Ryno Wessels
Isac Pheko
EX302EX301AVE Of
Cycle 22
8
6
8
Shifts

24-Hour period Digger Summary report
© Mining Consultancy Services (Pty) Ltd. 2016

Individual Digger Report
© Mining Consultancy Services (Pty) Ltd. 2016

Content
© Mining Consultancy Services (Pty) Ltd. 2016
– Brief company background
– Productivity Optimisation Project (POP) methodology
through two case studies:
– Underground case study
– Opencast case study
– Technology (hardware and software) currently in
operation and commercially available
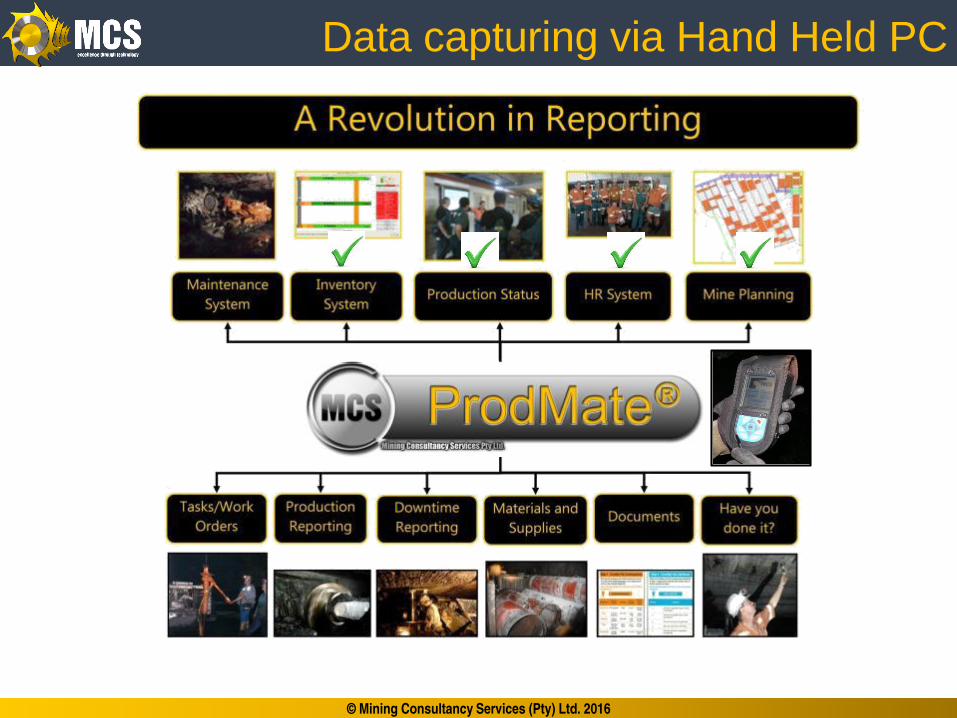
Data capturing via Hand Held PC
© Mining Consultancy Services (Pty) Ltd. 2016
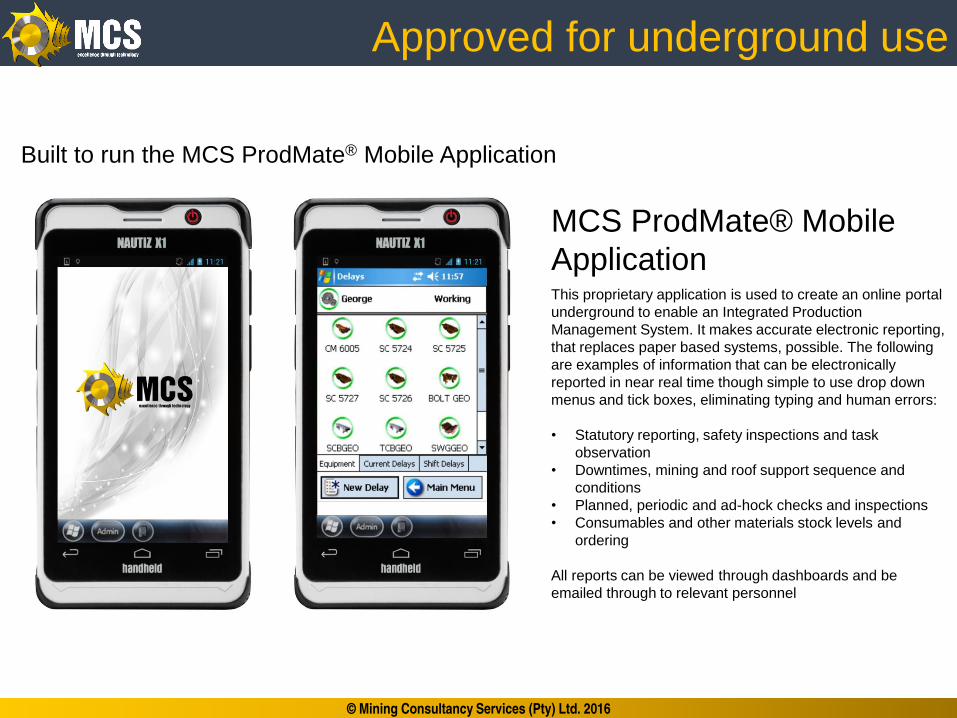
Approved for underground use
© Mining Consultancy Services (Pty) Ltd. 2016
MCS ProdMate® Mobile
Application This proprietary application is used to create an online portal
underground to enable an Integrated Production
Management System. It makes accurate electronic reporting,
that replaces paper based systems, possible. The following
are examples of information that can be electronically
reported in near real time though simple to use drop down
menus and tick boxes, eliminating typing and human errors:
• Statutory reporting, safety inspections and task
observation
• Downtimes, mining and roof support sequence and
conditions
• Planned, periodic and ad-hock checks and inspections
• Consumables and other materials stock levels and
ordering
All reports can be viewed through dashboards and be
emailed through to relevant personnel
Built to run the MCS ProdMate® Mobile Application

Underground Wi-Fi configuration
© Mining Consultancy Services (Pty) Ltd. 2016 30
Components:1. Single node fibre to belt drive2. Copper into section3. Combined IS power supply and
media converter mounted in switchgear
4. NS40 IS W-Fi node mounted on switchgear
5. Bi-directional antenna, one mounted and other one suspended
2
1
3
4
5

U/G Data and comms
© Mining Consultancy Services (Pty) Ltd. 2016 31
Daily Close out Meetings
Management of actions
ProdNote®
In-SectionWi-Fi
PlanningBoard

Mining Process Information
© Mining Consultancy Services (Pty) Ltd. 2016 32
Monitoring
ProdNote®
In-SectionWi-Fi
Downtime and Production
SC Report CM Report RB Report

Roofbolters
© Mining Consultancy Services (Pty) Ltd. 2016
– Number of bolts installed
– Utilisation – first use / last use
– Efficiency – All shift activities
– ONLINE DASHBOARDS
Laptop
Smart Phone IPad
TV Screens

Roofbolter Wi-Fi System
© Mining Consultancy Services (Pty) Ltd. 2016 34
Components:6. Second combined IS
power supply and media converter mounted in switchgear
7. Composite cable suspended against roof
8. NS 40 IR Wi-Fi node mounted against ribside
9. Uni-directional antennas suspended
10. Roofbolter system using VIP & two mounted antennas
6
7
8
10
9
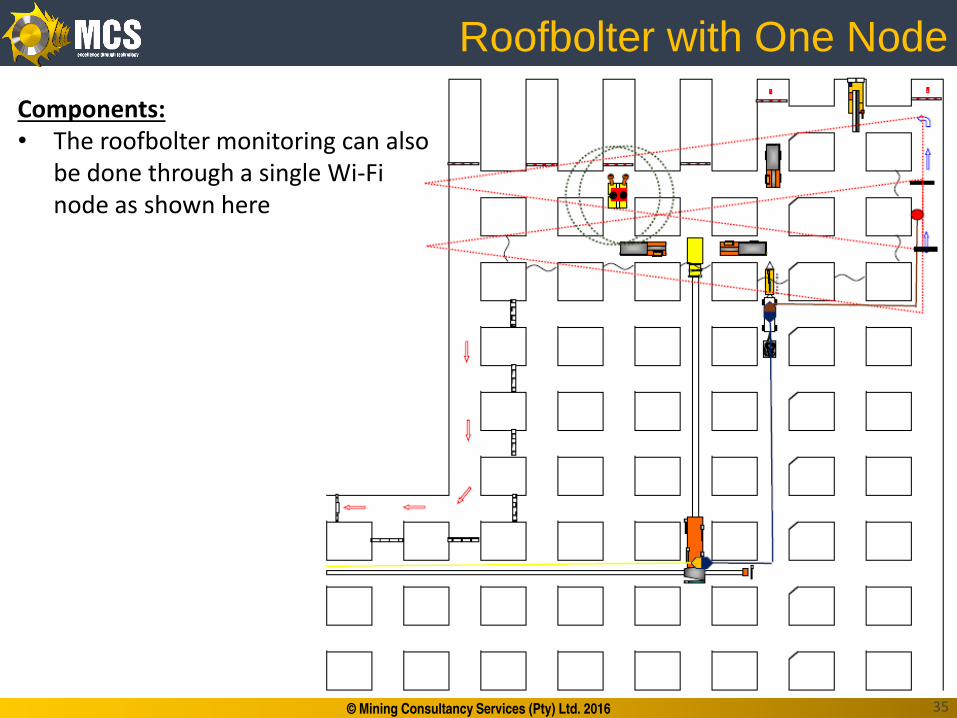
Roofbolter with One Node
© Mining Consultancy Services (Pty) Ltd. 2016 35
Components:• The roofbolter monitoring can also
be done through a single Wi-Fi node as shown here
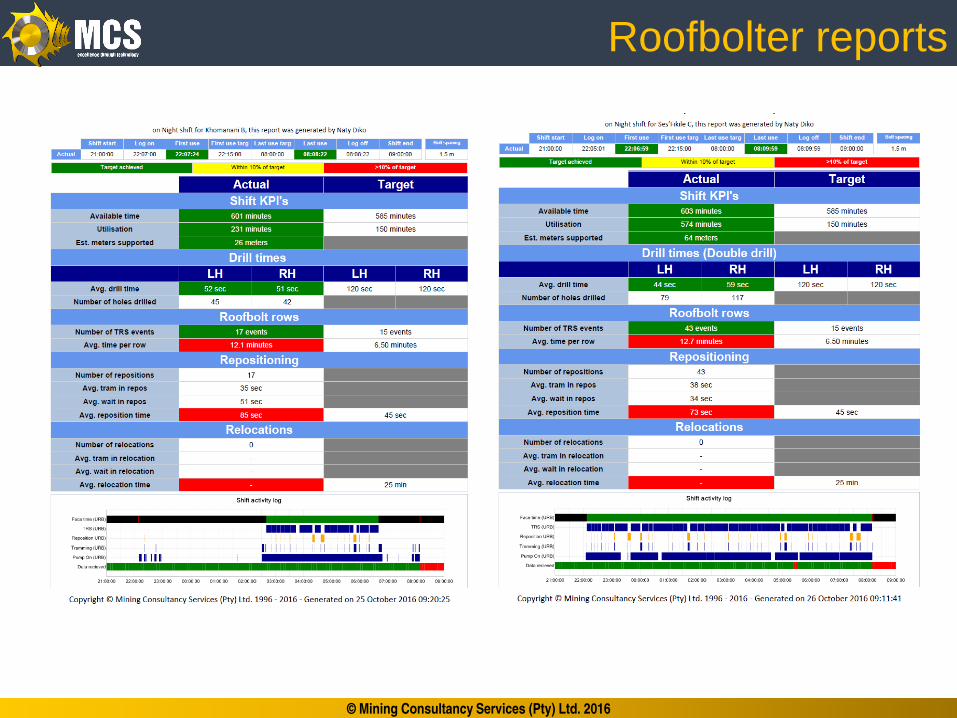
Roofbolter reports
© Mining Consultancy Services (Pty) Ltd. 2016

Roofbolter reports
© Mining Consultancy Services (Pty) Ltd. 2016
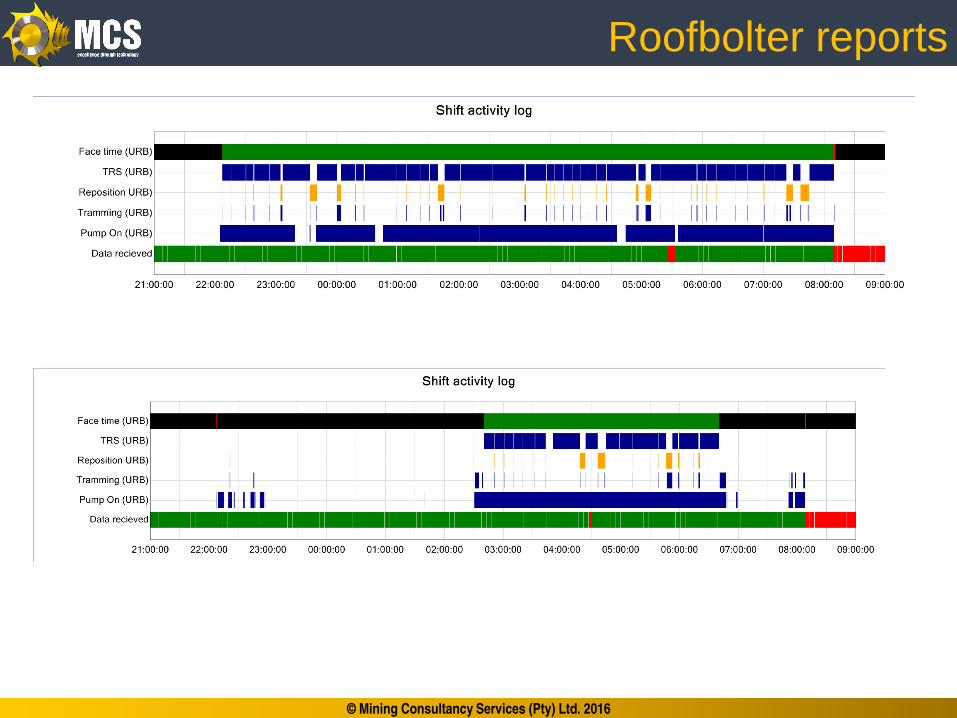
Roofbolter reports
© Mining Consultancy Services (Pty) Ltd. 2016

Hauling efficiency tracking online
© Mining Consultancy Services (Pty) Ltd. 2016
– Each shuttle car’s location can be monitored by means of Wi-Fi tags.
– This is used to determine queuing at the feeder breaker.
– Affordable solution
1
3
• Shuttle Cars and Battery Haulers:
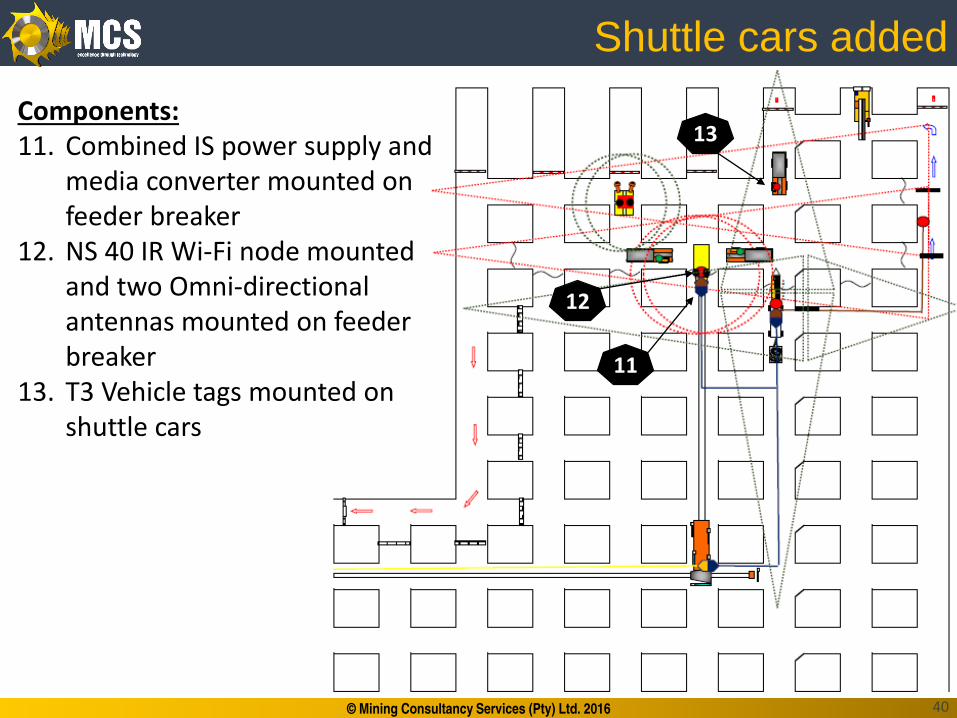
Shuttle cars added
© Mining Consultancy Services (Pty) Ltd. 2016 40
Components:11. Combined IS power supply and
media converter mounted on feeder breaker
12. NS 40 IR Wi-Fi node mounted and two Omni-directional antennas mounted on feeder breaker
13. T3 Vehicle tags mounted on shuttle cars
13
12
11

Live dashboards (15 minute update)
© Mining Consultancy Services (Pty) Ltd. 2016
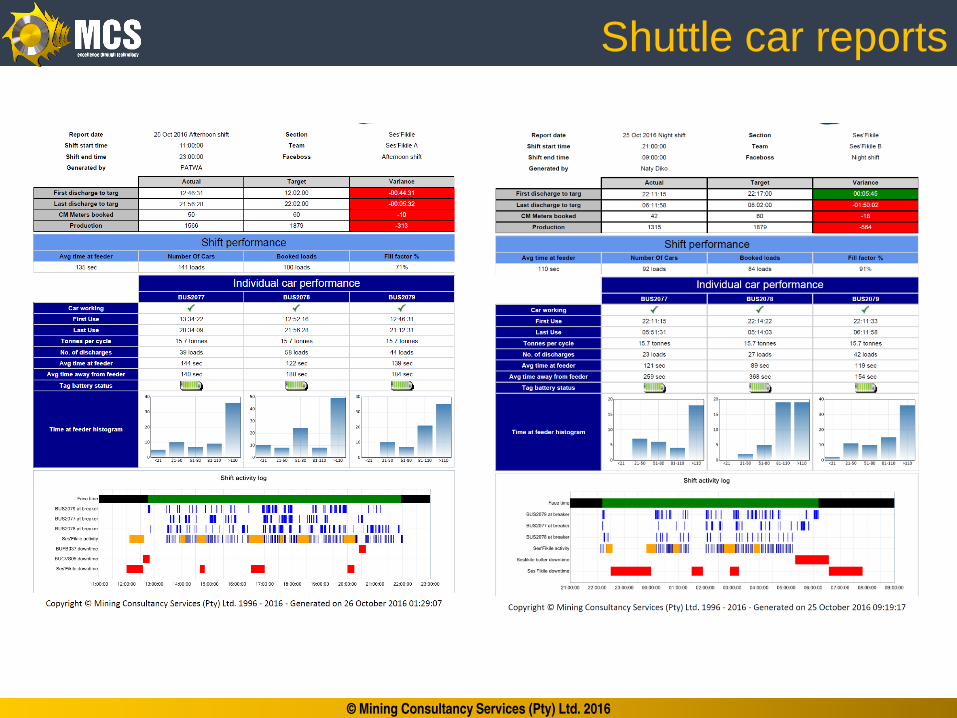
Shuttle car reports
© Mining Consultancy Services (Pty) Ltd. 2016

Shuttle car report
© Mining Consultancy Services (Pty) Ltd. 2016

© Mining Consultancy Services (Pty) Ltd. 2016

Thank you
© Mining Consultancy Services (Pty) Ltd. 2016 45