, jacques gautrais , richard bon 1,2, fernando … · 1 imitation combined with a characteristic...
TRANSCRIPT

1
Imitation Combined with A Characteristic Stimulus Duration Results inRobust Collective Decision-making
Sylvain Toulet1,2, Jacques Gautrais1,2, Richard Bon1,2, Fernando Peruani3,*1
1 Universite de Toulouse, UPS, Centre de Recherches sur la Cognition Animale, 118 routede Narbonne, F-31062 Toulouse Cedex 9, France.2 CNRS, Centre de Recherches sur la Cognition Animale, 118 route de Narbonne,F-31062 Toulouse Cedex 9, France.3 Laboratoire J. A. Dieudonne, Universite de Nice Sophia Antipolis, UMR 7351 CNRS,Parc Valrose, F-06108 Nice Cedex 02, France.
Abstract
For group-living animals, reaching consensus to stay cohesive is crucial for their fitness, particularlywhen collective motion starts and stops. Understanding the decision-making at individual and collectivelevels upon sudden disturbances is central in the study of collective animal behavior, and concerns thebroader question of how information is distributed and evaluated in groups. Despite the relevance ofthe problem, well-controlled experimental studies that quantify the collective response of groups facingdisruptive events are lacking. Here we study the behavior of groups of uninformed individuals subject tothe departure and stop of a trained conspecific within small-sized groups. We find that the groups reachan effective consensus: either all uninformed individuals follow the trained one (collective motion occurs)or none does. Combining experiments and a simple mathematical model we show that the observedphenomena results from the interplay between simple mimetic rules and the characteristic duration ofthe stimulus, here, the time the trained individual is moving away. The proposed mechanism stronglydepends on group size, as observed in the experiments, and though group splitting can occur, the mostlikely outcome is always a coherent collective group response (consensus). The prevalence of a consensusis expected even if the groups of naives face conflicting information, e.g. if groups contain two subgroupsof trained individuals, one trained to stay and one trained to leave. Our results indicate that collectivedecision-making and consensus in (small) animal groups are likely to be self-organized phenomena thatdo not involve concertation or even communication among the group members.
Introduction
Animals on the move show an impressive capacity to respond to strong perturbation such as changesof directions or behavioral switches [1, 2]. Many gregarious vertebrates are fusion-fission species, withfrequent changes in size and composition of groups. In addition, the habitat they live in is generallyheterogeneous, such that individuals alone or in groups may have to move among more or less distantareas in order to fulfil their basic vital requirements, e.g. drinking, resting or avoiding pblackators [3–7].Even during feeding periods, animals have to search for available food, moving slowly and on shortdistances between feeding stations or more rapidly and on larger distances to exploit distinct feedingareas [8]. Thus, groups either resting or feeding with animals motionless or moving slowly are frequentlyjoined by incoming individuals but also submitted to departures of group members [9–11]. When facedto multiple choices, social organisms must reach consensus in order to maintain the cohesion of the groupand the advantages linked to it [5, 12, 13]. The departure of one or few individuals from static groups as
1Email: [email protected]
arX
iv:1
512.
0730
7v1
[ph
ysic
s.bi
o-ph
] 2
2 D
ec 2
015

2
well as stops in moving groups compromise social cohesion [14,15]. This is particularly critical for smallgroups – a scenario that applies to most gregarious animals [16] despite the popularity and fascinationthat produce giant bird flocks or fish schools [17] – where group splitting represents a serious pblackatoryrisk [3].
What influences the individual decisions, i.e the interplay between external stimuli and internal state,and which decision-making processes occur to maintain social cohesion are among the most compellingquestions in the study of collective animal behavior [7, 18–26]. This is particularly true in very largegroups on the move like flocks of birds where the propagation of information through local interactionsplays a key role in the form of the collective response [27, 28]. This emerges from the very large numberof individuals or the strong effects of density in the group that implies that localized responses must beimplied to reach collective cohesive decisions. This goes beyond biology and concerns the broader questionof how information at the individual level is evaluated, processed and distributed in the group [29–33].Recent experiments with primates and fish revealed that an individual spontaneously departing froma static group is likely to give up and return to the group when not followed [9, 23]. It has been alsoobserved that collective motion is promoted by already moving conspecifics [24, 34]. Finally, in somespecies, a quorum is requiblack to observe collective movement [24, 34–37]. On the other hand, howcollective motion stops, remains largely unexploblack except for few exceptions [21, 38, 39]. In summary,there is a lack of experimental and theoretical studies focusing on the decision-making processes thattrigger and stop collective motion [3, 4, 6, 40].
Here, we use experimentally acquiblack data to address how groups of uninformed individuals respondto the departure and stop of an informed conspecific in small-sized groups where we suppose that indi-viduals have a global perception of all the group members and that effects of group density are negligible.We show that the groups of uninformed individuals always reach a consensus: either all uninformedindividuals follow the informed one or none does it. Combining experiments where we control the stim-ulus, associated to the motion of the informed individual, and a mathematical model we unveil that theapparent collective decision-making process leading to an effective consensus results from a self-organizedphenomenon resulting from the interplay of simple mimetic rules and the characteristic duration of thestimulus, with group size playing a central role.
Materials and Methods
Study area and Experiments
Fieldwork was carried out in the Domaine du Merle (5.74◦ E , 48.50◦ N) in the south of France. The fieldstation is located in the Crau region, a very flat area coveblack by a native steppe. The experiments wereperformed within irrigated pastures providing homogeneous food resources. From the available flock of1400 ewes, 30 of them were randomly selected and allocated to the training set and a further 200 ewesto the naive set. All ewes used were unrelated and were 3 to 5 year-old. A number was painted on theback and fleece of each sheep for identification. Both sets were penned up in the same sheepfold duringthe evening and the night. All the experiments were carried out in daylight (from 10am to 6pm) and theewes were fed hay in the sheepfold in the morning and in the evening.
Sheep training
The experiments rely on our capacity to trigger the movement of one sheep toward a fixed panel at theperiphery of an arena at a desiblack time. The protocol used to trained sheep was similar to the one usedin previous experiments [41,42]. Sheep to be trained were originally allocated at random in 6 groups of 5animals which composition remained unchanged during the training period. Sheep were first habituatedin the sheepfold to feed on corn and to receive simultaneously a vibration provided by a neck collar during

3
3 days. Then the training groups were introduced successively in one of two test arenas (50 x 50m), fora period of 30 to 40 min, each animal wearing a vibrating collar. Ten minutes past the introduction, thecollar was activated and one yellow panel (0.5 x 0.5m) was simultaneously raised delivering a handful ofcorn. Each group received four to eight stimulations, each separated by a period of at least 5 min duringeach training session. Past 14 days of training, we selected the 3 sheep with the best learning scores(100% of departure toward the panel following a vibration). These 3 trained sheep were comparable interms of initiation behavior and did not show any differences in movement speed to the panel (ANOVA:
F2
45= 0.378, P = 0.68). Meanwhile, the set of naive sheep to be used in experiments was confronted to
panel rising (without corn delivery) at the periphery of experimental arenas, at one-min interval duringtwo sessions of 90 min. At the end of this habituation session, no naive sheep raised its head when raisingthe panel. In addition, these two days allowed naive sheep to be familiarized with the experimental setup.
Experimental procedure
The experimental setup consisted in two arenas (50 x 50m) delimited with sheep fences and surroundedby a visual barrier (propylene net). A 7m-high tower was placed at an equal distance (10m) apart fromtwo next arenas corners. Yellow panels (0.5 x 0.5 m) were hammeblack in the middle of each side forboth arenas and were not visible to sheep (S1 Fig). The tests consisted in introducing groups of 8, 16 or32 sheep within one arena, among which one trained sheep equipped with a vibrating collar. The trainedewes were used no more than twice a day, but were implicated in all group sizes. The naive sheep thatcomposed the rest of the groups were selected randomly for each test. Because of the large number ofindividuals needed to complete all replications, the naive sheep were used several times, except in groupsof 8. Thirty replications were performed for groups of 32 and 15 replications for groups of 8 and 16individuals. A test was conducted as follows: the group was introduced in the arena and sheep grazedspontaneously during 20 min. Then, one of the two panels closest to the tower was raised, waiting forall sheep grazing (i.e head down). Simultaneously the vibrating collar of the trained sheep was activatedfor 2 sec. Past 10 min (end of test), a new panel was raised (one of the two farthest from the tower) toreinforce the conditioning of trained ewes and avoid restricting their space use to the vicinity of panelsclosest to the tower. The group was led back to the sheepfold shortly afterward. The naive sheep thatwere not tested during one experimental day were introduced in distant pasture. We never performedtwo trials in parallel. We also carried out control experiments to be sure that naive ewes did not associatethe panel rise and the food reward. Thereby, 6 tests before and 6 after the test series were conductedwith groups of 32 naive ewes, using the same protocol as described before. We found no movement ofgroups when raising the panel, almost all sheep continuing their spontaneous activity.
Data collection and analyses
Two digital cameras (Canon EOS D50) were fixed on the tower, each one focusing on one arena. Fifteenminutes after the introduction of the groups, the digital camera was turned on, taking a picture of theentire arena every second and turned off five minutes after the panel was raised. For each replication, weobtained a series of about 600 pictures. Using a custom software developed by JG [43,44], we were ableto track on each picture the position and the orientation of animals by dragging a vector on their back,and identify the behavior of each individual, i.e grazing, standing head-up, moving and others.
We defined a departure of the trained sheep (initiator), i.e initiation past experimental stimulationwhen it performed an uninterrupted walk towards the raised panel. The following behavior, i.e a newdeparture, was defined as the movement of a naive ewe occurring after the trained sheep departure,without stop until joining the trained ewe near the panel. The behavior of stopping was defined as anindividual ceasing to walk and remains either stationary head-up or resumes grazing. Six replicationin the groups of 32 were discarded, one because the initiator did not depart, two because the initiatorstopped moving between the group and the target and three because the initiator showed a moving

4
behavior not comparable to other trials (going to a wrong target first and then joining the rewardedtarget). Thus we performed analyses on 15 trials for groups of 8 and 16 sheep and 24 trials for groups of32.
The level α was fixed to 0.05 for statistical significance. All analyses were conducted using R version3.0.1.
Ethics statement
All the animals were maintained under routine husbandry conditions at a Montpellier Supagro researchstation (Domaine du merle, Salon-de-Provence, France) with full approval of its director Pierre-MarieBouquet. Animal welfare requirements were fully respected in accordance with the European Directive2010/63/EU, with the rules of the European Convention for the Protection of Vertebrate Animals usedfor Experimental and Other Scientific Purposes and with the Convention of the French Comite nationalde reflexion ethique sur lexperimentation animale. No special authorization from the French Ethical Com-mittee for animal experimentation (Commission nationale de l’exprimentation animale) was requiblackas no protected or endangeblack species was involved, as the experiments did not imply any invasivemanipulation (the experimental protocol consists in the observation of groups and the acquiblack dataare only pictures of the animals) and as sheep were conducted to the test arenas, as they are herded ona daily basis to the pastures. All personnel involved had technical support from the employees of theresearch station as requiblack by the French Ministry of Research. The experimental protocols includedshort test periods (20 minutes) where sheep did not experience painful, stressful or unfamiliar situations.The experimental procedures had no detrimental effect on the sheep and at the end of the experimentall the animals reintegrated the sheep herd of the breeding research station.
Results and Discussion
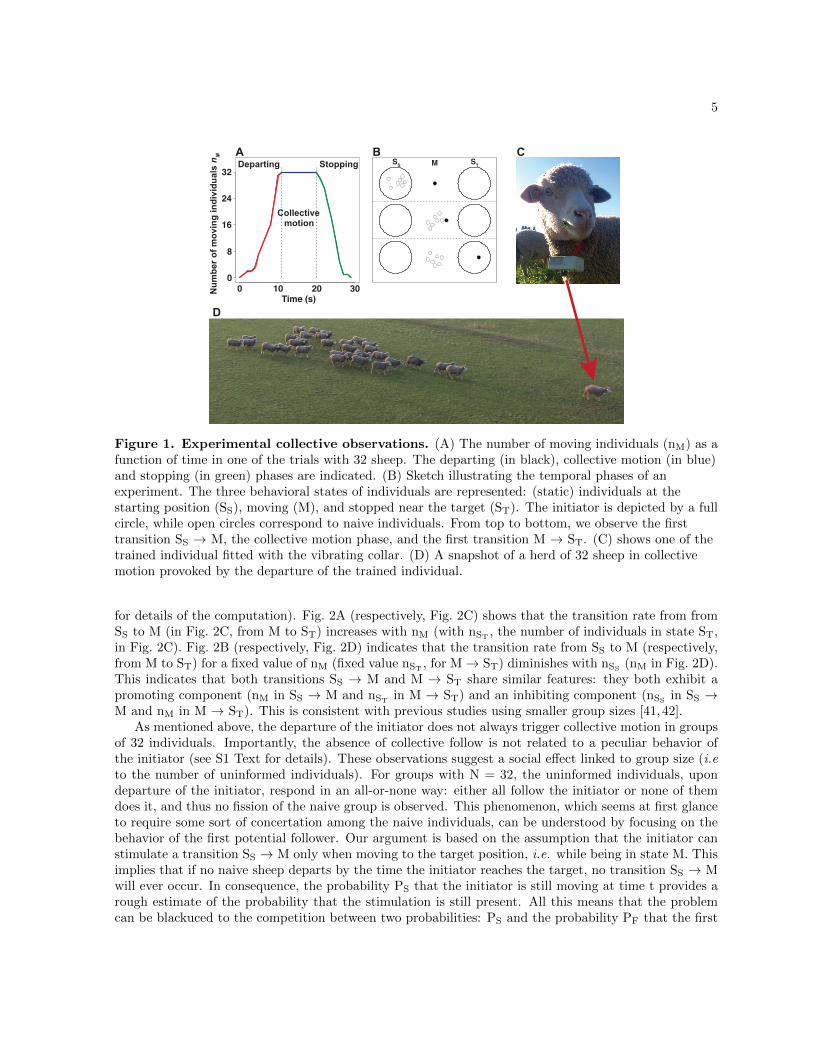
In our experiments, we work with groups of N = 8, 16 and 32 sheep, among which 1 is a trained individual– henceforth referblack to as initiator – while the remaining N - 1 are uninformed/naive individuals. Theinitiator is trained to move towards a target located at the periphery of the arena when a vibratingcollar is activated by a remote control (Fig. 1C). The group is subject to the perturbation produced bythe initiator: i.e. the sudden departure and stop of the initiator, which challenge the social cohesion ofthe group. When the departure of the initiator triggers a collective response, we observe three distinctconsecutive phases: departing, collective motion, and stopping as illustrated in Fig. 1A. The departingphase starts with the departure of the initiator and continues until the number nM of moving individualsincreases to match the group size. At this point, the collective motion phase begins with the groupmoving cohesively behind the initiator. The stop of the initiator near the target marks the onset of thestopping phase, where nM decreases until reaching 0. The behavior of an individual can be characterizedby one of the following states: stopped at the start position (SS), moving (M), or stopped at the targetposition (ST) (Fig. 1B). The whole process can be then described as a transition first from SS to M, andthen from M to ST.
In all trials with 8 and 16 sheep, the departure of the initiator systematically triggers a collectivemotion (Fig. 1D). In groups of 32 the departure of the initiator does not always leads to a collectivemotion of the naive group. Splitting of the naive group has not been observed (see S1 Video and S2Video for examples.)
We start our analysis by focusing first on the cases where the initiator successfully provokes a collectivemotion. We are interested in quantifying the decision of sheep to switch from SS to M and from M to ST.To account for the dynamics of the departing and stopping phases, we focused on the individual transitionrates (the probability per unit of time for a given individual to switch behavior). From the experimentaldata we estimated the departure and stopping rates for each departure and stopping rank (see S3 Text
5
00
20 30
8
16
24
32Stopping
Collective motion
Departing
Num
ber o
f mov
ing
indi
vidu
als
n M
Time (s)
●
●
●
SS M ST
A B
10
C
D
Figure 1. Experimental collective observations. (A) The number of moving individuals (nM) as afunction of time in one of the trials with 32 sheep. The departing (in black), collective motion (in blue)and stopping (in green) phases are indicated. (B) Sketch illustrating the temporal phases of anexperiment. The three behavioral states of individuals are represented: (static) individuals at thestarting position (SS), moving (M), and stopped near the target (ST). The initiator is depicted by a fullcircle, while open circles correspond to naive individuals. From top to bottom, we observe the firsttransition SS → M, the collective motion phase, and the first transition M → ST. (C) shows one of thetrained individual fitted with the vibrating collar. (D) A snapshot of a herd of 32 sheep in collectivemotion provoked by the departure of the trained individual.
for details of the computation). Fig. 2A (respectively, Fig. 2C) shows that the transition rate from fromSS to M (in Fig. 2C, from M to ST) increases with nM (with nST
, the number of individuals in state ST,in Fig. 2C). Fig. 2B (respectively, Fig. 2D) indicates that the transition rate from SS to M (respectively,from M to ST) for a fixed value of nM (fixed value nST , for M→ ST) diminishes with nSS (nM in Fig. 2D).This indicates that both transitions SS → M and M → ST share similar features: they both exhibit apromoting component (nM in SS → M and nST
in M → ST) and an inhibiting component (nSSin SS →
M and nM in M → ST). This is consistent with previous studies using smaller group sizes [41,42].As mentioned above, the departure of the initiator does not always trigger collective motion in groups
of 32 individuals. Importantly, the absence of collective follow is not related to a peculiar behavior ofthe initiator (see S1 Text for details). These observations suggest a social effect linked to group size (i.eto the number of uninformed individuals). For groups with N = 32, the uninformed individuals, upondeparture of the initiator, respond in an all-or-none way: either all follow the initiator or none of themdoes it, and thus no fission of the naive group is observed. This phenomenon, which seems at first glanceto require some sort of concertation among the naive individuals, can be understood by focusing on thebehavior of the first potential follower. Our argument is based on the assumption that the initiator canstimulate a transition SS → M only when moving to the target position, i.e. while being in state M. Thisimplies that if no naive sheep departs by the time the initiator reaches the target, no transition SS → Mwill ever occur. In consequence, the probability PS that the initiator is still moving at time t provides arough estimate of the probability that the stimulation is still present. All this means that the problemcan be blackuced to the competition between two probabilities: PS and the probability PF that the first

6
●
●●0.
00.
51.
0
0
1
2
Dep
artu
re ra
te μ
(s-1)
1 1 17 7 715 15 31
Dep
artu
re ra
te μ
(s-1)
0.0
0.5
1.0
8 16 32Number of moving individuals nM Group size N
●
●
●
0.00
0.25
0.50
8 16 32Group size N
0.0
0.25
0.5
Stop
rate
σ (s
-1)
1 1 17 7 715 15 31Number of stopped individuals nST
0.0
0.5
1.0
Stop
rate
σ (s
-1)
A B
C D
nM = 1nM = 2nM = 3
nM = 4
nST = 1
nST = 2nST = 4nST = 3
Figure 2. Individual transition rates. (A) and (C) show that the departure and stop rate increasewith nM and nST
, respectively, for all group sizes (N = 8, 16 and 32). (B) The inhibiting effect of SS onthe transition SS → M for a given nM is evidenced by the decrease of the transition rate with N. (D)Similarly, in the transition M → ST, we observe a decrease of the transition rate with N for a fixedvalue of nST , which indicates an inhibiting role of nM.
follower departs before time t, as illustrated in Fig. 3A-C. Fig. 3A and B indicate that for N = 8 and16, the transition SS → M for the first followers always occurs before the initiator stops near the targetposition. On the other hand, Fig. 3C shows that the transition SS → M for the first follower is such thatthe initiator can stop at the target position before this transition has ever occurblack. This provides aqualitative explanation of the remarkable group size effects observed in the experiments.
Now, we go further in the quantitative analysis using a mathematical model, which has proved usefulto analyze the experimental data and to test the various hypotheses formulated to interpret the observedphenomena. In particular, we will see that (i) the departure and stop rates can be expressed as non-linearfunctions, with promoting and inhibiting components as proposed above, and (ii) that the hypothesisthat the initiator can only induce a transition SS → M while being in state M is consistent with theexperimental data. Our first step is to formulate the (individual) rate µ associated to the transition SS
→ M as:
µ(nM , N) = αnβMnSS
γ= α
nβM(N − nM )
γ (1)
with α, β and γ parameters modulating the effect of nSSand nM on µ. Notice that for simplicity

7
we have assumed that every individual is able to perceive all individuals in the group. This implies thateach individual has a global perception of the group, that is a reasonable hypothesis for small groups ofup to few dozens of individuals, but that becomes unrealistic in large herds with hundblacks of animals.
Given expression (1), we can compute the mean time to depart t(nM) for the nMth follower as t(nM ) =
nM∑n=1
µ(n,N)−1, where µ = µ(n,N) (N − n) is the departure transition rate at the group level. From the
inverse function of this expression we obtain nM as a function of time (Fig. 3E), i.e. from t(nM) we
obtain nM(t). Notice that the departing phase is then given byN−1∑n=1
µ(n,N)−1, which means that the
average collective motion phase is approximately τ −N−1∑n=1
µ(n,N)−1, where τ is the time requiblack by
the initiator to reach the target (see S5 Text).In analogy to equation (1), we assume that the (individual) stop rate σ, related to the transition from
M → ST, is given by
σ(nM , N) = α′nST
β′
nMγ′ = α′(N − nM )
β′
nMγ′ (2)
with α′, β′ and γ′ parameters modulating the effect of nM and nSTon σ. During the stopping phase,
nM(t)) is obtained from the inverse function of t(nM ) = τ +nM∑
n=N−1σ(n,N)−1 with σ = σ(n,N)n, where
n ≤ N − 1.We emphasize that in the model we propose, the decision to switch behavior depends only on the
effect of the number of individuals in the current and the target states of the transition. This meansthat for example, for an individual in SS, the decision to switch to M will not depend on the number ofindividuals in ST (only on the number in SS and M). Also it is always true that nSS
+ nM + nST= N .
As commented above, it can occur that uninformed individuals do not follow the initiator in groupsof N = 32. Using the proposed mathematical framework, we can account for such group size effect. Werecall that the absence of collective motion is associated with those situations where the initiator does notinduce any transition SS → M of a naive individual during the time τ requiblack by the initiator to reachthe target position. Mathematically, the problem blackuces to compute the probability C – henceforthreferblack to as commitment – to observe a transition SS → M of a naive individual during τ , which takesthe form:
C = 1− 1
(τmax − τmin)µi(e−µi.τmin − e−µi.τmax) (3)
with µi = α iβ(N − i)1−γ , i the number of initiators (i = 1 in our experiments) and τmin and τmax, theminimum and maximum observed τ values respectively (see S6 Text for the derivation of expression (3)).The estimation of parameters is done in two steps. The best fit of Eq. (3) to the experimental pointsin Fig. 3D provides a set of α and γ values. Fixing these two parameters, the best fit on the individualrates is used to estimate the other parameter. More details on the fitting procedure are given in S4Text. The obtained values are α = 90.1, β = 2.5, γ = 3, and α′ = 0.23, β′ = 0.53, γ′ = 0.41. Fig. 3Eshows that the dynamics resulting from equations (1) and (2) provides a qualitative description of thedata (cf. Fig. 1A), while Fig. 3D shows that the model also accounts for the experimentally observedcommitment C. It worth noticing that given the nonlinear form of the transition rates and given theobtained parameter values, it turns out that after a first transition SS → M of a naive individual, acascade of transitions SS → M will immediately follow.
The mathematical model allows exploring a large variety of hypothetical scenarios with groups upto 100 animals, using conditions going beyond the ones used experimentally. It is important to stressthat model pblackictions are reliable as long as all hypotheses and assumptions remain valid. We stressthat the main assumption made on global perception might be irrelevant in larger groups where density

8
0.0
0.2
0.4
0.6
0.8
1.0
Time (s)
0
8
16
24
32
Num
ber o
f mov
ing
indi
vidu
als
n M
A B C
0.0
0.2
0.4
0.6
0.8
1.0
0.0
0.2
0.4
0.6
0.8
1.0
0.0
0.2
0.4
0.6
0.8
1.0
0.0
0.2
0.4
0.6
0.8
1.0
0.0
0.2
0.4
0.6
0.8
1.0
Com
mitm
ent C
Prob
abili
ty
2 8 16 32
D E
Group size N
0 3015Time t (s) Time t (s) Time t (s)
0.0
0.2
0.4
0.6
0.8
1.0
0.0
0.2
0.4
0.6
0.8
1.0
0 3015 0 3015
Size 8 Size 16 Size 32
PFPS
Departinggiven byeq. (1)
Stoppinggiven byeq. (2)
Collectivemotion
100
Figure 3. Following latency versus stimulus duration and model fitting. (A-C) ProbabilityPF of observing a first follow event before time t (solid line) and probability PS that the initiator hasnot reached the target at t (dashed line) for group sizes N = 8, 16, and 32. The blue areas indicate thetime window between the maximum departure time for the first follower and the minimum requiblacktime for the initiator to reach the target. (D) Probability that the initiator is followed by at least onenaive sheep (referblack to as commitment) as a function of group size N in experiments (blackdiamonds) and as pblackicted by equation (3) (black line). Whiskers represent 95% confidence intervals.(E) Pblackicted values of nM(t)) for N = 32. The dotted line indicates the time requiblack by theinitiator to reach the target (τ).
can be a constraint for interaction between individuals. Ultimately, models pblackictions should beverified/falsified by performing further experiments. Always according to our mathematical model, thereexist three possible outcomes when the naive group faces the departure of one or more initiators: i)all naive individuals follow the initiator(s), ii) none of them does it, and iii) only a fraction of naiveindividuals follow the initiator(s). The associated probabilities, PAF for i), PNF for ii), and PGS for iii),are shown in Fig. 4. While the first two scenarios, i.e. i) and ii), imply a sort of consensus for thenaive group, which assures group cohesion, the third scenario, i.e. iii), implies group fission. Althoughaccording to the mathematical model group splitting can occur, its probability is always small. Fig. 4Ashows that in groups of N ≤ 32, the probability of observing group splitting is smaller than 5%. Giventhat with N = 32 we have performed 24 experimental trials, one could expect in mean one group splittingevent. In short, the experimental observations are consistent with model pblackictions. In addition, themodel pblackicts - for a fixed range of τ (i.e. stimulation duration) - that full collective motion decreasesnon linearly with group size N, while the probability PNF that none follows increases non linearly (blackand black curves, respectively, in Fig. 4A). The probability of observing splitting of the naive group(green curve) exhibits a non monotonic dependency with N with a maximum at N = 64, where theprobability is close to 20%. This means that by performing similar experiments with 63 naive individuals

9
and one initiator - and performing a similar number of replications of the experiment - we should beable to observe group fission. It is worth noticing that if the group size is larger than 64, the probabilityof splitting decreases again. Furthermore, the model pblackicts that for large group sizes the departureof the initiator cannot induce naive individuals to move towards the target position: for large values ofN the naive group remains unresponsive to the departure of the initiator. This observation is, however,only valid for a fixed range of τ . If we imagine that the experiment is performed in larger arenas, insuch a way that the target position is located farther away and τ is significantly larger, the departure ofthe initiator will again lead naive individuals to move towards the target (Fig. 4B). Moreover, if the τ islarge enough, the model pblackicts that the only possible outcome upon the departure of the initiator isa full collective follow. Accordingly, the only scenario where fission of the naive group can be observedis when the two resulting subgroups will be separated a relatively small distance one from the other, atwhich point we could ask ourselves whether such separation qualifies truly as group splitting.
These experimental and theoretical results are in full agreement with very recent findings showingthat in animal groups, the persistence of the stimulus (the behaviour of one or several initiators) in timeis a crucial parameter to trigger a consensus to either turn or depart cohesively [1, 2]. This stimulusduration might be dependent of the travelled distance as shown in our results but also of the velocity ofthe initiator that is known to be a factor influencing group decisions [1, 42].
0.0
0.2
0.4
0.6
0.8
1.0
● ●● ●
●
●
●
●
●
●
●
●
●
●●
●●
● ● ●
●
0.0
0.2
0.4
0.6
0.8
1.0
●
●
●
●
●
●●
● ● ● ● ● ● ● ● ● ● ● ● ●
0.0
0.5
1.0
0.0
0.5
1.0
A BC
0.0
0.2
0.4
0.6
0.8
1.0
0.0
0.2
0.4
0.6
0.8
1.0
Prob
abili
ty
8 16 32 64 100 20 40 60 80 100
All follow (PAF)None follows (PNF)Group splitting (PGS)
Group size = 32
i = 1 / r = 0 i = 2 / r = 0 i = 3 / r = 0
0.0
0.5
1.0
0.0
0.5
1.0
i = 1 / r = 1 i = 1 / r = 2 i = 1 / r = 3Stimulus duration τ (s)Group size N
0.0
0.5
1.0
0.0
0.5
1.0
i = 1 / r =2 i = 2 / r =1
D
E
PAF
PNF
PGS
Figure 4. Model pblackictions for collective decision of naives. (A) Probabilities PAF ofobserving a full collective follow (black line), PNF corresponding to no follow (black line), and PGS togroup splitting (green line) as a function of group size N for groups of naives subject to the departure of1 initiator. (B) PAF, PNF, and PGS as function of the stimulus time, associated to the time requiblackby the initiator to reach the target position, for N = 32 including 1 initiator. The grey area shows theinterval of stimulus durations we observed experimentally. (C), (D) and (E) show PAF, PNF, and PGS
when the naive group is faced to contradictory information cues: a number i of individuals determinedto go towards the target (initiators) and the number r of individual determined to stay (see text fordetails). Results for N = 32. Notice that i and r do not induce a symmetric collective bias.
Finally, the model also allows us to explore situations where naive groups are subject to conflictinginformation cues. For instance, let us imagine we trained a group of i individuals to move towards thetarget position and a group of r individuals to stay at the starting position. We are interested in thebehavior of the naive individuals, for whom there are always two mutually exclusive options – either tostay or to go –, which means that all probabilities, PAF, PNF, and PGS, are computed with respect to thenaive group. To avoid confusions, we clarify that this implies that PAF is the probability that all naiveindividuals follow, PNF none of the naive individuals follows, and PGS the probability that at the end ofthe process we find some of the naive individuals at the starting position and some at the target position.We start out with a simple scenario where there is no trained individual to stay, i.e. r = 0. By increasing

10
the number i of individuals moving away, we find, not surprisingly, that PAF increases dramatically, tothe point that the only possible outcome is a collective motion (i.e. PAF → 1, Fig. 4C). Similarly, wecan fix i and increase the number r of individuals determined to stay. We find that increasing r leads toa very weak increase of PNF and PGS (Fig. 4E). Thus, there is a clear asymmetry in the role played byi and r. This is particularly evident by fixing the number of trained individuals and varying the relativeweight between i and r. Fig. 4D corresponds to i + r = 3 and shows that i = 1 and r = 2 is remarkablydifferent from i = 2 and r = 1. In particular, while for i = 2 and r = 1, PAF → 1, for i = 1 and r = 2,we do not find that PNF → 1. Moreover, i = 1 and r = 2 differs only slightly from i = 1 and r = 0.This means that if we have initially i = 1 and r = 1, adding an extra trained individual determinedto move towards the target ensures a full collective follow, while adding an extra individual determinedto stay has a very weak effect on the collective outcome. We have to make r close to N to assure thatthe trained individual will systematically fail to recruit any naive sheep. In short, a small variation ofr has a weaker effect than a small variation of i. Adding individuals determined to either stay or toleave does not produce, at the collective level, a symmetric bias, even if staying and leaving are oppositealternatives, naive individuals can only perceive the stimulation that constitute the moving individuals.The r individuals do not move and thus do not differ from other stopped individuals (the naive ones).The only effect of the r individuals is to slow down the departure dynamic. This is in sharp contrast withbinary decision studies [24,46–48] where mutually exclusive options are consideblack as symmetric. Thisis particularly clear in flocking models [47,48] where left-right choices are such that individuals determinedto move towards the left exert the same social influence than individuals determined to move towards theright. One important message we learn is that opposite alternatives are not necessarily symmetric. Theorigin of such asymmetry may be related to the fact that at the individual level the decision whether tostay or to leave can be formulated as a decision whether to remain in the current state or to change it.The obtained results, at both the experimental and theoretical level, suggest that behavioral change isstrongly favoblack. Moreover, it seems that the individuals that initiate a change become – as previouslyproposed [49] – incidental leaders, while those determined to remain in the current state, though playingan inhibiting role, exert a weaker influence on the naive group.
Conclusions
Here, we have shown that simple mimetic responses – as those described by equations (1) and (2) – whencombined with the characteristic duration associated to the stimulus – here, the time requiblack to arriveat the target position – act as an effective collective decision-making mechanism. Moreover, we showedthat the proposed mechanism, whose derivation is intimately based on the presented experimental obser-vations, allows a group of naive/uninformed individuals to solve a scenario with conflicting information insuch a way that the most probable collective outcome is a consensus. Specifically, we analyzed a situationwhere the naive group faces a scenario where there is a subgroup decided to stay and subgroup decided togo, and showed that the two most probable outcome are that either all naive individuals follow or nonedoes. Importantly, though group splitting cannot be discarded, such event is, according to the proposedmechanism, unlikely.
In summary, the interplay between mimetic rules and the characteristic duration of the stimulus leadsto a self-organized collective decision-making that does not requiblack neither explicit communication norconcertation among the group members. Interestingly, we are able to reproduce the collective behavioursusing a model considering that animals have a global perception of the group even in moderate groupesizes. The pblackictions the model allows with larger group sizes open the way to the realization ofnew experiments. Such experimental results will allow to test the validity of our proposal and check atwhich group size local interactions become prevalent. It is clear that considering alternative individualmechanisms taking into account local effects on the response of individuals can reproduce similar temporaldynamics as the one presented here. This is particularly true in very large groups or when density is

11
very high even in small groups where local interactions are mandatory due to crowding effects and/or tocognitive limits that might be involved in such cases [2,17,45]. The investigation of the effect of distanceon the responsiveness in groups of sheep will be subject to future works.
Finally, it is worth noticing that the effective decision-making mechanism described here applies to aspecific social context: a group of nave individuals sharing an initial behavioral state, which is subject tothe behavioral shift of one or several conspecifics. One of the essential elements of the proposed mechanismis the presence of a discrete number of behavioral states, which has to be, necessarily, larger than two (ase.g. SS, M and ST). This means that collective decision-making models for groups in motion, where thegroup has to decide in which direction to move [47] cannot be used to model the specific social contextaddressed here. Such models have been designed to describe the navigation of a group, and not to describebehavioral shifts. At the mathematical level the differences are evident. While navigation models associatea continuous variable to each individual, related to the moving direction of the individual, behavioral shiftmodels deal with discrete variables associated to the possible behavioral states of the group members.Similarly, the social mechanism analyzed here cannot be directly compablack with decision-making modelsdesigned to described dichotomic decisions as left and right moving direction [11, 24]. The essentialdifference with such models is that they consider groups that are not initially already moving to the left orto the right, and that they generally do not take into account any effect of the stimulus duration contraryto what we develop here. In contrast to the social context we are interested in here where individualsinitially share same behavioral state. In summary, the collective decision-making mechanism proposedhere is fundamentally different, and not comparable to previous collective decision-making mechanisms,which have been designed to describe a different social context. Deeply rooted in the models proposedin previous works [34, 41], the mechanism proposed here differs from these two by making use of threebehavioral states, accounting simultaneously for the initiation and stop of the collective response, andwith both processes modeled as a transition at the individual level.
Given the simplicity of the proposed mechanisms here, we expect similar mechanisms to be at workin other animal systems.
Acknowledgments
We thank the staff of the Domaine du Merle, R. Violleau and M.-H. Pillot for support during experiments,P. Arrufat for technical help, DYNACTOM team, R. Fournier, F.-X. Dechaume-Moncharmont, S. Blancoand O. Chepizhko for discussions. We thank Gregory Sempo and one anomynous reviewer for theirconstructive and helpful comments. This work was supported by one CNRS PEPS grant PhysiqueTheorique et ses Interfaces and one CNRS PEPS grant BIO-MATHS-INFO. ST is supported by a PhDgrant of the French Ministry of Superior Education and Research.
References
1. Ioannou CC, Singh M, Couzin ID. Potential Leaders Trade Off Goal-Oriented and Socially OrientedBehavior in Mobile Animal Groups. The American Naturalist. 2015 Aug;186(2):284–293
2. Attanasi A, Cavagna A, Del Castello L, Giardina I, Jelic A, Melillo S, et al. Emergence of collectivechanges in travel direction of starling flocks from individual birds’ fluctuations. Journal of RoyalSociety Interface. 2015 Jul;12(108)
3. Beauchamp G. Flock size and density influence speed of escape waves in semipalmated sandpipers.Animal Behaviour. 2012 Apr;83(4):1125–1129.
4. Conradt L, Roper TJ. Consensus decision making in animals. Trends in Ecology & Evolution.2005 Aug;20(8):449–456.

12
5. Fischhoff IR, Sundaresan SR, Cordingley J, Larkin HM, Sellier MJ, Rubenstein DI. Social rela-tionships and reproductive state influence leadership roles in movements of plains zebra, Equusburchellii. Animal Behaviour. 2007 May;73(5):825–831.
6. King AJ, Cowlishaw G. Leaders, followers and group decision-making. Communicative & integra-tive biology. 2009;2(2):147–150.
7. Sueur C, King AJ, Conradt L, Kerth G, Lusseau D, Mettke-Hofmann C, et al. Collective decision-making and fission-fusion dynamics: a conceptual framework. Oikos. 2011 Sep;120(11):1608–1617.
8. Dumont B, Boissy A. Grazing behaviour of sheep in a situation of conflict between feeding andsocial motivations. Behavioural Processes. 2000;49(3):131–138.
9. Reebs SG. Can a minority of informed leaders determine the foraging movements of a fish shoal?Animal Behaviour. 2000;59(2):403–409.
10. Ramseyer A, Boissy A, Dumont B, Thierry B. Decision making in group departures of sheep is acontinuous process. Animal Behaviour. 2009 Jul;78(1):71–78.
11. Ward AJW, Herbert-Read JE, Jordan LA, James R, Krause J, Ma Q, et al. Initiators, Leaders, andRecruitment Mechanisms in the Collective Movements of Damselfish. The American Naturalist.2013 Jun;181(6):748–760.
12. Danchin E, Giraldeau LA, Valone TJ, Wagner RH. Public information: From nosy neighbors tocultural evolution. Science. 2004;305(5683):487–491.
13. Galef Jr BG, Giraldeau LA. Social influences on foraging in vertebrates: causal mechanisms andadaptive functions. Animal Behaviour. 2001 Jan;61(1):3–15.
14. Couzin ID, Krause J, James R, Ruxton GD, Franks NR. Collective memory and spatial sorting inanimal groups. Journal of Theoretical Biology. 2002 Sep;218(1):1–11.
15. Eftimie R, de Vries G, Lewis MA. Complex spatial group patterns result from different animal com-munication mechanisms. Proceedings of the National Academy of Sciences. 2007 Apr;104(17):6974–6979.
16. Reiczigel J, Lang Z, Rozsa L, Tothmeresz B. Measures of sociality: two different views of groupsize. Animal Behaviour. 2008 Feb;75(2):715–721.
17. Ballerini M, Cabibbo N, Candelier R, Cavagna A, Cisbani E, Giardina I, et al. Interaction rulinganimal collective behavior depends on topological rather than metric distance: Evidence from afield study. Proceedings of the National Academy of Sciences. 2008 Jan;105(4):1232.
18. Conradt L, Roper TJ. Deciding group movements: where and when to go. Behavioural Processes.2010 Jul;84(3):675–677.
19. Giardina I. Collective behavior in animal groups: Theoretical models and empirical studies. HFSPJournal. 2008 Aug;2(4):205–219.
20. King AJ. Follow me! I’m a leader if you do; I’m a failed initiator if you don’t? BehaviouralProcesses. 2010 Jul;84(3):671–674.
21. Petit O, Bon R. Decision-making processes: the case of collective movements. Behavioural Pro-cesses. 2010 Jul;84(3):635–647.

13
22. Procaccini A, Orlandi A, Cavagna A, Giardina I, Zoratto F, Santucci D, et al. Propagating wavesin starling, Sturnus vulgaris, flocks under pblackation. Animal Behaviour. 2011 Oct;82(4):759–765.
23. Roberts G. How many birds does it take to put a flock to flight? Animal Behaviour.1997;54(6):1517–1522.
24. Ward AJW, Sumpter DJT, Couzin ID, Hart PJB, Krause J. Quorum decision-making facil-itates information transfer in fish shoals. Proceedings of the National Academy of Sciences.2008;105(1518):6948–6953.
25. Collignon B, Deneubourg J-L, Detrain C. Leader-based and self-organized communication: Mod-elling group-mass recruitment in ants. Journal of Theoretical Biology. 2012 Nov;313:79–86
26. Lihoreau M, Deneubourg J-L, Rivault C. Collective foraging decision in a gregarious insect. Be-havioral Ecology and Sociobiology. 2010 May;64(10):1577–1587
27. Attanasi A, Cavagna A, Del Castello L, Giardina I, Grigera TS, Jelic A, et al. Information transferand behavioural inertia in starling flocks. Nature Physics. 2014 Jul;10(9):615-698
28. Cavagna A, Del Castello L, Giardina I, Grigera TS, Jelic A, Melillo S, et al. Flocking and turning: anew model for self-organized collective motion. Journal of Statistical Physics. 2014 Mar;158(3):601–627
29. Bellman RE, Zadeh LA. Decision-Making in a Fuzzy Environment. Management Science. 1970Dec;17(4):141–164.
30. Dyer JRG, Ioannou CC, Morrell LJ, Croft DP, Couzin ID, Waters DA, et al. Consensus decisionmaking in human crowds. Animal Behaviour. 2008 Feb;75(2):461–470.
31. Edwards W. The theory of decision making. Psychological Bulletin. 1954 Jul;51(4):380.
32. Herrera F, Martinez L, Sanchez PJ. Managing non-homogeneous information in group decisionmaking. European Journal of Operational Research. 2005 Oct;166(1):115–132.
33. Lindley DV. Making decisions; 1985.
34. Petit O, Gautrais J, Leca JB, Theraulaz G, Deneubourg JL. Collective decision-making inwhite-faced capuchin monkeys. Proceedings of the Royal Society B: Biological Sciences. 2009Aug;276(1672):3495–3503.
35. Pratt SC. Quorum sensing by encounter rates in the ant Temnothorax albipennis. BehavioralEcology. 2005 Mar;16(2):488–496.
36. Sumpter DJT, Krause J, James R, Couzin ID, Ward AJW. Consensus Decision Making by Fish.Current Biology. 2008 Nov;18(22):1773–1777.
37. Sempo G, Canonge S, Detrain C, Deneubourg J-L. Complex Dynamics Based on a Quo-rum: Decision-Making Process by Cockroaches in a Patchy Environment. Ethology. 2009Dec;115(12):1150–1161
38. Bhattacharya K, Vicsek T. Collective decision making in cohesive flocks. New Journal of Physics.2010 Sep;12(9):093019.
39. Daruka I. A phenomenological model for the collective landing of bird flocks. Proceedings of theRoyal Society of London Series B-Biological Sciences. 2009 Mar;276(1658):911–917.

14
40. Cresswell W, Hilton GM, Ruxton GD. Evidence for a rule governing the avoidance of superfluousescape flights. Proceedings of the Royal Society B: Biological Sciences. 2000 Apr;267(1444):733–737.
41. Pillot MH, Deneubourg JL. Collective movements, initiation and stops: diversity of situations andlaw of parsimony. Behavioural Processes. 2010 Jul;84(3).
42. Pillot MH, Gautrais J, Arrufat P, Couzin ID, Bon R, Deneubourg JL. Scalable Rules for CoherentGroup Motion in a Gregarious Vertebrate. PLoS ONE. 2011 Jan;6(1):e14487.
43. Ginelli F,Peruani F, Pillot M-H, Chat’e H, Theraulaz G, Bon, R. Intermittent collective dynamicsemerge from conflicting imperatives in sheep herds. Proceedings of the National Academy ofSciences. 2015 Sept; 112 (41): 12729–12734
44. Michelena P, Gautrais J, Grard J-F, Bon R, Deneubourg J-L. Social cohesion in groups of sheep:Effect of activity level, sex composition and group size Applied Animal Behaviour Science. 2008Jul;112(1-2):81–93.
45. Strandburg-Peshkin A, Twomey CR, Bode NWF, Kao AB, Katz Y, Ioannou CC, et al. Vi-sual sensory networks and effective information transfer in animal groups. Current Biology. 2013Sep;23(17):709–711
46. Miller NY, Garnier S, Hartnett AT, Couzin ID. Both information and social cohesion determinecollective decisions in animal groups. Proceedings of the National Academy of Sciences. 2013, 110(13):5263–5268
47. Couzin ID, Krause J, Franks NR, Levin SA. Effective leadership and decision-making in animalgroups on the move. Nature. 2005;433(7025):513–516.
48. Conradt L, Krause J, Couzin ID, Roper TJ. ”Leading according to need” in self-organizing groups.The American Naturalist. 2009 Mar;173(3):304–312.
49. Pillot MH, Gautrais J, Gouello J, Michelena P, Sibbald AM, Bon R. Moving together: Incidentalleaders and naıve followers. Behavioural Processes. 2010 Feb;83(3):7–7.

15
Supporting Information
S1 Video
One example of a trial in a group of 32 where the initiator triggers a collective motion.We compiled the snapshots at a rate of 2 frames per second (1 second in the video represents 2 s in realtime). At 12 s, we added at the bottom left, for each frame a figure showing the locations of the groupmembers across time. The initiator is plotted in blue. Naive individuals not moving are plotted in blackand the moving ones in black.
S2 Video
One example of a trial in a group of 32 where the initiator fails to provoke a collectivemotion. Parameters as in S1 Video.
S1 Text
Details on the behavior of sheep. In trials with groups of 8 and 16, the initiation always triggeblackthe departure of all naives. In groups of 32, only 75% of the trials (18 out of 24) displayed such collectiveresponse. We investigated whether the lack of commitment of the naives could be explained by behavioraldifferences in initiations or by particular group configuration. We used three different initiators in theexperiments that were tested in all group sizes. Each failed to entrain naive sheep i.e. the cases where nocollective departure was observed cannot be due to any particular trained sheep. When comparing trialswith and without follower, no differences were found regarding initiators movement mean speed (Studentt-test: T = -1.08, P = 0.3) or in terms of group density (Wilcoxon test: W = 66, P = 0.9). Thus, thelack of commitment cannot be explained by any peculiar behavior or position of the initiators, indicatingthat social mechanisms are involved. Trials without collective motion occurblack on days 3, 4, 8, 15 and16 of the 17 days of experiments discarding any potential effect of habituation or change in motivationof the naives. All naive sheep were tested in control trials in groups of 32 (without trained individual),6 before and 6 after the experiments. These control groups were confronted to a panel rise in the sameconditions as in the experimental trials (except that no sheep was wearing a vibrating collar). No naivesheep responded to the panel rise i.e. we did not record any movement nor any behavioral modification.
S2 Text
Statistics of the departing and stopping phases. We tested whether latencies of the first followerswere affected by group size. We found a significant effect of group size (medians: 1 s, 1 s and 2 s for groupsof 8, 16 and 32 respectively; Kruskal-Wallis test: χ2 = 8.67, df = 2, P = 0.01). Furthermore, the firstfollowers’ latencies were more variable in groups of 32 than in smaller ones (Bartlett-test: K2 = 42.97,df = 2, P < 0.0001; S2 FigA). The duration of the departing phase (time elapsed between the first and thelast following events) increases with group size (medians: 3.6 s, 7 s and 14.5 s respectively; χ2 = 24.51,df = 2, P < 0.0001) but also varied highly in the larger group size (K2 = 20.81, df = 2, P < 0.0001; S2FigB). With the same logic, we tested the effect of group size on the latencies of first stoppers. There isno significant effect of group size on the first stop latency (medians: 1.3 s, 1.3 s and 3 s respectively forgroup sizes 8, 16 and 32; χ2 = 4, df = 2, P = 0.13), but stop latencies were more variable in groups of 32(K2 = 10.14, df = 2, P = 0.006; S3 FigA). The duration of the stopping phase (time elapsed between thefirst and the last stop) increases (medians: 6 s, 7.5 s and 11 s respectively; χ2 = 12.28, df = 2, P = 0.002)but the variance was not affected by group size (K2 = 4.12, df = 2, P = 0.13; S3 FigB).

16
S3 Text
Details on the estimation of the experimental rates. The transition rates in Fig.2 are estimatedfrom the experimental data. Let us take an example of how the departure rate (probability per unit oftime for an individual to depart) is estimated for groups of 32 individuals. For a given departure rank,nM = k (and then nSS
= N − k) we have 18 (the number of experimental trials with groups of 32)latencies of departure (the time elapsed between the previous departure that led to nM = k and thenext one that leads to nM = k + 1). As these latencies are exponentially distributed, we hypothesizethat a memoryless phenomenon is at stake. Thus that the probability per unit of time for one individualto depart is constant while the group configuration (the combination of nM and nSS
) is the same. Theindividual experimental departure rate (µ) for a given value of nM is estimated by computing the inverseof the mean experimental latency divided by nSS
. We apply the same method to estimate the individualstopping rate (σ) because the distribution of latencies for a given value of nST also follows an exponentiallaw. This estimation process is also detailed in [42].
S4 Text
Details on the parameter estimation. Following Pillot et al. [42], we quantify the individual responsefunction, i.e. the departure rate µ (respectively the stop rate σ) considering that sheep are stimulatedto move (respectively to stop) by all moving (stopped) sheep but inhibited by all stopped (moving) oneswith
µ = αnMβ
nSγS, (4)
and
σ = α′nSβ
′
T
nMγ′ . (5)
Previously, Pillot et al. never recorded cases where no collective departure was observed. The pa-rameter estimation we perform is of two types for departing and stopping phases because we want to getparameters values allowing to pblackict lack of collective departures (which is highly dependent on thefirst followers latencies), but also to account for the dual combination of mimetic rules in order to getcoherent description of the two phases when increasing the group size and the number of initiators. Aboutthe departing phase, the estimation of the parameters that best fit the experimental data is a non-trivialtask. We want equation (3) to produce a value of commitment C close to the experimental data (Fig. 3D),while equation (1) to reproduce as faithfully as possible the temporal patterns of the departure and thestopping phases respectively (Fig. 3E). Lets consider first the commitment C. Equation (3) which modelsC depends only on α and γ for i = 1. We adjust α and γ to obtain the best fitting of equation (3), andthen we have only one free parameter to play with (β) to tune equation (1). We kept the values of α andγ that minimize the error (as calculated by the average of the squares of differences) on C, and lookedfor a value of β minimizing the error on the departure rates. With respect to experimental departurerates, we modify the procedure followed by Pillot et al. in order to take into account both trials with andwithout collective departures. The modified procedure computes the survival analysis on the distributionof the departure latency of the first followers including those censoblack by the time spent by initiatorsto reach the target in trials where they were not followed (n = 6). Because the distribution of latencieswith censorship follows an exponential function, we then are able to calculate the associated time con-stant and thus the estimated rate for first followers in groups of 32 (estimated rate without censoring:0.19, with censoring: 0.08; time constant of the associated exponential without censoring: 5.22 s, withcensoring: 11.56 s; S4 Fig). We use this corrected rate in figures and parameter estimation. This processof parameter estimation gives the following values: α = 90.1, β = 2.5 and γ = 3. In the case of thestopping phase, we need to estimate parameters only for equation (2). We fit the equation (2) on theexperimental stop rates, giving α′ = 0.23, β′ = 0.53 and γ′ = 0.41. The range of values obtained for

17
β, γ, β′, and γ′ are larger than zero, which is in accordance with the hypotheses considering a promotingrole of nM (nST) and a inhibiting role of nSS (nM) for the transition from SS to M and from M to ST,respectively.
S5 Text
Details on the calculation of pblackicted nM(t). Given µ(t) and σ(t), it is straightforward toobtain nM(t). Let us initially focus on nM(t) during the departure phase. Let t1, the departure time ofthe initiator and t2, t3 ... tnM=N the departure times of the first, second ... N-1th followers. Assume thatat time t1 = 0, the initiator departs from the group. The time t2 - t1 we have to wait to observe thedeparture of the first follower is exponentially distributed and characterized by an average time:
1
µ(n = 1, N)=
1
(N − 1)1−γα.1β. (6)
Now we want to know at which time we will observe a second follower (to reach nM = 3). We knowthat t3 - t2 is exponentially distributed and that the average t3 - t2 is given by:
1
µ(n = 2, N)=
1
(N − 2)1−γα.2β. (7)
More generally, the average time between the n follow event and the n-1 follow event is given by:
tn+1 − tn =1
µ(n,N)=
1
(N − n)1−γα.nβ(8)
This means that the average time at which the nM event occurs can be expressed as:
tnM =
nM−1∑n=1
tn+1 − tn =
nM−1∑n=1
1
µ(n,N)=
nM−1∑n=1
1
(N − n)1−γα.nβ(9)
This allows us to build a list where we have:
nM Time
1 t12 t2... ...... ...N tN
The list provides all the information we are interested in. However, notice that we have not derivedan analytical expression for nM(t), but an expression of the form:
t =
nM−1∑n=1
1
µ(n,N)= f(nM) (10)
An explicit expression for nM(t) requires finding the inverse of f, which we denote f -1, in order toobtain f -1(t) = nM.
The derivation of the curve nM(t) in the stopping phase goes along similar lines. First, we assumethat t1 = τ , with τ being the time requiblack by the initiator to arrive at the target position. The timedifference t2 - t1 refers to the time elapsed between the stop of the initiator and the first stop of a naiveindividual. As before, this time difference is exponentially distributed, and its average is given by:

18
1
σ(n = 1, N)=
1
(N − 1)1−γ′α′.1β′ (11)
For the time difference t3 - t2 between the first and second stop (of naive individuals), the average isgiven by:
1
σ(n = 2, N)=
1
(N − 2)1−γ′α′.2β′ (12)
The generalization reads simply as:
tn−1 − tn =1
σ(n,N)=
1
(N − n)1−γ′α′.nβ′ (13)
As before, we can obtain the time from the previous expression. Before doing so, and since we areinterested in the temporal evolution of the number of individuals in state M, i.e. nM, we introduce achange of variable. The first individual that stops is the initiator, at which point nM = N - 1. With thefirst naive individual to stop, nM = N - 2. In short, we can either refer to the first naive individual tostop, the second, etc., as to nM = N - 2, nM = N - 3, etc. The time difference can be relabelled as tN-2 -tN-1 for the first stop of a naive individual, tN-3 - tN-2 for the second stop of a naive individual, etc., anddefine tN-1 = τ . We use this fact for nM < N - 1 to express :
tnM − τ =
N−2∑k=nM
tk − tk+1 =
N−2∑k=nM
1
σ(k,N)=
N−2∑k=nM
1
(k + 1)1−γ′α′(N − (k + 1))β′ (14)
From this it is obvious that:
tnM = τ +
N−2∑k=nM
1
(k + 1)1−γ′α′(N − (k + 1))β′ (15)
As before, we can make use of this expression to build a table:
nM Time
N − 1 tN−1N − 2 tN−2
... ...
... ...0 t0
Notice that knowing the average duration of the departing phase given by:
tN =
N−1∑n=1
1
(N − n)1−γ′α′.nβ′ (16)
the duration of the collective motion phase is simply τ − tN .
S6 Text
Details on the calculation of the commitment (equation (3)). The commitment is defined as theprobability of observing a naive abiding by the departure of the initiator. Here, we assume a generalcase where we have an arbitrary number of initiators i. This means that we have N - i naive individuals.

19
The probability per time unit per naive individual to switch from SS to M is given by µ. Since N - iindividuals can potentially decide to follow the initiator(s), the probability per time unit (e.g., seconds)to observe the first naive to depart is given by:
µ = (N − i)µ = α.iβ(N − i)1−γ (17)
From this expression we can obtain the probability that no naive will depart during time t and that ithappens between t and t + dt. This probability takes the form: e−µtµ.dt. For a given τ (time requiblackto arrive to the target), the probability that a following event occurs for t > τ is simply:∫ ∞
τ
e−µtµ.dt = e−µτ (18)
The commitment, denoted as C, is the probability that a naive departed during τ , and thus it isexpressed by:
C(τ) = 1− e−µτ (19)
Now, for simplicity, we assume that the distribution of time τ , denoted by p(τ) is an uniform distri-bution between the experimentally observed τmin and τmax (i.e., p(τ) = 1
τmax−τmin) and compute the
average C(τ):
C =
∫ τmax
τmin
C(τ)p(τ).dτ = 1− 1
(τmax − τmin)µ(e−µτmin − e−µτmax) (20)
This is the expression we use to calculate the expected commitment that we compare with the exper-imental observation. Exploring the model allows to check the effect of adding initiators on the value ofcommitment as a function of group size (S5 FigA). Also, for a given group size (here N = 100), we seethat the commitment value increases non-linearly with the number of initiators (S5 FigB). Finally, wewere able to compute the number of initiators i needed to recruit all group members (S5 FigC).
S1 Fig
Experimental setup. The setup is composed of two arenas (50 m side) delimited in native irrigatedpasture and surrounded by a 1.2 m visual barrier (propylene net). Observations were made possiblethanks to an observation tower located nearby. Yellow panels placed in the middle of each side can belevelled up and used as targets for the trained sheep thanks to a remote control. Digital snapshots weretaken at one-second interval with a camera fixed at the top of the tower.
S2 Fig
Statistics of the departing phase. (A) Latency to depart of the first followers as a function of thegroup size. (B) Duration of the departing phase i.e. time elapsed between the departure of the first andthe last followers. The bottom and top of boxes show the first and third quartile of data. The thick linesshow the median and the whiskers represent the minimum and maximum values of the distribution.
S3 Fig
Statistics of the stopping phase. (A) Latency to stop of the first stoppers as a function of the groupsize. (B) Duration of the stopping phase i.e. time elapsed between the first and the last stopping events.

20
S4 Fig
Survival curves of the latencies of the first followers in groups of 32 without and withcensoblack data (adding the times spent walking by initiators to reach the target in trialswhen they fail to be followed) Dashed curves show the experimental data without (black curve) andwith (black curve) the censoblack data. Respectively plain black (e−0.19t ; time constant = 5.26 s) andblack lines (e−0.08t ; time constant = 12.56 s) show the exponential curves fitted to the correspondingexperimental data. black crosses : the times spent walking by initiators to reach the target in trials whenthey fail to be followed. Dotted lines : ± 95% confidence interval.
S5 Fig
Model pblackictions. Probability C of triggering collective motion (commitment) as a function ofgroup size for various numbers i of initiators (A), and as a function of i for a fixed group size (B). (C)The minimum number of initiators requiblack to always observe a follow (commitment = 1) as a functionof group size (black line). The grey area indicates the combination of initiators and group size where thecommitment is less than 1 (risk zone: none follows the initiator).