iti · iti ~--s ~c/) il cl i~u. * .0 •department of metallurgy ... framing camera and streak...
TRANSCRIPT
ItI~--S
~C/)
iL CL
i~U.
* .0 •DEPARTMENT OF METALLURGY
Institute of Metal and Explosives Research
! " * UNIVERSITY OF UTAH
SALT LAKE CITY, IJTAII

NOTICE: When goverment or other drawings, speci-fications or other data are used for any purposeother than in connection with a definitely relatedgowerment procurement operation, the U. S.Government thereby incurs no responsibility, nor anyobligation whatsoever; and the fact that the Govern-ment may have formilated, furnished, or in any waysupplied the said drawings. specifications, or otherdata is not to be regarded by implication or other-vise as in any manner licensing the holder or anyother person or corporation, or conveying any rightsvr-fftission to manufacture, use or sell anypatented invention that may in any way be relatedS~thereto.
-- I
IONIZATION WAVES FROM FREE SURFACES OF
DETONATING EXPLOSIVES
A. Bauer, M.A. Cook and L.A. Rogers,2 September 7, 1961.
AFOSR - 1335"Contract Number AF-18(603) -100
File Number 11-17-W
Project Director: M.A. Cook
"qualified requestors may obtain copies of this report from ASTIA Document
Service Center, Arlington Hall Station, Arlington 12, Virginia. Departmentof Depense contractors must be establishe4 for ASTIA services, or have their'-need-to-know' certified by the cognizant dilitary agency of their projector contract----'-
Physics Division, Air Force Office of Scientific Research, ARDC, Washington 25D.C.
I.I ASTIA
STIPDFR 0
*1
WSS/CI Paper 61-20September 196 1
IONIZATION WAVES FROM FREE SURFACES OF DETONATING EXPLOSIVES
Alan Bauer, Melvin A. Cook, and Leo A. Rogers
Institute of Metals and Explosives Research, University of Utah, Salt Lake City, Utah
Western States Section, The Combustion Institute, 1961 Fall Meeting
TONIZATION WAVES FROM FREE SURFACES OF DETONATING £XP,.JSIVLS
A. Bauer, M. A. Cook, and L. A. Rogers
f ABSTRACT
Tonization waves ejected from the free surface of /condensed high
explosives in various gaseous media at ambient (about 645 mm) and 0.5 mm Hg
pressures are described. Framing camera and streak camera photographs
correlated with electrical conduction measurements showed that a highly
ionized, either highly luminous or completely transparent, precursor wave
led both the shock wave and the main products of detonation propagated from
the free surface. At 0.5 mm Hg this wave was transparent and non-l'minous,
but it always produced a burst of luminosity upon collision with the end
plate of the vacuum chamber several microseconds before the opaque detonation
products impacted the end plate. Measured ionization wave pressures were
compnried with.1 coputed-ones for shock waves moving at the same velocity in
the same gas. The measured pressures were in general several times greater
then the pressures computed by shock wave theory for the observed velocity
and initial pressure and up to 20 times greater than for the shock computed
by t~- impedance mismatch equation. The wavc-s from the explosive free
surface appear to be highly ionized material radiated from the free surface
of the explosive as a precursor way,. similar. for examplc. to tbh (electron)
precursor waves observed by Weyman and by Gloersen in shock tubes.
f}
1!~I!I
I

-2-
Introduction
When a condensed high explosive is detonated an vi.. wav'e is
ejected from its free surface Into the surrounding gaseous medium.(1-5) rhis
ionization wave may be luminous, transparent, or dark and opaque depending
upon the gas medium and the pressure. While this school has maintained
that this ionization wave is a dilute plasma moving in front of the shock
wave, dthers (6,7) have regarded it simply as the shock wave itself in6htch ionization occurs in a normal and predictable manner by thermal
(4,5) Ijionization. This article presents additioinal evidence that this
ionized wave is actually separated from tOe slower moving nhock wave and
contains free electrons at concentrations frequently quite different
II than in normal thermal ionization in =hrick waves. Data obtained from
"streak camera and color framing camEra sequences correlated with electrical
conduction measurements for shots in various gaseous media at ambient
(about 645 mm) and at 0.5 mm Hg pre,;sure are used to distinguish these waves
as well as measured pressures compared with hydrodynamically computed pressures
for shocks in the medium in question traveling at the same velocities as the
Obse'red ionization waves. Comparison of the observed velocities W4ith
velocities computed for shock waves transmitted from free surfaces are also
Sdesciribed in support of the precursor ionization wave concept.
FxerImental Methods
SI '0For correlation studies a streak camez and framing camera were in
some cases operated synchronously tn order to obtain both recordings of the
$ &ame event. Such simultaneous streak and framing photographs provide
ialuable, if not indispensable information f.ir Interpretation of detonation
phenomena at free surfaces.
"Jressure measurements were made by the "aquarium" technique by
Impacting the wave in question into a transparent medium and observing the
S initial shock wave velocity in the transparent medium. Pressures were
obtained from pressure vs veloctt.y calibration curves from which the pressure
1[
I:
I*

T7Ii
S. . °
in the transparent meditum was then related to t)'at in the wAev 1c) theSf ll"mpedance mismatch" equat ion(0
• •~i~i + W
i w w
wP pressure of shock wave in water (or
-Plexiglas), i V density of the gaseous media. " - velocity of wave,
pw density of water, and V - velocity of shock wave in water at impactw V
surface. 7Te values of Vi and V w;re obtained with the streak camera.
For study of various gaseous media at 645 mm Hg pressure glass aquaria
6" X 6" X 12" were used. The explosive was mounted inside the aquarium,
II overed and thoroughly flushed with the desired cas befire and during the
shot. For pressure measurements water was poured into the aquarium to a
depth of several inches and th& wave impacted into it after traveling
through the gas in question.
SWhen bare explosives wore fired n-ear the witer surface it was
impc:. 'ble to separate the ioni?ation wave from the normal detonation
ihoc1% wave owing to insufficipnt resolution. To overcome this the
asse•iThy shown. in Fig. 1. was used. The inniatirn wave ejected from
ihe ,i.-Posive and moving ahead of the normal shock wave was compressed
as it was "ex.truded" up the narrowing flask and Into the relatively
$mail diameter tubing. (5) The compressed inIznation wave was then
impacted into the water (or plexiglas) for pressure, measurements before
1he much more intense blast wave from the main charge impacted a short
i•ime later to transmit. an over-p-oworing shock into the gage medium. Fig. 2sphows framing camera sequencPs of an loni•.ari.on wave being extruded into
the tube and the shock generated in thF water by the extruded ionization%Wave.
For the studies at 0.5 mm Hl prpes.,re th, method shown in Fig. 3
Was used. The system was thorouglhly flushed with the desired gas, sealed
'and evacuated to 0.5 mm Rg as mc•air'-d with a Stokes Mcteod gage. The
gases used in these studie• we.re commercial products.
S- .
\I
-4-
60.
paa
96 V-45 *p
4 ou4
*6.44 t5 0
41 u4P4 fa
PT
4i4
611
wnve being coinpressed b .shc ,oa to n ae
2. Ionzto ae xrddit ls ueadipce noaqa mwtr
-6-
'I. fIflAll
iW7
(b)
I PROBES
CAP
Ii CO-AXIAL
IRICABLE
OSCILLOSCOPE- TRIGGER
LEADS
ETEKTRONIE (c1OSCILLOSCOPE
EXPLOSI.
- i~sembly used for electrical conductivitY measurements.
i -7-
Electrical conductivit -re made wih the method seen in
'rig. 3c the constant voltage E (Fig. 3c) was divided býtween the known
internal resistance (R ) and the unknown resistance (Rp) nfferzd by the
ionization wave as it passed into the region between the probes. By
measuring the voltage drop across Ri the value of R was found. Thei P
conductivity of the ionization wave was determined by applying a calibration
Sprobe factor. ( w K/R , where a a conductivity, K - probe factot). The
probe factor K was determined by inserting into the plastic tube a \small
length of pipe of the same inside diameter as the plastic tube and wich
a wire at its axis. With this known concentric geometry the conductivity
Swas calculated frnm trhe Pau.tin
SK __I_____
[fclne.-bl Vts~Lln2b~a - a]d (2)
"where b - inside radius of cylinder, a radius of inside wire. 1 m length
II cylinder. Table IV lists the expe!rimental data and probe factor.
Shock waves transmitted from-the high explosive through thin inert
Ii plates were observed by the streak camera by means of back lighting with
a pa-allel light source.
11 Ep•'imental Results
•- • Luminosity
Qualitative luminosity results are given in Table I and a few frames
from several typical framing camera sequences are shown in Fig. 4. Ionization
qave velocity data are given in Table I1. F'; e that the velocity of the
ionization waves decreased with increasing gas density. An important factor
other than the density of medium influending velocity of the ionization
SWaves is the ionization intensity which is determined by the chemicalSnature, density, diameter and length of the explosive as illustrated in
Fig. 5. Because of the many variables involved, no extensive analyses of
1ionization wave attenuation and life-time were made in this study, these
,factors having been discussed previously. '
L,!
I! II . :' ."

S-8-
I ̀Table I: Qualitative comparisons of visible light intens':Zy Zt ionization
wav•jiropagated through various gases at ambient pressures. 1
!Explosive Gaseous atmosphere Ionization Visible luminosity• potential
(e.v.
S•D-13* Argon 15.7 Extremely brilliant
i D-13 Air -- Bright
Nitrogen 15.5 Bright
SOxygen 12.5 Bright
Carbon monoxide 14.1 Bright
II Carbon dioxide 14.5 Bright
D-13 Ammonia 11.2 Moderately bright
Chlorine 13.2 Moderately bright
Propane -- Nonluminous-dark cloudforms
,D-13 Helium 24.5 No detectable luminositytransparent cloud only
BadHydrogen 15.6 Same as in He
Composition B and tetryl Helium 24.5 Weak momentary light atSi charge surface. No12 f\ luminosity at longdistances from charge
Composition B Air Vacuum -- Very low to no luminosityA depending on actual
J I]pressure
* D-13 * 63/24/13 HNO /nitrobenzene/water3
11:
, u
Ie
-9-iiii:/:
Table II: Ionization wave velocities in various ga-'es at ambient pressure
Explosive Gas Ve.locity'(mlsec))}f I-nita11i.n Wailes
11Comp. B* Air, q.32)1
Argon 8570H1 1: elium 8('70
Hydrogen 1.0400
Air at 0.5 mm ug I4000
D-13** Propane 5400
Carbon dioxide 5450
Acetylene 6100
4 Argon 6600
Nitrogen 6 00
Carbon monoxide 7200Helium 7400
Hydrogen 8150li•"••Comp P*' Propane 6650)
,• Heli ure 81.50
S~i
* Velocity 2 cm away from charge. as mea•,sred witk. st~re.ak camera
1.1**Approximate velocity determine~d from framing camera sequence
averaged over 8 to 12 frames wl-ille ionitation wavf. traveled to about
SII. '15 cm from charge surface,
S" ~I
-10-
11:
ii -a.* wave from D413 into oxygen
b.wave frmD-13inohdge
c. waefo -3into hedroge
I ANA
di . wave from Comp.3 into helium,
Vigo 4. 6ee dfaigcmr htgah fioiainwvseetdfo xlsvfree~~ surace inovrosgsosmda rm nmesson 13 scfa

eohigh voltage discharge (approx. 20 KLV.) across wave from D-13 into helium
f. bursi.. of luminosity generated when transparent wave from D-13 traveling in helium
irnpaut~td end of chamber.
g. twave from D-13 traveling first in heliumn and then in air. Thin polyethyleneiseparates gasfffs"I
Figo. 4. Selected framing camera photographs of ionization waves ejected from explosivefree surfaces into various gaseous media, Frame numbers shown. (1.39 p.sec/vframe)

'4
4 08
00 1'4 04"
00 k
F4.
* .P4
11 "4 0 "4 "4 4
AXIfr "4 a 4,

-13-
- Ionization and Sh.,ock Wave PrEssjref
TbeResults of measurement of the iortization wave press'ýi,^ý 'w' Siven inTbeill along wi~th ccrrespor'ding values calculatad froma s'oick wave ttsory.
Pligs. 6 and 7 show graphically the results of prers.,Te. it'd ve~locity
measurements as a function of gas density.
4 condAuctivity,
Estimates were also~ made of th'e rate of decay if cord,_ction of th.Ne.
ionization waves as threy propagated- away fro-m t-, fre'- s-urface. of tt-c
charge in various gaseous media. Figs. 8 an~d q q,ioiu pltst of ttp. conduction
as a function of time using bare parallel probes. In these: tests th'e ends
rof the probes were cast into 1-1/2 "X 1-1!2" pentolit~e chat-ges wit~h about20 cm of gaseous medium above the charge. Pte pribesý we'te placed .5m apart.
Tfiis afforded a uniform conductivity inside. the pe'~,l~its as a reference to
the (integrated) conduction in the freely expanding ioniz~ation. wave. The
"base line" as seen in Fig. 8 was obtained by inssulating Oth': probes down
to the surface of the explosive, the surface being coated withb grease. Thus,
the 7,s line defined the internal ex.plosive. conductior zone so ta.conduction
abový7 this line was related to the intensity of the isýnizatior wave:, and the
It, density and composition of the gaseous, m,.diumi.
In order to obtain maximum conduction. as a function, of distance from
PO~ tl~i ac&ge ratthik than integrated values, point probes (0.5 cm gap) were
mounted perpendicular to the charge a:.Fe at -tra1"-i dliFs:nces f-orn the
itcharge.. This method also employezd 1-112" X tor4/2" PenoIlite c'harges
and free expansion of the. fonri~ation. waves. VTh. c-'rvps allr.Xet~rapolat~ed
h ~to a common point at: the charge sur~face. Cir~d-,.:ct.itor,. dat~a for compressed
ionization waves as measured by ti'e mcthod ix. Fig. :3a arc- given, in. TVable IV.
iThe 1/16" D probes in this case ci.-t-ndLng instdo <rý'nr 9 Mm ?!.D. plast~ic tubeIwere about 5 am~ apart. The shapps of the o-sci~llscop-4. t~rac,ýý shown in
Fig. 10 are characteristics of the gases used (allowing fox statistical~ fluctuations).

iV
-14-
Table III:
Experimental and computed pressures (assumed shock) in various gases (Composition B
Gasý! Li N VI NP P, PS Pi/Pc]h Air 0.001 3 17.0 ± 0.1 51.3 Below experimental limit
2P4 m Hg) 0.075 3 16.8 ± 0.2 50.6 1.4 +±0.2 0.70 +±0.10 0.21 3.34
] 3. He 0.150 3 16.6 +0.15 50.0 1.2 +_0.2 0.60 +0.10 0.41 1.46
4. NH3 0.650 3 12.0 + 0.2 36.2 5.4 + 0.4 2.71 + 0.20 0.94 2.89
H5. C 2H 2 0 0. 9elO--1 11.0 33.2 10.7 5.37 1.19 4.51
6. Air 1.09 6 11.0 ± 0.1 33.2 7.9 + .M2 3.98 ± 0.09 1.32 3.02
7. 02 1.21 2 11.45 + 0.15 34.5 7.3 3.68 1.59 2.32
8. A 1.50 3 9.4 + 0.03 28.3 4.1 + 0.2 2.06 + 0.10 1.32 1.56
29. C 1.66 2 10.3 + 0.05 31.0 11.3 + 0.6 5.69 + 0.30 1.76 3.23
0.C1.70 ,3 10.2 + 0.2 30.8 12.9 + 0.5 6.50 + 0.25 1.77 3.67S1.`ý CI, 2.70 3 9.3 ± 0.1 28.0 12.5 ± 0.3 6.28 + 0.23 2.33 2.70
p resstureninywateras dbhcrv
V m velocity of ionization wave extruded into plastic tube (km/sec)1. wpi pressure in water as determined by measure" shock velocity and calibration curve (kb)
P 'pressure in incident wave as determined by the impcdance mismatch equation (kb)
p computed pressure of shock wave moving at the observed velocity V of the ionization
wave in same gaseous medium (p+ pl p V1 UI
pUi Particle velocity in shock wave of velocity Vl and pressure pt (km/sec)
NA number of shots
fl1
iii
' I.
-15
Tabl e IV.
A. Conduction in compressed ionization waves
Gas Ambient Pressure 0.5 m Hg Pressure
R (ohm) a (ohm cm) L (cm) R a Lic C
Argon .6 0.5 ........
Air i 0.6 0.5 16.5 1.2 0.25 30
Oxygen 0.6 0.5 ........
Chloxkne 1.0 0.3 ........
Ammonia 1.9 0.16 ........
Hydrogen 2.3 0.13 25 1.5 0.26 30
HelI Um 2.5 0.12 .. . .
Acetylene 10.0 0.03 ........
Prop AIe 52.5 0.006 12 1.7 0.18 30
IIL. length of ionization wave
B. Absolute conductivity data for compressed ionization waves
from equation 2 where b 0.416 cm, a - 0.159 cm
Iengthe..(cm) a (ohm cm) j -measured probe factor2.54 0.28 1. 0.23
3.81 0.39 2. 0.31
5.08 0.40 3. 0.38
. .
1:.
,i! 4
/4
-16-'10
, 1.0
numbers correspond to thosein table III
Ii 0.1 i i i I r ia I i i I t 1il
0.1 0.15 1.0 1.5 0
GAS DENSITY (gm/l)
'Fig. 6 Measured vs computed ionization wave (or shock) pressures as afunction of density of gaseous medium.
w
!2
9 4~* 15[KO0
10 6-r
numbers correspond to5 gases listed in table III
S0Si I
1.0 2.0 30
DENSITY OF GAS (gm/1)
FPig. 7 Grapical correlation of data in Table I.
" *1 ii!' •I
-1~7-
-- - -- aiu-aeu ei
robes cast in explosiy
'fg8Pot foclocp taeso conductioninarosgessa
fromtheexplosive.R*9fE-4 otprle rbs~1c
33 9Iba lin
I sec
Fig 80lt foclocp rcso cnuto nvrosgssafucto oftm0o itne fpoaaino oiainwv
.0i2
2 3 456 7 8 910I
DISTANCE FROM PENIOLITE SURFACE (cm)
Fig. 9 Maximum conduction of frceIly e~xpanding ionization v'aves as a functionj
of distance from frp'c- strface of 1-112" X 1-1/2" D pentolite charge.Constant R and E

-18-
i- -------------
1I' AIR 645 mm Hg. AIR 0.5 mm Hg.
HYDROGEN 645mm Hg-. HYDROGEN 0.mm Hg.
HPROPANE 645mm Hg. YDPROPANE 0.5 mm Hg.
•"- -
fPROPANE 64 5rm MgtR ,1*O n L Ri= S 2A
T ~Ea 925 VOLTSHORIZONTAL SWEEP 2 microsec/cm
t :VERTICAL GAIN= 5 VOLTS/cm
rig. 1 0. Typical conduction traces for- ionization waves. jI
I]
-19-
"'In comparing verticle gain, however, note that R was varied rnd the data
Ineeded to be normalized. When comparing the pulse duration it must be
'remembered, moreover, that the ionization traveled at a different velocity
ýfor each gas (Table III). The conduction data listed in Table IV also
!include data from a series of probe shots where two sets of probes were
'.used in the plastic tube a known distance apart, and yielded an oscilloscope
!trace with two humps in it. This permitted comparison of the ionization wave
- jlntensity and velocity with the luminosity and velocity determined by theestreak camera.
- • The observed conductivity data for air and hydrogen are compared with
1fdata computed from shock wave theory listed in Table V. The relative values
flisted permit observations and theory for air and hydrogen to be compared
"•with the uncertain probe factor eliminated. The calculations for hydrogen:were performed at this laboratory and a description is given in Appendix I.
IThe shock theory conduction data for air were taken from Gilmore( 1 1 ) and- Meyer-(12) Gilmore solved the equilibrium conditions for the many species
IL of particles in an air shock and tabulated the number of free electrons per
li air particle for a given initial pressure, conductivity in an air shock
1from the expression
n e (3
SC EnjjQ (3)
e e nnj
S, where a - conductivity, n e number density of free electrons, nj number
density of ion species J, Maxwell averaged total electron collision
cross-section of species J, C - mean speed of electrons - (8kT/vM) ed p
"di electron charge, Mi a electron mass, k - Boltzmann constant. The only
ions become the dominant electron scattering centers by introduct g a
Scoulombic effect between the ion and electron. While the cross-section ofS.-15 2neutral air atoms remain approximately constant (2.10 cm) over
Sexperimental temperature ranges the ion cross sections due to coulomb
V -
iI
iI

* 7i
-20-
Table 11: -
Experimental conductivities compared with shock theory-coinputed conductivities
A. ."Air
ProbePoao P 0645/00.5 Vi T2 20645/00.5
Near 645 0.012 8.6 13 10 29charge 0.5 0.2surface 0.5 0.006 15 17- 0.014 130
Extruded 645 0.52 11 17 10 130into 3/8" 2.0 0.8plastic tube 0.5 0.26 17 19 0.013 160
R. y 1Iydrosen
PO 0* 0645/a0.5 Vi T2 0*** 0645/00.5r -6Extruded 645 0.13 16.3 5.0 9.25.10i.nt:o 3/8" 0.6 82tube 0.5 0.20 17.0 3.3 0.11"10 82
V velocity of ionization wave (km/sec)
p m initial pressure of air (mm Hg)
T2 * - temperature-19-ili-ok wave (°K(10"
p2/Po - density ratio between shock front and initial density-1 -1"a conductivity in ohms cm
• using experimental K from Table IV b.
** from Fig. 12ji* calculated from shock theory
I ,.
I.!

interaction vary (21) from about 10 cm aý [-'W 'empvratres (3000' to values
, approaching .1.015cm2 at bigb temperatue o. With assumption- of how- • _•J Varies with T, Meyer calculated electric.al c_•d,.ctivities j-n at.', 3ir saock. !:
F s. 11 and 12 are taken from tVhs wo~k of Gilmire ard Meyer.
True Shock Velocit.
Shock wave velocitj meas-irements were made fir shocks transmitted fromiCompositfon F through stuminlum plav.s int'n air and ara.-r,. T*.e. plates were
0othin the pressure drop of th. shock wavE. in t.•. plat'e was small. The
velocities obtained were 4.& km/sec for t-.= rn:ck_ t.ransmit.ed into air and
3.85 km/sec for those transmitted lrt~o 4-g'n.
Discussion of Results
Source of Luminosity and ionizatior
(6,7)The detonation-gen.erated plasma conctpt "ýas been criticized on the
bais that the observed luminosity is 7impty t+,Ft result of thermal ionization
and recombination in a shock wave, th÷ dlff"r..ncs. f',r example, between
IIconductivitled in air and helium pre.s,)mably h:.ý.Ag caised by the greater
ididniv..tion potential of heltm, LumL'lsity. I:wev÷r, is not really the
Criterion that. determines the. eKistence o, non--eyi.t',nce of a plasma. 'En a
hydtogen atmosphere luminosity is also lack;ng ev-n t•ro•• Its ionization
11 poturrtial (1-5.6) is less than that, of the mo.ýt; br,'l..ti.nt luminosity genexrator,
argot. On.e, of course, realt.es t.•at t.h÷ s.•,cck w-v(. pressair- would be much
I higher in argon than in bydrogn. W,-.. Com ps,,tA ' on• is detonated In helium
otne does observe luminosity (Fig. 4d" ov-.- a i-,:r.: dtstan.ce from the charge
and this itself is a p1enomenon thjt, cars ladl.y 6-, t'xpL.qkned by a shock
micKansm-Also, &altholugv th(-. luminosi~tt dlsapp-c-rv in v-:ýry 9rbott periodS(m 3•sec) tbh Lonitzation continues itn .e1.i,•. W..r l.s powerful Dithekite-13was used there was no visible lumt.•o.i*y b sat it:l. s,:rong ion.izat.ion wasobserved. Clearly, one needs to dirqtsl,• •etw-.?rn t'"e. ionization wave from
the explosive and the ionizatiton ind'jc'd by , ',,ck w,,,e in a gAseous medium.
I: . i

-22'-
-Previous electrical conduc.ion work, and -.-e data ob-aired here
(fig.18,9) serve to distinguish between the tw! s1urce-s f ioni-atiors. in
Saddifion to the data reported here, unpuloltsted sps:'-roscopic stldie: of the
ionization wave , or plasma, in argon s'!owed ca-t, n as well as argon in. the
luminous wave front. Furthermore, Funk, et a.l3> .- Žw.d tr.at the luminosity
of the ionization wave may be readily modified by c*h-i films nr coatings
placed on the free surface of the charge. e.g-.. Ir lavers f alumirum,
magnesium, lead, grease, etc.
ý,,Dithekite-13 was used for some of the pres.n,. s.r:dv becaus.! its products
of detonation (since it is oxygen balanced) are trar.p .. in Fig. 4b. c,
for eiample, the presence of detonation produ-:ts ir. ."e transparent region
behind the ionization wave can be detected only by % dist'orttI.n of the
backlight grid. Close observation of the Oniza-:ir. wav;es in hydtogen and
helium reveals a diffuse, non-l-nminrous zone at t-. front of t've de*.onatIon
products that corresponds to the luminous zone,, fr e•amrle. in oxygen (Fig. 4a).
This •uzzy zone is not due to a shock wave alcne Fi-rceA .i's t:o wide to be
attributed to possible camera smear effects a-d c--vrs CnMy the fr'nrt part of the
detonarton product wave. Furthermore, with , ..sy ty;. -J dtff-ei- backlighting used
I in Fig. 4, one is not able to resolve gaseous .-. ,'ckr of r!e sm-'i. magn'itude Iinvolved. Special techniques such as Schlieren or parallel light a.re needed
r - to observe the gaseous shocks. ( The fact tla, t%. fuzzy zcr-e in, helium
is conuducting is seen in Fig. 4c where the hig, voDag-. Arc (approximately
20 K.) discharges as the zone reached týhF H-7. ,
!The low conduction (Figs. 8,9) in bydr-,c~r'!•. ga, e aý)d •vrg•and
ammonia, is explained or, the basis of electv•-.)n :: d:.- ':o bofki.g c'•
chemical bonds involving hydrogen atoms which z&ak -up 14A;: . electrons.
Cracking is strong in propane where the ionizati.tr, wa- 'rera. ..
black cloud and it Meerical conducti..-.'i ten bec.ým•, ril. On the o':b•r
handi as shown below, in many cases ionization of appteci.ablr., magnitude. is
geneiated by the shock wave, e.g., in argon. and air.
" !I' ? .1
-23-
0 IS100- 10 P I/
-'•~~- 14~lN.HE
s ingle
of~andOT 2/T1
dissociation0 I
So 00 0
,n W
10' - io101.
"! Fig. 11 Eecstricalcnduempera tur rato aciros h ok ae. Shc fotinar
3 L
i 104 1010 26
10 C
Pig. 120uctCI cnut~~i n hc ae
I.,0
0 0
4 41
Even though the ionization waves in h'ydrogen and helium were non-luminous
they always generated high luminosity upon impacti'rg a glass or plistir. e.g.,
the walls of the containers. For example, the chambpr erd may be seen in
Figs. 4,' 13 and 14 to be illminated well. ahead of t. oncoming dark detonation
product$. For instance, in Fig. 13a the illumin-tion occurred 2.9 jisec before
the massive detonation products reached the end plate, and in Fig. 13c, involving
a smaller vacuum chamber and CGvmp. P•A/N explo.iv-; . 7.1 .iw'rtc) the end of
the chamber may be seen to have been illumiratfd f.ve'+ b.fore tht detonation
-reached !the end of' the charge. For the latter case u'. -. ma,.erial causing
illumination came from off the sides of the charae; and reached the end of the
chamberPiwell ahead of the detona~ion owing to the ewtremely high velocity of
this pricusor wave. In Fig. 14 aithougy• tie chamber Lr•d plate was illuminated
well ahead of the detonation produc-s impact or the plate, the pressure in the
ionization wave produced no detectable shock wavs (observable by this particular
technique' in the plexiglas. It was several microt-_c-ods later before the cloud
of detonation products impacted the plexiQIaS arnd ge.•rated the shocks s~en in
iig. 14ý.
Shock vs Ionization Wave Prepiures
".e observed -consistently high values of p-rassures in compressed ionization
waves (Table '11) over corresponding presAures cnmpvtd for shocks traveling in
:the sae medium at the same speed is noteworthy. P; tOhemsetv::% comparisions of
observed vs computed pressures may -not be suffici n.t t) :-rule out,the possibility
of a shock mechanism. It may be argu-t•d, for ex.amp1.,... tlat the. impedance mismatch
equation may not apply with suf c Lent accuyacy " :.e other b.and, evidence
presented below shows that the actaaL shock wa,;'. -'.:ty for the true shock is
lesi than half the velocity of the ifonizatio va-. hqe.7zP the actual or trueI
shock'wave, pressure is only about on•.'foI'rt-r ':i gr•a. as ý..e value computed by
assuming the shock wave velocity to be the same as tC-. ionization wave. On
this issis the measured ionization wave p ressures 1. 0 to 20 times greater
than the pressures-tn _"-_•-_ue shock wave.s transmtt:tt.d from the explosive into
the gasOou, medium.
FI

-25-
I S
* b
* 3* u
7. u.�Ig UI .
1V K) �
-FI u b U 6'
'S ''-I - -.
I
I ,
.4.,,
* 4.
II i 7*.
0
AK'511
1 � � r
I ��hg
I
Fit. 13. Framing camera sequence and set up for vacuum shots.
*1��
-26-
MIRROR
15 _ _ _ _ _ __ _ _ _ _ _ _ __ _ _ _ _ _ _
PLEXISLAS ENDr PLATE
'%VACUUMCHAMBER
EXPLOSIVE
0 10 20 30 40---K OSE
TIME sj ee)
Firi.. 1,4a. Streak camera record obtained simultaneously with the framing camera sequencein Fig.j3&t.
Fig~ 14b Framing ciimern s'uu or (13/27) C'nmp. B/AN detonating. in plasticchamber of0.5 mmn lg Ai .hter f'ramo time 2.08 pae, D *7.400 km/sec.
Vqe conductivity data ray alisc b.-' crilticiz?:-d o.'i sevsral points, for example,
- t may be argued that surface ccondaLctivity effec!.- besween the probe (1 caused
inaccurate measurements, hencs an inazcurate ptnbtý faCtOT. On t- OFhp~r hand,
tit Fhould be noted from t;, rer--41ts cf 7ab'> VJ t'ýa .h c.rduction was almostindependent of the compasition of ga~-os mdt iewsx. egho the
conducting zone was in~deppr'dent nf tn'-s Sase-ous medtwni. Thil would be expected2.onily if the conduction w!re. dtz r~o iori-f.rd gareo-,:s products frf-m thte iýýplosive.
-The shape of the conduIction c*;rves 14 al;c. sigrdfic~rt in that thnere was a
gradual rise of conductior. as thpe iinizatior. wave resc*7,-d t~he probes,, wrn-ereas
the conduction for pure sbock .(Fig. 15) ita- S WIreý stidder. rise. The fact that
conduction over the probes 1(in fyeo:r- io. with no wall effects) increased
gradually indicates that there is ar, increasing dsrneity of elecron.s le~ading
up to the shock front.
It inounxetdta.alcrn r -laslwmsion,, would be
radate ahadVf-a'ýRiýckowingtoi, "i*- býcmagrdýn. Teth
tenpikrstura of the shock (e.g.1>lO,000OK) col.ýp~.ed with, tkh.e low ambient
temp(erature ahpead of the sliock pre~serts a ~e~~sdtiv'ing force quite asIII ~effective as an electr~ical pit.?ntial er~df!4at f.,v seI~:r~ t. lw masselectrons from higher mass ions."' Tnus, it. I,-- r~o. re~ally suýL'pri Stng th~at
41P.ctrons and the lighter ions arE able lff~ ~~~ and move aheadIInbf the shock front. Most of t'ýhe ionIzed mar.,ýxfai Icý 1h"b ionization. wave,j j~definately originates (from cOetlot izattor.) explosi~ve. surf ics and is
iejected into t~he &aqeo-.5 me-dLv:.r wYnthe. .'' eli ractinr. z;one onw~orges
'from the explos~ive free slirface.. AA th.h- srfacaý J.ay-ý. of explosive L'.I Iencourtersd by tbe detornat~ln7 -reý.cv- sclm- of ex~plo.-Avp Is projected:forward Vr~iI.e it Is stl uind.:rgofrg ri'icJo.n sn~d it t}'ca projectc-d Into the
gaseous medium before decay. promntad *hy 'h!gý dI-nsltyv, 'has time to take
fl ~~The precursor ionizat1,o.n w~',e ph#.in, '~ e~ obteerved by Weyyman (5(16)
iand by Gloersen and oth'ers (2 n s1-ock t* q t'dip.s. P're6 electrons
ii radfated ahead of the %bh:c~k wivo were. d~t-ttc-d by Wiyma~n at more than a meter
*1
I,j -
-28-
[ y
ErIOU PRBE
VX4! " PROBESCOMPOSITION
'L74cm GAP
4{ 1/8" STEEL PLATE
I
jig. 15. Asembly and resulting conductionl mensurement of shock in air driven by
"steel plate.
r 11..• '

-29-
in front of the shock wave and the General Telephone and Electronics Laboratories(22)t 11 13 crn/c•i•u vra:(22) determined electron density of 10 to 10 electrons/cc 1 ......p over a
distance of approximately 15 cm in front of the shock wave in a shock tube.
Velocitv of Shock Generated by High Explosives in Gaseous Media
The more general assumption is that the brilliantly luminous ion zation
waves from high explosives are simply intense air shock waves in which
ionization arises by thermal means. It has generally been overlooked that the
observed velocities would imply a breakdown of the hydrodynamic theory of
transmission of shock waves. That is, if the ionization waves were truly
shock waves one might well wonder by what mechanism they acquire such high
velocities and pressures, i.e. why the waves radiated from free surfaces of
high explosives have velocities about twice as great as waves of the same or
higher intensity transmitted from inert, e.g., metal, surfaces into air. For
example, the velocity of the observed luminous wave transmitted from Composition
B directly into air at atmospheric pressure was 8.3 km/sec, but when an aluminum
plate thin enough so that there was no appreciable attenuation of the wave, as
determined by actual pressure measurements by the aquarium method 8 ,9) was
placed on the end of the charge the shock wave was observed at only 4.4 km/sec.
For '&gon corresponding velocities were 8.57 and 3.85 km/sec. respectively.
SCareful exaMi oMtioi0of the application of the impedance mismatch equation
(1) *bas been made for shock wave transmitted from Composition B into five solids
and five liquids of widely different densities. For the liquids Fig. 16 presents
the measured velocity-pressure curves obtained 6' the aquarium method. Table VI
presents the observed initial shock velocities and pressures computed from the
impedance mismatch equation. The consistency is excellent and the results are
6lose arentwith those of the Los Alamos group(120
impedance mismatch equation applies very well to liquids and solids.
II As another check on consistency U /Vi values were compared with
(v b)/vi results computed from the Tait equation of state and the theoretical
equation of state derived by Cook.' 1 9 ' Table VI presents parameters used in
these computations. Note the excellent agreement between the observed U /VL/ii
AI
-30-
[200
Ti 150
I
CARBON TETRACHLORIDE
100 CARBON DISULFID
l r.X • • • . GLY C ER IN E4 ~ M'
'i! +•WATER
+0 1000 2000 3000 4000 5000 '', 6000
S~SHOCK VELOCITY (m/sec)
SFig. 16 Experimental v~elocity via pressure curves for shocks in various
S~liquids.! :

I-,4311>0n C'J 4r C7, n.
IIiIri
10 41%(J
o in 00'
.0~ ~ C
0.In1
In co n Ln "
0~L kntCI m -N 0 . 43
".4W co 0' c'3 u . ~
.00 9P
wn 00 Ln 00 0 P4 I0
%'- tn In "4 0In co r- N - 'ý~
-4,J4 r-. InwW 0 1 -NI~ '0 "' ~ 4. 941 4
a, '' Lm Lm C"m 0m r4 1 n 3. A !0N 0%*'. 0 N ~40 t~ 0.Id+
00 0: 4 ). In
"4 03 44.
0-4 ai P41LM4i O 4 "
1- %0 c C)% 00 n 4
0W'
4.1,
1 -32-
and computed (v 1 -v)/v, results. (Note that from hydrodynamic theoryU/V_ (v-v)/v .) Considering such wide differences in sh-kc inm'6edance as,
for example, between Composition B into methanol as compared with Composition B
j into mercury, magnesium, and copper, the impedance mismatch equation thus seems
to have quite general applicability. Even more significant is the fact that it
applies quite accurately in predicting the shock velocity (or pressure) of a
shock transmitted-knt-e--air and argon through a thin metal, e.g., an aluminum
T plate,as shown in Table VI. These considerations therefore provide strong
evidence that the ionization waves from free surfaces of high explosives are
not true shock waves because their velocity characteristics are quite different
•- from those computed from the well-established shock wave theory and the
P r1P•edance mismatch equation.
Conclusions
- i"1. Luminosity is observed when detonation plasmas propagate through
many gaseous media, but luminosity is not the determining criteria of plasma
existence. The luminosity is caused by interaction of electrons in the plasma
with ,iolecules of the gaseous medium (largely via negative ion formation). If
negative ions are not obtained, i.e., if there is no electron affinity, as in
heliuii, no medium (vacuum), or if there is rapid ionization decay due to free
radicals, there may be no visible, or only a transient luminosity associated
with the plasma even though it initially may be rich in free electrons.
S2. The measured pressures of (compress.4) plasma are consistently upt6 five times higher than corresponding shock pressure ef the same velocity.
3. Absolute conductivity measurements in air show1 insufficient11•differences relative to those computed for the shock wavI theory, and are
not conclusive in themselves. However, the situation is quite different forhydrogen, helium, and other gases where shock wave theory can in no way
account for the high observed conductivities. The shapes of the conduction
traces are quite different than for shock waves, but agree more with the
! i

-33-
1 concept of detonation-generated plasmas associated with, but gfev•ng ahead of
the shock wave.1 4. The precursor ionization wave or plasma is gererated primarily from
chemionization in the detonation reaction zone and is ejected into and trapped
in the low density state of the shock upon reaching the free surface of the
explosive. The ionized surface material is then propagated ahead of the
normal. shock where it interacts with the gaseous medium to produce high
luminosity in many cases.
5. The velocity of the ionization waves radiated from free surfaces of
high explosives are much greater than can be accounted for by classicalShydrodynamic theory of shocks and Is likewise much higher than one observes
for shocks transmitted into gaseous media from inert solid free surf ces.
LI
' i
. t I
II)I
BIBLIOGRAPHY
1. Cook, M.A., The Science of High Explosives, Reinhold Publishing Corp., N.Y.(1958).
2. Cook, M.A., McEwan, W.S., J. Appl. Phys. 29., 1612 (1958).
3. Cook, M.A., Pack, D.H., and Gey, W.A., S&eventh International Symposium onCombustion, London, September 1958.
4. Cook, M.A., Keyes, R.T., and Udy, L.L., J. Appl. Phys., 30 1881 (1959).
5. Bauer, A., Cook, M.A., and Keyes, R.T., Proc. Roy. Soc., A259, 508 (1961).
6. Davis, W.C., and Campbell, A.W., J. Appl. Phys., 31 1225, (1960).
7. Kendrew, E.L., _Av..Uhitbread, E.G., 3rd ONR Symposium on Detonation,PrincetOn University, 1960.
8. Cook, M.A., Pack, D.H., and McEwan, W.S.. Trans. Fara. Soc., 5 1028 (1960).
9. Cook, M.A., and Udy, L.L., J. Am. Rocket Soc., 31 52 (1961).
10..Walsh, J.M., and Christian, R.H., Phys. Rev. 97. 1955 (1955).
11. Gilmore, P.R., Rand Research Memorandum RM 1543, August 1955.
12. Meyer, R.X., J. Am. Rockct Soc., 29, 187 (1959).
13. Cook, M.A., Funk, A.G., Keyes, R.T., 3rd ONR Symposium on Detonation,.1 •Princeton University, 1960.
14. Dk,1, W.E., Jr., J. Appl. Phy3s., 28 782 (1957).
f 15..Weymann, A.D., Physics of Fluids, 3, 545 (1960).
16. Cloersen, P., Physics of Fluids, 3,857 (1950).
17. Lin, S.C., Resler, E.L., and Kantrowitz, A., J. Appl Phys., 26 95 (1955).
18. Deal, W.E., Jr., Second ONR Symposium on Detonation, Washington, D.C.,Pebruary 9-11, 1955.
J 19. Cook, M,A., Fara. Soc. Disc., No. 22, 203 (1956);Bulletin #74, 46, No. 16,'ýXovember 1955 (Utah Engineering Experiment Station, Univ, of Utah);
J.Appl. Phys., 30., 729 (1959).
20.-Walsh, J.M., and Rice, M.H., 3. Chem. Phys., 26, 818 (1953)
21. Bachynski, M.P., Shkarofsky, I.P., Johnston, T.W.. R.C.A. Research Laboratory,Research Report No 7-801.3 (June 1959).
22. General Telephone & Electronics Laboratories Inc. Palo 1 ito; .California.,i"Energy Transfer in Plasmas", Technical note no. 7, 15 'November 1960.
1: I
f .!
!. I
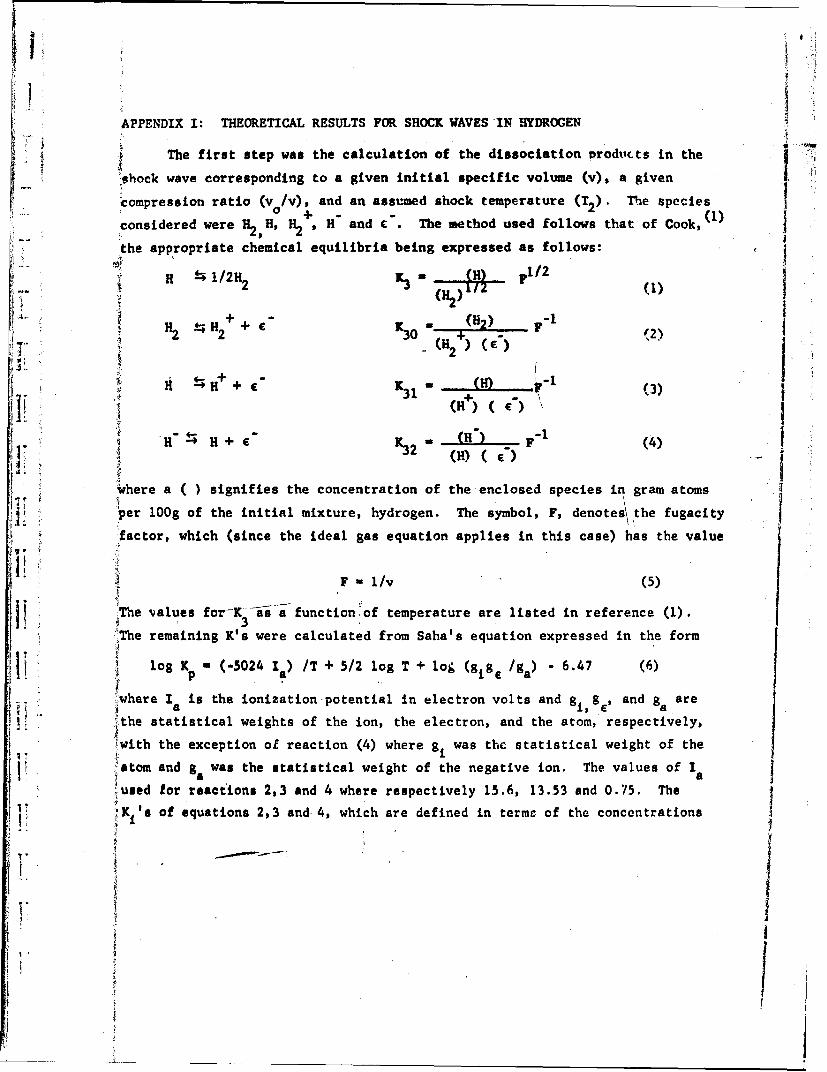
APPENDIX I: THEORETICAL RESULTS FOR SHOCK WAVES IN HYDROGEN
The first step was the calculation of the dissociation Products in the I'shock wave corresponding to a given initial specific volume (v), a given
'compression ratio (vo/v), and an assumed shock temperature (TY). The species
considered were H H, H , H and c. The method used follows that of Cook, (1)
the appropriate chemical equilibria being expressed as follows:14- 1/2 H2 K"H F1/2(
H+ -H H + .K (H2) F-2
"2 2 30 + (2)(H)()
]ii+ (H) ( ') IS+ 'H+
H, + e") (H-)(4
,where a ( ) signifies the concentration of the enclosed species in gram atoms
per lOOg of the initial mixture, hydrogen. The symbol, F, denote the fugacityfactor, which (since the ideal gas equation applies in this case) has the value
F- 1/v (5)
The values for-K -iia function of temperature are listed in reference (1).
'The remaining K's were calculated from Saha's equation expressed in the form
Ji log K w (-5024 1 ) /T + 5/2 log T + log (gLg /ga) - 6.47 (6)
!where I is the ionization-potential in electron volts and g g.1 and g area il a
"the statistical weights of the ion, the electron, and the atom, respectively,
,with the exception of reaction (4) where gi was the statistical weight of the
7atom and g was the statistical weight of the negative ion. The values of Ilused for reactions 2.3 and 4 where respectively 15.6, 13.53 and 0.75. The
1'ý iK 's of equations 2,3 and 4, which are defined in terme of the concentrations
~*I.
I' Ii/
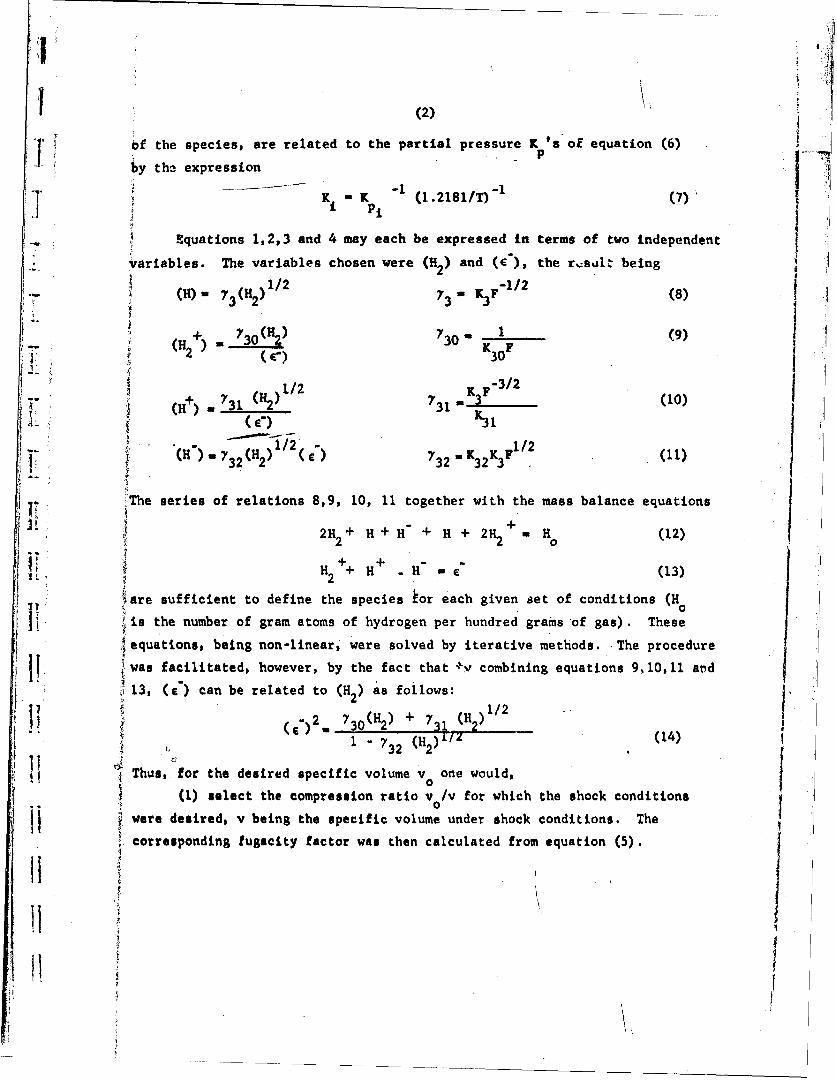
(2)
1 of the species, are related to the partial pressure K 'saof equation (6)
by the expression
K, K -K (1.2181/T-l (7)Pi
Equations 1,2,3 and 4 may each be expressed in terms of two independent
Variables. The variables chosen were (H2 ) and (C ), the r.suil. beingi; (t 'a )1/2 -/(H) 3 (H 73 K -/ (8)
- •: (H2+) 7H30.) K30 F (9)K~ FE
1/2 -3/22(H2+ 1,+ 1 " 'H+ 2 . H (12)""31 2 .. ) z31
+!+' ; 32 2)32 " K32K3Fl2
ý' The series of relations 8,9, 10, 11 together with the mass balance equations
][i•2H"2 + H + H_ + H + 2H-2 + =H (12)
0U +
H2 ++ H + " H (13)
'are sufficient to define the species kor each given set of conditions (H°
Sis the number of gram atoms of hydrogen per hundred grams of gas). These
!equations, being non-linear, were solved by iterative methods.. The procedure
,was facilitated, however, by the fact that -v combining equations 9,10, 11 ard
I !i 13, (e) can be related to (H2) as follows:
( 2 1/21()2 . 730(12) + 73, (H2))l1 7 32 (H 2 )±()
Thus, for the desired specific volume v one would,I(1) select the compression ratio v /v for which the shock conditions
11 I were desired, v being the specific volume under shock conditions. The
S. corresponding fugacity factor was then calculated from equation (5).
+ I
(3)
7 F(2) A guess was then made of the shock temperature T corresponding
• to the chosen initial specific volume and the compressimu ratio. YT (3) The equilibrium constants were calculated from equations 6 and 7
• and the 7's from equations 8,9, 10 and 11.
(4) A value for (H ) was next selected and the corresponding (e )
Scalculated from equation (14).
T (5) Through use of equations 8,9, 10 and 11 (H), (H2 ), (H) and (H-)
were calculated.
(6) These values were substituted into the mass balance equation (12),
the solution being correct when this equation was satisfied, the value of
02) being adjusted to facilitate this.
(7) The quantities n, Q and C where n is the number of moles of gas
at shock conditions, Q is the chemical heat, and 8 is the average heatiiIcapacity between the initial and the final temperat6re were calculated per
Skilogram of gas by the equations
n - 10E ni10(15)
I OE nSii"viThe thermochemical solution must be consistent with hydrodynamics. This
[ occurs when the "guessed" value of the sh•¢k temperature equals the value
Sthat 6ctually corresponds to the initial ap`ctitc volume and the compressionratio' sele-abd- The shock temperature is given by the relation
JT = T1 +1l/2(p + po)(vo-v) + " (16)
2 1 Qv
i t where T1 is the temperature of the unshocked gas, 1/ 2 (p + po) (vo-v) is thei0Hugoniot compressional energy and Q is the energy of chemical reactions in
I the shock wave. By means of the ideal gas equation of state which i'sapplicable to the high temperature, relatively low pressure conditions of
interest the shock pressure was calculated using the "guessed" value of the
I I
(4)
-f temperature, the chosen specific volume under the shocked conditions, and
j tth the number of moles of gas from the thermochemical calculations, namely
"p ntT2/v (17)
With this computed value of the pressure the shock temperature could then be
calculated from equation 16 using the r and Q determined from the thermo-
chemical calculations (step 5 above). If the resulting T was the same as
the "guessed" T2 , a self consistent solution had been obtained. Otherwise,
a new temperature was selected and the whole process was repeated until
agreement was achieved. In order to facilitate the rapid convergence of the
j, temperature it was helpful to plot the "guessed" T's vs the resulting T's
calculated from equation (16) as shown in Fig. a.
1/V
•1r 0 0of I.• zv
! ,, guessed 01'-4rý ý Caculate T2
"i Fig. a "guessed" vgcalculated Iz For hydrogen there were two solutions for some compression ratios; the
j correct solution being t~he one in which the temperature varied correctly
, with the compression ratio. The velocity of the shock wave was theniobtained from the well know equation
V v ( v - vC ) 1( 18
•,'(vo ,)
I and the particle velocity from
* p0
U5TI
I !
(5)
The above process was carried out for a sufffcieut nu,, er of different
compression ratios and the same initial specific volume that fairly accurate
plots of the results could be made. The electrical conductivities were then
calculated by the methods of Meyer.(12)
The results of the calculations are shown graphically in Fig. b and
tabulated results in Table i. In addition to the calculations for the
specific volume approximately equal to atmospheric pressure one calculation
was made for initial conditions corresponding to 10" atmospheres in order
C. I to compare with experimental data on conduction in the hydrogen at this
pressure. The comparison of experimental conduction and calculated theoretical
;: conduction is seen in Table V (in body of the report).
11..LII
lI I
I trI
11,
I.!
I'

0 0 0 00 1
0 0 0
14
-s44
0 0
00N 0p '
00
00\
TIWI a
000't fn C1P4 P- . 0 0%a L 0m N r
wo/ a vol so uo~eedo ~t
C'. %4 0% c %D %D G
&M '0 0 0 en
*w cl 2- '9 ~ 9 C
co . %0 ' coC
C"40
000C91 0
in 0
4 "V4-0
00
'0 c4 _
*94 C' %
Iu 0) v-4 "44 0'
0 0
.90 LM
m LM
P-uU~ 4 m "4 !P L
V- 4N "4 '0
~i"4
10: 0 lA ' r
~~C4
DISTRIBUTION LIST
No. of No. ofcopies copies
T Commander Armed Services Technical Info. AgencyAF Office of Scientific Research ATTN: TIPCRATiTN: *SRY Arlington Hall Station"Washington 25, D.C. 3 Arlington 12, Virginia 10
Commander Director of Research and DevelopmentAF Research Division Headquarters, USAFATTN: `RRRTL ATTN: AF1MDWashington 25, D.C. 2 Washington 25, D.C.
Commander Office of Naval ResearchWright'Air Development Division Department of the NavyATTN: i WMAD ATTN: Code 420
I Wright-,Patterson Air Force Base Washington 25, D.C.Ohio .•l4
Director, Naval Research LaboratoryCommander ATTN: Technical Information OfficerP AF Cambridge Research-Lab r~tories Washington 25, D.C.1ATTN: CRRELL. G. Hanscom Field Director, Army Research OfficeRedford, Massachusetts 1 ATTN: Scientific Information Branch
all,; Department of the ArmyCommandex Washington 25, D.C.Rome Air Development CenterATTN: RCOIL-2 Chief, Physics BranchGriffiss Air Force Base Division of ResearchRome, New York 1 U. S. Atomic Energy Commission
Washington 25, D.C.CommanderDetachment I U. S. Atomic Energy CommissionHq AF Research Division Tech;.'.cal information ExtensionThe Shell Building P. O. Box 62Brussels, Belgium 2 Oak Ridge, Tennessee
P. 0. iox AA- National Bureau of Standards LibraryWright-Patterson Air Force Base Room 203, Northwest BuildingOhio 1 Washington 25, D.C.
Aeronautical Research Laboratories Physics ProgramATTI: Technical library National Science FounddtionBuilding 450 Washington 25, D.C.Wright Patterson Air Force BaseOhio 1 Director, Office of Ordnance Research
i Box CM. Duke StationDirector, Department of Commerce Durham, North CarolinaOffice of Technical ServicesWashington 25, D.C.
-2-
ARO, Inc. Comnanding GeneralATTN: AiDC Library U.S.. Army Signal Corps ResearchArnold Air Force Station and Development LahoratoryTullahoma, Tennessee 1 ATTN: SIGFM/EL-RPO
Ft. Monmouth, New Jersey I
CommanderAF Flight Test Center National Aeronautics & SpaceATTN: FTOT1, AdministrationEdwards Air Force Base Washington 25, D.C. 6California I
Advanced Research Projects AgencyCommande4 Washington 25, D.C.AF Special Weapons CenterATTN: SWOI ChairmanKirtland Air Force Base Canadian Joint StaffNew Mexico 1 for DRB/DSIS
2450 Massachusetts Ave., N.Y.Commander Washington 25, D.C.AF Missile Development CenterATTN: HDOI CommanderHollomanlAir Force Base Air Proving GroundNew 1exi~o Attn: ACOT1• Eglin Air Force BaseCommander FloridaArmy Rocket & Guided Missile AgencyATTN: ORDXR-OTL CommanderRedstone',Arsenal Wright Air Development CenterAlabama 1 1 ATTN: WCRTM-l
I Wright-Patterson Air Force BaseCommandant OhioAir Forci tnstitute of Technology(AU) Library Director, Office of Naval ResearchMCLI-711" Bldg. 125, Area A Chicago Branch OfficeWright-Patterson Air Force Base 86 East Randolph StreetOhio • 1 Chicae ., Illinois
Commander Commanding OfficerAir Research and Development Command Aberdeen Proving GroundATTN: RDR 2 ATTN: Terminal Ballistic Lab. 1
RDRA I WSLRDRB 1 Aberdeen, MarylandRDRC iRDRS 1 Institute for Air Weapons Research
Andrews Air Force Base Museum of Science and IndustryWashington 25p D.C. University of Chicago
Chicago 37, IllinoisRand Corporation1700 Main StreetSanta Monica, California 1
iI14
t
S~-3-
Armour Research Foundation Applied Mechanics ReviewsI 33 West 33rd Street South West Research InstituceIllinois Institute of Technology- 8500 Culebra Road
SChicagoý Illinois 1 San Antonio 6, Texa&r
I Command~ing Officer National Bureau of StandardsFrankford Arsenal Plastics SectionAttn: Director, Pitman-Dunn Lab Attn: Dr. Olive EngelPhiladelphia 37, Pennsylvania 1 Washington 25, D.C.
Commanding Officer National Bureau of StandardsPicatinny Arsenal Boulder LaboratoriesAttn: Technical Division Boulder, ColoradoDover, New Jersey 1 DS~Dr. E. Paul Palmer
Chief, Bureau of Naval Weapons Ramo-Wooldridge CorporationResearch and Development Division Guided Missile DivisionDepartment of the Navy P.0. Box 45564
i Washington 25, D.C. 1 Air Port StationLos Angeles 45, California
Commanding Officer[ AU. S. Naval Ordnance Test Station CoarianderATTN: Technical Library U. S. Naval Proving GroundInyokern, China Lake, California 2 ATTN: Warhead and Terminal Ballistics
Lab., Research Division' Dr. P. Whitman Dahlgren,. Virginia
Applied Physics LaboratoryJohns Hopkins University Institute of the Aeronautical SciencesSilver Spring, Maryland- 1 ATTN: Librarian
I •,2 East 64th StreetMr. H..V. Wells New York 16, N.Y.Carnegie Institution of WashingtonDepartment of Terrestrial Magnetism Colorado School of Mines5241 Broad Branch Road, N.W. ATTN: J. S. RinehartWashington 15, D.C. 1 Golden, Colorado
S Stanford Research Institute Commanding OfficerPoulter Laboratories Document Custodian U. S. Naval Propellant PlantMenlo Park, California 1 ATTN: Technical Library
I Indian Head, MarylandU. S. Department of the InteriorBureau of Mines
4800 Forbes AvenuePittsburgh 13, PennsylvaniaATTN: M.P. Benoy, Repo?"E-Lirarian'1 Division of Explosives
Technology
i!I