- greenmark biomedical inc
TRANSCRIPT

www.advhealthmat.de
Vol. 6 • No. 1 • January 11 • 2017
ADHM_6_1_cover.indd 2 04/01/17 7:00 PM
FULL
PAPER
© 2016 WILEY-VCH Verlag GmbH & Co. KGaA, Weinheim wileyonlinelibrary.com (1 of 9) 1600883
Nanoparticle-Based Targeting and Detection ofMicrocavities
Nathan A. Jones, Sywe-Ren Chang, William J. Troske, Brian H. Clarkson,and Joerg Lahann*
DOI: 10.1002/adhm.201600883
N. A. Jones, Prof. J. LahannMacromolecular Science and EngineeringUniversity of MichiganAnn Arbor, MI 48109, USAE-mail: [email protected]. A. Jones, W. J. Troske, Prof. J. LahannBiointerfaces InstituteUniversity of MichiganAnn Arbor, MI 48109, USAS.-R. Chang, Prof. B. H. ClarksonCariology, Restorative Sciences, and Endodontics, Dental SchoolUniversity of MichiganAnn Arbor, MI 48109, USAW. J. Troske, Prof. J. LahannChemical EngineeringUniversity of MichiganAnn Arbor, MI 48109, USA
Although dental caries is the most prevalent oral disease worldwide,currently, many dentists continue to use the traditional mirror and probe(dental explorer) method of caries diagnosis. This method of caries detectionhas the drawback that it is often difficult to distinguish between active andinactive carious lesions. In this work, novel bio-based nanoparticles aredeveloped to specifically detect active caries in vitro. The nanoparticlesare made from a cationic fluorescein-labeled food-grade starch in order tofluoresce when illuminated by a standard dental curing light, and to degradein the oral cavity into nontoxic compounds after detecting the active car-ious lesion. When exposed to extracted human teeth, cationic fluorescent(+5.8 ± 1.2 mV) nanoparticles (size 101 ± 56 nm) selectively illuminate activecaries, but not the healthy tooth surface. Two-photon microscopy confirmsthe selective binding and accumulation of cationic fluorescent nanoparticlesinto microscopic carious pores in enamel. These novel nanoparticles providea unique method to assist in the early diagnosis of active carious lesions withthe potential to directly impact dental treatment.
Nearly everyone will develop cariesat some point in their life.[4] Worldwide,dental caries is the most prevalent dis-ease with ≈36% of the world’s populationpresenting with active caries. In the US,dental caries is the most common chronicdisease and more than 90% of adults willhave experienced dental caries in theirpermanent teeth.[5] The average Amer-ican adult has 3.3 decayed or missingteeth, and 25.5% of adults have untreateddental caries. Adults and children of lowersocioeconomic class have more untreateddental caries, because of lack of access toaffordable treatment.[5]
Dental cavities form when bacteria inthe dental biofilm on the surface of teethferment sugars and produce acids, whichdemineralize enamel and/or dentin. Gen-erally inactive lesions require no treatmentwhile active lesions do. Early active lesionspermit conservative remineralization treat-
ment, while cavitated lesions require dental restoration. Anactive lesion is one that is progressing and has a slightly decal-cified (≈5% compared to normal enamel) microporous surface,overlying a subsurface lesion that may have a porosity as high as30%–40%.[6,7] In contrast, an inactive lesion is not progressing,because the porosity, particularly on the surface, has beenreduced by mineral and/or protein deposition, thus facilitatingconservative management. Smaller, early stage active cariouslesions, also called “microcavities”, incipient carious lesions, orwhite spot lesions, can be reversed by a process called reminer-alization, which uses the calcium and phosphorous in the salivaand is aided by the presence of fluoride in drinking water ortoothpaste.[7] However, if decalcification continues, irreversiblecavitation will occur, requiring a dental procedure to avoid fur-ther progression of the carious lesion. If left untreated, cariesprogression can lead to pain, tooth loss, alveolar bone resorp-tion, and in rare cases, death.
The diagnosis of active dental caries is challenging, as pres-entation is highly variable.[8–10] Typically, diagnosis of caries iscarried out optically and tactically with a dental mirror andexplorer using techniques which have not changed in almosta century.[8,9] However, tactile detection of a carious lesion byapplying pressure on a dental explorer on a demineralizedlesion may lead to cavitation.[9,10] X-ray images of the teethcan be taken to identify cavities, particularly for regions inbetween teeth (interproximal caries), however, this suffers
1. Introduction
The use of nanoparticles for medical applications has garneredconsiderable interest, particularly for drug delivery, diagnostics,and imaging.[1–3] Oral health applications of nanoparticles havenot yet received as much attention, but offer potential for tech-nological advances that can immediately impact patient treat-ment and outcomes.
www.advhealthmat.de
Adv. Healthcare Mater. 2017, 6, 1600883
www.advancedsciencenews.com

FULL
PAPER
© 2016 WILEY-VCH Verlag GmbH & Co. KGaA, Weinheimwileyonlinelibrary.com1600883 (2 of 9)
from several limitations. X-ray images lack the resolution toidentify early forming lesions, which can still be repaired byan improved oral hygiene regimen and a fluoride applica-tion.[11] There are several new alternative methods for cariesdiagnosis that have been developed to address these draw-backs, including fluorescence, optical, radiographic, andelectrical conductance methods.[12,13] These methods requireadditional equipment, show minimal benefit over opticaldiagnosis, and incur greater cost to dentist and patient.[10,12,13]
Most importantly these methods only diagnose a lesion in theenamel surface, but do not distinguish between active andinactive lesions, which is the most critical need in moderncariology.[10]
If active carious lesions can be diagnosed before irrevers-ible cavitation occurs, the patient and dentist can be alerted toimprove dental hygiene in specific regions of the mouth. Inthis study, we have indirectly shown that the carious lesionshave a negative surface charge, and therefore cationic nano-particles may be used for targeting lesions due to electrostaticinteractions. To this end, we report a starch-based fluorescently-labeled cationic nanoparticle which selectively adsorbs ontoactive white spot enamel lesions in vitro. The use of food-gradestarch as the base polymer makes the particles nontoxic andbiodegradable upon exposure to salivary amylase. Fluoresceinwas chosen as a fluorophore for its understood safety profileand low toxicity in other diagnostic applications.[14] Usingfluorescein, carious lesions can be identified using a standarddental composite curing light, commonly used in dental offices.With further research and following successful clinical studies,these particles could be used by patients as a local application,mouth wash or rinse after cleaning the teeth, and then evalu-ated by a dentist or dental hygienist with illumination usinga standard dental composite curing lamp to identify stainedregions as active carious lesions.
In summary, our ultimate goal is to develop a new clinicallyvalid methodology to diagnose early active carious lesions thatalso enables effective monitoring of conservative treatment.The work reported here establishes the proof-of-principle whichdemonstrates the potential of this technology. We have devel-oped a nanoparticle technology which specifically targets activecarious lesions. The nanoparticles are made from food gradecorn starch. We have functionalized them so they specificallytarget the inside of dental caries. They are tagged with a safefluorescent dye so the caries will illuminate and be easily seenusing a standard dental curing lamp. This would allow dentiststo differentiate whether a carious lesion is active or inactive,and could be used to monitor treatment results. The productenvisioned is a mouth rinse or local application containing alow concentration of the nanoparticles in water. This wouldhelp detect early active carious lesions not visible on the toothsurface, because the extremely small nanoparticles are able topenetrate through surface pores into a very early active lesion.The starch-based nature of these particles allows for rapid deg-radation by amylase, an enzyme present in human saliva, soteeth will no longer fluoresce upon leaving the dentist’s office.With earlier detection of caries and less invasive management,cavitation and expensive treatments will be prevented, resultingin a reduction in dental expenditures by patients, insurancecompanies, and other payers.
2. Materials
All chemicals were lab grade and purchased from SigmaAldrich unless otherwise noted. These included tetrameth-ylpiperidinenitroxide (TEMPO), sodium bromide, sodiumhypochlorite, isopropyl alcohol, glycidyltrimethylammoniumchloride, sodium hydroxide, ethanol, fluoresceinamine isomer1, 1-ethyl-3-(-3-dimethylaminopropyl) carbodiimide hydro-chloride (EDC), N-hydroxysuccinimide (NHS), FITC-Dextran(10 K mol. wt.), fluorescein sodium salt, and a Tox8 cell viabilityassay. Samples of experimental grade starch nanoparticles wereprovided by EcoSynthetix Inc. (Canada).
3. Results and Discussion
3.1. Chemical Modification and Analysis
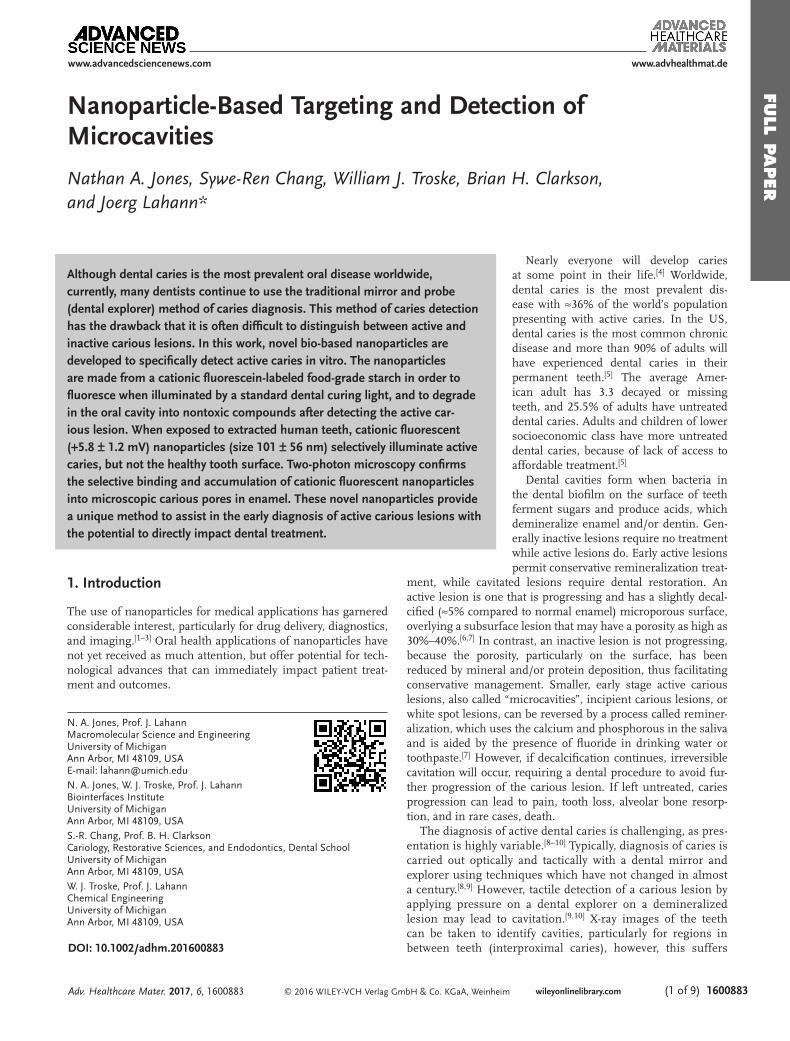
The chemical modification of starch nanoparticles followedthe approach outlined in Figure 1a. The cationic reaction wasperformed first to effectively modify free hydroxyl groups tomake the starch cationic, followed by the TEMPO oxidationof remaining hydroxyl groups. The intention was to create anet positive charge for specific adsorption to carious lesions,while still containing reactive carboxyl groups that allow forsubsequent functionalization using EDC/NHS chemistry. Fol-lowing the steps shown in Figure 1, cationic (StNP-2), anionic(StNP-5), and zwitterionic (StNP-3) particles were prepared.Fourier Transformed Infrared (FTIR) spectra of these particlesare shown in Figure 1b. All samples share characteristic bandsof the starch backbone, including (CO) stretching bands at1154 cm−1, 1121 cm−1, and 1017 cm−1, (CH) stretching bandsat 2926 cm−1, and a broad (OH) vibration band centered around3414 cm−1. There are increased bands at 2932 cm−1 (CH alkane),1450 cm−1 (CH alkane), and 1390 cm−1 (CH aldehyde) andthe appearance of new bands at 2830 cm−1 (CH aldehyde),1720 cm−1 (CO aldehyde), and 1493 cm−1 (CN). Theseresults are consistent with previously reported data on similarreactions.[15,16] The IR spectrum of anionic StNPs indicates asharp increase of the bands at 1710 cm−1 (CO carboxyl) and1422 cm−1 (COOH). The zwitterionic StNPs show evidence ofall of these bands, suggesting the presence of both carboxyl andcationic functional groups.
To further confirm the cationization of the starch nano-particles, X-ray photoelectron spectroscopy (XPS) results areshown in Table S1 in the Supporting Information. Nitrogenis unique to the quaternary amine in the cationic starch, andquantification of the nitrogen content allows for determinationof the degree of substitution (DS), which has a maximum valueof 3.0 for the fully substituted anhydroglucose unit of starch. Incationic StNPs (StNP-2), nitrogen was present after the reactionat ≈1.5–2 atomic percent, which corresponds to an approximateDS of 0.3. This DS is comparable to similarly studied starchcationization reactions.[17,18] The subsequent oxidation did notalter the degree of cationic substitution.
To characterize the TEMPO oxidation reaction, 1H NMRanalysis was performed (Figure S1, Supporting Informa-tion).[16] Based on the chemical shift of the C6 proton from5.2 to 5.4 ppm, we estimate a maximum DS of ≈0.55. It is
www.advhealthmat.de
Adv. Healthcare Mater. 2017, 6, 1600883
www.advancedsciencenews.com
FULL
PAPER
© 2016 WILEY-VCH Verlag GmbH & Co. KGaA, Weinheim wileyonlinelibrary.com (3 of 9) 1600883
hypothesized that the complex gel structure of the starch par-ticles sterically hinders the TEMPO oxidation, and some alde-hyde intermediates may be formed.[16]
In addition to the chemical analysis, physical particle analysiswas also performed on these samples, including particle sizeanalysis by nanoparticle tracking analysis (NTA) and dynamiclight scattering (DLS), as well as zeta potential measurements(Table 1). Variation in particle size between NTA and DLSoccurs, because NTA provides a number-weighted measure-ment, while DLS provides an intensity-weighted measurementof particle size. Consequently, DLS measurements of polydis-perse or aggregated samples will report larger diameters thanthe NTA measurements of the same particles.[19] The NTA par-ticle size distributions are shown in Figure S2 in the SupportingInformation. Initially, unmodified StNPs (StNP-1) showeda particle size of 41 nm and negligible charge. After TEMPOoxidation (StNP-5), particle charge decreased to –30.5 mV andaverage particle size decreased to 24 nm. The subsequent reac-tion with fluorescein via the EDC-NHS reaction reduced the
particle charge from –30.5 to –9.3 mV to result in anionic fluo-rescent StNPs.
In a separate preparation, after cationization (StNP-2),the average particle size decreased to 20 nm and the chargeincreased to +22.7 mV. For both anionically and cationicallymodified StNPs, a decrease in particle charge was expectedbecause of the addition of charged modalities on the particlesurface, which inhibit aggregation, resulting in an overalldecrease in average particle size. When both reactions werecombined through TEMPO oxidation of the cationic StNPs,zwitterionic particles were prepared, and the average particlesize increased to 101 nm and particles showed a moderate netcationic charge of +8.2 mV. The subsequent reaction with fluo-rescein via the EDC-NHS reaction reduced the particle chargefrom +8.2 to +5.8 mV, and appeared to have no significantimpact on particle size.
The degradation of starch particles in saliva was demon-strated using iodine and Benedict’s reagent tests (Figure 2). Acolorimetric method of analyzing the iodine solutions was used
www.advhealthmat.de
Adv. Healthcare Mater. 2017, 6, 1600883
www.advancedsciencenews.com
Figure 1. A) Chemical reaction scheme for preparation of starch nanoparticles. Unmodified particles (StNP-1) underwent cationization to preparecationic particles (StNP-2). TEMPO oxidation on cationic particles (StNP-2) and unmodified particles (StNP-1) yielded zwitterionic particles (StNP-3)and anionic particles (StNP-5), respectively. EDC/NHS chemistry was performed on particles (StNP-3) and (StNP-5) with fluorescein amine to yieldcationic fluorescent (StNP-4) and anionic fluorescent (StNP-6) StNP particles, respectively. B) FTIR spectra for unmodified (StNP-1), cationic (StNP-2),anionic (StNP-5), and zwitterionic (StNP-3) starch nanoparticles. Regions of interest for CH and CO peaks are highlighted.
FULL
PAPER
© 2016 WILEY-VCH Verlag GmbH & Co. KGaA, Weinheimwileyonlinelibrary.com1600883 (4 of 9)
instead of direct absorbance measurements to avoid precipita-tion in the well plates.[20]
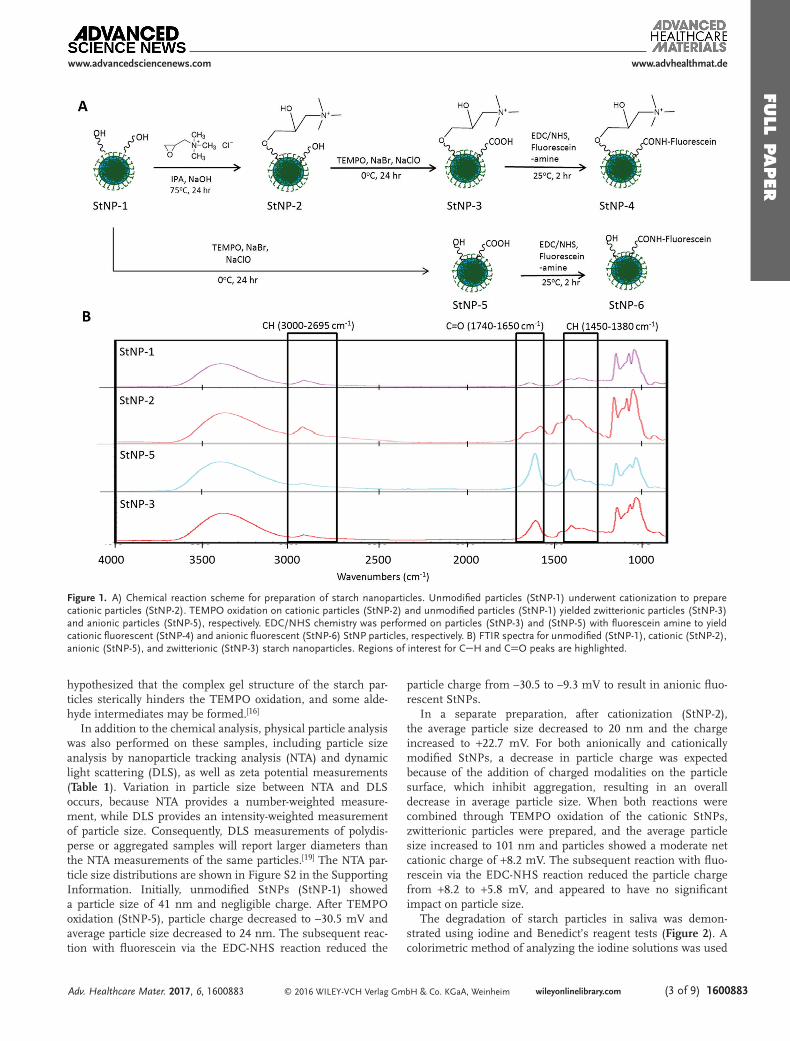
UV–vis absorbance measurements were used to quantify theBenedict’s test. For unmodified (StNP-1), zwitterionic (StNP-3),and cationic fluorescent (StNP-4) StNPs, the iodine test showeda decrease in starch staining after 30 min of exposure to saliva,while the Benedict’s test showed an increase in the presenceof reducing sugars. The initial starch–iodine concentration ofStNP-1 is higher than the modified nanoparticles (StNP-3 andStNP-4) because the modifications to the starch chemistryinhibit the ability of the iodine to interact with the starch.[21]
Similarly, with Benedict’s test the modified starches yield fewer
reducing sugars, because the starch modification preventsdegraded sugars from reducing the Benedict’s copper reagent.Nevertheless, these results indicate that starch particles aredegraded into reducing sugars after a 30 min exposure to saliva.Based on these data, we concluded that the starch particles candegrade in the patient’s mouth within less than an hour afterthey have been used by the dentist for diagnosis.
The results from the Tox8 cellular toxicity assay are shown inFigure S3 in the Supporting Information. These results indicatethat all the particles were nontoxic even at high concentrationsof 0.01 g mL–1.
3.2. Dental Activities Testing
Initial testing compared fluorescein sodium salt, fluorescentFITC-dextran, anionic fluorescent StNP, and cationic fluores-cent StNP dispersions at selectively targeting carious lesions.A 0.01 g mL–1 solution of fluorescein sodium salt nonspecifi-cally (adsorbed to) dyed the tooth (surface); therefore the con-centration of fluorescein was reduced to 10−5 g mL–1. Afterrinsing for 20 s, the fluorescein, fluorescent FITC-dextran, andanionic fluorescent StNP control groups displayed no observ-able levels of fluorescence. In contrast, the cationic fluorescentStNP sample fluorescently illuminated the carious lesions, andrinsing with DI-water for up to 5 min was unable to removethe fluorescence, suggesting specific adsorption of the nanopar-ticles to the surface of the carious enamel pores. This providedindirect evidence that the active carious lesions have a negativesurface charge, and can be specifically targeted with cationic
nanoparticles. Similar rinse studies wererepeated with saline solutions, and artificialsaliva, yielding consistent results.
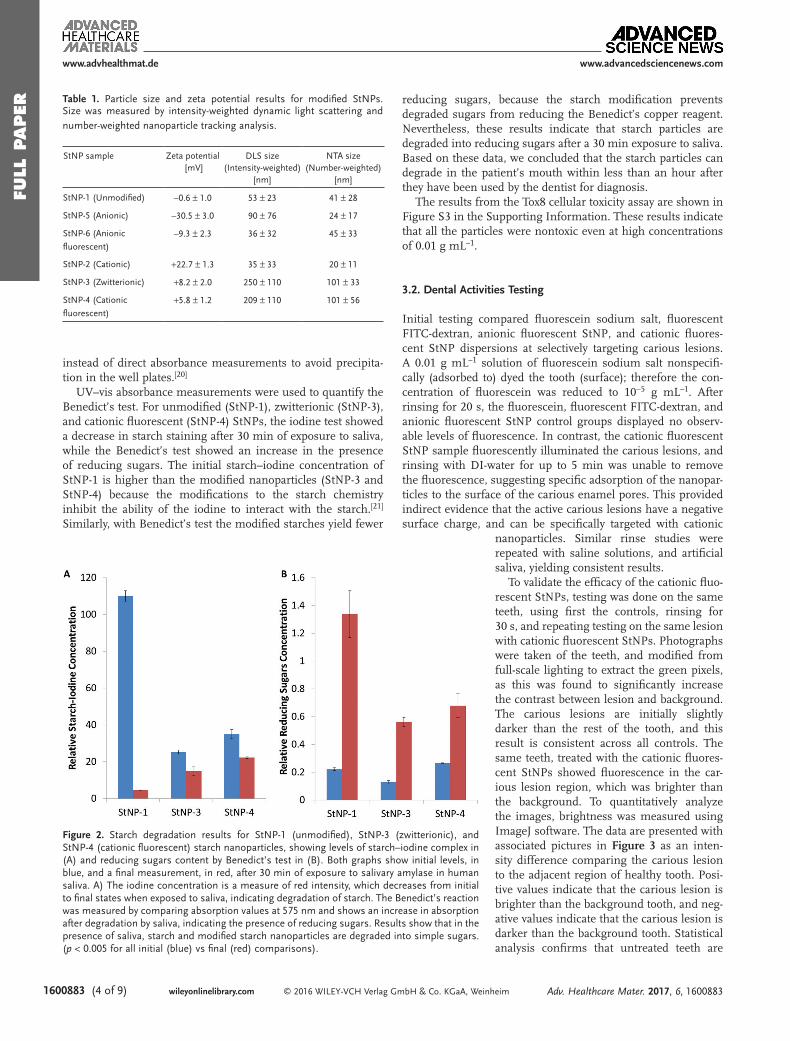
To validate the efficacy of the cationic fluo-rescent StNPs, testing was done on the sameteeth, using first the controls, rinsing for30 s, and repeating testing on the same lesionwith cationic fluorescent StNPs. Photographswere taken of the teeth, and modified fromfull-scale lighting to extract the green pixels,as this was found to significantly increasethe contrast between lesion and background.The carious lesions are initially slightlydarker than the rest of the tooth, and thisresult is consistent across all controls. Thesame teeth, treated with the cationic fluores-cent StNPs showed fluorescence in the car-ious lesion region, which was brighter thanthe background. To quantitatively analyzethe images, brightness was measured usingImageJ software. The data are presented withassociated pictures in Figure 3 as an inten-sity difference comparing the carious lesionto the adjacent region of healthy tooth. Posi-tive values indicate that the carious lesion isbrighter than the background tooth, and neg-ative values indicate that the carious lesion isdarker than the background tooth. Statisticalanalysis confirms that untreated teeth are
www.advhealthmat.de
Adv. Healthcare Mater. 2017, 6, 1600883
www.advancedsciencenews.com
Figure 2. Starch degradation results for StNP-1 (unmodified), StNP-3 (zwitterionic), andStNP-4 (cationic fluorescent) starch nanoparticles, showing levels of starch–iodine complex in(A) and reducing sugars content by Benedict’s test in (B). Both graphs show initial levels, inblue, and a final measurement, in red, after 30 min of exposure to salivary amylase in humansaliva. A) The iodine concentration is a measure of red intensity, which decreases from initialto final states when exposed to saliva, indicating degradation of starch. The Benedict’s reactionwas measured by comparing absorption values at 575 nm and shows an increase in absorptionafter degradation by saliva, indicating the presence of reducing sugars. Results show that in thepresence of saliva, starch and modified starch nanoparticles are degraded into simple sugars.(p < 0.005 for all initial (blue) vs final (red) comparisons).
Table 1. Particle size and zeta potential results for modified StNPs.Size was measured by intensity-weighted dynamic light scattering andnumber-weighted nanoparticle tracking analysis.
StNP sample Zeta potential[mV]
DLS size(Intensity-weighted)
[nm]
NTA size(Number-weighted)
[nm]
StNP-1 (Unmodified) –0.6 ± 1.0 53 ± 23 41 ± 28
StNP-5 (Anionic) –30.5 ± 3.0 90 ± 76 24 ± 17
StNP-6 (Anionic
fluorescent)–9.3 ± 2.3 36 ± 32 45 ± 33
StNP-2 (Cationic) +22.7 ± 1.3 35 ± 33 20 ± 11
StNP-3 (Zwitterionic) +8.2 ± 2.0 250 ± 110 101 ± 33
StNP-4 (Cationic
fluorescent)+5.8 ± 1.2 209 ± 110 101 ± 56
FULL
PAPER
© 2016 WILEY-VCH Verlag GmbH & Co. KGaA, Weinheim wileyonlinelibrary.com (5 of 9) 1600883
indistinguishable from fluorescein, fluorescent FITC-dextran,and anionic fluorescent StNP controls, meaning that these con-trols did not illuminate carious lesions. The analysis furthersuggests that untreated carious lesions are slightly distinguish-able against the background tooth; however, this is not alwaysstatistically significant. In stark contrast, the teeth treated withcationic fluorescent StNPs yielded highly significant positiveintensity differences (p < 10−5), indicating that these particlesimproved the contrast of carious lesions relative to the back-ground, even to the naked eye. Additionally, analyzing extractedgreen-pixel images instead of standard RGD images furtherimproved the contrast. It is interesting to note that comparingthe nonilluminated images to the illuminated images high-lights differences between the delineated shape of the lesiondepending on the optical method used (e.g., image of cariouslesions treated with anionic fluorescent particles and corre-sponding image of lesions treated with cationic fluorescent par-ticles). Conceivably, this variation occurs, because the fluores-cent particles will only illuminate an active carious lesion withopen porosity, while the closed pores of inactive lesions cannotbe detected by the starch nanoparticles. In contrast, the nonillu-minated lesion images are darker if there is subsurface porosity.This approach thus fails to identify inactive caries due to theirclosed surface porosity. The ability to distinguish between activeand inactive lesions is a significant dental advantage of tar-geted nanoparticles compared to other diagnostic methods. Asa further validation of these results, images of the same teethwere taken using a fluorescent scanner with a green 542 nmbandpass filter and blue light illumination. This method wasnot chosen as the primary method of analysis, because of itslimited translatability, though it significantly increased thecontrast compared to the optical method and images obtainedby camera using a dental curing light (p < 10−5). Neverthelessthese results provide further confirmation that the fluorescenceseen in the carious lesions is due to the cationic fluorescent
starch nanoparticles. Consequently, the prepared cationic fluo-rescent starch nanoparticles can specifically highlight activecaries lesions when illuminated with a standard dental curinglamp in vitro, and offer a simple method to assist dentists indiagnosis of white spot carious lesions.
3.3. Analysis of Nanoparticle Distribution usingTwo-Photon Microscopy
To dissect the microscopic distribution of nanoparticles inmicrocavities, two-photon microscopy images of the differentconditions were obtained as shown in Figure 4. Images showregions of teeth that are 256 × 256 µm across, with depthsranging from 40 to 80 µm gated to capture all detectable fluo-rescence signals. The various control samples (untreated lesion,or lesion treated with fluorescent FITC-dextran, anionic fluo-rescent StNPs, or fluorescein sodium salt, or nonlesion treatedwith cationic fluorescent StNPs) display only low levels ofsignal due to the autofluorescence of enamel. Darker regionsin the control images of carious lesions can be attributed to theporosity of the lesion and may explain their darker macroscopicappearance compared to nonlesion regions of the same tooth.In comparison, the two-photon micrograph of lesions exposedto cationic fluorescent StNPs shows illuminated small pores inthe tooth surface of the early carious lesions, resulting in anoverall speckled appearance. These results demonstrate, on amicroscopic level, the ability of cationic fluorescent starch parti-cles to penetrate and adsorb specifically to the subsurface poresof active carious lesions. An important control is the cationicfluorescent starch nanoparticles on a noncarious surface whichshowed low brightness typical of enamel autofluorescencesimilar to the negative controls on caries lesions, validating theselectivity of the cationic starch particles on a microscopic scale.Ring-shaped illumination patterns such as the one shown in
www.advhealthmat.de
Adv. Healthcare Mater. 2017, 6, 1600883
www.advancedsciencenews.com
Figure 3. Bar graph showing the contrast of carious lesions for various starches as compared to controls, demonstrating positive contrast for theStNP-4 sample. The teeth were illuminated using a standard dental composite curing lamp. “Normal” stands for the percent intensity differenceobtained for unmodified images, and “Green” stands for the extracted green pixel images. Orange inserts show the normal light image, and an exampleof an extracted green pixel image is shown for the StNP-4 sample. Statistical marks as follows: * Negative contrast (0.05 < p < 0.20); †Significant nega-tive contrast (p < 0.05); ‡Significant positive contrast (p < 10−5).

FULL
PAPER
© 2016 WILEY-VCH Verlag GmbH & Co. KGaA, Weinheimwileyonlinelibrary.com1600883 (6 of 9)
the inset in Figure 5 suggest that particles are arranged on thesurface of carious pores penetrating into the enamel. Further-more, the architecture of the pores indicates a larger subsurfaceporosity covered by a more limited surface porosity, consistentwith previously reported studies.[6,7] These results demonstrate
that two-photon microscopy can be used to obtain informa-tion about the size and shape of illuminated carious lesions,and provide an interesting experimental method in support ofcarious lesion development and remineralization studies. Forexample, the carious lesions shown in Figure 5 have an averagesubsurface diameter of 8.5 ± 6.6 µm, an average depth of10.3 ± 2.9 µm, and an overall porosity of 14 ± 2%. Monitoringporosity in this manner for different tooth conditions couldprovide a valuable research tool.
3.4. Nanoparticle Targeting to Remineralized Lesions
Teeth with microcavities were remineralized using a fluoridesolution to “heal” the surface porosity of the carious lesions,yielding inactive lesions with subsurface porosity.[22] Theselesions were analyzed using the same illumination and imageanalysis protocols before and after remineralization. The resultsobtained with a fluorescent scanner are shown in Figure 6. Byappearance, the remineralized (inactive) lesions were visuallyindistinguishable from demineralized (active) lesions (insetimage in Figure 6). Furthermore, without illumination by cati-onic fluorescent StNPs, the active and inactive carious lesionsare indistinguishable (p = 0.44). In contrast, after exposure tocationic fluorescent StNPs, the inactive lesions show only min-imal illumination (p = 0.38), when compared to active lesions(p < 10−5). Though a low level of fluorescence was detected forthe remineralized lesions, this is most likely because the teethwere not fully remineralized during the remineralization pro-tocol. However, in all cases, the illumination was lower for theremineralized lesions. Fundamentally, these results validate
www.advhealthmat.de
Adv. Healthcare Mater. 2017, 6, 1600883
www.advancedsciencenews.com
Figure 5. Example of carious lesion pore architecture illuminated by cati-onic fluorescent StNPs. Particles adsorb to the lumen surface of the poreleaving a central gap. Carious lesion is ≈10 µm wide, by 8 µm deep.
Figure 4. Representative top-view two-photon z-stack images of the surface of carious lesions with respective dyes. The lesion unexposed to fluores-cent materials has a low fluorescence intensity, similar to the fluorescent FITC-dextran, fluorescein, anionic fluorescent StNP, and cationic nonlesioncontrols. The sample treated with cationic fluorescent StNPs had a speckled appearance, with bright spots identifying carious lesions on the order of5–10 µm in diameter and with depths of 5–20 µm.

FULL
PAPER
© 2016 WILEY-VCH Verlag GmbH & Co. KGaA, Weinheim wileyonlinelibrary.com (7 of 9) 1600883
the high degree of specificity of cationic fluorescent StNPs todiagnose and differentiate between active and inactive cariouslesions. Use of a specific fluorescent nanoparticle probe canidentify caries activity by virtue of surface porosity, which, inactive carious lesions allows for diffusion to the subsurfacepores, but prevents access to the fluorescent probe in the caseof inactive lesions. Clinically, a dentist does not need to treatinactive lesions, and treatments such as fluoride varnishes,gels, washes, or sealants, will have no beneficial effect. In con-trast, active lesions are progressing, and appropriate treatmentcan halt and reverse demineralization. Two-photon micro-graphs of the remineralized lesions, both before and after expo-sure to cationic fluorescent StNPs, further support these results(Figure S4, Supporting Information). These images show asmooth surface with no observable fluorescent pores, whichmost closely resemble a nonlesion surface after exposure to cat-ionic fluorescent StNPs. These results highlight that the rem-ineralized lesion, from a surface perspective, has been healed.Furthermore, dentists and clinical researchers could use thecationic fluorescent StNPs to validate and monitor effectiveremineralization of carious lesions after treatment, or as a com-pelling means of quantifying the efficacy of various treatments.
4. Conclusion
We report a novel type of starch-based cationic fluorescent nan-oparticles which target and illuminate early forming active car-ious lesions in vitro. The nanoparticles made from food gradestarch, are biodegradable, biocompatible, and are enzymaticallydegraded in saliva after use. Our ultimate goal is to develop anew clinically valid methodology to diagnose early and activecarious lesions that also enables effective monitoring of con-servative treatment. With further research and clinical studies,these particles could be used by a dentist or dental hygienistas a local application, mouth wash, or rinse which can then beilluminated using a standard dental curing light used in dentalpractices, and thus improve the detection of microcavities whilethey are still reversible by improved dental hygiene and targetedfluoride treatments. Using image analysis, and in particular
by analyzing the green colors in images, these particles sig-nificantly improve the contrast of carious lesions. Furthermore,two-photon microscopy of teeth treated with these nanopar-ticles allows for analysis of the microscopic architecture ofthese lesions. Cationic fluorescent starch nanoparticles havethe potential to be used for diagnosis of early caries in dentalclinics, for point-of-care use, or to monitor tooth reminerali-zation therapies. These novel nanoparticles provide a uniquemethod to assist in the early diagnosis and treatment of activecarious lesions. Similarly designed nanoparticles could be usedto deliver fluoride, other remineralization aides, or antibacterialtherapeutics to help improve dental health.
5. Experimental SectionChemical Modification: The chemical reaction scheme for modification
of starch nanoparticles is presented in Figure 1, and described furtherbelow. All reactions were repeated in triplicate to account for batch-to-batch variability.
Chemical Modification—Cationization of Starch Nanoparticles: Starchnanoparticles (StNP-1) were modified to be cationic according to avariation on the procedure shown in Huang et al.[15] Seven gramsof starch nanoparticles were dispersed at 0.07 g mL–1 into 100 mL of0.01 g mL–1 sodium hydroxide in deionized water. To this dispersion,3 mL of isopropyl alcohol and 4.3 g (0.5:1 moles based on glycosidicrepeat units of starch) of glycidyl trimethyl ammonium chloride wereadded, and allowed to mix for 1 h. The mixture was then heated to75 °C and left overnight, before precipitation in anhydrous ethanoland centrifugation, followed by lyophilization, yielding cationic starchnanoparticles (StNP-2).
Chemical Modification—TEMPO Oxidation of Starch Nanoparticles:Starch nanoparticles were oxidized according to a modification ofthe procedure shown in Kato et al.[16] Briefly, a 100 mL 0.05 g mL–1
(5 g or 0.03 mol) dispersion of cationic starch nanoparticles in deionizedwater was mixed with a 100 mL aqueous solution containing 0.048 g ofTEMPO (0.3 mmol) and 0.635 g of sodium bromide (6.2 mmol). Themixture was cooled in an ice bath, and the pH value was adjusted above10 using a 10% sodium hydroxide solution. Next, 20 g of a 11% sodiumhypochlorite solution (1:2 molar ratio to starch nanoparticles) wereadded slowly to the mixture, while maintaining a pH value above 10. Thereaction was continued overnight and the product was precipitated inethanol and separated by centrifugation, followed by lyophilization toisolate the zwitterionic starch nanoparticles (StNP-3). The same reaction
www.advhealthmat.de
Adv. Healthcare Mater. 2017, 6, 1600883
www.advancedsciencenews.com
Figure 6. Remineralized (inactive) carious lesions do not illuminate after exposure to cationic fluorescent StNPs, in contrast to demineralized (active)carious lesions. * Negative contrast (0.05 < p < 0.20), ** Positive contrast (0.05 < p < 0.30), † Significant negative contrast (p < 0.05), ‡ Significantpositive contrast (p < 10−5).

FULL
PAPER
© 2016 WILEY-VCH Verlag GmbH & Co. KGaA, Weinheimwileyonlinelibrary.com1600883 (8 of 9)
www.advhealthmat.de
Adv. Healthcare Mater. 2017, 6, 1600883
www.advancedsciencenews.com
conditions performed on unmodified starch nanoparticles (StNP-1)yielded anionic particles (StNP-5).
Chemical Modification—EDC/NHS Linkage of FITC-Amine toCarboxylated Starch Nanoparticles: Two grams of zwitterionic starchnanoparticles were dispersed in a 20 mL solution of 0.1 m MES,0.5 m NaCl buffer. A 10-fold molar excess of EDC was added(0.2 g) over 20 min, followed by the addition of a 1.5-fold mass excessof NHS (0.3 g). A 20 mL solution of 0.1 m PBS, 0.15 m NaCl wasadded to raise the pH value above 7. Fluoresceinamine was added at a1:75 molar ratio (0.05 g), and allowed to react for 2 h. The particles wereprecipitated in ethanol, separated by centrifugation, and lyophilized,yielding fluorescein-labeled cationic starch nanoparticles (StNP-4).The same reaction conditions using the anionic starch nanoparticles(StNP-5) as a starting material yielded fluorescein-labeled anionicparticles (StNP-6).
Chemical Analysis: FTIR spectroscopy was performed using a ThermoScientific Nicolet 6700 instrument. Samples were prepared by spincoating dispersion of modified starch nanoparticles onto a gold-coatedsilicon wafer, followed by vacuum drying for 24 h. 128 scans werecollected for each sample.
1H NMR analysis was performed using a Varian MR400 instrument.Samples were dispersed in D2O at ≈5% solids and resonance peakpositions and integrations were compared to results from theliterature.[16]
XPS was run on lyophilized dry powder starch nanoparticle samplesusing an Axis Ultra X-ray photoelectron spectrometer (Kratos Analyticals,UK) equipped with a monochromatized Al Kα X-ray source at a powerof 150 kW.
Particle Characterization: Starch nanoparticle samples StNP-1 –StNP-6 were dispersed in 0.01 m phosphate buffered saline solutionat 2.5 × 10⁻⁴ g mL–1 and analyzed by zeta potential and DLS analysisusing a Malvern ZetaSizer, and NTA using a NanoSight NS300. Allsamples had a pH of 7.4 and were measured at 25 °C. The zetapotential measurements were conducted by inserting 1 mL of thedispersed nanoparticle formulations into a folded capillary cuvetteand run using a standard protocol on the Malvern ZetaSizer, involvingthree repeat measurements to ensure repeatability. DLS measurementswere performed by inserting 1 mL of the dispersed nanoparticleformulations into a polystyrene cuvette and running a standard protocolon the ZetaSizer. NTA size measurements were performed by injectingthe sample into the flow chamber and completing three 30 s videomeasurements, leading to a cumulative of thousands of individualparticle size measurements for each sample condition.
Particle Degradation Study: Starch particles were dispersed at0.01 g mL–1 in deionized water. Half of the particle dispersions wereset aside as an initial dispersion and diluted at a 1:1 ratio with DI-water.The remaining half of the particle dispersions were taken and dilutedat a 1:1 ratio with saliva, and placed in an incubator at 37 °C for30 min. Saliva was collected (donated; human subject exempt) andused immediately to minimize potential denaturation of salivaryenzymes. Both the initial and final dispersions were tested with iodineand Benedict’s reagent.
Particle Degradation Study—Iodine Test: 20 µL of iodine solution wereadded to 2 mL of the initial and final dispersions, and examined for colorusing ImageJ software.[20]
Particle Degradation Study—Benedict’s Reagent Test: 20 µL ofBenedict’s reagent were added to 2 mL of the initial and final dispersionsand heated to 80 °C for 30 min, and then evaluated with a UV–visspectrophotometer to measure absorbance at a wavelength of 735 nm.
TOX8 Cellular Toxicity Assay: Starch nanoparticle samples StNP-1–StNP-6 were evaluated for cellular toxicity with a TOX8 (Resazurinbased) assay on HeLa cells. The assay was performed according tomanufacturer’s instructions with appropriate controls. Cells were seededin 96 well microtiter plates (1 × 10⁴ cells per 200 µL growth mediumper well) followed by overnight incubation. Supernatants from the wellswere aspirated out and fresh aliquots of growth medium (containingStNP in desired concentrations in the range of 0.1–10 mg mL–1) wereadded. After 2 h incubation time, supernatants were aspirated out and
the cell monolayers in the wells were washed with 200 µL PBS (0.1 m,pH 7.4). Subsequently, TOX8 reagent (20 µL) was added in each well,incubated for 3 h and fluorescence was recorded at a wavelength of590 nm using an excitation wavelength of 560 nm using the plate reader,allowing for calculation of cell viability for each well. Each concentrationwas evaluated in triplicate to assess experimental variability.
Dental Testing—Preparation of Teeth: Extracted teeth were obtainedfrom the School of Dentistry, University of Michigan (human subjectexempt) and stored in 0.01 g mL–1 sodium azide before use. The teethwere coated with an acid resistant varnish leaving a 1 mm2 enamelwindow on the buccal surface of the crowns of the teeth. The teethwere then immersed in a pH 5.0 demineralization gel containing 0.1 m
lactic acid, 4.1 × 10⁻³ m CaCl2-2H2O, 8 × 10⁻³ m KH2PO4, and 1% w/vcarboxymethylcellulose sodium at 37 °C for 8 d.[23] At the completion ofdemineralization, the teeth were rinsed with DI-water before subjectionto caries activity testing. Residual varnish was removed by washing inacetone.
Dental Testing—Cavity Diagnosis Testing: For caries testing, 0.01 g mL–1
solutions of FITC-dextran, StNP-4, and StNP-6, and a 10−5 g mL–1
solution of fluorescein sodium salt were prepared. Teeth were exposedto 20 µL of sample for 3 min prior to rinsing in DI water. Rinsingproceeded for 10 s, and the teeth were examined and photographed,while illuminated with a dental curing light. Rinsing was then continuedfor an additional 10 s, followed by imaging, and this was repeated for upto 5 min to determine residence times for each sample used to optimizethe exposure and rinsing procedure.
A 20 s rinse in DI water was sufficient to wash away all but thecationic fluorescent StNPs, which remained even up to 5 min. Fifteenteeth were divided into 3 groups of 5 for testing with each control(fluorescent FITC-Dextran, anionic fluorescent StNP, and fluoresceinsodium salt). After a 3 min exposure followed by 30 s of rinsing, imagingwas performed under illumination by the dental curing light. The sameteeth were then dosed with fluorescein-labeled cationic StNPs andimaged to demonstrate the ability of these particles to illuminate thecarious lesions that could not be lit by the various controls.
Dental Testing—Remineralized Lesions Activity Testing: Prior toremineralization, active lesions were illuminated with StNP-4 to obtaina baseline readout. These demineralized teeth were then remineralizedby immersion in a remineralization solution containing 0.02 m cacodylicacid sodium salt, trihydrate, 1.5 × 10⁻³ m Ca(NO3)2-4H2O, 0.9 × 10⁻³ m
NaH2PO4-H2O, 150 × 10–3 m KCl, and 0.05 ppm NaF, with pH valueadjusted to 7.0.[22] Teeth were immersed at 37 °C for 13 d. Images ofremineralized teeth were taken for analysis prior to, and after exposureto cationic fluorescent StNPs.
Dental Testing—Image Analysis: Digital images were taken with aCanon DS126061 DSLR camera with a Sigma 105 mm 1:2.8 DG Macrolens and analyzed using ImageJ image analysis software. This providedRGD images and ImageJ image analysis techniques were used tocompare the brightness of the carious lesion relative to the backgroundtooth. Green pixel images were then extracted using ImageJ softwareand analyzed by the same methods. Digital images were also takenwith a Fluorchem M Imaging system, with auto-exposure, blue lightillumination and a green 542 nm bandpass filter applied to validate theparticle fluorescence in the carious lesions, and analyzed using the samemethods with ImageJ image analysis software.
Dental Testing—Two-Photon Microscopy: Treated teeth were examinedusing a Leica TCS SP8 Two-Photon Confocal Microscope equipped withFLIM & FCS capabilities using a 40X oil-immersion objective. Sampleswere immersed in oil and placed on a glass-bottomed petri dish. Theillumination wavelength was set to 810 nm, and z-stack images werecollected for a variety of tooth samples.
Supporting Information
Supporting Information is available from the Wiley Online Library orfrom the author.

FULL
PAPER
© 2016 WILEY-VCH Verlag GmbH & Co. KGaA, Weinheim wileyonlinelibrary.com (9 of 9) 1600883
www.advhealthmat.de
Adv. Healthcare Mater. 2017, 6, 1600883
www.advancedsciencenews.com
AcknowledgementsThe authors acknowledge analytical support from K.C. Chang (XPS),M. Bodner (FTIR), B. Plummer (Tox8 assay), and L. Barthel (two-photonmicroscopy). The authors further acknowledge financial support fromColgate-Palmolive. The authors thank EcoSynthetix Inc. for providingexperimental grade starch nanoparticles. The authors thank Dr. StevenBloembergen (Chairman and CEO of GreenMark Biomedical Inc.) for hisvaluable comments and advice throughout the study. N.J. acknowledgesthe National Science and Engineering Research Council of Canada forfinancial support through a PGS-D fellowship.
Received: August 8, 2016Revised: October 3, 2016
Published online: November 15, 2016
[1] J. Vasir, V. Labhasetwar, Technol. Cancer Res. Treat. 2005, 4, 4.[2] S. Parveen, R. Misra, S. Sahoo, Nanomed.: Nanotech. Biol.Med.
2012, 8, 2.[3] A. C. Misra, S. Bhaskar, N. Clay, J. Lahann, Adv. Mater. 2012,
24, 28.[4] WHO Media Centre, Oral Health Fact Sheet, http://www.who.int/
mediacentre/factsheets/fs318/en/ (accessed: October 2015).[5] NIHNIDCR, Dental Caries Statistics, http://www.nidcr.nih.gov/
DataStatistics/FindDataByTopic/DentalCaries/ (accessed: October2015).
[6] B. Clarkson, J. Wefel, L. Silverstone, Caries Res. 1981, 15, 158.[7] J. Featherstone, J Dent. Res. 2004, 83, Spec No C:C39–42.
[8] K. Thoma, in The American Textbook of Operative Dentistry, 7th ed.(Ed: M. Ward), Lea & Febiger, Philadelphia, USA 1940, Ch. 29.
[9] J. B. Summit, J. W. Robbins, R. S. Schwartz, Fundamentals ofOperative Dentistry: A Contemporary Approach, 2nd ed. Quintes-sence Publishing Co., Carol Stream, IL, USA 2001.
[10] A. I. Ismail, ICDAS Coordinating Committee, in Proceedings of the7th Indiana Conference, (Ed: G. Stookey), Indianapolis, USA 2005,p. 161.
[11] R. I. Ferreira, F. Haiter-Neto, C. P. Tabchoury, G. A. de Paiva,F. N. Bóscolo, Braz. Oral Res. 2006, 20, 114.
[12] J. D. Bader, D. A. Shugars, G. Rozier, K. N. Lohr, A. J. Bonito,J. P. Nelson, A. M. Jackman, AHRQ Evidence Report Summaries 2001.
[13] M. Zeitouny, M. Feghali, A. Nasr, P. Abou-Samra, N. Saleh,D. Bourgeois, P. Farge, Sci. World J. 2014, 2014, 924741.
[14] T. Hara, N. Imami, T. Hara, Am. J. Opthalmol. 1998, 126, 4.[15] Y. Huang, M. Liu, C. Gao, J. Yang, X. Zhang, X. Zhang, Z. Liu,
Int. J. Biol. Macromol. 2013, 58, 231.[16] Y. Kato, R. Matsuo, A. Isogai, Carbohydr. Polym. 2003, 51, 69.[17] J. Bendoraitiene, R. Kavaliasukaite, R. Klimaviciute, A. Zemaitaitis,
Starch 2006, 58, 12.[18] W. Pi-Xin, W. Xiu-Li, D. H. Xue, K. Xu, Y. Tan, X. B. Du, W. B. Li,
Carbohydr. Res. 2009, 344, 7.[19] V. Filipe, A. Hawe, W. Jiskoot, Pharm. Res. 2010, 27, 5.[20] K. Mathews, J. Landmark, D. Stickle, J. Chem. Educ. 2004, 81, 5.[21] S. K. Fischer, F. Piller, Staerke 1978, 30, 4.[22] J. R. S. Maas, I. M. Faraco Junior, C. S. Lodi, A. C. B. Delbem,
Int. J. Paediatr. Dent. 2013, 23, 166.[23] H. M. Nassar, F. Lippert, G. J. Eckert, A. T. Hara, Caries Res. 2014,
46, 557.