· following the new presentation rules under philippine accounting standard (pas) no. 34, ... new...
TRANSCRIPT


- 1 -
SAN MIGUEL CORPORATION AND SUBSIDIARIES
SELECTED NOTES TO THE CONSOLIDATED FINANCIAL STATEMENTS (Amounts in Millions, Except Per Share Data)
1. Summary of Significant Accounting and Financial Reporting Policies
The Group prepared its interim consolidated financial statements as of and for the period
ended June 30, 2016 and comparative financial statements for the same period in 2015
following the new presentation rules under Philippine Accounting Standard (PAS) No. 34,
Interim Financial Reporting. The consolidated financial statements of the Group have been
prepared in compliance with Philippine Financial Reporting Standards (PFRS).
The consolidated financial statements are presented in Philippine peso and all financial
information are rounded off to the nearest million (000,000), except when otherwise
indicated.
The principal accounting policies and methods adopted in preparing the interim consolidated
financial statements of the Group are the same as those followed in the most recent annual
audited consolidated financial statements.
Adoption of New and Amended Standards
The Financial Reporting Standards Council (FRSC) approved the adoption of a number of
new and amended standards and interpretation as part of PFRS.
Amendments to Standards Adopted in 2016
The Group has adopted the following PFRS starting January 1, 2016 and accordingly,
changed its accounting policies in the following areas:
Disclosure Initiative (Amendments to PAS 1, Presentation of Financial Statements).
The amendments clarify the following: (i) the materiality requirements in PAS 1;
(ii) that specific line items in the consolidated statements of income, consolidated
statements of comprehensive income and the consolidated statements of financial
position may be disaggregated; (iii) that entities have flexibility as to the order in
which they present the notes to the consolidated financial statements; and (iv) that
share of other comprehensive income of associates and joint ventures accounted for
using the equity method must be presented in aggregate as a single line item, and
classified between those items that will or will not be subsequently reclassified to
profit or loss. Furthermore, the amendments clarify the requirements that apply
when additional subtotals are presented in the consolidated statements of financial
position, the consolidated statements of income and consolidated statements of
comprehensive income.
Accounting for Acquisitions of Interests in Joint Operations (Amendments to
PFRS 11, Joint Arrangements). The amendments require business combination
accounting to be applied to acquisitions of interests in a joint operation that
constitutes a business. Business combination accounting also applies to the
acquisition of additional interests in a joint operation while the joint operator retains
joint control. The additional interest acquired will be measured at fair value. The
previously held interests in the joint operation will not be remeasured. The
amendments place the focus firmly on the definition of a business, because this is key
to determining whether the acquisition is accounted for as a business combination or
as the acquisition of a collection of assets. As a result, this places pressure on the

- 2 -
judgment applied in making this determination.
Clarification of Acceptable Methods of Depreciation and Amortization (Amendments
to PAS 16, Property, Plant and Equipment and PAS 38, Intangible Assets). The
amendments to PAS 38 introduce a rebuttable presumption that the use of revenue-
based amortization methods for intangible assets is inappropriate. This presumption
can be overcome only when revenue and the consumption of the economic benefits
of the intangible asset are highly correlated, or when the intangible asset is expressed
as a measure of revenue. The amendments to PAS 16 explicitly state that revenue-
based methods of depreciation cannot be used for property, plant and equipment.
This is because such methods reflect factors other than the consumption of economic
benefits embodied in the asset - e.g., changes in sales volumes and prices.
Annual Improvements to PFRS Cycles 2012-2014 contain changes to four standards,
of which the following are applicable to the Group:
o Changes in Method for Disposal (Amendments to PFRS 5, Noncurrent Assets
Held for Sale and Discontinued Operations). PFRS 5 is amended to clarify that:
(a) if an entity changes the method of disposal of an asset or disposal group - i.e.,
reclassifies an asset or disposal group from held-for-distribution to owners to
held-for-sale, or vice versa, without any time lag - the change in classification is
considered a continuation of the original plan of disposal and the entity continues
to apply held-for-distribution or held-for-sale accounting. At the time of the
change in method, the entity measures the carrying amount of the asset or
disposal group and recognizes any write-down (impairment loss) or subsequent
increase in the fair value of the asset or disposal group, less costs to sell or
distribute; and (b) if an entity determines that an asset or disposal group no
longer meets the criteria to be classified as held-for-distribution, then it ceases
held-for-distribution accounting in the same way as it would cease held-for-sale
accounting. Any change in method of disposal or distribution does not, in itself,
extend the period in which a sale has to be completed. The amendments to
PFRS 5 are applied prospectively in accordance with PAS 8, Accounting
Policies, Changes in Accounting Estimates and Errors.
o Disclosure of information “elsewhere in the interim financial report’
(Amendment to PAS 34). PAS 34 is amended to clarify that certain disclosures, if
they are not included in the notes to interim financial statements, may be
disclosed “elsewhere in the interim financial report” – i.e., incorporated by cross-
reference from the interim financial statements to another part of the interim
financial report (e.g., management commentary or risk report). The interim
financial report is incomplete if the interim financial statements and any
disclosure incorporated by cross reference are not made available to users of the
interim financial statements on the same terms and at the same time. The
amendment to PAS 34 is applied retrospectively, in accordance with PAS 8.
Except as otherwise indicated, the adoption of these foregoing amended standards did not
have a material effect on the interim consolidated financial statements.

- 3 -
New and Amended Standards Not Yet Adopted
A number of new and amended standards are effective for annual periods beginning after
January 1, 2016 and have not been applied in preparing the interim consolidated financial
statements. Unless otherwise indicated, none of these is expected to have a significant effect
on the interim consolidated financial statements.
The Group will adopt the following new and amended standards on the respective effective
dates:
PFRS 9 (2014), Financial Instruments, replaces PAS 39, Financial Instruments:
Recognition and Measurement, and supersedes the previously published versions
of PFRS 9 that introduced new classifications and measurement requirements (in
2009 and 2010) and a new hedge accounting model (in 2013). PFRS 9 includes
revised guidance on the classification and measurement of financial assets, including
a new expected credit loss model for calculating impairment of all financial assets
that are not measured at FVPL, which generally depends on whether there has been a
significant increase in credit risk since initial recognition of a financial asset, and
supplements the new general hedge accounting requirements published in 2013. The
new model on hedge accounting requirements provides significant improvements by
aligning hedge accounting more closely with risk management. The new standard is
required to be applied retrospectively for annual periods beginning on or after
January 1, 2018. Early adoption is permitted.
PFRS 16, Leases, supersedes PAS 17, Leases, and the related Philippine
Interpretations. The new standard introduces a single lease accounting model for
lessees under which all major leases are recognized on-balance sheet, removing the
lease classification test. Lease accounting for lessors essentially remains unchanged
except for a number of details including the application of the new lease definition,
new sale-and-leaseback guidance, new sub-lease guidance and new disclosure
requirements. Practical expedients and targeted reliefs were introduced including an
optional lessee exemption for short-term leases (leases with a term of 12 months or
less) and low-value items, as well as the permission of portfolio-level accounting
instead of applying the requirements to individual leases. New estimates and
judgmental thresholds that affect the identification, classification and measurement
of lease transactions, as well as requirements to reassess certain key estimates and
judgments at each reporting date were introduced. PFRS 16 is effective for annual
periods beginning on or after January 1, 2019. Earlier application is not permitted
until the FRSC has adopted PFRS 15, Revenue from Contracts with Customers. The
Group is currently assessing the potential impact of PFRS 16 and plans to adopt this
new standard on leases on the required effective date once adopted locally.
PFRS 15, replaces PAS 11, Construction Contracts, PAS 18, Revenue, IFRIC 13,
Customer Loyalty Programmes, IFRIC 18, Transfer of Assets from Customers and
Standard Interpretation Committee - 31, Revenue - Barter Transactions Involving
Advertising Services. The new standard introduces a new revenue recognition model
for contracts with customers which specifies that revenue should be recognized when
(or as) a company transfers control of goods or services to a customer at the amount
to which the company expects to be entitled. Depending on whether certain criteria
are met, revenue is recognized over time, in a manner that best reflects the
company’s performance, or at a point in time, when control of the goods or services
is transferred to the customer. The standard does not apply to insurance contracts,
financial instruments or lease contracts, which fall in the scope of other PFRS. It also
does not apply if two companies in the same line of business exchange nonmonetary

- 4 -
assets to facilitate sales to other parties. Furthermore, if a contract with a customer is
partly in the scope of another PFRS, then the guidance on separation and
measurement contained in the other PFRS takes precedence.
However, the FRSC has yet to issue/approve this new revenue standard for local
adoption pending completion of a study by the Philippine Interpretations Committee
on its impact on the real estate industry. If approved, the standard is effective for
annual periods beginning on or after January 1, 2018, with early adoption permitted.
Philippine Interpretation IFRIC 15, Agreements for the Construction of Real Estate,
applies to the accounting for revenue and associated expenses by entities that
undertake the construction of real estate directly or through subcontractors. It
provides guidance on the recognition of revenue among real estate developers for
sale of units, such as apartments or houses, ‘off plan’; i.e., before construction is
completed. It also provides guidance on how to determine whether an agreement for
the construction of real estate is within the scope of PAS 11 or PAS 18 and the
timing of revenue recognition. The SEC issued a notice dated August 5, 2011 that
defers the adoption of this interpretation indefinitely.
Disclosure initiative (Amendments to PAS 7, Statement of Cash Flows). The
amendments address financial statements users’ requests for improved disclosures
about an entity’s net debt relevant to understanding an entity’s cash flows. The
amendments require entities to provide disclosures that enable users of the
consolidated financial statements to evaluate changes in liabilities arising from
financing activities, including both changes arising from cash flows and non-cash
changes – e.g. by providing a reconciliation between the opening and closing
balances in the consolidated statements of financial position for liabilities arising
from financing activities. If the required disclosure is provided in combination with
disclosures of changes in other assets and liabilities, it shall disclose the changes in
liabilities arising from financing activities separately from changes in those other
assets and liabilities. On February 17, 2016, the FRSC has adopted the amendments
to PAS 7, which apply prospectively for annual periods beginning on or after
January 1, 2017 with early adoption permitted. When the Group first applies those
amendments, it is not required to provide comparative information for preceding
periods.
Recognition of Deferred Tax Assets for Unrealized Losses (Amendments to PAS 12).
The amendments clarify that:
the existence of a deductible temporary difference depends solely on a
comparison of the carrying amount of an asset and its tax base at the end of the
reporting period, and is not affected by possible future changes in the carrying
amount or expected manner of recovery of the asset;
the calculation of future taxable profit in evaluating whether sufficient taxable
profit will be available in future periods excludes tax deductions resulting from
the reversal of the deductible temporary differences;
the estimate of probable future taxable profit may include the recovery of some
of an entity's assets for more than their carrying amount if there is sufficient
evidence that it is probable that the entity will achieve this; and
an entity assesses a deductible temporary difference related to unrealized losses
in combination with all of its other deductible temporary differences, unless a tax
- 5 -
law restricts the utilization of losses to deduction against income of a specific
type.
On February 17, 2016, the FRSC has adopted the Amendments to PAS 12, which
will become effective for annual periods beginning on or after January 1, 2017.
Sale or Contribution of Assets between an Investor and its Associate or Joint Venture
(Amendments to PFRS 10, Consolidated Financial Statements, and PAS 28,
Investments in Associates). The amendments address an inconsistency in the
requirements in PFRS 10 and PAS 28 in dealing with the sale or contribution of
assets between an investor and its associate or joint venture. The amendments
require that a full gain or loss is recognized when a transaction involves a business
whether it is housed in a subsidiary or not. A partial gain or loss is recognized when
a transaction involves assets that do not constitute a business, even if these assets are
housed in a subsidiary.
Originally, the amendments apply prospectively for annual periods beginning on or
after January 1, 2016 with early adoption permitted. However on January 13, 2016,
the FRSC decided to postpone the effective date until the International Accounting
Standards Board has completed its broader review of the research project on equity
accounting that may result in the simplification of accounting for such transactions
and of other aspects of accounting for associates and joint ventures.
2. Segment Information
Operating Segments
The reporting format of the Group’s operating segments is determined based on the Group’s
risks and rates of return which are affected predominantly by differences in the products and
services produced. The operating businesses are organized and managed separately
according to the nature of the products produced and services provided, with each segment
representing a strategic business unit that offers different products and serves different
markets.
The Group’s reportable segments are beverage, food, packaging, energy, fuel and oil, and
infrastructure.
The beverage segment produces and markets alcoholic and non-alcoholic beverages.
The food segment includes, among others, poultry operations, livestock farming, and
processing and selling of meat products, processing and marketing of refrigerated and canned
meat products, manufacturing and marketing of feeds and flour products, cooking oil,
biscuits, breadfill desserts and dairy-based products, importation and marketing of coffee and
coffee-related products and grain terminal handling.
The packaging segment is involved in the production and marketing of packaging products
including, among others, glass containers, glass molds, polyethylene terephthalate (PET)
bottles and preforms, PET recycling, plastic closures, corrugated cartons, woven
polypropylene, kraft sacks and paperboard, pallets, flexible packaging, plastic crates, plastic
floorings, plastic films, plastic trays, plastic pails and tubs, metal closures and two-piece
aluminum cans, woven products, industrial laminates and radiant barriers. It is also involved
in crate and plastic pallet leasing, PET bottle filling graphics design, packaging research and
testing, packaging development and consultation, contract packaging and trading.

- 6 -
The energy segment is engaged in power generation, distribution and trading and coal
mining. The power generation assets supply electricity to a variety of customers, including
Manila Electric Company, electric cooperatives, industrial customers and the Philippine
Wholesale Electricity Spot Market.
The fuel and oil segment is engaged in refining and marketing of petroleum products.
The infrastructure segment is engaged in the business of construction and development of
various infrastructure projects such as airports, roads, highways, toll roads, freeways,
skyways, flyovers, viaducts and interchanges.
Inter-segment Transactions
Segment revenues, expenses and performance include sales and purchases between operating
segments. Transfer prices between operating segments are set on an arm’s length basis in a
manner similar to transactions with third parties. Such transactions are eliminated in
consolidation.

- 7 -
Financial information about reportable segments follows:
Beverage
Food
Packaging
Energy
Fuel and
Oil
Infrastructure
Others
Eliminations
Consolidated
2016 2015 2016 2015 2016 2015 2016 2015 2016 2015 2016 2015 2016 2015 2016 2015 2016 2015
Sales
External sales P55,719 P46,757 P53,112 P50,504 P10,156 P9,736 P36,052 P36,079 P158,132 P183,447 P9,779 P5,335 P6,218 P2,218 P – P – P329,168 P334,076
Inter-segment sales 91 498 42 4 3,355 2,277 5,020 4,376 3,731 2,604 – – 5,272 7,724 (17,511) (17,483) – –
Total sales P55,810 P47,255 P53,154 P50,508 13,511 12,013 P41,072 P40,455 P161,863 P186,051 P9,779 P5,335 P11,490 P9,942 (P17,511) (P17,483) P329,168 P334,076
Results
Segment results P12,988 P11,121 P3,602 P2,740 P1,331 P1,104 P15,741 P13,650 P11,479 P8,876 P5,035 P2,987 (P894) P575 (P529) P41 P48,753 P41,094

- 8 -
3. Discontinued Operations
On May 30, 2016, the Parent Company entered into agreements with Philippine Long
Distance Telephone Company (PLDT) and Globe Telecom, Inc. (Globe), respectively, for the
sale of 100% ownership interest of the Parent Company in Vega Telecom, Inc. (Vega) for
total amount of P30,004 million. Vega holds the telecommunications assets of the Parent
Company through its subsidiaries. In addition, advances by the Parent Company to Vega was
also assigned to PLDT and Globe, in the total amount of P22,077 million. The Parent
Company received P26,040 million or 50% of the proceeds from the sale of shares and
assignment of advances upon signing of the agreement. The payments of the remaining
balance will be made to the Parent Company at 25% of the proceeds each on December 1,
2016 and May 16, 2017.
The Parent Company booked a net gain from the transaction amounting to P6,948 million,
net of capital gains tax.
As required by PFRS 5, Noncurrent Assets Held for Sale and Discontinued Operations, the
financial performace of Vega and its subsidiaries for the period from Janaury 1 to May 30,
2016 and for the period ended June 30, 2015, were presented as a separate item under
“Income (loss) after income tax from discontinued operations” in the consolidated statements
of income. Accordingly, the comparable 2015 consolidated statement of income was restated.
The result of discontinued operations is presented below:
2016 2015
Net sales P818 P815
Cost of sales 389 414
Gross profit 429 401
Selling and administrative expenses (1,380) (767)
Interest expense and other financing charges (6) (2)
Interest income 14 11
Equity in net losses of associates - (198)
Other income - net 136 32
Loss before income tax (807) (523)
Income tax expense 175 86
Loss from discontinued operations (982) (609)
Gain on sale of investment - net of tax of P772 12,800 -
Net income (loss) from discontinued operations 11,818 (609)
Attributable to:
Equity holders of the Parent Company 11,756 (651)
Non-controlling interests 62 42
P11,818 (P609)
Basic and diluted earnings per common share from discontinued operations, attributable to
equity holders of the Parent Company, are presented in Note 7.
Cash flows provided by (used in) discontinued operations are presented below: 2016 2015
Net cash flows used in operating activities (P419) (P83)
Net cash flows provided by (used in) investing activities 20,492 (1,649)
Net cash flows used in financing activities (1,220) -
Net cash flows provided by (used in) discontinued operations P18,853 (P1,732)

- 9 -
The effect of disposal on the financial position follows:
2016
Assets
Cash and cash equivalents P1,877
Trade and other receivables - net 1,516
Inventories 258
Prepaid expenses and other current assets 3,185
Investments and advances - net 8
Available-for-sale financial assets 2
Property, plant and equipment - net 13,141
Goodwill - net 734
Other intangible assets - net 23,843
Deferred tax assets 103
Other noncurrent assets - net 236
Liabilities
Accounts payable and accrued expenses (509)
Income and other taxes payable (242)
Deferred tax liabilities (257)
Other noncurrent liabilities (4,557)
Non-controlling interests (852)
Reserve for retirement plan 14
Net assets disposed of P38,500
Cash consideration received P26,040
Transaction cost (9)
Cash and cash equivalents disposed of (1,877)
Net cash flows P24,154
4. Other Income (Charges)
Other income (charges) consists of:
June 30
2016 2015
Gain (loss) on foreign exchange - net P841 (P1,369)
Construction revenue 4,983 3,931
Loss on derivatives - net (1,079) (785)
Construction costs (4,983) (3,931)
Others (37) (39)
(P275) (P2,193)
Construction revenue is recognized by reference to the stage of completion of the
construction activity at the reporting date. When it is probable that the total contract costs
will exceed total contract revenue, the expected loss is recognized as an expense
immediately.
Construction costs pass through the profit or loss before it is capitalized as toll road and
airport concession rights.
- 10 -
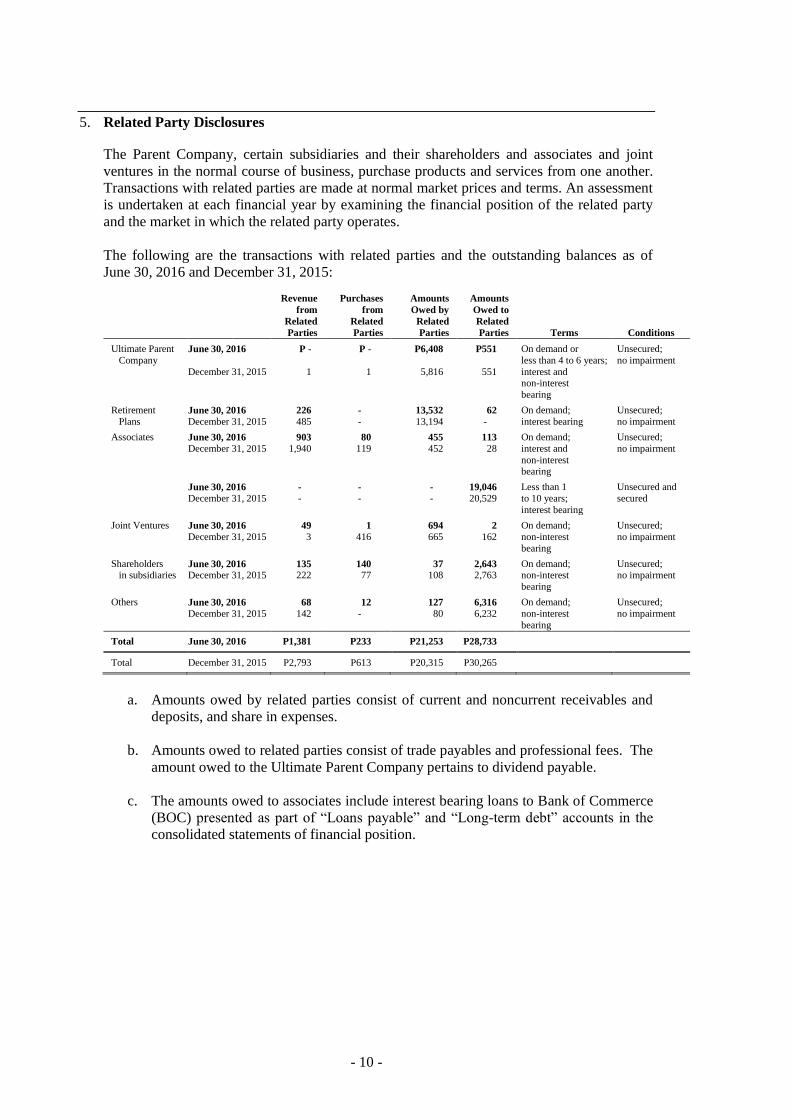
5. Related Party Disclosures
The Parent Company, certain subsidiaries and their shareholders and associates and joint
ventures in the normal course of business, purchase products and services from one another.
Transactions with related parties are made at normal market prices and terms. An assessment
is undertaken at each financial year by examining the financial position of the related party
and the market in which the related party operates.
The following are the transactions with related parties and the outstanding balances as of
June 30, 2016 and December 31, 2015:
Revenue
from
Related
Parties
Purchases
from
Related
Parties
Amounts
Owed by
Related
Parties
Amounts
Owed to
Related
Parties Terms Conditions
Ultimate Parent
Company June 30, 2016 P - P - P6,408 P551 On demand or
less than 4 to 6 years;
Unsecured;
no impairment
December 31, 2015 1 1 5,816 551 interest and non-interest
bearing
Retirement June 30, 2016 226 - 13,532 62 On demand; Unsecured;
Plans December 31, 2015 485 - 13,194 - interest bearing no impairment
Associates June 30, 2016 903 80 455 113 On demand; Unsecured;
December 31, 2015 1,940 119 452 28 interest and
non-interest
no impairment
bearing
June 30, 2016 - - - 19,046 Less than 1 Unsecured and
December 31, 2015 - - - 20,529 to 10 years; secured
interest bearing
Joint Ventures June 30, 2016 49 1 694 2 On demand; Unsecured;
December 31, 2015 3 416 665 162 non-interest
no impairment
bearing
Shareholders June 30, 2016 135 140 37 2,643 On demand; Unsecured; in subsidiaries December 31, 2015 222 77 108 2,763 non-interest no impairment
bearing
Others June 30, 2016 68 12 127 6,316 On demand; Unsecured;
December 31, 2015 142 - 80 6,232 non-interest no impairment
bearing
Total June 30, 2016 P1,381 P233 P21,253 P28,733
Total December 31, 2015 P2,793 P613 P20,315 P30,265
a. Amounts owed by related parties consist of current and noncurrent receivables and
deposits, and share in expenses.
b. Amounts owed to related parties consist of trade payables and professional fees. The
amount owed to the Ultimate Parent Company pertains to dividend payable.
c. The amounts owed to associates include interest bearing loans to Bank of Commerce
(BOC) presented as part of “Loans payable” and “Long-term debt” accounts in the
consolidated statements of financial position.
- 11 -
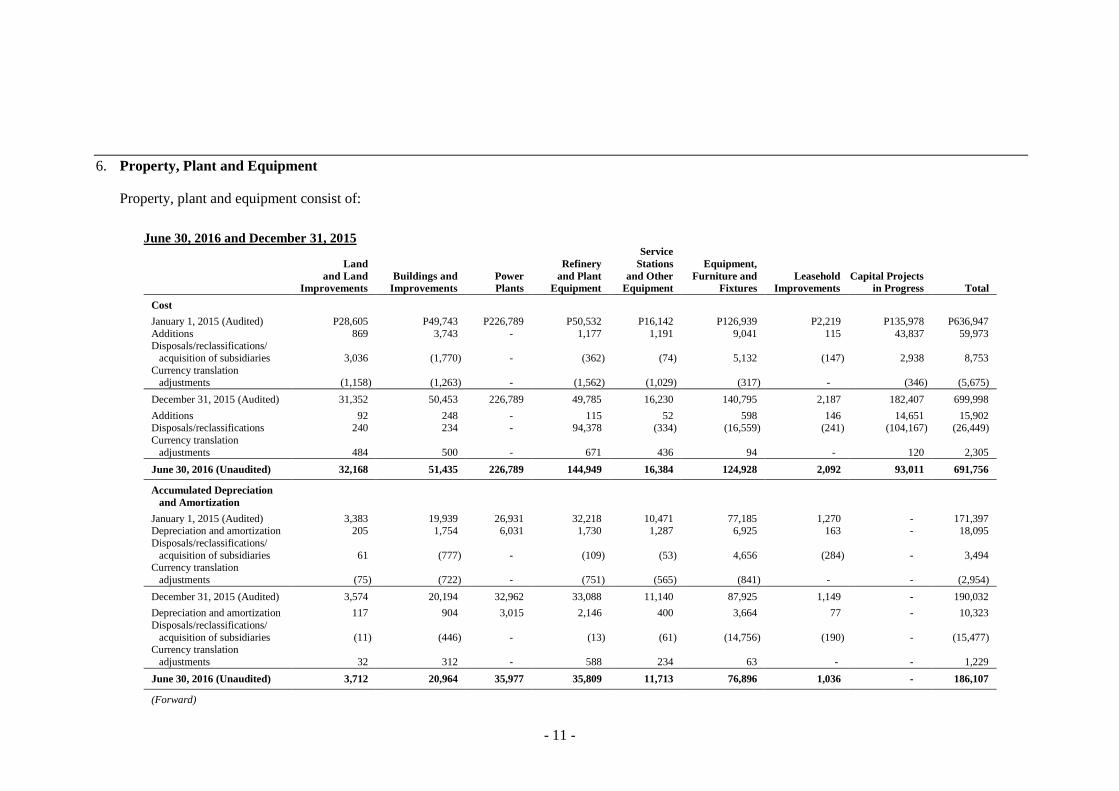
6. Property, Plant and Equipment
Property, plant and equipment consist of:
June 30, 2016 and December 31, 2015
Land
and Land
Improvements
Buildings and
Improvements
Power
Plants
Refinery
and Plant
Equipment
Service
Stations
and Other
Equipment
Equipment,
Furniture and
Fixtures
Leasehold
Improvements
Capital Projects
in Progress Total
Cost
January 1, 2015 (Audited) P28,605 P49,743 P226,789 P50,532 P16,142 P126,939 P2,219 P135,978 P636,947
Additions 869 3,743 - 1,177 1,191 9,041 115 43,837 59,973 Disposals/reclassifications/
acquisition of subsidiaries 3,036 (1,770) - (362) (74) 5,132 (147) 2,938 8,753
Currency translation adjustments (1,158) (1,263) - (1,562) (1,029) (317) - (346) (5,675)
December 31, 2015 (Audited) 31,352 50,453 226,789 49,785 16,230 140,795 2,187 182,407 699,998
Additions 92 248 - 115 52 598 146 14,651 15,902
Disposals/reclassifications 240 234 - 94,378 (334) (16,559) (241) (104,167) (26,449)
Currency translation
adjustments 484 500 - 671 436 94 - 120 2,305
June 30, 2016 (Unaudited) 32,168 51,435 226,789 144,949 16,384 124,928 2,092 93,011 691,756
Accumulated Depreciation
and Amortization
January 1, 2015 (Audited) 3,383 19,939 26,931 32,218 10,471 77,185 1,270 - 171,397 Depreciation and amortization 205 1,754 6,031 1,730 1,287 6,925 163 - 18,095
Disposals/reclassifications/
acquisition of subsidiaries 61 (777) - (109) (53) 4,656 (284) - 3,494 Currency translation
adjustments (75) (722) - (751) (565) (841) - - (2,954)
December 31, 2015 (Audited) 3,574 20,194 32,962 33,088 11,140 87,925 1,149 - 190,032
Depreciation and amortization 117 904 3,015 2,146 400 3,664 77 - 10,323
Disposals/reclassifications/
acquisition of subsidiaries (11) (446) - (13) (61) (14,756) (190) - (15,477) Currency translation
adjustments 32 312 - 588 234 63 - - 1,229
June 30, 2016 (Unaudited) 3,712 20,964 35,977 35,809 11,713 76,896 1,036 - 186,107
(Forward)

- 12 -
Land
and Land
Improvements
Buildings and
Improvements
Power
Plants
Refinery
and Plant
Equipment
Service
Stations
and Other
Equipment
Equipment,
Furniture and
Fixtures
Leasehold
Improvements
Capital Projects
in Progress Total
Accumulated Impairment
Losses
January 1, 2015 (Audited) P266 P2,270 P - P - P - P7,690 P1 P - P10,227
Impairment - 202 - - - 2,129 - - 2,331 Disposals and reclassifications - - - - - (9) - - (9)
Currency translation
adjustments - (22) - - - 87 - - 65
December 31, 2015 (Audited) 266 2,450 - - - 9,897 1 - 12,614
Disposals and reclassifications - (6) - - - (1,327) - - (1,333)
Currency translation
adjustments - (52) - - - (122) - - (174)
June 30, 2016 (Unaudited) 266 2,392 - - - 8,448 1 - 11,107
Carrying Amount
December 31, 2015 (Audited) P27,512 P27,809 P193,827 P16,697 P5,090 P42,973 P1,037 P182,407 P497,352
June 30, 2016 (Unaudited) P28,190 P28,079 P190,812 P109,140 P4,671 P39,584 P1,055 P93,011 P494,542
June 30, 2015
Land
and Land
Improvements
Buildings and
Improvements
Power
Plants
Refinery
and Plant
Equipment
Service
Stations
and Other
Equipment
Equipment,
Furniture and
Fixtures
Leasehold
Improvements
Capital Projects
in Progress Total
Cost
January 1, 2015 (Audited) P28,605 P49,743 P226,789 P50,532 P16,142 P126,939 P2,219 P135,978 P636,947
Additions 318 351 - 301 895 2,214 22 21,109 25,210
Disposals/reclassifications/ acquisition of subsidiaries 1,142 (1,477) - (2) (157) (3,003) 179 1,465 (1,853)
Currency translation
adjustments (545) (606) - (723) (476) (231) - (165) (2,746)
June 30, 2015 (Unaudited) 29,520 48,011 226,789 50,108 16,404 125,919 2,420 158,387 657,558
(Forward)

- 13 -
Land
and Land
Improvements
Buildings and
Improvements
Power
Plants
Refinery
and Plant
Equipment
Service
Stations
and Other
Equipment
Equipment,
Furniture and
Fixtures
Leasehold
Improvements
Capital Projects
in Progress Total
Accumulated Depreciation
and Amortization
January 1, 2015 (Audited) P3,383 P19,939 P26,931 P32,218 P10,471 P77,185 P1,270 P - P171,397
Depreciation and amortization 100 854 3,015 946 682 3,139 81 - 8,817
Disposals/reclassifications/
acquisition of subsidiaries 64 (937) - (2) (49) (1,313) (160) - (2,397)
Currency translation adjustments (39) (348) - (328) (259) (466) - - (1,440)
June 30, 2015 (Unaudited) 3,508 19,508 29,946 32,834 10,845 78,545 1,191 - 176,377
Accumulated Impairment
Losses
January 1, 2015 (Audited) 266 2,270 - - - 7,690 1 - 10,227
Currency translation
adjustments - 22 - - - 65 - - 87
June 30, 2015 (Unaudited) 266 2,292 - - - 7,755 1 - 10,314
Carrying Amount
June 30, 2015 (Unaudited) P25,746 P26,211 P196,843 P17,274 P5,559 P39,619 P1,228 P158,387 P470,867
Depreciation and amortization charged to operations amounted to P10,323 and P8,817 for the periods ended June 30, 2016 and 2015, respectively.

- 14 -
7. Basic and Diluted Earnings Per Share (EPS)
Basic EPS is computed by dividing the net income for the period attributable to equity holders of
the Parent Company, net of dividends on preferred shares, by the weighted average number of
issued and outstanding common shares during the period, with retroactive adjustment for any
stock dividends declared.
Diluted EPS is computed in the same manner, adjusted for the effects of the shares issuable to
employees and executives under the LTIP of the Parent Company, which are assumed to be
exercised at the date of grant.
Where the effect of the assumed conversion of shares issuable to employees and executives under
the stock purchase and option plans of the Parent Company would be anti-dilutive, diluted EPS is
not presented.
Basic and diluted EPS is computed as follows:
June 30
Note 2016 2015
Net income from continuing operations
attributable to equity holders of the
Parent Company P12,778 P9,386
Less dividends on preferred shares for the period (a) 3,186 3,302
Net income from continuing operations
attributable to equity holders of the
Parent Company (a) 9,592 6,084
Net income (loss) from discontinued operations
attributable to equity holders of the
Parent Company (b) 3 11,756 (651)
Net income attributable to common
shareholders of the Parent Company P21,348 P5,433
Weighted average number of common
shares outstanding (in millions) - basic (c) 2,379 2,378
Effect of dilution - common 7 13
Weighted average number of common shares
outstanding (in millions) - diluted (d) 2,386 2,391
Earnings per common share attributable to equity
holders of the Parent Company
Basic EPS from continuing operations (a/c) P4.03 P2.56
Basic EPS from discontinued operations (b/c) 4.94 (0.28)
P8.97 P2.28
Diluted EPS from continuing operations (a/d) P4.02 P2.54
Diluted EPS from discontinued operations (b/d) 4.93 (0.27)
P8.95 P2.27

- 15 -
8. Dividends
The Board of Directors (BOD) of the Parent Company approved the declaration and
payment of the following cash dividends to common and preferred stockholders as
follows:
June 30, 2016
Date of Declaration Date of Record Date of Payment
Dividend per
Share
Common
March 17, 2016 April 8, 2016 May 4, 2016 P0.35
June 14, 2016 July 1, 2016 July 27, 2016 P0.35
Preferred
SMC2B January 15, 2016 March 21, 2016 April 5, 2016 1.4296875
May 12, 2016 June 21, 2016 July 6, 2016 1.4296875
SMC2C January 15, 2016 March 21, 2016 April 5, 2016 1.50
May 12, 2016 June 21, 2016 July 6, 2016 1.50
SMC2D January 15, 2016 March 21, 2016 April 5, 2016 1.11433125
May 12, 2016 June 21, 2016 July 6, 2016 1.11433125
SMC2E January 15, 2016 March 21, 2016 April 5, 2016 1.18603125
May 12, 2016 June 21, 2016 July 6, 2016 1.18603125
SMC2F January 15, 2016 March 21, 2016 April 5, 2016 1.27635
May 12, 2016 June 21, 2016 July 6, 2016 1.27635
SMC2G May 12, 2016 June 21, 2016 July 6, 2016 1.23361875
SMC2H May 12, 2016 June 21, 2016 July 6, 2016 1.1854125
SMC2I May 12, 2016 June 21, 2016 July 6, 2016 1.18790625
SMCP1 January 15, 2016 March 21, 2016 April 5, 2016 1.0565625
May 12, 2016 June 21, 2016 July 6, 2016 1.0565625
June 30, 2015
Date of Declaration Date of Record Date of Payment
Dividend per
Share
Common
April 22, 2015 May 8, 2015 May 20, 2015 P0.35
Preferred
SMC2A May 14, 2015 May 29, 2015 June 11, 2015 1.40625
SMC2B May 14, 2015 May 29, 2015 June 11, 2015 1.4296875
SMC2C May 14, 2015 May 29, 2015 June 11, 2015 1.50
SMCP1 June 9, 2015 June 26, 2015 July 8, 2015 1.0546
Cash dividends declared on December 11, 2014 to all common shareholders as of January 7, 2015
at P0.35 per share were paid on February 2, 2015.
Cash dividends declared on November 10, 2014 to all Series “2” - Subseries “2-A”, Subseries “2-
B” and Subseries “2-C” preferred shareholders as of February 27, 2015 at P1.40625, P1.4296875
and P1.5 per share, respectively, were paid on March 25, 2015.
9. Financial Risk and Capital Management Objectives and Policies
Objectives and Policies
The Group has significant exposure to the following financial risks primarily from its use of
financial instruments:
Interest Rate Risk
Foreign Currency Risk
Commodity Price Risk

- 16 -
Liquidity Risk
Credit Risk
This note presents information about the exposure to each of the foregoing risks, the objectives,
policies and processes for measuring and managing these risks, and for management of capital.
The principal non-trade related financial instruments of the Group include cash and cash
equivalents, option deposit, AFS financial assets, financial assets at FVPL, restricted cash, short-
term and long-term loans, and derivative instruments. These financial instruments, except
financial assets at FVPL and derivative instruments, are used mainly for working capital
management purposes. The trade-related financial assets and financial liabilities of the Group
such as trade and other receivables, noncurrent receivables and deposits, accounts payable and
accrued expenses, finance lease liabilities and other noncurrent liabilities arise directly from and
are used to facilitate its daily operations.
The outstanding derivative instruments of the Group such as commodity and currency options,
forwards and swaps are intended mainly for risk management purposes. The Group uses
derivatives to manage its exposures to foreign currency, interest rate and commodity price risks
arising from the operating and financing activities.
The BOD has the overall responsibility for the establishment and oversight of the risk
management framework of the Group. The BOD has established the Risk Management
Committee, which is responsible for developing and monitoring the risk management policies.
The committee reports regularly to the BOD on its activities.
The risk management policies of the Group are established to identify and analyze the risks faced
by the Group, to set appropriate risk limits and controls, and to monitor risks and adherence to
limits. Risk management policies and systems are reviewed regularly to reflect changes in
market conditions and activities. The Group, through its training and management standards and
procedures, aims to develop a disciplined and constructive control environment in which all
employees understand their roles and obligations.
The BOD constituted the Audit Committee to assist the BOD in fulfilling its oversight
responsibility of the Group’s corporate governance process relating to the: a) quality and integrity
of the financial statements and financial reporting process and the systems of internal accounting
and financial controls; b) performance of the internal auditors; c) annual independent audit of the
financial statements, the engagement of the independent auditors and the evaluation of the
independent auditors’ qualifications, independence and performance; d) compliance with legal
and regulatory requirements, including the disclosure control and procedures; e) evaluation of
management’s process to assess and manage the enterprise risk issues; and f) fulfillment of the
other responsibilities set out by the BOD. The Audit Committee shall also prepare the reports
required to be included in the annual report of the Group.
The Audit Committee also oversees how management monitors compliance with the risk
management policies and procedures of the Group and reviews the adequacy of the risk
management framework in relation to the risks faced by the Group. The Audit Committee is
assisted in its oversight role by Internal Audit. Internal Audit undertakes both regular and ad hoc
reviews of risk management controls and procedures, the results of which are reported to the
Audit Committee.
The accounting policies in relation to derivatives are set out in Note 10 to the selected notes to the
consolidated financial statements.

- 17 -
Interest Rate Risk
Interest rate risk is the risk that future cash flows from a financial instrument (cash flow interest
rate risk) or its fair value (fair value interest rate risk) will fluctuate because of changes in market
interest rates. The Group’s exposure to changes in interest rates relates primarily to the long-term
borrowings and investment securities. Investments acquired or borrowings issued at fixed rates
expose the Group to fair value interest rate risk. On the other hand, investment securities
acquired or borrowings issued at variable rates expose the Group to cash flow interest rate risk.
The Group manages its interest cost by using an optimal combination of fixed and variable rate
debt instruments. Management is responsible for monitoring the prevailing market-based interest
rate and ensures that the mark-up rates charged on its borrowings are optimal and benchmarked
against the rates charged by other creditor banks.
On the other hand, the investment policy of the Group is to maintain an adequate yield to match
or reduce the net interest cost from its borrowings pending the deployment of funds to their
intended use in the operations and working capital management. However, the Group invests only
in high-quality securities while maintaining the necessary diversification to avoid concentration
risk.
In managing interest rate risk, the Group aims to reduce the impact of short-term fluctuations on
the earnings. Over the longer term, however, permanent changes in interest rates would have an
impact on profit or loss.
The management of interest rate risk is also supplemented by monitoring the sensitivity of the
Group’s financial instruments to various standard and non-standard interest rate scenarios.
The sensitivity to a reasonably possible 1% increase in the interest rates, with all other variables
held constant, would have decreased the Group’s profit before tax (through the impact on floating
rate borrowings) by P1,784 and P1,933 for the period ended June 30, 2016 and for the year ended
December 31, 2015, respectively. A 1% decrease in the interest rate would have had the equal
but opposite effect. These changes are considered to be reasonably possible given the
observation of prevailing market conditions in those periods. There is no impact on the Group’s
other comprehensive income.

- 18 -
Interest Rate Risk Table
The terms and maturity profile of the interest-bearing financial instruments, together with its gross amounts, are shown in the following tables:
June 30, 2016 <1 Year 1-2 Years >2-3 Years >3-4 Years >4-5 Years >5 Years Total
Fixed Rate
Philippine peso-denominated P9,146 P28,191 P24,032 P11,957 P27,733 P52,038 P153,097
Interest rate 5.65% - 8.74899% 5.65% - 8.74899% 5.5% - 10.50% 5.65% - 8.74899% 4.9925% - 8.74899% 5.50% - 8.74899%
Foreign currency-denominated
(expressed in Philippine peso) 68 - - - - 24,301 24,369
Interest rate 12.45% - 13.27% - - - - 4.875%
Floating Rate
Philippine peso-denominated 1,136 1,295 1,254 733 545 1,642 6,605
Interest rate PDST-R + margin
or BSP overnight
rate, whichever is
higher
PDST-R +
margin or BSP
overnight rate,
whichever is
higher
PDST-R + margin
or BSP overnight
rate, whichever is
higher
PDST-R + margin
or BSP overnight
rate, whichever is
higher
PDST-R + margin or
5,75%, whichever
is higher
PDST-R + margin or
5.75%, whichever is
higher
Foreign currency-denominated
(expressed in Philippine peso) 2,267 85,745 48,714 8,582 19,367 7,131 171,806
Interest rate LIBOR + margin,
COF + margin
LIBOR +
margin, COF +
margin
LIBOR + margin,
COF + margin
LIBOR + margin,
COF + margin
LIBOR + margin
LIBOR + margin
P12,617 P115,231 P74,000 P21,272 P47,645 P85,112 P355,877
December 31, 2015 <1 Year 1-2 Years >2-3 Years >3-4 Years >4-5 Years >5 Years Total
Fixed Rate
Philippine peso-denominated P6,060 P29,399 P9,643 P23,426 P13,730 P58,854 P141,112
Interest rate 5.65% - 8.74899% 5.65% - 8.74899% 5.65% - 8.74899% 5.50% - 10.50% 4.9925% - 8.74899% 5.50% - 8.74899% Foreign currency-denominated
(expressed in Philippine peso) 14,021 - - - - 24,301 38,322
Interest rate 7% - 13.27% - - - - 4.875%
Floating Rate
Philippine peso-denominated 1,096 1,215 1,303 1,059 545 1,915 7,133 Interest rate PDST-R + margin
or BSP overnight
rate, whichever is higher
PDST-R + margin
or BSP overnight
rate, whichever is higher
PDST-R + margin
or BSP overnight
rate, whichever is higher
PDST-R + margin
or BSP overnight
rate, whichever is higher
PDST-R + margin or
5,75%, whichever
is higher
PDST-R + margin or
5.75%, whichever is
higher
Foreign currency-denominated
(expressed in Philippine peso) 16,672 11,181 126,410 11,046 20,901 - 186,210 Interest rate LIBOR + margin,
COF + margin
LIBOR + margin,
COF + margin
LIBOR + margin,
COF + margin
LIBOR + margin,
COF + margin
LIBOR + margin,
P37,849 P41,795 P137,356 P35,531 P35,176 P85,070 P372,777

- 19 -
Foreign Currency Risk
The functional currency is the Philippine peso, which is the denomination of the bulk of the Group’s
revenues. The exposure to foreign currency risk results from significant movements in foreign
exchange rates that adversely affect the foreign currency-denominated transactions of the Group.
The risk management objective with respect to foreign currency risk is to reduce or eliminate
earnings volatility and any adverse impact on equity. The Group enters into foreign currency hedges
using a combination of non-derivative and derivative instruments such as foreign currency forwards,
options or swaps to manage its foreign currency risk exposure.
Short-term currency forward contracts (deliverable and non-deliverable) and options are entered into
to manage foreign currency risks arising from importations, revenue and expense transactions, and
other foreign currency-denominated obligations. Currency swaps are entered into to manage foreign
currency risks relating to long-term foreign currency-denominated borrowings.
Information on the Group’s foreign currency-denominated monetary assets and monetary liabilities
and their Philippine peso equivalents is as follows:
June 30, 2016 December 31, 2015
US
Dollar
Peso
Equivalent
US
Dollar
Peso
Equivalent
Assets
Cash and cash equivalents US$1,877 P88,363 US$1,766 P83,084
Trade and other receivables 765 36,001 866 40,098
Prepaid expenses and other
current assets - - 56 2,578
Noncurrent receivables 51 2,419 43 2,007
2,693 126,783 2,731 127,767
Liabilities
Loans payable 536 25,187 356 16,774
Accounts payable and
accrued expenses 899 42,353 851 40,064
Long-term debt (including
current maturities) 4,167 196,175 4,770 224,532
Finance lease liabilities
(including current portion) 1,970 92,723 2,058 96,843
Other noncurrent liabilities 89 4,204 1 33
7,661 360,642 8,036 378,246
Net foreign currency-
denominated monetary
liabilities (US$4,968) (P233,859) (US$5,305) (P250,479)
- 20 -
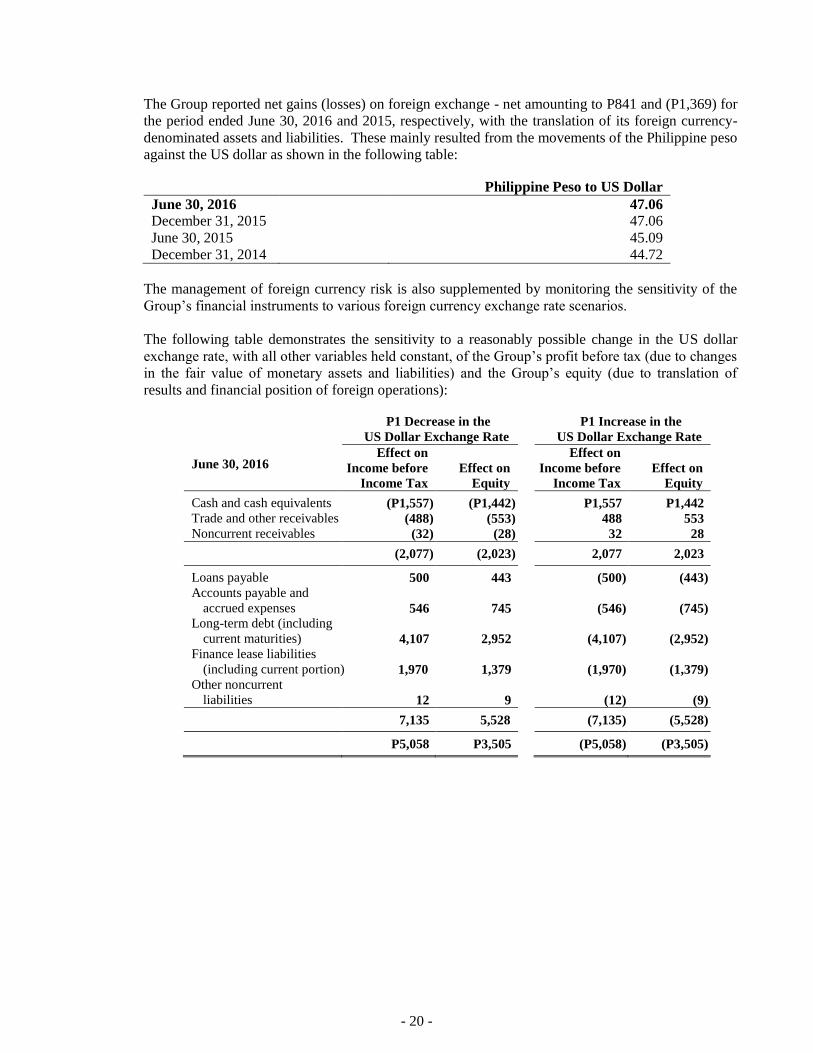
The Group reported net gains (losses) on foreign exchange - net amounting to P841 and (P1,369) for
the period ended June 30, 2016 and 2015, respectively, with the translation of its foreign currency-
denominated assets and liabilities. These mainly resulted from the movements of the Philippine peso
against the US dollar as shown in the following table:
Philippine Peso to US Dollar
June 30, 2016 47.06
December 31, 2015 47.06
June 30, 2015 45.09
December 31, 2014 44.72
The management of foreign currency risk is also supplemented by monitoring the sensitivity of the
Group’s financial instruments to various foreign currency exchange rate scenarios.
The following table demonstrates the sensitivity to a reasonably possible change in the US dollar
exchange rate, with all other variables held constant, of the Group’s profit before tax (due to changes
in the fair value of monetary assets and liabilities) and the Group’s equity (due to translation of
results and financial position of foreign operations):
P1 Decrease in the
US Dollar Exchange Rate
P1 Increase in the
US Dollar Exchange Rate
June 30, 2016
Effect on
Income before
Income Tax
Effect on
Equity
Effect on
Income before
Income Tax
Effect on
Equity
Cash and cash equivalents (P1,557) (P1,442) P1,557 P1,442
Trade and other receivables (488) (553) 488 553
Noncurrent receivables (32) (28) 32 28
(2,077) (2,023) 2,077 2,023
Loans payable 500 443 (500) (443)
Accounts payable and
accrued expenses 546 745 (546) (745)
Long-term debt (including
current maturities) 4,107 2,952 (4,107) (2,952)
Finance lease liabilities
(including current portion) 1,970 1,379 (1,970) (1,379)
Other noncurrent
liabilities 12 9 (12) (9)
7,135 5,528 (7,135) (5,528)
P5,058 P3,505 (P5,058) (P3,505)

- 21 -
P1 Decrease in the
US Dollar Exchange Rate
P1 Increase in the
US Dollar Exchange Rate
December 31, 2015
Effect on
Income before
Income Tax
Effect on
Equity
Effect on
Income before
Income Tax
Effect on
Equity
Cash and cash equivalents (P1,457) (P1,329) P1,457 P1,329
Trade and other receivables (689) (662) 689 662
Prepaid expenses and other
current assets (47) (42) 47 42
Noncurrent receivables (34) (36) 34 36
(2,227) (2,069) 2,227 2,069
Loans payable 240 284 (240) (284)
Accounts payable and
accrued expenses 529 692 (529) (692)
Long-term debt (including
current maturities) 4,360 3,462 (4,360) (3,462)
Finance lease liabilities
(including current portion) 2,058 1,441 (2,058) (1,441)
Other noncurrent
liabilities 1 1 (1) (1)
7,188 5,880 (7,188) (5,880)
P4,961 P3,811 (P4,961) (P3,811)
Exposures to foreign exchange rates vary during the period depending on the volume of overseas
transactions. Nonetheless, the analysis above is considered to be representative of the Group’s
foreign currency risk.
Commodity Price Risk
Commodity price risk is the risk that future cash flows from a financial instrument will fluctuate
because of changes in commodity prices. The Group enters into various commodity derivatives to
manage its price risks on strategic commodities. Commodity hedging allows stability in prices, thus
offsetting the risk of volatile market fluctuations. Through hedging, prices of commodities are fixed
at levels acceptable to the Group, thus protecting raw material cost and preserving margins. For
hedging transactions, if prices go down, hedge positions may show marked-to-market losses;
however, any loss in the marked-to-market position is offset by the resulting lower physical raw
material cost.
The Parent Company enters into commodity derivative transactions on behalf of its subsidiaries and
affiliates to reduce cost by optimizing purchasing synergies within the Group and managing
inventory levels of common materials.
Commodity Swaps, Futures and Options. Commodity swaps, futures and options are used to manage
the Group’s exposures to volatility in prices of certain commodities such as fuel oil, crude oil,
aluminum, soybean meal and wheat.
Commodity Forwards. The Group enters into forward purchases of various commodities. The
prices of the commodity forwards are fixed either through direct agreement with suppliers or by
reference to a relevant commodity price index.

- 22 -
Liquidity Risk
Liquidity risk pertains to the risk that the Group will encounter difficulty to meet payment
obligations when they fall under normal and stress circumstances.
The Group’s objectives to manage its liquidity risk are as follows: a) to ensure that adequate funding
is available at all times; b) to meet commitments as they arise without incurring unnecessary costs;
c) to be able to access funding when needed at the least possible cost; and d) to maintain an adequate
time spread of refinancing maturities.
The Group constantly monitors and manages its liquidity position, liquidity gaps and surplus on a
daily basis. A committed stand-by credit facility from several local banks is also available to ensure
availability of funds when necessary. The Group also uses derivative instruments such as forwards
and swaps to manage liquidity.
The table below summarizes the maturity profile of the Group’s financial assets and financial
liabilities based on contractual undiscounted receipts and payments used for liquidity management.
June 30, 2016
Carrying
Amount
Contractual
Cash Flow
1 Year or
Less
> 1 Year -
2 Years
> 2 Years -
5 Years
Over
5 Years
Financial Assets
Cash and cash equivalents P189,679 P189,679 P189,679 P - P - P -
Trade and other receivables - net 125,115 125,115 125,115 - - -
Derivative assets (included under “Prepaid expenses and other
current assets” account) 872 872 872 - - -
Financial assets at FVPL (included under “Prepaid
expenses and other current
assets” account) 152 152 152 - - -
AFS financial assets (including
current portion presented under
“Prepaid expenses and other
current assets” account) 41,949 41,982 74 41,604 181 123
Noncurrent receivables and
deposits - net (included under “Other noncurrent assets”
account) 12,975 12,975 - 2,122 148 10,705
Restricted cash (included under “Prepaid expenses and other
current assets” and “Other
noncurrent assets” accounts) 5,812 5,812 2,838 2,974 - -
Financial Liabilities
Loans payable 148,403 148,993 148,993 - - -
Accounts payable and accrued expenses (excluding current
retirement liabilities, derivative
liabilities and IRO) 104,680 104,680 104,680 - - -
Derivative liabilities (included
under “Accounts payable and
accrued expenses” account) 2,150 2,150 2,150 - - -
Long-term debt (including current
maturities) 351,495 423,078 29,496 129,765 167,788 96,029
Finance lease liabilities (including current portion) 172,382 220,065 23,915 24,185 79,832 92,133
Other noncurrent liabilities
(excluding noncurrent retirement liabilities, IRO and
ARO) 11,382 11,390 - 10,793 7 590

- 23 -
December 31, 2015 Carrying Amount
Contractual Cash Flow
1 Year or Less
> 1 Year - 2 Years
> 2 Years - 5 Years
Over 5 Years
Financial Assets
Cash and cash equivalents P180,758 P180,758 P180,758 P - P - P -
Trade and other receivables - net 100,727 100,727 100,727 - - - Derivative assets (included
under “Prepaid expenses
and other current assets” account) 391 391 391 - - -
Financial assets at FVPL
(included under “Prepaid expenses and other current
assets” account) 147 147 147 - - -
AFS financial assets (including current portion
presented under “Prepaid
expenses and other current assets” account) 41,616 41,647 85 41,172 213 177
Noncurrent receivables and
deposits - net (included under “Other noncurrent
assets” account) 9,389 9,473 - 2,587 1,089 5,797
Restricted cash (included under “Prepaid expenses
and other current assets” and “Other noncurrent
assets” accounts) 5,661 5,661 4,230 1,431 - -
Financial Liabilities Loans payable 146,859 147,633 147,633 - - -
Accounts payable and
accrued expenses (excluding current
retirement liabilities,
derivative liabilities and IRO) 99,794 99,794 99,794 - - -
Derivative liabilities
(included under “Accounts
payable and accrued
expenses” account) 2,581 2,581 2,581 - - -
Long-term debt (including current maturities) 368,377 439,427 54,480 56,767 232,745 95,435
Finance lease liabilities
(including current portion) 179,280 231,882 23,776 24,040 77,806 106,260 Other noncurrent liabilities
(excluding noncurrent
retirement liabilities, IRO and ARO) 18,371 18,376 - 17,831 4 541
Credit Risk
Credit risk is the risk of financial loss to the Group if a customer or counterparty to a financial
instrument fails to meet its contractual obligations, and arises principally from trade and other
receivables and investment securities. The Group manages its credit risk mainly through the
application of transaction limits and close risk monitoring. It is the Group’s policy to enter into
transactions with a wide diversity of creditworthy counterparties to mitigate any significant
concentration of credit risk.
The Group has regular internal control reviews to monitor the granting of credit and management of
credit exposures.
Trade and Other Receivables
The exposure to credit risk is influenced mainly by the individual characteristics of each customer.
However, management also considers the demographics of the Group’s customer base, including the

- 24 -
default risk of the industry and country in which customers operate, as these factors may have an
influence on the credit risk.
Goods are subject to retention of title clauses so that in the event of default, the Group would have a
secured claim. Where appropriate, the Group obtains collateral or arranges master netting
agreements.
The Group has established a credit policy under which each new customer is analyzed individually
for creditworthiness before the standard payment and delivery terms and conditions are offered. The
Group ensures that sales on account are made to customers with appropriate credit history. The
Group has detailed credit criteria and several layers of credit approval requirements before engaging
a particular customer or counterparty. The review includes external ratings, when available, and in
some cases bank references. Purchase limits are established for each customer and are reviewed on a
regular basis. Customers that fail to meet the benchmark creditworthiness may transact with the
Group only on a prepayment basis.
The Group establishes an allowance for impairment losses that represents its estimate of incurred
losses in respect of trade and other receivables. The main components of this allowance include a
specific loss component that relates to individually significant exposures, and a collective loss
component established for groups of similar assets in respect of losses that have been incurred but
not yet identified. The collective loss allowance is determined based on historical data of payment
statistics for similar financial assets.
Investments
The Group recognizes impairment losses based on specific and collective impairment tests, when
objective evidence of impairment has been identified either on an individual account or on a
portfolio level.
Financial information on the Group’s maximum exposure to credit risk, without considering the
effects of collaterals and other risk mitigation techniques, is presented below.
June 30, 2016 December 31, 2015
Cash and cash equivalents (excluding
cash on hand) P187,905 P178,581
Trade and other receivables - net 125,115 100,727
Derivative assets 872 391
Financial assets at FVPL 152 147
AFS financial assets 41,949 41,616
Noncurrent receivables and deposits - net 12,975 9,389
Restricted cash 5,812 5,661
P374,780 P336,512
The credit risk for cash and cash equivalents, option deposit, derivative assets, financial assets at
FVPL, AFS financial assets and restricted cash is considered negligible, since the counterparties are
reputable entities with high quality external credit ratings.
The Group’s exposure to credit risk arises from default of counterparty. Generally, the maximum
credit risk exposure of trade and other receivables and noncurrent receivables and deposits is its
carrying amount without considering collaterals or credit enhancements, if any. The Group has no
significant concentration of credit risk since the Group deals with a large number of homogenous
- 25 -
counterparties. The Group does not execute any credit guarantee in favor of any counterparty.
Financial and Other Risks Relating to Livestock
The Group is exposed to financial risks arising from the change in cost and supply of feed
ingredients and the selling prices of chicken, hogs and cattle and related products, all of which are
determined by constantly changing market forces such as supply and demand and other factors. The
other factors include environmental regulations, weather conditions and livestock diseases for which
the Group has little control. The mitigating factors are listed below:
The Group is subject to risks affecting the food industry, generally, including risks posed by
food spoilage and contamination. Specifically, the fresh meat industry is regulated by
environmental, health and food safety organizations and regulatory sanctions. The Group has
put into place systems to monitor food safety risks throughout all stages of manufacturing and
processing to mitigate these risks. Furthermore, representatives from the government regulatory
agencies are present at all times during the processing of dressed chicken, hogs and cattle in all
dressing and meat plants and issue certificates accordingly. The authorities, however, may
impose additional regulatory requirements that may require significant capital investment at
short notice.
The Group is subject to risks relating to its ability to maintain animal health status considering
that it has no control over neighboring livestock farms. Livestock health problems could
adversely impact production and consumer confidence. However, the Group monitors the health
of its livestock on a daily basis and proper procedures are put in place.
The livestock industry is exposed to risk associated with the supply and price of raw materials,
mainly grain prices. Grain prices fluctuate depending on the harvest results. The shortage in the
supply of grain will result in adverse fluctuation in the price of grain and will ultimately increase
the Group’s production cost. If necessary, the Group enters into forward contracts to secure the
supply of raw materials at a reasonable price.
Other Market Price Risk
The Group’s market price risk arises from its investments carried at fair value (financial assets at
FVPL and AFS financial assets). The Group manages its risk arising from changes in market price
by monitoring the changes in the market price of the investments.
Capital Management
The Group maintains a sound capital base to ensure its ability to continue as a going concern,
thereby continue to provide returns to stockholders and benefits to other stakeholders and to maintain
an optimal capital structure to reduce cost of capital.
The Group manages its capital structure and makes adjustments in the light of changes in economic
conditions. To maintain or adjust the capital structure, the Group may adjust the dividend payment
to shareholders, pay-off existing debts, return capital to shareholders or issue new shares.
The Group defines capital as paid-in capital stock, additional paid-in capital and retained earnings,
both appropriated and unappropriated. Other components of equity such as treasury stock,
cumulative translation adjustments, reserve for retirement plan and equity reserve are excluded from
capital for purposes of capital management.
The BOD has overall responsibility for monitoring capital in proportion to risk. Profiles for capital
ratios are set in the light of changes in the external environment and the risks underlying the Group’s

- 26 -
business, operation and industry.
The Group, except for BOC which is subject to certain capitalization requirements by the Bangko
Sentral ng Pilipinas, is not subject to externally imposed capital requirements.
10. Financial Assets and Financial Liabilities
Date of Recognition. The Group recognizes a financial asset or a financial liability in the
consolidated statements of financial position when it becomes a party to the contractual provisions of
the instrument. In the case of a regular way purchase or sale of financial assets, recognition is done
using settlement date accounting.
Initial Recognition of Financial Instruments. Financial instruments are recognized initially at fair
value of the consideration given (in case of an asset) or received (in case of a liability). The initial
measurement of financial instruments, except for those designated as at FVPL, includes transaction
costs.
‘Day 1’ Difference. Where the transaction price in a non-active market is different from the fair
value of other observable current market transactions in the same instrument or based on a valuation
technique whose variables include only data from observable market, the Group recognizes the
difference between the transaction price and the fair value (a ‘Day 1’ difference) in the consolidated
statements of income unless it qualifies for recognition as some other type of asset. In cases where
data used is not observable, the difference between the transaction price and model value is only
recognized in the consolidated statements of income when the inputs become observable or when the
instrument is derecognized. For each transaction, the Group determines the appropriate method of
recognizing the ‘Day 1’ difference amount.
Financial Assets
The Group classifies its financial assets, at initial recognition, in the following categories: financial
assets at FVPL, loans and receivables, AFS financial assets and held-to-maturity (HTM)
investments. The classification depends on the purpose for which the investments are acquired and
whether they are quoted in an active market. The Group determines the classification of its financial
assets at initial recognition and, where allowed and appropriate, re-evaluates such designation at
every reporting date.
Financial Assets at FVPL. A financial asset is classified as at FVPL if it is classified as held for
trading or is designated as such upon initial recognition. Financial assets are designated as at FVPL
if the Group manages such investments and makes purchase and sale decisions based on their fair
values in accordance with the documented risk management or investment strategy of the Group.
Derivative instruments (including embedded derivatives), except those covered by hedge accounting
relationships, are classified under this category.
Financial assets are classified as held for trading if they are acquired for the purpose of selling in the
near term.
Financial assets may be designated by management at initial recognition as at FVPL, when any of
the following criteria is met:
the designation eliminates or significantly reduces the inconsistent treatment that would
otherwise arise from measuring the assets or recognizing gains or losses on a different basis;

- 27 -
the assets are part of a group of financial assets which are managed and their performances are
evaluated on a fair value basis, in accordance with a documented risk management or investment
strategy; or
the financial instrument contains an embedded derivative, unless the embedded derivative does
not significantly modify the cash flows or it is clear, with little or no analysis, that it would not
be separately recognized.
The Group carries financial assets at FVPL using their fair values. Attributable transaction costs are
recognized in the consolidated statements of income as incurred. Fair value changes and realized
gains or losses are recognized in the consolidated statements of income. Fair value changes from
derivatives accounted for as part of an effective cash flow hedge are recognized in other
comprehensive income and presented in the consolidated statements of changes in equity. Any
interest earned is recognized as part of “Interest income” account in the consolidated statements of
income. Any dividend income from equity securities classified as at FVPL is recognized in the
consolidated statements of income when the right to receive payment has been established.
The Group’s derivative assets and financial assets at FVPL are classified under this category.
Loans and Receivables. Loans and receivables are non-derivative financial assets with fixed or
determinable payments and maturities that are not quoted in an active market. They are not entered
into with the intention of immediate or short-term resale and are not designated as AFS financial
assets or financial assets at FVPL.
Subsequent to initial measurement, loans and receivables are carried at amortized cost using the
effective interest rate method, less any impairment in value. Any interest earned on loans and
receivables is recognized as part of “Interest income” account in the consolidated statements of
income on an accrual basis. Amortized cost is calculated by taking into account any discount or
premium on acquisition and fees that are an integral part of the effective interest rate. The periodic
amortization is also included as part of “Interest income” account in the consolidated statements of
income. Gains or losses are recognized in the consolidated statements of income when loans and
receivables are derecognized or impaired.
Cash includes cash on hand and in banks which are stated at face value. Cash equivalents are short-
term, highly liquid investments that are readily convertible to known amounts of cash and are subject
to an insignificant risk of changes in value.
The Group’s cash and cash equivalents, trade and other receivables, option deposit, noncurrent
receivables and deposits, and restricted cash are included under this category.
AFS Financial Assets. AFS financial assets are non-derivative financial assets that are either
designated in this category or not classified in any of the other financial asset categories. Subsequent
to initial recognition, AFS financial assets are measured at fair value and changes therein, other than
impairment losses and foreign currency differences on AFS debt instruments, are recognized in other
comprehensive income and presented in the “Fair value reserve” account in the consolidated
statements of changes in equity. The effective yield component of AFS debt securities is reported as
part of “Interest income” account in the consolidated statements of income. Dividends earned on
holding AFS equity securities are recognized as dividend income when the right to receive the
payment has been established. When individual AFS financial assets are either derecognized or
impaired, the related accumulated unrealized gains or losses previously reported in the consolidated

- 28 -
statements of changes in equity are transferred to and recognized in the consolidated statements of
income.
AFS financial assets also include unquoted equity instruments with fair values which cannot be
reliably determined. These instruments are carried at cost less impairment in value, if any.
The Group’s investments in equity and debt securities are classified under this category.
Financial Liabilities
The Group classifies its financial liabilities, at initial recognition, in the following categories:
financial liabilities at FVPL and other financial liabilities. The Group determines the classification of
its financial liabilities at initial recognition and, where allowed and appropriate, re-evaluates such
designation at every reporting date. All financial liabilities are recognized initially at fair value and,
in the case of loans and borrowings, net of directly attributable transaction costs.
Financial Liabilities at FVPL. Financial liabilities are classified under this category through the fair
value option. Derivative instruments (including embedded derivatives) with negative fair values,
except those covered by hedge accounting relationships, are also classified under this category.
The Group carries financial liabilities at FVPL using their fair values and reports fair value changes
in profit or loss. Fair value changes from derivatives accounted for as part of an effective accounting
hedge are recognized in other comprehensive income and presented in the consolidated statements of
changes in equity. Any interest expense incurred is recognized as part of “Interest expense and other
financing charges” account in the consolidated statements of income.
The Group’s derivative liabilities are classified under this category.
Other Financial Liabilities. This category pertains to financial liabilities that are not designated or
classified as at FVPL. After initial measurement, other financial liabilities are carried at amortized
cost using the effective interest rate method. Amortized cost is calculated by taking into account any
premium or discount and any directly attributable transaction costs that are considered an integral
part of the effective interest rate of the liability. The effective interest rate amortization is included
in “Interest expense and other financing charges” account in the consolidated statements of income.
Gains and losses are recognized in the consolidated statements of income when the liabilities are
derecognized as well as through the amortization process.
The Group’s liabilities arising from its trade or borrowings such as loans payable, accounts payable
and accrued expenses, long-term debt, finance lease liabilities and other noncurrent liabilities are
included under this category.
Derecognition of Financial Assets and Financial Liabilities
Financial Assets. A financial asset (or, where applicable, a part of a financial asset or part of a group
of similar financial assets) is primarily derecognized when:
the rights to receive cash flows from the asset have expired; or
the Group has transferred its rights to receive cash flows from the asset or has assumed an
obligation to pay them in full without material delay to a third party under a “pass-through”
arrangement; and either: (a) has transferred substantially all the risks and rewards of the asset; or
(b) has neither transferred nor retained substantially all the risks and rewards of the asset, but has
transferred control of the asset.

- 29 -
When the Group has transferred its rights to receive cash flows from an asset or has entered into a
pass-through arrangement, it evaluates if and to what extent it has retained the risks and rewards of
ownership. When it has neither transferred nor retained substantially all the risks and rewards of the
asset nor transferred control of the asset, the Group continues to recognize the transferred asset to the
extent of the Group’s continuing involvement. In that case, the Group also recognizes the associated
liability. The transferred asset and the associated liability are measured on the basis that reflects the
rights and obligations that the Group has retained.
Financial Liabilities. A financial liability is derecognized when the obligation under the liability is
discharged or cancelled, or expires. When an existing financial liability is replaced by another from
the same lender on substantially different terms, or the terms of an existing liability are substantially
modified, such an exchange or modification is treated as a derecognition of the original liability and
the recognition of a new liability. The difference in the respective carrying amounts is recognized in
the consolidated statements of income.
Impairment of Financial Assets
The Group assesses, at the reporting date, whether a financial asset or group of financial assets is
impaired.
A financial asset or a group of financial assets is deemed to be impaired if, and only if, there is
objective evidence of impairment as a result of one or more events that have occurred after the initial
recognition of the asset (an incurred loss event) and that loss event has an impact on the estimated
future cash flows of the financial asset or the group of financial assets that can be reliably estimated.
Assets Carried at Amortized Cost. For financial assets carried at amortized cost such as loans and
receivables, the Group first assesses whether impairment exists individually for financial assets that
are individually significant, or collectively for financial assets that are not individually significant. If
no objective evidence of impairment has been identified for a particular financial asset that was
individually assessed, the Group includes the asset as part of a group of financial assets with similar
credit risk characteristics and collectively assesses the group for impairment. Assets that are
individually assessed for impairment and for which an impairment loss is, or continues to be
recognized, are not included in the collective impairment assessment.
Evidence of impairment may include indications that the borrower or a group of borrowers is
experiencing financial difficulty, default or delinquency in principal or interest payments, or may
enter into bankruptcy or other form of financial reorganization intended to alleviate the financial
condition of the borrower. For collective impairment purposes, evidence of impairment may include
observable data on existing economic conditions or industry-wide developments indicating that there
is a measurable decrease in the estimated future cash flows of the related assets.

- 30 -
If there is objective evidence of impairment, the amount of loss is measured as the difference
between the asset’s carrying amount and the present value of estimated future cash flows (excluding
future credit losses) discounted at the financial asset’s original effective interest rate (i.e., the
effective interest rate computed at initial recognition). Time value is generally not considered when
the effect of discounting the cash flows is not material. If a loan or receivable has a variable rate, the
discount rate for measuring any impairment loss is the current effective interest rate, adjusted for the
original credit risk premium. For collective impairment purposes, impairment loss is computed
based on their respective default and historical loss experience.
The carrying amount of the asset is reduced either directly or through the use of an allowance
account. The impairment loss for the period is recognized in the consolidated statements of income.
If, in a subsequent period, the amount of the impairment loss decreases and the decrease can be
related objectively to an event occurring after the impairment was recognized, the previously
recognized impairment loss is reversed. Any subsequent reversal of an impairment loss is recognized
in the consolidated statements of income, to the extent that the carrying amount of the asset does not
exceed its amortized cost at the reversal date.
AFS Financial Assets. For equity instruments carried at fair value, the Group assesses, at each
reporting date, whether objective evidence of impairment exists. Objective evidence of impairment
includes a significant or prolonged decline in the fair value of an equity instrument below its cost.
‘Significant’ is evaluated against the original cost of the investment and ‘prolonged’ is evaluated
against the period in which the fair value has been below its original cost. The Group generally
regards fair value decline as being significant when the decline exceeds 25%. A decline in a quoted
market price that persists for 12 months is generally considered to be prolonged.
If an AFS financial asset is impaired, an amount comprising the difference between the cost (net of
any principal payment and amortization) and its current fair value, less any impairment loss on that
financial asset previously recognized in the consolidated statements of changes in equity, is
transferred to the consolidated statements of income. Impairment losses in respect of equity
instruments classified as AFS financial assets are not reversed through the consolidated statements of
income. Increases in fair value after impairment are recognized directly in other comprehensive
income.
For debt instruments classified as AFS, impairment is assessed based on the same criteria as
financial assets carried at amortized cost. If, in subsequent period, the fair value of the debt
instrument increases and the increase can be objectively related to an event occurring after the
impairment loss was recognized in the consolidated statements of income, the impairment loss is
reversed through the consolidated statements of income.
If there is objective evidence that an impairment loss on an unquoted equity instrument that is not
carried at fair value because its fair value cannot be reliably measured, or a derivative asset that is
linked to and must be settled by delivery of such unquoted equity instrument has been incurred, the
amount of loss is measured as the difference between the asset’s carrying amount and the present
value of estimated future cash flows discounted at the current market rate of return for a similar
financial asset. Such impairment loss shall not be reversed.
Classification of Financial Instruments between Liability and Equity
Financial instruments are classified as liability or equity in accordance with the substance of the
contractual arrangement. Interest, dividends, gains and losses relating to a financial instrument or a
component that is a financial liability, are reported as expense or income. Distributions to holders of
financial instruments classified as equity are charged directly to equity, net of any related income tax

- 31 -
benefits.
A financial instrument is classified as liability if it provides for a contractual obligation to:
deliver cash or another financial asset to another entity;
exchange financial assets or financial liabilities with another entity under conditions that are
potentially unfavorable to the Group; or
satisfy the obligation other than by the exchange of a fixed amount of cash or another financial
asset for a fixed number of own equity shares.
If the Group does not have an unconditional right to avoid delivering cash or another financial asset
to settle its contractual obligation, the obligation meets the definition of a financial liability.
The components of issued financial instruments that contain both liability and equity elements are
accounted for separately, with the equity component being assigned the residual amount after
deducting from the instrument as a whole or in part, the amount separately determined as the fair
value of the liability component on the date of issue.
Debt Issue Costs
Debt issue costs are considered as an adjustment to the effective yield of the related debt and are
deferred and amortized using the effective interest rate method. When a loan is paid, the related
unamortized debt issue costs at the date of repayment are recognized in the consolidated statements
of income.
Offsetting Financial Instruments
Financial assets and financial liabilities are offset and the net amount is reported in the consolidated
statements of financial position if, and only if, there is a currently enforceable legal right to offset the
recognized amounts and there is an intention to settle on a net basis, or to realize the assets and settle
the liabilities simultaneously. This is not generally the case with master netting agreements, and the
related assets and liabilities are presented gross in the consolidated statements of financial position.
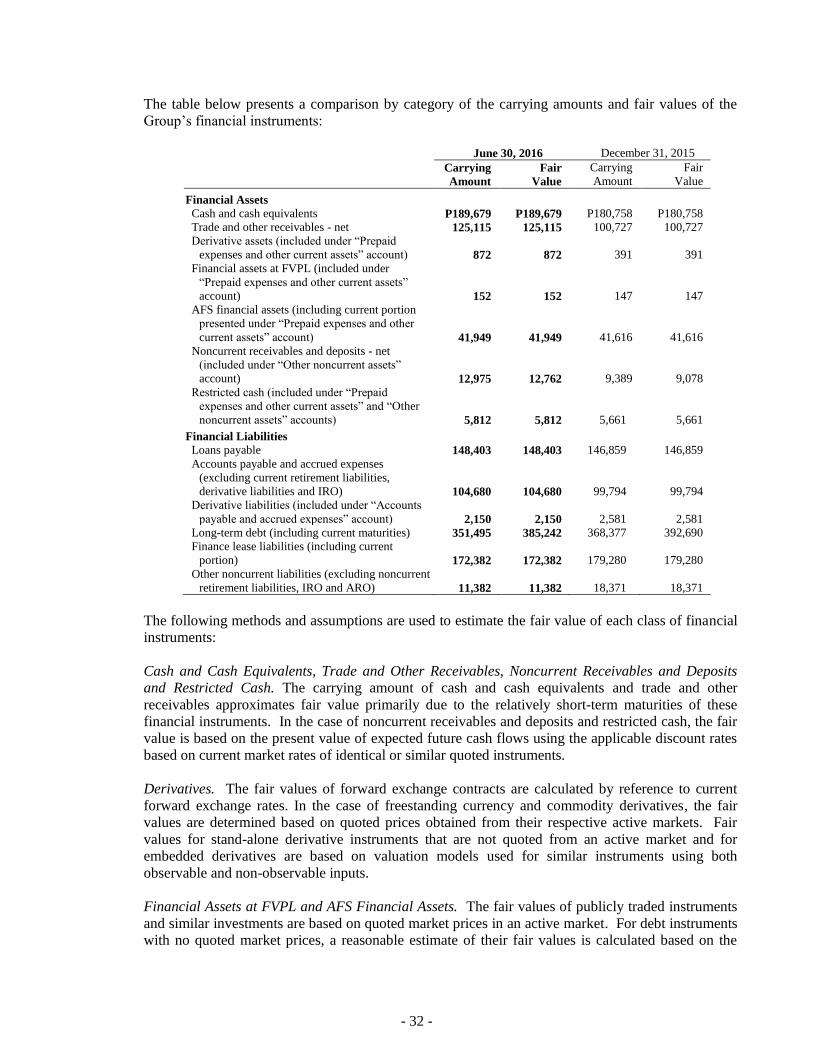
- 32 -
The table below presents a comparison by category of the carrying amounts and fair values of the
Group’s financial instruments:
June 30, 2016 December 31, 2015
Carrying
Amount
Fair
Value
Carrying
Amount
Fair
Value
Financial Assets
Cash and cash equivalents P189,679 P189,679 P180,758 P180,758
Trade and other receivables - net 125,115 125,115 100,727 100,727
Derivative assets (included under “Prepaid
expenses and other current assets” account) 872 872 391 391
Financial assets at FVPL (included under
“Prepaid expenses and other current assets”
account) 152 152 147 147
AFS financial assets (including current portion
presented under “Prepaid expenses and other
current assets” account) 41,949 41,949 41,616 41,616
Noncurrent receivables and deposits - net
(included under “Other noncurrent assets”
account) 12,975 12,762 9,389 9,078
Restricted cash (included under “Prepaid
expenses and other current assets” and “Other
noncurrent assets” accounts) 5,812 5,812 5,661 5,661
Financial Liabilities
Loans payable 148,403 148,403 146,859 146,859
Accounts payable and accrued expenses
(excluding current retirement liabilities,
derivative liabilities and IRO) 104,680 104,680 99,794 99,794
Derivative liabilities (included under “Accounts
payable and accrued expenses” account) 2,150 2,150 2,581 2,581
Long-term debt (including current maturities) 351,495 385,242 368,377 392,690
Finance lease liabilities (including current
portion) 172,382 172,382 179,280 179,280
Other noncurrent liabilities (excluding noncurrent
retirement liabilities, IRO and ARO) 11,382 11,382 18,371 18,371
The following methods and assumptions are used to estimate the fair value of each class of financial
instruments:
Cash and Cash Equivalents, Trade and Other Receivables, Noncurrent Receivables and Deposits
and Restricted Cash. The carrying amount of cash and cash equivalents and trade and other
receivables approximates fair value primarily due to the relatively short-term maturities of these
financial instruments. In the case of noncurrent receivables and deposits and restricted cash, the fair
value is based on the present value of expected future cash flows using the applicable discount rates
based on current market rates of identical or similar quoted instruments.
Derivatives. The fair values of forward exchange contracts are calculated by reference to current
forward exchange rates. In the case of freestanding currency and commodity derivatives, the fair
values are determined based on quoted prices obtained from their respective active markets. Fair
values for stand-alone derivative instruments that are not quoted from an active market and for
embedded derivatives are based on valuation models used for similar instruments using both
observable and non-observable inputs.
Financial Assets at FVPL and AFS Financial Assets. The fair values of publicly traded instruments
and similar investments are based on quoted market prices in an active market. For debt instruments
with no quoted market prices, a reasonable estimate of their fair values is calculated based on the

- 33 -
expected cash flows from the instruments discounted using the applicable discount rates of
comparable instruments quoted in active markets. Unquoted equity securities are carried at cost less
impairment.
Loans Payable and Accounts Payable and Accrued Expenses. The carrying amount of loans payable
and accounts payable and accrued expenses approximates fair value due to the relatively short-term
maturities of these financial instruments.
Long-term Debt, Finance Lease Liabilities and Other Noncurrent Liabilities. The fair value of
interest-bearing fixed-rate loans is based on the discounted value of expected future cash flows using
the applicable market rates for similar types of instruments as of reporting date. Discount rates used
for Philippine peso-denominated loans range from 1.6% to 4.2% and 2.4% to 4.6% as of June 30,
2016 and December 31, 2015, respectively. The discount rates used for foreign currency-
denominated loans range from 0.6% to 7.4% and 0.4% to 9.1% as of June 30, 2016 and
December 31, 2015, respectively. The carrying amounts of floating rate loans with quarterly interest
rate repricing approximate their fair values.
Derivative Financial Instruments and Hedging
The Group’s derivative financial instruments according to the type of financial risk being managed
and the details of freestanding and embedded derivative financial instruments are discussed below.
The Group enters into various currency and commodity derivative contracts to manage its exposure
on foreign currency and commodity price risk. The portfolio is a mixture of instruments including
forwards, swaps and options.
Freestanding Derivatives
For the purpose of hedge accounting, hedges are classified as either:
(a) fair value hedges when hedging the exposure to changes in the fair value of a recognized asset or
liability or an unrecognized firm commitment (except for foreign currency risk);
(b) cash flow hedges when hedging exposure to variability in cash flows that is either attributable to
a particular risk associated with a recognized asset or liability or a highly probable forecast
transaction or the foreign currency risk in an unrecognized firm commitment; or
(c) hedges of a net investment in foreign operations.
At the inception of a hedge relationship, the Group formally designates and documents the hedge
relationship to which the Group wishes to apply hedge accounting and the risk management
objective and strategy for undertaking the hedge. The documentation includes identification of the
hedging instrument, the hedged item or transaction, the nature of the risk being hedged and how the
entity will assess the hedging instrument’s effectiveness in offsetting the exposure to changes in the
hedged item’s fair value or cash flows attributable to the hedged risk. Such hedges are expected to
be highly effective in achieving offsetting changes in fair value or cash flows and are assessed on an
ongoing basis to determine that they actually have been highly effective throughout the financial
reporting periods for which they were designated.
Fair Value Hedge. Derivatives classified as fair value hedges are carried at fair value with
corresponding change in fair value recognized in the consolidated statements of income. The
carrying amount of the hedged asset or liability is also adjusted for changes in fair value attributable
to the hedged item and the gain or loss associated with that remeasurement is also recognized in the

- 34 -
consolidated statements of income.
When the hedge ceases to be highly effective, hedge accounting is discontinued and the adjustment
to the carrying amount of a hedged financial instrument is amortized immediately.
The Group discontinues fair value hedge accounting if:
(a) the hedging instrument expires, is sold, is terminated or is exercised;
(b) the hedge no longer meets the criteria for hedge accounting; or
(c) the Group revokes the designation.
The Group has no outstanding derivatives accounted for as a fair value hedge as of
June 30 and March 31, 2016 and December 31, 2015.
Cash Flow Hedge. Changes in the fair value of a hedging instrument that qualifies as a highly
effective cash flow hedge are recognized in other comprehensive income and presented in the
consolidated statements of changes in equity. The ineffective portion is immediately recognized in
the consolidated statements of income.
If the hedged cash flow results in the recognition of an asset or a liability, all gains or losses
previously recognized directly in the consolidated statements of changes in equity are transferred and
included in the initial measurement of the cost or carrying amount of the asset or liability.
Otherwise, for all other cash flow hedges, gains or losses initially recognized in the consolidated
statements of changes in equity are transferred to the consolidated statements of income in the same
period or periods during which the hedged forecasted transaction or recognized asset or liability
affects the consolidated statements of income.
When the hedge ceases to be highly effective, hedge accounting is discontinued prospectively. The
cumulative gain or loss on the hedging instrument that has been reported directly in the consolidated
statements of changes in equity is retained until the forecasted transaction occurs. When the
forecasted transaction is no longer expected to occur, any net cumulative gain or loss previously
reported in the consolidated statements of changes in equity is recognized in the consolidated
statements of income.
The Group has no outstanding derivatives accounted for as a cash flow hedge as of
June 30 and March 31, 2016 and December 31, 2015.
Net Investment Hedge. Hedges of a net investment in a foreign operation, including a hedge of a
monetary item that is accounted for as part of the net investment, are accounted for in a way similar
to cash flow hedges. Gains or losses on the hedging instrument relating to the effective portion of
the hedge are recognized in other comprehensive income while any gains or losses relating to the
ineffective portion are recognized in the consolidated statements of income. On disposal of a foreign
operation, the cumulative value of any such gains and losses recorded in the consolidated statements
of changes in equity is transferred to and recognized in the consolidated statements of income.
The Group has no hedge of a net investment in a foreign operation as of June 30 and March 31, 2016
and December 31, 2015.

- 35 -
Changes in fair values of derivatives that do not qualify for hedge accounting are recognized directly
in the consolidated statements of income.
Derivative Instruments not Designated as Hedges
The Group enters into certain derivatives as economic hedges of certain underlying exposures.
These include freestanding and embedded derivatives found in host contracts, which are not
designated as accounting hedges. Changes in fair value of these instruments are accounted for
directly in the consolidated statements of income. Details are as follows:
Freestanding Derivatives
Freestanding derivatives consist of commodity and currency derivatives entered into by the Group.
Interest Rate Swap
As of June 30 and March 31, 2016 and December 31, 2015, the Group has outstanding interest rate
swap with notional amount of US$300. Under the agreement, the Group receives quarterly floating
interest rate based on LIBOR and pays annual fixed interest rate adjusted based on a specified index
up to March 2020. The negative fair value of the swap amounted to P1,325, P1,052 and P632 as of
June 30 and March 31, 2016 and December 31, 2015, respectively.
Currency Forwards
The Group has outstanding foreign currency forward contracts with aggregate notional amount of
US$1,085, US$1,139 and US$1,013 as of June 30 and March 31, 2016 and December 31, 2015,
respectively, and with various maturities in 2016. The net positive (negative) fair value of these
currency forwards amounted to P395, (P727) and (P202) as of June 30 and March 31, 2016 and
December 31, 2015, respectively.
Currency Options
The Group has outstanding currency options with an aggregate notional amount of US$1,764 as of
June 30, 2016 and US$565 as of March 31, 2016 and December 31, 2015, and with various
maturities in 2016. The net negative fair value of these currency options amounted to P402, P1,443
and P1,232 as of June 30 and March 31, 2016 and December 31, 2015, respectively.
Commodity Swaps
As of March 31, 2016 and December 31, 2015, the Group has outstanding swap agreements covering
its aluminum requirements, with various maturities in 2016. Under the agreement, payment is made
either by the Group or its counterparty for the difference between the agreed fixed price of aluminum
and the price based on the relevant price index. The outstanding equivalent notional quantity
covered by the commodity swaps is 465 and 1,150 metric tons as of March 31, 2016 and
December 31, 2015, respectively. The net negative fair value of these swaps amounted to P1 and P2
as of March 31, 2016 and December 31, 2015, respectively. The Group has no outstanding swap
agreements covering its aluminum requirements as of June 30, 2016.
The Group has outstanding swap agreements covering its oil requirements, with various maturities in
2016. Under the agreement, payment is made either by the Group or its counterparty for the
difference between the hedged fixed price and the relevant monthly average index price. The
outstanding equivalent notional quantity covered by the commodity swaps is 11.8, 9.2 and 10.9
million barrels as of June 30 and March 31, 2016 and December 31, 2015, respectively. The positive
(negative) fair value of these swaps amounted to P120, (P46) and (P39) as of June 30 and March 31,
2016 and December 31, 2015, respectively.
- 36 -
Commodity Options
As of June 30 and March 31, 2016 and December 31, 2015, the Group has no outstanding
commodity options on the purchase of wheat.
As of June 30 and March 31, 2016 and December 31, 2015, the Group has no outstanding
commodity options on the purchase of soybean meals.
As of June 30 and March 31, 2016 and December 31, 2015, the Group has no outstanding 3-way
options designated as hedge of forecasted purchases of crude oil.
Embedded Derivatives
The Group’s embedded derivatives include currency derivatives (forwards and options) embedded in
non-financial contracts.
Embedded Currency Forwards
The total outstanding notional amount of currency forwards embedded in non-financial contracts
amounted to US$150, US$166 and US$173 as of June 30 and March 31, 2016 and December 31,
2015, respectively. These non-financial contracts consist mainly of foreign currency- denominated
purchase orders, sales agreements and capital expenditures. The embedded forwards are not clearly
and closely related to their respective host contracts. The net positive (negative) fair value of these
embedded currency forwards amounted to (P66), P75 and (P83) as of June 30 and March 31, 2016
and December 31, 2015, respectively.
Embedded Currency Options
As of June 30 and March 31, 2016 and December 31, 2015, the Group has no outstanding currency
options embedded in non-financial contracts.
The Group recognized marked-to-market losses from freestanding and embedded derivatives
amounting to P1,079, P785, P1,627 and P248 for the periods ended June 30, 2016 and 2015 and
March 31, 2016 and 2015, respectively.
Fair Value Measurements
The Group measures a number of financial and non-financial assets and liabilities at fair value at
each reporting date.
Fair value is the price that would be received to sell an asset or paid to transfer a liability in an
orderly transaction between market participants at the measurement date. The fair value
measurement is based on the presumption that the transaction to sell the asset or transfer the liability
takes place either in the principal market for the asset or liability, or in the absence of a principal
market, in the most advantageous market for the asset or liability. The principal or most
advantageous market must be accessible to the Group.
The fair value of an asset or liability is measured using the assumptions that market participants
would use when pricing the asset or liability, assuming that market participants act in their best
economic interest.
The Group uses valuation techniques that are appropriate in the circumstances and for which
sufficient data are available to measure fair value, maximizing the use of relevant observable inputs
and minimizing the use of unobservable inputs.

- 37 -
All assets and liabilities for which fair value is measured or disclosed in the consolidated financial
statements are categorized within the fair value hierarchy, described as follows, based on the lowest
level input that is significant to the fair value measurement as a whole:
Level 1: quoted prices (unadjusted) in active markets for identical assets or liabilities;
Level 2: inputs other than quoted prices included within Level 1 that are observable
for the asset or liability, either directly or indirectly; and
Level 3: inputs for the asset or liability that are not based on observable market data.
For assets and liabilities that are recognized in the consolidated financial statements on a recurring
basis, the Group determines whether transfers have occurred between levels in the hierarchy by re-
assessing the categorization at the end of each reporting period.
For the purpose of fair value disclosures, the Group has determined classes of assets and liabilities on
the basis of the nature, characteristics and risks of the asset or liability and the level of the fair value
hierarchy.
Fair Value Hierarchy
Financial assets and financial liabilities measured at fair value in the consolidated statements of
financial position are categorized in accordance with the fair value hierarchy. This hierarchy groups
financial assets and financial liabilities into three levels based on the significance of inputs used in
measuring the fair value of the financial assets and financial liabilities.
The table below analyzes financial instruments carried at fair value by valuation method:
June 30, 2016 December 31, 2015
Level 1 Level 2 Total Level 1 Level 2 Total
Financial Assets
Derivative assets P - P872 P872 P - P391 P391
Financial assets at FVPL - 152 152 - 147 147
AFS financial assets 734 41,215 41,949 407 41,209 41,616
Financial Liabilities
Derivative liabilities - 2,150 2,150 - 2,581 2,581
The Group has no financial instruments valued based on Level 3 as of June 30, 2016 and
December 31, 2015. During the year, there were no transfers between Level 1 and Level 2 fair value
measurements, and no transfers into and out of Level 3 fair value measurement.
11. Other Matters
a. There are no unusual items as to nature and amount affecting assets, liabilities, equity, net
income or cash flows, except those stated in Management’s Discussion and Analysis of
Financial Position and Financial Performance.
b. There were no material changes in estimates of amounts reported in prior financial years.

- 38 -
c. There were no known trends, demands, commitments, events or uncertainties that will have a
material impact on the Group’s liquidity.
d. There were no known trends, events or uncertainties that have had or that are reasonably
expected to have a favorable or unfavorable impact on net sales or revenues or income from
continuing operation.
e. There were no known events that will trigger direct or contingent financial obligation that is
material to the Group, including any default or acceleration of an obligation and there were no
changes in contingent liabilities and contingent assets since the last annual reporting date,
except for Note 25 (c) and Note 45 (a) of the 2015 Audited Consolidated Financial Statements,
that remain outstanding as of June 30, 2016. No material contingencies and any other events or
transactions exist that are material to an understanding of the current interim period.
f. The effects of seasonality or cyclicality on the interim operations of the Group’s businesses are
not material.
g. There were no material off-statements of financial position transactions, arrangements,
obligations (including contingent obligations), and other relationship of the Group with
unconsolidated entities or other persons created during the reporting period, except for the
outstanding derivative transactions entered by the Group as of and for the period ended
June 30, 2016.
h. The Group’s material commitments for capital expenditure projects have been approved during
the current year but are still ongoing and not yet completed as of end of June 30, 2016. These
consist of construction, acquisition, upgrade or repair of fixed assets needed for normal
operations of the business. The said projects will be carried forward to the next quarter until its
completion. The fund to be used for these projects will come from available cash, short and
long-term loans.
i. Certain amounts in prior year have been reclassified for consistency with the current period
presentation. These reclassifications had no effect on the reported financial performance for
any period.


Management Discussion and Analysis Page 2
order against the PCC made by Globe was denied. PLDT’s similar application for a temporary
restraining order is pending resolution by the Court of Appeals. The two petitions have been
consolidated. The Parent Company is not a party to the pending cases between the PCC and
PLDT and Globe.
INVESTMENTS
Additional Investment in Universal LRT Corporation (BVI) Limited (ULC BVI) and
Acquisition of 100% Equity Interest in ULCOM Company, Inc. (ULCOM) by San Miguel
Holdings Corp. (SMHC)
On June 16, 2016, the Parent Company through its wholly-owned subsidiary, SMHC, executed
an Amended and Restated Share Sale and Purchase Agreement with Universal LRT Corporation
Limited (ULC HK) and Mr. Salvador B. Zamora II and various parties, for the purchase of: (i) an
additional 49% equity interest in ULC BVI; and (ii) 100% equity interest in ULCOM. The total
consideration for the acquisition of ULC BVI and ULCOM is US$100 million, which amount
consists of payment for the shares as well as the outstanding shareholder advances made by each
of ULC HK and Mr. Zamora to ULC BVI and ULCOM, respectively. The amount of the
shareholder advances is approximately US$3.8 million. ULC BVI holds the exclusive right,
obligation and privilege to finance, design, construct, supply, complete and commission the
Metro Rail Transit Line 7 Project (MRT 7 Project) by virtue of the Concession Agreement dated,
June 18, 2008 with the Republic of the Philippines, through the Department of Transportation
and Communications. ULCOM is the designated Facility Operator and Maintenance Provider of
the MRT 7 Project.
The additional investment in ULC BVI and the acquisition of ULCOM was completed on July 1,
2016. With the completion of such acquisition, SMHC now owns 100% interest in ULC BVI
and ULCOM.
LONG-TERM DEBT
Payment of Long-term Debt
On April 7, 2016, the Parent Company fully paid its US$170 million (P7,837 million) loan,
obtained to fund the infrastructure investments and for general corporate purposes. The payment
was funded by the proceeds from the issuance of Series "2 - G, H and I" Preferred Shares of
SMC.
FIRST QUARTER
EQUITY
Issuance of 400,000,000 Series “2” Preferred Shares – Subseries G, H and I by the Parent
Company
On February 24, 2016, the Board of Directors of Philippine Stock Exchange, Inc. approved the
listing application of the Parent Company of up to 975,571,800 shares of Series “2” Preferred
Shares under shelf registration (the “Shelf Registered Shares”) and the offering of up to
400,000,000 shares of Series “2” Preferred Shares (the “First Tranche”) with a par value of P5.00
per share and an offer price of P75.00 per share. The Philippine Securities and Exchange
Commission approved the shelf registration of the Shelf Registered Shares and issued a permit to
sell covering the same on March 8, 2016.
The Parent Company offered the “First Tranche” of (i) up to 280,000,000 shares of Series “2”

Management Discussion and Analysis Page 3
Preferred Shares consisting of Subseries “2-G”, “2-H” and “2-I” and (ii) up to 120,000,000
shares of Series “2” Preferred Shares to cover the oversubscription option. The First Tranche will
be re-issued and offered from the Series “2” Preferred Shares Subseries held in treasury. The
offer period was from March 14 to March 18, 2016. The First Tranche was issued on March 30,
2016 which was also the listing date of the Shelf Registered Shares.
The remaining 575,571,800 Shelf Registered Shares will be issued within a period of three years.
The offer shares shall be issued from the remaining Series “2” Preferred Shares Subseries “2-A”
held in treasury and unissued shares of Series “2” Preferred Shares.
Dividend rates are 6.5793%, 6.3222% and 6.3355% per annum for Subseries “2-G”, “2-H” and
“2-I”, respectively.
Following the completion of the Parent Company’s follow-on offering of 280,000,000 Series “2”
Preferred Shares, with an oversubscription option of 120,000,000 Series “2” Preferred Shares,
the Parent Company shall reissue the following Series “2” Preferred Shares held in treasury:
(i) 244,432,686 Series “2” Preferred Shares; and (ii) 155,567,314 Subseries “2-A” Preferred
Shares (collectively, the “Offer Shares”). The Series “2” Preferred Shares were Series “1”
Preferred Shares held in treasury that were reclassified to Series “2” Preferred Shares on June 9,
2015.
After reissuance of the Offer Shares on March 30, 2016, the Parent Company shall have a
remaining 565,445,086 Subseries “2-A” Preferred Shares held in treasury. There are no more
Series “2” Preferred Shares held in treasury.
LONG-TERM DEBT
Refinancing of the US300 Million Short-term Loan
- SMC Global Power Holdings Corp. (SMC Global)
On January 26, 2016, SMC Global redeemed its US$300 million (P14,115 million), 7%, five-
year bond, issued on January 14, 2011 under the Regulations of the U.S. Securities Act of 1933,
as amended. The bond issue was listed in the Singapore Exchange Securities Trading Limited.
SMC Global availed of a US$300 million (P14,364 million) bridge financing, six-month term
loan, with a local bank on January 14, 2016 for the redemption of the US$300 million bond.
On July 11, 2016, SMC Global issued and listed in the Philippine Dealing & Exchange Corp.
fixed rate Philippine Peso-denominated bonds (the “Bonds”) with an aggregate principal amount
of P15,000 million. The Bonds were issued 100% of face value in minimum denominations of
P50,000.00 each, and in integral multiples of P10,000.00 thereafter. The bonds comprised of the
Series A Bonds, the Series B Bonds, and the Series C Bonds.
The terms and interest rate of the bonds are as follows:
Term Interest Rate Per Annum
Series A Bonds five (5) years, due 2021 4.3458%
Series B Bonds seven (7) years, due 2023 4.7575%
Series C Bonds ten (10) years, due 2026 5.1792%
Interest on the Bonds shall be payable quarterly in arrears starting on October 11, 2016, for the
first Interest Payment Date, and January 11, April 11, July 11 and October 11 of each year
thereafter.

Management Discussion and Analysis Page 4
The net proceeds of the Offer shall be used primarily by SMC Global to refinance the short-term
US$300 million bridge financing loan availed for the redemption of the US$300 million bond.
- Atlantic Aurum Investments Philippines Corporation (AAIPC)
On March 14, 2016, AAIPC availed in full the P16,700 million loan facility with various banks.
The loan has a term of nine years and bears a fixed interest rate of 6.7394% per annum.
The net proceeds of the loan were used by AAIPC to acquire the Stage 3 Connector Tollways
Holding Corporation shares owned by Atlantic Aurum Investments B.V. (AAIBV).
On March 15, 2016, AAIBV used the proceeds from the sale of the shares to prepay its existing
US$340 million (P16,000 million) loan with Standard Chartered Bank. The loan is payable lump
sum on September 19, 2016 and bears an interest rate of 5.375% margin rate and LIBOR rate
applicable to the loan payable at the end of each interest period.
Availment of Long-term Debt to Finance Capital Projects
- SMC Consolidated Power Corporation (SCPC)
In 2016, SCPC has drawn a total of US$254 million (P11,906 million) from the US$400 million,
seven-year term loan with a syndicate of banks. The loan bears interest rate of LIBOR plus a
margin, payable in arrears on the last day of the agreed interest period. Repayment of the loan
principal shall commence on October 31, 2017, and every three months thereafter.
Proceeds of the loan is earmarked for the financing of the construction of the 2x150MW Limay
Power Plant (Phase I), in Bataan.
- Vertex Tollways Devt. Inc. (Vertex)
On January 29 and February 1, 2016, Vertex has drawn a total of P1,100 million, to complete the
P7,500 million loan facility for the financing of ongoing construction of the Ninoy Aquino
International Airport (NAIA) Expressway Project.
II. FINANCIAL PERFORMANCE
2016 vs. 2015
As a result of completion of the sale of Vega and subsidiaries on May 30, 2016, the line by line
consolidation of Vega and subsidiaries were excluded in the consolidated statements of income
for the periods ended June 30, 2016 and 2015 and presented under “Income (loss) after income
tax from discontinued operations.” Accordingly, the comparable 2015 consolidated statement of
income was restated.
The consolidated sales revenue of the Group for the first semester of 2016 amounted to P329,168
million. This is slightly lower than 2015. Most businesses increased their revenues but the
decline in oil prices lowered Petron Corporation (Petron) revenues offsetting the increases.
The Group’s consolidated operating income reached P48,753 million, 19% higher than last year.
This is a result of Petron’s improved refinery margins, Infrastructure business’ full semester
contribution, core Beverage, Food and Packaging business’ double digit income growth as well
as the Energy business improved income performance.

Management Discussion and Analysis Page 5
The higher interest expense was mainly due to the absence of capitalized interest of Petron in
2016 and the six month-period balance contribution of AAIBV Group compared to four months
last year.
The decrease in interest income was mainly due to lower average balance of money market
placements of the Parent Company, SMC Global and Petron in June 2016 compared to the same
period last year, net of the higher interest income of Infra Group due to six month-period balance
contribution of AAIBV Group compared to four months last year.
The decrease in equity in net earnings in 2016 primarily represents the share of San Miguel
Properties, Inc. (SMPI) in the lower net income of Bank of Commerce in 2016. The Group
recognized P137 million as its share in the net income of AAIBV Group from January 1 to
March 5, 2015, prior to consolidation.
Other charges consist of the gain (loss) on foreign exchange and derivatives of the Group. The
gain on foreign exchange in 2016, consists of translation of the foreign currency-denominated
cash and cash equivalents and the foreign exchange gain realized from the payment of US$170
million long-term debt in April 2016 of the Parent Company. The appreciation of Malaysian
Ringgit against the United States Dollar during the period resulted to the gain on foreign
exchange from the importation of crude oil and petroleum products of Petron Malaysia.
The depreciation of the Philippine Peso against the United States Dollar by P0.37 on June 30,
2015, resulted to foreign exchange loss on the translation of foreign currency-denominated
liabilities of SMC Global and Petron.
Petron incurred higher net loss on freestanding currency forward derivatives, partly offset by
higher net gain on commodity hedging. However, the Parent Company gained from its
freestanding currency derivatives, a turn-around from the loss incurred in June 2015.
The higher income tax expense was primarily due to: a) increase in taxable net income of Petron,
SMC Global and San Miguel Foods, Inc.; b) recognition of deferred income tax on the temporary
difference of the net book value of leased assets against the carrying amount of finance lease
liabilities of SMC Global; c) recognition of income tax on the dividend income from foreign
subsidiaries of Petron; and d) six month-period balance contribution of AAIBV Group compared
to four months last year. However, this was tempered by the recognition by Petron of income
tax holiday from the Refinery Master Plan Phase 2.
Gain from discontinued operations amounting to P11,818 million represents recovery of previous
costs, losses, interest expense, and provisions pertaining to the sale of telecommunication
business.
The net loss from discontinued operations in 2015 pertains to the consolidated net loss of Vega
and its subsidiaries for the first semester of 2015.
Consolidated net income amounted to P35,281 million, more than double the previous year’s
level.
The share of non-controlling interests (NCI) on the Group's net income increased in 2016 mainly
due to the increase in share of the holders of undated subordinated capital securities on the net
income of SMC Global due to additional issuance in August 2015, the increase in share of NCI
due to higher net income of San Miguel Brewery Inc. (SMB) and Petron in 2016 and the higher
share of NCI in the net income of Citra Metro Manila Tollways Corporation and South Luzon
Tollways Corporation, which were consolidated to the Group starting March 5, 2015.

Management Discussion and Analysis Page 6
2015 vs. 2014
San Miguel Corporation’s 2015 consolidated sales revenue for the first semester amounted to
P334,076 million, 17% lower than 2014. As in the first quarter of 2015, this is due to the decline
in Petron’s sales revenue which primarily resulted from the lower selling price per liter.
Offsetting the decline in Petron’s sales revenue was the continued growth in Beverages, Food
and Packaging businesses as well as Infrastructure business. In June 2015, the Infrastructure
business contributed P5,305 million in toll revenues with the consolidation of SLEX and Skyway
starting March 2015.
The lower cost of sales resulted from the drop in reference crude Dubai prices.
Margin improvement in Petron during the second quarter of 2015 coupled by continued
improved performance of Beverage, Food and Packaging as well as Infrastructure business
resulted to June 2015 consolidated operating income of P41,094 million, 24% higher than 2014.
The consolidation of AAIBV Group starting March 2015 mainly accounts for the increase in
interest expense and other financing charges.
Interest earned from the placement of the proceeds from the sale of the investments in Philippine
Airlines, Inc. and Air Philippines Corporation and the proceeds from the reissuance of the Parent
Company’s Series “1” Preferred Shares principally contributed to the increase in interest income.
The decrease in equity in net earnings of associates and joint ventures is mainly attributable to
the consolidation of the AAIBV Group starting March 2015 which was previously accounted for
as an associate.
The depreciation of the Philippine Peso against the United States Dollar by P0.37 on June 30,
2015 as compared to the appreciation of Philippine Peso by P0.745 on June 30, 2014, resulted to
loss on foreign exchange of P1,369 million in 2015 as compared to gain on foreign exchange of
P3,677 million in 2014.
The higher income tax expense in 2015 primarily resulted from the higher taxable income of
SMB, the expiration of the income tax holiday of San Miguel Energy Corporation, South
Premiere Power Corp. and Strategic Power Devt. Corp. in July 2014, and the consolidation of the
AAIBV Group.
Including net financing charges and taxes, consolidated net income amounted to P17,010
million, while the corresponding net income attributable to equity holders of the Parent Company
is P8,735 million. This is lower than 2014, with the loss on foreign exchange in June 2015 versus
the gains in June 2014.
Excluding the effect of foreign exchange, consolidated net income would have been P18,116
million, 15% higher than the comparable amount in 2014. Net income attributable to equity
holders of the Parent Company would be P9,580 million.

Management Discussion and Analysis Page 7
The following are the highlights of the performance of the individual business segments:
1. BEVERAGE
2016 vs. 2015
a. San Miguel Brewery Inc.
San Miguel Brewery registered consolidated sales revenues of P47,396 million, 19% higher
than the previous year, driven by higher domestic sales volumes.
Domestic operations sold 101.3 million cases, 17% higher than last year, despite the price
increase implemented last April 1. This is due to the increased consumption of SMB Brands
with the favorable economic environment as well as with the effective implementation of
new campaigns, consumer and trade programs. Corresponding domestic revenues posted a
21% growth from last year to reach P41,565 million.
International operations, on the other hand, contributed 13.6 million cases equivalent to
P5,831 million revenues during the first semester. This is 7% higher than last year with the
increase coming mainly from Indonesia.
With higher sales, SMB’s consolidated operating income reached P12,574 million, 16%
higher than last year.
b. Ginebra San Miguel Inc. (GSMI)
Ginebra San Miguel continued to do very well, first semester 2016 sales revenues increased
by 13% from last year to P8,414 million. This is on the back of a 12% volume growth in
hard liquor reaching 11.4 million cases, fueled by strong sales of core brands Ginebra San
Miguel and Vino Kulafu.
The corresponding operating income grew 68% to about P414 million.
2015 vs. 2014
a. San Miguel Brewery Inc.
SMB’s consolidated revenues grew 5%, reaching P39,802 million for the first half of 2015.
This was mainly driven by its domestic beer operations which delivered a 3% volume
growth or 86.4 million cases. Along with the price increase implemented in October 2014,
this translated to domestic revenues of P34,473 million, 13% higher than 2014. On the other
hand, volumes in the international operations were lower as the Hong Kong and Indonesia
markets continue to face challenges. With this, SMB managed to register consolidated beer
sales volume of 100.5 million cases, slightly lower than 2014.
With cost management programs, operating income for the first semester amounted to
P10,875 million, 6% better than 2014.
b. Ginebra San Miguel Inc.
GSMI regains profitability as it ends the first half of 2015 with a net income of P5 million.
This is mainly brought about by growth in volumes, led by GSM Red. First semester
volume totaled to 10.2 million cases, 4% above 2014. Coupled with the effect of the

Management Discussion and Analysis Page 8
implemented price adjustments last January 2015 to recover higher excise taxes,
consolidated revenues ended at about P7,453 million, 8% ahead of 2014.
With higher revenues and contained costs, operating income for the semester reached P246
million, significantly higher than 2014’s levels.
2. FOOD
2016 vs. 2015
San Miguel Pure Foods Company Inc. (SMPFC) and its subsidiaries achieved a 5% growth
in consolidated sales revenues reaching P53,154 million for the first semester of 2016. Just
like in the first quarter, this was driven by the good performance of its major businesses –
Agro-industrial and Branded Value-added businesses.
Agro-industrial cluster posted a revenue growth of 8% coming from its Poultry and Feeds
businesses. Poultry and Meats revenues went up by 9% due to higher volumes and prices of
chicken, tempered by lower pork prices due to the influx of lower-priced imported meats.
Branded Value-added cluster contributed revenue of P12,147 million, 8% higher than last
year. Still, this is a result of combined strong brand leadership in the market of Pure Foods
and Magnolia thru their product expansion, effective marketing campaigns and better sales
mix strategy.
SMPFC’s consolidated operating income amounted to P3,602 million, 31% higher than last
year. In addition to revenue increases, operation efficiencies on its major business segments
and lower prices of key raw materials also helped improved SMPFC’s income performance.
2015 vs. 2014
SMPFC’s consolidated revenue for the first semester of 2015 is up by 3% versus 2014 level
to P50,508 million. Agro and Milling businesses posted a modest 2% revenue growth with
higher feeds and flour volume. The increase was achieved despite lower results in poultry
and Meat businesses with lower chicken selling prices due to industry oversupply, and lower
supply of meat due to slower weight gain. On the other hand, core brands such as Purefoods,
Magnolia, Star and Dari Crème remained strong and contributed to the 11% growth in
revenue of the Branded Value-added business.
These translated to a consolidated operating income amounting to P2,740 million, 2% above
2014. The improved profitability of the Branded Value-added business during the second
quarter of 2015 and sustained strong performance of Feeds offset the impact of Poultry and
Meat businesses’ weak performance.
3. PACKAGING
2016 vs. 2015
The San Miguel Yamamura Packaging Group’s (SMYPG) sales revenues for the first
semester of 2016 amounted to P13,511 million, 12% higher than 2015. Glass business with
revenue increasing by 14% versus June 2015 remained the major contributor. It is worthy to
note, however, that Australia operations and Metal business’ increased sales performance
was sustained.
The corresponding operating income increased by 21% to P1,331 million.

Management Discussion and Analysis Page 9
2015 vs. 2014
SMYPG’s consolidated revenues for the first semester of 2015 amounted to P12,013 million,
4% higher than 2014. The business continued to benefit from higher revenues from Glass
and Paper business. Glass business grew stronger during the second quarter of 2015 with
growing demands coming from beverage clients and exports. The Paper business, on the
other hand continued to benefit from higher tolling and export sales.
With better productivity and improved costs, the Packaging Group’s first semester of 2015
operating income reached P1,104 million, 7% above 2014.
4. ENERGY
2016 vs. 2015
SMC Global Power’s off take volume for the first semester of 2016 was 9.3 million
megawatt hours (MWh), 14% higher than 2015. This is a result of Sual and Ilijan’s
continued higher bilateral volumes coupled with San Roque’s higher plant dispatch because
of better water inflow.
The resulting Energy group’s consolidated net revenue, however, increased only by 2% to
P41,072 million with lower average realization prices for both spot sales and bilateral
customers.
The Energy business’ corresponding operating income reached P15,741 million, 15% higher
than last year.
2015 vs. 2014
SMC Global’s off take volume for the first semester of 2015 was about 8.2 million MWh,
7% lower than 2014. Ilijan’s lower volumes were due to the scheduled maintenance outage
of Malampaya and Block 2 units of the plant that started in the first quarter of 2015. This
was moderated by the 5% increase in Sual’s off take volume with higher bilateral and
Wholesale Electricity Spot Market volumes.
Coupled with decrease in average prices, SMC Global’s consolidated revenue was P40,455
million, 8% lower than 2014.
The Energy business’ consolidated operating income of P13,650 million was 9% lower than
2014.
5. FUEL AND OIL
2016 vs. 2015
Petron Corporation continued its strong performance, posting a consolidated net income of
P5,279 million in the first half of 2016. This represents 55% income growth from 2015,
attributed to increase in sales volumes supported by its aggressive network expansion,
improved production and cost efficiencies, and a deeper focus on customer programs.
Consolidated sales volumes increased by 9% to 51.8 million barrels in the first 6 months of
2016. Petron saw robust growth across its major businesses namely Retail, Industrial,
Liquefied Petroleum Gas (LPG) and Lubricants in both countries. Philippine sales volume

Management Discussion and Analysis Page 10
grew 10% to 32.7 million barrels, remaining the undisputed leader in retail through the
aggressive network expansion and posting double digit growth during the period in its
Industrial, Lubricants and LPG businesses. Malaysia sales, on the other hand, spurred
volumes by 8% to 19 million barrels as more focused customer programs grew preference
and confidence in Petron Malaysia’s products and services.
The prolonged slump in oil prices, with Dubai crude averaging $36.80 per barrel in the first
half of 2016 compared to $56.59 per barrel last year, led to Petron sale revenues declining by
13% to P161,863 million for the first half of 2016. The decrease in prices coupled with
reduced product “cracks” was however offset by the improved refinery margins resulting
from the Bataan Refinery upgrade which has substantially increased the production of high
margin products. Operating income increased by 29% to reach P11,479 million during the
first semester of 2016.
2015 vs. 2014
Petron closed the first semester of 2015 with a P3,408 million net income, 13% higher than
2014, following a strong second quarter performance. For the second quarter of 2015 alone,
a net income of P3,151 million was recognized resulting from higher volumes due to
increased production from the Bataan Refinery and higher margin due to steadier crude oil
prices during the quarter.
June 2015 volumes ended at about 47.4 million barrels, 9% above 2014’s level. Philippine
operations led the volume growth with 29.7 million barrels, 17% ahead of 2014, on account
of the 10% increase in retail sales and 25% growth in LPG business. Petron Malaysia’s
volumes, on the other hand, contributed about 17.7 million barrels.
Meanwhile, consolidated revenues continued to reflect weakness in finished product prices
causing a 28% decline and ended at P186,051 million.
With increased volumes and improved margins, first semester of 2015 consolidated
operating income of P8,876 million grew by 48%.
6. INFRASTRUCTURE
2016 vs. 2015
The Infrastructure business, mainly composed of Metro Manila Skyway (Skyway) and South
Luzon Expressway (SLEX) operations, contributed P9,779 million in revenues and P5,035
million in operating income, registering growth of 14% and 9%, respectively, on a full
semester comparison. The increase in revenues is driven by higher traffic from Skyway,
SLEX, Southern Tagalog Arterial Road (STAR), and full semester operations of Sections 1
and 2 for Tarlac-Pangasinan-La Union Toll Expressway (TPLEX).
2015 vs. 2014
The 2015 first semester results of the Infrastructure business, mainly represents the tollway
operations of the Skyway and SLEX for the period from March 5, 2015 to June 30, 2015,
and the first semester financial performance of TPLEX and STAR. The consolidation of the
Skyway and SLEX with SMC group starting March 5, 2015 contributed P5,305 million in
toll revenues and about P2,987 million in operating income in June 2015.

Management Discussion and Analysis Page 11
June 2014 revenue and operating loss of the Infrastructure business amounted to P397
million and P87 million, respectively, which comprise mainly of the tollway operations of
TPLEX and STAR.
III. FINANCIAL POSITION
2016 vs. 2015
The Group’s consolidated total assets as of June 30, 2016 amounted to P1,275,862 million,
P29,840 million higher than 2015. The increase is primarily due to the higher balance of
cash and cash equivalents, from the net proceeds of the issuance of Series “2” preferred
shares of the Parent Company and the recognition of receivable from PLDT and Globe
related to the sale of the investment in shares of stock of Vega and the assignment of the
receivables from Vega and its subsidiaries.
Cash and cash equivalents increased by P8,921 million mainly due to the net proceeds from
the: (a) issuance of Series "2 - G, H and I" Preferred Shares of the Parent Company and
(b) 50% down payment from the sale of investment in shares of stock of Vega and
assignment of Telco advances, net of the payment of: (a) long-term debt of the Parent
Company; (b) loans payable of Petron and SMPI; and (c) dividends and distributions.
Trade and other receivables increased by P24,388 million primarily due to the receivable
from PLDT and Globe related to the sale of the investment in shares of stock of Vega and
the assignment of the receivables from Vega and its subsidiaries.
Inventories increased by P12,403 million mainly due to: a) higher price and volume of crude
and finished products of Petron Philippines; b) importation of certain major raw materials,
usage of which will commence in the third quarter of 2016 by SMPFC; c) higher volume of
banker fuel oil importation by SL Harbour Bulk Terminal Corporation (SLHBTC); and d)
purposive build-up of molasses by GSMI.
Biological assets increased by P236 million, mainly due higher piglet cost.
Investments and advances decreased by P1,985 million in 2016 mainly due to
reclassification to investment in subsidiaries of the advances for the acquisition of: (a) the
shares of stock of E-Fare Investment Holdings, Inc. and (b) 49% non-controlling interest in
ULC BVI.
Investment property increased by P1,643 million mainly due to the consolidation of E-fare's
balance.
Other intangible assets decreased by P19,290 million primarily due to the deconsolidation of
licenses attributed to the subsidiaries of Vega, net of the recognition of additional concession
rights for the various infrastructure project, such as: Skyway Stage 3, TPLEX, NAIA
Expressway, Boracay Airport and Manila North Harbor Development Program in 2016.
Deferred tax assets increased by P1,059 million mainly due to the recognition by the Parent
Company of deferred tax asset on net operating loss carry over.
Other noncurrent assets increased by P4,354 million mainly due to the down payment for the
engineering procurement and construction contract for MRT 7 Project.

Management Discussion and Analysis Page 12
The increase in income and other taxes payable of P1,360 million in 2016 was mainly due to
higher income tax and Value-added Tax (VAT) payable attributable to the increase in net
sales and service revenue of SLHBTC.
Dividends payable increased by P1,726 million mainly due to the dividend declared by the
Parent Company to its preferred stockholders owning Series 1 and Series 2 – B, C, D, E, F,
G, H and I, on May 12, 2016, which was subsequently paid on July 6, 2016. The Parent
Company has no outstanding dividend payable to its preferred stockholders as of
December 31, 2015.
The decrease in long-term debt was mainly due to redemption of the US$300 million bonds
of SMC Global which matured in January 2016, and the payments made by the Parent
Company, Infrastructure Group, Petron, SMC PowerGen Inc. and San Miguel Yamamura
Packaging Corp. of their maturing long-term debt. This was partly offset by the availments
used to finance the following projects: (a) SMC Consolidated Power Corporation to finance
the construction of the 2x150MW Limay Power Plant (Phase I), in Bataan, and (b) Vertex
for the construction of the NAIA Expressway Project.
Deferred tax liabilities increased by P1,877 million mainly due to the application of
minimum corporate income tax and higher deferred tax liability on the inventories of Petron.
The decrease in finance lease liabilities was mainly due to payments of P11,856 million, net
of interest.
Other noncurrent liabilities decreased by P7,824 million mainly due to the deconsolidation of
Vega's balance, as a result of the sale of the investment.
Equity reserve decreased by P4,799 million primarily due to the increase in ownership
interest in ULC BVI, from 51% to 100%.
Cumulative translation adjustments increased by P1,617 million mainly due to the translation
adjustment on the net assets of foreign subsidiaries, particularly of Petron.
The decrease in treasury stock pertains to the issuance of Series “2” in Subseries G, H and I
preferred shares of the Parent Company at P75.00 per share on March 30, 2016.
2015 vs. 2014
The Group’s consolidated total assets as of June 30, 2015 amounted to P1,246,210 million,
P28,721 million higher than 2014. The increase is primarily due to the consolidation of
AAIBV’s balance of toll road concession rights to operate and maintain the SLEX and the
Skyway and the recognition of goodwill upon the consolidation of AAIBV on March 5,
2015, net of the decrease in cash and cash equivalents.
Cash and cash equivalents decreased by P52,719 million mainly due to the a) redemption of:
the preferred shares of Petron and its subsidiary and the US$284 million medium term notes
of the Parent Company; and b) payment of short-term loans of Petron and finance lease
liabilities of SMC Global, net of the proceeds from reissuance of 279,406,667 Series “1”
Preferred Shares of the Parent Company and the consolidation of AAIBV Group's cash and
cash equivalents balance.
Trade and other receivables decreased by P15,604 million mainly due to the collection of:
a) non-trade receivables of SMHC, b) advances to crude supplier of Petron and c) trade
receivables of SMPFC.
Management Discussion and Analysis Page 13
Prepaid expenses and other current assets increased by P15,824 million mainly due to the
consolidation of AAIBV Group's balance and the increase in excess of input VAT of SMC
Global and Petron Malaysia due to payments made for the costs of materials, equipment and
labor for the construction of the new power plants and with the implementation of Goods and
Services Tax starting April 1, 2015, respectively.
The decrease in assets held for sale was primarily due to the sale by Coastal View of the
investment in shares of stock of Indophil Resources NL.
Investments and advances decreased by P7,669 million mainly due to the reclassification of
the carrying amount of the investment in AAIBV, Manila Toll Expressway Systems, Inc. and
Skyway O&M Corporation to investments in subsidiaries from investments in associates.
These companies were consolidated starting March 5, 2015.
Investment property decreased by P381 million mainly due to the reclassification by SMPI to
property, plant and equipment of the land and model unit of Makati Diamond Residences.
Biological assets increased by P315 million as breeding stocks affected by typhoon Glenda
were replenished.
Goodwill increased by P17,768 million mainly due to the consolidation of AAIBV Group.
Other intangible assets increased by P58,921 million mainly due to the consolidation of
AAIBV's toll road concession rights to operate and maintain the SLEX and Stages 1 to 3 of
the Skyway; and the recognition of additional toll road concession rights for the various
infrastructure projects namely: NAIA Expressway, TPLEX, Boracay Airport and STAR in
2015.
Other noncurrent assets decreased by P6,222 million mainly due to the elimination of the
noncurrent receivable of the Parent Company from AAIBV upon its consolidation in March
2015.
Loans payable decreased by P24,978 million mainly due to the payments made by Petron
and SMPFC of their short-term loan.
Income and other taxes payable decreased by P1,049 million mainly due to the lower
accrued sales tax payable of Petron Malaysia resulting from lower regulated price of crude,
net of the consolidation of the income and other taxes payable balance of AAIBV Group.
Dividends payable decreased by P1,558 million mainly due to the payment by the Parent
Company in 2015 of the dividends payable to its preferred and common stockholders which
were outstanding in 2014.
The increase in long-term debt of P50,069 million was mainly due to the consolidation of the
balance of AAIBV Group, and the loan availments made by: a) SMC Global primarily to
finance the ongoing construction of power plants in Davao and Limay, b) Vertex to fund the
NAIA Expressway Project and c) Private Infra Dev Corporation to fund the TPLEX Project,
net of the redemption of US$284 million medium term notes of the Parent Company.
Deferred tax liabilities increased by P6,215 million due to the consolidation of AAIBV.

Management Discussion and Analysis Page 14
Equity reserve increased by P328 million primarily due to the acquisition by San Miguel
Pure Foods International, Limited of the 49% equity interest of Hormel Netherlands B.V. in
San Miguel Pure Foods Investment (BVI) Limited.
Cumulative translation adjustments decreased by P1,189 million mainly due to the
translation adjustments on the net assets of foreign subsidiaries, particularly of Petron.
Additional appropriation on retained earnings was made by SMPFC to cover the expansion
projects of its subsidiaries.
The decrease in treasury stock by P20,956 million pertains to the reissuance of 279,406,667
Series “1” Preferred Shares from the treasury stock of the Parent Company.
Non-controlling interests decreased by P15,907 million mainly due to the redemption of the
preferred shares of Petron and its subsidiary, net of the NCI recognized upon the
consolidation of AAIBV Group.
Equity
The increase in equity is due to:
(In millions) June 30
2016 2015
Reissuance of treasury shares P29,722 P 20,956
Income during the period 35,281 17,010
Reduction to non-controlling
interests and others (4,924) (15,812)
Issuance of capital stock 69 26
Other comprehensive income (loss) 2,948 (2,021)
Cash dividends and distributions (12,764) (9,861)
P50,332 P10,298
IV. SOURCES AND USES OF CASH
A brief summary of cash flow movements is shown below:
(In millions) June 30
2016 2015
Net cash flows provided by operating activities P33,773 P11,293
Net cash flows used in investing activities (13,813) (15,509)
Net cash flows used in financing activities (11,508) (50,594)
Net cash flows provided by operating activities for the period basically consists of income
for the period less changes in noncash current assets, certain current liabilities and others.

Management Discussion and Analysis Page 15
Major components of net cash flows used in investing activities included the following:
(In millions) June 30
2016 2015
Proceeds from disposal of discontinued operations, net
of cash and cash equivalents disposed of P24,154 P -
Proceeds from sale of investments and property and
equipment 136 698
Interest received 1,825 2,172
Increase in other noncurrent assets and others (21,770) (5,280)
Additions to property, plant and equipment (15,903) (24,928)
Acquisition of subsidiaries (1,724) (1,095)
Additions to investments and advances (538) (1,498)
Cash and cash equivalents acquired from business
combination, net of cash paid - 14,415
Major components of net cash flows used in financing activities included the following:
(In millions) June 30
2016 2015
Proceeds from reissuance of treasury shares P29,722 P 20,956
Proceeds from (payment of) short-term loans - net 2,641 (24,091)
Proceeds from (payments of) long-term debt - net (18,007) 133
Payment of finance lease liabilities (11,855) (10,997)
Payment of cash dividends and distributions (11,103) (11,421)
Increase (decrease) in non-controlling interests (2,975) 558
Redemption of preferred shares of subsidiaries - (40,642)
Net proceeds from issuance of preferred shares of a
subsidiary - 14,884
The effect of exchange rate changes on cash and cash equivalents amounted to P469 million
and P2,091 million on June 30, 2016 and 2015, respectively.
V. KEY PERFORMANCE INDICATORS
The following are the major performance measures that the Group uses. Analyses are
employed by comparisons and measurements based on the financial data of the current
period against the comparative period of previous year. Please refer to Item II “Financial
Performance” for the discussion of certain Key Performance Indicators.
June 30 2016 December 2015
Liquidity:
Current Ratio 1.54 1.32
Solvency:
Debt to Equity Ratio 1.93 2.24 Asset to Equity Ratio 2.93 3.24
Profitability:
Return on Average Equity Attributable to Equity
Holders of the Parent Company 10.81% 5.20%
Interest Rate Coverage Ratio 3.72 3.39

Management Discussion and Analysis Page 16
Period Ended June 30 2016 2015
Operating Efficiency:
Volume Growth 11% 6%
Revenue Growth (1%) (17%)
Operating Margin 15% 12%
The manner by which the Group calculates the key performance indicators is as follows:
KPI Formula
Current Ratio
Current Assets
Current Liabilities
Debt to Equity Ratio
Total Liabilities (Current + Noncurrent)
Equity + Non-controlling Interests
Asset to Equity Ratio
Total Assets (Current + Noncurrent)
Equity + Non-controlling Interests
Return on Average
Equity
Net Income Attributable to Equity Holders of the Parent Company*
Average Equity Attributable to Equity Holders of the Parent
Company
Interest Rate Coverage
Ratio
Earnings Before Interests, Taxes, Depreciation and Amortization
Interest Expense and Other Financing Charges
Volume Growth
Sum of all Businesses’ Revenue at Prior Period Prices
Prior Period Net Sales
Revenue Growth
Current Period Net Sales
Prior Period Net Sales
Operating Margin
Income from Operating Activities
Net Sales
* Annualized for quarterly reporting
-1
-1

