contentscensusindia.gov.in/vital_statistics/ahs/ahs_report_part2.pdf · figure 6.2: comparison of...
TRANSCRIPT


ii

iii
CONTENTS
CONTENTS ��������������������������������������������������������������������������������������������������������������������������������������������������������������������� ���
LIST OF TABLES ������������������������������������������������������������������������������������������������������������������������������������������������������������� ��
LIST OF MAPS ��������������������������������������������������������������������������������������������������������������������������������������������������������������� ���
LIST OF ABBREVIATIONS ��������������������������������������������������������������������������������������������������������������������������������������������� ����
EXECUTIVE SUMMARY �������������������������������������������������������������������������������������������������������������������������������������������������� ��
INTRODUCTION ��������������������������������������������������������������������������������������������������������������������������������������������������������������� �
NUTRITIONAL STATUS OF CHILDREN BELOW 5 YEARS ��������������������������������������������������������������������������������������������������� �
NUTRITIONAL STATUS OF SCHOOL-AGED CHILDREN AND ADOLOSCENTS (5-18 YEARS) ��������������������������������������������� ��
NUTRITIONAL STATUS OF ADULT POPULATION ����������������������������������������������������������������������������������������������������������� ��
PREVALENCE OF ANAEMIA ������������������������������������������������������������������������������������������������������������������������������������������� ��
HIGH BLOOD SUGAR LEVELS ��������������������������������������������������������������������������������������������������������������������������������������� ��
HIGH BLOOD PRESSURE LEVELS ���������������������������������������������������������������������������������������������������������������������������������� ��
CHILD NUTRITIONAL DEPRIVATION INDEX ���������������������������������������������������������������������������������������������������������������� ���
CH
APT
ER
S

iv
LIST OF TABLES
TABLE 1.1: CAB SAMPLE PARTICULARS FOR NUTRITIONAL STATUS FOR BELOW 5 YEARS FOR ALL THE NINE AHS STATES ...................... 5
TABLE 1.2: CAB SAMPLE PARTICULARS FOR NUTRITIONAL STATUS, FOR AGE GROUPS: 5-18 YEARS, 18-59 YEARS AND 60 YEARS AND ABOVE, FOR ALL THE NINE AHS STATES ..................................................................................................................................................... 6
TABLE 1.3: CAB SAMPLE PARTICULARS FOR ANAEMIA BY HAEMOGLOBIN LEVEL FOR ALL THE NINE AHS STATES .................................. 6
TABLE 1.4: CAB SAMPLE PARTICULARS FOR BLOOD SUGAR, HYPERTENSION AND IODINE CONTENT FOR ALL THE NINE AHS STATES...... 6
TABLE 2.1: STUNTING, WASTING AND UNDERWEIGHT (%) AMONG CHILDREN BELOW AGE 5 ..................................................................... 8
TABLE 2.2: UNDERNOURISHED AND OVERNOURISHED (%) AMONG CHILDREN BELOW 5 YEARS ................................................................ 9
TABLE 2.3: WASTING, STUNTING AND UNDERWEIGHT AMONG MALE-FEMALE (%) .................................................................................... 9
TABLE 2.4: UNDERNOURISHED AND OVERNOURISHED MALE-FEMALE (%) ............................................................................................... 14
TABLE 2.5: LIST OF 100 DISTRICTS WITH HIGHEST PREVALENCE OF CHILD WASTING, STUNTING AND UNDERWEIGHT, 2014 ................... 15
TABLE 2.6: LIST OF 100 DISTRICTS WITH HIGHEST PREVALENCE OF UNDER- AND OVER-NUTRITION AMONG CHILDREN .......................... 17
TABLE 2.7: COEFFICIENT OF VARIATION OF DISTRICT LEVEL WASTING, STUNTING AND UNDERWEIGHT CHILDREN BELOW 5 YEARS IN EACH STATE, 2014 ..................................................................................................................................................................................... 19
TABLE 2.8: COEFFICIENT OF VARIATION OF DISTRICT LEVEL UNDERNOURISHED AND OVERNOURISHED CHILDREN BELOW 5 YEARS IN EACH STATE, 2014 ..................................................................................................................................................................................... 19
TABLE 2.9: COEFFICIENT OF VARIATION OF DISTRICT LEVEL WASTING, STUNTING, UNDERWEIGHT, UNDERNOURISHED AND OVER NOURISHED CHILDREN BELOW 5 YEARS AMONG MALE AND FEMALE, 2014 .............................................................................................. 20
TABLE 2.10: INTER-DISTRICT RANGEIN WASTING, STUNTING AND UNDERWEIGHT AMONG CHILDREN BELOW 5 YEARS ........................... 21
TABLE 2.11: INTER-DISTRICT RANGE IN UNDERNOURISHED AND OVERNOURISHED CHILDREN BELOW 5 YEARS ...................................... 22
TABLE 3.1: UNDERNOURISHED AND OVERNOURISHED (%), 2014 .............................................................................................................. 28
TABLE 3.2: UNDERNOURISHED AND OVERNOURISHED IN RURAL AREAS (%) ............................................................................................ 33
TABLE 3.3: UNDERNOURISHED AND OVERNOURISHED AMONG MALE AND FEMALE (%) ........................................................................... 33
TABLE 3.4: LIST OF 100 DISTRICTS WITH HIGHEST PERCENTAGE OF UNDERNOURISHED AND OVERNOURISHED POPULATION (5-18 YEARS), 2014 ........................................................................................................................................................................................................... 35
TABLE 3.5: LIST OF 10 DISTRICTS WITH HIGHEST PREVALENCE OF UNDERNOURISHED AND OVERNOURISHED IN RURAL AREAS (5-18 YEARS), 2014 .............................................................................................................................................................................................. 37
TABLE 3.6:COEFFICIENT OF VARIATION OF DISTRICT LEVEL UNDERNOURISHED AND OVERNOURISHED POPULATION AMONG 5-18 YEARS IN EACH STATE, 2014 ................................................................................................................................................................................. 37
TABLE3.7: COEFFICIENT OF VARIATION OF DISTRICT LEVEL UNDERNOURISHED AND OVERNOURISHED MALE-FEMALE POPULATION AMONG 5-18 YEARS, 2014 .......................................................................................................................................................................... 38
TABLE 3.8: DISTRICT-WISE DISPARITY IN DISTRICT LEVEL UNDERNOURISHED AND OVERNOURISHED MALE-FEMALE POPULATION AMONG 5-18 YEARS, 2014 ....................................................................................................................................................................................... 39
TABLE 3.9: NUMBER OF DISTRICTS WITH HIGH GENDER DIFFERENTIAL IN UNDERNOURISHED AND OVERNOURISHED POPULATION (5-18 YEARS), 2014 .............................................................................................................................................................................................. 40
TABLE 3.10: LIST OF 10 DISTRICTS WITH HIGH MALE-FEMALE RATIO DIFFERENTIAL IN UNDERNOURISHED AND OVERNOURISHED POPULATION (5-18 YEARS), 2014 ............................................................................................................................................................... 40
TABLE 4.1: BODY MASS INDEX DISTRIBUTION ACROSS AHS STATES, 2014 ............................................................................................. 44
TABLE 4.2: BODY MASS INDEX DISTRIBUTION IN RURAL AREAS, 2014 ..................................................................................................... 49
TABLE 4.3: BODY MASS INDEX DISTRIBUTION AMONG MALE AND FEMALE, 2014 .................................................................................... 50
TABLE 4.4: LIST OF 100 DISTRICTS WITH HIGHEST PREVALENCE OF UNDERWEIGHT, OVERWEIGHT AND OBESITY AMONG POPULATION AGED 18-59 YEARS ..................................................................................................................................................................................... 51
TABLE 4.5: LIST OF 100 DISTRICTS WITH HIGHEST PREVALENCE OF UNDERWEIGHT, OVERWEIGHT AND OBESITY AMONG ELDERLY POPULATION (AGED 60 YEARS AND ABOVE) .............................................................................................................................................. 53

v
TABLE 4.6: LIST OF 10 DISTRICTS IN RURAL AREAS WITH HIGHEST PERCENTAGE OF POPULATION WITH BMI LESS THAN 18.5, GREATER THAN EQUAL TO 25 AND 30 AMONG AGE GROUPS 18-59 YEARS, (2014) .................................................................................................... 56
TABLE 4.7: LIST OF 10 DISTRICTS IN RURAL AREAS WITH HIGHEST PERCENTAGE OF POPULATION WITH BMI LESS THAN 18.5, GREATER THAN EQUAL TO 25 AND 30 AMONG AGE GROUP 60 YEARS AND ABOVE, (2014) ....................................................................................... 56
TABLE 4.8: COEFFICIENT OF VARIATION OF DISTRICT LEVEL BMI LESS THAN 18.5, GREATER THAN EQUAL TO 25 IN EACH STATE ......... 57
TABLE 4.9: COEFFICIENT OF VARIATION OF DISTRICT LEVEL MALE AND FEMALE BMI LESS THAN 18.5 IN EACH STATE ......................... 57
TABLE 4.10: STATE-WISE INTER-DISTRICT RANGE IN BMI DISTRIBUTION ................................................................................................. 58
TABLE 4.11: NUMBER OF DISTRICTS WITH HIGH GENDER DIFFERENTIAL IN BMI LESS THAN 18.5 AMONG AGE GROUPS 18-59 YEARS; AND 60 YEARS AND ABOVE, (2014) .................................................................................................................................................................... 59
TABLE 4.12: LIST OF 10 DISTRICTS WITH HIGHESTGENDER DIFFERENTIAL IN BMI LESS THAN 18.5 AMONG AGE GROUPS 18-59 YEARS; AND 60 YEARS AND ABOVE ........................................................................................................................................................................ 60
TABLE 5.1: ANAEMIA STATUS BY HAEMOGLOBIN LEVEL (%), 2014 ......................................................................................................... 66
TABLE5.2: ANAEMIA STATUS BY HAEMOGLOBIN LEVEL OF MALES AND FEMALES (%), 2014 .................................................................. 67
TABLE5.3: ANAEMIA STATUS BY HAEMOGLOBIN LEVEL OF MALES AND FEMALES IN RURAL AREAS (%), 2014 ...................................... 72
TABLE 5.4: SEVERE ANAEMIA STATUS BY HAEMOGLOBIN (%), 2014 ....................................................................................................... 73
TABLE5.5: SEVERE ANAEMIA STATUS BY HAEMOGLOBIN LEVEL OF MALES AND FEMALES (%), 2014 .................................................... 73
TABLE 5.6: SEVERE ANAEMIA STATUS BY HAEMOGLOBIN LEVEL OF MALES AND FEMALES IN RURAL AREAS (%), 2014 ........................ 74
TABLE: 5.7 IODINE CONTENT IN HOUSEHOLD SALT (%), 2014 .................................................................................................................. 75
TABLE 5.8: LIST OF 100 DISTRICTS WITH HIGHEST PREVALENCE OF ANAEMIA ACROSS DIFFERENT AGE GROUPS, 2014 ........................... 76
TABLE 5.9: LIST OF 100 DISTRICTS WITH LOWEST PERCENTAGE OF IODINE CONTENT IN HOUSEHOLD SALT (MORE THAN 15 PPM) (%), 2014 ........................................................................................................................................................................................................... 78
TABLE 5.10: COEFFICIENT OF VARIATION OF DISTRICT LEVEL ANAEMIA ACROSS AGE GROUPS ............................................................... 81
TABLE 5.11: COEFFICIENT OF VARIATION OF DISTRICT LEVEL IODINE CONTENT IN HOUSEHOLD SALT .................................................... 81
TABLE 5.12: DISTRICTS-WISE DISPARITY IN ANAEMIA, 2014 ..................................................................................................................... 82
TABLE 6.1: BLOOD SUGAR LEVEL (%), 2014 ............................................................................................................................................. 85
TABLE 6.2: BLOOD SUGAR LEVEL (18 YEARS AND ABOVE) AMONGST MALES AND FEMALE, 2014 ........................................................... 86
TABLE 6.3: BLOOD SUGAR LEVEL (18 YEARS AND ABOVE) AMONGST MALES AND FEMALE IN RURAL AREAS, 2014 ............................... 86
TABLE 6.4: LIST OF 100 DISTRICTS WITH HIGHEST BLOOD SUGAR, 2014 ................................................................................................... 91
TABLE 6.5: LIST OF 10 DISTRICTS WITH HIGH BLOOD SUGAR IN RURAL AREAS, 2014 ............................................................................... 93
TABLE 6.6: DISTRICT-WISE DISPARITY IN DISTRICT LEVEL BLOOD SUGAR, 2014....................................................................................... 94
TABLE 6.7: MALE-FEMALE DIFFERENTIALS IN BLOOD SUGAR, 2014 ......................................................................................................... 95
TABLE 6.8: NUMBER OF DISTRICTS WITH HIGH MALE-FEMALE RATIO DIFFERENTIAL IN BLOOD SUGAR, 2014 .......................................... 95
TABLE 7.1: HYPERTENSION (18 YEARS AND ABOVE (%)), 2014 ................................................................................................................. 98
TABLE 7.2: HYPERTENSION 18 YEARS AND ABOVE IN RURAL AREAS (%), 2014 ........................................................................................ 99
TABLE 7.3: HYPERTENSION 18 YEARS AND ABOVE AMONG MALES AND FEMALES (%), 2014 ................................................................. 102
TABLE 7.4: LIST OF 100 DISTRICTS WITH HIGHEST ABOVE NORMAL RANGE BLOOD PRESSURE LEVEL, 2014 .......................................... 105
TABLE 7.5: COEFFICIENT OF VARIATION OF DISTRICT LEVEL ABOVE NORMAL RANGE HYPERTENSION IN EACH STATE, 2014 ............... 107
TABLE 7.6: COEFFICIENT OF VARIATION OF DISTRICT LEVEL ABOVE NORMAL RANGE HYPERTENSION AMONG MALE-FEMALE IN EACH STATE, 2014 ............................................................................................................................................................................................. 107
TABLE 7.7: DISTRICT-WISE DISPARITY IN ABOVE NORMAL RANGE HYPERTENSION, 2014 ....................................................................... 108
TABLE8.1: DISTRICTS WITH HIGHEST AND LOWEST NUTRITIONAL DEPRIVATIONINDEX VALUE ACROSS AHS STATES .......................... 112
TABLE 8.2: LIST OF 10 BEST AND WORST DISTRICTS ON NUTRITIONAL DEPRIVATION INDEX .................................................................. 112
TABLE8.3:RANKING OF AHS DISTRICTS ON CHILD NUTRITIONAL DEPRIVATION INDEX (CNDI) ........................................................... 114

vi
List of Figures
FIGURE 2.1: COMPARISON OF DISTRICT-LEVEL PREVALENCE OF UNDERWEIGHT IN CHILDREN ACROSS REGION AND SEX...................... 23
FIGURE 2.2: COMPARISON OF DISTRICT-LEVEL PREVALENCE OF STUNTING IN CHILDREN ACROSS REGION AND SEX ............................. 23
FIGURE 2.3: ASSOCIATION OF STUNTING, WASTING AND UNDERWEIGHT PREVALENCE WITH LITERACY RATES .................................... 24
FIGURE 2.4: ASSOCIATION BETWEEN DISTRICT LEVEL PREVALENCE OF STUNTING AND SELECTED CHILD HEALTH INDICATORS ............ 25
FIGURE 2.5: ASSOCIATION BETWEEN DISTRICT LEVEL PREVALENCE OF UNDERWEIGHT AND SELECTED CHILD HEALTH INDICATORS .... 26
FIGURE 3.1: STATE-WISE DISTRIBUTION OF 100 DISTRICTS WITH HIGHEST PERCENTAGE OF UNDERNOURISHED AND OVERNOURISHED
POPULATION (5-18 YEARS), 2014 ...................................................................................................................................................... 34
FIGURE 3.2: COMPARISON OF UNDERNOURISHMENT AND OVERNOURISHMENT IN SCHOOL GOING AGED CHILDREN ACROSS REGION AND
SEX .................................................................................................................................................................................................. 41
FIGURE 3.3: ASSOCIATION OF UNDERNOURISHMENT IN SCHOOL GOING AGED CHILDREN AND OTHER DEVELOPMENTAL INDICATORS ... 42
FIGURE 4.1: STATE-WISE DISTRIBUTION OF 100 DISTRICTS WITH HIGHEST PERCENTAGE OF POPULATION WITH BMI LESS THAN 18.5,
GREATER THAN EQUAL TO 25 AND 30 AMONG AGE GROUPS 18-59 YEARS, (2014) .............................................................................. 55
FIGURE 4.2: STATE-WISE DISTRIBUTION OF 100 DISTRICTS WITH HIGHEST PERCENTAGE OF POPULATION WITH BMI LESS THAN 18.5,
GREATER THAN EQUAL TO 25 AND 30 AMONG AGE GROUPS 60 YEARS AND ABOVE, (2014) ................................................................. 55
FIGURE 4.3: COMPARISON OF THE PREVALENCE OF OVERWEIGHT ADULTS ACROSS REGION AND SEX .................................................. 61
FIGURE 4.4: COMPARISON OF THE PREVALENCE OF UNDERWEIGHT ADULTS ACROSS REGION AND SEX ................................................ 62
FIGURE 4.5: ASSOCIATION OF ADULT NUTRITIONAL STATUS WITH OVERALL LITERACY RATES AND CHILD NUTRITIONAL STATUS ........ 63
FIGURE 4.6: ASSOCIATION OF LOW BMI IN FEMALES WITH HEALTH AND DEVELOPMENTAL INDICATORS ............................................ 64
FIGURE 5.1: STATE-WISE DISTRIBUTION OF 100 DISTRICTS WITH HIGHEST PREVALENCE OF ANAEMIA ACROSS AGE GROUPS ................ 80
FIGURE 5.2: STATE-WISE DISTRIBUTION OF 100 DISTRICTS WITH LOWEST PERCENTAGE OF HOUSEHOLDS USING IODISED SALT ........... 80
FIGURE 6.1: STATE-WISE DISTRIBUTION OF 100 DISTRICTS WITH HIGHEST BLOOD SUGAR LEVELS, 2014 ............................................. 93
FIGURE 6.2: COMPARISON OF BLOOD SUGAR LEVELS ACROSS REGION AND SEX AND LITERACY RATE ................................................. 96
FIGURE 7.1: COMPARISON OF BLOOD PRESSURE ACROSS REGION AND SEX AND ASSOCIATION WITH BLOOD PRESSURE AND LITERACY
RATE. ............................................................................................................................................................................................. 109
FIGURE 7.2: COMPARISON OF BLOOD PRESSURE WITH CHRONIC ILLNESS AND IODINE CONTENT. ...................................................... 109
FIGURE 8.1: STATE-WISE DISTRIBUTION OF WORST 100 DISTRICTS ONNUTRITIONAL DEPRIVATIONINDEX ......................................... 117
FIGURE 8.2: ASSOCIATION OF CHILD NUTRITION DEPRIVATION INDEX WITH MATERNAL AND CHILD HEALTH INDICATORS ................ 118

vii
LIST OF MAPS
MAP 2.1: PREVALENCE OF STUNTING AMONG CHILDREN BELOW 5 YEARS (2014) IN AHSSTATES (DISTRICT WISE) ..... 10
MAP 2.2: PREVALENCE OF WASTING AMONG CHILDREN BELOW 5 YEARS (2014) IN AHSSTATES (DISTRICT WISE) ...... 11
MAP 2.3: PREVALENCE OF UNDERWEIGHT AMONG CHILDREN BELOW 5 YEARS (2014) IN AHSSTATES (DISTRICT WISE) ..................................................................................................................................................................................... 12
MAP 2.4: PREVALENCE OF UNDERNUTRITION AMONG CHILDREN BELOW 5 YEARS (2014) IN AHSSTATES (DISTRICT WISE) ............................................................................................................................................................................ 13
MAP 3.1: PREVALENCE OF UNDER-NUTRITION (BELOW-2 SD) IN AGE GROUP 5-18 YEARS (2014) ................................ 28
MAP 3.2: PREVALENCE OF UNDER-NUTRITION (BELOW-3 SD) IN AGE GROUP 5-18 YEARS ........................................... 30
MAP 3.3: PREVALENCE OF OVER-NUTRITION (ABOVE 2 SD) IN AGE GROUP 5-18 YEARS .............................................. 31
MAP 3.4: PREVALENCE OF OVER-NUTRITION (ABOVE 3 SD) IN AGE GROUP 5-18 YEARS .............................................. 32
MAP 4.1: PERCENTAGE OF UNDERWEIGHT (BMI LESS THAN 18.5) POPULATION AGED 18-59 YEARS ........................... 45
MAP 4.2: PERCENTAGE OF UNDERWEIGHT (BMI < 18.5) PREVALENCE AMONG ELDERLY (AGED 60 YEARS AND ABOVE) ..................................................................................................................................................................................... 46
MAP 4.3: PERCENTAGE OF OVERWEIGHT (BMI 25.0) POPULATION AGED 18-59 YEARS ............................................. 47
MAP 4.4: PERCENTAGE OF OVERWEIGHT (BMI 25.0) AMONG ELDERLY POPULATION (AGED 60 YEARS AND ABOVE) 48
MAP 5.1: ANAEMIA STATUS BY HAEMOGLOBIN LEVEL OF CHILDREN AGED 6-59 MONTHS ........................................... 68
MAP 5.2: ANAEMIA STATUS BY HAEMOGLOBIN LEVEL OF CHILDREN AGED 5 9 YEARS .............................................. 69
MAP 5.3: ANAEMIA STATUS BY HAEMOGLOBIN LEVEL OF CHILDREN AGED 10 17 YEARS .......................................... 70
MAP 5.4: SEVERE ANAEMIA STATUS BY HAEMOGLOBIN LEVEL OF CHILDREN AGED 5 9 YEARS ................................. 71
MAP 6.1: PERCENTAGE OF MALES (18 YEARS AND ABOVE) WITH BLOOD SUGAR 110 MG/DL (2014) ......................... 87
MAP 6.2: PERCENTAGE OF FEMALES (18 YEARS AND ABOVE) WITH BLOOD SUGAR 110 MG/DL (2014) ...................... 88
MAP 6.3: PERCENTAGE OF MALES (18 YEARS AND ABOVE) WITH BLOOD SUGAR 130 MG/DL (2014) ......................... 89
MAP 6.4: PERCENTAGE OF FEMALES (18 YEARS AND ABOVE) WITH BLOOD SUGAR 130 MG/DL (2014) ...................... 90
MAP 7.1: PERCENTAGE OF POPULATION (18 YEARS AND ABOVE) WITH BLOOD PRESSURE LEVEL ABOVE NORMAL RANGE ........................................................................................................................................................................ 100
MAP 7.2: PERCENTAGE OF RURAL POPULATION (18 YEARS AND ABOVE) WITH BLOOD PRESSURE ABOVE NORMAL RANGE ........................................................................................................................................................................ 101
MAP 7.3: PERCENTAGE OF MALES (18 YEARS AND ABOVE) WITH BLOOD PRESSURE ABOVE NORMAL RANGE ............. 103
MAP 7.4: PERCENTAGE OF FEMALES (18 YEARS AND ABOVE) WITH BLOOD PRESSURE ABOVE NORMAL RANGE ......... 104
MAP 8.1: CHILD NUTRITIONAL DEPRIVATION INDEX ACROSSAHS STATES (DISTRICT WISE) ....................................... 113

viii
LIST OF ABBREVIATIONS AHS Annual health survey ANM Auxiliary nurse midwife BMI Body mass index BP Blood pressure CAB Clinical, anthropometric and bio-chemical CEB Census enumeration blocks CI Confidence interval CV Coefficient of variation DCO Directorate of census operations DG Director general DGHS Director general of health services DMRC Desert medical research centre EAG Empowered action group Hb Hemoglobin ICMR Indian council of medical research IEC Institutional ethics committee IFA Iron and folic acid IMR Infant mortality rate MCPC Mother and child protection card MOHFW Ministry of health and family welfare NCD Non-communicable diseases NFI Nutrition foundation of india NIHFW National institute of health & family welfare NIN National institute of nutrition NSSO National sample survey office ORGI Office of registrar general PPM Parts per million PRSE Percentage relative standard error PSU Primary sample units RMRC Regional medical research centre SD Standard deviation SPSS Statistical package for social science SRS Sample registration system TAG Technical advisory group UFMR Under-five mortality rate UIP Universal immunization program WHO World health organization

ix
EXECUTIVE SUMMARY 0.1 To supplement the information provided by the Annual Health Survey (AHS), a biomarker component has been introduced in order to collect data for the Empowered Action Group (EAG) States & Assam. The CAB survey is specifically designed to fill the data gaps on nutritional status, life style diseases like diabetes & hypertension and anaemia so that district-specific programmes can be drawn up, funded and implemented. This data can serve as the baseline, helping to assess not only the progress made in implementation but also the impact of these interventions and further enable enable midcourse corrections by identifying the factors responsible for poor performance. Thus, in making available district data, the CAB survey aims to contribute immensely to rapid improvement in health and nutritional indices in these States by making available district data and demonstrating good quality assessment of health and nutritional status in a community setting, enabling these States therefore to bridge the gap between poor and well performing districts. The Clinical, Anthropometric and Bio-chemical (CAB) survey has been conducted for 2014, on a sub-sample of AHS in all EAG States, namely Bihar, Chhattisgarh, Jharkhand, Madhya Pradesh, Odisha, Rajasthan, Uttarakhand & Uttar Pradesh and Assam. Indicators and instruments used for data collection 0.2 Stunting (low height-for-age), Wasting (low weight-for-height), Underweight (low weight-for-age) and undernourished (low Body Mass
Index, BMI) are the four major indicators available for measuring malnutrition level in
children under 5 years. For children in the age 5 to 18 years, undernourishment is provided and
for persons 18 years and above, BMI indicators
provided separately for male female and rural. 0.3 Anemia, measured by Hemoglobin level, is available sex wise for children, women and men. For children, the data is available for age 6-59 months, 5-9 years, and 10-17 years. Adult anemia is categorized for age 18-59 years and 60 and above. Measured by the content of salt available in household, iodine content in salt is estimated and this data is also provided. 0.4 Blood sugar and Hypertension level are provided for person age 18 and above only.
separate categories of Systolic & Diastolic measurements viz. above normal (>140/90 mm of Hg), moderately high(>160/100 mm of Hg), and very high(>180/110 mm of Hg) is provided. 0.5 Various equipments are used to take measurements and to collect data. Height is measured using Wall Mounted Statute Meter. Infantometer is used to measure the length for the children up to the age two years. Weight is recorded with the help of a Digital Weighing Scale.Automated Digital BP monitor is used to take blood pressure and Hb pipette for blood samples. Hb level is measured with the help of colorimeter in designated labs and Iodine content in household salt is measured using Salt testing kit.The survey collected data directly from the participants on the clinical components like morbidity episodes and BP measurements, anthropometric parameters like measurement of weight and length/height and collected biochemical samples like blood for Hb and fasting glucose and salt for iodine estimation.

Annual Health Survey Report
x
On the spot information on health status is provided to the participants during the survey. Sample size 0.6 The Survey has taken into consideration a subsample of 12 sample units per district on an average, in all the 284 districts except for two in Uttarakhand (Chamoli and Rudraprayag) where only 6 units could be surveyed (2 and 4 respectively) due to administrative reasons. The fasting blood sugar prevalence level has been taken as the decisive indicator for estimation of sample size at the district level. The prevalence of blood sugar among the population in the age group of 18 years and above has been considered as 4 per cent across districts while estimating the sample size. The permissible level of error has been taken as 10 percentage relative standard error (prse) at the district level. A total of 0.34 million households and 1.65 million people have been surveyed. Like in the case of AHS, the field work has been outsourced and supervision was done by ORGI. Nutritional status of children below 5 years 0.7 Undernutrition is identified as both a health outcome and a risk-factor. It initiates a vicious cycle wherein it causes several other infectious diseases (including respiratory diseases) and further deteriorates nutritional health and is identified as a major cause of child mortality. Undernutrition persists as a major public health challenge for the country. The CAB 2014 survey finds that among the AHS States stunting prevalence among children is highest in Uttar Pradesh (62 per cent), while the highest prevalence of underweight and wasting is in Jharkhand (45.7 per cent) and Chhattisgarh (32.4 per cent), respectively. Prevalence of severe stunting, is highest in Uttar Pradesh
(35.6 per cent) whereas Chhattisgarh has highest prevalence of severe underweight (18.8 per cent) and severe wasting (11.5 per cent). Among AHS States, Chhattisgarh has lowest level of stunting prevalence (34.7 per cent) whereas Uttarakhand displays lowest prevalence of underweight (28.0 per cent) and wasting (14.7 per cent). 0.8 Across districts, highest prevalence of stunting, wasting and underweight outcomes is observed in Rae Bareli district (77.4 per cent) of Uttar Pradesh, Aurangabad district of Bihar (37.2 per cent) and Hamirpur district of Uttar Pradesh (70.2 per cent), respectively. Inter-district disparities in prevalence of stunting, wasting and underweight among AHS States are highest in Madhya Pradesh (inter-district range 44.9 per cent in stunting; 32.3 per cent in wasting and 54.1 per cent in underweight). There is a positive association between district-level prevalence of underweight and stunting, thus districts with high stunting prevalence, also report a high prevalence of underweight. It may be noted that districts recording higher overall and female literacy rates tend to have lower levels of stunting, wasting and underweight among children below five years of age. Nutritional status of school aged children and adolescents (5-18 years) 0.9 The CAB survey provides vital insights regarding nutritional status of school-aged children and adolescents (5 18 years). Bihar recorded the highest prevalence of undernourishment (33 per cent) and severe undernourishment (21.7 per cent) among this age group whereas Uttarakhand recorded the lowest prevalence of 19.9 per cent and 6.1 per cent, respectively. Prevalence of overnourishment (defined as 2 SD above the

Executive Summary
xi
reference population) is comparatively low in all the States with the lowest being in Uttar Pradesh at 1.1 per cent and the highest in Uttarakhand at 3.1 per cent. 0.10 In rural areas, Rajasthan and Bihar have the maximum cases of undernourishment in the below 2SD category at 33.8 per cent and 33.7 per cent respectively. Odisha has the highest prevalence of undernourishment among males at 36.1 per cent, followed by Rajasthan at 35.9 per cent. Uttarakhand showed the least prevalence at 21.8 per cent. In the case of females, Bihar reported the highest prevalence at 30.5 per cent, and Uttarakhand the lowest at 17.8 per cent. Prevalence of severe undernourishment is also high with Bihar displaying the highest prevalence among both males and females at 24 per cent and 19.1 per cent respectively, while Uttarakhand recorded the lowest for males and females at 7.1 per cent and 5 per cent respectively. 0.11 Among the worst 100 districts with a high prevalence of under-nourishment and over-nourishment, Madhya Pradesh accounted for the maximum districts with cases of under-nourished (19) and over-nourished (22) children. Uttarakhand was the only state that did not report any case of under-nourishment in 2014-15, while 8 of its districts featured among the list of 100 districts with high levels of over-nourishment. Bihar and Uttar Pradesh too had a considerably high number of casesof both under-nourishment and over-nourishment. 0.12 Among rural areas, Sagar district in Madhya Pradesh had the maximum cases of under-nourished children in the 5-18 age groups at 60.3 per cent, followed by Araria district in Bihar at 57.9 per cent. On the other hand, Naintal district of Uttarakhand saw the highest
number of over-nourished children in 2014-15 at 12.5 per cent. Male-female differential is considerably high across States, denoting that more men tend to be under-nourished. Nutritional status of adults 0.13 Percentage of underweight population with BMI less than 18.5 among 18-59 age-groups is highest in Uttar Pradesh (30 per cent) and lowest in Chhattisgarh (15.4 per cent). Percentage of overweight population with BMI greater than or equal to 25 in 18-59 age groups is highest in Uttarakhand (21.6 per cent) and lowest in Chhattisgarh (6.3 per cent). Also, percentage of obese presons with BMI greater than or equal to 30 in the 18-59 age group is highest in Uttarakhand (4.7 per cent) and lowest in Bihar (0.6 per cent). 0.14 Among elderly population (aged 60 years and above) the percentage of underweight population with BMI less than 18.5 is the highest in Odisha (37.6 per cent) and lowest in Uttarakhand (23.4 per cent). The share of overweight among elderly population is highest in Uttarakhand (20.6 per cent) and lowest in Bihar (4.5 per cent). These States also have highest (Uttarakhand, 4.3 per cent) and lowest (Bihar, 0.5 per cent) prevalence of obesity. 0.15 Among males aged 18-59 years, the prevalence of underweight in the age group18-59 years is the highest in Uttar Pradesh (31.9 per cent) and lowest in Chhattisgarh (12.5 per cent). However, prevalence of overweight is the highest in Uttarakhand (19.4 per cent) and lowest in Bihar (5.6 per cent). Obesity prevalence is also highest in Uttarakhand (3.2 per cent) and lowest in Bihar (0.5 per cent). Among females, Odisha shows the highest underweight prevalence at 30.3 per cent while
Annual Health Survey Report
xii
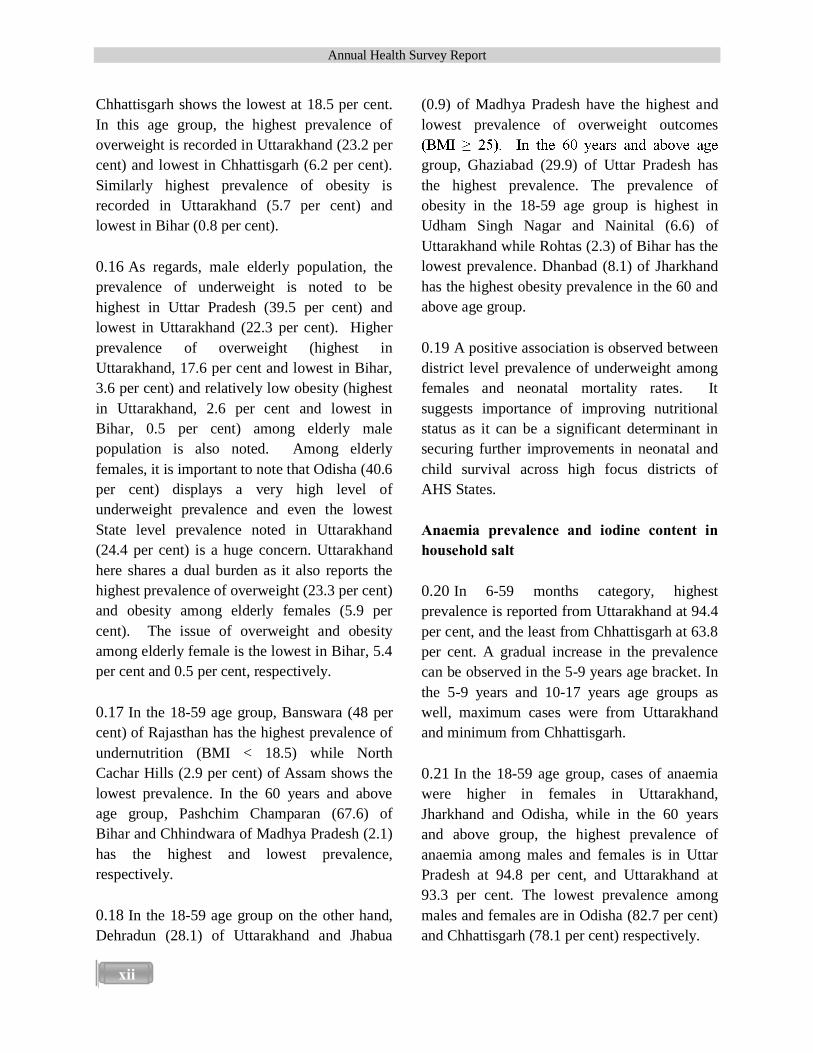
Chhattisgarh shows the lowest at 18.5 per cent. In this age group, the highest prevalence of overweight is recorded in Uttarakhand (23.2 per cent) and lowest in Chhattisgarh (6.2 per cent). Similarly highest prevalence of obesity is recorded in Uttarakhand (5.7 per cent) and lowest in Bihar (0.8 per cent). 0.16 As regards, male elderly population, the prevalence of underweight is noted to be highest in Uttar Pradesh (39.5 per cent) and lowest in Uttarakhand (22.3 per cent). Higher prevalence of overweight (highest in Uttarakhand, 17.6 per cent and lowest in Bihar, 3.6 per cent) and relatively low obesity (highest in Uttarakhand, 2.6 per cent and lowest in Bihar, 0.5 per cent) among elderly male population is also noted. Among elderly females, it is important to note that Odisha (40.6 per cent) displays a very high level of underweight prevalence and even the lowest State level prevalence noted in Uttarakhand (24.4 per cent) is a huge concern. Uttarakhand here shares a dual burden as it also reports the highest prevalence of overweight (23.3 per cent) and obesity among elderly females (5.9 per cent). The issue of overweight and obesity among elderly female is the lowest in Bihar, 5.4 per cent and 0.5 per cent, respectively. 0.17 In the 18-59 age group, Banswara (48 per cent) of Rajasthan has the highest prevalence of undernutrition (BMI < 18.5) while North Cachar Hills (2.9 per cent) of Assam shows the lowest prevalence. In the 60 years and above age group, Pashchim Champaran (67.6) of Bihar and Chhindwara of Madhya Pradesh (2.1) has the highest and lowest prevalence, respectively. 0.18 In the 18-59 age group on the other hand, Dehradun (28.1) of Uttarakhand and Jhabua
(0.9) of Madhya Pradesh have the highest and lowest prevalence of overweight outcomes
group, Ghaziabad (29.9) of Uttar Pradesh has the highest prevalence. The prevalence of obesity in the 18-59 age group is highest in Udham Singh Nagar and Nainital (6.6) of Uttarakhand while Rohtas (2.3) of Bihar has the lowest prevalence. Dhanbad (8.1) of Jharkhand has the highest obesity prevalence in the 60 and above age group. 0.19 A positive association is observed between district level prevalence of underweight among females and neonatal mortality rates. It suggests importance of improving nutritional status as it can be a significant determinant in securing further improvements in neonatal and child survival across high focus districts of AHS States. Anaemia prevalence and iodine content in household salt 0.20 In 6-59 months category, highest prevalence is reported from Uttarakhand at 94.4 per cent, and the least from Chhattisgarh at 63.8 per cent. A gradual increase in the prevalence can be observed in the 5-9 years age bracket. In the 5-9 years and 10-17 years age groups as well, maximum cases were from Uttarakhand and minimum from Chhattisgarh. 0.21 In the 18-59 age group, cases of anaemia were higher in females in Uttarakhand, Jharkhand and Odisha, while in the 60 years and above group, the highest prevalence of anaemia among males and females is in Uttar Pradesh at 94.8 per cent, and Uttarakhand at 93.3 per cent. The lowest prevalence among males and females are in Odisha (82.7 per cent) and Chhattisgarh (78.1 per cent) respectively.

Executive Summary
xiii
0.22 Highest prevalence of severe anaemia is reported from Uttarakhand in both the 6-59 months (6.3 per cent) and 5-9 years groups (17.8 per cent), while Madhya Pradesh recorded the highest prevalence in the 10-17 years group (14.8 per cent). The lowest prevalence of severe anaemia was seen in Odisha. In rural areas, highest prevalence of severe anaemia were recorded from Uttarakhand in the 6-59 months (6.6 per cent) age group, and from Madhya Pradesh in 5-9 years (18.2 per cent) and 10-17 years (14.6 per cent) groups. 0.23 Overall, the percentage of households using household salt with more than 15 ppm of iodine is the highest in Jharkhand (92.3 per cent) and lowest in Assam (46.8 per cent). At the district level, Khagaria and Purnia (100) in Bihar; and Godda and Garhwa (100) in Jharkhand had the highest use of household salt with more than 15 ppm of iodine, while Sibsagar (11.5) in Assam had the lowest percentage. The inter-district range in use of adequately iodized salt is the highest in case of Assam (88.4 per cent) and lowest in case of Chhattisgarh (29 per cent). High blood sugar levels 0.24 Assam, Chhattisgarh and Uttarakhand have higher prevalence of blood sugar levels in
per cent of the population in Uttarakhand has blood sugar levels higher than 150mg/dl, followed by 2.5 per cent in Jharkhand with high blood sugar levels and the lowest level of 1.1 per cent in Bihar. In all the states studied, individuals in rural areas have lower levels of blood sugar than those at the state level. 0.25 Chhattisgarh had the highest percentage of men (13.2 per cent) and women (9.9 per cent) in
the greater than 110mg/dl category. In the greater than 130 mg/dl section too, Chhattisgarh showed the highest prevalence, but in case of women with blood sugar levels higher than 130 mg/dl, Uttarakhand has the highest percentage of 4.2, followed by Chhattisgarh at 3.6 per cent. However, the patterns were different at the above 150 mg/dl levels as Jharkhand (2.9 per cent) had the highest level closely followed by Uttarakhand (2.7 per cent), while Bihar had the lowest level among both men and women. 0.26 Among the worst 100 districts with the highest percentage of blood sugar levels, Uttar Pradesh had a major share in all three categories
sections. Uttarakhand had 4 of its districts in the
0.27 st prevalence of blood sugar was reported from Raisen district (20.8 per cent) in Madhya Pradesh, and the lowest from Kishanganj district (1.9 per centmg/dl range, the highest variation was observed in Rajasthan, with the highest prevalence being recorded from Chittaurgarh district at 10 per cent. 0.28 In rural areas, though Dhanbad in Jharkhand had the highest levels of blood sugar
Raisen in Madhya Pradesh and Chittaurgarh in Rajasthan continue to have highest prevalence in rural areas as well. 0.29 There is a clear association between high blood sugar levels and high levels of BMI (greater than 30). Districts with a higher

Annual Health Survey Report
xiv
percentage of individuals having blood sugar levels higher than 150 mg/dl also have a higher percentage of individuals with BMI higher than 30, implying higher risk of diabetes. High blood pressure levels 0.30 Prevalence of blood pressure levels above normal range (for all the three categories combined) is the highest in Uttarakhand (28 per cent) and lowest in Chhattisgarh (18.3 per cent). Moderately high hypertension is also the highest in Uttarakhand (9.5 per cent) and lowest in Bihar (5.5 per cent). Prevalence of very high blood pressure is again observed to be highest in Uttarakhand (3.5 per cent) and lowest in Bihar (1.8 per cent). 0.31 Above normal range blood pressure among both males and females is highest in Uttarakhand (33.4 and 24.3 per cent respectively) and lowest in Chhattisgarh (19.7 and 16.8 per cent respectively). The percentage
compared to other categories of above normal range blood pressure levels. 0.32 Among the worst 100 districts with high percentages of above normal range hypertension in 2014-15, Uttar Pradesh has the highest share (30), followed by Madhya Pradesh (15), Rajasthan (12) and Bihar (11). Considerable inter-state variations are observed in case of above normal range hypertension. The CV values for 2014-15 suggest that Odisha has the highest inter-district variations in above normal range hypertension (CV 0.33) followed by Assam (0.32). 0.33 North Cachar Hills (41.2 per cent) district in Assam and Kishanganj (7.2 per cent) district
in Bihar have the highest and lowest percentages respectively of above normal range hypertension. Likewise, North Cachar Hills district in Assam (45.2 per cent) and Jashpur (9.2 per cent) of Chhattisgarh had the highest and lowest percentage respectively of above normal range hypertension in rural areas. A higher prevalence of above normal blood pressure levels in total population when compared with rural population indicates that hypertension is a greater concern in urban areas. Child nutritional deprivation index 0.34 A multidimensional child nutritional deprivation index is constructed to ascertain the relative positions of the AHS districts in overall performance in child nutrition. The index uses five key indicators viz. stunting, underweight, wasting, undernourishment and anaemia and provides equal weights to each of the dimension while arriving at a summary index of nutritional deprivation. 0.35 Districts from Odisha and Assam have the lowest scores on the child nutritional deprivation index, with Jajapur in Odisha having the lowest rate of nutritional deprivation at 0.38. Bihar and Uttar Pradesh mostly account for the worst performing districts, with Jamui district in Bihar having the highest value on the child deprivation index for instance. Overall, such poor nutritional status clearly highlights the need for policy interventions to curb such deprivations in the backward districts across the AHS States. 0.36 Among the 10 best and worst performing districts with regard to nutritional deprivation in 2014-15, while Odisha and Assam recorded the maximum number in the list of the best 10 districts in terms of low nutritional deprivation,

Executive Summary
xv
Bihar and Uttar Pradesh accounted for a majority among the worst 10. Bihar and Uttar Pradesh require immediate medical attention for children in order to control their depreciating levels of nutrition. 0.37 Among the worst 100 districts in case of child nutritional deprivation index, Uttar Pradesh has 40 while Bihar and Madhya Pradesh have 19 and 18 districts respectively, all with high levels of child deprivation. None of the districts of Uttarakhand feature in the list, meaning that the state has no districts with very high child nutritional deprivation. Districts in Assam and Chhattisgarh also perform well in
case of child nutrition with 1 and 4 districts on the child nutritional deprivation index. 0.38 Districts with a high percentage of children born with low weight have a high nutritional deprivation index. The association between children breastfed within an hour of birth and child nutrition deprivation index is negative. A negative relation is also observed between children who received full immunization and the child nutrition deprivation index, indicating that areas in which children received full immunization have lower levels of child nutrition deprivation and vice-a versa.


1
INTRODUCTION 1.1 Background and Objective 1.1 Clinical, Anthropometric and Biomarkers (CAB) component of the Annual Health Survey is designed to provide district specific information on the magnitudes of under- and overnutrition, hypertension and high fasting glucose in all the districts in 9 AHS States. Based on these data, district specific programmes can be drawn up, funded and implemented. By using this data as the baseline, an assessment of the progress and impacts of implementation can be made. This would enable midcourse corrections by identifying the factors responsible for poor performance. Thus CAB survey aims to contribute immensely to rapid improvements in health and nutritional indices in these States by making available district data and by demonstrating good quality assessment of health and nutritional status in a community setting, enabling these States therefore to bridge the gap between poor and well performing districts. 1.2 In a meeting held under the Chairmanship of the then Secretary (Health & Family Welfare), it was suggested that the component of Clinical, Anthropometric and Biomarkers tests should be included under AHS, in order to obtain data on nutritional status and information on prevalence of certain lifestyle disorders like diabetes and hypertension at the district level. The Steering Committee, constituted for AHS, set up a Technical Advisory Group (TAG) under the chairmanship of Dr. N.S. Sastry, former DG, National Sample Survey Office (NSSO) with representatives from MoHFW, Directorate General of Health Services (DGHS), ORGI, NSSO and International Institute for Population Sciences (IIPS) as
members, to decide the technical aspects of the survey including its methodology, design and coverage. 1.3 A sub-group was then constituted under the TAG to suggest the biomarker tests to be conducted under the CAB component and the methodology thereof. The sub-group held a series of meetings with different stake holders i.e. National Institute of Health & Family Welfare (NIHFW), Nutrition Foundation of India (NFI), National Institute of Nutrition (NIN), MoHFWand Indian Council of Medical Research (ICMR) before finalizing biomarker tests and their methodology. An Institutional Ethics Committee (IEC) for the CAB component was also constituted under the chairmanship of Dr. Shiv Lal, former Special DG, DGHS, to ensure adherence to proper ethical guidelines while conducting the CAB tests. The committee approved the methodology, content and protocols for conduct of the CAB tests. 1.4 The National Institute of Health & Family Welfare (NIHFW) has been the nodal agency for technical guidance, training, accuracy testing of equipments and hemoglobin testing. At the State level, the training and hemoglobin testing have been carried out by NFI, NIN and other institutions of ICMR namely Regional Medical Research Centre(RMRC) in Assam, RMRC in Bhubaneswar,RMRC for Tribals in Jabalpur and Desert Medical Research Centre(DMRC) in Jodhpur. For supplying equipments and consumables, M/s HLL Life Care Limited has been appointed by MoHFW. NIHFW and NFI have also provided inputs for the Instruction/ training manual prepared by ORGI.
1

Annual Health Survey Report
2
1.2. Core Vital and Health Indicators 1.5 Stunting is the effect of an insufficient intake of vital nutrients over a long period of time and frequent infections, leading to a failure to reach a linear growth potential. Stunting, which is also termed as low height-for-age, is associated with poor socio-economic conditions, inappropriate feeding habits and an amplified risk of exposure to adverse conditions such as illness. On the other hand, a reduction in the stunting prevalence is usually indicative of enhanced health and socio-economic conditions. 1.6 Wasting is also termed as low weight-for-height or thinness. Acute starvation and/or severe diseases are its key indicators as it is often associated with a severe process of weight loss. It may also be a consequenceof chronic unfavourable condition. 1.7 Underweight is a condition reflecting a low level of body mass relative to the corresponding age. Weight-for-age is determined by both the height of the child (height-for-age) and weight (weight-for-height). 1.8 Under-nutrition can be termed as a deficiency of calories or several vital nutrients essential for growth and survival. Under-nutrition develops largely when people fail to obtain or prepare food, suffer from a disorder that makes eating or absorbing food difficult, or have a greatly increased need for calories. 1.9 Over-nutrition is a form of malnutrition marked by an excessive intake of nutrients. The amount of nutrients consumed exceeds the amount required for normal growth, development and metabolism.Overnutrition can develop into obesity, which increases the risk of
serious health conditions, including cardiovascular disease, hypertension, cancer, and type-2 diabetes. 1.10 BMI: Body Mass Index (BMI) is an index of weight-for-height that is commonly used to classify underweight, overweight and obesity. It is determined by the weight in kilograms divided by the square of the height in meters (kg/m2). For example, an adult who weighs 70kg and whose height is 1.75m will have a BMI of 22.9. 1.11 Anaemia is a disorder in which the number of red blood cells or their oxygen-carrying capacity is insufficient for physiological needs, which vary by age, sex, altitude, smoking and pregnancy status. One of the most important causes for anaemia is iron deficiency, although other conditions like deficiencies in folate, vitamin B12 and vitamin A, chronic inflammation, parasitic infections and inherited disorders can all cause anaemia. It often leads to fatigue, weakness, dizziness and drowsiness. Anaemia, measured by haemoglobin level, is available for children (sex-wise), women and men.
1.12 Iodised salt is table-salt mixed with a minute amount of various salts of the element iodine. The ingestion of iodine prevents iodine deficiency.Iodine deficiency also causes thyroid gland problems, such as endemic . 1.13 Blood sugar concentration or blood glucose level is the amount of glucose (sugar) present in the human body. The body tends to regulate blood glucose levels naturally as a part of metabolic homeostasis. Glucose levels are usually the lowest in the morning, before the first meal of the day (termed the fasting

Introduction
�
by a few millimolars after meals.Blood sugar levels outside the normal range may be indicative of a medical condition. A persistently high level is referred to as hyperglycemia while low levels are referred to as hypoglycemia. Blood sugar levels are provided for persons aged 18 and above only. Blood sugar has beenmg/.Blood sugar has beenprovided in the ranges of: 1.14 Hypertension or high blood pressure is a medical condition whereinblood flows through the blood vessels with a force greater than normal. Blood pressure is expressed by two measurements systolic and diastolic, which are the maximum and minimum pressures respectively in the arterial system. Whilesystolic pressure occurs when the left ventricle is most contracted, diastolic pressure occurs when the left ventricle is most relaxed prior to the next contraction. Data for hypertension levelsis provided for persons aged 18 and above only. Hypertension in three separate categories of Systolic & Diastolic measurements viz. above normal (>140/90 mm of Hg), moderately high (>160/100 mm of Hg), and very high (>180/110 mm of Hg) have beenprovided. 1.3. Quality control mechanism 1.15 An elaborate quality control mechanism was put in place to ensure the emergence of the best possible data. Intensive training, supply of detailed instruction manual explaining each step of data collection, and accuracy testing of measurements are some of the methods that were adopted for quality control. Other measures taken include immediate replacement of faulty equipments, selection of the most suitable and experienced persons like ANM and
lab technicians for field work and regular field visits by officials of ORGI. Protocols were prescribed for the usage of equipments and consumables in the field.Appointment of a doctor as health consultant for every four districts was another important step to ensure data quality by supervising field activities, checking the accuracy of equipments and undertaking duplicate assessments. 10% duplicate measurements were taken for quality checking and 10% households were again checked by Medical Consultants after readings had been taken. Monthly exchange of blood samples between labs were also arranged to ensure quality assurance among institutions for Hb estimation. In order to maintainthe quality of the survey, constant monitoring and supervision of the field activities were undertakenby ORGI/Directorate of Census Office (DCO) officials whilefield teams and medical consultants were imparted training. 1����Training� 1.16 Intensive training has been provided to the field survey teams, medical consultants and field investigators. For the field survey teams, a skill-intensive training in batches consisting of 12-15 members was imparted by NIHFW, NFI and ICMR regional institutes in a phased manner. The field investigators were trained for skill upgradation and taught about quality control measures to ensure accuracy of measurements. The medical consultants were specifically trained by NIHFW and NFI for the purpose. 1.5. Coverage, Field work and Sample Design
1.17 CAB has been conducted in 2014 on a subsample of 12 sample units per district on an average, in all the 284 districts except for two of

Annual Health Survey Report
4
Uttarakhand, namely Chamoli and Rudraprayag where only 6 units could be surveyed(2 and 4 respectively) due to administrative reasons. All eligible members of alternate households in the selected sample units were surveyed. The total population and households thus covered are 1.65 million and 0.34 million respectively. Similar to AHS, the field work has been outsourced and supervision done by ORGI. 1.18 The field work strategy adopted for AHS has been replicated in CAB. The field work has been outsourced to seven selected Survey Agencies as in Annual Health Survey (AHS).In the States, the co-ordination, supervision and monitoring of CAB has beencarried out by the dedicated staff posted at various levels in the respective Directorates of Census Operations (DCOs). The AHS division of ORGI has managed the overall co-ordination, supervision and monitoring across the 9 AHS States.
Sample design 1.19 AHS sample design has been applied to CAB tests as CAB was conducted on a sub sample of 12 Primary Sample Units (PSUs) in each district in the total AHS sample .The sample design adopted was that of a uni-stage stratified simple random sample without replacement except in case of larger villages in rural areas (population more than or equal to 2000 as per 2001 Census), wherein a two stage stratified sampling was applied. The sample units were Census Enumeration Blocks (CEBs) in urban areas and village in rural areas, the villages in the latter having been divided into two strata. Stratum I comprises villages with a population less than 2000 and Stratum II contains villages with a population of 2000 or more.
1.20 Smaller villages with a population less than 200 were excluded from the sampling frame in such a manner that the total population of villages so excluded did not exceed 2 per cent of the total population of the district. In case of Stratum I, the entire village is the sample unit while in case of Stratum II, the village has been divided into mutually exclusive(non-overlapping) and geographically contiguous units comprising groups of EBs called segments of more or less equal size and population not exceeding 2000 in any case. One segment from the frame of segments thus prepared was selected in a random manner to represent the selected village at the second stage of sampling. Methodology for selection of PSUs for CAB 1.21 The 12 PSUs in each of the 284 districts are distributed among rural and urban in the same proportion that roughly exists among the total PSUs selected for the AHS in the respective districts. The proportionate numbers for rural and urban have been rounded off to the nearest integer. In some districts, no Urban Units could be selected after following the above methodology and therefore, in order to represent the urban population, at least two urban PSUs were selected in each district. 1.22 The sub-sample of PSUs within a district was selected by Simple Random Sampling (SRS) and within a PSU; the first household was selected randomly, followed by the selection of alternate households. The selection of PSUs through SRS was proposed as they were only a sub-sample of the AHS Sample and at the time of selection of AHS Samples, precautions regarding representation of each type of sampling unit had been taken care of.

Introduction
�
Survey Tools 1.23 All households selected for CAB test were given a Survey Information Sheet explaining the purpose of CAB and possible benefits to the individual and national health programmes. Consent was taken from persons participating in various tests on a Consent Form while the consent of children was taken on the Child Assent Form. To record the measurements/results, Form 1 (CAB Tests Schedule) and Form 2 (Hemoglobin Tests Schedule) were administered. All tests other
-the-results and were recorded in Form1. For Hb estimation, the blood samples were tested in the laboratory . Other particulars entered in Form 1 include salt intake by the household, weight and length/height results, BP and blood sugar measurements, details of breast feeding practices and supplementary feeding for children, acute illness of children, etc. Form 2 was filled in duplicate with Hb Values taken from a particular PSU. Results of duplicate samples were reported on a separate Form. Two Forms were used for data quality check: Form 7 for data quality check of measurements by field investigator and Form 8 for data quality check of measurements by Medical consultant. The
field investigator took duplicate measurements in 10% of the persons surveyed per day while the medical consultants did so in 10% of the households surveyed and filled data in Form 7 and Form 8 respectively. Following the test in a household, a Household Health Card containing the ready results of the tests conducted were given to the household. In addition, all pregnant and lactating women and women with children below 3 years of age were given a Mother and Child Protection Card (MCPC), jointly developed by MOHFW and Ministry of Woman and Child Development, with aim to record the details of ante-natal, natal and post-natal care, immunization, etc. The card also provides standard growth monitoring charts. Sample size 1.24 The fasting blood sugar prevalence level has been taken as the decisive indicator for estimation of sample size at the district level. The prevalence of blood sugar among the population in the age group of 18 years and above has beenconsidered as 4 % across districts while estimating the sample size. The permissible level of error has been taken as 10 percentage relative standard error (prse) at the district level.
Table 1.1: CAB sample particulars for nutritional status for below 5 years for all the nine AHS States
Sample size for Nutitional Status
Below 5 years
States Below 2SD Wasting
Below 2SD Stunting
Below 2SD Underweight BMI
Below 2SD Undernourished BMI
Above 2SD Overnourished
Assam 8318 8667 8971 8957 8957 Bihar 23110 23874 24080 24617 24617 Chhattisgarh 6278 6147 6640 6733 6733 Jharkhand 8072 8211 8535 8583 8583 Madhya Pradesh 15884 15934 16887 17239 17239 Odisha 12015 12282 12494 12540 12540 Rajasthan 12592 12638 13201 13334 13334 Uttar Pradesh 375995 37136 38683 39048 39048 Uttarakhand 3953 3938 4170 4135 4135

Annual Health Survey Report
6
Table 1.2: CAB sample particulars for nutritional status, for age groups: 5-18 years, 18-59 years and 60 years and above, for all the nine AHS States
Sample size for Nutitional Status
5-18 years 18 -59 60 and above
States Below 2SD Undernourished (BMI)
Below 2SD Overnourished BMI 25.0
BMI 25.0
BMI
Assam 32395 32395 68275 9143 68275 9143 Bihar 80544 80544 117560 21211 117560 21211 Chhattisgarh 21902 21902 50188 6804 50188 6804 Jharkhand 26717 26717 45837 7462 45837 7462 Madhya Pradesh 61615 61615 131279 20683 131279 20683 Odisha 38368 38368 89387 17705 89387 17705 Rajasthan 47153 47153 80912 14357 80912 14357 Uttar Pradesh 1256617 1256617 196150 35729 196150 35729 Uttarakhand 153359 153359 30364 6539 30364 6539
Table 1.3: CAB sample particulars for anaemia by haemoglobin level for all the nine AHS States
Sample size for Anaemia status by Haemoglobin Level
States 6-59 months 5-9 years 10-17 years 18-59 years 60 years and above Person Person Person Male Female Male Female
Assam 3740 7087 14658 26371 31101 4147 3734 Bihar 14716 19234 34531 34441 46760 8456 8463 Chhattisgarh 4329 6800 12760 23948 24509 3345 3216 Jharkhand 5550 8137 13843 16473 23534 3404 3220 Madhya Pradesh 7981 14052 30221 55640 55317 9201 8427 Odisha 9643 11872 20438 36001 44232 8370 7848 Rajasthan 7936 10493 23327 30458 37906 5912 6529 Uttar Pradesh 20970 27918 55597 61760 77931 12933 13268 Uttarakhand 2396 3295 7315 10014 14764 2586 2865
Table 1.4: CAB sample particulars for blood sugar, hypertension and iodine content for all the nine AHS States
Instruments used and data collected 1.25 Various equipments have been used to take measurements and collect data. Height has been measured using Wall Mounted Statute
Meter and length for the children upto two years of age, using an infantometer. Similarly, weight has been recorded with the help of a Digital Weighing Scale. While Automated Digital BP monitor has beenused to take blood pressure,
Blood Sugar levels Hypertension Iodine content States 18 years and above 18 years and above
Houeshold Person Person Assam 72036 76925 32100 Bihar 129975 138087 58132 Chhattisgarh 56037 56303 23395 Jharkhand 51625 53029 23580 Madhya Pradesh 141287 151240 58094 Odisha 104716 107101 43488 Rajasthan 81934 94879 38717 Uttar Pradesh 209146 232756 92600 Uttarakhand 35577 36651 15882

Introduction
�
Hb pipette has been used for blood samples. Hb level has beenmeasured with the help of colorimeter in designated labs and Iodine content in household salt using Salt testing kit. The survey collected data directly from the participants on clinical components like morbidity episodes and BP measurements and anthropometric parameters like measurement of weight and length/height, and also collected biochemical samples like blood for Hb and fasting and glucose and salt for iodine estimation. Information on health status was provided on the spot to the participants. Data dissemination 1.26 The CAB data has beendisseminated in a single phase in the form of factsheets containing 40 indicators of nutritional status, anaemia and other life style diseases. 1.6. Navigating this Report 1.27 This CAB report has been presented in 8 chapters: (1) Introduction; (2) Nutritional Status of Children Below 5 years; (3) Nutritional Status of School Aged Children And Adolescents (5-18 years); (4) Nutritional Status of Adults; (5) Anaemia and Iodine content in Household Salt; (6) Blood Sugar; (7) Hypertension and (8) Child Nutritional Deprivation Index. The report presents and discusses the findings related to key nutrition indicators based on the CAB survey conducted during the year 2014. 1.28 The chapters highlight the levels and trends observed in nutrition indicators in 2014. The inter-district variations in key indicators have been highlighted by listing the names of the best and worst performing districts, also facilitating an understanding of performance
ranges demonstrated by the States. State-wise inter-district disparities are highlighted by computing the coefficient of variation (CV). The chapters further list the 100 districts that fared poorly under each category, providing their State-wise distribution. The chapters also discuss the differentials observed in rural areas across districts and States. In order to understand the levels of disparity between males and females, gender differentials have been drawn in the report with regard to nutrition, anaemia, blood sugar and hypertension. 1.29 The report also describes the associations between nutrition indicators and key health and development indicators (such as total fertility rate, use of family planning, child immunization, antenatal care, delivery care, neonatal and infant mortality rate, literacy and mean age of marriage). Associations made between programme indicators help to ascertain how district-level performance of one factor is associated with the other. Finally, a child nutritional deprivation index, focusing on the multi-dimensional nature of nutrition deprivation among children aged below 5 years, is presented.
1.30 The index has been developed using a total of five indicators related to nutrition: stunting, wasting, underweight, under-nourished and anaemia. All the indicators have been normalized and aggregated with equal weights provided to each indicator. Districts have been ranked based on their performance in 2014 as the best and worst performing districts, in nutritional deprivation among children below 5 years of age. Also, a list of 10 best districts and 10 worst districts for selected indicators has been presented to highlight the inter district variation.

8
NUTRITIONAL STATUS OF CHILDREN BELOW 5 YEARS 2.1. Definition of Indicators 2.1 The three standard anthropometric measures used to assess the nutritional status of children are stunting (low height-for-age), wasting (low weight-for-height) and underweight (low weight-for-age). Stunting is an indicator of chronic undernutrition or prolonged food deprivation and/or disease or illness; wasting is an indicator of acute undernutrition, the result of more recent food deprivation or illness; underweight is used as a composite indicator to reflect both acute and chronic undernutrition, although it cannot distinguish between them. A child is considered stunted, wasted or underweight if it falls two standard deviations below the median score for children of the same age and gender in the reference population, which is based on an internationally accepted World Health Organization Child Growth Standards. Severe stunting, severe wasting and severe underweight are defined if a child falls three standard deviations below the median score for children of the same age and gender in the reference population. Levels of undernourishment and overnourishment are also presented.
2.2. Levels and Patterns 2.2 Table 2.1 shows the prevalence of wasting, stunting and underweight among children under the age of five in each of the States surveyed. Below 2SD indicates that the extent of wasting, stunting or underweight is two standard deviations below the median of the WHO Child Growth Standards. Similarly, 3SD means that the value is three standard deviations below the median, indicating a higher level of malnutrition. All States show a higher percentage of children with 2 SD wasting, stunting and underweight than 3SD of the corresponding measures. Among the nine AHS States, highest level of stunting is reported in Uttar Pradesh (62.0 per cent). Bihar, Madhya Pradesh and Jharkhand record similar levels of stunting at 52 per cent, 51.5 per cent and 50.5 per cent. The highest level of underweight children is noted in Jharkhand (45.7 per cent). The highest percentage of wasting in both 2SD and 3SD at 32.4 per cent and 11.5 per cent is noted in Chhattisgarh. Uttarakhand does report the lowest extents of wasting, stunting and underweight, but these are not substantially lower than those of the other States.
Table 2.1: Stunting, wasting and underweight (%) among children below age 5 Prevalence of wasting, stunting and underweight among children below 5 years at State-level, 2014
State Wasting (%) Stunting (%) Underweight (%)
Below -2 SD Below -3 SD Below -2 SD Below -3 SD Below -2 SD Below -3 SD Assam 20.2 9.2 37.4 17.4 30.8 11.1 Bihar 19.2 8.1 52.0 25.3 40.3 15.8 Chhattisgarh 32.4 11.5 34.7 20.0 39.4 18.8 Jharkhand 21.3 8.8 50.5 28.5 45.7 18.3 Madhya Pradesh 17.3 8.3 51.5 32.4 40.6 16.5 Odisha 20.2 6.0 41.5 19.4 38.9 14.4 Rajasthan 22.5 9.5 44.0 24.4 36.6 15.0 Uttar Pradesh 15.9 5.8 62.0 35.6 44.9 17.7 Uttarakhand 14.7 5.8 40.2 20.0 28.0 8.7
2

Nutritional Status Of Children Below 5 Years
�
2.3 Table 2.2 shows the prevalence of undernourishment and overnourishment among children under five. Chhattisgarh reports the highest level of undernourishment (33.5 per cent and 15.9 per cent). Uttar Pradesh, Uttarakhand and Odisha have low levels of severe undernourishment at 6.7 per cent, 7 per
cent and 8.8 per cent. It may be noted that the low levels of undernourishment in Uttarakhand are accompanied by higher levels of over nourishment. Table 2.3 shows the prevalence of any and severe wasting, stunting and underweight among male and female children under the age of 5.
Table 2.2: Undernourished and Overnourished (%) among Children below 5 years Percentage of undernourished and overnourished children below 5 years at State-level, 2014
State Undernourished (%) Overnourished (%)
Below -2 SD Below -3 SD Above 2 SD Above 3 SD Assam 22.3 13.2 8.0 4.7 Bihar 20.7 12.8 3.1 1.9 Chhattisgarh 33.5 15.9 7.6 4.0 Jharkhand 22.5 12.4 5.5 1.9 Madhya Pradesh 19.7 12.4 11.5 5.7 Odisha 19.8 8.8 4.7 2.1 Rajasthan 22.7 12.2 8.9 4.5 Uttar Pradesh 13.9 6.7 8.4 4.1 Uttarakhand 13.8 7.0 9.7 5.9
Table 2.3: Wasting, stunting and underweight among male-female (%)
Prevalence of wasting, stunting and underweight among male-female children below 5 years at State-level, 2014
State Wasting Stunting Underweight
Male Female Male Female Male Female Below -2 SD Assam 20.9 19.4 38.4 36.4 32.1 29.3 Bihar 20.5 17.8 57.8 45.7 44.9 35.4 Chhattisgarh 31.8 33.1 35.9 33.4 41.3 37.1 Jharkhand 21.0 21.8 51.1 49.8 46.8 44.6 Madhya Pradesh 17.6 16.9 58.1 43.8 49.2 30.5 Odisha 20.5 19.8 41.2 41.8 38.0 40.0 Rajasthan 23.0 21.8 44.7 43.3 36.4 36.9 Uttar Pradesh 16.5 15.3 64.3 59.6 46.6 43.1 Uttarakhand 15.6 13.6 40.8 39.5 28.8 27.1 Below -3 SD Assam 10.2 8.2 18.8 15.8 11.7 10.6 Bihar 8.3 7.8 28.8 21.5 20.2 10.9 Chhattisgarh 11.8 11.1 21.2 18.7 19.9 17.4 Jharkhand 8.7 9.0 28.7 28.3 18.6 18.1 Madhya Pradesh 7.7 9.0 33.3 31.3 20.7 11.6 Odisha 6.5 5.4 19.2 19.8 13.8 15.1 Ajasthan 9.7 9.2 24.9 23.9 15.1 14.9 Uttar Pradesh 5.9 5.7 36.5 34.7 20.5 14.6 Uttarakhand 6.4 5.2 20.7 19.2 8.4 9.1

Annual Health Survey Report
10
Map 2.1: Prevalence of stunting among children below 5 years (2014) in AHSStates (district wise)

Nutritional Status Of Children Below 5 Years
11
Map 2.2: Prevalence of wasting among children below 5 years (2014) in AHSStates (district wise)

Annual Health Survey Report
12
Map 2.3: Prevalence of underweight among children below 5 years (2014) in AHSStates (district wise)

Nutritional Status Of Children Below 5 Years
1�
Map 2.4: Prevalence of undernutrition among children below 5 years (2014) in AHSStates (district wise)

Annual Health Survey Report
14
2.4 Table 2.4 shows the prevalence of undernourishment and overnourishment for both sexes across the nine States. Any and severe undernutrition levels are highest in Chhattisgarh among both males and females. The level of above 2SD overnutrition is the highest among males and females in Madhya Pradesh (11.7 per cent and 11.2 per cent respectively), followed by Uttarakhand where
the prevalence is 10.2 per cent in males and 9 per cent in females. 2.5 The lowest prevalence of above 2SD and 3SD overnutrition is noted in Bihar. In case of 2SD overnourished children a mere 3.1 per cent is noted for boys and 3 per cent for girls, the levels further reducing to 1.9 per cent and 1.8 per cent respectively in case of above 3SD.
Table 2.4: Undernourished and overnourished male-female (%)
Percentage of undernourished and over nourished male-female children below 5 years at State-level, 2014 State Male Female Male Female Undernourished Below -2 SD Below -3 SD Assam 23.0 21.7 14.1 12.2 Bihar 23.4 17.7 13.7 11.8 Chhattisgarh 32.7 34.2 16.5 15.1 Jharkhand 22.0 23.1 12.4 12.5 Madhya Pradesh 20.1 19.3 12.3 12.6 Odisha 19.4 20.3 9.3 8.3 Rajasthan 23.0 22.3 12.6 11.7 Uttar Pradesh 15.2 12.5 7.0 6.3 Uttarakhand 14.1 13.5 7.4 6.6 Overnourished Above 2 SD Above 3 SD Assam 8.6 7.4 4.9 4.5 Bihar 3.1 3.0 1.9 1.8 Chhattisgarh 7.9 7.4 4.0 4.1 Jharkhand 5.5 5.3 1.9 1.8 Madhya Pradesh 11.7 11.2 6.1 5.2 Odisha 5.3 4.0 2.4 1.7 Rajasthan 9.6 8.1 5.1 3.9 Uttar Pradesh 8.8 7.8 4.3 3.8 Uttarakhand 10.2 9.0 6.4 5.3 2.6 We also present the list of 100 districts with highest levels of stunting, wasting and underweight (Table 2.5) and highest levels of undernutrition and overnutrition (Table 2.6). Uttar Pradesh, Rajasthan, Odisha, Madhya Pradesh, Chhattisgarh and Bihar have similar number of districts with a very high prevalence of wasting. In comparison, fewer districts in Assam (3) and Uttarakhand (7) have high levels of wasting, stunting and underweight among the 100 districts. Only one district from Assam records very high levels in case of stunting,
while no district reports case of underweight. No district from Uttarakhand is among the 100 districts with the highest levels of underweight and stunting. Uttar Pradesh has 55 districts with a high prevalence of stunting among children, followed by 21 districts of Madhya Pradesh; and 12 districts of Bihar. Odisha, Chhattisgarh and Assam each reported 1 district amongst the 100 districts. Uttar Pradesh (36) has the highest percentage of underweights followed by Madhya Pradesh with 20 districts, and Bihar (12), Odisha (11) and Rajasthan (10).

Nutritional Status Of Children Below 5 Years
1�
Table 2.5: List of 100 districts with highest prevalence of child wasting, stunting and underweight, 2014
No. Wasting (%) Stunting (%) Underweight (%) Below -2 SD Below -2 SD Below -2 SD
State District State District State District 1 Bihar Aurangabad (37.2) UP Rae Bareli (77.4) UP Hamirpur (70.2) 2 Jharkhand Gumla (37) UP Hamirpur (75.7) UP Farrukhabad (68.3) 3 Jharkhand Sahibganj (37) UP Hardoi (73.5) Odisha Malkanagiri (67.4) 4 MP Ratlam (36) UP Jalaun (73.3) UP Rae Bareli (67.3) 5 Bihar Munger (35.4) UP Barabanki (72.9) UP Sultanpur (65.9) 6 Bihar Jamui (35.4) UP Budaun (72.8) MP West Nimar (65.8) 7 Bihar Banka (35) UP Sultanpur (72) Bihar Jamui (65.7) 8 Chhattisgarh Mahasamund (34.7) UP Gonda (72) MP Barwani (65.6) 9 Bihar Nawada (34.6) UP Balrampur (72) MP Datia (65.5) 10 Chhattisgarh Durg (34.1) MP West Nimar (71.8) UP Kheri (63.2) 11 Assam Cachar (33.8) UP Kannauj (71.6) UP Barabanki (61) 12 MP Jabalpur (33.8) UP Mainpuri (71.1) Jharkhand Paschimi Singhbum (60.4) 13 Chhattisgarh Bilaspur (33.7) MP Sagar (70.5) UP Jhansi (60.3) 14 Bihar Rohtas (33.5) UP Farrukhabad (70.3) Bihar Aurangabad (60) 15 Odisha Malkanagiri (33.4) UP Sitapur (69.4) Bihar Munger (59.6) 16 MP Datia (33.1) UP Kanpur Dehat (69.3) MP Raisen (59.5) 17 Chhattisgarh Raipur (32.5) UP Kheri (69.2) UP Bahraich (59.5) 18 Chhattisgarh Rajnandgaon (32.5) UP Mahoba (69.1) UP Hathras (59) 19 Rajasthan Ajmer (31.7) UP Rampur (69) MP Tikamgarh (58.7) 20 Chhattisgarh Kawardha (31.3) UP Agra (68.8) UP Gonda (58) 21 Jharkhand Giridih (31.3) UP Aligarh (68.8) Jharkhand Giridih (57.8) 22 Bihar Sheikhpura (31.2) UP Bahraich (68.3) UP Shrawasti (57.8) 23 MP Hoshangabad (31) MP Tikamgarh (67.8) MP Dindori (57.6) 24 Jharkhand Pakaur (30.8) MP Harda (67.7) UP Balrampur (57.6) 25 Odisha Rayagada (30.6) UP Bareilly (67.7) Bihar Gaya (57.5) 26 Odisha Debagarh (30) UP Firozabad (67.1) UP Kanpur Dehat (56.9) 27 Assam Hailakandi (29.8) UP Bulandshahr (66.9) Bihar Rohtas (56.5) 28 Bihar Gopalganj (29.4) UP Shrawasti (66.7) UP Mirzapur (55.4) 29 Assam NC Hills (28.8) UP Unnao (66.4) Rajasthan Dhaulpur (55.2) 30 MP Vidisha (28.7) UP Siddharthanagar (65.4) MP Dewas (55.1) 31 Odisha Baudh (28.7) MP Shahdol (65.3) MP Seoni (54.8) 32 Rajasthan Alwar (28.7) UP Kanpur Nagar (65.3) Odisha Rayagada (53.9) 33 Rajasthan Dungarpur (28.5) MP Mandsaur (65.1) UP Lucknow (53.6) 34 Chhattisgarh Janjgir-Champa (28.3) UP Hathras (65.1) UP Etah (53.5) 35 Assam Marigaon (28.2) UP Auraiya (65) UP Rampur (53.1) 36 Jharkhand Garhwa (28.1) UP Moradabad (64.9) UP Maharajganj (53) 37 UP Kheri (28.1) UP Etawah (64.9) MP Jabalpur (52.8) 38 Uttarakhand Pithoragarh (28.1) MP Dindori (64.8) Odisha Nabarangapur (52.8) 39 Rajasthan Churu (27.9) Bihar Jehanabad (64.6) Odisha Kalahandi (52.8) 40 Rajasthan Dhaulpur (27.8) UP SR Nagar (64.5) UP Mainpuri (52.8) 41 MP Barwani (27.7) UP Jhansi (64.5) Odisha Koraput (52.6) 42 MP Katni (27.5) Jharkhand Paschimi Singhbum (64.3) Chhattisgarh Raipur (52.3) 43 Odisha Balangir (27.5) UP Etah (64.3) Rajasthan Jalore (52.1) 44 Rajasthan Jaisalmer (27.3) MP Bhind (64.2) MP Katni (51.7) 45 MP Mandla (27.2) UP Meerut (64.2) Chhattisgarh Kawardha (51.1) 46 Bihar Bhagalpur (27.1) UP Pilibhit (64.2) UP Mau (51) 47 UP JyotibaPhule Nagar (27.1) UP Mathura (64.1) Jharkhand Chatara (50.9) 48 MP Dewas (27) MP Raisen (64) Rajasthan Bhilwara (50.8) 49 Odisha Kalahandi (26.9) Rajasthan Jalore (63.8) Bihar Banka (50.7) 50 Chhattisgarh Dhamtari (26.8) UP Lucknow (63.6) MP Bhind (50.7)

Annual Health Survey Report
16
No. Wasting (%) Stunting (%) Underweight (%) Below -2 SD Below -2 SD Below -2 SD
State District State District State District 51 Odisha Kandhamal (26.8) UP G Buddha Nagar (63.3) UP SR Nagar (50.7) 52 Assam Karimganj (26.7) Bihar Jamui (63.1) UP Allahabad (50.6) 53 UP Gonda (26.7) UP Ambedkar Nagar (62.8) MP Sagar (50.2) 54 Rajasthan Bhilwara (26.4) UP Faizabad (61.9) Rajasthan Banswara (50.2) 55 UP Bahraich (26.4) UP Shahjahanpur (61.8) UP Sonbhadra (50.2) 56 Bihar Nalanda (26.3) UP Kaushambi (61.7) Odisha Nuapada (49.8) 57 Rajasthan Tonk (26.1) UP Bijnor (61.7) Bihar Nalanda (49.7) 58 Chhattisgarh Raigarh (26) Bihar Munger (61.4) Odisha Baudh (49.5) 59 MP Dindori (25.9) UP Mirzapur (61.2) Rajasthan Sirohi (49.5) 60 UP Sultanpur (25.9) Chhattisgarh Bastar (61.1) UP Agra (49.5) 61 MP Ujjain (25.8) MP Indore (60.7) UP Kaushambi (49.4) 62 Chhattisgarh Jashpur (25.7) UP Mau (60.3) Jharkhand Gumla (49.3) 63 UP Hathras (25.7) Rajasthan Chittaurgarh (59.6) UP Faizabad (49.3) 64 UP Rae Bareli (25.7) UP Baghpat (59.5) Chhattisgarh Bilaspur (49.1) 65 Bihar Gaya (25.5) Bihar Patna (59.4) UP Firozabad (49) 66 MP Chhatarpur (25.5) MP Shivpuri (59.3) Bihar Pashchim Champaran (48.6) 67 Odisha Sambalpur (25.5) Bihar Buxar (59.2) MP Sheopur (48.2) 68 Jharkhand Chatara (25.4) MP Datia (58.7) UP Ambedkar Nagar (48.1) 69 Jharkhand Paschimi Singhbum (25.3) UP Ghazipur (58.3) Jharkhand Dhanbad (47.9) 70 Bihar Saharsa (25.1) MP Seoni (58.1) MP Mandsaur (47.8) 71 Rajasthan Bharatpur (25.1) Bihar Khagaria (58) Odisha Kendujhar (47.7) 72 Uttarakhand Almora (25) Assam Nagaon (57.9) MP Umaria (47.6) 73 Chhattisgarh Korba (24.8) Bihar Begusarai (57.8) Rajasthan Chittaurgarh (47.1) 74 Rajasthan Jhunjhunun (24.8) MP Umaria (57.7) Bihar Lakhisarai (46.9) 75 Odisha Kendujhar (24.7) Odisha Koraput (57.7) MP Mandla (46.9) 76 Bihar Pashchim Champaran (24.6) Rajasthan Banswara (57.7) UP Sitapur (46.9) 77 Odisha Bargarh (24.6) UP Azamgarh (57.7) MP Chhatarpur (46.8) 78 UP Farrukhabad (24.6) UP Allahabad (57.6) Rajasthan Pali (46.8) 79 Rajasthan Pali (24.5) MP Sheopur (57.5) Bihar Darbhanga (46.7) 80 Assam Dhubri (24.4) Bihar Araria (57.4) Odisha Ganjam (46.7) 81 Rajasthan Udaipur (24.2) Bihar Rohtas (57.3) UP Budaun (46.7) 82 Uttarakhand Champawat (24) MP Barwani (57.2) Chhattisgarh Rajnandgaon (46.6) 83 MP Dhar (23.9) UP Saharanpur (57) MP Hoshangabad (46.5) 84 Rajasthan Jodhpur (23.9) UP Sonbhadra (56.8) UP Banda (46.5) 85 Assam Golaghat (23.8) UP Banda (56.6) Jharkhand Deoghar (46.4) 86 Odisha Nabarangapur (23.8) Bihar Darbhanga (56.5) Odisha Bargarh (46.4) 87 Odisha Puri (23.6) MP Chhatarpur (56) UP Jalaun (46.3) 88 UP Jhansi (23.6) Bihar Muzaffarpur (55.8) UP Mathura (46.3) 89 Rajasthan Sikar (23.5) Rajasthan Sirohi (55.8) UP Kanpur Nagar (46.1) 90 UP Saharanpur (23.3) UP Maharajganj (55.8) UP Sant Kabir Nagar (46.1) 91 UP Lucknow (23.3) MP Jabalpur (55.6) Jharkhand Garhwa (46) 92 UP Maharajganj (23.3) MP Bhopal (55.5) UP Unnao (46) 93 Chhattisgarh Dantewada (23.1) Jharkhand Dhanbad (55.4) Odisha Balangir (45.9) 94 UP Barabanki (23.1) Rajasthan Pali (55.3) Bihar Saharsa (45.8) 95 Chhattisgarh Surguja (23) Bihar Saharsa (55.2) MP Bhopal (45.8) 96 Odisha Gajapati (23) Jharkhand Palamu (55.2) MP Sehore (45.8) 97 Jharkhand Godda (22.9) UP Varanasi (55.2) Bihar Gopalganj (45.7) 98 MP Panna (22.9) MP Morena (55) Rajasthan Barmer (45.7) 99 UP Shrawasti (22.7) Jharkhand Lohardaga (54.9) Rajasthan Rajsamand (45.3) 100 MP Raisen (22.6) MP Shajapur (54.7) Rajasthan Kota (45.1)

Nutritional Status Of Children Below 5 Years
1�
Table 2.6: List of 100 districts with highest prevalence of under- and over-nutrition among children
No. Undernourished (%) Overnourished (%)
Below -2 SD Below 2 SD State District State District
1 MP Hoshangabad (48.7) MP Shahdol (31.3) 2 Jharkhand Sahibganj (44.1) MP Sagar (30.6) 3 Jharkhand Gumla (40.2) Assam Nalbari (28.1) 4 Chhattisgarh Mahasamund (39.9) MP Jabalpur (28.1) 5 MP Ratlam (38.5) Uttarakhand Bageshwar (27.3) 6 MP Barwani (37) MP Raisen (26.7) 7 MP Katni (36.6) MP Jhabua (24.6) 8 Jharkhand Garhwa (35) UP Pilibhit (24.6) 9 Odisha Malkanagiri (35) MP Seoni (22.8) 10 Bihar Gopalganj (34.9) MP Chhatarpur (22.5) 11 Chhattisgarh Bilaspur (34.9) MP Dindori (22.4) 12 Chhattisgarh Durg (34.8) UP Bulandshahr (21.8) 13 Odisha Puri (34.6) MP Dhar (21.7) 14 Jharkhand Pakaur (34.4) UP Budaun (21.7) 15 Odisha Debagarh (34.2) UP Auraiya (21.4) 16 Rajasthan Ajmer (34.2) Uttarakhand Nainital (21.2) 17 Bihar Aurangabad (34) UP Aligarh (21.1) 18 Assam Cachar (33.2) MP Vidisha (21) 19 Chhattisgarh Janjgir-Champa (32.8) Uttarakhand Almora (21) 20 Chhattisgarh Kawardha (32.5) UP Gautam Buddha Nagar (20.5) 21 Jharkhand Giridih (32.4) Rajasthan Jaisalmer (20.4) 22 Chhattisgarh Raipur (32.3) UP Muzaffarnagar (20) 23 Bihar Munger (31.8) MP Umaria (19.9) 24 MP Panna (31.3) Chhattisgarh Bastar (19.6) 25 Bihar Nawada (31.2) Assam Dhubri (19) 26 Odisha Baudh (31) Chhattisgarh Rajnandgaon (19) 27 Rajasthan Churu (31) MP Tikamgarh (18.6) 28 Bihar Banka (30.8) MP Panna (18.6) 29 Bihar Jamui (30.4) UP Hardoi (18.5) 30 Odisha Rayagada (30.4) Assam Kamrup (18.2) 31 Bihar Sheikhpura (30.3) MP Neemuch (18.2) 32 Chhattisgarh Jashpur (30.2) UP Shahjahanpur (18) 33 Assam Marigaon (30) UP Jyotiba Phule Nagar (17.4) 34 MP Ujjain (29.8) MP Damoh (17.1) 35 Assam Hailakandi (29.7) UP Fatehpur (16.9) 36 Chhattisgarh Dantewada (29.7) UP Mahoba (16.8) 37 Rajasthan Dhaulpur (29.4) MP Sidhi (16.5) 38 MP Jabalpur (29.3) Uttarakhand Pithoragarh (16.5) 39 Rajasthan Alwar (29.3) UP Jalaun (16.2) 40 Rajasthan Jhunjhunun (29.2) Rajasthan Churu (16.1) 41 Assam Nalbari (28.8) Rajasthan Ajmer (16) 42 Bihar Pashchim Champaran (28.8) UP Etawah (15.6) 43 Uttarakhand Pithoragarh (28.8) Rajasthan Jhunjhunun (15.2) 44 UP Jyotiba Phule Nagar (28.5) Rajasthan Jalore (14.6) 45 Bihar Darbhanga (28.4) UP Etah (14.3) 46 Odisha Kandhamal (28.4) UP Mathura (14.3) 47 Bihar Saran (28.2) Chhattisgarh Raigarh (14.2) 48 Assam North Cachar Hills (28.1) UP Moradabad (14.1) 49 Chhattisgarh Dhamtari (28.1) Rajasthan Bikaner (14) 50 Jharkhand Paschimi Singhbum (28.1) UP Lalitpur (13.8)

Annual Health Survey Report
18
No. Undernourished (%) Overnourished (%)
Below -2 SD Below 2 SD State District State District
51 Rajasthan Jodhpur (28) UP Meerut (13.8) 52 Assam Dhubri (27.9) Uttarakhand Udham Singh Nagar (13.8) 53 Rajasthan Sikar (27.9) MP Hoshangabad (13.6) 54 Jharkhand Dumka (27.7) UP Agra (13.2) 55 Chhattisgarh Rajnandgaon (27.4) UP Bareilly (12.8) 56 Rajasthan Dungarpur (27.3) UP Ghaziabad (12.8) 57 MP Gwalior (27.1) Rajasthan Dhaulpur (12.7) 58 MP Vidisha (27.1) MP Morena (12.5) 59 Rajasthan Jaisalmer (27.1) Jharkhand Garhwa (12.3) 60 Assam Karimganj (26.9) Assam Goalpara (12.2) 61 Bihar Rohtas (26.6) Rajasthan Sikar (12.1) 62 MP Mandla (26.6) UP Kannauj (11.9) 63 Jharkhand Godda (26.5) Uttarakhand Pauri Garhwal (11.4) 64 MP Betul (26.3) Rajasthan Alwar (11.2) 65 UP Gonda (25.9) Chhattisgarh Bilaspur (11.1) 66 Bihar Araria (25.5) Rajasthan Karauli (11.1) 67 Bihar Saharsa (25.4) UP Baghpat (11.1) 68 Rajasthan Bharatpur (25.3) Assam Sonitpur (11) 69 Odisha Kendujhar (25.2) Jharkhand Palamu (10.7) 70 MP Chhatarpur (25.1) UP Saharanpur (10.7) 71 UP Kheri (25.1) Chhattisgarh Kawardha (10.6) 72 Odisha Balangir (24.8) MP Indore (10.6) 73 Bihar Nalanda (24.7) UP Firozabad (10.6) 74 Rajasthan Bundi (24.7) Rajasthan Ganganagar (10.4) 75 Rajasthan Pali (24.6) UP Hathras (10.4) 76 Bihar Siwan (24.5) MP Betul (10) 77 MP Datia (24.3) Rajasthan Bharatpur (10) 78 Assam Barpeta (24.2) MP Chhindwara (9.9) 79 MP Mandsaur (24.2) MP Ratlam (9.8) 80 UP Hathras (24.2) Rajasthan Baran (9.8) 81 Assam Sibsagar (24.1) Uttarakhand Champawat (9.8) 82 Chhattisgarh Surguja (23.9) UP Unnao (9.7) 83 Jharkhand Chatara (23.7) MP Bhind (9.5) 84 MP Rajgarh (23.7) Chhattisgarh Koriya (9.4) 85 Uttarakhand Almora (23.7) Jharkhand Pakaur (9.4) 86 Bihar Madhepura (23.6) MP Harda (9.4) 87 Assam Kamrup (23.4) Bihar Kaimur (Bhabhua) (9.3) 88 Uttarakhand Champawat (23.4) MP Guna (9.3) 89 Chhattisgarh Raigarh (23.3) UP Bijnor (9.3) 90 Bihar Bhagalpur (23.2) UP Mainpuri (9.3) 91 Odisha Sambalpur (23.2) Assam Dibrugarh (9.2) 92 Rajasthan Bhilwara (23.2) Assam Lakhimpur (9.2) 93 Rajasthan Udaipur (23) Odisha Cuttack (9.1) 94 Bihar Purba Champaram (22.9) Assam Darrang (9) 95 Odisha Kalahandi (22.9) Jharkhand Dumka (9) 96 Assam Sonitpur (22.8) Rajasthan Sawai Madhopur (9) 97 Rajasthan Jaipur (22.8) Bihar Sheohar (8.7) 98 Assam Golaghat (22.7) Rajasthan Jodhpur (8.6) 99 MP Chhindwara (22.7) Assam Sibsagar (8.5) 100 Rajasthan Barmer (22.6) MP Sheopur (8.5)

Nutritional Status Of Children Below 5 Years
1�
2.3 Inter-District Disparities
2.7 Table 2.7 shows the State-specific coefficient of variation for district level wasting, stunting and underweight prevalence among children below 5 years. A high value of the coefficient of variation indicates higher inter-district differences whereas a lower value
indicates lower inter-district disparities. Madhya Pradesh has the highest co-efficient of variation in case of below 2SD wasting and Uttarakhand in case of below 3 SD wasting. In case of below 2SD and below 3SD stunting the highest value of co-efficient of variation is noted in case of Chhattisgarh and Assam, respectively.
Table 2.7: Coefficient of variation of district level wasting, stunting and underweight children below 5 years in each State, 2014
State Wasting Stunting Underweight
Below -2 SD Below -3 SD Below -2 SD Below -3 SD Below -2 SD Below -3 SD Assam 0.37 0.40 0.25 0.41 0.29 0.31 Bihar 0.38 0.43 0.13 0.31 0.22 0.40 Chhattisgarh 0.28 0.66 0.30 0.45 0.26 0.45 Jharkhand 0.33 0.50 0.17 0.27 0.15 0.29 Madhya Pradesh 0.41 0.56 0.23 0.33 0.31 0.47 Odisha 0.29 0.54 0.23 0.35 0.33 0.51 Rajasthan 0.24 0.50 0.20 0.32 0.27 0.48 Uttar Pradesh 0.35 0.48 0.13 0.24 0.23 0.40 Uttarakhand 0.38 0.68 0.25 0.30 0.25 0.39 2.8 Table 2.8 shows the extent of disparities across States in case of undernourished and overnourished children below 5 years. Madhya Pradesh and Uttarakhand have the highest coefficient of variation, indicating wide disparities in below 2 SD undernourished
children. At higher levels of undernourishment (below 3 SD) Chhattisgarh has the highest coefficient of variation. Assam on the other hand, has the highest CV in above 2SD overnourishment of children and Uttarakhand, in case of 3SD overnourishment.
Table 2.8: Coefficient of variation of district level undernourished and overnourished children below 5
years in each State, 2014
State Undernourished Overnourished
Below -2 SD Below 3 SD Above -2 SD Above 3 SD Assam 0.28 0.40 0.74 0.87 Bihar 0.32 0.39 0.71 0.68 Chhattisgarh 0.31 0.71 0.60 0.73 Jharkhand 0.39 0.60 0.50 0.38 Madhya Pradesh 0.44 0.55 0.64 0.86 Odisha 0.33 0.59 0.51 0.37 Rajasthan 0.29 0.50 0.47 0.57 Uttar Pradesh 0.34 0.55 0.72 0.75 Uttarakhand 0.44 0.58 0.58 0.90 2.9 Table 2.9 shows the disparities in wasting, stunting, underweight, undernourishment and
over nourishment in both male and female children below five years of age. Uttarakhand

Annual Health Survey Report
20
shows the highest disparity in case of below 2 SD wasting for males, whereas Bihar shows the same for females, indicating that these States have very few districts with a remarkably poor or good performance when compared with the observed average levels. Chhattisgarh showsthe highest level of disparity for both males and females in case of below 2 SD stunting. Odisha
has the highest co-efficient of variation in case of underweight males and Madhya Pradesh in case of underweight and undernourished females. Uttarakhand has the highest level of variation in case of wasting as well as undernourishment. Bihar shows the highest disparity of over nourishment and Odisha the lowest.
Table 2.9: Coefficient of variation of district level wasting, stunting, underweight, undernourished and
over nourished children below 5 years among male and female, 2014
State Wasting (Below -2 SD)
Stunting (Below -2 SD)
Underweight (Below -2 SD)
Undernourished (Below -2 SD)
Overnourished (Above 2 SD)
Male Assam 0.34 0.27 0.27 0.29 0.64 Bihar 0.34 0.13 0.18 0.33 0.79 Chhattisgarh 0.31 0.35 0.26 0.37 0.64 Jharkhand 0.35 0.18 0.16 0.42 0.49 Madhya Pradesh 0.42 0.24 0.29 0.42 0.62 Odisha 0.29 0.25 0.34 0.31 0.41 Rajasthan 0.26 0.21 0.25 0.30 0.48 Uttar Pradesh 0.36 0.15 0.23 0.38 0.70 Uttarakhand 0.45 0.28 0.21 0.59 0.64 Female Assam 0.40 0.25 0.36 0.30 0.80 Bihar 0.46 0.17 0.31 0.36 0.70 Chhattisgarh 0.29 0.29 0.31 0.28 0.51 Jharkhand 0.35 0.19 0.16 0.38 0.50 Madhya Pradesh 0.41 0.27 0.44 0.47 0.66 Odisha 0.33 0.23 0.32 0.38 0.41 Rajasthan 0.28 0.22 0.30 0.31 0.48 Uttar Pradesh 0.39 0.15 0.28 0.38 0.68 Uttarakhand 0.37 0.28 0.23 0.37 0.58 2.10 Table 2.10 presents State-wise inter-district range in the prevalence of stunting, wasting and underweight. In case of wasting, the lowest level of inter-district range is observed in Uttarakhand followed by Madhya Pradesh. Shahdol district of Madhya Pradesh showsthe lowest prevalence of 3.7 per cent, Ratlam district reports the highest prevalence at 36 per cent. 2.11 Madhya Pradesh also shows the highest inter-district range in case of severe wasting.
Aurangabad in Bihar, Sahibganj and Gumla in Jharkhand showthe highest level of wasting at 37 per cent. 2.12 In case of stunting, Madhya Pradesh once again reports the highest inter-district range while Bihar reports the lowest at 44.9 and 29.4, respectively. In case of severe stunting, Tikamgarh district of Madhya Pradesh has the highest prevalence of 56.8 per cent and Kendrapara (6.4 per cent) in Odisha has the lowest prevalence.The highest range in inter-

Nutritional Status Of Children Below 5 Years
�1
district disparities in underweight prevalence is noted in Madhya Pradesh and Odisha at 54.1 and 53.4 respectively. While Uttarakhand has
the lowest range for below 2SD, Assam has the lowest range for below 3SD underweight, followed by Uttarakhand (16).
Table 2.10: Inter-district rangein wasting, stunting and underweight among children below 5 years
District with the highest and lowest percentage of wasting, stunting and underweight children below 5 years, 2014
State Below -2 SD Below -3 SD Highest Lowest Range Highest Lowest Range
Wasting Assam Cachar (33.8) Kokrajhar (9.3) 24.5 Cachar (17.7) Dibrugarh (4.5) 13.2
Bihar Aurangabad (37.2) Patna (5.5) 31.7 Gopalganj (18.7) Patna (1.6) 17.1
Chhattisgarh Mahasamund (34.7) Bastar (8.5) 26.2 Kawardha (15.2) Surguja (2.5) 12.7
Jharkhand Sahibganj, Gumla (37) Dhanbad (10.5) 26.5 Pakaur (19.6) Hazaribagh (3.7) 15.9
Madhya Pradesh Ratlam (36) Shahdol (3.7) 32.3 Ratlam (23.7) Indore (2) 21.7
Odisha Malkanagiri (33.4) Jajapur (7.8) 25.6 Malkanagiri (16) Jajapur (1.4) 14.6
Rajasthan Ajmer (31.7) Sawai Madhopur (9.9) 21.8 Ajmer (19) Karauli (1.4) 17.6
Uttar Pradesh Kheri (28.1) Azamgarh (6) 22.1 Hathras (14.4) Azamgarh (1.4) 13.0
Uttarakhand Pithoragarh (28.1) Dehradun (8) 20.1 Pithoragarh (20.4) Dehradun (1.6) 18.8
Stunting Assam Nagaon (57.9) Karimganj (25.9) 32.0 Darrang (35.8) Karimganj (9.2) 26.6
Bihar Jehanabad (64.6) Sheohar (35.2) 29.4 Jamui (47) Madhubani (14) 33.0
Chhattisgarh Bastar (61.1) Jashpur (22.1) 39.0 Bastar (43.7) Jashpur (7.2) 36.5
Jharkhand Paschimi Singhbum (64.3) Sahibganj (21.9) 42.4 Paschimi Singhbum (46.2) Sahibganj (10.1) 36.1
Madhya Pradesh West Nimar (71.8) Satna (26.9) 44.9 Tikamgarh (56.8) Satna (6.6) 50.2
Odisha Koraput (57.7) Jagatsinghapur (21.3) 36.4 Koraput (34.6) Kendrapara (6.4) 28.2
Rajasthan Jalore (63.8) Jaipur, Jaisalmer (30.5) 33.3 Jalore (43.1) Jaipur (12.8) 30.3
Uttar Pradesh RaeBareli (77.4) Deoria (42.2) 35.2 Jalaun (56.5) Deoria (17.7) 38.8
Uttarakhand Haridwar (52.2) Pithoragarh (21.8) 30.4 Haridwar (26.1) Bageshwar (9.9) 16.2
Underweight Assam Nagaon (44.2) Kamrup (12.5) 31.7 Tinsukia (17.1) Kamrup (4.3) 12.8
Bihar Jamui (65.7) Samastipur (25.6) 40.1 Aurangabad (36.3) Kaimur(Bhabhua) (7.1) 29.2
Chhattisgarh Raipur (52.3) Surguja (22.2) 30.1 Bilaspur (29.9) Jashpur (4) 25.9
Jharkhand PaschimiSinghbum (60.4) Godda (33.1) 27.3 Paschimi Singhbum (31.4) Sahibganj (13.1) 18.3
Madhya Pradesh WestNimar (65.8) Satna (11.7) 54.1 Dewas (50.4) Indore (5.8) 44.6
Odisha Malkanagiri (67.4) Jagatsinghapur (14) 53.4 Malkanagiri (34.5) Jagatsinghapur (3) 31.5
Rajasthan Dhaulpur (55.2) Bikaner (19.9) 35.3 Dhaulpur (35) Bikaner (4.8) 30.2
Uttar Pradesh Hamirpur (70.2) Muzaffarnagar (23.4) 46.8 Farrukhabad (36.3) Muzaffarnagar (6.5) 29.8
Uttarakhand TehriGarhwal (34.4) Pithoragarh (15) 19.4 Champawat (17.9) Dehradun (1.9) 16.0
2.13 Table 2.11 presents the list of districts with highest and lowest prevalence of undernutrition and overnutrition among children below age 5 years. Highest inter-district range of 45.6 per
cent in undernutrition and 38.5 per cent in severe undernutrition is observed in Madhya Pradesh. The lowest inter-district range of 22.2 per cent in undernutrition prevalence is

Annual Health Survey Report
22
observed in Assam whereas the lowest inter-district range in case of severe undernutrition is noted Uttar Pradesh (16.6 per cent). Such wide inter-district range reveals that some districts suffer from very high levels of undernutrition. Madhya Pradesh also displays the highest inter-district range in case of overnutrition
prevalence. Although, levels of overnutrition among children is generally low across districts but there are a few districts with very high level of overnutrition prevalence. For instance, Shahdol in Madhya Pradesh reports 31.3 per cent prevalence of overnutrition among children.
Table 2.11: Inter-district range in undernourished and overnourished children below 5 years
District with the highest and lowest percentage of undernourished and overnourished children below 5 years, 2014
State Below -2 SD Below -3 SD Highest Lowest Range Highest Lowest Range
Undernourished Assam Cachar (33.2) Dibrugarh (11) 22.2 Nalbari (26.1) Darrang (5.7) 20.4
Bihar Gopalganj (34.9) Patna (4.8) 30.1 Gopalganj (26) Patna (1.8) 24.2
Chhattisgarh Mahasamund (39.9) Bastar (8.5) 31.4 Bilaspur (23.7) Rajnandgaon (2.9) 20.8
Jharkhand Sahibganj (44.1) Dhanbad (12.4) 31.7 Sahibganj (28.4) Ranchi (4.2) 24.2
Madhya Pradesh Hoshangabad (48.7) Harda (3.1) 45.6 Hoshangabad (41) Sheopur (2.5) 38.5
Odisha Malkanagiri (35) Jajapur (7.5) 27.5 Puri (24.1) Jajapur (2.2) 21.9
Rajasthan Ajmer (34.2) Chittaurgarh (9.4) 24.8 Churu (22.8) Karauli (2.3) 20.5
Uttar Pradesh J Phule Nagar (28.5) Azamgarh (5.6) 22.9 Gonda (17.9) Hamirpur (1.3) 16.6
Uttarakhand Pithoragarh (28.8) Dehradun (5.8) 23.0 Pithoragarh (23.8) Haridwar (4) 19.8
Overnourished Above SD Above 3 SD Assam Nalbari (28.1) Barpeta (2.4) 25.7 Nalbari (16.3) Jorhat (1) 15.3
Bihar Kaimur (Bhabhua) (9.3) Siwan, Darbhanga, Kishanganj (0) 9.3 Sheohar (5.7) Siwan, Darbhanga,
Kishanganj (0) 5.7
Chhattisgarh Bastar (19.6) Jashpur (2.1) 17.5 Rajnandgaon (15.3) Mahasamund (2) 13.3
Jharkhand Garhwa (12.3) Hazaribagh (1.4) 10.9 Garhwa (4.5) Giridih, Kodarma (1.4) 3.1
Madhya Pradesh Shahdol (31.3) Satna (1.7) 29.6 Shahdol (22) Morena (0.9) 21.1
Odisha Cuttack (9.1) Kalahandi, Malkanagiri (0.7) 8.4 Puri (4.9) Malkanagiri (0.4) 4.5
Rajasthan Jaisalmer (20.4) Tonk (2.7) 17.7 Jaisalmer (12.6) Pali (1) 11.6
Uttar Pradesh Pilibhit (24.6) Sant Kabir Nagar (0.9) 23.7 Pilibhit (13.6) SR Nagar, Basti (0.9) 12.7
Uttarakhand Bageshwar (27.3) Tehri Garhwal (3.8) 23.5 Bageshwar (25.3) Tehri Garhwal (0.9) 24.4
2.14 A positive association between district-level prevalence of underweight and stunting is observable. Similarly, a positive relation exists between wasting and underweight, implying that districts with a low level of wasting also have a low percentage of underweight children. However, no such association can be observed between the prevalence of undernourishment
and overnourishment. Figure 2.1 illustrates the gender differentials in prevalence of underweight with males below five years tending to be more underweight than females below five years. Figure 2.2 shows that there is a higher prevalence of stunting among males. As regards wasting, no such specific pattern is observed.

Nutritional Status Of Children Below 5 Years
��
Figure2.1: Comparison of district-level prevalence of underweight in children across region and sex
Figure 2.2: Comparison of district-level prevalence of stunting in children across region and sex

Annual Health Survey Report
24
2.4. Association with Development Indicators
Figure 2.3: Association of stunting, wasting and underweight prevalence with literacy rates

Nutritional Status Of Children Below 5 Years
��
2.15 Figure 2.3 shows the association between the percentage of children with 2SD stunting and the overall literacy rate in a district. A negative relationship is observed between the two variables, implying that districts with higher literacy rates have lower levels of stunting and districts with lower level of literacy have higher instances of stunting. Similarly, an inverse relation is noted between
the prevalence of 2 SD stunting and female literacy, proving that high levels of stunting are associated with low levels of female literacy. Districts with higher levels of overall and female literacy tend to have lower levels of children below the age of five categorized as 2SD underweight. In case of wasting in children too, districts with higher overall and female literacy are observed to have lower instances.
Figure 2.4: Association between district level prevalence of stunting and selected child health
indicators
2.16 Figure 2.4 shows the association between district level prevalence of stunting with other indicators. The practice of breastfeeding infants within an hour of birth is negatively associated with district level stunting prevalence. The association between district level stunting prevalence and proportion of low birth weight
babies is weak. But, a positive association between stunting prevalence and under five mortality rates is observable, indicating that there are higher risks of mortality that could be associated with factors related with poor nutrition among children. Figure 2.5 shows similar associations with selected indicators.

Annual Health Survey Report
26
Figure 2.5: Association between district level prevalence of underweight and selected child health indicators
2.5. Key Findings The prevalence of 2SD stunting, wasting and underweight in all the AHS States is comparatively
higher than the prevalence of 3SD of the corresponding measures, indicating that the degree of malnutrition is below the critical limits but still alarming. To elaborate, the prevalence of 2SD stunting among children in Uttar Pradesh is as high as 62 per cent, and the prevalence of 2SD underweight and 2SD wasting in Jharkhand and Chhattisgarh is 45.7 per cent and 32.4 per cent respectively which reflects poor nutrition intake and food deprivation among children below 5 years.
The States reporting high percentage of undernourished children below 5 years also have higher prevalence of wasting and vice-versa. For instance, the percentage of below-2SD undernourished children below 5 years in Chhattisgarh (33.7 per cent) and the prevalence of wasting (32.4 per cent) is the highest among all AHS States. Similarly, the corresponding figures for Uttarakhand are the lowest.
The prevalence of (2SD and 3SD) stunting, wasting and underweight is higher among the males as compared to the females across the AHS States. Similarly, higher percentages of undernourished and overnourished children are male rather than female.

Nutritional Status Of Children Below 5 Years
��
The problem of stunting and underweight in Uttar Pradesh is quite grave. Among, the 100 districts with the highest level of stunting and underweight, 55 and 36 districts are from Uttar Pradesh. In Uttar Pradesh, Rae Bareli has 77.4 per cent of children below 5 years suffering from stunting; and in Hamirpur 70 per cent of children are underweight.
Comparatively, the prevalence of 3SD stunting, wasting, underweight, undernourished and overnourished is lower as compared to the prevalence of 2SD for the corresponding measures. But the coefficient of variation for the 3SD measures is relatively higher indicating that the instances of severe malnourishment are confined to certain areas. And, thus bringing out the need to evaluate the reason for such inter district variation.
Literacy is a significant determinant of stunting. Better educated families tend to be more informed about the nutritional requirement of children and are also aware of health services available. A negative association between literacy and 2SD stunting is observable from data. Similarly, a negative association between female literacy and stunting is visible. Also, there is a positive association between under 5 mortality and stunting, indicating that poor nutrition among children can increase the risk of mortality or augment the factors leading to mortality like low immunity.

28
NUTRITIONAL STATUS OF SCHOOL-AGED CHILDREN AND ADOLOSCENTS (5-18 YEARS)
3.1 Nutritional intake is an important determinant of human health and well-being, playing a crucial role in promoting development of school going children and adolescents. Nutritional intake fosters physical and mental growth as well as cognitive development. Furthermore, during this stage, children develop life-long eating behaviors. This chapter presents the AHS district-wise levels, trends and differentials in nutritional status of school-aged children and adolescents. 3.1. Definition of Indicators 3.2 Under-nutrition can be termed as a deficiency of calories or several vital nutrients essential for growth and survival. Under-nutrition develops largely when people fail to obtain or prepare food, suffer from a disorder that makes eating or absorbing food difficult, or have a greatly increased need for calories. 3.3 Over-nutrition is a form of malnutrition marked by anexcessive intake of nutrients. The
amount of nutrients consumed exceeds the amount required for normal growth, development and metabolism. 3.2. Levels and Patterns 3.4 Table 3.1 illustrates the percentage of undernourished (below 2SD and below 3SD) and overnourished (aove 2 SD and above 3 SD) children between 5 and 18 years for 2014. A considerably high number of undernourished children are observed across States, with Bihar recording the highest percentage of undernourished at 33 per cent for below2SD and 21.7per cent for below3SD. Uttarakhand recorded the lowest percentage with 19.9per cent being reported for below2SD and 6.1per cent for below3SD in 2014. Cases of overnourished children are comparatively low in all the States with the lowest being in Uttar Pradesh at 1.1per cent. Uttarakhand has the maximum cases of over-nourishment at 3.1per cent in above2SD and 1per cent in above3SD categories.
Table 3.1: Undernourished and overnourished (%), 2014
Percentage of undernourished and over-nourished population among 5-18 years in (2014)
State Undernourished Overnourished
Below -2 SD Below -3 SD Above 2 SD Above 3 SD Assam 27.6 16.0 2.0 0.7 Bihar 33.0 21.7 2.3 0.7 Chhattisgarh 29.9 14.9 1.5 0.7 Jharkhand 30.3 12.4 1.5 0.6 Madhya Pradesh 31.1 16.4 1.7 0.7 Odisha 32.2 11.6 1.4 0.3 Rajasthan 32.5 14.5 1.7 0.6 Uttar Pradesh 27.2 10.8 1.1 0.4 Uttarakhand 19.9 6.1 3.1 1.0
3

Nutritional Status Of School Aged Children and Adoloscents (5-18 Years)
��
Map 3.1: Prevalence of under-nutrition (below-2 SD) in age group 5-18 years (2014)

Annual Health Survey Report
30
Map 3.2: Prevalence of under-nutrition (below-3 SD) in age group 5-18 years

Nutritional Status Of School Aged Children and Adoloscents (5-18 Years)
�1
Map 3.3: Prevalence of over-nutrition (above 2 SD) in age group 5-18 years

Annual Health Survey Report
32
Map 3.4: Prevalence of over-nutrition (above 3 SD) in age group 5-18 years

Nutritional Status Of School Aged Children and Adoloscents (5-18 Years)
��
3.5 Table 3.2shows the percentage of undernourished and overnourished children aged 5-18 years in rural areas. Rajasthan and Bihar report the maximum cases of under-nourishment in below2SD category at 33.8 per cent and 33.7 per cent respectively, while Bihar reports the maximum in the case of below 3SD
too. Uttarakhand recorded the lowest number of cases in rural areas as well at 19.7 per cent and 5.8 per centin below2SD and below3SD categories, respectively. In the case of over-nourishment in rural areas too, Uttarakhand has the highest prevalence in above2SD (3.2per cent) and above 3SD (1.2per cent) categories.
Table 3.2: Undernourished and overnourished in rural areas (%)
Percentage of undernourished and over-nourished population among 5-18 years in rural areas (2014) States Undernourished Over-nourished Rural Below -2 SD Below -3 SD Above 2 SD Above 3 SD Assam 28.3 16.1 2.0 0.8 Bihar 33.7 22.1 2.4 0.7 Chhattisgarh 30.9 15.3 1.5 0.7 Jharkhand 32.8 14.1 1.2 0.6 Madhya Pradesh 32.8 17.3 1.6 0.6 Odisha 33.1 11.9 1.1 0.3 Rajasthan 33.8 15.1 1.2 0.4 Uttar Pradesh 28.0 11.1 0.9 0.4 Uttarakhand 19.7 5.8 3.2 1.2
Table 3.3: Undernourished and overnourished among male and female (%) Percentage of undernourished and overnourished male-female population among 5-18 years (2014)
State Male Female Male Female Undernourished Below -2 SD Below -3 SD Assam 29.9 25.2 17.5 14.3 Bihar 35.3 30.5 24.0 19.1 Chhattisgarh 33.3 26.3 17.1 12.6 Jharkhand 33.9 26.8 14.4 10.4 Madhya Pradesh 33.6 28.4 18.7 13.8 Odisha 36.1 28.1 13.6 9.4 Rajasthan 35.9 28.7 17.2 11.6 Uttar Pradesh 30.8 23.3 13.0 8.5 Uttarakhand 21.8 17.8 7.1 5.0 State Male Female Male Female Overnourished Above 2 SD Above 3 SD Assam 2.3 1.7 0.8 0.7 Bihar 2.8 1.8 0.9 0.4 Chhattisgarh 1.7 1.4 0.8 0.6 Jharkhand 1.6 1.3 0.7 0.5 Madhya Pradesh 1.9 1.5 0.8 0.5 Odisha 1.7 1.1 0.3 0.3 Rajasthan 2.1 1.1 0.7 0.5 Uttar Pradesh 1.3 1.0 0.5 0.4 Uttarakhand 3.9 2.3 1.3 0.7

Annual Health Survey Report
34
3.6 Table 3.3 shows that prevalence of under-nourishment and over-nourishment is higher amongst males as compared to females. Odisha shows the highest cases of undernourishment in males in the below 2SD category at 36.1 per cent, followed by Rajasthan at 35.9per cent. The least prevalence was seen in Uttarakhand at 21.8 per cent. In the case of females, Bihar reported the highest percentage at 30.5 per cent, while Uttarakhand registered the lowest levels at 17.8 per cent. In the below 3SD category, Bihar shows the highest prevalence in both males and females at 24 per cent and 19.1 per cent respectively while Uttarakhand records the lowest for both sexes at 7.1 per cent and 5 per cent respectively. In the case of over-nourishment, Uttarakhand points to higher
figures for males and females in both the categories. 3.7 Figure 3.1 shows the distribution of the 100 districts with highest prevalence of under-nourishment and over-nourishment among AHS States. Madhya Pradesh accounts for the maximum districts in the list of 100 districts with highest prevalence of under-nourishment (19) and over-nourishment (22) among school going children and adolescents. Uttarakhand was the only State that did not report any districtin the list of for under-nourishment in 2014, while it had 8 districts among the highest 100 districts for over-nourishment. Bihar and Uttar Pradesh too have high number of cases of both under-nourishment and over-nourishment.
Figure 3.1: State-wise distribution of 100 districts with highest percentage of undernourished and
overnourished population (5-18 years), 2014
3.8 Table 3.4 lists the 100 districts with the highest percentage of undernourished and over-nourished population in the 5-18 age groups, with Bihar occupying a majority of the slots in
the case of under-nourishment. Bihar also recorded the maximum cases of over-nourishment among the list of highest prevalence 100 districts.

Nutritional Status Of School Aged Children and Adoloscents (5-18 Years)
��
Table 3.4: List of 100 districts with highest percentage of undernourished and overnourished population (5-18 years), 2014
No. Undernourished (%) Overnourished (%)
Below -2 SD Below 2 SD State District State District
1 Bihar Araria (57.8) Bihar Purnia (8.4) 2 Bihar Darbhanga (57.1) Bihar Saharsa (8.2) 3 MP Umaria (55.4) Uttarakhand Nainital (8.2) 4 Bihar Saharsa (55) Uttarakhand Bageshwar (8.2) 5 Bihar Supaul (53.4) Bihar Katihar (7.9) 6 Assam Hailakandi (52.3) Jharkhand Dhanbad (7.7) 7 Odisha Kalahandi (49.6) Bihar Samastipur (6.9) 8 MP Sagar (48.7) UP Jyotiba Phule Nagar (6.8) 9 Jharkhand Sahibganj (48.5) MP Vidisha (6.3) 10 Bihar Purnia (48.4) Assam Dhubri (5.7) 11 Bihar Muzaffarpur (48.1) UP Gautam Buddha Nagar (5.3) 12 MP Narsinghapur (48) Uttarakhand Pithoragarh (5.3) 13 Bihar Sitamarhi (47.1) Assam North Cachar Hills (5.1) 14 Bihar Pashchim Champaran (46.7) Odisha Kandhamal (5) 15 MP Dewas (46) Assam Golaghat (4.9) 16 Bihar Sheohar (45.9) Bihar Purba Champaram (4.8) 17 MP Barwani (44.4) Chhattisgarh Rajnandgaon (4.5) 18 Bihar Madhepura (43.6) UP Bulandshahr (4.5) 19 Jharkhand Giridih (43.4) UP Ghaziabad (4.3) 20 Odisha Koraput (43.4) Assam Dibrugarh (4.2) 21 Rajasthan Sawai Madhopur (43.3) Assam Sibsagar (4.2) 22 Jharkhand Chatara (43.2) Uttarakhand Pauri Garhwal (4.2) 23 Rajasthan Banswara (43.2) MP Barwani (4) 24 Rajasthan Pali (42.8) UP Kannauj (4) 25 Rajasthan Tonk (42.6) MP Neemuch (3.9) 26 Rajasthan Sirohi (42.6) Rajasthan Jaipur (3.8) 27 Rajasthan Karauli (41.9) Uttarakhand Champawat (3.8) 28 UP Balrampur (41.7) MP Dewas (3.7) 29 Odisha Malkanagiri (41.6) Chhattisgarh Bilaspur (3.5) 30 UP Kheri (41.4) Jharkhand Paschimi Singhbum (3.4) 31 MP Ujjain (41.3) Rajasthan Jhunjhunun (3.3) 32 Odisha Baudh (41.2) Assam Nalbari (3.2) 33 Bihar Samastipur (41.1) Jharkhand Gumla (3.2) 34 MP Katni (40.5) Uttarakhand Udham Singh Nagar (3.2) 35 Rajasthan Dungarpur (40.5) MP Dhar (3.1) 36 UP Maharajganj (40) Odisha Khordha (3.1) 37 Jharkhand Kodarma (39.7) Jharkhand Pakaur (3) 38 Assam Karimganj (39.6) Odisha Puri (3) 39 MP Shivpuri (39.5) UP Aligarh (3) 40 Odisha Balangir (39.4) UP Pilibhit (3) 41 Odisha Nabarangapur (39.4) Bihar Madhubani (2.7) 42 Rajasthan Udaipur (39) Bihar Siwan (2.6) 43 Chhattisgarh Durg (38.7) MP Seoni (2.6) 44 Rajasthan Bhilwara (38.6) Odisha Rayagada (2.6) 45 Chhattisgarh Jashpur (38.5) Assam Lakhimpur (2.5) 46 Jharkhand Pakaur (38.5) Bihar Sitamarhi (2.5) 47 Odisha Kendujhar (38.1) MP Raisen (2.5) 48 Odisha Baleshwar (38.1) MP Harda (2.5) 49 Bihar Khagaria (38) Bihar Sheohar (2.4)

Annual Health Survey Report
36
No. Undernourished (%) Overnourished (%)
Below -2 SD Below 2 SD State District State District
50 Assam Sonitpur (37.8) MP Shahdol (2.4) 51 Bihar Purba Champaram (37.8) Rajasthan Jalore (2.4) 52 Rajasthan Baran (37.7) UP Etah (2.4) 53 UP Sonbhadra (37.6) UP Bareilly (2.4) 54 Rajasthan Bundi (37.5) UP Rampur (2.4) 55 Bihar Katihar (37.4) Odisha Sambalpur (2.2) 56 MP Balaghat (37.4) Bihar Rohtas (2.1) 57 UP Gonda (37) MP Indore (2.1) 58 MP Tikamgarh (36.8) MP Dindori (2.1) 59 Jharkhand Deoghar (36.7) MP West Nimar (2.1) 60 Odisha Bhadrak (36.7) Odisha Kendrapara (2.1) 61 Rajasthan Rajsamand (36.7) UP Shahjahanpur (2.1) 62 Chhattisgarh Kanker (36.6) Assam Karimganj (2) 63 MP Harda (36.6) Bihar Munger (2) 64 MP Dhar (36.6) Bihar Khagaria (2) 65 UP Lucknow (36.4) MP Betul (2) 66 Odisha Sonapur (36.3) UP Agra (2) 67 UP Shrawasti (36) Assam Cachar (1.9) 68 MP Shajapur (35.8) Bihar Vaishali (1.9) 69 UP Lalitpur (35.7) MP Sagar (1.9) 70 Rajasthan Jalore (35.6) MP Bhopal (1.9) 71 Bihar Kishanganj (35.3) Odisha Jharsuguda (1.9) 72 Odisha Ganjam (35.3) Odisha Jagatsinghapur (1.9) 73 MP Dindori (35.2) UP Mathura (1.9) 74 MP Mandla (35.1) Uttarakhand Dehradun (1.9) 75 MP Damoh (34.6) Chhattisgarh Dantewada (1.8) 76 Rajasthan Ganganagar (34.6) Jharkhand Purbi Singhbum (1.8) 77 MP Raisen (34.4) Jharkhand Godda (1.8) 78 UP Sultanpur (34.4) MP Sidhi (1.8) 79 UP Mau (34.4) Odisha Bhadrak (1.8) 80 Rajasthan Dausa (34.3) Odisha Cuttack (1.8) 81 Jharkhand Godda (34.2) Rajasthan Churu (1.8) 82 Jharkhand Dhanbad (34) Rajasthan Ajmer (1.8) 83 MP Ratlam (34) UP Budaun (1.8) 84 MP East Nimar (34) UP Hathras (1.8) 85 UP Sant Kabir Nagar (33.9) UP Saharanpur (1.8) 86 Rajasthan Kota (33.5) Uttarakhand Haridwar (1.8) 87 Assam Cachar (33.4) Assam Tinsukia (1.7) 88 Bihar Siwan (33) Chhattisgarh Korba (1.7) 89 Odisha Debagarh (33) Chhattisgarh Durg (1.7) 90 Rajasthan Jodhpur (32.9) Jharkhand Ranchi (1.7) 91 UP Jalaun (32.9) MP Datia (1.7) 92 Assam Dhubri (32.8) MP Satna (1.7) 93 Rajasthan Dhaulpur (32.6) MP Rewa (1.7) 94 UP Mahoba (32.5) Rajasthan Udaipur (1.7) 95 Bihar Vaishali (32.4) UP Meerut (1.7) 96 Chhattisgarh Dhamtari (32.4) UP Muzaffarnagar (1.7) 97 Rajasthan Bharatpur (32.4) Bihar Saran (1.6) 98 Chhattisgarh Raipur (32.3) MP Mandla (1.6) 99 Jharkhand Palamu (32.3) MP Tikamgarh (1.6) 100 UP Kaushambi (32.3) MP Jabalpur (1.6)

Nutritional Status Of School Aged Children and Adoloscents (5-18 Years)
��
3.9 Table 3.5 lists the name of districts whose rural areas reported high percentage of under-nourishment and over-nourishment. Sagar district in Madhya Pradesh had the maximum cases of under-nourished children in the 5-18 age bracket at 60.3 per cent, followed by Araria
district in Bihar at 57.9 per cent. Bihar has a majority of districts from rural areas too with a high prevalence of under-nourishment and over-nourishment. Naintal district of Uttarakhand saw the highest number of over-nourished children in 2014 at 12.5 per cent.
Table 3.5: List of 10 Districts with highest prevalence of undernourished and overnourished in rural
areas (5-18 years), 2014
Undernourished Overnourished State District State District
1 Madhya Pradesh Sagar (60.3) Uttarakhand Nainital (12.5) 2 Bihar Araria (57.9) Jharkhand Dhanbad (9.3) 3 Bihar Darbhanga (57.4) Bihar Saharsa (8.3) 4 Madhya Pradesh Umaria (56.8) Bihar Purnia (8.3) 5 Bihar Saharsa (54.6) Bihar Katihar (8.3) 6 Bihar Supaul (54.3) Uttarakhand Bageshwar (7.9) 7 Assam Hailakandi (53.3) Uttarakhand Pithoragarh (6.9) 8 Odisha Kalahandi (50.1) Uttar Pradesh Jyotiba Phule Nagar (6.7) 9 Jharkhand Sahibganj (49.1) Bihar Samastipur (6.6) 10 Madhya Pradesh Narsinghapur (48.2) Madhya Pradesh Vidisha (6.4) 3.3. Inter-District Disparities 3.10 Table 3.6 enumeratescoefficient of variation at the State level for undernourished and over-nourished children falling in the 5-18 age bracket. In the case of under-nourishment, Bihar reported the maximum variation at
0.41and 0.58 for below2SD and below 3SD categories respectively. For cases of over-nourishment as well, Bihar recorded the highest CV in case of below2SD, followed by Uttar Pradesh at 0.95 (indicating a high variation) while Jharkhand reported the maximum variation in the 3SD category at 1.08.
Table 3.6:Coefficient of variation of district level undernourished and overnourished population among 5-18 years in each State, 2014
State Undernourished Overnourished
Below -2 SD Below -3 SD Above 2 SD Above 3 SD Assam 0.32 0.51 0.79 0.46 Bihar 0.41 0.58 1.00 0.98 Chhattisgarh 0.17 0.25 0.67 0.54 Jharkhand 0.24 0.48 0.92 1.08 Madhya Pradesh 0.29 0.45 0.63 0.76 Odisha 0.21 0.31 0.67 0.43 Rajasthan 0.21 0.28 0.52 0.56 Uttar Pradesh 0.23 0.45 0.95 0.74 Uttarakhand 0.24 0.28 0.72 0.73

Annual Health Survey Report
38
3.11 Table3.7 indicates the State-wise coefficient of variation of districts for under-nourishment and over-nourishment. For under-nourishment at below 2SD levels, the variation is the highest in Bihar at 0.38 and 0.45 in the case of males and femalesrespectively. For 3SD
levels as well, Bihar and Assam depicts
for males and 0.63 for females, and Assamvariation at 0.55 (males) and 0.56 (females). Bihar and Assam show high variations in case of over-nourishment too.
Table3.7: Coefficient of variation of district level undernourished and overnourished male-female
population among 5-18 years, 2014 State Male Female Male Female Undernourished Below -2 SD Below -3 SD Assam 0.32 0.34 0.50 0.56 Bihar 0.38 0.45 0.56 0.63 Chhattisgarh 0.19 0.16 0.24 0.29 Jharkhand 0.24 0.26 0.47 0.52 Madhya Pradesh 0.29 0.31 0.42 0.49 Odisha 0.22 0.23 0.32 0.34 Rajasthan 0.23 0.21 0.28 0.32 Uttar Pradesh 0.24 0.25 0.41 0.53 Uttarakhand 0.29 0.19 0.32 0.30 State Male Female Male Female Overnourished Above 2 SD Above 3 SD Assam 0.71 0.67 0.53 0.67 Bihar 1.01 0.77 0.97 0.65 Chhattisgarh 0.57 0.78 0.40 0.40 Jharkhand 0.74 1.11 0.59 1.10 Madhya Pradesh 0.62 0.62 0.73 1.03 Odisha 0.64 0.58 0.41 0.56 Rajasthan 0.45 0.43 0.38 0.70 Uttar Pradesh 0.93 0.77 0.68 0.64 Uttarakhand 0.71 0.62 0.89 0.38 3.12 Table 3.8 illustrates the district-wise disparity of under-nourished and over-nourished children in the 5-18 age group. Araria district in Bihar recorded 57.8 per cent under-nutrition in the below2SD category, while Saharsa (48.4 per cent) reported the highest cases of over-nutrition in the 3SD level. In comparison to the other AHS States, Bihar reports a high inter-district disparity range at 46.6 per cent (below2SD) and 46.1 per cent (below 3SD). Chhindwara district in Madhya Pradesh
reported the lowest cases of under-nourishment. Bihar also has districts with high levels of over-nourishment, recording the maximum number of cases for above 2SD levels at 8.4 per cent, followed by Bageshwar and Nainital districts in Uttarakhand that reported 8.2 per cent cases. Interestingly, Rae Bareli and Chitrakoot districts in Uttar Pradesh did not report any case of over-nourishment in 2014 in both the above 2SD and above 3SD categories. Bageshwar district in Uttarakhand had the maximum

Nutritional Status Of School Aged Children and Adoloscents (5-18 Years)
��
prevalence of over-nourishment for 3SD at 4.2per cent. The inter-district disparity was the
highest in Bihar (8.1) and Uttarakhand (3.95) for above2SD and 3SD levels respectively.
Table 3.8: District-wise disparity in district level undernourished and overnourished male-female population
among 5-18 years, 2014 District with the highest and lowest percentage of undernourished and overnourished male-female population among
5-18 years, 2014
State
Below -2 SD Below -3 SD
Highest Lowest Range Highest Lowest Range
Undernourished Assam Hailakandi (52.3) North Cachar Hills
(12.8) 39.5 Hailakandi (34.5) Kokrajhar (3.6) 30.9
Bihar Araria (57.8) Gaya (11.2) 46.6 Saharsa (48.4) Patna (2.3) 46.1
Chhattisgarh Durg (38.7) Raigarh (20.1) 18.6 Raipur (20.2) Raigarh (9) 11.2
Jharkhand Sahibganj (48.5) Paschimi Singhbum (19.5)
29.0 Sahibganj (32.7) Ranchi (6) 26.7
Madhya Pradesh Umaria (55.4) Chhindwara (8.4) 47.0 Dewas (34.3) Chhindwara (3.8) 30.5
Odisha Kalahandi (49.6) Sundargarh, Nayagarh (22.7)
26.9 Kalahandi (20) Jajapur (5.6) 14.4
Rajasthan Sawai Madhopur (43.3)
Jaisalmer (14.3) 29.0 Dungarpur (23.7) Jaisalmer (6.3) 17.4
Uttar Pradesh Balrampur (41.7) Banda (14.2) 27.5 Kheri (25) Chandauli (4.2) 20.8
Uttarakhand Uttarkashi (24.8) Pithoragarh (12.1) 12.7 Champawat, Almora (8.7)
Tehri Garhwal (3.5) 5.2
Overnourished Above 2 SD Above 3 SD Assam Dhubri (5.7) Marigaon, Goalpara,
Hailakandi (0.5) 5.2 Dibrugarh (1) Karbi Anglong (0.1) 0.9
Bihar Purnia (8.4) Supaul (0.3) 8.1 Katihar (3.8) Sheikhpura (0.2) 3.6
Chhattisgarh Rajnandgaon (4.5)
Janjgir-Champa (0.7) 3.8 Rajnandgaon (1.4) Janjgir-Champa, Mahasamund (0.3)
1.1
Jharkhand Dhanbad (7.7) Hazaribagh (0.4) 7.3 Dhanbad (4.4) Giridih, Kodarma (0.2) 4.2
Madhya Pradesh Vidisha (6.3) EastNimar (0.4) 5.9 Vidisha (3.4) Hoshangabad, Jabaua (0.2)
3.2
Odisha Kandhamal (5) Nabarangapur (0.2) 4.8 Kandhamal (1) Ganjam, Sundargarh (0.2)
0.8
Rajasthan Jaipur (3.8) Baran, Sirouhi (0.6) 3.2 Jhunjhunun (1.4) Chittaurgarh (0.1) 1.3
Uttar Pradesh Jyotiba Phule Nagar (6.8)
RaeBareli, Chitrakoot (0)
6.8 Jyotiba Phule Nagar (2)
Lucknow, Fathepur, Chitrakoot, Rae Bareli (0)
2.0
Uttarakhand Bageshwar, Nainital (8.2)
Uttarkashi (0.7) 7.5 Bageshwar (4.2) Haridwar (0.3) 3.9
3.4. Gender Differentials 3.13 Table3.9 shows the gender differentials in the case of under-nourishment and over-nourishment for children in the 5-18 age brackets. A ratio differential of 1.2 times and above is considered as a high differential. Most
of the States show a considerably high male-female differential; and a nil female-male ratio, indicating that more men tend to be under-nourished as well as over-nourished. Looking at male-female disparity, Uttar Pradesh reported the highest differential for cases of

Annual Health Survey Report
40
undernourishment, (50 districts) as well as overnourishment (20 districts). Uttarakhandhad only 1 district showing exceptional gender
disparity for under-nourishment in case of female-male differential.
Table 3.9: Number of districts with high gender differential in undernourished and overnourished population (5-18 years), 2014
State Undernourished Overnourished
(Below -2 SD) (Above -2 SD) High female-male ratio differential Assam 0 1 Bihar 0 1 Chhattisgarh 0 0 Jharkhand 0 2 Madhya Pradesh 0 3 Odisha 0 2 Rajasthan 0 1 Uttar Pradesh 0 6 Uttarakhand 1 0 High male-female ratio differential Assam 15 6 Bihar 14 15 Chhattisgarh 13 6 Jharkhand 12 6 Madhya Pradesh 24 12 Odisha 22 9 Rajasthan 23 14 Uttar Pradesh 50 20 Uttarakhand 6 6 Table 3.10: List of 10 Districts with high male-female ratio differential in undernourished and overnourished
population (5-18 years), 2014 Undernourished (Below -2 SD) Overnourished (Above -2 SD)
State District State District High male-female ratio differential
1 Bihar Kaimur (Bhabhua) (2.4) Bihar Jehanabad (12.5)
2 Bihar Rohtas (2) Uttarakhand Dehradun (5.5) 3 Bihar Buxar (1.9) Assam Karimganj (4.7)
4 Uttar Pradesh Kaushambi (1.8) Jharkhand Sahibganj (4) 5 Uttar Pradesh Gorakhpur (1.7) Madhya Pradesh Dindori (3)
6 Madhya Pradesh Chhindwara (1.7) Madhya Pradesh Mandla (3) 7 Odisha Anugul (1.6) Uttar Pradesh Muzaffarnagar (2.8)
8 Rajasthan Nagaur (1.6) Chhattisgarh Koriya (2.7) 9 Uttar Pradesh Sitapur (1.6) Madhya Pradesh Hoshangabad (2.7)
10 Uttar Pradesh Hamirpur (1.6) Uttar Pradesh Balrampur (2.6)

Nutritional Status Of School Aged Children and Adoloscents (5-18 Years)
�1
3.14 Table 3.10 lists the 10 districts of the nine AHS States that recorded the highest percentage of male-female differential in children in 2014. Uttar Pradesh and Bihar report a majority of districts (4 and 3 respectively) with high gender differential for under-nourishment (below2SD), with Kaimur district of Bihar reporting the highest disparity at 2.4. In the case of over-nourishment, Madhya Pradesh has the maximum number ofdistricts with high gender differentials. However, a district of Bihar, Jehanabad, tops the list in this category too with a figure of 12.5, while the district with the second highest gender differential, Dehradun
from Uttarakhand, reports a much lower figure at 5.5. 3.5. Associations with Development Indicators 3.15 Figure 3.2 compares the prevalence of below 2SD undernourishment between therural and total populations aged 5-18. The prevalence in rural areas is slightly higher than in the total, indicating higher undernourishment in school going children in rural areas. Also, males have relatively higher prevalence of undernourishment than females.
Figure 3.2: Comparison of undernourishment and overnourishment in school going aged children across region and sex
3.16 Figure 3.3 suggests that undernourishment in school going children is not associated with the drop-out level from schools, as no specific pattern between the percentage of drop-out levels and below 2SD undernourishment in rural population can be traced at the district level. A weak positive association can be observed between the levels of employment and undernourishment in children, but a conclusive result cannot be established due to the high
number of outlier districts. In both cases, undernourishment in rural population was studied owing to the higher prevalence of child labour and school dropouts in rural areas. 3.17 No clear association exists between under-nourishment and early marriages for females either. While child labour among males is weakly associated with higher prevalence of male undernourishment in the 5-18 age group.

Annual Health Survey Report
42
Figure 3.3: Association of undernourishment in school going aged children and other developmental indicators
3.6. Key Findings At the State level, among population aged 5-18 years the percentage of undernourished
population (below 2SD) is comparatively higher than the overnourished population (Above 2SD). This implies that under-nutrition rather than over-nutrition is the major problem across the AHS States. The figures for below 3SD under-nutrition and above 3SD over-nutrition, which are indicators of presence of higher degree of malnutrition, are lower compared to 2 SD levels.
The percentage of undernourished population (below 2SD and below 3SD) among 5-18 years in
AHS States is slightly higher in the rural areas in comparison to State level figures (urban plus rural) except for Uttarakhand. For instance, Bihar recorded the highest percentage of undernourished population among 5-18 years at 33 per cent in below 2SD category while 33.7 per cent in rural areas. Similarly, Bihar recorded under-nourishment at 21.7 per cent in below 2SD category at State level and 22.1 per cent in below 3 SD category.

Nutritional Status Of School Aged Children and Adoloscents (5-18 Years)
��
The percentage of male are likely to be more undernourished and overnourished as compared to
female among 5-18 population across all the categories of malnutrition. For instance, Odisha recorded the highest percentage of undernourished male population among 5-18 years at 36.1 per cent in below 2SD category while 28.1 per cent females are undernourished. Similarly, Uttarakhand has the maximum number of over-nourished males at 3.9 per cent in above 2SD category as compared to 2.3 per cent females.
Among the worst 100 districts with high prevalence of under-nourishment (below 2SD) and over-
nourishment (above 2SD) among 5- 18 population, Madhya Pradesh accounted for the maximum number of cases of under-nourished (19) and over-nourished (22). Uttarakhand was the only State that did not report any case of under-nourishment in 2014.
Among 5-18 year group, coefficient of variation is higher for undernourished populations below
3SD, as compared to 2SD measure of the same indicator, implying that the case of under nutrition below 3SD are higher in certain areas. For instance the coefficient of variation for Bihar for under nutrition is 0.58 for below 3SD category while only 0.41 for below 2SD category which means that the variation across districts in case of 3SD under nutrition is higher and the malady is confined to certain districts. Similarly, the coefficient of variation for under nutrition below 3SD is higher than 2SD for females, implying that females belonging to specific districts are more likely to be undernourished (below 3SD).
Interestingly in the case of 5-18 age group the calculations for high gender differentials (gender
differential greater than 1.2), show that in most of the districts males are more likely to be undernourished (below 2SD) and overnourished (above 2SD). Uttar Pradesh has the maximum number of districts with a high male-female gender differential both in case of undernutrition below 2SD (50 districts) and overnutrition above 2SD (20 districts). In the case of over-nourishment (above 2SD), Jehanabad district of Bihar tops the list with an alarming male-female differential figure of 12.5.
The scatter plot for prevalence of below 2SD undernourishment between the rural and total
populations aged 5-18 and for prevalence of below 2SD undernourishment between the male and female populations aged 5-18 shows that at the district level too, higher percentage of population belonging to rural areas and higher proportion of male population are more likely to be undernourished (below 2SD). Also, male children engaged in work are more likely to be undernourished.

44
NUTRITIONAL STATUS OF ADULT POPULATION
4.1. Definition of Indicators 4.1 Body Mass Index (BMI) is an index of weight-for-height that is commonly used to classify underweight, overweight and obesity. The BMI is computed by dividing the weight (in kilograms)of the individual by the square of height of the individual (in metres) and is expressed in units of kg/m2. For example, an adult who weighs 70kg and whose height is 1.75m will have a BMI of 22.9. For interpretation purposes, individuals with BMI below 18.5 Kg/m2 are classified as underweight whereas those with BMI greater than or equal to 25.0 Kg/m2 are considered as overweight. Further, individuals with BMI greater than or equal to 30.0 Kg/m2 are categorized as obese.
4.2. Levels and Trends 4.2 Table 4.1 reports the State-wise percentage of population with BMI less than 18.5, greater than equal to 25 and greater than equal to 30 among the age groups of 18-59 years and 60 years and above. Percentage of population with BMI less than 18.5 among 18-59 age-groups is highest in Uttar Pradesh (30 per cent) and lowest in Chhattisgarh (15.4 per cent). Percentage of population with BMI greater than or equal to 25 in 18-59 age groups is highest in Uttarakhand (21.6 per cent) and lowest in Chhattisgarh (6.3 per cent). Also, percentage of presons with BMI greater than or equal to 30 in the 18-59 age group is highest in Uttarakhand (4.7 per cent) and lowest in Bihar (0.6 per cent).
Table 4.1: Body Mass Index distribution across AHS States, 2014 Percentage of population with BMI less than 18.5, greater than equal to 25 and greater than equal to 30 among age
groups 18-59 years; and 60 years and above , (2014)
States BMI <18.5
18-59 years 60 years and above 18-59 years 60 years and
above 18-59 years 60 years and above
Assam 19.8 29.5 10.1 8.7 1.3 1.4 Bihar 20.3 36.4 6.9 4.5 0.6 0.5 Chhattisgarh 15.4 25.6 6.3 8.0 1.3 1.5 Jharkhand 25.5 31.9 13.0 11.7 2.4 2.8 Madhya Pradesh 22.9 25.8 6.7 9.6 1.1 1.7 Odisha 27.1 37.6 14.1 10.8 2.6 2.0 Rajasthan 27.2 31.4 12.9 14.3 2.6 3.4 Uttar Pradesh 30.0 36.9 11.2 10.7 2.1 2.2 Uttarakhand 19.0 23.4 21.6 20.6 4.7 4.3 4.3 Among elderly population (aged 60 years and above) the percentage of underweight population with BMI less than 18.5 is the highest in Odisha (37.6 per cent) followed by Uttar Pradesh (36.9 per cent) and Bihar (36.4 per cent); and lowest in Uttarakhand (23.4 per cent). The share of overweight (BMI greater
than equal to 25) among elderly population is highest in Uttarakhand (20.6 per cent) and lowest in Bihar (4.5 per cent). These States also have highest (Uttarakhand, 4.3 per cent) and lowest (Bihar, 0.5 per cent) prevalence of obesity (BMI greater than equal to 30) among the elderly population.
4

Nutritional Status Of Adult Population
��
Map 4.1: Percentage of underweight (BMI less than 18.5) population aged 18-59 years

Annual Health Survey Report
46
Map 4.2: Percentage of underweight (BMI < 18.5) prevalence among elderly (aged 60 years and above)

Nutritional Status Of Adult Population
��
-59 years
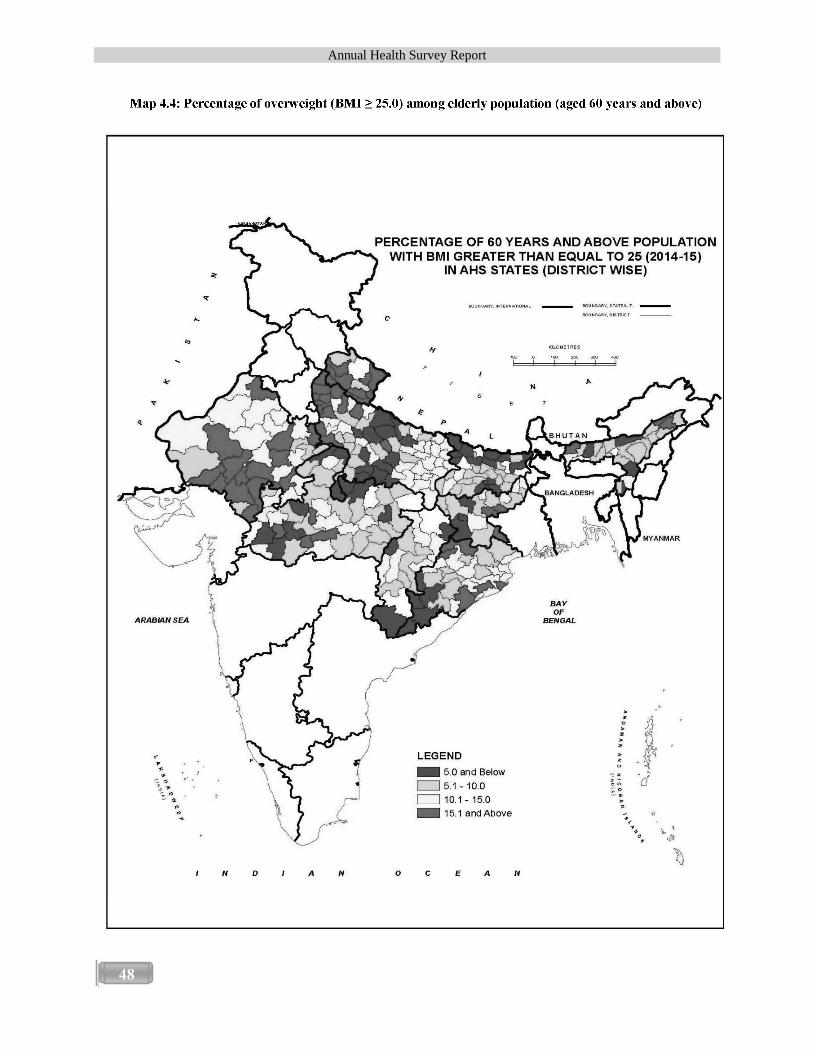
Annual Health Survey Report
48

Nutritional Status Of Adult Population
��
4.4 Table 4.2 reports the State-wise percentage of population in rural areas with BMI less than 18.5, greater than equal to 25 and greater than equal to 30 among age groups 18-59 years; and 60 years and above. Percentage of population with BMI less than 18.5 in 18-59 age group is the highest in rural areas of Uttar Pradesh (32.5 per cent) and lowest in ruralChhattisgarh (17.3 per cent). In the same age group prevalence of overweight (BMI ) is notably highest in rural Uttarakhand (18.3 per cent) and lowest in rural Chhattisgarh (4.9 per cent). In fact, rural Uttarakhand also has a higher prevalence (3.8 per cent) of obesity (BMI ) among this
age group while rural Bihar has the lowest prevalence of 0.6 per cent. 4.5 As regards the elderly population, percentage of underweight population (BMI <18.5) is the highest in rural Odisha (39.9 per cent) and lowest in rural Uttarakhand (26.5 per cent). Prevalence of overweight among elderly isalso highest in rural Uttarakhand (15.9 per cent) and lowest in rural Bihar (3.9 per cent). Both these States also havethe highest (rural Uttarakhand, 2.7 per cent) and lowest (rural Bihar, 0.4 per cent) prevalence of obesity, respectively.
Table 4.2: Body Mass Index distribution in rural areas, 2014
Percentage of population with BMI less than 18.5, greater than equal to 25 and greater than equal to 30 among age groups 18-59 years; and 60 years and above in rural areas , (2014)
Rural BMI <18.5
18-59 years 60 years and above 18-59 years 60 years and
above 18-59 years 60 years and above
Assam 20.9 32.1 8.6 6.9 0.9 1.1 Bihar 20.5 37.4 6.6 3.9 0.6 0.4 Chhattisgarh 17.3 28.3 4.9 6.1 1.0 1.3 Jharkhand 29.7 38.3 6.9 6.5 1.1 1.3 Madhya Pradesh 24.0 29.3 4.4 6.1 0.7 0.9 Odisha 29.2 39.9 11.5 8.7 1.9 1.4 Rajasthan 29.5 35.3 9.3 9.5 1.6 1.9 Uttar Pradesh 32.5 39.7 8.4 8.2 1.4 1.5 Uttarakhand 20.1 26.5 18.3 15.9 3.8 2.7 4.6 Table 4.3 reports the State-wise distribution of BMI among males and females. Among males, the prevalence of underweight in the age group18-59 years is the highest in Uttar Pradesh (31.9 per cent) and lowest in Chhattisgarh (12.5 per cent). However, prevalence of overweight is the highest in Uttarakhand (19.4 per cent) and lowest in Bihar (5.6 per cent). Obesity prevalence is also highest in Uttarakhand (3.2 per cent) and lowest in Bihar (0.5 per cent). As regards, male elderly population, the prevalence of underweight is noted to be highest in Uttar
Pradesh (39.5 per cent) followed by Bihar (39.1 per cent) and lowest in Uttarakhand (22.3 per cent). Higher prevalence of overweight (highest in Uttarakhand, 17.6 per cent and lowest in Bihar, 3.6 per cent) and relatively low obesity (highest in Uttarakhand, 2.6 per cent and lowest in Bihar, 0.5 per cent) among elderly male population is also noted. 4.7 Among females aged 18-59 years, Odisha shows the highest percentage of underweight prevalenceat 30.3 per cent while Chhattisgarh

Annual Health Survey Report
50
showsthe lowest at 18.5 per cent. In this age group, the highestprevalence of overweight is recorded in Uttarakhand (23.2 per cent) and lowest in Chhattisgarh (6.2 per cent). Similarly highest prevalence of obesity is recorded in Uttarakhand (5.7 per cent) and lowest in Bihar (0.8 per cent). Notably, Odisha (40.6 per cent) displays a very high level of underweight
prevalence among elderly females.Uttarakhandshares a dual burden as it also reports the highest prevalence of overweight (23.3 per cent) and obesity among elderly females (5.9 per cent). The issue of overweight ( ) and obesity ( ) among elderly female is the lowest in Bihar, 5.4 per cent and 0.5 per cent.
Table 4.3: Body Mass Index distribution among male and female, 2014 Percentage of male-female population with BMI less than 18.5, greater than equal to 25 and 30 among age groups
18-59 years; and 60 years and above, (2014)
Male BMI <18.5
18-59 years 60 years and above 18-59 years 60 years and
above 18-59 years 60 years and above
Assam 17.3 27.1 9.4 8.3 1.0 0.9 Bihar 20.8 39.1 5.6 3.6 0.5 0.5 Chhattisgarh 12.5 22.9 6.5 7.4 1.1 0.9 Jharkhand 21.2 28.1 12.9 11.0 1.8 2.4 Madhya Pradesh 24.4 25.0 5.9 8.8 0.9 1.5 Odisha 23.3 34.8 13.9 10.3 2.2 1.6 Rajasthan 26.2 32.6 11.1 12.0 1.7 2.2 Uttar Pradesh 31.9 39.5 8.8 8.4 1.3 1.3 Uttarakhand 18.1 22.3 19.4 17.6 3.2 2.6
Female 18-59 years 60 years and above 18-59 years 60 years and
above 18-59 years 60 years and above
Assam 21.9 32.1 10.7 9.2 1.6 1.9 Bihar 19.8 33.7 8.0 5.4 0.8 0.5 Chhattisgarh 18.5 28.4 6.2 8.6 1.4 2.2 Jharkhand 28.6 36.0 13.0 12.4 2.9 3.2 Madhya Pradesh 21.2 26.6 7.5 10.4 1.3 1.9 Odisha 30.3 40.6 14.3 11.3 2.9 2.4 Rajasthan 28.1 30.3 14.4 16.4 3.4 4.4 Uttar Pradesh 28.4 34.3 13.2 12.9 2.8 3.1 Uttarakhand 19.6 24.4 23.2 23.3 5.7 5.9 4.8 Table 4.4 and 4.5 lists the 100 districts with high percentages of population having BMI less than 18.5, greater than or equal to 25 and 30 in the18-59 age groups and 60 years and above, respectively. Districts from Uttar Pradesh,
Rajasthan and Odisha figure prominently in the list of districts with highest prevalence of underweight, overweight and obesityamong population in 18-59 age group. The trend is quite similar for population age 60 and above.

Nutritional Status Of Adult Population
�1
Table 4.4: List of 100 districts with highest prevalence of underweight, overweight and obesity among population aged 18-59 years
No.
BMI <18.5 (Underweight) State District State District State District
1 Rajasthan Banswara (48) Uttarakhand Dehradun (28.1) Uttarakhand Nainital (6.6) 2 UP Kheri (46.8) UP G Buddha Nagar (26.6) Uttarakhand US Nagar (6.6) 3 Odisha Malkanagiri (45.3) Uttarakhand Nainital (26.6) Uttarakhand Dehradun (5.9) 4 Odisha Nabarangapur (45) Uttarakhand US Nagar (25.8) UP Meerut (5.8) 5 Odisha Kalahandi (42.8) Jharkhand Purbi Singhbum (24.8) Rajasthan Kota (5.6) 6 Bihar Pashchim Champaran (42.1) UP Meerut (24.8) Uttarakhand Haridwar (5.5) 7 UP Jalaun (42) Odisha Khordha (24.5) UP Agra (5.3) 8 MP Shivpuri (41.6) Odisha Cuttack (22.9) Jharkhand Bokaro (5.2) 9 UP Allahabad (41.2) UP Ghaziabad (22.8) UP Baghpat (5) 10 UP Deoria (41.1) Odisha Jagatsinghapur (22.5) Jharkhand Dhanbad (4.7) 11 UP Jaunpur (41.1) Jharkhand Bokaro (22.3) Rajasthan Udaipur (4.6) 12 Assam Hailakandi (41) Uttarakhand Bageshwar (21.8) UP Bijnor (4.6) 13 UP Gorakhpur (41) Uttarakhand Haridwar (21.8) Uttarakhand Tehri Garhwal (4.6) 14 UP Basti (40.6) UP Baghpat (21.6) Odisha Jagatsinghapur (4.4) 15 UP Varanasi (40.3) Odisha Jharsuguda (21.5) Odisha Jharsuguda (4.4) 16 Bihar Supaul (39.7) Rajasthan Kota (21.3) Odisha Nayagarh (4.4) 17 MP Balaghat (39.7) UP Saharanpur (20.5) UP Mathura (4.4) 18 UP Sant Kabir Nagar (39.7) UP Mathura (20.5) UP G Buddha Nagar (4.3) 19 MP Dhar (39.4) Uttarakhand Pauri Garhwal (20.4) Uttarakhand Pauri Garhwal (4.3) 20 UP Mahoba (39.4) Jharkhand Dhanbad (20.3) UP Aligarh (4.2) 21 UP Sitapur (39.2) UP Agra (20.3) UP Bareilly (4.2) 22 Jharkhand Chatara (39.1) Odisha Nayagarh (20.2) Odisha Sambalpur (3.9) 23 Odisha Balangir (38.8) Uttarakhand Tehri Garhwal (20.2) Odisha Khordha (3.8) 24 UP Gonda (38.8) Uttarakhand Champawat (19.7) UP Ghaziabad (3.8) 25 UP Ballia (38.7) Assam Dibrugarh (19.5) Odisha Ganjam (3.7) 26 UP Pratapgarh (37.8) UP Bareilly (18.9) Odisha Cuttack (3.7) 27 UP Chandauli (37.8) UP Aligarh (18.4) Rajasthan Hanumangarh (3.7) 28 Rajasthan Karauli (37.4) UP Bijnor (18.3) UP Moradabad (3.7) 29 UP Rae Bareli (37.3) Odisha Ganjam (17.9) MP Vidisha (3.6) 30 UP Mau (37.2) Odisha Kendrapara (17.2) Odisha Sundargarh (3.6) 31 Odisha Koraput (37.1) Odisha Bargarh (17.2) Odisha Bargarh (3.6) 32 UP Sultanpur (37) Odisha Sambalpur (17.1) Rajasthan Dhaulpur (3.6) 33 UP Siddharthanagar (36.8) Odisha Anugul (17.1) Rajasthan Jalore (3.6) 34 UP Kaushambi (36.8) Rajasthan Chittaurgarh (17.1) Assam Dibrugarh (3.5) 35 UP Maharajganj (36.5) Uttarakhand Pithoragarh (16.8) Rajasthan Chittaurgarh (3.5) 36 MP Sagar (36.4) Odisha Puri (16.5) UP Mainpuri (3.5) 37 UP Hardoi (36.2) Rajasthan Hanumangarh (16.5) Odisha Kendrapara (3.4) 38 Rajasthan Tonk (36.1) UP Moradabad (16.5) UP Bulandshahr (3.4) 39 UP Barabanki (35.9) Rajasthan Udaipur (16.3) Jharkhand Purbi Singhbum (3.3) 40 Assam Karimganj (35.7) Odisha Baleshwar (16.2) MP Raisen (3.3) 41 UP Ghazipur (35.6) MP Harda (15.8) Rajasthan Pali (3.3) 42 UP Mirzapur (35.6) Odisha Sundargarh (15.8) UP Lucknow (3.2) 43 UP Lucknow (35.5) Assam Kokrajhar (15.7) UP Rampur (3.1) 44 Jharkhand Giridih (35.2) Assam Dhemaji (15.6) Uttarakhand Champawat (3.1) 45 MP Ujjain (35) Odisha Jajapur (15.5) MP Harda (3) 46 UP Faizabad (34.9) Uttarakhand Uttarkashi (15.5) MP Indore (3) 47 Rajasthan Pali (34.8) UP Lucknow (15.3) Rajasthan Bhilwara (3) 48 UP SR Nagar (34.7) Rajasthan Bharatpur (15.1) Rajasthan Jhunjhunun (3) 49 MP Dewas (34.5) Rajasthan Jalore (14.9) Odisha Baleshwar (2.9)

Annual Health Survey Report
52
No.
BMI <18.5 (Underweight) State District State District State District
50 UP Farrukhabad (34.2) UP Mainpuri (14.9) Odisha Kandhamal (2.9) 51 UP Ambedkar Nagar (34.1) Rajasthan Ganganagar (14.8) Rajasthan Ajmer (2.9) 52 UP Shrawasti (34) Rajasthan Jaipur (14.7) Rajasthan Bikaner (2.9) 53 Odisha Kendujhar (33.9) UP Bulandshahr (14.5) UP Saharanpur (2.9) 54 Jharkhand Sahibganj (33.8) UP Kanpur Nagar (14.3) UP Muzaffarnagar (2.9) 55 Assam Tinsukia (33.7) Jharkhand Ranchi (14.2) UP Kannauj (2.9) 56 MP Jhabua (33.7) Jharkhand Kodarma (14.1) Uttarakhand Uttarkashi (2.9) 57 UP Jhansi (33.6) Rajasthan Pali (13.8) Rajasthan Ganganagar (2.8) 58 Rajasthan Sirohi (33.4) MP Indore (13.7) Rajasthan Sikar (2.8) 59 MP Narsinghapur (33.3) Rajasthan Bhilwara (13.7) Chhattisgarh Korba (2.7) 60 Odisha Sonapur (33.1) Rajasthan Jhunjhunun (13.7) Odisha Anugul (2.7) 61 Rajasthan Jodhpur (33) Rajasthan Churu (13.5) UP Pilibhit (2.7) 62 Bihar Darbhanga (32.9) Assam Cachar (13.3) Jharkhand Ranchi (2.6) 63 Jharkhand Deoghar (32.8) Rajasthan Ajmer (13.3) Odisha Puri (2.6) 64 UP Balrampur (32.8) Assam Lakhimpur (13.2) Rajasthan Bharatpur (2.6) 65 Rajasthan Ganganagar (32.7) Rajasthan Dhaulpur (13.2) UP Hathras (2.6) 66 MP Indore (32.6) UP Rampur (13.2) Assam Cachar (2.5) 67 MP Mandla (32.2) Rajasthan Sikar (13.1) Rajasthan Bundi (2.5) 68 Odisha Debagarh (32.1) Rajasthan Bikaner (13.1) Rajasthan Jaipur (2.5) 69 UP Kanpur Dehat (32) Odisha Bhadrak (13) UP Deoria (2.5) 70 MP Umaria (31.9) Rajasthan Jodhpur (13) UP Faizabad (2.5) 71 Odisha Baudh (31.8) Chhattisgarh Korba (12.9) UP Azamgarh (2.5) 72 Chhattisgarh Kanker (31.4) Odisha Kandhamal (12.9) Chhattisgarh Durg (2.4) 73 Rajasthan Jaipur (31.3) UP Deoria (12.9) MP Dindori (2.4) 74 Jharkhand Kodarma (31) UP Faizabad (12.8) Rajasthan Sawai Madhopur (2.4) 75 Jharkhand Hazaribagh (31) UP Gorakhpur (12.8) UP Jyotiba Phule Nagar (2.4) 76 Assam Jorhat (30.9) UP Allahabad (12.8) UP Kanpur Nagar (2.4) 77 Rajasthan Ajmer (30.9) UP Varanasi (12.6) UP Pratapgarh (2.4) 78 Assam Cachar (30.7) MP Bhopal (12.5) UP Kaushambi (2.4) 79 Odisha Mayurbhanj (30.7) UP Azamgarh (12.5) UP Sonbhadra (2.4) 80 UP Unnao (30.7) UP Sonbhadra (12.5) Bihar Rohtas (2.3) 81 UP Hamirpur (30.5) Rajasthan Barmer (12.4) Jharkhand Palamu (2.3) 82 Rajasthan Bhilwara (30.3) Rajasthan Bundi (12.4) Jharkhand Kodarma (2.3) 83 Rajasthan Jhalawar (30.3) Assam Nagaon (12.3) Odisha Jajapur (2.3) 84 UP Azamgarh (30.3) Bihar Vaishali (12.3) Rajasthan Jhalawar (2.3) 85 UP Lalitpur (30.2) Bihar Saran (12.3) UP Ambedkar Nagar (2.3) 86 UP Kushinagar (30) UP Hathras (12.3) Assam Nagaon (2.2) 87 UP Kanpur Nagar (29.7) Odisha Kendujhar (12.2) Odisha Baudh (2.2) 88 UP Etawah (29.3) Rajasthan Tonk (12.2) Odisha Kendujhar (2.2) 89 Rajasthan Bikaner (29) UP Mau (12.2) Rajasthan Churu (2.2) 90 Bihar Jehanabad (28.9) UP Kushinagar (12.2) UP Allahabad (2.2) 91 Rajasthan Sikar (28.9) MP Raisen (12) UP Sant Ravidas Nagar (2.2) 92 Odisha Sambalpur (28.8) Assam Dhubri (11.9) UP Ballia (2.2) 93 UP Sonbhadra (28.7) UP Ballia (11.9) UP Gorakhpur (2.2) 94 Bihar Purba Champaram (28.4) UP Chandauli (11.9) Chhattisgarh Koriya (2.1) 95 MP Gwalior (28.4) UP Sant Ravidas Nagar (11.9) Jharkhand Paschimi Singhbum (2.1) 96 Odisha Dhenkanal (28.3) Odisha Gajapati (11.8) Jharkhand Deoghar (2.1) 97 Rajasthan Dungarpur (28.3) UP Mirzapur (11.8) Odisha Debagarh (2.1) 98 Rajasthan Bharatpur (28.3) Odisha Dhenkanal (11.7) Odisha Nuapada (2.1) 99 MP Katni (28.2) UP Jaunpur (11.7) Odisha Bhadrak (2.1) 100 Odisha Bhadrak (28.2) Assam Jorhat (11.6) Rajasthan Jodhpur (2.1)

Nutritional Status Of Adult Population
��
Table 4.5: List of 100 districts with highest prevalence of underweight, overweight and obesity among elderly population (aged 60 years and above)
No.
BMI <18.5 (Underweight) State District State District State District
1 Bihar Pashchim Champaran (67.6) UP Ghaziabad (29.9) Rajasthan Kota (8.9) 2 Bihar Purnia (61.4) Uttarakhand Dehradun (29.6) Jharkhand Dhanbad (8.1) 3 Bihar Madhepura (58) Jharkhand Bokaro (26.9) UP Moradabad (7.7) 4 Odisha Kalahandi (57.9) Uttarakhand Nainital (26.7) Uttarakhand Nainital (7.5) 5 Odisha Malkanagiri (55.9) Uttarakhand US Nagar (25.5) UP Agra (7.2) 6 MP Sagar (55.4) UP Saharanpur (23.8) Uttarakhand Dehradun (7.1) 7 UP Jaunpur (54.8) Rajasthan Kota (23.4) Rajasthan Udaipur (6.9) 8 Odisha Nabarangapur (53.9) Uttarakhand Haridwar (22.9) UP Meerut (6.9) 9 Bihar Darbhanga (53.3) Uttarakhand Pithoragarh (22.8) Uttarakhand Champawat (6.7) 10 Bihar Saran (52.6) MP Indore (22.5) MP Harda (6.1) 11 Odisha Balangir (52.6) UP Agra (21.7) UP Mathura (6.1) 12 Odisha Koraput (51.6) UP Meerut (21.3) Uttarakhand Udham Singh Nagar (6.1) 13 Odisha Baudh (50.3) Rajasthan Udaipur (20.8) MP Indore (5.9) 14 Bihar Muzaffarpur (49.7) UP Mathura (20.4) UP Ghaziabad (5.7) 15 Assam Hailakandi (49.3) MP Harda (20.2) UP Baghpat (5.6) 16 Jharkhand Chatara (49.2) Assam Kokrajhar (19.3) Jharkhand Bokaro (5.4) 17 Bihar Katihar (48.7) MP Bhopal (19.3) Rajasthan Chittaurgarh (5.4) 18 Bihar Sitamarhi (48.6) UP Baghpat (19.3) UP Aligarh (5.4) 19 UP Kheri (48.6) Jharkhand Dhanbad (19.2) UP Lucknow (5.2) 20 Rajasthan Banswara (48.5) Rajasthan Chittaurgarh (18.9) Uttarakhand Haridwar (5.1) 21 UP Gonda (48.4) Uttarakhand Champawat (18.7) Rajasthan Jalore (5) 22 UP Chandauli (48.2) Rajasthan Jalore (18.4) Rajasthan Bhilwara (5) 23 Bihar Purba Champaram (48) Assam Dibrugarh (18.1) UP Saharanpur (5) 24 MP Dewas (47.8) Jharkhand Purbi Singhbum (18.1) Rajasthan Hanumangarh (4.7) 25 Bihar Kishanganj (46.6) Uttarakhand Pauri Garhwal (18.1) UP Bulandshahr (4.7) 26 Assam Karimganj (46.5) Uttarakhand Tehri Garhwal (17.8) Bihar Rohtas (4.6) 27 Odisha Sonapur (46.5) UP Lucknow (17.6) Rajasthan Rajsamand (4.6) 28 UP Pratapgarh (46.5) UP Moradabad (17.5) MP Vidisha (4.3) 29 Odisha Nuapada (46.4) Odisha Jharsuguda (17.2) Odisha Sambalpur (4.3) 30 UP Allahabad (46.3) Odisha Jagatsinghapur (17) MP Narsinghapur (4.1) 31 UP Faizabad (46.3) MP Hoshangabad (16.8) Odisha Jharsuguda (4) 32 UP Basti (46.2) Rajasthan Hanumangarh (16.7) Rajasthan Bharatpur (4) 33 Assam Jorhat (45.2) Odisha Sundargarh (16.6) Uttarakhand Tehri Garhwal (4) 34 Rajasthan Dhaulpur (44.9) UP G Buddha Nagar (16.5) Assam Dibrugarh (3.9) 35 UP Balrampur (44.8) Uttarakhand Bageshwar (16.3) Rajasthan Tonk (3.9) 36 UP Shrawasti (44.8) Rajasthan Rajsamand (16) UP Bareilly (3.9) 37 Chhattisgarh Dantewada (44.7) UP Bijnor (15.9) UP G Buddha Nagar (3.8) 38 UP Mainpuri (44.1) UP Muzaffarnagar (15.8) Assam Kokrajhar (3.7) 39 Rajasthan Ajmer (44) Rajasthan Tonk (15.6) Jharkhand Palamu (3.7) 40 Assam Tinsukia (43.8) Rajasthan Bhilwara (15.6) Odisha Khordha (3.7) 41 Bihar Gopalganj (43.7) Odisha Ganjam (15.5) Rajasthan Jhalawar (3.7) 42 Rajasthan Karauli (43.7) Rajasthan Jaipur (15.5) Rajasthan Jhunjhunun (3.6) 43 MP Tikamgarh (43.5) Rajasthan Banswara (15.5) Rajasthan Jaipur (3.5) 44 Odisha Mayurbhanj (43.5) UP Bareilly (15.5) Rajasthan Bundi (3.4) 45 Jharkhand Sahibganj (43.1) Rajasthan Jodhpur (15.4) Chhattisgarh Mahasamund (3.3) 46 MP Balaghat (42.9) Rajasthan Pali (15.4) Rajasthan Sirohi (3.3) 47 Odisha Debagarh (42.6) UP Bulandshahr (15.4) Rajasthan Banswara (3.3) 48 UP Kaushambi (42.6) Rajasthan Sirohi (15.2) UP Kannauj (3.3) 49 MP Jhabua (42.4) Assam Dhemaji (15.1) Odisha Nayagarh (3.1)

Annual Health Survey Report
54
No.
BMI <18.5 (Underweight) State District State District State District
50 UP Siddharthanagar (42.4) Odisha Khordha (15.1) Odisha Jagatsinghapur (3.1) 51 UP Mahoba (42.3) Rajasthan Bharatpur (15.1) Rajasthan Bikaner (3.1) 52 UP Rae Bareli (42.2) Rajasthan Ganganagar (15) Rajasthan Pali (3) 53 UP Ballia (42.1) Odisha Baleshwar (14.7) UP Rampur (3) 54 MP Mandla (41.9) UP Rampur (14.6) Uttarakhand Pauri Garhwal (3) 55 Bihar Sheohar (41.8) Rajasthan Bikaner (14.5) Bihar Aurangabad (2.9) 56 UP Ghazipur (41.8) Rajasthan Sawai Madhopur (14.5) Odisha Sundargarh (2.9) 57 UP Mau (41.7) UP Aligarh (14.5) Rajasthan Churu (2.9) 58 Bihar Vaishali (41.6) Jharkhand Ranchi (14.4) UP Kanpur Nagar (2.9) 59 UP Varanasi (41.6) Chhattisgarh Durg (14.3) UP Jyotiba Phule Nagar (2.9) 60 Odisha Kendujhar (41.5) Rajasthan Sikar (14.3) Jharkhand Deoghar (2.8) 61 UP Hardoi (41.5) Chhattisgarh Mahasamund (14.2) MP Bhopal (2.8) 62 MP Dhar (41.3) Rajasthan Churu (14.1) Odisha Ganjam (2.8) 63 Odisha Sambalpur (41) Odisha Sambalpur (13.7) UP Azamgarh (2.8) 64 Bihar Saharsa (40.9) MP Vidisha (13.5) Bihar Khagaria (2.7) 65 UP Sitapur (40.7) Rajasthan Jhunjhunun (13.5) Chhattisgarh Durg (2.7) 66 UP Firozabad (40.5) MP Ratlam (13.3) Rajasthan Barmer (2.7) 67 UP Mirzapur (40.4) Bihar Bhojpur (13.2) Odisha Baleshwar (2.6) 68 UP Rampur (40.4) MP Ujjain (13.2) Rajasthan Ajmer (2.6) 69 Odisha Kandhamal (40.1) Odisha Gajapati (13.2) Chhattisgarh Rajnandgaon (2.5) 70 Jharkhand Kodarma (40) UP Kanpur Nagar (13.2) Jharkhand Godda (2.5) 71 Chhattisgarh Kanker (39.9) Rajasthan Jhalawar (13.1) MP Betul (2.5) 72 Jharkhand Deoghar (39.9) MP Mandsaur (13) MP Balaghat (2.5) 73 MP Shivpuri (39.9) Rajasthan Ajmer (12.9) UP Balrampur (2.5) 74 UP Deoria (39.9) Odisha Cuttack (12.8) Odisha Kendujhar (2.4) 75 UP Maharajganj (39.5) UP Gorakhpur (12.8) Rajasthan Ganganagar (2.4) 76 Odisha Bargarh (39.3) Odisha Puri (12.7) UP Allahabad (2.4) 77 Jharkhand Dumka (38.9) UP Faizabad (12.6) UP Pratapgarh (2.4) 78 UP Sant Kabir Nagar (38.9) UP Varanasi (12.6) Chhattisgarh Raipur (2.3) 79 UP SR Nagar (38.8) Rajasthan Bundi (12.5) MP Ujjain (2.3) 80 Rajasthan Pali (38.7) Bihar Rohtas (12.4) Odisha Puri (2.3) 81 Jharkhand Lohardaga (38.6) Odisha Bargarh (12.4) UP Gorakhpur (2.3) 82 Jharkhand Hazaribagh (38.6) Odisha Nayagarh (12.4) UP Ambedkar Nagar (2.3) 83 Bihar Supaul (38.5) MP Barwani (12.3) UP Deoria (2.3) 84 Assam Nagaon (38.4) UP Kannauj (12.3) UP Kushinagar (2.3) 85 MP Katni (38.4) UP Deoria (12.3) Chhattisgarh Koriya (2.2) 86 UP Barabanki (38.4) UP Mau (12.2) Jharkhand Kodarma (2.2) 87 UP Bareilly (38.2) Odisha Bhadrak (12.1) Odisha Bargarh (2.2) 88 Odisha Anugul (38.1) UP Hathras (12.1) Rajasthan Jodhpur (2.2) 89 UP Azamgarh (38.1) UP Allahabad (12.1) UP Maharajganj (2.2) 90 Chhattisgarh Jashpur (38) UP Ballia (11.9) UP Hathras (2.2) 91 Chhattisgarh Surguja (37.9) UP Kushinagar (11.8) Jharkhand Garhwa (2.1) 92 Jharkhand Giridih (37.9) UP Sant Ravidas Nagar (11.8) MP Seoni (2.1) 93 Odisha Gajapati (37.8) Chhattisgarh Korba (11.7) MP Dindori (2.1) 94 Odisha Rayagada (37.7) UP Mirzapur (11.7) Odisha Cuttack (2.1) 95 Odisha Dhenkanal (37.7) Chhattisgarh Rajnandgaon (11.6) UP Etah (2.1) 96 UP Sultanpur (37.4) MP Narsinghapur (11.6) UP Varanasi (2.1) 97 MP Narsinghapur (37.1) MP Betul (11.6) UP Sant Ravidas Nagar (2.1) 98 MP Chhatarpur (36.7) UP Jaunpur (11.5) UP Ghazipur (2.1) 99 MP Satna (36.7) UP Azamgarh (11.4) Uttarakhand Bageshwar (2.1) 100 UP Etah (36.6) UP Pratapgarh (11.4) Jharkhand Paschimi Singhbum (2)

Nutritional Status Of Adult Population
��
4.9 Figure 4.1 illustrates the distribution of the 100 districts with high percentages of population with BMI less than 18.5, greater than or equal to 25 and greater than or equal to 30 in the 18-59 age group for2014. Uttar Pradesh accounted for themaximum districts in the list of worst 100 districts, followed by Rajasthan, for all categories, i.e., BMI less than
18.5 (42 districts), greater than equal to 25.0 (31districts) and 30.0 (32 districts)in the 18-59 yearsage group. Among 100 distrticts with BMI greater than or equal to 25, Bihar and Chhattisgarh had 2 and 1 districts respectively, while among 100 districts with high obesity prevalence, Bihar had only 1 district, while Assam and Chhattisgarh had 3 each.
Figure 4.1: State-wise distribution of 100 districts with highest percentage of population with BMI less than 18.5, greater than equal to 25 and 30 among age groups 18-59 years, (2014)
Figure 4.2: State-wise distribution of 100 districts with highest percentage of population with BMI less than 18.5, greater than equal to 25 and 30 among age groups 60 years and above, (2014)

Annual Health Survey Report
56
4.10 Figure 4.2 illustrates the distribution of the 100 districts which have high percentages of underweight, overweight and obesity prevalencein the 60 years and above age group. Uttar Pradesh accounts for maximum districts in the list for all the categories, i.e., BMI less than 18.5 (33 districts), greater than or equal to 25 (31 districts) and 30 in the 60 years and above age group.Among the 100 distrticts with BMI greater than or equal to 25, Bihar had 2 districts, while among the 100 districts with BMI greater than or equal to 30, Assam had 2 districts. 4.11 The table4.6 shows the 10 districts inrural areas displaying the highest percentages of
population with BMI less than 18.5, greater than or equal to 25 and 30in the age group of 18-59 years. While Gorakhpur (50.4) district of Uttar Pradesh recorded the highest percentage of population with BMI less than 18.5, Udham Singh Nagar (24.2) of Uttarakhand recorded the highest percentage of population with BMI greater than or equal to 25 and 30. Uttar Pradesh accounted forthe highest number of districts among the top 10 districts in rural areas with highest percentage of population havingBMI less than 18.5. On the other hand, Uttarakhand had the highest number of districts among top 10 districts in rural areas withhigh cases of overweight and obesity.
Table 4.6: List of 10 districts in rural areas with highest percentage of population with BMI less than
18.5, greater than equal to 25 and 30 among age groups 18-59 years, (2014) BMI <18.5 (Underweight) State District State District State District Uttar Pradesh Gorakhpur (50.4) Uttarakhand Udham Singh Nagar (24.2) Uttarakhand Udham Singh Nagar (6.3) Rajasthan Banswara (50) Uttarakhand Dehradun (24.1) Uttarakhand Dehradun (5.2) Odisha Malkanagiri (47.1) Uttar Pradesh Gautam Buddha Nagar (24) Uttar Pradesh Gautam Buddha Nagar (4.7) Uttar Pradesh Allahabad (46.7) Odisha Jagatsinghapur (21.2) Uttar Pradesh Bijnor (4.5) Odisha Nabarangapur (45.9) Uttarakhand Bageshwar (20.9) Uttarakhand Nainital (4.5) Madhya Pradesh Sagar (45.6) Uttarakhand Champawat (20.4) Uttarakhand Pauri Garhwal (4.4) Odisha Kalahandi (44.7) Uttarakhand Pauri Garhwal (20.2) Uttar Pradesh Meerut (4.3) Uttar Pradesh Kheri (44.4) Uttarakhand Nainital (20.1) Odisha Nayagarh (4.1) Assam Hailakandi (44.3) Odisha Nayagarh (19.6) Uttarakhand Tehri Garhwal (4) Uttar Pradesh Deoria (44.2) Uttar Pradesh Meerut (19.5) Odisha Jagatsinghapur (3.8) Table 4.7: List of 10 districts in rural areas with highest percentage of population with BMI less than
18.5, greater than equal to 25 and 30 among age group 60 years and above, (2014) BMI <18.5 (Underweight) State District State District State District Madhya Pradesh Sagar (68.4) Uttarakhand Nainital (23.8) Uttarakhand Champawat (7.9) Bihar Pashchim Champaran (66.4) Uttarakhand Udham Singh Nagar (23.5) Uttar Pradesh Moradabad (7.2) Bihar Purnia (63.9) Uttar Pradesh Saharanpur (20.6) Madhya Pradesh Harda (5.6) Odisha Kalahandi (61.4) Uttarakhand Dehradun (20.5) Uttarakhand Nainital (5.1) Rajasthan Jaipur (59.8) Uttarakhand Champawat (20.2) Uttar Pradesh Aligarh (4.9) Odisha Malkanagiri (58.1) Uttarakhand Pithoragarh (20) Rajasthan Bhilwara (4.8) Bihar Madhepura (57.6) Madhya Pradesh Harda (19.2) Uttar Pradesh Bulandshahr (4.8) Uttar Pradesh Jaunpur (56) Uttar Pradesh Ghaziabad (19) Uttar Pradesh Baghpat (4.8) Odisha Nabarangapur (55) Uttar Pradesh Baghpat (17.6) Uttarakhand Udham Singh Nagar (4.6) Odisha Balangir (54.6) Rajasthan Jalore (17.5) Rajasthan Jalore (4.3) Table 4.7presents a similar list for10 districts in rural areas displaying the highest percentages ofthe population in the age group 60 years and
above. Sagar (68.4) district of Madhya Pradesh recorded the highest percentage of population with BMI less than 18.5, Nainital (23.8) and

Nutritional Status Of Adult Population
��
Champawat (7.9) of Uttarakhand recorded the highest percentage of population with BMI greater than or equal to 25 and 30 respectively. Uttarakhand accounted for the highest number of districts among top 10 districts in rural areas with the highest percentage of population with BMI greater than or equal to 25 and 30. 4.3. Inter-District Disparities 4.12 Table 4.8 reports the coefficient of variation (CV) for districts with BMI less than 18.5 and greater than or equal to 25 for 2014.
The CV values for 2014 suggest that in the 18-59 agegroup, Odisha had the highest inter-district variations in case of BMI less than 18.5 and Madhya Pradesh in case of BMI greater than or equal to 25, whereas Rajasthan (0.25) and Uttarakhand (0.19) had the lowest inter-district variations. On the other hand, in the 60 years and above age group, Madhya Pradesh (0.47) had the highest inter-district variation in case of BMI less than 18.5 and Bihar (.64) in case of BMI greater than or equal to 25. Rajasthan showedthe lowest inter-district variations.
Table 4.8: Coefficient of variation of district level BMI less than 18.5, greater than equal to 25 in each State
State
BMI <18.5 (Underweight) (Overweight) 18-59 years 60 years and above 18-59 years 60 years and above
Assam 0.50 0.43 0.44 0.51 Bihar 0.38 0.40 0.48 0.64 Chhattisgarh 0.41 0.37 0.53 0.47 Jharkhand 0.24 0.26 0.52 0.58 Madhya Pradesh 0.44 0.47 0.56 0.53 Odisha 0.30 0.23 0.40 0.41 Rajasthan 0.25 0.21 0.24 0.24 Uttar Pradesh 0.32 0.24 0.54 0.52 Uttarakhand 0.41 0.38 0.19 0.34
Table 4.9: Coefficient of variation of district level male and female BMI less than 18.5 in each State BMI <18.5
Male Female State 18-59 years 60 years and above 18-59 years 60 years and above Assam 0.45 0.37 0.55 0.47 Bihar 0.44 0.43 0.42 0.42 Chhattisgarh 0.49 0.40 0.38 0.37 Jharkhand 0.26 0.30 0.26 0.26 Madhya Pradesh 0.49 0.43 0.50 0.51 Odisha 0.32 0.26 0.30 0.22 Rajasthan 0.28 0.25 0.23 0.25 Uttar Pradesh 0.35 0.22 0.34 0.28 Uttarakhand 0.61 0.41 0.32 0.36 4.13 Table 4.9 reports the coefficient of variation (CV) for districts having BMI less than 18.5 for males and females for 2014. The CV values for 2014 suggest that in the 18-59 age group for males, Uttarakhand had the highest inter-district variations in BMI, while
for females, Assam had the highest figures. Jharkhand (0.26) and Rajasthan (0.23) on the other hand reported the lowest inter-district variations. In the 60 years and above group, Madhya Pradesh had the highest inter-district variations in case of both males and females.

Annual Health Survey Report
58
Table 4.10: State-wise inter-district range in BMI distribution District with the highest and lowest percentage of population with BMI less than 18.5, greater than equal to 25 and
30 among age groups 18-59 years; and 60 years and above, (2014) State 18-59 years 60 years and above
Highest Lowest Range Highest Lowest Range BMI <18.5 (Underweight) Assam Hailakandi (41) North Cachar Hills
(2.9) 38.1 Hailakandi (49.3) Goalpara (6.2) 43.1
Bihar Pashchim Champaran (42.1)
Katihar (9.3) 32.8 Pashchim Champaran (67.6)
Buxar, rohtas (16.1) 51.5
Chhattisgarh Kanker (31.4) Kawardha (5.4) 26.0 Dantewada (44.7) Kawardha (11.6) 33.1 Jharkhand Chatara (39.1) Godda (16.7) 22.4 Chatara (49.2) Purbi Singhbum (19.3) 29.9 Madhya Pradesh
Shivpuri (41.6) Chhindwara (2.1) 39.5 Sagar (55.4) Chhindwara (2.1) 53.3
Odisha Malkanagiri (45.3) Jagatsinghapur (12.6)
32.7 Kalahandi (57.9) Jagatsinghapur (22.9) 35.0
Rajasthan Banswara (48) Churu (14.4) 33.6 Banswara (48.5) Udaipur (20.3) 28.2 Uttar Pradesh Kheri (46.8) Ghaziabad (7.5) 39.3 Jaunpur (54.8) Ghaziabad (11.6) 43.2 Uttarakhand Pauri Garhwal (27.2) Pithoragarh (6) 21.2 Haridwar (32.8) Nainital (8.6) 24.2
(Overweight) Assam Dibrugarh (19.5) Marigaon (2.6) 16.9 Kokrajhar (19.3) Barpeta (1.9) 17.4 Bihar Saran, Vaishali (12.3) Jamui (2.1) 10.2 Bhojpur (13.2) Muzaffarpur, Kishanganj,
Supaul, Purnia, Pashchim Champaran (0)
13.2
Chhattisgarh Korba (12.9) Surguja (1.4) 11.5 Durg (14.3) Jashpur (3.2) 11.1 Jharkhand Purbi Singhbum (24.8) Gumla (4) 20.8 Bokaro (26.9) Gumla (4) 22.9 Madhya Pradesh
Harda (15.8) Jhabua (0.9) 14.9 Indore (22.5) Chhatarpur (2.7) 19.8
Odisha Khordha (24.5) Malkanagiri, Nabarangapur (4.5)
20.0 Jharsuguda (17.2) Nabarangapur (4) 13.2
Rajasthan Kota (21.3) Dungarpur (6.6) 14.7 Kota (23.4) Karauli (8.3) 15.1 Uttar Pradesh Gautam Buddha Nagar
(26.6) Chitrakoot (1.6) 25.0 Ghaziabad (29.9) Hamirpur (2) 27.9
Uttarakhand Dehradun (28.1) Uttarkashi (15.5) 12.6 Dehradun (29.6) Almora (8.6) 21.0
(Obese) Assam Dibrugarh (3.5) Sonitpur (0.2) 3.3 Dibrugarh (3.9) North Cachar Hills (0) 3.9 Bihar Rohtas (2.3) Pashchim
Champaran, Siwan, Saharsa, Purnia (0)
2.3 Rohtas (4.6) Purnia (0) 4.6
Chhattisgarh Korba (2.7) Bastar (0.2) 2.5 Mahasamund (3.3) Dantewada (0) 3.3 Jharkhand Bokaro (5.2) Dumka (0.6) 4.6 Dhanbad (8.1) Dumka (1) 7.1 Madhya Pradesh
Vidisha (3.6) Ratlam, Dhar, West Nimar (0.2)
3.4 Harda (6.1) Neemuch, Rewa (0) 6.1
Odisha Nayagarh, Jharsuguda, Jagatsinghapur (4.4)
Nabarangapur (0.6) 3.8 Sambalpur (4.3) Nuapada (0.5) 3.8
Rajasthan Kota (5.6) Baran (1.3) 4.3 Kota (8.9) Jaisalmer, Baran (1.4) 7.5 Uttar Pradesh Meerut (5.8) Hardoi (0.2) 5.6 Moradabad (7.7) Sitapur (0) 7.7 Uttarakhand Udham Singh Nagar,
Nainital (6.6) Bageshwar (2) 4.6 Nainital (7.5) Uttarkashi (0.9) 6.6
4.14 Table 4.10 lists the names of the districts with the highest and lowest percentage of population having BMI less than 18.5, greater than or equal to 25 and 30 in the age groups of 18-59 years and 60 years and above during 2014. In the 18-59 age group, Banswara (48) of Rajasthan has the highest percentage of population having BMI less than 18.5 while
North Cachar Hills (2.9) of Assam shows the lowest percentage of population having BMI less than 18.5. In the 60 years and above age group, Pashchim Champaran (67.6) of Bihar and Chhindwara of Madhya Pradesh (2.1) have the highest and lowest percentages of population respectively with BMI less than 18.5. In the 18-59 age group on the other hand,

Nutritional Status Of Adult Population
��
Dehradun (28.1) of Uttarakhand and Jhabua (0.9) of Madhya Pradesh have the highest and lowest percentages of population with BMI greater than or equal to 25. In the 60 years and above age group, Ghaziabad (29.9) of Uttar Pradesh and Muzaffarpur, Kishanganj, Supaul, Purnia, Pashchim Champaran (0) of Bihar have the highest and lowest percentages of population with BMI greater than equal to 25. 4.15 In the 18-59 age group, Udham Singh Nagar and Nainital (6.6) of Uttarakhand have the highest percentage of population while Rohtas (2.3) of Bihar has the lowest percentage with BMI greater than or equal to 30. Dhanbad (8.1) of Jharkhand has the highest percentage of
population with BMI greater than equal to 30 in the 60 and above age group. 4.4. Gender Differentials 4.16 The table 4.11 denotes the number of districts in each State with BMI less than 18.5 that have female-male and male-female ratio differentials higher than 1.2 in the age groups of 18-59 years and 60 years and above. While 20 districts in Odisha recorded the highest female-male differential in the 18-59 group, Madhya Pradesh reported the highest (19) for the 60 years and above age group. While 5 districts of Uttarakhand recorded the lowest female-male differential in the 18-59 age group,1 district of Uttar Pradesh reported the lowest female-male differential in the 60 years and abovegroup.
Table 4.11: Number of districts with high gender differential in BMI less than 18.5 among age groups
18-59 years; and 60 years and above, (2014) State BMI <18.5 High female-male ratio differential 18-59 years 60 years and above Assam 13 12 Bihar 11 4 Chhattisgarh 14 8 Jharkhand 15 11 Madhya Pradesh 17 19 Odisha 20 15 Rajasthan 7 4 Uttar Pradesh 6 1 Uttarakhand 5 3 High male-female ratio differential 18-59 years 60 years and above Assam 3 2 Bihar 15 19 Chhattisgarh 0 1 Jharkhand 0 0 Madhya Pradesh 19 9 Odisha 0 1 Rajasthan 0 10 Uttar Pradesh 25 26 Uttarakhand 1 1

Annual Health Survey Report
60
4.17 Table 4.11 also denotes the number of districts in each Statewith BMI less than 18.5 that have male-female ratio differentials higher than 1.2 percent among 18-59 and 60 and above age groups. From Uttar Pradesh, 25 and 26 districts respectively recorded the highest male-
female differential in both age groups, while Jharkhand and Chhattisgarh recorded the lowest male-female differential in the 18-59 group with 0 districts, Jharkhand reported the lowest male-female differential in the 60 years and abovegroup, again with 0 districts.
Table 4.12: List of 10 Districts with highestgender differential in BMI less than 18.5 among age groups
18-59 years; and 60 years and above
BMI <18.5 (Underweight) Highest female-male ratio differential Rank State District State District 1 Uttarakhand Pithoragarh (4.4) Uttarakhand Bageshwar (3.09) 2 Chhattisgarh Dantewada (3.33) Jharkhand Dhanbad (2.32) 3 Uttarakhand Almora (2.6) Assam North Cachar Hills (2.04) 4 Jharkhand Sahibganj (2.37) Jharkhand Godda (1.95) 5 Bihar Muzaffarpur (2.21) Jharkhand Sahibganj (1.92) 6 Madhya Pradesh Dindori (2.04) Assam Kamrup (1.86) 7 Madhya Pradesh Panna (2.01) Madhya Pradesh Umaria (1.84) 8 Madhya Pradesh Tikamgarh (2.01) Rajasthan Jodhpur (1.71) 9 Chhattisgarh Surguja (1.94) Chhattisgarh Jashpur (1.66) 10 Madhya Pradesh Sagar (1.91) Assam Sibsagar (1.62)
BMI <18.5 (Underweight) Highest male-female ratio differential Rank State District State District 1 Bihar Saran (2.47) Uttar Pradesh Muzaffarnagar (2.15) 2 Madhya Pradesh Gwalior (2.29) Assam Sonitpur (2.12) 3 Uttar Pradesh Chitrakoot (2.04) Uttar Pradesh Fatehpur (2.03) 4 Madhya Pradesh Sehore (2.01) Assam Barpeta (2.01) 5 Bihar Kishanganj (1.99) Bihar Aurangabad (1.91) 6 Uttar Pradesh Lucknow (1.99) Madhya Pradesh Bhopal (1.86) 7 Madhya Pradesh Indore (1.97) Uttar Pradesh Farrukhabad (1.81) 8 Madhya Pradesh Bhind (1.96) Uttar Pradesh Kanpur Dehat (1.75) 9 Bihar Aurangabad (1.95) Rajasthan Pali (1.72) 10 Assam Kokrajhar (1.93) Uttar Pradesh Auraiya (1.69) 4.18 The table 4.12 shows the 10 districts having female-male and male-female differentials higher than 1.2 percent among 18-59 and 60 years and above age groups. While Pithoragarh (4.4) district of Uttarakhand recorded the highest female-male differential in the 18-59 group, Bageshwar (3.09) district of Uttarakhand reported the corresponding highest figure in the 60 years and above group. Madhya
Pradesh has the highest number of districts with highest female-male differential in the 18-59 age groups. On the other hand, while Saran (2.47) district of Bihar recorded the highest male-female differential in the 18-59 group, Muzaffarnagar (2.15) district of Uttar Pradesh reported the highest male-female differential in the 60 years and above group, there are 5 districts of Uttar Pradesh in the list.

Nutritional Status Of Adult Population
�1
4.5. Association with Developmental Indicators 4.19 Figure 4.3 shows that overweight adults are present mostly in the urban population, with the prevalence of adults havingBMI greater than 25 in rural population beingsubstantially lower than that in the total population. The figure also suggests that in most of the districts prevalence
of overweight among females aged 18-59is higher than males in the same age group. In case of overweight among the elderly too, the total population reportsmore instances than the rural population, indicating that this is predominantly an urbanconcern. However, in the case of the elderly population, in most of the districts the prevalence of overweight among males is higher than females.
Figure 4.3: Comparison of the prevalence of overweight adults across region and sex
4.20 Figure 4.4 shows the differences in underweight prevalence (BMI <18.5) in the adult population. In comparison to high BMI, low BMI is more prevalent in the rural population. Across sex, prevalence of underweight among females is higher than men
in most of the districts across both age groups, the prevalence of low BMI being higher in the rural population. However, in case of underweight prevalence theclear evidence of prevalence of gender differential atdistrict-level isabsent among the elderly population.

Annual Health Survey Report
62
Figure 4.4: Comparison of the prevalence of underweight adults across region and sex
4.21 Figure 4.5 illustrates the relationship between overall literacy rates and BMI levels across districts. Districts with higher prevalence of overweight also have higher levels of literacy. The opposite remains true for underweight prevalance, as districts where percentage of individuals who have less than 18.5 BMI also have lower levels of literacy. However, the figure also shows that there is no clear association between child undernourishment and adult underweight prevalence across districts. 4.22 Figure 4.6 shows a positive association between the prevalence of underweight among females and proportion of low birth weight
outcomes in a district, implying that in many districts when females (aged 18-59) have BMI less than 18.5, there are more instances of children being born with low weight. Similarly the health of females aged 18-59 correlates with the levels of neo-natal mortality in a district. Districts with a very high prevalence of neo-natal mortality also tend to have higher levels of undernourished females, depicting therefore a close association between nutritional status and maternal and child health. 4.23 Further, a weak association exists between low BMI and mean age at marriage in females. Many districts with a high percentage of females aged 18-59 having BMI lesser than

Nutritional Status Of Adult Population
��
18.5 also have a lower mean age at marriage. However the relation is not very conclusive as districts with different levels of underweight prevalence, show the same mean age at
marriage for females. Also, there is no significant pattern in instances of abortion in a district and the levels of underweight prevalence among females.
Figure 4.5: Association of adult nutritional status with overall literacy rates and child nutritional status
4.24 Figure 4.6 also shows that the district level total fertility rate is directly related with district level low female BMI. Districts with high total fertility rates also have higher percentages of femaleswithBMI lesser than 18.5. In case of chronic illnesses in females, only few districts report a positive association between low female BMI and high instances of chronic
illness. So in most districts chronic illnesses in arecaused by many factors other than a
low BMI. A lower mean age of marriageand higher fertility rates for females suggests a lower mean age of first pregnancy and delivery, and the females who are subject to this cycle tend to have low BMI, which could further deteriorate their health.

Annual Health Survey Report
64
Figure 4.6: Association of low BMI in females with health and developmental indicators

Nutritional Status Of Adult Population
��
4.6. Key Findings The percentage of population with BMI less than 18.5 is higher than percentage of
population with BMI greater than or equal to 25 and 30 among age groups 18-59 years implying that higher proportion of population are underweight than overweight and obese. Similar trend could be observed in the rural areas. Percentage of underweights among 18-59 age-groups is highest in Uttar Pradesh (30 per cent), while percentage of overweight and obese in the 18-59 age group is highest in Uttarakhand, and stands at 21.6 per cent and 4.7 per cent respectively.
In every AHS State prevalence of overweight among female is higher than male. Notably, Odisha (40.6 per cent) has a very high percentage of underweight females in the 60 years and above group. The concern is also the fact that the lowest percentage of underweight elderly females reported from Uttarakhand stands at a high figure of 24.4 per cent. Interestingly, the proportion of elderly females that are overweight (23.3 per cent) and obese (5.9 per cent) are very high in Uttarakhand.
Among the 100 districts with a high percentage of population having BMI less than 18.5, greater than or equal to 25 and 30 among age groups 18-59 years, Uttar Pradesh accounted for the maximum districts. Also, Uttar Pradesh accounted for the maximum districts in the age groups of 60 and above for 2014. Uttarakhand was the only State that did not report any case of BMI less than 18.5 in 2014 across both age groups. Among rural areas, while Gorakhpur district of Uttar Pradesh recorded the highest number of underweight (50.4), Udham Singh Nagar of Uttarakhand recorded the highest percentage of overweight and obese population.
Coefficient of variation of BMI less than 18.5 for males aged 60 years and above is higher than females indicating that the proportion of underweight males could be higher in certain districts. In case of male-female disparity for low BMI at the district level Uttarakhand had the highest level for males but the disparity was much lower for females. Jharkhand and Rajasthan had low levels of disparity in this aspect. Odisha is particularly noted for the high number of districts which have high female-male ratio disparity, with a higher number of districts than Uttar Pradesh even on an absolute measure. Assam, Chhattisgarh and Jharkhand also have a higher number of districts with a high female-male ratio differential than high male-female ratio differential.
A positive association is observed between district level prevalence of underweight among females and neonatal mortality rates. It suggests importance of improving nutritional status as it can be a significant determinant in securing further improvements in neonatal and child survival across high focus districts of AHS States.

66
PREVALENCE OF ANAEMIA
5.1. Definition of Indicators 5.1 Anaemia is a disorder in which the number of red blood cells or their oxygen-carrying capacity is insufficient to meet physiological needs, which vary according to age, sex, altitude, smoking and pregnancy status. Iron deficiency, measured by haemoglobin level, is one of the most important causes for anaemia. Iron deficiency often causes low blood cell levels (anaemia) and can delay the development of unborn babies. 5.2 Iodised salt is table salt mixed with a minute amount of various salts of the element iodine. The ingestion of iodine prevents iodine deficiency. Iodine deficiency is a major public health problem that can be cheaply addressed by purposely adding small amounts of iodine
(about 0.15 mg iodine per day) to the sodium chloride salt. 5.2. Levels and Trends 5.2.1 Anaemia and Severe Anaemia 5.3 Table 5.1 presents the anaemia status by haemoglobin levels in three age brackets (6-59 months, 5-9 years and 10-17 years) for the nine AHS States. In 6-59 months category, highest prevalence is reported from Uttarakhand at 94.4 per cent, and the least from Chhattisgarh at 63.8 per cent. A gradual increase in the prevalence can be observed in the 5-9 years age bracket. In the 5-9 years and 10-17 years age groups as well, maximum cases were from Uttarakhand followed by Uttar Pradesh and minimum from Chhattisgarh.
Table 5.1: Anaemia status by Haemoglobin Level (%), 2014 Anaemia status by Haemoglobin Level across different age groups in different States and rural areas, 2014
Anaemia 6-59 months 5-9 years 10-17 years Assam 78.9 89.2 86.8 Bihar 80.7 87.8 85.3 Chhattisgarh 63.8 78.5 75.1 Jharkhand 78.4 85.7 78.5 Madhya Pradesh 76.3 84.9 82.4 Odisha 70.8 81.2 74.5 Rajasthan 77.0 85.7 81.4 Uttar Pradesh 86.8 92.4 90.9 Uttarakhand 94.4 95.1 91.1 Rural Assam 79.6 89.7 87.1 Bihar 80.5 87.4 84.6 Chhattisgarh 66.6 80.2 76.3 Jharkhand 78.7 86.1 79.6 Madhya Pradesh 76.6 85.3 82.4 Odisha 70.6 81.1 74.7 Rajasthan 77.8 85.8 82.2 Uttar Pradesh 87.4 93.0 91.4 Uttarakhand 94.9 95.8 93.1
5
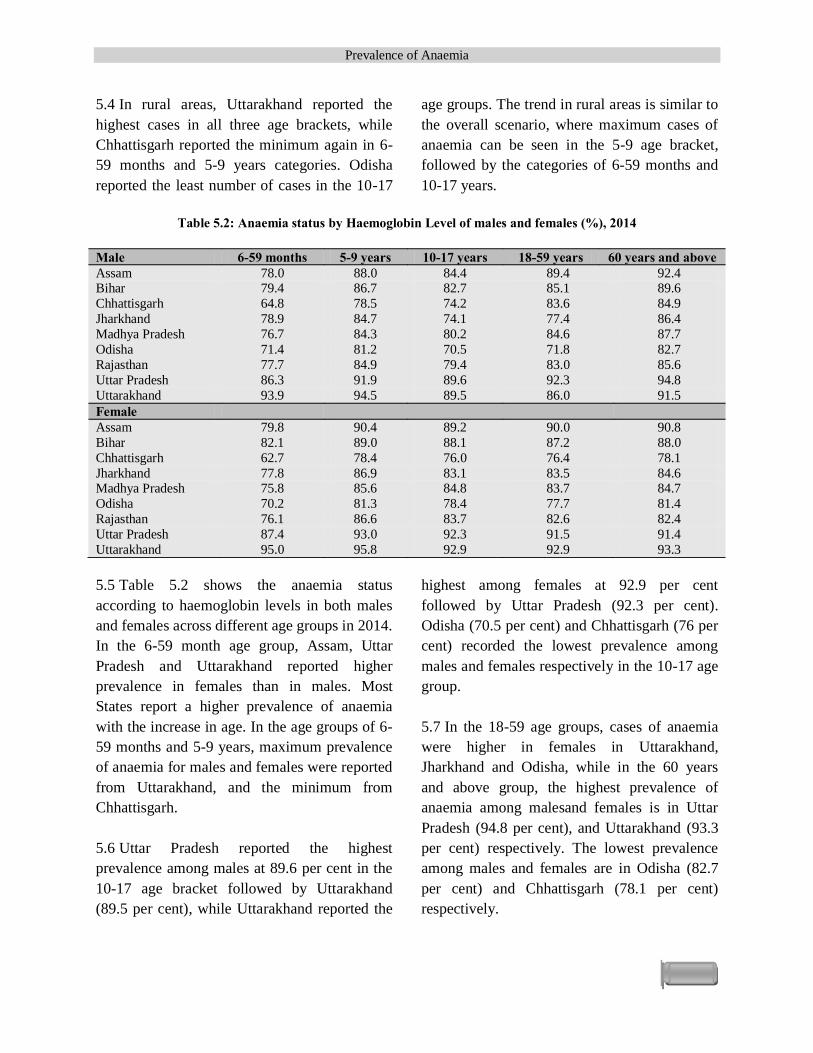
Prevalence of Anaemia
��
5.4 In rural areas, Uttarakhand reported the highest cases in all three age brackets, while Chhattisgarh reported the minimum again in 6-59 months and 5-9 years categories. Odisha reported the least number of cases in the 10-17
age groups. The trend in rural areas is similar to the overall scenario, where maximum cases of anaemia can be seen in the 5-9 age bracket, followed by the categories of 6-59 months and 10-17 years.
Table 5.2: Anaemia status by Haemoglobin Level of males and females (%), 2014
Male 6-59 months 5-9 years 10-17 years 18-59 years 60 years and above Assam 78.0 88.0 84.4 89.4 92.4 Bihar 79.4 86.7 82.7 85.1 89.6 Chhattisgarh 64.8 78.5 74.2 83.6 84.9 Jharkhand 78.9 84.7 74.1 77.4 86.4 Madhya Pradesh 76.7 84.3 80.2 84.6 87.7 Odisha 71.4 81.2 70.5 71.8 82.7 Rajasthan 77.7 84.9 79.4 83.0 85.6 Uttar Pradesh 86.3 91.9 89.6 92.3 94.8 Uttarakhand 93.9 94.5 89.5 86.0 91.5 Female Assam 79.8 90.4 89.2 90.0 90.8 Bihar 82.1 89.0 88.1 87.2 88.0 Chhattisgarh 62.7 78.4 76.0 76.4 78.1 Jharkhand 77.8 86.9 83.1 83.5 84.6 Madhya Pradesh 75.8 85.6 84.8 83.7 84.7 Odisha 70.2 81.3 78.4 77.7 81.4 Rajasthan 76.1 86.6 83.7 82.6 82.4 Uttar Pradesh 87.4 93.0 92.3 91.5 91.4 Uttarakhand 95.0 95.8 92.9 92.9 93.3 5.5 Table 5.2 shows the anaemia status according to haemoglobin levels in both males and females across different age groups in 2014. In the 6-59 month age group, Assam, Uttar Pradesh and Uttarakhand reported higher prevalence in females than in males. Most States report a higher prevalence of anaemia with the increase in age. In the age groups of 6-59 months and 5-9 years, maximum prevalence of anaemia for males and females were reported from Uttarakhand, and the minimum from Chhattisgarh. 5.6 Uttar Pradesh reported the highest prevalence among males at 89.6 per cent in the 10-17 age bracket followed by Uttarakhand (89.5 per cent), while Uttarakhand reported the
highest among females at 92.9 per cent followed by Uttar Pradesh (92.3 per cent). Odisha (70.5 per cent) and Chhattisgarh (76 per cent) recorded the lowest prevalence among males and females respectively in the 10-17 age group. 5.7 In the 18-59 age groups, cases of anaemia were higher in females in Uttarakhand, Jharkhand and Odisha, while in the 60 years and above group, the highest prevalence of anaemia among malesand females is in Uttar Pradesh (94.8 per cent), and Uttarakhand (93.3 per cent) respectively. The lowest prevalence among males and females are in Odisha (82.7 per cent) and Chhattisgarh (78.1 per cent) respectively.

Annual Health Survey Report
68
Map 5.1: Anaemia status by haemoglobin level of children aged 6-59 months

Prevalence of Anaemia
��
Map 5.2: Anaemia status by haemoglobin level of children aged 5 9 years

Annual Health Survey Report
70
Map 5.3: Anaemia status by haemoglobin level of children aged 10 17 years

Prevalence of Anaemia
�1
Map 5.4: Severe anaemia status by haemoglobin level of children aged 5 9 years

Annual Health Survey Report
72
Table5.3: Anaemia status by Haemoglobin Level of males and females in rural areas (%), 2014 Rural Male 6-59 months 5-9 years 10-17 years 18-59 years 60 years and above Assam 78.7 88.7 85.2 89.9 93.0 Bihar 79.1 86.1 82.1 84.3 89.2 Chhattisgarh 67.3 80.4 75.4 84.8 85.9 Jharkhand 78.7 84.9 76.0 79.1 88.9 Madhya Pradesh 77.2 84.3 80.6 84.6 86.9 Odisha 71.0 81.1 71.1 71.9 82.9 Rajasthan 77.8 84.6 80.3 83.8 86.0 Uttar Pradesh 87.0 92.5 90.2 92.9 95.2 Uttarakhand 94.5 95.5 91.6 88.2 92.1 Rural Female Assam 80.5 90.7 89.1 90.6 91.7 Bihar 82.0 88.9 87.4 86.5 87.6 Chhattisgarh 65.9 80.0 77.3 77.9 78.5 Jharkhand 78.6 87.3 83.3 83.8 85.9 Madhya Pradesh 76.0 86.3 84.4 83.4 84.2 Odisha 70.1 81.2 78.3 77.5 81.9 Rajasthan 77.8 87.2 84.4 83.4 82.7 Uttar Pradesh 87.9 93.5 92.5 92.3 91.9 Uttarakhand 95.4 96.2 94.8 94.0 95.1 5.8 Table 5.3 demonstrates anaemia status in rural areas in the AHS States in 2014 according to haemoglobin levels of males and females. In the age groups of 6-59 month, 5-9 years, 10-17 years and 18-59 years, highest prevalenceamong both males and females were reported from Uttarakhand, while in the 60 and above age group highest prevalence were from Uttar Pradesh for males (95.2 per cent) and Uttarakhand for females (95.1 per cent). Highest prevalence of anaemia can be seen in the 60 and above group, followed by the 5-9 years group, for both males and females. Prevalence of anaemia is higher in rural females than males. The lowest prevalence among males in rural areas is recorded from Odisha and Chhattisgarh, while among females lowest prevalence is reported from Chhattisgarh.
5.9 Table 5.4 presents the severe anaemia status for 2014 for rural areas across different age groups.The highest prevalence of severe anaemia was seen in the 5-9 years age group, followed by 10-17 years. Highest prevalence of severe anaemia is reported from Uttarakhand in both the 6-59 months (6.3 per cent) and 5-9 years groups (17.8 per cent), while Madhya Pradesh recorded the highest prevalence in the 10-17 years group (14.8 per cent). The lowest prevalence of severe anaemia was seen in Odisha. In rural areas, highest prevalence of severe anaemia was recorded from Uttarakhand in the 6-59 months (6.6 per cent) age group, and from Madhya Pradesh in 5-9 years (18.2 per cent) and 10-17 years (14.6 per cent) groups. Clearly, there are huge variations in prevalence of severe anaemia across the AHS States.

Prevalence of Anaemia
��
Table 5.4: Severe Anaemia status by Haemoglobin (%), 2014 Severe Anaemia status by Haemoglobin Level across different age groups in different States and rural areas, 2014
State 6-59 months 5-9 years 10-17 years Assam . 5.1 4.9 Bihar 1.5 14.5 13.3 Chhattisgarh 1 10.7 9.5 Jharkhand 0.6 7.4 6.1 Madhya Pradesh 0.9 17.6 14.8 Odisha 0.2 3.3 2.7 Rajasthan 6 16.1 12.7 Uttar Pradesh 2.1 12.3 10.8 Uttarakhand 6.3 17.8 12.5 Rural Assam . 5.3 5 Bihar 1.5 14.5 13.2 Chhattisgarh 1 11 10 Jharkhand 0.7 7.5 6.6 Madhya Pradesh 0.9 18.2 14.6 Odisha 0.2 3.4 2.7 Rajasthan 6.3 16.3 13.1 Uttar Pradesh 2.2 12.6 11.1 Uttarakhand 6.6 18 12.3
Table5.5: Severe Anaemia status by Haemoglobin Level of males and females (%), 2014 Male 6-59 months 5-9 years 10-17 years 18-59 years 60 years and above Assam . 5 4.3 4.2 5.8 Bihar 1.4 14 12.5 9.6 12.7 Chhattisgarh 1 10.5 9.7 8.8 9.9 Jharkhand 0.5 7.2 4.9 4.2 6.9 Madhya Pradesh 1 17.5 14.1 14.7 14.7 Odisha 0.3 3.2 2.4 1.7 2.9 Rajasthan 6.2 15.6 12 9.7 10.1 Uttar Pradesh 2 12.1 9.6 7.9 11.3 Uttarakhand 7.3 16.4 10.5 7.8 11 Female Assam . 5.2 5.5 6.5 7.5 Bihar 1.6 15.1 14.1 13.8 16.7 Chhattisgarh 0.9 10.9 9.3 10.6 9.4 Jharkhand . 7.6 7.4 8.2 8.8 Madhya Pradesh 0.9 17.8 15.5 16.2 16.7 Odisha 0.1 3.3 3.1 3.1 4.3 Rajasthan 5.9 16.6 13.5 13.6 12.7 Uttar Pradesh 2.2 12.5 12.2 11.6 12.9 Uttarakhand 5.3 19.3 14.8 15.1 15.7 5.10 Table 5.5 shows the severe anaemia status according to haemoglobin level of males and females in 2014. Among males, highest prevalence of severe anaemia in the 6-59 months age group was reported from Uttarakhand (7.3 per cent) and the highest in the
5-9 years (17.5 per cent), 10-17 years (14.1 per cent), 18-59 years (14.7 per cent) and 60 years and above (14.7 per cent) age brackets was reported from Madhya Pradesh. Among females, highest prevalence of severe anaemia can be seen in the 5-9 years and 60 years and

Annual Health Survey Report
74
above age brackets. Uttarakhand recorded the highest prevalence in the 6-59 months (5.3 per cent) and 5-9 years (19.3 per cent) age groups, Madhya Pradesh reported the highest in 10-17 years (15.5 per cent), 18-59 (16.2 per cent) and 60 years and above (16.7 per cent) groups. 5.11 Table 5.6 shows the severe anaemia status considering haemoglobin levels of males and females in rural areas in 2014. Among males, highest prevalence ofsevere anaemia is observed in Uttarakhand in the 6-59 months (7.3 per cent) group, while the highest in the 5-9
years (17.8 per cent), 10-17 years (14 per cent), 18-59 (15.1 per cent) and 60 years and above (15.2 per cent) groups were from Madhya Pradesh. Odisha saw the lowest prevalenceof severe anaemia in males across all age groups. Highestprevalenceof severe anaemia among rural females is in the 60 years and above group followed by the 5-9 years group. Rajasthan, Uttarakhand, Madhya Pradesh, Uttarakhand and Madhya Pradesh registered the highest prevalence of severe anaemia in the 6-59 months, 5-9 years, 10-17 years, 18-59 years and 60 years and above groups.
Table 5.6: Severe Anaemia status by Haemoglobin Level of males and females in rural areas (%), 2014
Rural Male 6-59 months 5-9 years 10-17 years 18-59 years 60 years and above Assam . 5.2 4.4 4.5 6.2 Bihar 1.4 13.9 12.5 9.6 13 Chhattisgarh 1 11 10.3 9.3 10.5 Jharkhand 0.7 7.3 5.7 4.7 7.5 Madhya Pradesh 0.8 17.8 14 15.1 15.2 Odisha 0.2 3.3 2.4 1.7 3 Rajasthan 6.5 15.8 12.4 10.1 10.7 Uttar Pradesh 2.1 12.5 9.9 8.2 11.8 Uttarakhand 7.3 17.2 10.8 8.1 10.8 Rural Female Assam . 5.3 5.7 6.8 8.1 Bihar 1.6 15.1 13.9 13.8 16.8 Chhattisgarh 1.1 11 9.8 11.1 9.1 Jharkhand . 7.7 7.4 8.4 9.6 Madhya Pradesh 1.1 18.7 15.3 17 16.9 Odisha 0.1 3.5 3.1 3.1 4.4 Rajasthan 6.1 16.8 13.9 14.2 13.1 Uttar Pradesh 2.3 12.7 12.4 12.1 13.9 Uttarakhand 5.8 18.8 14 15.6 16.4 5.2.2 Iodine Content in Household Salt (more than 15ppm) 5.12 Table 5.7 presents presents information regarding households with adequate iodine content in household salt (more than 15 ppm), State-wise and rural area-wise, for2014. The
percentage of households using household salt with more than 15 ppm of iodine is the highest in Jharkhand (92.3 per cent) followed by Uttarakhand (83 per cent) and lowest in Assam (46.8 per cent). At the district level Khagaria and Purnia (100 per cent) in Bihar; and Godda and Garhwa (100 per cent) in Jharkhand had the

Prevalence of Anaemia
��
highest use of household salt with more than 15 ppm of iodine, while Sibsagar (11.5 per cent) in Assam had the lowest percentage. The table also presents the State-wise ranges of
households using household salt with more than 15 ppm of iodine. The difference in use is the highest in case of Assam (88.4) and lowest in case of Jharkhand (25.9).
Table: 5.7 Iodine content in Household Salt (%), 2014
Levels and trends in percentage of Iodine content in Household Salt (more than 15 ppm) at State level (%), (2014) State Total Highest Lowest Range Assam 46.8 Sonitpur (99.9) Sibsagar (11.5) 88.4 Bihar 79.5 Khagaria, Purnia (100) Sitamarhi (32.5) 67.5 Chhattisgarh 75.9 Rajnandgaon (93.5) Surguja (64.5) 29.0 Jharkhand 92.3 Godda, Garhwa (100) Dumka (74.1) 25.9 Madhya Pradesh 72.6 Bhopal (98.7) Jhabua (45.6) 53.1 Odisha 72.4 Mayurbhanj (95.4) Jajapur (40.3) 55.1 Rajasthan 59.6 Chittaurgarh (89.2) Nagaur (32.1) 57.1 Uttar Pradesh 74.0 Kanpur Dehat, Rae Bareli (99) Shrawasti (30.6) 68.4 Uttarakhand 83.0 Bageshwar (99.6) Pithoragarh (57.1) 42.5 State Rural Highest Lowest Range Assam 43.4 Kokrajhar (100) Sibsagar (11.8) 88.2 Bihar 79.1 Purnia, Khagaria (100) Sitamarhi (32.5) 67.5 Chhattisgarh 75.6 Rajnandgaon (93.6) Surguja (62.6) 31.0 Jharkhand 92.4 Garhwa, Sahibganj, Godda, Kodarma (100) Dumka (72.3) 27.7 Madhya Pradesh 66.2 Vidisha (94.7) Guna (42.2) 52.5 Odisha 71.8 Mayurbhanj (95.6) Jajapur (39.2) 56.4 Rajasthan 56.9 Chittaurgarh (87.2) Nagaur (30.2) 57.0 Uttar Pradesh 69.6 Rae Bareli (99) Sonbhadra (29.7) 69.3 Uttarakhand 82.6 Bageshwar (99.6) Haridwar (59.6) 40.0 5.13 Table 5.7 also presents the level of iodine content in household salt (more than 15 ppm) for rural areas. Jharkhand has the highest proportion of households (92.4 per cent) using household salt with more than 15 ppm of iodine while Assam has the lowest (43.4 per cent). Garhwa, Sahibganj, Godda and Kodarma (100 per cent) in Jharkhand, Kokrajhar (100 per cent) in Assam and Purnia and Khagaria (100 per cent) in Bihar reported the highest use of household salt with more than 15 ppm of iodine, while Sibsagar (11.8) in Assam showed the lowest percentage. The difference in use is the highest in case of Assam (88.2 per cent) and the lowest in case of Jharkhand (27.7 per cent).
5.14 Table5.8 lists the names of 100 districts in the nine AHS States with the highest prevalence of anaemia across different age groups in 2014. Mau district in Uttar Pradesh has the highest percentage of its children suffering from anaemia in the categories of 6-59 months, 5-9 years and 10-17 years. 5.15 Table 5.9 lists the names of the 100 districts having the lowest percentage of households using Iodine content in Household Salt (more than 15 ppm) (%) in 2014. It can be observed that apart from forming a major share in the list of 100 districts, Uttar Pradesh has most of its districts towards the top of the list.
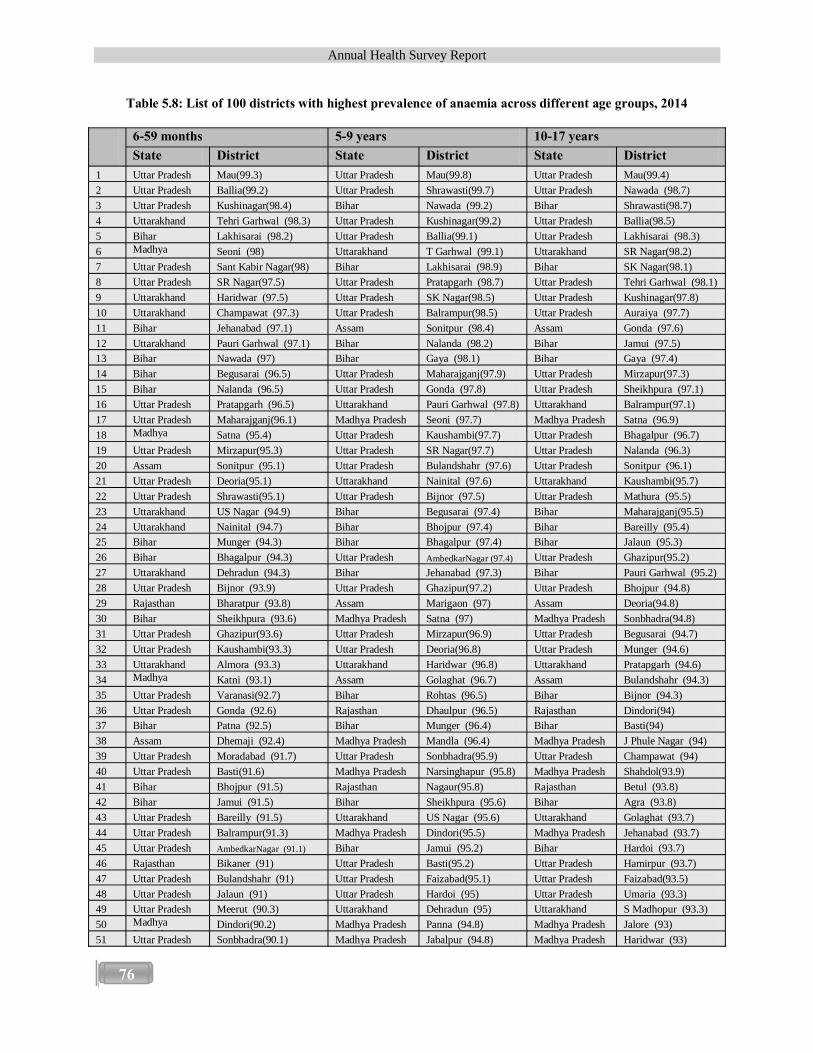
Annual Health Survey Report
76
Table 5.8: List of 100 districts with highest prevalence of anaemia across different age groups, 2014
6-59 months 5-9 years 10-17 years State District State District State District
1 Uttar Pradesh Mau(99.3) Uttar Pradesh Mau(99.8) Uttar Pradesh Mau(99.4) 2 Uttar Pradesh Ballia(99.2) Uttar Pradesh Shrawasti(99.7) Uttar Pradesh Nawada (98.7) 3 Uttar Pradesh Kushinagar(98.4) Bihar Nawada (99.2) Bihar Shrawasti(98.7) 4 Uttarakhand Tehri Garhwal (98.3) Uttar Pradesh Kushinagar(99.2) Uttar Pradesh Ballia(98.5) 5 Bihar Lakhisarai (98.2) Uttar Pradesh Ballia(99.1) Uttar Pradesh Lakhisarai (98.3) 6 Madhya
Pradesh Seoni (98) Uttarakhand T Garhwal (99.1) Uttarakhand SR Nagar(98.2)
7 Uttar Pradesh Sant Kabir Nagar(98) Bihar Lakhisarai (98.9) Bihar SK Nagar(98.1) 8 Uttar Pradesh SR Nagar(97.5) Uttar Pradesh Pratapgarh (98.7) Uttar Pradesh Tehri Garhwal (98.1) 9 Uttarakhand Haridwar (97.5) Uttar Pradesh SK Nagar(98.5) Uttar Pradesh Kushinagar(97.8) 10 Uttarakhand Champawat (97.3) Uttar Pradesh Balrampur(98.5) Uttar Pradesh Auraiya (97.7) 11 Bihar Jehanabad (97.1) Assam Sonitpur (98.4) Assam Gonda (97.6) 12 Uttarakhand Pauri Garhwal (97.1) Bihar Nalanda (98.2) Bihar Jamui (97.5) 13 Bihar Nawada (97) Bihar Gaya (98.1) Bihar Gaya (97.4) 14 Bihar Begusarai (96.5) Uttar Pradesh Maharajganj(97.9) Uttar Pradesh Mirzapur(97.3) 15 Bihar Nalanda (96.5) Uttar Pradesh Gonda (97.8) Uttar Pradesh Sheikhpura (97.1) 16 Uttar Pradesh Pratapgarh (96.5) Uttarakhand Pauri Garhwal (97.8) Uttarakhand Balrampur(97.1) 17 Uttar Pradesh Maharajganj(96.1) Madhya Pradesh Seoni (97.7) Madhya Pradesh Satna (96.9) 18 Madhya
Pradesh Satna (95.4) Uttar Pradesh Kaushambi(97.7) Uttar Pradesh Bhagalpur (96.7)
19 Uttar Pradesh Mirzapur(95.3) Uttar Pradesh SR Nagar(97.7) Uttar Pradesh Nalanda (96.3) 20 Assam Sonitpur (95.1) Uttar Pradesh Bulandshahr (97.6) Uttar Pradesh Sonitpur (96.1) 21 Uttar Pradesh Deoria(95.1) Uttarakhand Nainital (97.6) Uttarakhand Kaushambi(95.7) 22 Uttar Pradesh Shrawasti(95.1) Uttar Pradesh Bijnor (97.5) Uttar Pradesh Mathura (95.5) 23 Uttarakhand US Nagar (94.9) Bihar Begusarai (97.4) Bihar Maharajganj(95.5) 24 Uttarakhand Nainital (94.7) Bihar Bhojpur (97.4) Bihar Bareilly (95.4) 25 Bihar Munger (94.3) Bihar Bhagalpur (97.4) Bihar Jalaun (95.3) 26 Bihar Bhagalpur (94.3) Uttar Pradesh AmbedkarNagar (97.4) Uttar Pradesh Ghazipur(95.2) 27 Uttarakhand Dehradun (94.3) Bihar Jehanabad (97.3) Bihar Pauri Garhwal (95.2) 28 Uttar Pradesh Bijnor (93.9) Uttar Pradesh Ghazipur(97.2) Uttar Pradesh Bhojpur (94.8) 29 Rajasthan Bharatpur (93.8) Assam Marigaon (97) Assam Deoria(94.8) 30 Bihar Sheikhpura (93.6) Madhya Pradesh Satna (97) Madhya Pradesh Sonbhadra(94.8) 31 Uttar Pradesh Ghazipur(93.6) Uttar Pradesh Mirzapur(96.9) Uttar Pradesh Begusarai (94.7) 32 Uttar Pradesh Kaushambi(93.3) Uttar Pradesh Deoria(96.8) Uttar Pradesh Munger (94.6) 33 Uttarakhand Almora (93.3) Uttarakhand Haridwar (96.8) Uttarakhand Pratapgarh (94.6) 34 Madhya
Pradesh Katni (93.1) Assam Golaghat (96.7) Assam Bulandshahr (94.3)
35 Uttar Pradesh Varanasi(92.7) Bihar Rohtas (96.5) Bihar Bijnor (94.3) 36 Uttar Pradesh Gonda (92.6) Rajasthan Dhaulpur (96.5) Rajasthan Dindori(94) 37 Bihar Patna (92.5) Bihar Munger (96.4) Bihar Basti(94) 38 Assam Dhemaji (92.4) Madhya Pradesh Mandla (96.4) Madhya Pradesh J Phule Nagar (94) 39 Uttar Pradesh Moradabad (91.7) Uttar Pradesh Sonbhadra(95.9) Uttar Pradesh Champawat (94) 40 Uttar Pradesh Basti(91.6) Madhya Pradesh Narsinghapur (95.8) Madhya Pradesh Shahdol(93.9) 41 Bihar Bhojpur (91.5) Rajasthan Nagaur(95.8) Rajasthan Betul (93.8) 42 Bihar Jamui (91.5) Bihar Sheikhpura (95.6) Bihar Agra (93.8) 43 Uttar Pradesh Bareilly (91.5) Uttarakhand US Nagar (95.6) Uttarakhand Golaghat (93.7) 44 Uttar Pradesh Balrampur(91.3) Madhya Pradesh Dindori(95.5) Madhya Pradesh Jehanabad (93.7) 45 Uttar Pradesh AmbedkarNagar (91.1) Bihar Jamui (95.2) Bihar Hardoi (93.7) 46 Rajasthan Bikaner (91) Uttar Pradesh Basti(95.2) Uttar Pradesh Hamirpur (93.7) 47 Uttar Pradesh Bulandshahr (91) Uttar Pradesh Faizabad(95.1) Uttar Pradesh Faizabad(93.5) 48 Uttar Pradesh Jalaun (91) Uttar Pradesh Hardoi (95) Uttar Pradesh Umaria (93.3) 49 Uttar Pradesh Meerut (90.3) Uttarakhand Dehradun (95) Uttarakhand S Madhopur (93.3) 50 Madhya
Pradesh Dindori(90.2) Madhya Pradesh Panna (94.8) Madhya Pradesh Jalore (93)
51 Uttar Pradesh Sonbhadra(90.1) Madhya Pradesh Jabalpur (94.8) Madhya Pradesh Haridwar (93)

Prevalence of Anaemia
��
6-59 months 5-9 years 10-17 years State District State District State District
52 Uttar Pradesh Faizabad(89.9) Assam Nalbari (94.7) Assam Chhindwara (92.9) 53 Uttar Pradesh Allahabad(89.7) Madhya Pradesh Betul (94.7) Madhya Pradesh Kannauj (92.8) 54 Bihar Madhepura (89.6) Assam Goalpara (94.6) Assam Barpeta (92.7) 55 Uttar Pradesh Kannauj (89.5) Madhya Pradesh Tikamgarh (94.6) Madhya Pradesh Narsinghapur (92.6) 56 Rajasthan Jhunjhunun (89.4) Madhya Pradesh Shahdol(94.6) Madhya Pradesh Karauli (92.5) 57 Uttar Pradesh Hardoi (89.4) Rajasthan Chittaurgarh (94.6) Rajasthan Kokrajhar (92.4) 58 Bihar Kaimur (Bhabhua) (89.1) Rajasthan Baran (94.6) Rajasthan Seoni (92.4) 59 Uttarakhand Uttarkashi (89) Uttar Pradesh Bareilly (94.4) Uttar Pradesh Jabalpur (92.4) 60 Rajasthan Nagaur(88.7) Rajasthan Karauli (94.3) Rajasthan Tikamgarh (92.3) 61 Uttar Pradesh Barabanki (88.7) Uttar Pradesh Jalaun (94.3) Uttar Pradesh Rohtas (92.2) 62 Odisha Nabarangapur (88.6) Bihar Banka (94.2) Bihar Banka (92.2) 63 Uttarakhand Bageshwar (88.5) Uttar Pradesh Kannauj (94.2) Uttar Pradesh Baghpat (92.2) 64 Uttar Pradesh Chandauli(88.4) Assam Dhubri (94.1) Assam Meerut (92.1) 65 Assam Nagaon (88.2) Uttar Pradesh Auraiya (94) Uttar Pradesh Chitrakoot (92.1) 66 Assam Golaghat (88.2) Madhya Pradesh Balaghat (93.9) Madhya Pradesh AmbedkarNagar(92.1) 67 Rajasthan Dhaulpur (87.6) Uttar Pradesh Allahabad(93.9) Uttar Pradesh Bageshwar (92.1) 68 Bihar Araria (87.2) Uttar Pradesh Moradabad (93.8) Uttar Pradesh Balaghat (91.9) 69 Madhya
Pradesh Jabalpur (87.2) Assam Barpeta (93.7) Assam Mainpuri (91.9)
70 Bihar Rohtas (87) Rajasthan S Madhopur (93.7) Rajasthan Dhaulpur (91.5) 71 Madhya
Pradesh Harda (87) Uttar Pradesh J Phule Nagar (93.7) Uttar Pradesh Hathras (91.5)
72 Uttar Pradesh Agra (87) Assam Nagaon (93.6) Assam Farrukhabad (91.5) 73 Uttar Pradesh Mainpuri (86.9) Uttar Pradesh Agra (93.6) Uttar Pradesh Nainital (91.3) 74 Uttar Pradesh Mathura (86.9) Uttarakhand Champawat (93.6) Uttarakhand Rampur (91.2) 75 Rajasthan S Madhopur (86.8) Odisha Kendujhar (93.5) Odisha Varanasi(91.1) 76 Madhya
Pradesh Balaghat (86.7) Uttar Pradesh Barabanki (93.4) Uttar Pradesh Dhubri (91)
77 Madhya Pradesh
Ratlam (86.6) Uttar Pradesh Farrukhabad (93.4) Uttar Pradesh Etah (91) 78 Uttar Pradesh Gorakhpur(86.6) Rajasthan Banswara (93.3) Rajasthan Barabanki (91) 79 Assam Tinsukia (86.5) Rajasthan Bharatpur (93.3) Rajasthan Bahraich (90.9) 80 Uttar Pradesh Unnao (86.5) Uttar Pradesh Unnao (93.3) Uttar Pradesh Fatehpur (90.8) 81 Madhya
Pradesh Rewa (86.4) Uttar Pradesh Baghpat (93.3) Uttar Pradesh Moradabad (90.8)
82 Bihar Gaya (86.3) Uttar Pradesh Rampur (93.2) Uttar Pradesh Rewa (90.7) 83 Uttar Pradesh Hamirpur (86.3) Uttar Pradesh Chandauli(93.2) Uttar Pradesh Rayagada (90.7) 84 Rajasthan Ganganagar(86.2) Uttar Pradesh Kanpur Nagar (93.1) Uttar Pradesh Dhemaji (90.6) 85 Uttar Pradesh Rae Bareli (86.2) Chhattisgarh Bastar (93) Chhattisgarh Kheri (90.3) 86 Odisha Balangir (86.1) Jharkhand Pakaur (92.9) Jharkhand Jhansi (90.1) 87 Jharkhand Purbi Singhbum (86) Madhya Pradesh Umaria (92.9) Madhya Pradesh Dehradun (90.1) 88 Uttar Pradesh Auraiya (85.9) Rajasthan Jalore (92.9) Rajasthan Etawah (90) 89 Uttar Pradesh Lucknow (85.6) Uttarakhand Almora (92.9) Uttarakhand Goalpara (89.9) 90 Madhya
Pradesh Raisen (85.5) Odisha Nabarangapur (92.7) Odisha Rae Bareli (89.9)
91 Uttar Pradesh Chitrakoot (85.3) Rajasthan Jhunjhunun (92.7) Rajasthan Almora (89.9) 92 Madhya
Pradesh Mandla (85.2) Rajasthan Bikaner(92.6) Rajasthan Buxar (89.8)
93 Uttar Pradesh Rampur (85.2) Uttar Pradesh Mathura (92.5) Uttar Pradesh Chandauli(89.8) 94 Rajasthan Baran (85.1) Uttar Pradesh Hathras (92.4) Uttar Pradesh Bastar (89.6) 95 Uttar Pradesh G Buddha Nagar (85.1) Uttar Pradesh Rae Bareli (92.4) Uttar Pradesh US Nagar (89.6) 96 Uttar Pradesh Farrukhabad (85) Bihar Kaimur(Bhabhua) (92.3) Bihar Nalbari (89.5) 97 Chhattisgarh Jashpur (84.9) Jharkhand Purbi Singhbum (92.3) Jharkhand Madhepura (89.5) 98 Madhya
Pradesh Tikamgarh (84.9) Odisha Jharsuguda (92.3) Odisha Firozabad (89.4)
99 Uttar Pradesh J Phule Nagar (84.8) Assam Tinsukia (92.1) Assam Karimganj (89.3) 100 Madhya
Pradesh Betul (84.7) Rajasthan Ganganagar(92.1) Rajasthan Panna (89.3)

Annual Health Survey Report
78
Table 5.9: List of 100 districts with lowest percentage of Iodine content in Household Salt (more than 15 ppm) (%), 2014
Total Rural State District State District
1 Assam Sibsagar (11.5) Assam Sibsagar (11.8) 2 Assam Golaghat (16.2) Assam Golaghat (12.5) 3 Assam Tinsukia (20.3) Assam Tinsukia (15.4) 4 Assam Cachar (20.4) Assam Cachar (18) 5 Assam North Cachar Hills (26.4) Assam North Cachar Hills (25.2) 6 Assam Lakhimpur (29.9) Assam Dibrugarh (26.7) 7 Uttar Pradesh Shrawasti (30.6) Uttar Pradesh Sonbhadra (29.7) 8 Uttar Pradesh Gonda (31) Uttar Pradesh Shrawasti (30.1) 9 Assam Barpeta (31.7) Rajasthan Nagaur (30.2) 10 Rajasthan Nagaur (32.1) Uttar Pradesh Gonda (30.6) 11 Uttar Pradesh Sonbhadra (32.1) Rajasthan Dausa (30.7) 12 Assam Dibrugarh (32.4) Assam Lakhimpur (31.5) 13 Rajasthan Dausa (32.4) Uttar Pradesh Auraiya (31.5) 14 Bihar Sitamarhi (32.5) Uttar Pradesh Hardoi (32.3) 15 Assam Darrang (33.7) Bihar Sitamarhi (32.5) 16 Assam Bongaigaon (33.7) Assam Barpeta (32.8) 17 Uttar Pradesh Kheri (34.7) Assam Bongaigaon (33.5) 18 Uttar Pradesh Maharajganj (35) Assam Darrang (34) 19 Uttar Pradesh Auraiya (35.3) Uttar Pradesh Maharajganj (34.3) 20 Assam Karimganj (38.7) Uttar Pradesh Kheri (35.2) 21 Uttar Pradesh Hardoi (38.7) Uttar Pradesh Farrukhabad (35.9) 22 Uttar Pradesh Unnao (38.8) Assam Nagaon (36.9) 23 Assam Nagaon (39.2) Rajasthan Ganganagar (38.5) 24 Uttar Pradesh Ambedkar Nagar (39.6) Uttar Pradesh Sant Kabir Nagar (38.7) 25 Uttar Pradesh Bahraich (40) Uttar Pradesh Ambedkar Nagar (39.1) 26 Odisha Jajapur (40.3) Odisha Jajapur (39.2) 27 Uttar Pradesh Sant Kabir Nagar (40.5) Uttar Pradesh Sant Ravidas Nagar (39.4) 28 Uttar Pradesh Kaushambi (41.1) Uttar Pradesh Jhansi (39.4) 29 Uttar Pradesh Pratapgarh (41.2) Uttar Pradesh Bahraich (39.6) 30 Uttar Pradesh Sant Ravidas Nagar (41.4) Uttar Pradesh Jalaun (39.7) 31 Uttar Pradesh Hamirpur (43) Assam Karimganj (39.8) 32 Uttar Pradesh Siddharthanagar (43.3) Uttar Pradesh Pratapgarh (39.9) 33 Uttar Pradesh Farrukhabad (43.3) Uttar Pradesh Kaushambi (40.7) 34 Uttar Pradesh Mirzapur (43.6) Uttar Pradesh Chandauli (41.4) 35 Odisha Anugul (43.7) Rajasthan Jaisalmer (42) 36 Rajasthan Jaisalmer (43.7) Uttar Pradesh Hamirpur (42) 37 Uttar Pradesh Chandauli (44) Madhya Pradesh Guna (42.2) 38 Rajasthan Bharatpur (44.2) Rajasthan Churu (42.4) 39 Rajasthan Jhunjhunun (44.3) Odisha Anugul (42.6) 40 Assam Hailakandi (44.6) Rajasthan Bikaner (42.7) 41 Uttar Pradesh Balrampur (44.7) Uttar Pradesh Siddharthanagar (42.8) 42 Uttar Pradesh Faizabad (44.7) Uttar Pradesh Mirzapur (43) 43 Uttar Pradesh Banda (44.9) Madhya Pradesh Jhabua (43.1) 44 Uttar Pradesh Sultanpur (45) Uttar Pradesh Faizabad (43.1) 45 Rajasthan Ganganagar (45.1) Uttar Pradesh Banda (43.6) 46 Assam Goalpara (45.3) Rajasthan Jhunjhunun (43.7) 47 Madhya Pradesh Jhabua (45.6) Uttar Pradesh Mau (44) 48 Uttar Pradesh Jaunpur (46.1) Uttar Pradesh Sultanpur (44.2) 49 Uttar Pradesh Mau (46.5) Uttar Pradesh Unnao (44.3) 50 Odisha Kalahandi (47.3) Assam Goalpara (44.6)

Prevalence of Anaemia
��
Total Rural State District State District
51 Rajasthan Alwar (48) Uttar Pradesh Jaunpur (44.9) 52 Assam Karbi Anglong (48.1) Assam Hailakandi (45.1) 53 Uttar Pradesh Ballia (48.2) Uttar Pradesh Balrampur (45.1) 54 Uttar Pradesh Jalaun (48.8) Assam Karbi Anglong (46.7) 55 Uttar Pradesh Etawah (48.9) Madhya Pradesh Dhar (46.8) 56 Uttar Pradesh Mahoba (49.5) Rajasthan Hanumangarh (46.8) 57 Madhya Pradesh Guna (49.7) Madhya Pradesh Shajapur (46.9) 58 Uttar Pradesh Basti (49.9) Odisha Kalahandi (47) 59 Rajasthan Jodhpur (50.2) Uttar Pradesh Mahoba (47) 60 Uttar Pradesh Deoria (51.1) Rajasthan Alwar (47.4) 61 Madhya Pradesh Dhar (51.4) Uttar Pradesh Etawah (47.7) 62 Rajasthan Ajmer (51.9) Uttar Pradesh Ballia (47.8) 63 Uttar Pradesh Ghazipur (52) Rajasthan Ajmer (48.1) 64 Uttar Pradesh Azamgarh (52.1) Rajasthan Bharatpur (48.2) 65 Rajasthan Hanumangarh (52.2) Uttar Pradesh Deoria (48.3) 66 Odisha Balangir (52.6) Rajasthan Jodhpur (49.4) 67 Rajasthan Bikaner (53) Uttar Pradesh Basti (49.5) 68 Rajasthan Churu (53.2) Madhya Pradesh Dewas (50.2) 69 Uttar Pradesh Barabanki (53.3) Madhya Pradesh Shivpuri (50.3) 70 Assam Marigaon (53.9) Uttar Pradesh Ghazipur (50.8) 71 Bihar Madhubani (54.2) Uttar Pradesh Kanpur Nagar (50.9) 72 Odisha Nabarangapur (54.3) Odisha Balangir (51) 73 Madhya Pradesh Shajapur (54.5) Rajasthan Sikar (51.7) 74 Rajasthan Sikar (54.9) Uttar Pradesh Azamgarh (51.9) 75 Bihar Begusarai (55.7) Uttar Pradesh Barabanki (52.6) 76 Uttarakhand Pithoragarh (57.1) Uttar Pradesh Varanasi (52.9) 77 Madhya Pradesh Shivpuri (57.9) Assam Marigaon (53.1) 78 Bihar Lakhisarai (58) Odisha Nabarangapur (53.2) 79 Rajasthan Jalore (58.5) Rajasthan Bundi (53.5) 80 Madhya Pradesh Panna (59.7) Bihar Munger (54) 81 Rajasthan Dungarpur (59.8) Madhya Pradesh Datia (54.1) 82 Uttar Pradesh Kushinagar (60.2) Bihar Madhubani (54.6) 83 Rajasthan Sirohi (60.5) Rajasthan Jalore (54.8) 84 Madhya Pradesh Neemuch (60.6) Bihar Begusarai (54.9) 85 Uttar Pradesh Rampur (60.7) Uttar Pradesh Allahabad (55.5) 86 Rajasthan Bundi (60.9) Bihar Lakhisarai (56.5) 87 Uttar Pradesh Allahabad (60.9) Rajasthan Sirohi (56.5) 88 Uttar Pradesh Varanasi (61.1) Madhya Pradesh Katni (56.8) 89 Uttar Pradesh Agra (61.2) Madhya Pradesh Shahdol (57) 90 Uttar Pradesh Jhansi (61.6) Uttar Pradesh Budaun (57) 91 Madhya Pradesh Shahdol (61.9) Madhya Pradesh Panna (57.2) 92 Madhya Pradesh Dindori (61.9) Madhya Pradesh Neemuch (57.6) 93 Madhya Pradesh Mandla (62.3) Rajasthan Dungarpur (58.4) 94 Bihar Madhepura (62.6) Rajasthan Kota (58.8) 95 Madhya Pradesh Dewas (62.7) Madhya Pradesh Barwani (58.9) 96 Uttar Pradesh Gorakhpur (62.8) Madhya Pradesh Raisen (58.9) 97 Madhya Pradesh Damoh (63.1) Uttar Pradesh Gorakhpur (59) 98 Uttar Pradesh Pilibhit (63.1) Uttar Pradesh Rampur (59.1) 99 Madhya Pradesh Raisen (63.2) Uttarakhand Haridwar (59.6) 100 Madhya Pradesh Vidisha (63.3) Rajasthan Barmer (60.1)

Annual Health Survey Report
80
5.16 Figure 5.1 illustrates the distribution of 100 districts from the nine States with the highest prevalence of anaemia across different age groups. Uttar Pradesh has the highest number of districts across all the three age
group categories: 44 of its districts in case of anaemic children aged 6-59 months, 39 in case of anaemic children aged 5-9 years and 48 for anaemic children aged 10-17 years, while Assam and Jharkhand have 16 and 13 districts.
Figure 5.1: State-wise distribution of 100 districts with highest prevalence of anaemia across age groups
Figure 5.2: State-wise distribution of 100 districts with lowest percentage of households using Iodised salt
5.17 Figure 5.2 illustrates the share of Statesand rural areas among the 100 districts with the lowest percentage of households using adequately iodized Household Salt (more than 15 ppm). Data reveals that the number of
districts of most States is largely similar in case of both total as well as rural areas. Uttar Pradesh has the highest share (42), followed by Rajasthan (17), Assam (16) and Madhya Pradesh (14). In case of rural areas, Uttar

Prevalence of Anaemia
�1
is slightly lesser (41), while that of Rajasthan is higher (19). Chhattisgarh and Jharkhand have no districts in the list. 5.3. Inter-District Disparities 5.18 Table 5.10 reports the coefficient of variation (CV) for district district level anaemia across different age groups for2014. The CV
values suggest that Madhya Pradesh has the highest inter-district variations in percentage anaemia among children aged 6-59 months. Odisha has highest CV values in percentage anaemia among children aged 5-9 years and 10-17 years. Lowest CV has been observed for Jharkhand (CV 0.06) among children aged 6-59 months and for Uttarakhand (CV 0.05) and Uttar Pradesh (CV 0.05) among children aged 5-9 years and 10-17 years.
Table 5.10: Coefficient of variation of district level Anaemia across age groups
State 6-59 months 5-9 years 10-17 years Assam 0.14 0.08 0.07 Bihar 0.13 0.08 0.09 Chhattisgarh 0.13 0.08 0.09 Jharkhand 0.06 0.06 0.08 Madhya Pradesh 0.17 0.14 0.14 Odisha 0.12 0.11 0.16 Rajasthan 0.13 0.08 0.09 Uttar Pradesh 0.09 0.06 0.05 Uttarakhand 0.11 0.05 0.06 5.19 Table 5.11 reports the coefficient of variation (CV) for use of adequately Iodized Household Salt (more than 15 ppm) for States and rural areas for 2014. The CV values for 2014 suggest that Assam (CV 0.58) has the highest inter-district variations in the percentage use of Household Salt with Iodine content more
than 15 ppm. In rural areas also Assam (CV 0.60) has the highest CV values in percentage of use of Household Salt with Iodine content more than 15 ppm. On the other hand, Jharkhand records the lowest CV at the State level (CV 0.09) as well as for rural areas (CV 0.10).
Table 5.11: Coefficient of variation of district level Iodine content in Household Salt
State Total Rural Assam 0.58 0.60 Bihar 0.19 0.19 Chhattisgarh 0.11 0.12 Jharkhand 0.09 0.10 Madhya Pradesh 0.16 0.19 Odisha 0.19 0.20 Rajasthan 0.25 0.28 Uttar Pradesh 0.30 0.31 Uttarakhand 0.14 0.15

Annual Health Survey Report
82
5.20 Table 5.14 lists the districts with the highest and lowest percentage of anaemia across different age groups in 2014, with special focus on rural areas. In the 6-59 months age group, Tehri Garhwal in Uttarakhand has the highest prevalence of anaemia at 98.3 per cent, while Nawada in Bihar has the maximum cases (99.2 per cent) in the 5-9 years category and Mau in Uttar Pradesh the maximum (99.4 per cent) in the 10-17 years group. Rajgarh in Madhya Pradesh recorded the minimum prevalence across all districts at 34.7 per cent in case of 6-59 months, 51.4 per cent in case of 5-
9 years and 51 per cent in case of 10-17 year age groups. The inter-district divide in rural areas too is huge with Ballia and Mau districts in Uttar Pradesh reporting the maximum prevalence of anaemia in the 6-59 month group at 99.2 per cent, and Rajgarh in Madhya Pradesh the least at 33.8 per cent. Mau district also has the highest number of cases in the 5-9 years (99.8 per cent) and 10-17 years (99.2 per cent) age groups. Indore in Madhya Pradesh has the least number of cases of anaemia in the 5-9 years (46.9 per cent) and 10-17 years (41.4 per cent) categories.
Table 5.12: Districts-wise disparity in anaemia, 2014
Districts with highest and lowest percentage of prevalence of anaemia in rural and urban areas across different age groups, 2014
State 6-59 months 5-9 years 10-17 years
Lowest (%) Highest (%) Lowest (%) Highest (%) Lowest (%) Highest (%) Assam Sibsagar (54.2) Sonitpur (95.1) Kamrup (74.5) Sonitpur (98.4) Sibsagar (70.2) Sonitpur (96.1)
Bihar Muzaffarpur (57.1)
Lakhisarai (98.2) Darbhanga (76.4) Nawada (99.2) Pashchim Champaran (70.1)
Nawada (98.7)
Chhattisgarh Raipur (55.1) Jashpur (84.9) Durg (68.4) Bastar (93) Durg (64.7) Bastar (89.6)
Jharkhand Dumka (68.3) Purbi Singhbum (86)
Kodarma (73.6) Pakaur (92.9) Deoghar (61.8) Pakaur (86.7)
Madhya Pradesh Rajgarh (34.7) Seoni (98) Rajgarh (51.4) Seoni (97.7) Rajgarh (51) Satna (96.9)
Odisha Jajapur (47.9) Nabarangapur (88.6)
Jajapur (52.7) Kendujhar (93.5) Jajapur (39) Rayagada (90.7)
Rajasthan Bhilwara (51.2) Bharatpur (93.8) Ajmer (64.4) Dhaulpur (96.5) Ajmer (60.5) Sawai Madhopur (93.3)
Uttar Pradesh Mahoba (62.3) Mau, Ballia (99.3)
Mahoba (73.2) Mau, Shrawasti (99.8)
Lalitpur (75) Mau (99.4)
Uttarakhand Pithoragarh (61.6) T Garhwal(98.3) Pithoragarh (82.7) T Garhwal (99.1) Uttarkashi (80.9) T Garhwal (98.1)
Rural Areas Assam Sibsagar (55.3) Kokrajhar (72.1) Sibsagar (76.4) Sonitpur (98.3) Sibsagar (70.4) Sonitpur (95.8)
Bihar Muzaffarpur (57.1)
Lakhisarai (98.5) Pashchim Champaran (75.3)
Lakhisarai, Nawada (99.4)
Pashchim Champaran(66.6)
Lakhisarai, Nawada (98.7)
Chhattisgarh Raipur (54.4) Jashpur (84.7) Kawardha (73.6) Bastar (92.9) Rajnandgaon (68.1)
Bastar (89.5)
Jharkhand Dumka (66.3) Purbi Singhbum (89.7)
Deoghar (72) Pakaur (92.9) Deoghar (61.4) Pakaur (86.9)
Madhya Pradesh Rajgarh (33.8) Seoni (99) Indore (46.9) Satna (98.4) Indore (41.4) Satna (97.7)
Odisha Jajapur (48.2) Nabarangapur (88.9)
Jajapur (52.9) Jharsuguda, Kendujhar (94.4)
Jajapur (39.3) Jharsuguda (94.5)
Rajasthan Bhilwara (53) Bharatpur (95.7) Ajmer (62) Sawai Madhopur (97.7)
Alwar (62.6) Sawai Madhopur (94.8)
Uttar Pradesh Mahoba (58.1) Ballia, Mau (99.2)
Mahoba (71.2) Shrawasti, Mau (99.8)
Lalitpur (74.3) Mau (99.2)
Uttarakhand Pithoragarh (58.2) Haridwar, Tehri Garhwal (98.4)
Pithoragarh (82.4) Tehri Garhwal, Dehradun (99.1)
Uttarkashi (80.9) Tehri Garhwal (98.3)

Prevalence of Anaemia
��
5.4. Key Findings The figures for percentage of population suffering from anaemia are distressing. On average
more than 70 per cent of the population is anemic. In 6-59 months age group, highest prevalence of anaemia is reported from Uttarakhand at 94.4 per cent, and the least from Chhattisgarh at 63.8 per cent. In case of rural areas too, Uttarakhand (94.9 per cent) had the highest prevalence of anaemia and Chhattisgarh the lowest (66.6 per cent). Evidently across the AHS States, the percentage of anemic population is higher in rural areas as compared to States (rural and urban combined). Also, the percentage of population from anaemia in the age group 5-9 years is higher than across 6-59 months but lower across 10-17 year group.
Specific trends emerge when prevalence of anaemia is compared across different age groups. To elaborate, comparing the anaemia level across age groups 6-59 months and 60 years and above group, it could be observed that anaemia level are higher among population aged 60 years and above, except for Uttarakhand. Also, higher percentages of males among 60 years and above age group are anemic as compared to females, except for Utarakhand. Among population aged 10-17 years females are more anemic as compared males.
In rural areas similar trends are observable; the prevalence of anaemia among females in age group 5-9 years and 10-17 years is higher than compared to males in the same age groups, while anaemia is higher among males in 60 years and above group, except for Uttarakhand. The level of anaemia among males and females in 6-59 months age group are very high in Uttarakhand and Uttar Pradesh in both rural areas as well as at State level (rural and urban combined).
The proportion of population suffering from severe anaemia is comparatively lower than anaemia. The higher proportions of population suffering from severe anaemia belong to the age group 5-9 years. Notably, slightly higher percentage of females in 5-9 year, 10-17 years, 18-59 years and 60 years and above (except for Chhattisgarh) age group are anemic. Clearly, indicating that severe anaemia is prevalent more among females than males.
Overall, the percentage of population using household salt with more than 15 ppm of iodine is the highest in Jharkhand (92.3 per cent) and lowest in Assam (46.8 per cent). But disparities exist at district level, Khagaria and Purnia (100) in Bihar; and Godda and Garhwa (100) in Jharkhand have the highest use of household salt with more than 15 ppm of iodine, while Sibsagar (11.5) in Assam has the lowest percentage. Also, on average the use of household salt with more than 15 ppm of iodine is higher at State level than in rural areas.
Uttar Pradesh has the highest number of districts reporting highest prevalence of anaemia and lowest use of salt with iodine (more than 15 ppm). Mau district in Uttar Pradesh has the highest percentage of its children suffering from anaemia in the categories of 6-59 months, 5-9 years and 10-17 years. Sibsagar in Assam reported the lowest percentage of iodine content in household salt (more than 15 ppm).

Annual Health Survey Report
84
Association of district level anaemia prevalence was verified across indicators such as district level undernutrition outcome, overall literacy rates and consumption of IFA tablets during pregnancy. The district patterns do not reveal any significant association which may be partly because of very high prevalence of anaemia observed across all the districts. Similarly, only a weak association could be ascertained between districts with high level of anaemia and high neonatal mortality rates. A similar association is observed in the context of low birth-weight outcomes and high total fertility rates.

��
HIGH BLOOD SUGAR LEVELS
6.1. Definition of Indicators 6.1 Blood sugar concentration or blood glucose level is the amount of glucose (sugar) present in the human body. Blood sugar levels outside the normal range may be an indicator of a medical condition. A persistently high level is referred to as hyperglycemia while low levels are referred to as hypoglycemia. Diabetes mellitus, characterized by persistent hyperglycemia, is the most prominent disease related to failure of blood sugar regulation. Blood sugar levels are provided for person aged 18 and above only and
mg/dl.
6.2. Levels and Patterns 6.2 The percentage of with blood sugar level greater than or equal to110 mg/dl, 130 mg/dl and 150 mg/dl is reported in Table 6.1. Assam, Chhattisgarh and Uttarakhand have higher prevalence of blood sugar levels in
110mg/dl and 130mg/dl categories. The percentage of population with blood sugar mg/dl is comparatively lower. In Uttarakhand, 2.8 per cent of the population has blood sugar levels higher than 150mg/dl, while the lowest level is observed in Bihar at (1.1 per cent). Blood Sugar level in rural areas are relatively higher as compared to States (rural and urban).
Table 6.1: Blood Sugar Level (%), 2014
Blood sugar at State-level and in rural areas for (18 years and above) in 2014 Blood sugar Assam 10.1 4 1.9 Bihar 8.5 2.5 1.1 Chhattisgarh 11.5 4.3 1.7 Jharkhand 8.5 3.8 2.5 Madhya Pradesh 8.8 2.8 1.4 Odisha 8.3 3.4 2 Rajasthan 9.5 3.4 1.7 Uttar Pradesh 9.1 3.5 2 Uttarakhand 10.2 4.4 2.8 Rural Assam 9.6 3.6 1.6 Bihar 7.9 2.3 1 Chhattisgarh 10.7 3.7 1.5 Jharkhand 7.3 2.5 1.5 Madhya Pradesh 8 2.3 1.1 Odisha 7.8 3 1.8 Rajasthan 7.9 2.5 1.1 Uttar Pradesh 8.4 3 1.6 Uttarakhand 8.9 3.5 2.1 6.3 Table 6.2 shows blood sugar levels among men and women. Chhattisgarh has the highest percentage of both men (13.2 per cent) and women (9.9 per cent) in the category. In the 130 mg/dl section, Chhattisgarh has the highest prevalence among men but Uttarakhand shows the highest in case
of femalesat 4.2 per cent. Chhattisgarh shows a prevalence level of3.6 per cent among females. However, the patterns are different in the mg/dl as Jharkhand (2.9 per cent) has the highest level closely followed by Uttarakhand (2.7 per cent). Bihar has the lowest level among both men and women.
6

Annual Health Survey Report
86
Table 6.2: Blood Sugar Level (18 years and above) amongst males and female, 2014 Male Assam 11.3 4.6 2.1 Bihar 9.2 2.7 1.3 Chhattisgarh 13.2 5.1 1.9 Jharkhand 9.3 4.3 2.9 Madhya Pradesh 9.8 2.9 1.4 Odisha 9.1 3.8 2.4 Rajasthan 10.2 3.6 1.8 Uttar Pradesh 9.6 3.6 2 Uttarakhand 11 4.6 2.7 Female Assam 9.1 3.5 1.6 Bihar 7.9 2.3 1 Chhattisgarh 9.9 3.6 1.5 Jharkhand 7.8 3.3 2.1 Madhya Pradesh 7.7 2.7 1.4 Odisha 7.7 3.1 1.7 Rajasthan 8.8 3.2 1.6 Uttar Pradesh 8.7 3.4 1.9 Uttarakhand 9.6 4.2 2.8
Table 6.3: Blood Sugar Level (18 years and above) amongst males and female in rural areas, 2014 Rural Male Assam 10.6 4 1.7 Bihar 8.6 2.4 1.1 Chhattisgarh 12.2 4.3 1.7 Jharkhand 8.2 2.9 1.8 Madhya Pradesh 8.9 2.3 1.1 Odisha 8.4 3.4 2.1 Rajasthan 8.3 2.6 1.1 Uttar Pradesh 8.9 3.2 1.6 Uttarakhand 9.9 4 2.4 Rural Female Assam 8.8 3.2 1.5 Bihar 7.3 2.1 0.9 Chhattisgarh 9.3 3.2 1.3 Jharkhand 6.7 2.2 1.3 Madhya Pradesh 6.9 2.1 1 Odisha 7.2 2.7 1.5 Rajasthan 7.5 2.4 1.1 Uttar Pradesh 8.1 3 1.7 Uttarakhand 8.2 3.2 1.9 6.4 Table 6.3 shows the levels of blood sugar for the rural male and female population. Chhattisgarh has the highest percentage of rural males with levels higher than 110 mg/dl and 130 mg/dl at 12.2 per cent and 4.3 per cent.
Rajasthan, Madhya Pradesh and Bihar have 1.1 percent rural males with blood sugar levels in the higher than 150 mg/dl range. Among rural females too, Chhattisgarh records a high prevalence of blood sugar (9.3 per cent).

High Blood Sugar Levels
��

Annual Health Survey Report
88

High Blood Sugar Levels
��
Map 6.3: Percentage of males (18 years and above) with

Annual Health Survey Report
90

High Blood Sugar Levels
�1
6.5 Table 6.4 lists the names of all the 100 districts in the nine AHS States with the highest prevalence of blood sugar levels in 2014.
Dhanbad district (6.5 per cent) in Jharkhand has the highest percentage of people with blood
Table 6.4: List of 100 districts with highest blood sugar, 2014 No. District State District State District State 1 Raisen (20.8) Madhya Pradesh Chittaurgarh (10) Rajasthan Dhanbad (6.5) Jharkhand 2 US Nagar (20.3) Uttarakhand US Nagar (8.5) Uttarakhand US Nagar (5.4) Uttarakhand 3 Chittaurgarh (19.2) Rajasthan Sheikhpura (8.1) Bihar Bokaro (4.3) Jharkhand 4 Rajnandgaon (18.2) Chhattisgarh Rajnandgaon (7.7) Chhattisgarh Sambalpur (3.8) Odisha 5 Rajsamand (16) Rajasthan Dhanbad (7.7) Jharkhand Ranchi (3.6) Jharkhand 6 Patna (15.9) Bihar Sambalpur (7.5) Odisha Nagaon (3.5) Assam 7 Ranchi (15.8) Jharkhand Nagaon (7.3) Assam Purbi Singhbum (3.5) Jharkhand 8 Bhilwara (15.8) Rajasthan Durg (6.9) Chhattisgarh Ujjain (3.5) Madhya Pradesh 9 Sonitpur (15.3) Assam Banswara (6.9) Rajasthan Mandla (3.3) Madhya Pradesh 10 Dhubri (15.3) Assam Bhojpur (6.7) Bihar Jhansi (3.3) Uttar Pradesh 11 Kawardha (15.3) Chhattisgarh Ujjain (6.6) Madhya Pradesh Bijnor (3.3) Uttar Pradesh 12 Lakhimpur (14.6) Assam Barabanki (6.6) Uttar Pradesh Bhojpur (3.2) Bihar 13 Raigarh (14.1) Chhattisgarh Dhubri (6.2) Assam Neemuch (3.2) Madhya Pradesh 14 Khordha (14) Odisha Jhansi (6.2) Uttar Pradesh Khordha (3.2) Odisha 15 Udaipur (13.9) Rajasthan Ranchi (6.1) Jharkhand Cuttack (3.1) Odisha 16 Mahasamund (13.4) Chhattisgarh Pilibhit (5.9) Uttar Pradesh Ganganagar (3) Rajasthan 17 Barabanki (13.4) Uttar Pradesh Auraiya (5.9) Uttar Pradesh Barabanki (3) Uttar Pradesh 18 Champawat (13.4) Uttarakhand Mahasamund (5.8) Chhattisgarh Meerut (3) Uttar Pradesh 19 Jalore (13.3) Rajasthan Guna (5.8) Madhya Pradesh Lalitpur (3) Uttar Pradesh 20 Guna (13.2) Madhya Pradesh Bokaro (5.7) Jharkhand Dehradun (3) Uttarakhand 21 Banswara (13.1) Rajasthan Etawah (5.7) Uttar Pradesh Nainital (3) Uttarakhand 22 Marigaon (13) Assam Lucknow (5.6) Uttar Pradesh Pilibhit (2.9) Uttar Pradesh 23 Kota (13) Rajasthan Tinsukia (5.5) Assam Agra (2.9) Uttar Pradesh 24 Nalbari (12.9) Assam Buxar (5.5) Bihar Guna (2.8) Madhya Pradesh 25 Kanker (12.9) Chhattisgarh Nawada (5.5) Bihar Kendrapara (2.8) Odisha 26 Sagar (12.9) Madhya Pradesh Raigarh (5.5) Chhattisgarh Hanumangarh (2.8) Rajasthan 27 Sheikhpura (12.8) Bihar Purbi Singhbum (5.5) Jharkhand Haridwar (2.8) Uttarakhand 28 Supaul (12.8) Bihar Sehore (5.5) Madhya Pradesh Chittaurgarh (2.7) Rajasthan 29 Durg (12.8) Chhattisgarh Sonitpur (5.4) Assam Udaipur (2.7) Rajasthan 30 Dhemaji (12.6) Assam Kawardha (5.4) Chhattisgarh Gorakhpur (2.7) Uttar Pradesh 31 Nagaon (12.5) Assam Udaipur (5.4) Rajasthan Kanpur Nagar (2.7) Uttar Pradesh 32 Sehore (12.5) Madhya Pradesh Nalbari (5.3) Assam Bareilly (2.7) Uttar Pradesh 33 Narsinghapur (12.1) Madhya Pradesh Ratlam (5.3) Madhya Pradesh Muzaffarpur (2.6) Bihar 34 Goalpara (12) Assam Neemuch (5.3) Madhya Pradesh Durg (2.6) Chhattisgarh 35 Kamrup (11.9) Assam Mandla (5.3) Madhya Pradesh Rajnandgaon (2.6) Chhattisgarh 36 Shivpuri (11.9) Madhya Pradesh Almora (5.3) Uttarakhand Paschimi Singhbum (2.6) Jharkhand 37 Lucknow (11.9) Uttar Pradesh Marigaon (5.1) Assam Ratlam (2.6) Madhya Pradesh 38 Hardoi (11.9) Uttar Pradesh Nalanda (5.1) Bihar Nayagarh (2.6) Odisha 39 Neemuch (11.8) Madhya Pradesh Bhagalpur (5.1) Bihar Jodhpur (2.6) Rajasthan 40 Kanpur Dehat (11.8) Uttar Pradesh Raipur (5.1) Chhattisgarh Siddharthanagar (2.6) Uttar Pradesh 41 Almora (11.8) Uttarakhand Raisen (5.1) Madhya Pradesh Bulandshahr (2.6) Uttar Pradesh 42 Bhagalpur (11.7) Bihar Jabalpur (5.1) Madhya Pradesh Dhubri (2.5) Assam 43 Nalanda (11.7) Bihar Rajgarh (5) Madhya Pradesh Karimganj (2.5) Assam 44 Jalaun (11.7) Uttar Pradesh Khordha (5) Odisha Nawada (2.5) Bihar 45 Koriya (11.6) Chhattisgarh Kheri (5) Uttar Pradesh Buxar (2.5) Bihar 46 Ratlam (11.6) Madhya Pradesh Kannauj (5) Uttar Pradesh Bilaspur (2.5) Chhattisgarh 47 Cuttack (11.6) Odisha Agra (5) Uttar Pradesh Kandhamal (2.5) Odisha

Annual Health Survey Report
92
No. District State District State District State 48 Hailakandi (11.5) Assam Lalitpur (4.9) Uttar Pradesh Deoria (2.5) Uttar Pradesh 49 Jabalpur (11.5) Madhya Pradesh Hardoi (4.9) Uttar Pradesh Kodarma (2.4) Jharkhand 50 Rajgarh (11.5) Madhya Pradesh Ghaziabad (4.9) Uttar Pradesh Bhopal (2.4) Madhya Pradesh 51 Jhansi (11.5) Uttar Pradesh Kanpur Nagar (4.9) Uttar Pradesh Rajgarh (2.4) Madhya Pradesh 52 Darrang (11.4) Assam Bhopal (4.8) Madhya Pradesh Indore (2.4) Madhya Pradesh 53 Samastipur (11.3) Bihar Cuttack (4.8) Odisha Ganjam (2.4) Odisha 54 Datia (11.3) Madhya Pradesh Dehradun (4.8) Uttarakhand Kendujhar (2.4) Odisha 55 Sambalpur (11.3) Odisha Banka (4.7) Bihar SR Nagar (2.4) Uttar Pradesh 56 Auraiya (11.3) Uttar Pradesh Dantewada (4.7) Chhattisgarh Pratapgarh (2.4) Uttar Pradesh 57 Etah (11.3) Uttar Pradesh Koriya (4.7) Chhattisgarh Jorhat (2.3) Assam 58 Bokaro (11.2) Jharkhand Kota (4.7) Rajasthan Tinsukia (2.3) Assam 59 Sheopur (11.2) Madhya Pradesh Nainital (4.7) Uttarakhand Cachar (2.3) Assam 60 Mahoba (11.2) Uttar Pradesh Sagar (4.6) Madhya Pradesh Nalanda (2.3) Bihar 61 Etawah (11.2) Uttar Pradesh Bijnor (4.6) Uttar Pradesh Jabalpur (2.3) Madhya Pradesh 62 Farrukhabad (11.2) Uttar Pradesh Dhemaji (4.5) Assam Jagatsinghapur (2.3) Odisha 63 Nawada (11.1) Bihar Kamrup (4.4) Assam Kota (2.3) Rajasthan 64 Banka (11.1) Bihar East Nimar (4.4) Madhya Pradesh Farrukhabad (2.3) Uttar Pradesh 65 Gwalior (11.1) Madhya Pradesh Rajsamand (4.4) Rajasthan Jaunpur (2.3) Uttar Pradesh 66 Ujjain (11.1) Madhya Pradesh Farrukhabad (4.4) Uttar Pradesh Etawah (2.3) Uttar Pradesh 67 Araria (11) Bihar Begusarai (4.3) Bihar Ambedkar Nagar (2.3) Uttar Pradesh 68 Kanpur Nagar (11) Uttar Pradesh Jagatsinghapur (4.3) Odisha Ballia (2.3) Uttar Pradesh 69 Fatehpur (11) Uttar Pradesh Bhilwara (4.3) Rajasthan Pauri Garhwal (2.3) Uttarakhand 70 Aurangabad (10.9) Bihar Bulandshahr (4.3) Uttar Pradesh Bargarh (2.2) Odisha 71 Mandla (10.9) Madhya Pradesh Champawat (4.3) Uttarakhand Rajsamand (2.2) Rajasthan 72 Sirohi (10.9) Rajasthan Kanker (4.2) Chhattisgarh Tonk (2.2) Rajasthan 73 Unnao (10.9) Uttar Pradesh Anugul (4.2) Odisha Mathura (2.2) Uttar Pradesh 74 Dhanbad (10.8) Jharkhand Ganganagar (4.2) Rajasthan Ghaziabad (2.2) Uttar Pradesh 75 Shajapur (10.8) Madhya Pradesh Hanumangarh (4.2) Rajasthan Auraiya (2.2) Uttar Pradesh 76 Tonk (10.8) Rajasthan Paschim Singhbum(4.1) Jharkhand Chandauli (2.2) Uttar Pradesh 77 Pilibhit (10.8) Uttar Pradesh Kodarma (4.1) Jharkhand Lucknow (2.2) Uttar Pradesh 78 Rae Bareli (10.8) Uttar Pradesh Nayagarh (4.1) Odisha Pithoragarh (2.2) Uttarakhand 79 Sultanpur (10.8) Uttar Pradesh Tonk (4.1) Rajasthan Dibrugarh (2.1) Assam 80 Bahraich (10.8) Uttar Pradesh Haridwar (4.1) Uttarakhand Bhagalpur (2.1) Bihar 81 Jamui (10.7) Bihar Kendrapara (4) Odisha Koriya (2.1) Chhattisgarh 82 Bhind (10.7) Madhya Pradesh Kandhamal (4) Odisha Korba (2.1) Chhattisgarh 83 Kandhamal (10.7) Odisha Sirohi (4) Rajasthan Lohardaga (2.1) Jharkhand 84 Bhojpur (10.6) Bihar Kendujhar (3.9) Odisha Satna (2.1) Madhya Pradesh 85 Nainital (10.6) Uttarakhand Ganjam (3.9) Odisha Balangir (2.1) Odisha 86 Dumka (10.5) Jharkhand Gorakhpur (3.9) Uttar Pradesh Baleshwar (2.1) Odisha 87 Banda (10.5) Uttar Pradesh Meerut (3.9) Uttar Pradesh Dhenkanal (2.1) Odisha 88 Kaimur (Bhabhua) (10.4) Bihar Rae Bareli (3.9) Uttar Pradesh Anugul (2.1) Odisha 89 Morena (10.4) Madhya Pradesh Cachar (3.8) Assam Banswara (2.1) Rajasthan 90 East Nimar (10.4) Madhya Pradesh Patna (3.8) Bihar Azamgarh (2.1) Uttar Pradesh 91 Sitapur (10.4) Uttar Pradesh Lohardaga (3.8) Jharkhand Mau (2.1) Uttar Pradesh 92 G Buddha Nagar (10.4) Uttar Pradesh Rewa (3.8) Madhya Pradesh Kheri (2.1) Uttar Pradesh 93 Mathura (10.4) Uttar Pradesh Jhunjhunun (3.8) Rajasthan G Buddha Nagar (2.1) Uttar Pradesh 94 Bulandshahr (10.3) Uttar Pradesh Korba (3.7) Chhattisgarh Basti (2.1) Uttar Pradesh 95 Gaya (10.2) Bihar Shivpuri (3.7) Madhya Pradesh Almora (2.1) Uttarakhand 96 Jehanabad (10.2) Bihar Sheopur (3.7) Madhya Pradesh Banka (2) Bihar 97 Raipur (10.2) Chhattisgarh Jodhpur (3.7) Rajasthan Begusarai (2) Bihar 98 Bhopal (10.2) Madhya Pradesh Mathura (3.7) Uttar Pradesh Kanker (2) Chhattisgarh 99 Hamirpur (10.2) Uttar Pradesh Jamui (3.6) Bihar Janjgir-Champa (2) Chhattisgarh 100 Indore (10.1) Madhya Pradesh Muzaffarpur (3.6) Bihar Sahibganj (2) Jharkhand

High Blood Sugar Levels
��
6.6 Figure 6.1 illustrates the distribution of 100 districts from the nine States with the highest percentage of blood sugar levels. Uttar Pradesh accounts for a major share in all three categories: 24 of its districts in the
sections, indicating the lack of good health
facilities. Madhya Pradesh too has high levels of blood sugar with a majority of its districts being a part of the worst 100 districts. Uttarakhand has the lowest number of districts in all the three categories with 4 of its districts
Figure 6.1: State-wise distribution of 100 districts with highest blood sugar levels, 2014
6.3. Inter-District Disparities 6.7 Table 6.5 shows the worst 10 districts with high blood sugar levels in rural areas across the nine monitored States. The table indicates that districts from across the States have high levels of blood sugar across categories, indicating a
nation-wide policy intervention in rural areas. Neemuch in Madhya Pradesh has the highest percentage of population with blood sugar 150
Pradesh and Chittaurgarh in Rajasthan continue to top the chart in rural areas as well.
Table 6.5: List of 10 Districts with high blood sugar in rural areas, 2014
State District State District State District 1 MP Raisen (22.1) Rajasthan Chittaurgarh (10) MP Neemuch (4) 2 Rajasthan Chittaurgarh (20.2) Bihar Sheikhpura (8.7) Assam Nagaon (3.6) 3 Chhattisgarh Rajnandgaon (18.7) Chhattisgarh Rajnandgaon (7.5) Jharkhand Ranchi (3.5) 4 Uttarakhand US Nagar (17.4) UP Ghaziabad (7.4) Odisha Sambalpur (3.5) 5 Uttarakhand Champawat (16.7) Odisha Sambalpur (7.3) Uttarakhand US Nagar (3.4) 6 Jharkhand Ranchi (16.2) Assam Nagaon (7) Chhattisgarh Bilaspur (3.1) 7 Rajasthan Rajsamand (15.6) Rajasthan Banswara (6.4) Jharkhand Dhanbad (3.1) 8 MP Bhopal (15.2) UP Barabanki (6.3) UP Bijnor (3.1) 9 Assam Dhubri (15) UP Auraiya (6.2) UP Lalitpur (3) 10 Rajasthan Bhilwara (15) Bihar Bhojpur (6.1) Jharkhand Bokaro (2.9)

Annual Health Survey Report
94
6.8 Table 6.6 names the districts with the highest and lowest rate of blood sugar levels, along with the inter-district disparities. In the
blood sugar was reported from Raisen district (20.8per cent) in Madhya Pradesh, and the lowest level from Kishanganj district (1.9 per cent) in Bihar. The highest disparity was seen in Madhya Pradesh at 16.1 per centmg/dl range, the highest variation was observed in Rajasthan, with the highest prevalence being recorded from Chittaurgarh district at 10 per
cent. On the other hand, Samastipur district in Bihar did not report any cases in the category in 2014. Jharkhand recorded the highest inter-
6.1per cent, with Dhanbad recording the highest across districts in all nine States at 6.5 per cent. Contrary to it, Samastipur, Saran and Araria districts in Bihar did not report cases of blood sugar in the category, suggesting high health amenities and equal access to medical facilities for blood sugar for both males and females across these districts.
Table 6.6: District-wise disparity in district level blood sugar, 2014
District with the highest and lowest percentage of blood sugar, 2014 State Highest Lowest Range
Assam Dhubri,Sonitpur (15.3) Golaghat (3.3) 12.0 Bihar Patna (15.9) Kishanganj (1.9) 14.0 Chhattisgarh Rajnandgaon (18.2) Janjgir-Champa (5.5) 12.7 Jharkhand Ranchi (15.8) Gumla (3.6) 12.2 Madhya Pradesh Raisen (20.8) Sidhi (4.7) 16.1 Odisha Khordha (14) Sonapur (3.5) 10.5 Rajasthan Chittaurgarh (19.2) Pali (4.9) 14.3 Uttar Pradesh Barabanki (13.4) Balrampur (6.1) 7.3 Uttarakhand Udham Singh Nagar (20.3) Uttarkashi (6.1) 14.2
Assam Nagaon (7.3) Kokrajhar, Barpeta (1.2) 6.1 Bihar Sheikhpura (8.1) Samastipur (0) 8.1 Chhattisgarh Rajnandgaon (7.7) Dhamtari, Bastar (0.8) 6.9 Jharkhand Dhanbad (7.7) Gumla (0.9) 6.8 Madhya Pradesh Ujjain (6.6) Dewas (0.2) 6.4 Odisha Sambalpur (7.5) Nabarangapur (1.1) 6.4 Rajasthan Chittaurgarh (10) Dausa (1.2) 8.8 Uttar Pradesh Barabanki (6.6) Budaun (1) 5.6 Uttarakhand Udham Singh Nagar (8.5) Uttarkashi (2) 6.5
Assam Nagaon (3.5) Goalpara (0.3) 3.2 Bihar Bhojpur (3.2) Samastipur, Saran, Araria (0) 3.2 Chhattisgarh Rajnandgaon, Durg (2.6) Bastar (0.3) 2.3 Jharkhand Dhanbad (6.5) Gumla (0.4) 6.1 Madhya Pradesh Ujjain (3.5) Dewas, Jhabua (0.2) 3.3 Odisha Sambalpur (3.8) Nabarangapur (0.6) 3.2 Rajasthan Ganganagar (3) Barmer (0.6) 2.4 Uttar Pradesh Bijnor (3.3) Kannauj (0) 3.3 Uttarakhand Udham Singh Nagar (5.4) Uttarkashi (1.2) 4.2

High Blood Sugar Levels
��
6.4. Gender Differentials 6.9 The table 6.7lists State-wise gender differentials in blood sugar levels for 2014, with particular focus on rural areas. Male-female differential is considerably high in Chhattisgarh, the State also displaying higher ratio differentials in rural areas, recording figures as high as 1.31 and 1.34 in the
ranges respectively. Uttar Pradesh,
on the contrary, showed low male-female differentials
. Table 6.8 shows the number of districts with male-female ratio differentials higher than 1.2 times. While Madhya Pradesh had 23 districts with high gender differential in
(20 districts).
Table 6.7: Male-female differentials in blood sugar, 2014 State-wise comparison of blood sugar across males-females
Total Assam 1.24 1.31 1.31 Bihar 1.16 1.17 1.3 Chhattisgarh 1.33 1.42 1.27 Jharkhand 1.19 1.3 1.38 Madhya Pradesh 1.27 1.07 1 Odisha 1.18 1.23 1.41 Rajasthan 1.16 1.13 1.13 Uttar Pradesh 1.1 1.06 1.05 Uttarakhand 1.15 1.1 0.96 Rural Areas Assam 1.2 1.25 1.13 Bihar 1.18 1.14 1.22 Chhattisgarh 1.31 1.34 1.31 Jharkhand 1.22 1.32 1.38 Madhya Pradesh 1.29 1.1 1.1 Odisha 1.17 1.26 1.4 Rajasthan 1.11 1.08 1 Uttar Pradesh 1.1 1.07 0.94 Uttarakhand 1.21 1.25 1.26 Note: A male to female ratio greater than 1.2 is regarded as high male-female differential.
Table 6.8: Number of districts with high male-female ratio differential in blood sugar, 2014 State mg/dl (%) Assam 12 14 11 Bihar 14 9 9 Chhattisgarh 12 9 7 Jharkhand 10 11 12 Madhya Pradesh 23 13 13 Odisha 14 17 20 Rajasthan 14 16 14 Uttar Pradesh 21 23 19 Uttarakhand 5 6 6 Note: A male to female ratio greater than 1.2 is regarded as high male-female differential.

Annual Health Survey Report
96
Figure 6.2: Comparison of blood sugar levels across region and sex and literacy rate
6.10 Figure 6.2 provides a comparison of district level prevalence of high blood sugar levels in males and females whereby it is noted that in most of the districts prevalence of high blood sugar (levels equal to or greater than 110 mg/dl) is higher among males than females. The prevalence of high blood sugar levels in rural areas is clearly lesser when compared to the
total regions of a district. The figure also illustrates that high blood sugar levels are clearly associated with high levels of BMI (greater than 30). Districts with a higher percentage of individuals having blood sugar levels higher than 150 mg/dl also have a higher percentage of individuals with BMI higher than 30.

High Blood Sugar Levels
��
6.5. Key Findings The proportion of population suffering
of population suffering from blood sugar across all the three categories is slightly lower in the rural areas. At State level, Assam, Chhattisgarh and Uttarakhand have higher prevalence of blood
the population has blood sugar levels higher than 150mg/dl. Across the AHS States, the proportion of females suffering from blood sugar across all the three categories is lower than the proportion of males suffering from blood sugar across the same categories. Interestingly, Bihar has the lowest percentage of population sufferiand females.
Among the 100 districts with the highest percentage of blood sugar levels, Uttar Pradesh has 24
ha
(20.8 per cent) in Madhya Pradesh, while the lowest was from Kishanganj district (1.9 per cent)
highest prevalence from Chittaurgarh district at 10 per cent. Dhanbad in Jharkhand has the highest levels of blood sugar across
The high male-female differentials (male to female ratio greater than 1.2) in blood sugar indicate that males are more likely to develop blood sugar than females, across all the categories. A very high number of districts of Uttar Pradesh record a very high male-female differential. The highest number (23) of districts with male-female ratio differentials (higher than 1.2 times) exists in
Pradesh reported the highest iThere is a clear
association between high blood sugar levels and high levels of BMI (greater than 30). Districts with a higher percentage of individuals having blood sugar levels higher than 150 mg/dl also have a higher percentage of individuals with BMI higher than 30, implyinghigher risk of developing chronic ailments such as diabetes.

98
HIGH BLOOD PRESSURE LEVELS 7.1. Definition of Indicators
7.1 Hypertension or high blood pressure is a medical condition wherein blood flows through blood vessels with a force greater than normal. Over time, if untreated, it can cause health conditions, such as heart disease and stroke. In
this chapter, prevalence of high blood pressure levels are provided for persons aged 18 and above. Measure of high blood pressure is presented in three Systolic/Diastolic categories viz. above normal (>140/90 mm of Hg), moderately high (>160/100 mm of Hg), and very high (>180/110 mm of Hg).
Table 7.1: Hypertension (18 years and above (%)), 2014 State-wise prevalence of hypertension: above normal range, moderately high and very high, 2014
Above Normal Range &<90mm of Hg
<140mm of Hg & Total
1 2 3 1+2+3 Assam 9.9 7.0 5.4 22.3 Bihar 9.5 5.2 6.2 20.9 Chhattisgarh 6.1 4.8 7.4 18.3 Jharkhand 10.7 7.2 7.8 25.7 Madhya Pradesh 10.6 5.1 6.2 21.9 Odisha 8.5 6.4 5.8 20.7 Rajasthan 9.1 5.7 8.2 23.0 Uttar Pradesh 10.8 6.0 5.7 22.5 Uttarakhand 12.9 6.5 8.6 28.0
Moderately High &<100mm of Hg <160mm of Hg &
Total
Assam 2.1 2.2 2.6 6.9 Bihar 2.3 2.0 1.2 5.5 Chhattisgarh 2.1 1.8 2.9 6.8 Jharkhand 2.8 2.8 2.8 8.4 Madhya Pradesh 2.4 2.2 2.4 7.0 Odisha 2.3 2.5 2.4 7.2 Rajasthan 2.2 2.0 2.6 6.8 Uttar Pradesh 2.8 3.4 2.2 8.4 Uttarakhand 3.5 2.6 3.4 9.5
Very High &<110mm of Hg <180mm of Hg &
Total
Assam 0.5 0.6 1.3 2.4 Bihar 0.8 0.5 0.5 1.8 Chhattisgarh 0.7 0.7 1.6 3.0 Jharkhand 0.9 0.9 1.4 3.2 Madhya Pradesh 1.0 0.3 1.2 2.5 Odisha 0.6 0.8 1.3 2.7 Rajasthan 0.7 0.7 1.1 2.5 Uttar Pradesh 1.0 0.7 1.0 2.7 Uttarakhand 1.1 1.0 1.4 3.5 7.2. Levels and Patterns 7.2 Table 7.1 reports the State-wise estimates for above normal, moderately high and very high blood pressure levels. Prevalence of blood
pressure levels above normal range (for all the three categories combined) is the highest in Uttarakhand (28 per cent) followed by Jharkhand (25.7 per cent); and lowest in Chhattisgarh (18.3 per cent). Moderately high
7

High Blood Pressure Levels
��
hypertension is highest in Uttarakhand (9.5 per cent) and lowest in Bihar (5.5 per cent). Prevalence of very high blood pressure is the highest in Uttarakhand (3.5 per cent) and lowest in Bihar (1.8 per cent). 7.3 Table 7.2 reports the State-wise estimates for above normal range, moderately high and very high blood pressure levels for rural areas. Prevalence of above normal range of blood pressure is the highest in Uttarakhand (25.9 per cent) and lowest in Chhattisgarh (17.7 per cent). Moderately high hypertension in rural areas is also the highest in Uttarakhand (8.8 per cent)
and lowest inBihar (5.3 per cent). The percentage of cases with Systolic <160mm of Hg and compared to other categories of moderately high blood pressure, ranging from 3.2 per cent in case of Uttarakhand to 1.2 per cent in case of Bihar. Very high blood pressure in rural areas is the highest in Uttarakhand (3.3 per cent) and lowest in Bihar (1.7 per cent). Moreover, the percentage of cases with Systolic <180mm of
compared to other categories of very high blood pressure, ranging from 1.6 per cent in case of Chhattisgarh to 0.5 per cent in case of Bihar.
Table 7.2: Hypertension 18 years and above in rural areas (%), 2014
State-wise prevalence of hypertension in rural areas: above normal range, moderately high and very high, 2014 Above Normal Range &<90mm of Hg
<140mm of Hg & Total
Rural 1 2 3 1+2+3 Assam 9.2 6.8 5.3 21.3 Bihar 8.8 5.1 6.2 20.1 Chhattisgarh 5.9 4.5 7.3 17.7 Jharkhand 9.4 6.9 7.7 24.0 Madhya Pradesh 9.4 4.7 7.0 21.1 Odisha 8.1 6.3 5.6 20.0 Rajasthan 8.0 5.5 7.5 21.0 Uttar Pradesh 10.5 5.9 5.1 21.5 Uttarakhand 11.7 6.1 8.1 25.9
Moderately High &<100mm of Hg <160mm of Hg &
Total
Assam 2.1 2.1 2.6 6.8 Bihar 2.1 2.0 1.2 5.3 Chhattisgarh 2.0 1.7 2.8 6.5 Jharkhand 2.4 2.6 2.6 7.6 Madhya Pradesh 2.1 1.8 2.5 6.4 Odisha 2.2 2.5 2.3 7.0 Rajasthan 1.8 2.0 2.3 6.1 Uttar Pradesh 2.8 3.3 1.9 8.0 Uttarakhand 3.2 2.4 3.2 8.8
Very High &<110mm of Hg <180mm of Hg &
Total
Assam 0.5 0.6 1.3 2.4 Bihar 0.7 0.5 0.5 1.7 Chhattisgarh 0.7 0.7 1.6 3.0 Jharkhand 0.7 0.8 1.2 2.7 Madhya Pradesh 0.9 0.3 1.3 2.5 Odisha 0.6 0.8 1.2 2.6 Rajasthan 0.6 0.6 1.0 2.2 Uttar Pradesh 1.1 0.7 0.9 2.7 Uttarakhand 1.0 0.9 1.4 3.3

Annual Health Survey Report
100
Map 7.1: Percentage of population (18 years and above) with blood pressure level above normal range

High Blood Pressure Levels
1�1
Map 7.2: Percentage of rural population (18 years and above) with blood pressure above normal range

Annual Health Survey Report
102
7.4 Table 7.3 reports the State-wise estimates for above normal, moderately high and very high blood pressure prevalence for males and females. Above normal range blood pressure among both males and females is highest in Uttarakhand (33.4 and 24.3 per cent
respectively) and lowest in Chhattisgarh (19.7 and 16.8 per cent respectively). The percentage
Diastoli relatively higher as compared to other categories of above normal range blood pressure levels.
Table 7.3: Hypertension 18 years and above among males and females (%), 2014
State-wise prevalence of hypertension among male and female: above normal range, moderately high and very high Male Female Male Female Male Female Male Female
Above Normal Range
&<90mm of Hg <140mm of Hg &
Total Total
1 2 3 4 5 6 1+3+5 2+4+6 Assam 11.4 8.6 8.1 6.0 5.8 4.9 25.3 19.5 Bihar 8.2 10.6 5.5 4.9 6.8 5.6 20.5 21.1 Chhattisgarh 6.1 6.1 5.3 4.2 8.3 6.5 19.7 16.8 Jharkhand 12.5 9.3 8.1 6.5 8.8 7.1 29.4 22.9 Madhya Pradesh 10.0 11.3 5.9 4.3 7.3 5.0 23.2 20.6 Odisha 8.7 8.4 6.7 6.1 6.1 5.5 21.5 20.0 Rajasthan 10.4 8.1 6.2 5.4 9.9 6.8 26.5 20.3 Uttar Pradesh 10.5 11.0 6.7 5.4 6.2 5.3 23.4 21.7 Uttarakhand 16.0 10.8 7.6 5.8 9.8 7.7 33.4 24.3
Moderately High &<100mm of Hg <160mm of Hg &
Total Total
Assam 2.1 2.1 2.3 2.1 2.9 2.3 7.3 6.5 Bihar 1.9 2.7 2.1 1.9 1.4 1.1 5.4 5.7 Chhattisgarh 1.8 2.4 1.8 1.9 3.1 2.7 6.7 7.0 Jharkhand 3.1 2.7 3.0 2.6 3.4 2.4 9.5 7.7 Madhya Pradesh 1.9 3.0 2.7 1.8 2.7 2.1 7.3 6.9 Odisha 2.4 2.3 2.5 2.5 2.4 2.3 7.3 7.1 Rajasthan 2.2 2.2 1.9 2.1 2.8 2.4 6.9 6.7 Uttar Pradesh 2.6 3.0 3.9 3.0 2.3 2.0 8.8 8.0 Uttarakhand 4.2 3.0 2.8 2.6 4.0 2.9 11.0 8.5
Very High &<110mm of Hg <180mm of Hg &
Total Total
Assam 0.5 0.5 0.6 0.6 1.3 1.2 2.4 2.3 Bihar 0.5 1.1 0.5 0.5 0.6 0.5 1.6 2.1 Chhattisgarh 0.6 0.8 0.5 0.9 1.6 1.6 2.7 3.3 Jharkhand 0.9 0.8 0.9 0.8 1.5 1.3 3.3 2.9 Madhya Pradesh 0.6 1.5 0.2 0.3 1.2 1.1 2.0 2.9 Odisha 0.6 0.6 0.8 0.8 1.3 1.3 2.7 2.7 Rajasthan 0.7 0.7 0.6 0.7 1.2 1.1 2.5 2.5 Uttar Pradesh 0.8 1.2 0.5 0.8 1.0 1.0 2.3 3.0 Uttarakhand 1.3 0.9 0.8 1.1 1.8 1.2 3.9 3.2 7.5 Level of moderately high blood pressure among males and females are the highest in Uttarakhand (11 per cent and 8.5 per cent respectively). Levels of very high blood pressure among males and females areagain
noted to be the highest in Uttarakhand (3.9 per cent and 3.2 per cent respectively). The percentage of cases with Systolic <180mm of Hg and of Hg is higher as compared to other categories.

High Blood Pressure Levels
1��
Map 7.3: Percentage of males (18 years and above) with blood pressure above normal range

Annual Health Survey Report
104
Map 7.4: Percentage of females (18 years and above) with blood pressure above normal range

High Blood Pressure Levels
1��
7.6 Table 7.4 lists the 100 districts with the highest percentage of cases with above normal range blood pressure levels. It can be observed that apart from forming a major share in the list
of 100 districts, Uttar Pradesh has most of its districts towards the top of the list. Rajnandgaon (25.6) is the only district from Chhattisgarh to be part of the list.
Table 7.4: List of 100 districts with highest above normal range blood pressure level, 2014
Total Rural No. State District State District 1 Assam North Cachar Hills (41.2) Assam North Cachar Hills (45.2) 2 Uttarakhand Pithoragarh (40.84) Uttarakhand Pithoragarh (41.36) 3 Odisha Kendujhar (39.6) Odisha Kendujhar (40) 4 Uttar Pradesh Ghazipur (36.7) Uttar Pradesh Ghazipur (36.8) 5 Uttar Pradesh Siddharthanagar (36.6) Uttar Pradesh Siddharthanagar (36.6) 6 Jharkhand PaschimiSinghbum (34.5) Uttarakhand Udham Singh Nagar (36.4) 7 Uttarakhand Nainital (34.19) Jharkhand PaschimiSinghbum (35.3) 8 Uttarakhand Bageshwar (34.08) Uttarakhand Bageshwar (33.82) 9 Odisha Sundargarh (34) Jharkhand Godda (33.2) 10 Uttarakhand Udham Singh Nagar (33.4) Assam KarbiAnglong (32.5) 11 Assam KarbiAnglong (33.1) Jharkhand Dumka (32.1) 12 Jharkhand Godda (33) Assam Jorhat (31.8) 13 Jharkhand Dhanbad (32.5) Odisha Sundargarh (31.8) 14 Assam Jorhat (32) Uttar Pradesh Jaunpur (31.2) 15 Jharkhand Dumka (32) Jharkhand Dhanbad (31.1) 16 Uttar Pradesh Gorakhpur (31.8) Jharkhand Garhwa (30.6) 17 Uttar Pradesh Jaunpur (31.6) Rajasthan Jodhpur (30.5) 18 Assam Dibrugarh (31.5) Jharkhand Pakaur (30.4) 19 Rajasthan Chittaurgarh (31.5) Uttar Pradesh Unnao (30.3) 20 Rajasthan Churu (31.4) Rajasthan Churu (30.1) 21 Jharkhand Garhwa (31.2) Uttar Pradesh Mau (30) 22 Jharkhand Pakaur (30.8) Assam Sibsagar (29.2) 23 Uttarakhand Champawat (30.5) Rajasthan Chittaurgarh (29.2) 24 Rajasthan Jodhpur (30.2) Uttarakhand Almora (29.19) 25 Uttarakhand Almora (30.18) Uttar Pradesh Lalitpur (29) 26 Rajasthan Jaipur (30) Bihar Sheohar (28.7) 27 Uttarakhand Dehradun (30) Rajasthan Ganganagar (28.7) 28 Bihar Munger (29.6) Madhya Pradesh Bhopal (28.7) 29 Uttar Pradesh Unnao (29.6) Bihar Nawada (28.5) 30 Uttar Pradesh Jalaun (29.2) Uttar Pradesh Azamgarh (28.4) 31 Uttar Pradesh Lalitpur (29.2) Madhya Pradesh Bhind (28.2) 32 Uttar Pradesh Chitrakoot (29.1) Madhya Pradesh Sehore (27.9) 33 Uttar Pradesh Kanpur Nagar (29.1) Uttar Pradesh Chandauli (27.8) 34 Bihar Sheohar (28.9) Assam Dibrugarh (27.7) 35 Madhya Pradesh West Nimar (28.9) Uttar Pradesh Aligarh (27.5) 36 Assam Sibsagar (28.8) Uttar Pradesh Farrukhabad (27.5) 37 Uttar Pradesh Mau (28.7) Uttarakhand Nainital (27.42) 38 Uttar Pradesh Azamgarh (28.5) Odisha Kendrapara (27.4) 39 Uttar Pradesh Jhansi (28.4) Uttar Pradesh Kanpur Dehat (27.3) 40 Jharkhand PurbiSinghbum (28.3) Madhya Pradesh Indore (27.3) 41 Bihar Nawada (28.2) Madhya Pradesh Jhabua (27.2) 42 Uttar Pradesh Sultanpur (28.1) Uttar Pradesh Hamirpur (27.1) 43 Madhya Pradesh Sehore (27.7) Madhya Pradesh West Nimar (26.9) 44 Madhya Pradesh Ratlam (27.5) Uttar Pradesh Jalaun (26.9) 45 Rajasthan Ganganagar (27.5) Bihar Munger (26.7) 46 Bihar Patna (27.4) Madhya Pradesh Ratlam (26.6) 47 Odisha Kendrapara (27.3) Uttar Pradesh Gonda (26.6)

Annual Health Survey Report
106
Total Rural No. State District State District 48 Uttar Pradesh Bijnor (27.3) Uttar Pradesh Etawah (26.4) 49 Rajasthan Bikaner (27.1) Uttar Pradesh Gorakhpur (26.4) 50 Uttar Pradesh Gonda (27.1) Rajasthan Bikaner (26.2) 51 Uttar Pradesh Lucknow (27) Madhya Pradesh Shajapur (26.1) 52 Bihar Rohtas (26.9) Bihar Sitamarhi (26) 53 Jharkhand Gumla (26.9) Jharkhand Gumla (26) 54 Madhya Pradesh Gwalior (26.9) Bihar Nalanda (25.8) 55 Uttar Pradesh Etawah (26.9) Jharkhand PurbiSinghbum (25.7) 56 Madhya Pradesh Barwani (26.8) Rajasthan Pali (25.7) 57 Uttar Pradesh Auraiya (26.8) Uttar Pradesh Auraiya (25.7) 58 Uttar Pradesh Kanpur Dehat (26.7) Rajasthan Sikar (25.6) 59 Uttar Pradesh Chandauli (26.7) Bihar Rohtas (25.5) 60 Uttar Pradesh Aligarh (26.6) Madhya Pradesh East Nimar (25.5) 61 Madhya Pradesh Bhopal (26.6) Madhya Pradesh Shivpuri (25.5) 62 Uttar Pradesh Farrukhabad (26.6) Assam Tinsukia (25.3) 63 Rajasthan Pali (26.4) Madhya Pradesh Dewas (25.3) 64 Madhya Pradesh Jhabua (26.4) Uttar Pradesh Chitrakoot (25.3) 65 Madhya Pradesh Shivpuri (26.2) Uttar Pradesh Kheri (25.3) 66 Bihar Sitamarhi (26) Chhattisgarh Rajnandgaon (25.2) 67 Madhya Pradesh Shajapur (26) Rajasthan Rajsamand (25.2) 68 Uttarakhand Haridwar (25.96) Uttar Pradesh Rae Bareli (25.2) 69 Madhya Pradesh East Nimar (25.9) Uttarakhand Dehradun (25.16) 70 Rajasthan Rajsamand (25.9) Bihar Patna (25.1) 71 Uttar Pradesh Hamirpur (25.9) Jharkhand Sahibganj (25.1) 72 Assam Tinsukia (25.8) Uttar Pradesh Bijnor (25.1) 73 Madhya Pradesh Ujjain (25.8) Uttar Pradesh Kanpur Nagar (25) 74 Madhya Pradesh Dewas (25.8) Assam Nalbari (24.8) 75 Bihar Sheikhpura (25.8) Uttar Pradesh Bahraich (24.8) 76 Rajasthan Hanumangarh (25.8) Uttar Pradesh Basti (24.6) 77 Rajasthan Jaisalmer (25.7) Odisha Mayurbhanj (24.5) 78 Chhattisgarh Rajnandgaon (25.6) Bihar Jehanabad (24.4) 79 Madhya Pradesh Dhar (25.6) Uttar Pradesh Hardoi (24.2) 80 Rajasthan Sikar (25.6) Uttar Pradesh Mahoba (24.2) 81 Bihar Bhojpur (25.4) Assam Kokrajhar (24.1) 82 Madhya Pradesh Mandsaur (25.4) Bihar Banka (24.1) 83 Madhya Pradesh Bhind (25.3) Bihar Bhojpur (24) 84 Jharkhand Sahibganj (25.3) Uttar Pradesh Lucknow (24) 85 Uttar Pradesh Mahoba (25.2) Uttar Pradesh Barabanki (24) 86 Assam Nalbari (25.1) Bihar PashchimChamparan (23.8) 87 Uttar Pradesh Basti (25.1) Madhya Pradesh Barwani (23.8) 88 Uttar Pradesh Bahraich (25) Assam Lakhimpur (23.7) 89 Uttar Pradesh Barabanki (24.9) Bihar Jamui (23.6) 90 Assam Lakhimpur (24.9) Bihar Kaimur (Bhabhua) (23.6) 91 Uttar Pradesh Hardoi (24.8) Madhya Pradesh Mandsaur (23.4) 92 Uttar Pradesh Kheri (24.8) Assam Karimganj (23.3) 93 Bihar Banka (24.6) Madhya Pradesh Ujjain (23.3) 94 Bihar Jehanabad (24.6) Odisha Nayagarh (23.2) 95 Uttar Pradesh Rae Bareli (24.6) Rajasthan Nagaur (23.2) 96 Assam Kokrajhar (24.4) Rajasthan Hanumangarh (23.2) 97 Bihar Nalanda (24.4) Madhya Pradesh Dindori (23.1) 98 Jharkhand Bokaro (24.3) Rajasthan Jhunjhunun (23.1) 99 Rajasthan Jhunjhunun (24.2) Bihar Purnia (23) 100 Assam Karimganj (24.1) Bihar Sheikhpura (22.9)

High Blood Pressure Levels
1��
7.3. Inter-District Disparities 7.7 Table 7.5 reports the coefficient of variation (CV) for districtsin case of above normal range hypertension for the year 2014. The CV considers the distance of each district from the overall average and is a simple indicator withhigher values of CV revealing higher regional disparities and vice versa. The CV
values for 2014 suggest that Odisha has the highest inter-district variations in above normal range hypertension (CV 0.33) followed by Assam (0.32). Assam (0.36) and Odisha (0.34) have the highest CV values for this indicator in rural areas during 2014. On the other hand, lowest CV has been observed for Madhya Pradesh at the State level (0.21) as well as for rural areas (0.22).
Table 7.5: Coefficient of variation of district level above normal range hypertension in each State, 2014
State Total Rural Assam 0.32 0.36 Bihar 0.25 0.24 Chhattisgarh 0.26 0.26 Jharkhand 0.23 0.27 Madhya Pradesh 0.21 0.22 Odisha 0.33 0.34 Rajasthan 0.22 0.24 Uttar Pradesh 0.29 0.32 Uttarakhand 0.24 0.29 7.8 Table 7.6 reports the coefficient of variation (CV) for districts in case of above normal range hypertension for the year 2014 among both males and females. The CV values for 2014 suggest that Odisha has the highest inter-district variations in this case among males (CV 0.36)
followed by Assam (0.35). Bihar has the highest CV value (0.34) among females during 2014, followed by Odisha (0.31). On the other hand, Uttarakhand and Chhattisgarh report the lowest CV (0.20) among males and Rajasthan (0.22) among females.
Table 7.6: Coefficient of variation of district level above normal range hypertension among male-female in
each State, 2014 State Male Female Assam 0.35 0.30 Bihar 0.24 0.34 Chhattisgarh 0.20 0.28 Jharkhand 0.22 0.25 Madhya Pradesh 0.24 0.27 Odisha 0.36 0.31 Rajasthan 0.25 0.22 Uttar Pradesh 0.33 0.29 Uttarakhand 0.20 0.28

Annual Health Survey Report
108
7.9 Table 7.7 lists the names of the districts with highest and lowest above normal range blood pressure levels in States and respective rural areas during 2014. The North Cachar Hills district in Assam (41.2 per cent) and Kishanganj district in Bihar (7.2 per cent) have the highest and lowest percentage respectively of above normal range blood pressure levels. Likewise, the North Cachar Hills district in Assam (45.2 per cent) and Jashpur (9.2 per cent) of Chhattisgarh areestimated to have the highest
and lowest percentageof above normal range hypertension in rural areas, respectively.The State-wise range between the districts with highest and lowest percentage of above normal range hypertension has also been presented. At the State level, highest range has been observed in case of Assam (29.1) and lowest in case of Chhattisgarh (16.2). In the rural areas, highest range has been observed in case of Assam (33.7) and lowest in case of Madhya Pradesh (15.6).
Table 7.7: District-wise disparity in above normal range hypertension, 2014
District with the highest and lowest percentage of above normal range hypertension, 2014
State Total Rural
Highest Lowest Range Highest Lowest Range
Assam North Cachar Hills (41.2) Sonitpur (12.1) 29.1 North Cachar Hills (45.2) Sonitpur (11.5) 33.7
Bihar Munger (29.6) Kishanganj (7.2) 22.4 Sheohar (28.7) Kishanganj (6.6) 22.1
Chhattisgarh Rajnandgaon (25.6) Jashpur (9.4) 16.2 Rajnandgaon (25.2) Jashpur (9.2) 16.0
Jharkhand PaschimiSinghbum (34.5) Giridh (17.7) 16.8 PaschimiSinghbum (35.3) Kodarma (16.3) 19.0
Madhya Pradesh West Nimar (28.9) Panna (13) 15.9 Bhopal (28.7) Panna (13.1) 15.6
Odisha Kendujhar (39.6) Nuapada (9.8) 29.8 Kendujhar (40) Nuapada (9.3) 30.7
Rajasthan Chittaurgarh (31.5) Dausa (11.6) 19.9 Jodhpur (30.5) Karauli (10.6) 19.9
Uttar Pradesh Ghazipur (36.7) Muzzafarnagar (9.1) 27.6 Ghazipur (36.8) Firozabad (8.2) 28.6
Uttarakhand Pithoragarh (40.8) Uttarkashi (17.8) 23.0 Pithoragarh (41.4) Uttarkashi (17.5) 23.9
7.4. Associations 7.10 The figure 7.1 shows the prevalence of blood pressure levels of systolic higher than 140 mm of Hg and diastolic greater than 90 mm of Hg amongtotal and rural populations. It clearly shows the higher prevalence in total population when compared with rural population, indicating that hypertension is a greater matter of concern in urban rather than rural areas. The prevalence in males and females were observed to be similar. The association of high blood pressure with high levels of BMI and literacy rate is not clear. Districts with high levels of
overall literacy rate could have very different percentages of individuals with hypertension. 7.11 Figure 7.2 shows the association of district level prevalence of high blood pressure with instances of chronic illness. There are many districts with a high prevalence of hypertension but low prevalence of chronic illness. Hypertension being one of the chronic illnesses, this show that these districts have much higher instances of hypertension than any other chronic illness. These districts therefore require specific policy interventions to curb high levels of hypertension.

High Blood Pressure Levels
1��
Figure 7.1: Comparison of Blood pressure across region and sex and association with blood pressure and
literacy rate.
Figure 7.2: Comparison of Blood pressure with chronic illness and iodine content.

Annual Health Survey Report
110
7.5. Key Findings The percentage of population (aged 18 years and above) suffering from above normal blood
pressure is relatively higher than proportion of population suffering from moderately high and very high level of blood pressure. Percentage of population suffering from high blood pressure across all the three categories is the highest in Uttarakhand, while comparatively lower proportion of population from Bihar report the problem of high blood pressure both at State level as well as in rural areas.
The percentage of male population (aged 18 years and above) suffering from above normal blood pressure is relatively higher than proportion of female population suffering from the same condition. But, this trend is not replicated across moderately high and very high categories of blood pressure. Notably, the proportion of males suffering from high blood pressure across Uttarakhand is comparatively higher than other AHS States. Also the coefficient of variation of district for above normal range hypertension is lower for Uttarakhand as compared to other AHS States implying that the problem of normal range hypertension is present uniformly across its districts.
The coefficient of variation of district level above normal range hypertension is higher for rural areas as compared to State level (rural and urban combined), except for Bihar. It implies that certain districts in rural areas are having higher instances of above normal range hypertension. North Cachar Hills (41.2 per cent) district in Assam and Kishanganj (7.2 per cent) district in Bihar have the highest and lowest percentages respectively of above normal range hypertension. Likewise, North Cachar Hills district in Assam (45.2 per cent) and Jashpur (9.2 per cent) of Chhattisgarh were estimated to have the highest and lowest percentages respectively of above normal range hypertension in rural areas.

111
CHILD NUTRITIONAL DEPRIVATION INDEX 8.1 This chapter presents a multidimensional child nutritional deprivation index to ascertain the relative positions of the AHS districts in overall performance in child nutrition. The index uses a total of five important indicators to capture the nutritional deprivation among children aged below 5 years. The index is based on a simple aggregation of the normalized indicators with equal weights being provided to each indicator and each dimension. The results focus on overall performance and the concentration of worst performing districts. 8.1. Definition of Indicators 8.2 The three standard anthropometric measures used to assess the nutritional status of children are stunting (low height-for-age), wasting (low weight-for-height) and underweight (low weight-for-age). Stunting is an indicator of chronic undernutrition or the result of prolonged food deprivation and/or disease or illness; wasting is an indicator of acute undernutrition, the result of more recent food deprivation or illness; underweight is used as a composite indicator to reflect both acute and chronic undernutrition, although it cannot distinguish between them. A child is considered stunted, wasted or underweight if it falls two standard deviations below the median score for children of the same age and gender in the reference population. The median score of the reference population is based on an internationallyaccepted World Health Organization Child Growth Standards. Levels of undernutrition (below 2SD and 3SD) are also included. 8.3 Anaemia is a disorder in which the number of red blood cells or their oxygen-carrying
capacity is insufficient for physiological. Data for children aged between 6 to 59 months have been used to create the index. 8.2. Methodology 8.4 The child nutritional deprivation index has been designed to provide a summary measure of nutritional deprivation among children aged below 5 years and to draw attention towards the worst performing districts where such deprivations are higher. The index summarizes the deprivation score in each of the dimensions using a simple aggregation procedure. The districts are considered as the units of analysis. For each district and for each indicator the deprivation score is defined in relation to a normative benchmark of deprivation. The indicators are then normalized accordingly with a deprivation value of 0 being provided to the normative best level and a value of 1 being provided to the normative worst level. Using the normative criterion, the normalized score for each indicator is computed using the following method: Normalized score for ith district and jth indicator, Iij = Dij/Dmaxj. Here, Dmaxj is the highest value for jth indicator across all districts. Finally, the nutrition index for the ith district is computed as follows; 8.5 Ò«¬®·¬·±² ײ¼»¨· ã ©
ë¶ãï ·
8.6 Where, wj is the weight presented to the jth indicator and Iij is the normalized score of the jth indicator for the ith district. 8.3. Levels and Patterns 8.7 Table 8.1presents the districts of the nine AHS States with the highest and lowest child
8

Annual Health Survey Report
112
nutritional deprivation index values. Various indicators determining child nutrition like stunting, wasting, under-weight, under-nutrition and anaemia were taken into consideration in order to ascertain nutritional deprivation. The stark inter-district divide has been enumerated in the table with the maximum difference being seen in Odisha at 0.455 followed by Bihar at
0.39, and the minimum in Jharkhand at 0.192followed by Uttarakhand at 0.20. Deplorable medical conditions for children lead to nutritional deprivations across the country and the data thus points to a need for policy interventions to curb such deprivations. A mechanism for early detection also helps in minimising the severity of cases.
Table 8.1: Districts with highest and lowest nutritional deprivationindex value across AHS States
State-wise comparison of the districts with the highest and lowest score on the nutrition deprivation index in 2014 State Highest Deprivation Lowest Deprivation Assam 0.708 Nagaon 0.401 Kamrup Bihar 0.906 Jamui 0.512 Purnia Chhattisgarh 0.716 Rajnandgaon 0.484 Surguja Jharkhand 0.796 Paschimi Singhbum 0.604 Dhanbad Madhya Pradesh 0.816 Dindori 0.464 Satna Odisha 0.835 Malkanagiri 0.38 Jajapur Rajasthan 0.776 Dhaulpur 0.504 Sawai Madhopur Uttar Pradesh 0.879 Rae Bareli 0.491 Jaunpur Uttarakhand 0.644 Champawat 0.443 Dehradun 8.8 Table 8.2 ranks the 10 best and worst performing districts in the nutritional deprivation index. Odisha and Assam accounted for the maximum districts in the list of 10 best performing districts with Jajapur in Odisha having the lowest rate of nutritional deprivation
index value at 0.38. A majority of the 10 worst performing districts are from Bihar and Uttar Pradesh, with Jamui district in Bihar recording the highest nutritional deprivation across the States at 0.906, followed by Munger district of Bihar at .0886.
Table 8.2: List of 10 best and worst districts on nutritional deprivation Index
Best 10 districts Worst 10 districts S.No State District State District 1 Odisha 0.38, Jajapur Bihar 0.906, Jamui 2 Assam 0.401, Kamrup Bihar 0.886, Munger 3 Assam 0.403, Nalbari Uttar Pradesh 0.879, Rae Bareli 4 Odisha 0.435, Kendrapara Uttar Pradesh 0.852, Gonda 5 Assam 0.437, Kokrajhar Uttar Pradesh 0.85, Farrukhabad 6 Odisha 0.441, Jagatsinghapur Bihar 0.843, Aurangabad 7 Odisha 0.442, Dhenkanal Uttar Pradesh 0.836, Kheri 8 Uttarakhand 0.443, Dehradun Odisha 0.835, Malkanagiri 9 Assam 0.453, Sibsagar Uttar Pradesh 0.831, Barabanki 10 Odisha 0.454, Cuttack Bihar 0.83, Rohtas

Child Nutritional Deprivation Index
11�
Map 8.1: Child nutritional deprivation index acrossAHS states (district wise)

Annual Health Survey Report
114
Table 8.3: Ranking of AHS Districts on Child Nutritional deprivation Index (CNDI) State District CNDI Value Rank State District CNDI Value Rank Odisha Jajapur 0.38 1 MP Rajgarh 0.54 47 Assam Kamrup 0.401 2 Uttarakhand Bageshwar 0.54 48 Assam Nalbari 0.403 3 Odisha Bhadrak 0.545 49 Odisha Kendrapara 0.435 4 MP Betul 0.546 50 Assam Kokrajhar 0.437 5 Bihar Kaimur (Bhabhua) 0.546 51 Odisha Jagatsinghapur 0.441 6 UP Azamgarh 0.547 52 Odisha Dhenkanal 0.442 7 Assam Sonitpur 0.548 53 Uttarakhand Dehradun 0.443 8 Odisha Kandhamal 0.55 54 Assam Sibsagar 0.453 9 Bihar Kishanganj 0.551 55 Odisha Cuttack 0.454 10 Rajasthan Jodhpur 0.551 56 MP Satna 0.464 11 Rajasthan Sikar 0.552 57 Uttarakhand Pithoragarh 0.468 12 Odisha Puri 0.552 58 Assam Dhemaji 0.468 13 UP Deoria 0.553 59 MP Sidhi 0.469 14 Bihar Katihar 0.553 60 Odisha Nayagarh 0.477 15 UP Gorakhpur 0.553 61 MP Narsinghapur 0.477 16 MP Shajapur 0.554 62 MP East Nimar 0.479 17 Chhattisgarh Korba 0.562 63 Assam Jorhat 0.481 18 Rajasthan Nagaur 0.564 64 Odisha Khordha 0.482 19 Odisha Sundargarh 0.564 65 Chhattisgarh Surguja 0.484 20 Chhattisgarh Janjgir-Champa 0.565 66 Assam Dibrugarh 0.489 21 MP Chhindwara 0.566 67 MP Shahdol 0.49 22 MP Sehore 0.567 68 UP Jaunpur 0.491 23 Chhattisgarh Koriya 0.568 69 MP Guna 0.493 24 Uttarakhand Pauri Garhwal 0.571 70 Odisha Anugul 0.5 25 MP Indore 0.572 71 Chhattisgarh Dantewada 0.501 26 Uttarakhand Uttarkashi 0.572 72 MP Rewa 0.502 27 Chhattisgarh Bastar 0.573 73 Rajasthan Sawai Madhopur 0.504 28 Rajasthan Churu 0.574 74 Assam Karbi Anglong 0.506 29 Assam North Cachar Hills 0.576 75 Bihar Purnia 0.512 30 MP Morena 0.577 76 Chhattisgarh Kanker 0.52 31 Bihar Patna 0.578 77 Uttarakhand Nainital 0.52 32 UP Fatehpur 0.579 78 MP Damoh 0.521 33 Odisha Jharsuguda 0.579 79 Bihar Madhubani 0.523 34 Odisha Mayurbhanj 0.581 80 Rajasthan Jaipur 0.524 35 Uttarakhand Udham Singh Nagar 0.584 81 UP Muzaffarnagar 0.525 36 Rajasthan Alwar 0.585 82 MP Jhabua 0.529 37 Assam Lakhimpur 0.587 83 Rajasthan Ganganagar 0.531 38 Chhattisgarh Dhamtari 0.588 84 Rajasthan Dausa 0.532 39 Assam Darrang 0.588 85 Bihar Samastipur 0.533 40 Odisha Ganjam 0.588 86 Rajasthan Bikaner 0.535 41 Chhattisgarh Durg 0.589 87 Bihar Sheohar 0.535 42 UP Ghazipur 0.589 88 Bihar Muzaffarpur 0.536 43 UP Chitrakoot 0.589 89 Rajasthan Hanumangarh 0.538 44 MP Shivpuri 0.59 90 UP Ghaziabad 0.539 45 Rajasthan Jaisalmer 0.592 91 Chhattisgarh Jashpur 0.54 46 Assam Karimganj 0.593 92

Child Nutritional Deprivation Index
11�
State District CNDI Value Rank State District CNDI
Value Rank
Assam Golaghat 0.594 93 Rajasthan Karauli 0.642 139 Bihar Khagaria 0.594 94 UP Siddharthanagar 0.642 140 UP Chandauli 0.594 95 Rajasthan Bundi 0.642 141 UP Banda 0.594 96 MP Sheopur 0.642 142 Bihar Vaishali 0.598 97 Jharkhand Kodarma 0.642 143 Rajasthan Ajmer 0.598 98 Jharkhand Hazaribagh 0.642 144 Bihar Saran 0.599 99 Rajasthan Jhalawar 0.643 145 Bihar Siwan 0.601 100 Uttarakhand Champawat 0.644 146 MP Balaghat 0.602 101 UP Meerut 0.644 147 Uttarakhand Haridwar 0.602 102 Jharkhand Lohardaga 0.644 148 MP Bhopal 0.603 103 MP Panna 0.645 149 Jharkhand Dhanbad 0.604 104 Rajasthan Rajsamand 0.646 150 Rajasthan Udaipur 0.606 105 UP Bareilly 0.646 151 UP Aligarh 0.606 106 Odisha Sambalpur 0.648 152 Odisha Sonapur 0.607 107 UP Bijnor 0.649 153 MP Gwalior 0.608 108 Rajasthan Chittaurgarh 0.651 154 Chhattisgarh Mahasamund 0.612 109 UP Pratapgarh 0.651 155 Bihar Sitamarhi 0.613 110 Jharkhand Deoghar 0.652 156 UP Shahjahanpur 0.613 111 Rajasthan Dungarpur 0.653 157 Jharkhand Ranchi 0.613 112 Odisha Gajapati 0.655 158 Rajasthan Jhunjhunun 0.614 113 UP Kushinagar 0.656 159 MP Bhind 0.615 114 Odisha Koraput 0.658 160 Odisha Baleshwar 0.615 115 Rajasthan Kota 0.658 161 Assam Hailakandi 0.616 116 Bihar Gopalganj 0.658 162 Assam Cachar 0.619 117 UP Kannauj 0.66 163 Uttarakhand Almora 0.619 118 Bihar Supaul 0.661 164 Jharkhand Bokaro 0.621 119 Rajasthan Barmer 0.661 165 UP Etawah 0.621 120 Rajasthan Bhilwara 0.663 166 Odisha Nuapada 0.624 121 UP Baghpat 0.663 167 Jharkhand Godda 0.626 122 UP Sitapur 0.666 168 UP Varanasi 0.627 123 Odisha Bargarh 0.667 169 UP Lalitpur 0.628 124 Rajasthan Baran 0.667 170 Jharkhand Dumka 0.629 125 Odisha Debagarh 0.668 171 MP Harda 0.631 126 Bihar Bhojpur 0.669 172 MP Dhar 0.632 127 Jharkhand Palamu 0.67 173 Jharkhand Sahibganj 0.633 128 Rajasthan Tonk 0.67 174 Uttarakhand Tehri Garhwal 0.634 129 Bihar Madhepura 0.671 175 Assam Tinsukia 0.635 130 Chhattisgarh Kawardha 0.671 176 Bihar Purba Champaram 0.637 131 MP Dewas 0.673 177 UP Auraiya 0.637 132 UP Jalaun 0.674 178 Jharkhand Purbi Singhbum 0.638 133 UP Gautam Buddha Nagar 0.676 179 Rajasthan Bharatpur 0.638 134 UP Kanpur Nagar 0.677 180 UP Basti 0.639 135 UP Saharanpur 0.678 181 Chhattisgarh Raigarh 0.64 136 UP Pilibhit 0.679 182 UP Ballia 0.64 137 Chhattisgarh Bilaspur 0.68 183 UP Moradabad 0.641 138 UP Sant Kabir Nagar 0.682 184

Annual Health Survey Report
116
State District CNDI Value Rank State District CNDI
Value Rank
MP Mandsaur 0.683 185 UP Allahabad 0.733 230 MP Umaria 0.683 186 UP Kaushambi 0.733 231 Bihar Begusarai 0.683 187 MP Katni 0.733 232 Bihar Jehanabad 0.685 188 Rajasthan Jalore 0.734 233 UP Bulandshahr 0.688 189 Odisha Rayagada 0.736 234 MP Sagar 0.691 190 UP Agra 0.737 235 Odisha Kendujhar 0.692 191 UP Sonbhadra 0.741 236 Bihar Pashchim Champaran 0.692 192 Odisha Nabarangapur 0.742 237 Odisha Baudh 0.694 193 UP Rampur 0.75 238 UP Budaun 0.695 194 Jharkhand Gumla 0.751 239 Bihar Buxar 0.695 195 MP Tikamgarh 0.753 240 UP Jyotiba Phule Nagar 0.696 196 UP Kanpur Dehat 0.756 241 Bihar Saharsa 0.698 197 UP Mirzapur 0.757 242 Bihar Darbhanga 0.699 198 Bihar Sheikhpura 0.757 243 Odisha Kalahandi 0.7 199 Bihar Gaya 0.76 244 MP Ujjain 0.7 200 Bihar Nawada 0.764 245 Jharkhand Pakaur 0.701 201 Bihar Nalanda 0.766 246 Rajasthan Sirohi 0.702 202 UP Maharajganj 0.768 247 MP Mandla 0.703 203 UP Lucknow 0.768 248 MP Chhatarpur 0.705 204 UP Mau 0.774 249 Bihar Araria 0.705 205 Rajasthan Dhaulpur 0.776 250 UP Hardoi 0.706 206 UP Jhansi 0.776 251 Bihar Lakhisarai 0.708 207 UP Balrampur 0.778 252 Assam Nagaon 0.708 208 Bihar Banka 0.779 253 Chhattisgarh Raipur 0.708 209 MP Raisen 0.786 254 UP Ambedkar Nagar 0.711 210 Jharkhand Giridih 0.791 255 UP Unnao 0.712 211 Jharkhand Paschimi Singhbum 0.796 256 UP Faizabad 0.712 212 UP Hathras 0.806 257 UP Firozabad 0.713 213 MP Datia 0.809 258 MP Hoshangabad 0.714 214 UP Shrawasti 0.813 259 MP Ratlam 0.716 215 MP Jabalpur 0.814 260 Chhattisgarh Rajnandgaon 0.716 216 MP Dindori 0.816 261 Jharkhand Garhwa 0.718 217 UP Bahraich 0.822 262 MP Vidisha 0.719 218 UP Hamirpur 0.824 263 Rajasthan Pali 0.72 219 UP Sultanpur 0.83 264 Rajasthan Banswara 0.722 220 Bihar Rohtas 0.83 265 Jharkhand Chatara 0.722 221 UP Barabanki 0.831 266 MP West Nimar 0.724 222 Odisha Malkanagiri 0.835 267 UP Sant Ravidas Nagar 0.726 223 UP Kheri 0.836 268 UP Mathura 0.726 224 Bihar Aurangabad 0.843 269 MP Seoni 0.728 225 UP Farrukhabad 0.85 270 Odisha Balangir 0.73 226 UP Gonda 0.852 271 UP Mainpuri 0.731 227 UP Rae Bareli 0.879 272 UP Etah 0.731 228 Bihar Munger 0.886 273 Bihar Bhagalpur 0.731 229 Bihar Jamui 0.906 274

Child Nutritional Deprivation Index
11�
8.9 Figure 8.1 presents the worst 100 districts on nutritional deprivation index. Uttar Pradesh, Bihar and Madhya Pradesh have 40, 19 and 18 districts respectivelyamong the worst 100 in case of the child nutritional deprivation index. None of the districts of Uttarakhand feature in
the list, meaning that ithas no district with very high child nutritional deprivation. Districts in Assam and Chhattisgarh also perform well in child nutrition with only 1 district from Assam and 4 from Chhattisgarh having high levels on the deprivation index.
Figure 8.1: State-wise distribution of worst 100 districts onnutritional deprivationIndex
8.10 Overall, it is noted that the child nutritional deprivation index is positively associated with the prevalence of stunting, wasting, undernourished and underweight in children. 8.4. Association with Developmental Indicators 8.11 Figure 8.2denotes the relation between the district level child nutrition deprivation index anddistrict level prevalence of low birth weight outcomes (below 2.5kg). Though a slight positive curve can be noticed indicating a direct relation between the two indicators, the figure fails to show a conclusive picture of the association. In a few districts, higher intake of IFA supplements is associated with lower
scores on child nutritional deprivation index but the relation between the two is not significant. 8.12 The association of child nutritional deprivation index with IMR and UFMR reveals that child mortality rates are higher in districts with higher levels of nutritional deprivation. Also there is a negative association between children breastfed within an hour of birth and child nutrition deprivation index, indicating that the districts having higher cases of children being breastfed within the first hour of birth also have high child nutrition rates. A negative relation can also be observed between the child nutrition deprivation index and children who received full immunization, indicating that areas in which children received full immunization had lower levels of child nutrition deprivation.

Annual Health Survey Report
118
Figure 8.2: Association of Child Nutrition deprivation index with maternal and child health indicators

Child Nutritional Deprivation Index
11�
8.5. Key Findings Districts from Odisha and Assam have the lowest scores on the child nutritional deprivation
index, with Jajapur in Odisha having the lowest rate of nutritional deprivation at 0.38.Most of the worst performing districts are from Bihar and Uttar Pradesh with Jamui district in Bihar having the highest value on the nutritional deprivation index.
Odisha and Assam recorded the maximum districts in the list of 10 best performing districts
in case of child nutritional deprivation, across the nine States. A majority of the 10 worst performing districts on the other hand were from Bihar and Uttar Pradesh, showing need for effective interventions to improve the levels of child nutrition.
Among the worst 100 districts onthe list of child nutritional deprivation index, Uttar Pradesh,
Bihar and Madhya Pradesh had 40,19 and 18 districts respectively with high levels of child deprivation. No district from Uttarakhand featured in the list with the Statenot having districts with very high child nutritional deprivation. Districts in Assam and Chhattisgarh also performedrelatively better as only 1 district fromAssam and 4 fromChhattisgarh recordedhigh levels on the index.
The child nutritional deprivation index is positively associated with the prevalence of
stunting, wasting, undernourished and underweight in children. Districts with a high percentage of children born with low weight also had higher nutritional
deprivation index values. The association between children breastfed within an hour of birth and child nutrition
deprivation index is negative, indicating that the districts with higher cases of children being breastfed within the first hour of birth also have relatively low nutritional deprivation.
A negative association can be observed between district level full immunization rates and
child nutrition deprivation index, indicating that districtswhere more children received full immunization have lower levels of nutritional deprivation.

INSTITUTE OF ECONOMIC GROWTH DELHI UNIVERSITY ENCLAVE, NORTH CAMPUS
DELHI 110007