ecorfan.org...ecorfan journal-mexico definition of journal scientific objectives support the...
TRANSCRIPT

Volume 8, Issue 18 – January – June – 2017
Journal-Mexico
ISSN-Print: 2007-1582
ISSN-On line: 2007-3682
Volume 10, Issue 23 – July – December – 2019
E
C
O
R F
A
N

ECORFAN®
Chief Editor
RAMOS-ESCAMILLA, María. PhD
Senior Editor
SERRUDO-GONZALES, Javier. BsC
Senior Editorial Assistant
ROSALES-BORBOR, Eleana. BsC
SORIANO-VELASCO, Jesús. BsC
Editorial Director
PERALTA-CASTRO, Enrique. MsC
Production Editors
ESCAMILLA-BOUCHAN, Imelda. PhD
LUNA-SOTO, Vladimir. PhD
Administration Manager
REYES-VILLAO, Angélica. BsC
Production Controllers
RAMOS-ARANCIBIA Alejandra. BsC
DÍAZ-OCAMPO Javier. BsC
ECORFAN Journal, Volume 10, Issue 23, July -
December 2019, is a journal edited six- monthly
by ECORFAN. Itzopan, Number 244, Block 2,
Cologne. La Florida, Cd. Azteca. Ecatepec
Municipality, Estate of Mexico. Zipcode. 55120.
WEB: www.ecorfan.org, [email protected].
Editor in Chief: RAMOS-ESCAMILLA, María.
Reservations for Exclusive Use Rights No: 04-
2012-032214353400-203. ISSN-Print: 2007-
1582- ISSN-On line: 2007-3682.
Legality of Title and Content: 15048 both from
the Qualifying Committee Publications and
Illustrated Journals of the Interior Ministry.
Responsible for the latest update of this number
ECORFAN Computer Unit. ESCAMILLA-
BOUCHÁN, Imelda, LUNA-SOTO, Vladimir.
Itzopan, Number244, Block 2. Cologne. La
Florida, Cd. Azteca. Ecatepec Municipality,
Estate of Mexico.Zipcode.55120, last updated
December 31, 2019.
The opinions expressed by the authors do not
necessarily reflect the views of the editor of the
publication.
It is strictly forbidden to reproduce any part of the
contents and images of the publication without
permission of the National Institute of Copyright.

ECORFAN Journal-Mexico
Definition of Journal
Scientific Objectives
Support the international scientific community in its written production Science, Technology and
Innovation in the Field of Social Sciences, in Subdisciplines of Economics, computer science,
optimization, risk, finance, business and management.
ECORFAN-Mexico SC is a Scientific and Technological Company in contribution to the Human
Resource training focused on the continuity in the critical analysis of International Research and is
attached to CONACYT-RENIECYT number 1702902, its commitment is to disseminate research and
contributions of the International Scientific Community, academic institutions, agencies and entities of
the public and private sectors and contribute to the linking of researchers who carry out scientific
activities, technological developments and training of specialized human resources with governments,
companies and social organizations.
Encourage the interlocution of the International Scientific Community with other Study Centers in
Mexico and abroad and promote a wide incorporation of academics, specialists and researchers to the
publication in Science Structures of Autonomous Universities - State Public Universities - Federal IES -
Polytechnic Universities - Technological Universities - Federal Technological Institutes - Normal
Schools - Decentralized Technological Institutes - Intercultural Universities - S & T Councils -
CONACYT Research Centers.
Scope, Coverage and Audience
ECORFAN Journal-Mexico is a Journal edited by ECORFAN-Mexico S.C in its Holding with repository
in Mexico, is a scientific publication arbitrated and indexed with semester periods. It supports a wide
range of contents that are evaluated by academic peers by the Double-Blind method, around subjects
related to the theory and practice of Economics, computing, optimization, risks, finance, administration
and business with diverse approaches and perspectives , That contribute to the diffusion of the
development of Science Technology and Innovation that allow the arguments related to the decision
making and influence in the formulation of international policies in the Field of Social Sciences. The
editorial horizon of ECORFAN-Mexico® extends beyond the academy and integrates other segments of
research and analysis outside the scope, as long as they meet the requirements of rigorous argumentative
and scientific, as well as addressing issues of general and current interest of the International Scientific
Society.

Editorial Board
AZIZ - POSWAL, Bilal. PhD
University of the Punjab Lahore Pakistan
ANGELES - CASTRO, Gerardo. PhD
University of Kent
CAMPOS - QUIROGA, Peter. PhD
Universidad Real y Pontifica de San Francisco Xavier de Chuquisaca
GARCIA - ESPINOZA, Lupe Cecilia. PhD
Universidad de Santiago de Compostela
MIRANDA - GARCÍA, Marta. PhD
Universidad Complutense de Madrid
MIRANDA - TORRADO, Fernando. PhD
Universidad de Santiago de Compostela
SUYO - CRUZ, Gabriel. PhD
Universidad de Santiago de Compostela
VARGAS - DELGADO, Oscar René. PhD
Universidad de Santiago de Compostela
VILLASANTE, Sebastián. PhD
Universidad de Santiago de Compostela
GUZMÁN - HURTADO, Juan Luis. PhD
Universidad de Santiago de Compostela

Arbitration Committee
BUJARI - ALLI, Ali. PhD
Instituto Politécnico Nacional
GALICIA - PALACIOS, Alexander. PhD
Instituto Politécnico Nacional
GÓMEZ - CHIÑAS, Carlos. PhD
Instituto Politécnico Nacional
MANRÍQUEZ - CAMPOS, Irma. PhD
Instituto de Investigaciones Económicas – UNAM
QUIJANO - GARCIA, Román Alberto. PhD
Universidad Anáhuac Mayab
PÉREZ - SOTO, Francisco. PhD
Colegio de Postgraduados
PÉREZ - RAMÍREZ, Rigoberto. PhD
Universidad Nacional Autónoma de México
SALDAÑA - CARRO, Cesar. PhD
Colegio de Tlaxcala
CAMELO - AVEDOY, José Octavio. PhD
Universidad de Guadalajara
CERVANTES - ROSAS, María de los Ángeles. PhD
Universidad de Occidente
FERNÁNDEZ - GARCÍA, Oscar. PhD
Instituto Politécnico Nacional

Assignment of Rights
The sending of an Article to ECORFAN Journal Mexico emanates the commitment of the author not to
submit it simultaneously to the consideration of other series publications for it must complement the
Originality Format for its Article.
The authors sign the Authorization Format for their Article to be disseminated by means that ECORFAN-
Mexico, S.C. In its Holding Mexico considers pertinent for disclosure and diffusion of its Article its
Rights of Work.
Declaration of Authorship
Indicate the Name of Author and Coauthors at most in the participation of the Article and indicate in
extensive the Institutional Affiliation indicating the Department.
Identify the Name of Author and Coauthors at most with the CVU Scholarship Number-PNPC or SNI-
CONACYT- Indicating the Researcher Level and their Google Scholar Profile to verify their Citation
Level and H index.
Identify the Name of Author and Coauthors at most in the Science and Technology Profiles widely
accepted by the International Scientific Community ORC ID - Researcher ID Thomson - arXiv Author
ID - PubMed Author ID - Open ID respectively.
Indicate the contact for correspondence to the Author (Mail and Telephone) and indicate the Researcher
who contributes as the first Author of the Article.
Plagiarism Detection
All Articles will be tested by plagiarism software PLAGSCAN if a plagiarism level is detected Positive
will not be sent to arbitration and will be rescinded of the reception of the Article notifying the Authors
responsible, claiming that academic plagiarism is criminalized in the Penal Code.
Arbitration Process
All Articles will be evaluated by academic peers by the Double Blind method, the Arbitration Approval
is a requirement for the Editorial Board to make a final decision that will be final in all cases. MARVID®
is a derivative brand of ECORFAN® specialized in providing the expert evaluators all of them with
Doctorate degree and distinction of International Researchers in the respective Councils of Science and
Technology the counterpart of CONACYT for the chapters of America-Europe-Asia- Africa and
Oceania. The identification of the authorship should only appear on a first removable page, in order to
ensure that the Arbitration process is anonymous and covers the following stages: Identification of the
Journal with its author occupation rate - Identification of Authors and Coauthors - Detection of plagiarism
PLAGSCAN - Review of Formats of Authorization and Originality-Allocation to the Editorial Board-
Allocation of the pair of Expert Arbitrators-Notification of Arbitration -Declaration of observations to
the Author-Verification of Article Modified for Editing-Publication.
Instructions for Scientific, Technological and Innovation Publication
Knowledge Area
The works must be unpublished and refer to topics of Economics, computer science, optimization, risks,
finance, administration and business and other topics related to Social Sciences.

Presentation of Content
In the first chapter we present Does the macroeconomic context condition the prediction of business
failure?, by CONTRERAS-FRÍAS, José Guillermo, SEGOVIA-VARGAS, María Jesús, CAMACHO-
MIÑANO, María del Mar and MIRANDA-GARCÍA, Marta, with adscription in the Universidad
Complutense de Madrid and Universidad Rey Juan Carlos respectively. As a next article we present,
Investigation of the effect of the brand equity on the repurchase intention by mediation of the brand
attractiveness and brand trust, by HASANI-NASAB, Mahmood, with adscription in the Islamic Azad
University. As a next article we present, The effect of marketing mix on export development with regard
to the mediating role of market competition, by HASANI-NASAB, Mahmood & SHIRAZIAN, Zahra,
with adscription in the Islamic Azad University. As the next article we present, Financial viability and
environmental aspects in the selection of energy sources for sanitary hot water (SHW) and heated
swimming pools, by LONGARELA-ARES, Angeles, with adscription in the Universidade da Coruña.

Content
Artícle Page
Does the macroeconomic context condition the prediction of business failure?
CONTRERAS-FRÍAS, José Guillermo, SEGOVIA-VARGAS, María Jesús, CAMACHO-
MIÑANO, María del Mar and MIRANDA-GARCÍA, Marta
Universidad Complutense de Madrid
Universidad Rey Juan Carlos
1-18
Investigation of the effect of the brand equity on the repurchase intention by
mediation of the brand attractiveness and brand trust
HASANI-NASAB, Mahmood
Islamic Azad University
19-33
The effect of marketing mix on export development with regard to the mediating role
of market competition
HASANI-NASAB, Mahmood & SHIRAZIAN, Zahra
Islamic Azad University
34-45
Financial viability and environmental aspects in the selection of energy sources for
sanitary hot water (SHW) and heated swimming pools
LONGARELA-ARES, Angeles
Universidade da Coruña
46-71

1
Article ECORFAN Journal- Mexico December 2019 Vol.10 No.23 1-18
Does the macroeconomic context condition the prediction of business failure?
¿Condiciona el contexto macroeconómico a la predicción de quiebra empresarial?
CONTRERAS-FRÍAS, José Guillermo†, SEGOVIA-VARGAS, María Jesús*, CAMACHO-
MIÑANO, María del Mar and MIRANDA-GARCÍA, Marta
Universidad Complutense de Madrid. Facultad de Ciencias Económicas y Empresariales. Campus de Somosaguas, 28223 Madrid
Universidad Rey Juan Carlos. Escuela de Economía y Administración de Empresas. Calle Tulipán, s/n, 28933 Móstoles,
Madrid, Spain
ID 1st Author: José Guillermo, Contreras-Frías
ID 1st Coauthor: María Jesús, Segovia-Vargas / ORC ID: 0000-0002-6578-8017, Researcher ID Thomson: I-3637-2017
ID 2nd
Coauthor: María del Mar, Camacho-Miñano / ORC ID: 0000-0001-5852-338X, Researcher ID Thomson: F-5746-
2010
ID 3st Coauthor: Marta, Miranda-García / ORC ID: 0000-0001-9731-496X
DOI: 10.35429/EJM.2019.23.10.1.18 Received July 20, 2019; Accepted September 15, 2019
Abstract
The objective of this study is to identify both micro and
macroeconomic variables that allow us to analyze in
advance the probabilities of business failure. The selected
sample contains all the listed companies of the IPC index
of Mexico, IBEX-35 of Spain and EURO STOXX50 of
Europe for a time horizon of 5 years. Our contribution lies in the empirical testing of the results by two different
techniques: general estimating equations (a parametric
technique) and a decision tree (a non-parametric
technique based on artificial intelligence). The obtained
results show that the factors of liquidity, indebtedness
and profitability are the ones that affect the prediction of
corporate bankruptcy for listed companies, but not the
macroeconomic ones, since the macroeconomic
peculiarities of each country are diluted by the
importance of the economic-financial structure of each
company.
Business bankruptcy, Macroeconomics variables,
Panel data models, Decision tree
Resumen
El objetivo de este estudio es identificar aquellas
variables tanto micro como macroeconómicas que
permitan analizar anticipadamente las probabilidades de
fracaso empresarial. La muestra utilizada fue de la
totalidad de empresas cotizadas de los índices IPC de
México, IBEX-35 de España y EURO STOXX50 de Europa para un horizonte temporal de 5 años. Nuestra
contribución radica en la contrastación empírica de los
resultados mediante dos técnicas distintas: ecuaciones de
estimación generalizadas (técnica paramétrica) y el árbol
de decisión (técnica no paramétrica de Inteligencia
Artificial). Dichos resultados son que los factores de
liquidez, endeudamiento y rentabilidad son los que
afectan a la predicción de quiebra empresarial para
empresas cotizadas y no los macroeconómicos, ya que las
particularidades macroeconómicas de cada país se
diluyen por la importancia de la estructura económico-
financiera de cada empresa.
Quiebra empresarial, Variables macroeconómicas,
Modelos de datos de panel, Árbol de decisión
Citation: CONTRERAS-FRÍAS, José Guillermo, SEGOVIA-VARGAS, María Jesús, CAMACHO-MIÑANO, María del
Mar and MIRANDA-GARCÍA, Marta. Does the macroeconomic context condition the prediction of business failure?
ECORFAN Journal-Mexico. 2019, 10-23: 1-18.
* Correspondence to Author (email: [email protected])
† Researcher contributing first author.
© ECORFAN Journal - Mexico www.ecorfan.org
2
Article ECORFAN Journal- Mexico December 2019 Vol.10 No.23 1-18
ISSN-Print: 2007-1582- ISSN-On line: 2007-3682
ECORFAN® All rights reserved
CONTRERAS-FRÍAS, José Guillermo, SEGOVIA-VARGAS, María
Jesús, CAMACHO-MIÑANO, María del Mar and MIRANDA-
GARCÍA, Marta. Does the macroeconomic context condition the
prediction of business failure? ECORFAN Journal-Mexico. 2019.
Introduction
The development and use of models for
predicting companies in financial difficulties
have been the subject of a multitude of studies
at least in the last five decades, mainly due to
the very negative consequences that business
failures have for society in general and for the
economy in particular. After more than seventy
years of trying to study why companies fail and
more than fifty years of modeling the behaviour
of companies with financial problems compared
to those without, there is still no single, clear
theory of business failure (Lukason, 2016). In
fact, every time there is an economic crisis
there seems to be an increase in studies on the
subject. In 1966, when Beaver's first empirical
study was published, 9 articles were published
in the Web of Knowledge (ISI), the first
database of prestigious articles worldwide. The
number of articles on bankruptcy has reached
818 in 2017.1
In addition, Korol (2013) states that
business problems are not sudden. On the
contrary, the appeared five to six years before
they enter in the bankruptcy procedure, so they
have to be predictable or at least explainable.
The economic problem that a company can
have in such a situation is very serious and that
is the reason why having prediction models that
allow us to identify possible difficulties is of
great importance for entrepreneurs, managers,
shareholders, investors as well as for
researchers.
Although this is true, what is even more
interesting is to be able to take the necessary
actions avoiding consequences that imply
greater losses. Many companies go bankrupt as
a result of economic crises. For example, in
Mexico for the last 10 years, 468 companies
from all sectors have been in insolvency in the
country. The director of IFECOM in Mexico
said that as an immediate effect of an economic
crisis there is an increase in litigation between
companies. This was the case with companies
such as "Comercial Mexicana", which in 2008
began to have problems with the banks with
whom it contracted derivative financial
instruments to supposedly improve their
finances (Contreras, Segovia-Vargas and
Camacho, 2014).
1 Using the keyword “bankruptcy”
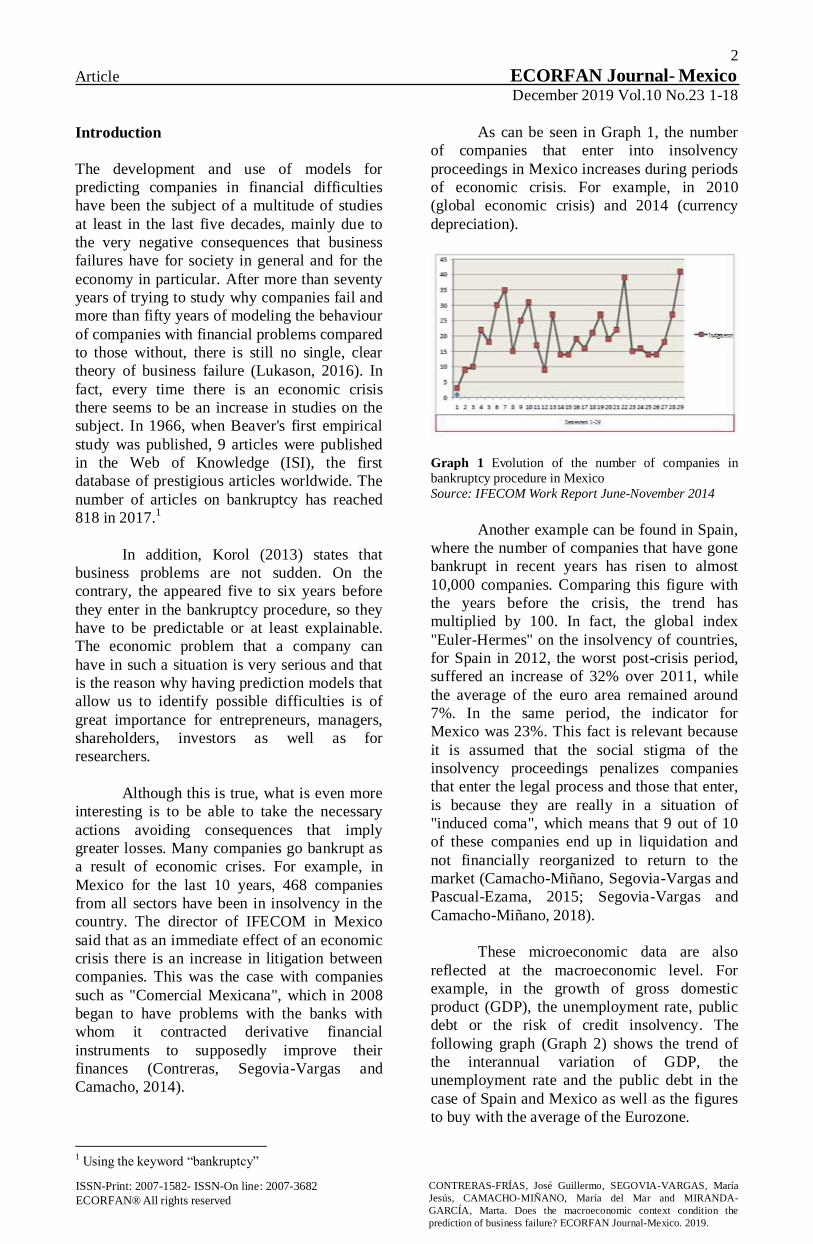
As can be seen in Graph 1, the number
of companies that enter into insolvency
proceedings in Mexico increases during periods
of economic crisis. For example, in 2010
(global economic crisis) and 2014 (currency
depreciation).
Graph 1 Evolution of the number of companies in
bankruptcy procedure in Mexico Source: IFECOM Work Report June-November 2014
Another example can be found in Spain,
where the number of companies that have gone
bankrupt in recent years has risen to almost
10,000 companies. Comparing this figure with
the years before the crisis, the trend has
multiplied by 100. In fact, the global index
"Euler-Hermes" on the insolvency of countries,
for Spain in 2012, the worst post-crisis period,
suffered an increase of 32% over 2011, while
the average of the euro area remained around
7%. In the same period, the indicator for
Mexico was 23%. This fact is relevant because
it is assumed that the social stigma of the
insolvency proceedings penalizes companies
that enter the legal process and those that enter,
is because they are really in a situation of
"induced coma", which means that 9 out of 10
of these companies end up in liquidation and
not financially reorganized to return to the
market (Camacho-Miñano, Segovia-Vargas and
Pascual-Ezama, 2015; Segovia-Vargas and
Camacho-Miñano, 2018).
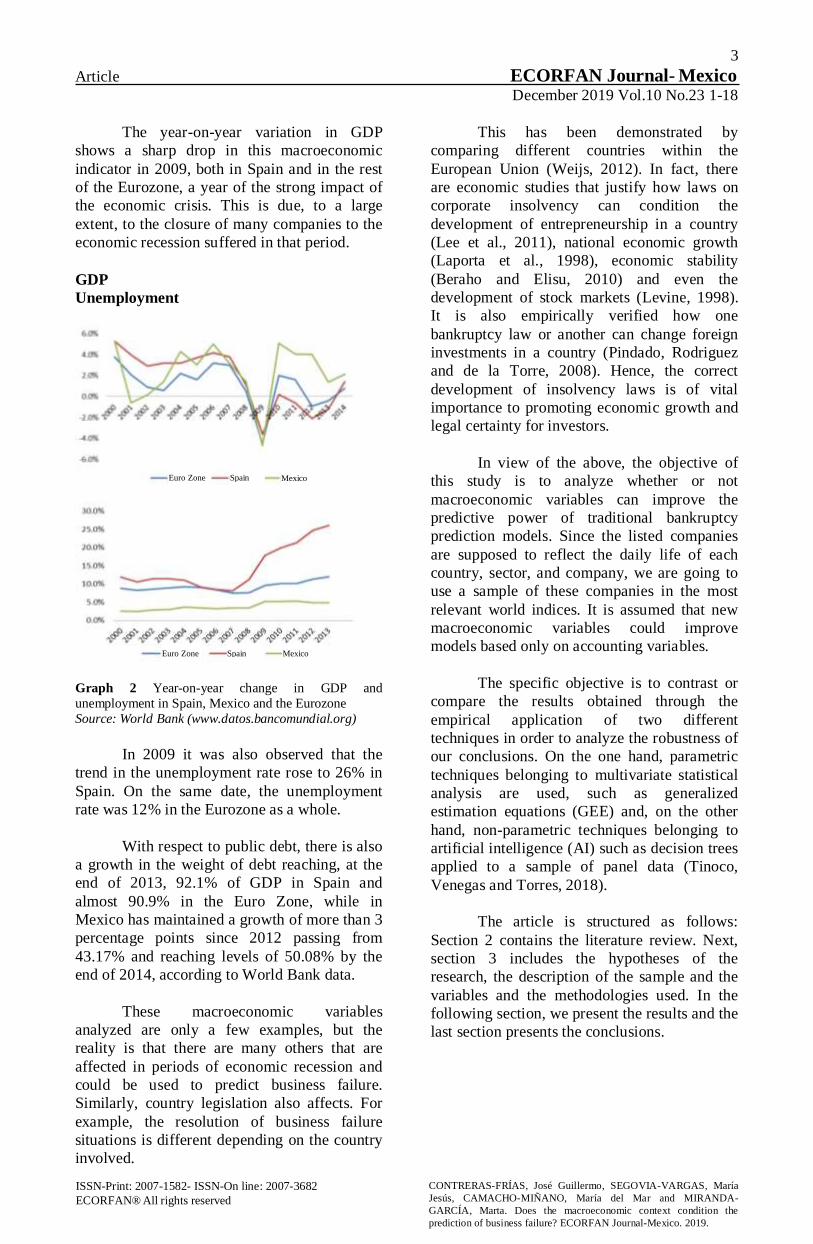
These microeconomic data are also
reflected at the macroeconomic level. For
example, in the growth of gross domestic
product (GDP), the unemployment rate, public
debt or the risk of credit insolvency. The
following graph (Graph 2) shows the trend of
the interannual variation of GDP, the
unemployment rate and the public debt in the
case of Spain and Mexico as well as the figures
to buy with the average of the Eurozone.
3
Article ECORFAN Journal- Mexico December 2019 Vol.10 No.23 1-18
ISSN-Print: 2007-1582- ISSN-On line: 2007-3682
ECORFAN® All rights reserved
CONTRERAS-FRÍAS, José Guillermo, SEGOVIA-VARGAS, María
Jesús, CAMACHO-MIÑANO, María del Mar and MIRANDA-
GARCÍA, Marta. Does the macroeconomic context condition the
prediction of business failure? ECORFAN Journal-Mexico. 2019.
The year-on-year variation in GDP
shows a sharp drop in this macroeconomic
indicator in 2009, both in Spain and in the rest
of the Eurozone, a year of the strong impact of
the economic crisis. This is due, to a large
extent, to the closure of many companies to the
economic recession suffered in that period.
GDP
Unemployment
Graph 2 Year-on-year change in GDP and
unemployment in Spain, Mexico and the Eurozone
Source: World Bank (www.datos.bancomundial.org)
In 2009 it was also observed that the
trend in the unemployment rate rose to 26% in
Spain. On the same date, the unemployment
rate was 12% in the Eurozone as a whole.
With respect to public debt, there is also
a growth in the weight of debt reaching, at the
end of 2013, 92.1% of GDP in Spain and
almost 90.9% in the Euro Zone, while in
Mexico has maintained a growth of more than 3
percentage points since 2012 passing from
43.17% and reaching levels of 50.08% by the
end of 2014, according to World Bank data.
These macroeconomic variables
analyzed are only a few examples, but the
reality is that there are many others that are
affected in periods of economic recession and
could be used to predict business failure.
Similarly, country legislation also affects. For
example, the resolution of business failure
situations is different depending on the country
involved.
This has been demonstrated by
comparing different countries within the
European Union (Weijs, 2012). In fact, there
are economic studies that justify how laws on
corporate insolvency can condition the
development of entrepreneurship in a country
(Lee et al., 2011), national economic growth
(Laporta et al., 1998), economic stability
(Beraho and Elisu, 2010) and even the
development of stock markets (Levine, 1998).
It is also empirically verified how one
bankruptcy law or another can change foreign
investments in a country (Pindado, Rodriguez
and de la Torre, 2008). Hence, the correct
development of insolvency laws is of vital
importance to promoting economic growth and
legal certainty for investors.
In view of the above, the objective of
this study is to analyze whether or not
macroeconomic variables can improve the
predictive power of traditional bankruptcy
prediction models. Since the listed companies
are supposed to reflect the daily life of each
country, sector, and company, we are going to
use a sample of these companies in the most
relevant world indices. It is assumed that new
macroeconomic variables could improve
models based only on accounting variables.
The specific objective is to contrast or
compare the results obtained through the
empirical application of two different
techniques in order to analyze the robustness of
our conclusions. On the one hand, parametric
techniques belonging to multivariate statistical
analysis are used, such as generalized
estimation equations (GEE) and, on the other
hand, non-parametric techniques belonging to
artificial intelligence (AI) such as decision trees
applied to a sample of panel data (Tinoco,
Venegas and Torres, 2018).
The article is structured as follows:
Section 2 contains the literature review. Next,
section 3 includes the hypotheses of the
research, the description of the sample and the
variables and the methodologies used. In the
following section, we present the results and the
last section presents the conclusions.
Euro Zone Mexico Spain
Euro Zone Mexico Spain
4
Article ECORFAN Journal- Mexico December 2019 Vol.10 No.23 1-18
ISSN-Print: 2007-1582- ISSN-On line: 2007-3682
ECORFAN® All rights reserved
CONTRERAS-FRÍAS, José Guillermo, SEGOVIA-VARGAS, María
Jesús, CAMACHO-MIÑANO, María del Mar and MIRANDA-
GARCÍA, Marta. Does the macroeconomic context condition the
prediction of business failure? ECORFAN Journal-Mexico. 2019.
Literature Review
Over the years, many researchers have focused
their efforts on trying to determine the level of
solvency of a business in order to predict or
avoid the bankruptcy of a company through the
use of ratios, statistical methods and financial
analysis on factors that directly impact
liquidity, leverage, and profitability, among
others. In 1932 Fitzpatrick carried out the first
works giving rise to what is known as the
descriptive stage. His primary objective was to
try to detect business failures through the use of
ratios only. In the same line is the work of
Winakor and Smith (1935), applying basic
univariate analysis techniques, analyzing the
trends of various financial ratios. However, it
was not until the 1960s that more complex
statistical techniques such as discriminant,
univariate and multiple analysis began to be
used. Based on these studies, Beaver (1966),
Altman (1968) and many others have attempted
to develop a general theory of business failure,
albeit still unsuccessful. In these studies, the
methodology is based on a paired design of
companies.
Initially, studies that attempted to
predict and therefore explain business failure
were based on ratios derived from accounting
information (Ohlson, 1980). They consisted of
analyzing the cases of real business failures
and, using an inductive method, learning the
common characteristics of failed companies by
comparing them with "healthy" companies.
However, even today, with more than half a
century of subsequent research, there is still no
unanimity among researchers as to which
accounting ratios best explain the insolvency
situation. In the accounting literature, many
researchers have used key ratios from financial
analysis or financial statement documents
(balance sheet, profit and loss account, or cash
flow statement) to explain bankruptcy (Altman
et al., 2017). Generally speaking, there are three
types of ratios most used by academics on the
subject: profitability ratios, debt ratios and
economic-financial equilibrium ratios (among
others, see: Tascón Fernández and Castaño
Gutiérrez (2012); Korol (2013)). The
relationship between profitability and liquidity
seems logical since the idea is that companies
with financial problems are less able to access
financing, external financial resources, such as
banks, which means significant cash
imbalances.
Depending on the methodology used in
forecasting insolvencies, the way in which
explanatory factors are selected may vary. In
other words, if traditional statistical techniques
are used, the way in which the variables
explaining the sample are selected may
condition the results, as not all existing
accounting ratios can be included due to
problems of multicollinearity between them. In
addition, variables are also required to meet
certain baseline assumptions, such as the
criteria of normality and heteroscedasticity, in
order to be able to apply certain statistical
techniques.
In the decade of the 80's the first
questionings to these last models appear
because they are not random Zmijewski (1984)
and because of the advances in the
methodology with logistic regression or Logit
model. Motivated by the importance of
incorporating the history of each company, we
began with the application of models for
longitudinal data, such as the mixed linear
model or the mixed logistic model, which
incorporate in their analysis the financial
statements of each company in a time horizon.
At the time of elaborating this type of models, it
is also relevant to the selection of the variables
to use. Different techniques are used for this:
main components, degree of statistical
significance of the variables (forward or
backward), the judgment of researchers or
professionals, cluster analysis, etc.
If it is decided to use non-traditional
methodologies (De Andrés, Landajo and
Lorca., 2012; Du Jardin, 2018; Ravi Kumar and
Ravi, 2007) as artificial intelligence methods
(rough set, decision trees such as PART
algorithms, C4.5, random forest, neural
networks...), all available variables can be
considered as long as they classify the problem
to be studied well, i.e. that its level of
significance is acceptable. However, although
errors in the classification of failed enterprises
have been reduced, they have not been fully
classified. According to a study by Aziz and
Dar (2006) up to that date, studies predicting
the risk of insolvency had used statistical
models in 64% of the cases, 25% had made use
of soft computing techniques or artificial
intelligence, and 11% had studied the
phenomenon through another one.
5
Article ECORFAN Journal- Mexico December 2019 Vol.10 No.23 1-18
ISSN-Print: 2007-1582- ISSN-On line: 2007-3682
ECORFAN® All rights reserved
CONTRERAS-FRÍAS, José Guillermo, SEGOVIA-VARGAS, María
Jesús, CAMACHO-MIÑANO, María del Mar and MIRANDA-
GARCÍA, Marta. Does the macroeconomic context condition the
prediction of business failure? ECORFAN Journal-Mexico. 2019.
Regardless of the methodology used,
accounting ratios involve a number of
limitations inherent in accounting. First,
accounting data are historical data, based on
past events, which sometimes makes it difficult
to make predictive decisions in the future (Yeh,
Lin and Hsu, 2012). Another limitation of
accounting data is that they are subject to
manipulation or bias, depending on the
incentives that their managers have: the lower
payment of taxes, postponing or avoiding a
legal insolvency process, showing a healthy
image to get credit, and so on. (Campa and
Camacho-Miñano, 2014). In addition, the
accounting policies of companies, and even the
sectors to which they belong may have some
influence on accounting variables (Balcaen and
Ooghe, 2006). Likewise, whether or not they
belong to a group of companies and the type of
group could modify these variables (Korol,
2013).
Another problem is the existence of
different accounting regulations, which makes
it difficult to use data from companies
worldwide. Finally, there are academic studies
that highlight the role that accounting
information plays on the probability of
insolvency of companies (Meeks and Meeks,
2009), since the paradox is that the simple
probability of insolvency affects the accounting
valuation of assets and liabilities and that, in
turn, the valuation of these conditions this
probability.
Despite all these accounting problems,
models with financial ratios (accounting data)
are zrecognized and used worldwide. Thus,
Agarwal and Taffler (2008); Das, Hanouna, and
Sarin (2009) and Bauer and Argawal (2014)
point out that, taking into account the
profitability of models based on accounting
data, market-based models and risk models
prevail in the finance literature. For Argawal
and Taffler (2008), there is little predictive
difference between models based on accounting
data and those based on the market, however,
the use of models based on accounting allows a
higher level of risk-adjusted return.
However, even though various types of
research have been conducted related to
predicting business failure, the original "Z-
Score" model introduced by Altman (1968) has
been the dominant and globally applicable
model (Altman et al., 2017).
Although its origin is more than 45
years old, it is still used as a prediction tool in
bankruptcies or financial difficulties.
Despite all the above, two options are
considered to increase the predictive power of
the models by researchers: either the use of
stock market variables or the use of other non-
financial variables. Marais, Patell, and Wolfson
(1984) were the first to point out that stock
prices improved the prediction of failure,
compared to the use of accounting variables
only. Barniv, Agarwal, and Leach (1997) found
that there were accumulated abnormal results,
weighted by market prices, before firms entered
the contest. Hillegeist et al. (2004) noted that
adding market variables to models improved
information opportunity. In fact, Chava and
Purnanandam (2010) found a positive
relationship between stock returns and the risk
of failure. A study by Bauer and Agarwal
(2014) points out that hazard models add
greater predictability than traditional models for
predicting potential insolvencies. Other
research has also focused on the predictive
power of financial statements (Collins,
Maydew, and Weiss, 1997; Francis and
Shipper, 1999, among others).
With regard to non-financial variables,
variables such as the age of the company since
its foundation, size (such as algorithm of total
assets, the average number of employees and
sales figure) and sector (Tascón and Castaño,
2012) were added to the models.
Among the first studies that attempted to
create a theory of business failure and success,
the theory developed by Lussier (1995) stands
out, based on fifteen internal variables of the
company, such as the level of initial
capitalisation of the business, the experience of
the company in the sector or the training of
managers. However, the main problem of this
study was the difficulty in obtaining this type of
data from failed companies, coming from
interviews with managers. Many other variables
have been added model by model. Thus,
Laitinen and Laitinen (2009) incorporate
information on audit reports, and De Andrés,
Landajo and Lorca (2012), which make use of
standards from different economic sectors.
Other more specific audit report variables have
also been added recently, such as the auditors'
comments, which improve the practical power
of the auditors.

6
Article ECORFAN Journal- Mexico December 2019 Vol.10 No.23 1-18
ISSN-Print: 2007-1582- ISSN-On line: 2007-3682
ECORFAN® All rights reserved
CONTRERAS-FRÍAS, José Guillermo, SEGOVIA-VARGAS, María
Jesús, CAMACHO-MIÑANO, María del Mar and MIRANDA-
GARCÍA, Marta. Does the macroeconomic context condition the
prediction of business failure? ECORFAN Journal-Mexico. 2019.
Other more specific audit report
variables have also been added recently, such as
auditor comments, which improve the
predictive power of Altman's models (Muñoz-
Izquierdo, 2017).
Noga and Schnader (2013) use
temporary tax differences, Kallunki and Pyykkö
(2013) analyze the past experience of the
managers of companies in competition and
Chiu, Peña and Wang (2013) explain the
probability of business failure depending on the
degree of concentration of the sector, based on
the idea that the more competition in a sector,
the greater the probability of failure.
Finally, it should be noted that the latest
trend in business failure investigations is cross-
country comparisons. Few studies have carried
out a comparative study mainly due to the lack
of access to data from different countries. The
development of international trade databases
has led to these studies, although there is still a
theory of business failure to be built. One of the
first studies was that of Altman and Narayanan
(1997). They reviewed business failure
prediction models in 22 countries. Another
study by Ravid and Sundgren (1998) compared
the efficiency of Finnish and US legal codes
governing business failure. Analyzing 70
companies from each country, they found that,
although the economic factors affecting
bankruptcy proceedings coincide in both
countries, Finnish legislation favors a
liquidation process to a greater extent than the
American one, rather than achieving the
reorganization of a company. Laitinen (2002)
also analyzed companies from 17 European
countries and the United States, concluding that
there are differences between countries with
regard to the degree of reliability of the models.
On the basis of the analysis of their sample, the
countries that obtained the highest degree of
reliability in their classification were Germany,
Belgium, Italy, Finland and Greece, and the
lowest were Switzerland, Ireland, and Portugal.
Similarly, Bellovary, Giacomi, and
Akers (2007) refer to models in 18 countries.
Davydenko and Franks (2008), with a sample
of approximately 1,500 companies from
Germany, France and the United Kingdom,
concluded that the legislation in force in each
country affected business crises, although the
role of banks or competition also affects the
tendering of companies.
A study conducted by Korol (2013)
compares data from Polish companies listed,
healthy and in competition, with Latin
American companies (from Mexico, Argentina,
Peru, Brazil and Chile) using traditional
methodologies and artificial intelligence.
He concludes that it is more difficult to
explain the Latin American companies than the
European ones since the normative and
macroeconomic context of the Latin American
ones conditions the competition. Another study
by Laitinen and Suvas (2013) compares 30
European countries, pointing out that, despite
the differences between countries, it is possible
to predict business failure with some acceptable
classification errors.
A recent study is the work of Altman et
al. (2017). It stands out for an exhaustive
review of the literature on the importance and
effectiveness of Altman's Z-Score model for
predicting global bankruptcy and its
applications in bonds and other related areas.
The review is based on an analysis of 33
scientific articles published from 2000 to the
present in the major financial and accounting
journals. The result of the analysis shows that
while a general international model works
reasonably well, with predictive accuracy levels
ranging from 75% to 90%, classification
accuracy can be improved considerably with
country-specific estimates, especially with the
use of additional variables.
In short, the line of research on
predicting bankruptcy between countries is key
due to the globalization of international markets
and the existence of a global investor.
Therefore, the existence of a common
bankruptcy or failure prediction model for
different countries with a high degree of
reliability remains relevant and is one of the
purposes of this thesis.
The research continues around the world
in order to "perfect" predictive models with the
addition in the application of both parametric
and non-parametric techniques more efficient
that have attempted to obtain greater accuracy
in prediction.

7
Article ECORFAN Journal- Mexico December 2019 Vol.10 No.23 1-18
ISSN-Print: 2007-1582- ISSN-On line: 2007-3682
ECORFAN® All rights reserved
CONTRERAS-FRÍAS, José Guillermo, SEGOVIA-VARGAS, María
Jesús, CAMACHO-MIÑANO, María del Mar and MIRANDA-
GARCÍA, Marta. Does the macroeconomic context condition the
prediction of business failure? ECORFAN Journal-Mexico. 2019.
Research hypotheses, sample, variables and
methodologies
1. Research hypotheses
H0: The presence of macroeconomic variables
conditions business failure in a global context
of listed companies. In other words,
macroeconomic variables should increase the
predictive power of models without taking
these variables into account.
2. Sample
For the selection of the companies in this study,
all the companies that made up the following
reference indices without prior knowledge of
their financial situation were used: IPC of
Mexico (35 companies), IBEX35 of Spain (34
companies) and EURO STOXX 50 of the
Eurozone (50 companies).
Therefore the sample is made up of 119
companies. The geographical unit refers to the
selection of the region or country to which the
units of analysis belong. In most of the
investigations carried out, it has been chosen to
include samples belonging to a single country
or region, however, in this research the
geographical unit has been extended to several
countries considering the place where the
companies carry out their economic activity.
The time unit comprises the time period
of the database. Normally these periods are
annual and vary from 3 to 10 years. In the
present study, the accumulated data for the last
quarter of each year from 2010 to 2014 were
available, so there is a time horizon of 5 years.
3. Description of the variables
The determination of the dependent variable is
a subject of multiple divergences and
contradictions. The analysis of bankruptcy or
business failure gives rise to disagreements due
to the nation consensus in the definitions and to
the timing and indicators that are used to
declare such a state. Given that the factors that
can cause business failure are many and of
diverse nature, the intention of this paper will
be to detect indications or indicators from the
information contained in the financial
statements.
Due to the problematic exposed, and
before the diversity of definitions, in the present
study we have classified the companies in two
categories, healthy and bankruptcy, according
to the score obtained when using the Z-score of
Altman (1968), an indicator that continues valid
for almost fifty years. Based on Altman's
experience with companies in financial
difficulties, an index was developed using five
ratios and five weights, with the aim of
forecasting the bankruptcy of listed
manufacturing companies. The experience of
this model led the author to conclude that Z-
Score scores below 1.81 indicated a high
probability of bankruptcy. On the other hand,
scores above 3.00 indicated a low probability of
bankruptcy. The range between 1.81 and 2.99
was referred to as the "ignorance zone".
Companies with this Z-score should be
analyzed in depth to determine their probability
of bankruptcy. After applying this indicator to
the 119 companies in the study and using
information from their financial statements, we
obtain a classification as shown in the
following table (Table 1).
Year Healthy
firms
Bankrupt
firms
Not-
classified
2010 46 38 35
2011 43 45 31
2012 43 46 30
2013 46 41 32
2014 46 41 32
Table 1 Classification of firms according to Z-SCORE
ALTMAN
Source: Own elaboration
An average of 27% of companies could
not be classified according to the Z-score due to
lack of accounting data. However, of the
remaining 73% of companies in the sample that
have been classified, 51% are healthy and 49%
are bankrupt. This concludes that we start from
a balanced sample of healthy and bankrupt
companies for each of the years within the time
series analyzed.
On the other hand, the selection of the
independent or explanatory variables that will
be used in any model is of special importance
and attention on the part of the researchers,
since based on them it will be possible to draw
appropriate and accurate conclusions.

8
Article ECORFAN Journal- Mexico December 2019 Vol.10 No.23 1-18
ISSN-Print: 2007-1582- ISSN-On line: 2007-3682
ECORFAN® All rights reserved
CONTRERAS-FRÍAS, José Guillermo, SEGOVIA-VARGAS, María
Jesús, CAMACHO-MIÑANO, María del Mar and MIRANDA-
GARCÍA, Marta. Does the macroeconomic context condition the
prediction of business failure? ECORFAN Journal-Mexico. 2019.
In order to determine the role of
macroeconomic variables in the explanation
and prediction of business failure, this research
paper considered two types of explanatory
variables: microeconomic variables (financial
ratios) and macroeconomic variables.
For Brealey and Myers (1999), using
financial ratios has the advantage of not being
overwhelmed by the large volume of
information and data contained in financial
statements. According to Segovia-Vargas and
Camacho-Miñano (2018), an advantage of
using ratios is that they reduce the dispersion in
the figures of the financial statements of
companies due to their size. This fact facilitates
the inter-company comparison. Large firms
produce large accounting numbers and small
firms produce smaller accounting numbers.
Therefore, the use of ratios has the advantage of
reducing the bias that could arise from the size
of firms.
As far as the selection of financial ratios
is concerned, this study was carried out taking
into consideration the following elements:
1. The data extracted from the financial
statements available for the study.
2. The bibliographical review of a
considerable number of articles in this
line of research. This review took into
account the number of papers in which
financial ratios were most frequently
used (see section 2, Tascón Fernández
and Castaño Gutierrez, 2012).
Variable Definition Nº
Papers Indicator
Current
Assets/Current
Liabilities
1 Liquidity
Total Liabilities/ Total
Assets
18 Indebtedness
Total Liabilities /
Stockholders’ equity
3 Indebtedness
EBIT / Revenues 1 Profitability
EBIT / Stockholders’
equity
5 Profitability
Net Income / Net
revenues
2 Profitability
Net Income /
Stockholders’ equity
6 Profitability
Net Income / Total
Assets
14 Profitability
Revenues / Fixed
Assets
5 Efficiency
Table 2 Microeconomic variables (financial ratios) Source: Own elaboration
The rest of the explanatory variables are
the most relevant macroeconomic variables
(Hernández-Tinoco and Wilson, 2013) of each
of the countries under study (Table 3):
Variable Definition
Sector
Industry: Classification according to
the specialization of the economic
activity
País Country
GII Global Insolvency Index (Euler
Hermes)
TEA
Business Entrepreneurship Index.
Early - Stage Entrepreneurial
Activity
PIB GDP- Gross Domestic Product
Desempleo Unemployment (Rate of
unemployment)
Corrupción Corruption Perception Index
Cumplimento
ley
Enforcement: law enforcement
index
Inflación Inflation
Situación
legal
Legal situation: Classification
according to civil law or common
law
Table 3 Macroeconomic variables
Source: Own elaboration
The main characteristics of our sample
are shown in the following tables 4 and 5:
Variables Minimum Maximum Mean Standard Deviation
X1 0.06 7.63 0.72 0.77
X2 0.06 0.99 0.66 0.21
X3 0.06 98.16 5.33 9.72
X4 -80.90 0.80 -0.18 5.18
X5 -9.10 1.84 0.05 0.62
X6 -34.14 1.09 -0.05 2.03
X7 -3.84 0.88 0.02 0.29
X8 -0.12 0.11 0.01 0.02
X9 0.03 209.94 3.13 12.46
Table 4 Descriptive statistics of the selected
microeconomic variables
Source: Own elaboration
Variables Minimum Maximum Mean Standard
Deviation
GII -0.30 0.33 0.03 0.15
TEA 0.00 0.19 0.07 0.05
PIB -0.03 0.05 0.01 0.02
Desempleo 0.05 0.26 0.12 0.08
Corrupción 0.03 0.09 0.06 0.02
Enforcement 0.42 0.86 0.67 0.08
Inflación -0.01 0.05 0.02 0.01
Table 5 Descriptive statistics of the selected
macroeconomic variables
Source: Own elaboration
9
Article ECORFAN Journal- Mexico December 2019 Vol.10 No.23 1-18
ISSN-Print: 2007-1582- ISSN-On line: 2007-3682
ECORFAN® All rights reserved
CONTRERAS-FRÍAS, José Guillermo, SEGOVIA-VARGAS, María
Jesús, CAMACHO-MIÑANO, María del Mar and MIRANDA-
GARCÍA, Marta. Does the macroeconomic context condition the
prediction of business failure? ECORFAN Journal-Mexico. 2019.
4. Methodologies
We will use two types of methodologies, one
parametric and the other non-parametric. The
parametric method is based on the analysis of
panel data, that is, repeated measurements over
a period of time on the same individual, thus
obtaining a history that shows the development
or evolution of the characteristics being
measured. For the application of this
methodology, it is necessary an efficient
analysis of the databases since when data are
missing (they should be estimated) or the
presence of atypical data can have a negative or
illogical influence on the results. In addition,
this efficient analysis can contribute to a better
prediction and, therefore, to a better evaluation
of the companies under study.
When panel data are available, the use
of linear models ignores possible correlations
between variables and therefore erroneous
conclusions would be reached regarding
statistical significance. A tool that is
appropriate for analyzing dichotomous
variables with this type of data is through
generalized estimating equation (GEE),
introduced by Liang and Zeger (1986) which
are an extension of generalized linear models
(GLM), in which the existing correlation
between variables is taken into account to
increase the efficiency of the estimator.
To estimate β, the GEE is
∑
( ( , where
(
and being, ( the
correlation matrix. The element (j, k) of this
matrix is the correlation between and .
The correlation between repeated
measures, however, can have an important
effect on the estimated variance of the
regression coefficients and will, therefore, have
to be taken into account to make correct
inferences. Since it is rare that the true
correlation is known, it is considered a working
correlation matrix, R. This matrix is of size t x t
because it is assumed that there is a fixed
number of points in time at which individuals
are observed. In addition, the correlation matrix
Ri is considered to depend on a vector of
association parameters, denoted by α. This
unknown vector of parameters has a structure
that will be determined by the researcher.
There is not much information on how
to choose the best correlation structure and it is
often difficult to determine. However, the
possible loss of efficiency is reduced as the
number of individuals grows. Unstructured was
used in this paper. In addition, GEEs perform
better when the following conditions are met:
- The number of observations per subject
is small (5 observations per company in
this study) and the number of subjects is
large (119 companies in this study).
- These are longitudinal studies or, to put
it another way, with a panel data
structure, always obtaining
measurements at the same instant of
time for each individual (2010 - 2014 in
the present study).
When using the GEE model, it should
be noted that it is a model that is not based on
the use of the likelihood function. One of the
criteria most used and implemented in different
data analysis packages is Wald's statistic. This
criterion can be used to select the best structure
of the Ri matrix (α) according to the data, or to
select variables to be taken into account within
the model and previously requires a rigorous
analysis of the data. Therefore, the first analysis
of the predictive model does not have to consist
of mainly estimating the predictive model, but
of evaluating the underlying assumptions that
are as important as the final result.
A second method is a non-parametric
approach based on Artificial Intelligence (AI),
i.e., it does not start from previously established
hypotheses, and considers the baseline data in a
fully exploratory manner. The IA is in charge,
among other applications, of building computer
programs capable of carrying out intelligent
work based on learning from the data by means
of pattern recognition, with the purpose of
extracting information that allows establishing
properties and characteristics of a certain set of
objects. Of all the artificial intelligence
techniques, we have selected the decision trees
for their easy comprehension for the end user
and for their explanatory power.
Decision trees are part of so-called
automatic learning and are diagrams of logical
constructions of the optimal classification of a
given group of data according to their
characteristics or attributes.

10
Article ECORFAN Journal- Mexico December 2019 Vol.10 No.23 1-18
ISSN-Print: 2007-1582- ISSN-On line: 2007-3682
ECORFAN® All rights reserved
CONTRERAS-FRÍAS, José Guillermo, SEGOVIA-VARGAS, María
Jesús, CAMACHO-MIÑANO, María del Mar and MIRANDA-
GARCÍA, Marta. Does the macroeconomic context condition the
prediction of business failure? ECORFAN Journal-Mexico. 2019.
According to Molina and García (2006)
a decision tree can be interpreted as a series of
compacted rules for its representation in the
form of a tree and what differentiates one
decision tree from another is the algorithm that
generates it and that will make the successive
partitions in the space of explanatory variables,
using in each partition a single variable. There
are numerous algorithms to elaborate a decision
tree, but one of the most used in the literature is
the one developed by Quinlan (1993) and
implemented in C4.5 (as an example, see Díaz-
Martínez, Segovia-Vargas and Fernández
Menéndez, 2005; Gelashvili, Segovia-Vargas
and Camacho-Miñano, 2015). This algorithm
generates a decision tree from the data using
recursive partitions, partitions supported by a
series of concepts from information theory
(Reza, 1961). The basic idea is to take in each
branch of the tree, to make the corresponding
partition, that variable that provides more
information. It uses a heuristic technique
known as a gain ratio which is a measure based
on information that considers different numbers
and (different probabilities) of the test results.
Thus, the algorithm generates a rule structure
and evaluates its goodness using criteria that
measure the precision in the classification of
cases.
Results and discussion
1. Principal component analysis
First, a preliminary analysis of the data was
made using the statistical technique known as
principal component analysis. The following
criteria will be used to select the components:
- Kaiser criterion: This criterion mentions
that the eigenvalues have to be greater
than 1, since these are the ones that
explain greater variance. The average of
all these values is equal to 1.
- Choose a minimum of variance that you
want to explain. For this study, we set a
target between 65% and 75%.
Taking into account these criteria, we
have chosen 4 components for each of the years
analyzed, observing which variables saturate
each factor in each of the years (those that have
more weight within each of them).
In the space of the variables, the
analysis makes sense if there are positive
variabilities of the variables, since this is
indicative of their greater incidence on the total
absolute variability, and therefore the other
factors will have little incidence.
Figure 1 shows the variables that
saturate each factor for each of the years and for
the 4 main components selected. Figure 2
includes a summary considering the frequency
of appearance of these variables:
Figure 1 Principal Component Analysis
Source: Own elaboration
Variable Comp 1 Comp 2 Comp 3 Comp 4 Total
X1 0 0 0 0 0 X2 0 0 0 5 5 X3 0 0 0 0 0 X4 0 2 0 0 2 X5 0 1 0 2 3 X6 0 2 0 0 2 X7 0 2 0 0 2 X8 0 2 1 0 3 X9 0 0 0 0 0 Sector 0 0 0 0 0 Pais 1 0 0 0 1 GII 0 0 2 0 2 TEA 1 0 0 0 1 PIB 0 0 0 0 0 Desempleo 0 0 3 0 3 Corruption 0 0 0 0 0 Enforcement 0 0 2 0 2 Legal 0 0 0 1 1 Inflacion 2 1 0 0 3
Figure 2 Frequency summary of variables by component
Source: Own elaboration
2. Generalized estimating equation
model
The analysis of main components gives us an
idea of the independent variables that could
form part of the model without losing
information from the rest of them, and from
them, the iterations of the GEE model have
been carried out:

11
Article ECORFAN Journal- Mexico December 2019 Vol.10 No.23 1-18
ISSN-Print: 2007-1582- ISSN-On line: 2007-3682
ECORFAN® All rights reserved
CONTRERAS-FRÍAS, José Guillermo, SEGOVIA-VARGAS, María
Jesús, CAMACHO-MIÑANO, María del Mar and MIRANDA-
GARCÍA, Marta. Does the macroeconomic context condition the
prediction of business failure? ECORFAN Journal-Mexico. 2019.
Wald X2= 93.13
Variable p-value (P>│z│) Coeficient
X2 0.000 7.114
X5 0.049 -1.073
X8 0.000 -30.904
Figure 3 Iterations of GEE model
Source: Own elaboration
As regards the interpretation of the
coefficients in financial terms, it should be
pointed out that the main variables explaining
business failure in the sample of listed
companies used are the following:
- The negative coefficient of variable X1
(liquidity ratio): Indicates that a
company is more likely to go bankrupt
when, for each monetary unit of debt, it
has fewer liquid assets to meet its
obligations.
- The positive coefficient of variable X2
(global debt-solvency): Indicates that a
company is more likely to go bankrupt
when it is more dependent on its debt. In
other words, for each monetary unit of
the total asset, more depends on external
resources.
- The negative coefficient of variable X5
(return on capital): Indicates that a
company is more likely to go bankrupt
when for each monetary unit of capital
invested by shareholders generates less
profit before taxes and interest.
- The negative coefficient of variable X8
(ROA or return on assets): Indicates that
a company is more likely to go bankrupt
when less operating profit is generated
for each monetary unit invested in
assets.
After the third iteration, the same
variables are maintained as significant within
the GEE model, and its predictive capacity was
improved by adding variable X1. Thus, we can
conclude that the variables within the third
iteration are those that would have greater
predictive power in relation to the dependent
variable, i.e. the possible bankruptcy of a
company. In this way, we demonstrate that
macroeconomic variables do not have sufficient
weight in the prediction of possible insolvency
in listed companies as the sample used.
3. Decision Tree Model
As a robustness analysis, we are going to
contrast the results obtained previously with the
decision tree methodology. Although the data
we have presents the characteristic of panel
data, for the application of these models only
two cross sections will be made, one for 2010
and another for 2014, so we can analyze the
beginning and end of the time series.
The obtained results2 of the C4.5
decision tree for 2010 are shown in the
following figure (figure 4):
Figure 4 C4.5 Decision Tree year 2010
Source: Own elaboration. Note: The arrows point to the
strongest branches.
The 10 k-fold cross validation result
(which the most common)3 of this model is
77% of correct classifications.
2 WEKA is the data mining package developed by the
University of Waikato (Witten and Frank, 2005) with which we performed our analysis. 3 In cross validation, a random partition (usually 10 parts)
of the development group (the entire sample data) is
performed and a subgroup (9 parts) is used recursively to
generate the tree and another (1 part) for validation.
Wald X2 (6) = 107.83
Variable p-value (P>│z│) Coeficient
X1 0.000 -1.932
X2 0.000 6.742
X5 0.007 -1.501
X8 0.000 -33.829
Unemployment 0.007 3.566
Inflaction 0.095 13.185
Wald X2 (4) = 116.96
Variable p-value (P>│z│) Coeficient
X1 0.000 -1.91
X2 0.000 6.88
X5 0.019 -1.24
X8 0.000 -31.39
12
Article ECORFAN Journal- Mexico December 2019 Vol.10 No.23 1-18
ISSN-Print: 2007-1582- ISSN-On line: 2007-3682
ECORFAN® All rights reserved
CONTRERAS-FRÍAS, José Guillermo, SEGOVIA-VARGAS, María
Jesús, CAMACHO-MIÑANO, María del Mar and MIRANDA-
GARCÍA, Marta. Does the macroeconomic context condition the
prediction of business failure? ECORFAN Journal-Mexico. 2019.
The branches that verify more
companies (stronger) are those that we must
analyze and interpret since they would reflect
certain patterns since they are supported by the
majority of the cases. To analyze bankruptcy
(class 1) we have the following branches that
represent the strongest rule:
- Branch 1. All companies, according to
the classification criteria provided by
the response variable (bankruptcy or no
bankruptcy), can be classified according
to first to the microeconomic variable
known as the global solvency ratio X2.
The higher the result of this quotient, the
more the company depends on outside
resources. For values higher than 0.6054
in this ratio, the tree suggests the
analysis of another additional variable,
i.e. the microeconomic variable X1.
- Branch 2. This branch corresponds to
the analysis of variable X1, the financial
ratio of current liquidity that measures
the share of total financing in short-term
investments, the greater the ratio, the
greater the short-term liquidity of the
company. The decision tree suggests the
analysis of the Macroeconomic variable
GII for values lower than 0.5563.
- Branch 3 refers to the analysis of the
variable GII (global insolvency index).
The higher this indicator, the lower the
level of solvency of a company. For
values greater than 0.1031 the company
would be classified as bankruptcy, a
situation that is fulfilled in 24 cases, i.e.
a total of 30% of the sample.
In the same way, we will analyze the
healthy companies (class 0- no bankruptcy) we
have the following branches that represent the
strongest rule. In this case, we have a single
branch that, following the same criterion, shows
that all companies can be classified by first
taking into account variable X2.
Analyzed inversely, the lower the result
of this quotient, the less the company depends
on external resources. That is why the tree
suggests that for values lower than 0.6054 of
this variable, the company would be classified
directly as healthy without the need for any
other additional variable, a situation that is
fulfilled in 37 cases, that is, a total of 46% of
the sample.
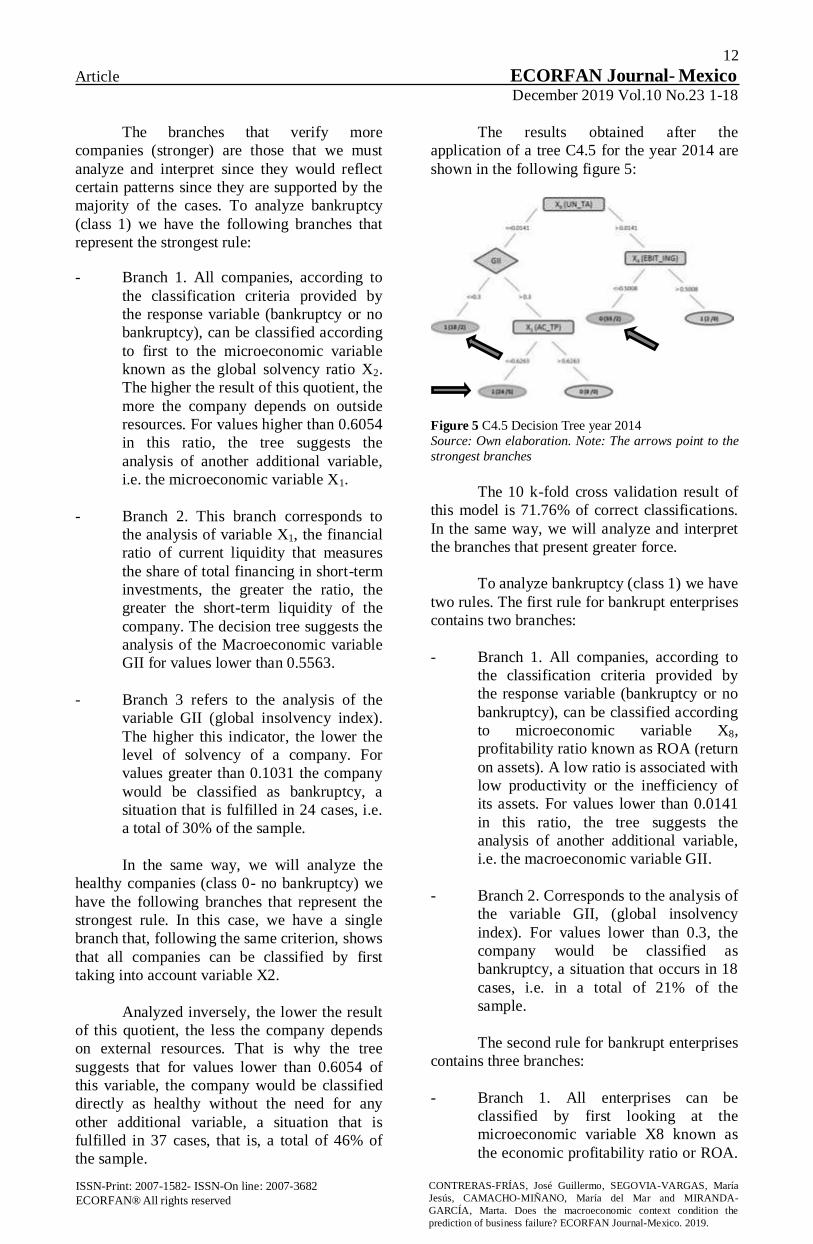
The results obtained after the
application of a tree C4.5 for the year 2014 are
shown in the following figure 5:
Figure 5 C4.5 Decision Tree year 2014
Source: Own elaboration. Note: The arrows point to the
strongest branches
The 10 k-fold cross validation result of
this model is 71.76% of correct classifications.
In the same way, we will analyze and interpret
the branches that present greater force.
To analyze bankruptcy (class 1) we have
two rules. The first rule for bankrupt enterprises
contains two branches:
- Branch 1. All companies, according to
the classification criteria provided by
the response variable (bankruptcy or no
bankruptcy), can be classified according
to microeconomic variable X8,
profitability ratio known as ROA (return
on assets). A low ratio is associated with
low productivity or the inefficiency of
its assets. For values lower than 0.0141
in this ratio, the tree suggests the
analysis of another additional variable,
i.e. the macroeconomic variable GII.
- Branch 2. Corresponds to the analysis of
the variable GII, (global insolvency
index). For values lower than 0.3, the
company would be classified as
bankruptcy, a situation that occurs in 18
cases, i.e. in a total of 21% of the
sample.
The second rule for bankrupt enterprises
contains three branches:
- Branch 1. All enterprises can be
classified by first looking at the
microeconomic variable X8 known as
the economic profitability ratio or ROA.
13
Article ECORFAN Journal- Mexico December 2019 Vol.10 No.23 1-18
ISSN-Print: 2007-1582- ISSN-On line: 2007-3682
ECORFAN® All rights reserved
CONTRERAS-FRÍAS, José Guillermo, SEGOVIA-VARGAS, María
Jesús, CAMACHO-MIÑANO, María del Mar and MIRANDA-
GARCÍA, Marta. Does the macroeconomic context condition the
prediction of business failure? ECORFAN Journal-Mexico. 2019.
For values lower than 0.0141 in this
ratio, the tree suggests the analysis of
another additional variable, i.e. the
macroeconomic variable GII.
- Branch 2. It corresponds to the analysis
of the macroeconomic variable GII
(global insolvency index, the higher this
indicator, the lower the level of
solvency of a company). For values
greater than 0.3 in this indicator, the tree
suggests the analysis of another
additional variable, i.e. microeconomic
variable X1.
- Branch 3. It corresponds to the analysis
of variable X1, (current liquidity
coefficient). For values lower than
0.6263 in this variable, the company
would be classified as bankruptcy, a
situation that is fulfilled in 24 cases, i.e.
a total of 28% of the sample.
Similarly, we will analyze healthy
enterprises (class 0-no bankruptcy) for which
we only have one strong rule with two
branches:
- Branch 1. All enterprises can be
classified first by the microeconomic
variable X8, i.e. by the ROA. As
mentioned above, a high ratio is
synonymous with very efficient and
productive assets. For values greater
than 0.0141, the tree suggests the
analysis of another additional variable,
i.e. microeconomic variable X4.
- It corresponds to the analysis of the
microeconomic variable X4 or net profit
margin or profitability of income; it
indicates how much profit is obtained by
each monetary unit of sales and
therefore, the lower the indicator, the
less profit is obtained by the sales made.
For values lower than 0.5008, the
company would be classified as
bankrupt, a situation that is fulfilled in
33 cases, i.e. a total of 39% of the
sample.
From the analyses carried out, it can be
inferred that in order to identify the micro and
macroeconomic variables that are most
significant for analyzing the probabilities of
early business failure, the ratios X1 (current
liquidity coefficient), X2 (global solvency ratio)
and X8 (ROA) are the variables to be taken into
account and with the patterns shown by the
rules.
4. Results and discussion
The results show that increasing the predictive
capacity or power of business failure prediction
models can be approached from two different
approaches. The first of these approaches relate
to the appropriate choice of variables and the
second relates to the appropriate choice of
methodology or application technique used. In
general terms, the research work carried out in
this sense indicates that the precision of
bankruptcy models cannot be appreciably
improved by the choice of one or another
classification algorithm. For example, in the
work carried out by Karas and Režňáková,
(2014) for the case of companies in the Czech
Republic, a parametric vs. a nonparametric
method applied to the same initial sample was
tested and obtaining as results for the case of
the parametric methodology (discriminant
analysis) 8 significant ratios and 7 for the case
of the nonparametric (trees), obtaining 3 ratios
in common. At the same time, Olmeda and
Fernández (1997) compare the precision of
parametric and non-parametric classifiers
suggesting that an optimal system for risk
classification should combine two or more
different techniques.
The results presented in this research
work show that the application of parametric
and nonparametric techniques does not show
significant differences for the variables with the
best predictive capacity. As can be seen in
Table 6, under these two approaches, the
microeconomic variables or financial ratios that
present greater predictive power X1, X2, X8 are
coincident. Variable X2 (overall solvency ratio)
and variable X8 (return on assets - ROA) have
been present in most of the research work
related to business failure.
14
Article ECORFAN Journal- Mexico December 2019 Vol.10 No.23 1-18
ISSN-Print: 2007-1582- ISSN-On line: 2007-3682
ECORFAN® All rights reserved
CONTRERAS-FRÍAS, José Guillermo, SEGOVIA-VARGAS, María
Jesús, CAMACHO-MIÑANO, María del Mar and MIRANDA-
GARCÍA, Marta. Does the macroeconomic context condition the
prediction of business failure? ECORFAN Journal-Mexico. 2019.
It is to be expected that these variables
will have great relevance in the study since, on
the one hand, the global solvency ratio relates
the totality of assets that a company has to meet
its total obligations, the same relationship that
indicates that the more dependent the company
is on external resources, the greater the
possibility of filing for bankruptcy.
On the other hand, the ROA or
profitability on assets shows how much cash
the company's assets are being and, therefore,
they generate greater profitability, causing at
the same time that the company has the
capacity to solve the financing that the
company has from external resources.
The X1 ratio (current liquidity ratio) is
part of the liquidity factors and its presence as a
significant ratio within the models is more than
justified because these indicators demonstrate
the overall ability of a company to pay its debts
(short and long term), if necessary by
liquidating the assets quickly or converting
them into cash.
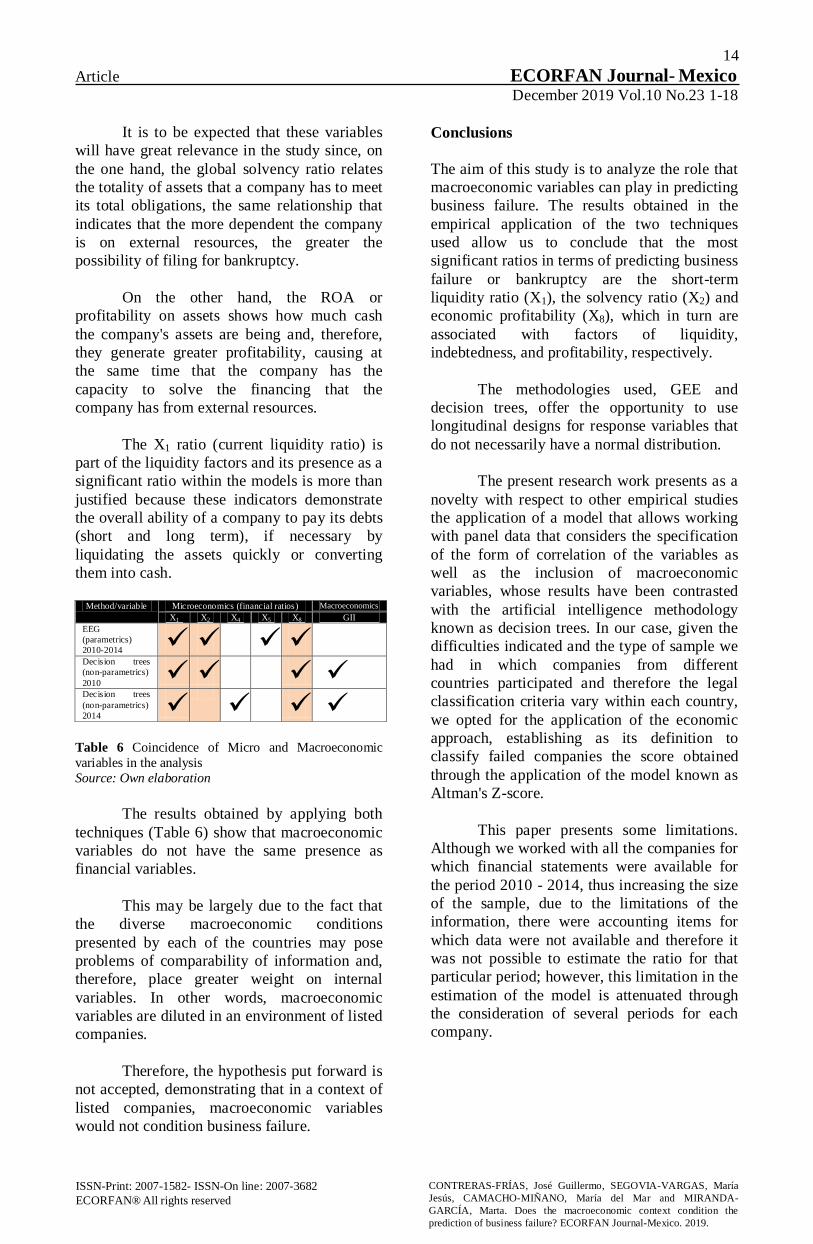
Method/variable Microeconomics (financial ratios) Macroeconomics
X1 X2 X4 X5 X8 GII
EEG
(parametrics)
2010-2014
Decision trees
(non-parametrics)
2010
Decision trees
(non-parametrics)
2014
Table 6 Coincidence of Micro and Macroeconomic
variables in the analysis
Source: Own elaboration
The results obtained by applying both
techniques (Table 6) show that macroeconomic
variables do not have the same presence as
financial variables.
This may be largely due to the fact that
the diverse macroeconomic conditions
presented by each of the countries may pose
problems of comparability of information and,
therefore, place greater weight on internal
variables. In other words, macroeconomic
variables are diluted in an environment of listed
companies.
Therefore, the hypothesis put forward is
not accepted, demonstrating that in a context of
listed companies, macroeconomic variables
would not condition business failure.
Conclusions
The aim of this study is to analyze the role that
macroeconomic variables can play in predicting
business failure. The results obtained in the
empirical application of the two techniques
used allow us to conclude that the most
significant ratios in terms of predicting business
failure or bankruptcy are the short-term
liquidity ratio (X1), the solvency ratio (X2) and
economic profitability (X8), which in turn are
associated with factors of liquidity,
indebtedness, and profitability, respectively.
The methodologies used, GEE and
decision trees, offer the opportunity to use
longitudinal designs for response variables that
do not necessarily have a normal distribution.
The present research work presents as a
novelty with respect to other empirical studies
the application of a model that allows working
with panel data that considers the specification
of the form of correlation of the variables as
well as the inclusion of macroeconomic
variables, whose results have been contrasted
with the artificial intelligence methodology
known as decision trees. In our case, given the
difficulties indicated and the type of sample we
had in which companies from different
countries participated and therefore the legal
classification criteria vary within each country,
we opted for the application of the economic
approach, establishing as its definition to
classify failed companies the score obtained
through the application of the model known as
Altman's Z-score.
This paper presents some limitations.
Although we worked with all the companies for
which financial statements were available for
the period 2010 - 2014, thus increasing the size
of the sample, due to the limitations of the
information, there were accounting items for
which data were not available and therefore it
was not possible to estimate the ratio for that
particular period; however, this limitation in the
estimation of the model is attenuated through
the consideration of several periods for each
company.
15
Article ECORFAN Journal- Mexico December 2019 Vol.10 No.23 1-18
ISSN-Print: 2007-1582- ISSN-On line: 2007-3682
ECORFAN® All rights reserved
CONTRERAS-FRÍAS, José Guillermo, SEGOVIA-VARGAS, María
Jesús, CAMACHO-MIÑANO, María del Mar and MIRANDA-
GARCÍA, Marta. Does the macroeconomic context condition the
prediction of business failure? ECORFAN Journal-Mexico. 2019.
However, we consider that all financial
models for the prediction of business failure
should only be taken as a reference parameter,
that is, only as an indicator and as a support
tool for the business diagnosis, and should be
complemented with the different types of
corresponding financial analysis as well as with
the experience observed through the years and
the socioeconomic environment in which the
company under study performs.
There is no doubt that in the last few
decades the analysis of business solvency has
become a key piece and an issue of concern
worldwide, mainly due to the increase in the
number of business bankruptcies (which are
more frequent day by day regardless of
geographical location or developed economic
activity), the development of new financial
instruments and, in general, to the globalization
that has great importance for companies since it
allows free trade and opens up competition in
international markets.
With what has been said so far and after
having tackled the problem of a business
bankruptcy or failure from two different
perspectives, we can conclude that there are
great survival challenges that companies face
worldwide and that would be the object of
future lines of research.
References
Agarwal, V. & Taffler, R. (2008). Comparing
the performance of market-based and
accounting-based bankruptcy prediction
models. Journal of Banking & Finance,
32(8),1541-1551.
Altman, E. I. (1968). Financial ratios,
discriminant analysis and the prediction of
corporate bankruptcy. The Journal of Finance,
23 (4), 589-609.
Altman, E. I. & Narayanan, P. (1997). An
international survey of business failure
classification models. Financial Markets,
Institutions & Instruments, 6(2), 1-57.
Altman, E.I., Iwanicz-Drozdowska, M.,
Laitinen, E.K. & Suvas, A. (2017). Financial
distress prediction in an international context: a
review and empirical analysis of Altman’s z-
score model. Journal of International Financial
Management & Accounting, 28(2), 131-171.
Aziz, M. & Dar, H., (2006). Predicting
corporate bankruptcy - where we stand?
Corporate Governance Journal, 6 (1), 18–33.
Balcaen, S. & Ooghe, H. (2006). 35 years of
studies on business failure: an overview of the
classic statistical methodologies and their
related problems. The British Accounting
Review, 38(1), 63-93.
Barniv, R. Agarwal, A., & Leach, R. (1997).
Predicting the outcome following bankruptcy
filing: a three‐state classification using neural
networks. Intelligent Systems in Accounting,
Finance and Management, 6(3), 177-194.
Bauer, J. & Agarwal, V. (2014). Are hazard
models superior to traditional bankruptcy
prediction approaches? A comprehensive test.
Journal of Banking & Finance, 40, 432-442.
Beaver, W. H. (1966): Financial Ratios as
Predictors of Failure. Empirical Research in
Accounting: Selected Studies, University of
Chicago.
Bellovary, J. L., Giacomino, D. E., & Akers, M.
D. (2007). A review of bankruptcy prediction
studies: 1930 to present. Journal of Financial
Education, 1, 3-41.
Beraho, E. K., & Elisu, R. (2010). Influence of
country culture on bankruptcy and insolvency
legal reform management. International
Journal of Management & Information
Systems, 14(2), 39-49.
Brealey, R. & Myers, B. (1999). Principles of
corporate finance. USA, Edit. McGraw-Hill.
Camacho-Miñano, M.M., Segovia-Vargas, M.J.
& Pascual-Ezama D. (2015). Which
Characteristics do the Insolvent Firms Have to
Get Survival? A SME Reorganization
Prediction Model. Journal of Small Business
Management, 53 (2), 340-354.
Campa, D. & Camacho-Miñano, M. M. (2014).
Earnings management among bankrupt non-
listed firms: evidence from Spain. Spanish
Journal of Finance and Accounting/Revista
Espanola de Financiacion y Contabilidad,
43(1), 3-20.
16
Article ECORFAN Journal- Mexico December 2019 Vol.10 No.23 1-18
ISSN-Print: 2007-1582- ISSN-On line: 2007-3682
ECORFAN® All rights reserved
CONTRERAS-FRÍAS, José Guillermo, SEGOVIA-VARGAS, María
Jesús, CAMACHO-MIÑANO, María del Mar and MIRANDA-
GARCÍA, Marta. Does the macroeconomic context condition the
prediction of business failure? ECORFAN Journal-Mexico. 2019.
Chava, S. & Purnanandam, A. (2010). Is default
risk negatively related to stock returns? Review
of Financial Studies, 23(6), 2523-2559.
Chiu, W. C., Peña, J. I. & Wang, C. W. (2013).
Do structural constraints of the industry matter
for corporate failure prediction? Investment
Analysts Journal, 78, 65-81.
Collins, D.W., Maydew, E.L., Weiss, I.S.
(1997). Changes in the value-relevance of
earnings and book values over the past forty
years. Journal of Accounting and Economics,
24, 39 - 67.
Contreras, J., Segovia-Vargas, M.J & Camacho,
M. M. (2014). Origen del endeudamiento en
empresas mexicanas y su entrada en concurso
mercantil-Propuesta de detección anticipada de
la insolvencia. Crecimiento Empresarial,
ECORFAN, 23-38. http://www.ecorfan.org/ser ies/riesgos/Serie_Topicos%20selectos%20de%20
Riesgos_3.pdf (Acceso el 15 de abril de 2018)
Das, S. R., Hanouna, P. & Sarin, A. (2009).
Accounting-based versus market-based cross-
sectional models of CDS spreads. Journal of
Banking & Finance, 33(4), 719-730.
Davydenko, S. A. & Franks, J. R. (2008). Do
bankruptcy codes matter? A study of defaults in
France, Germany, and the UK. The Journal of
Finance, 63(2), 565-608.
De Andrés, J., Landajo, M. & Lorca, P. (2012).
Bankruptcy prediction models based on
multinorm analysis: An alternative to
accounting ratios. Knowledge-Based Systems,
30, 67-77.
Díaz Martínez, Z., Segovia-Vargas, M. J. &
Fernández Menéndez, J. (2005). Machine
learning and statistical techniques. An
application to the prediction of insolvency in
Spanish non-life insurance companies. The
International Journal of Digital Accounting
Research, 5 (9), 1-45.
Du Jardin, P. (2018). Failure pattern-based
ensembles applied to bankruptcy forecasting.
Decision Support Systems, 107, 64-77.
Fitzpatrick, P. J. (1932). A comparison of ratios
of successful industrial enterprises with those of
failed firms. Certified Public Accountant, 10(2),
598-605, 656–662 y 727–731.
Francis, J. & Shipper, K. (1999). Have
Financial Statements Lost Their Relevance?.
Journal of Accounting Research. 37 (2), 319-
352.
Gelashvili, V., Segovia-Vargas, M. J. &
Camacho-Miñano, M. M. (2015). Patrones de
supervivencia para la gestión de los centros
especiales de empleo. Revista de Estudios
Empresariales, 1,109-126.
Hernández Tinoco, M. & Wilson, N. (2013).
Financial distress and bankruptcy prediction
among listed companies using accounting,
market and macroeconomic variables.
International Review of Financial Analysis, 30,
394-419.
Hillegeist, S. A., Keating, E. K., Cram, D. P. &
Lundstedt, K. G. (2004). Assessing the
probability of bankruptcy. Review of
Accounting Studies, 9(1), 5-34.
Kallunki, J. P. & Pyykkö, E. (2013). Do
defaulting CEOs and directors increase the
likelihood of financial distress of the firm?
Review of Accounting Studies, 18(1), 228-260.
Karas, M. & Režňáková, M. (2014). A
parametric or nonparametric approach for
creating a new bankruptcy prediction model:
The Evidence from the Czech Republic.
International Journal of Mathematical Models
and Methods in Applied Sciences, 8(1), 214-
223.
Korol, T. (2013). Early warning models against
bankruptcy risk for Central European and Latin
American enterprises. Economic Modelling, 31,
22-30.
Laitinen, E. K. (2002). Financial rating of
European technology companies: an
international comparison. Journal of Business
Finance & Accounting, 29(7‐8), 871-901.
Laitinen, E. K. & Laitinen, T. (2009). Audit
report in payment default prediction: A
contingency approach. International Journal of
Auditing, 13(3), 259-280.
Laitinen, E. K. & Suvas, A. (2013).
International Applicability of Corporate Failure
Risk Models Based on Financial Statement
Information: Comparisons across European
Countries. Journal of Finance & Economics, 1(3),
1-26.
17
Article ECORFAN Journal- Mexico December 2019 Vol.10 No.23 1-18
ISSN-Print: 2007-1582- ISSN-On line: 2007-3682
ECORFAN® All rights reserved
CONTRERAS-FRÍAS, José Guillermo, SEGOVIA-VARGAS, María
Jesús, CAMACHO-MIÑANO, María del Mar and MIRANDA-
GARCÍA, Marta. Does the macroeconomic context condition the
prediction of business failure? ECORFAN Journal-Mexico. 2019.
Laporta, R., López de Silanes, F., Shleifer, A.
& Vishny, R.W. (1998). Law and finance.
Journal of Political Economy, 106 (6), 1113-
1155.
Lee, S. H., Yamakawa, Y., Peng, M. W., &
Barney, J. B. (2011). How do bankruptcy laws
affect entrepreneurship development around the
world? Journal of Business Venturing, 26(5),
pp. 505-520.
Levine, R. (1998). The legal environment,
banks, and long-run economic growth. Journal
of Money, Credit y Banking, 30(3), 596-613.
Liang, K. Y. & Zeger, S. L. (1986).
Longitudinal data analysis using generalized
linear models. Biometrika, 73(1), 13-22.
Lukason, O. (2016). Characteristics of firm
failure processes in an international context.
Doctoral dissertation. University of Tartu.
Lussier, R. N. (1995). A nonfinancial business
success versus failure prediction model for
young firms. Journal of Small Business
Management, 33(1), 8-20.
Marais, M. L., Patell, J. M. & Wolfson, M. A.
(1984). The experimental design of
classification models: An application of
recursive partitioning and bootstrapping to
commercial bank loan classifications. Journal
of Accounting Research, 22, 87-114.
Meeks, G. & Meeks, J. G. (2009). Self‐
fulfilling prophecies of failure: the endogenous
balance sheets of distressed companies. Abacus,
45(1), 22-43.
Molina, J. & García, J. (2006). Técnicas de
análisis de datos: aplicaciones prácticas
utilizando Microsoft Excel y Weka. Universidad Carlos III de Madrid España.
Muñoz Izquierdo, N. (2017). The impact of
auditing on financial distress prediction.
Doctoral dissertation. Madrid: UCM
Noga, T. J. & Schnader, A. L. (2013). Book-tax
differences as an indicator of financial distress.
Accounting Horizons, 27(3), 469-489.
Ohlson, J. A. (1980). Financial ratios and the
probabilistic prediction of bankruptcy. Journal
of Accounting Research, 18(1), 109-131.
Olmeda, I. & Fernández, E. (1997). Hybrid
classifiers for financial multicriteria decision
making: The case of bankruptcy prediction.
Computational Economics, 10(4), 317-335.
Pindado, J., Rodriguez, L. & de la Torre, C.
(2008). How do insolvency codes affect a
firm’s investment? International Review of Law
and Economics, 28(4), 227-238.
Quinlan, J.R. (1993). C4.5: Programs for
machine learning. Morgan Kaufmann, Inc.
California.
Ravi Kumar, P. & Ravi, V. (2007). Bankruptcy
prediction in banks and firms via statistical and
intelligent techniques - A review. European
Journal of Operational Research, 180(1), 1-28.
Ravid, S. A. & Sundgren, S. (1998). The
comparative efficiency of small-firm
bankruptcies: A study of the US and Finnish
bankruptcy codes. Financial Management,
27(4), 28-40.
Reza, F. M. (1961) An introduction to
information theory. Courier Corporation.
Segovia-Vargas & Camacho-Miñano, (2018).
Analysis of corporate viability in the pre-
bankruptcy proceedings. Revista Contaduría y
Administración, 63, 250-271
Tascón Fernández, M. T. & Castaño Gutiérrez,
F. J. (2012). Variables y modelos para la
identificación y predicción del fracaso
empresarial: revisión de la investigación
empírica reciente. Revista de Contabilidad -
Spanish Accounting Review, 15(1), 7-58.
Tinoco, M. Á., Venegas, F. & Torres, V. H.
(2018). Effects of inflation on financial sector
performance: New evidence from panel
quantile regressions. Investigación
Económica, 77(303), 94-129.
Yeh, C. C., Lin, F. & Hsu, C. Y. (2012). A
hybrid KMV model, random forests and rough
set theory approach for credit rating.
Knowledge-Based Systems, 33, 166-172.
Weijs, R. J. (2012).Harmonisation of European
Insolvency Law and the Need to Tackle Two
Common Problems: Common Pool and
Anticommons. International Insolvency
Review, 21(2), 67-83.

18
Article ECORFAN Journal- Mexico December 2019 Vol.10 No.23 1-18
ISSN-Print: 2007-1582- ISSN-On line: 2007-3682
ECORFAN® All rights reserved
CONTRERAS-FRÍAS, José Guillermo, SEGOVIA-VARGAS, María
Jesús, CAMACHO-MIÑANO, María del Mar and MIRANDA-
GARCÍA, Marta. Does the macroeconomic context condition the
prediction of business failure? ECORFAN Journal-Mexico. 2019.
Winakor, C.H. & Smith, R.F. (1935). Changes
in Financial Structures of Unsuccessful
Industrial Companies. Bureau of Economic
Research. University of Illinois Press, 51.
Witten, I. H. & Frank, E. (2005). Data Mining:
Practical machine learning tools and
techniques. Morgan Kaufmann.
Zmijewski, M. E. (1984). Methodological
issues related to the estimation of financial
distress prediction models. Journal of
Accounting Research, 22, 59-82.
19
Article ECORFAN Journal- Mexico December 2019 Vol.10 No.23 19-33
Investigation of the effect of the brand equity on the repurchase intention by
mediation of the brand attractiveness and brand trust
Investigación del efecto del valor de la marca en la intención de recompra por
mediación del atractivo de la marca y la confiabilidad de la marca
HASANI-NASAB, Mahmood†
Islamic Azad University, Department of Management, Malayer Branch, Malayer, Iran
ID 1st Author: Mahmood, Hasani-Nasab / ORC ID: 0000-0003-4507-4313, Researcher ID Thomson: Q-6779-2118
DOI: 10.35429/EJM.2019.23.10.19.33 Received July 24, 2019; Accepted September 10, 2019
Abstract
The objective of the present research is evaluating the effect of the brand equity on the repurchase intention by
mediation of the brand attractiveness and brand trust. The
present research is applied and descriptive- survey. The
population of this study include 188 staff of Iran
insurance company in Hamedan city. The volume of
sample considering the Morgan table equals to 127
people. The sampling method is simple random method.
Data gathering tool is standard questionnaire. The
conformity factor analysis method was used in order to
validity examination. The Cronbach’s alpha was used for
reliability evaluation LIZREL Software was used for date
analysis of the structural equations modeling. the
obtained results indicated that the brand equity, the brand
attractiveness and brand trust have a positive and
significant effect on the repurchase intention of Iran
insurance company of Hamedan.
Brand equity, Repurchase intention, Brand
attractiveness, Brand trust
Resumen
El objetivo de la presente investigación es evaluar el efecto del valor de la marca en la intención de recompra
mediante la mediación del atractivo y la confianza de la
marca. La presente investigación es aplicada y
descriptiva-encuesta. La población de este estudio
incluye 188 empleados de la compañía de seguros de Irán
en la ciudad de Hamedan. El volumen de muestra
considerando la tabla Morgan equivale a 127 personas. El
método de muestreo es un método aleatorio simple. La
herramienta de recopilación de datos es un cuestionario
estándar. El método de análisis del factor de conformidad
se utilizó para el examen de validez. El alfa de Cronbach
se usó para la evaluación de confiabilidad. El software
LIZREL se usó para el análisis de fechas del modelado
de ecuaciones estructurales. Los resultados obtenidos
indicaron que el valor de la marca, el atractivo de la
marca y la confianza de la marca tienen un efecto
positivo y significativo en la intención de recompra de la compañía de seguros iraní de Hamedan.
Valor de marca, Intención de recompra, Atractivo de
marca, Confianza de marca
Citation: HASANI-NASAB, Mahmood. Investigation of the effect of the brand equity on the repurchase intention by
mediation of the brand attractiveness and brand trust. ECORFAN Journal-Mexico. 2019, 10-23: 19-33.
† Researcher contributing first author.
© ECORFAN Journal - Mexico www.ecorfan.org
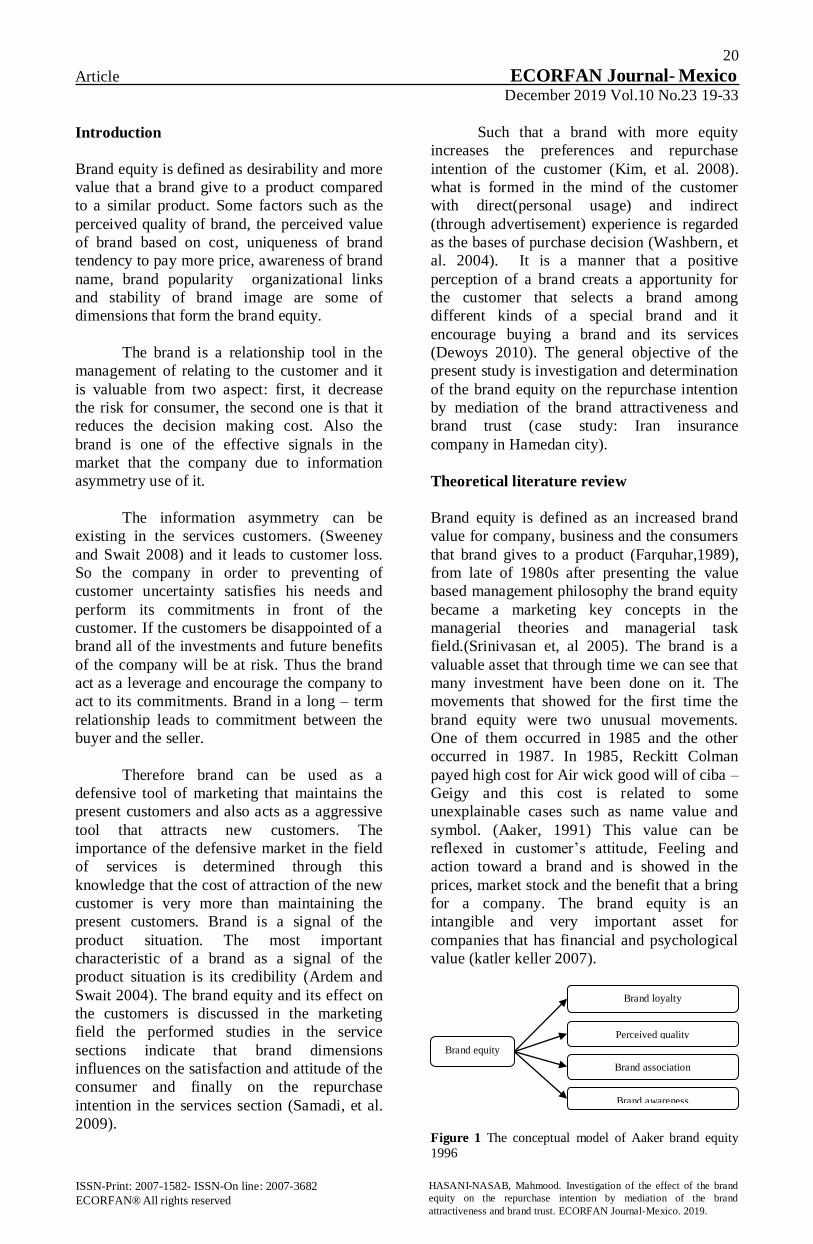
20
Article ECORFAN Journal- Mexico December 2019 Vol.10 No.23 19-33
ISSN-Print: 2007-1582- ISSN-On line: 2007-3682
ECORFAN® All rights reserved
HASANI-NASAB, Mahmood. Investigation of the effect of the brand
equity on the repurchase intention by mediation of the brand
attractiveness and brand trust. ECORFAN Journal-Mexico. 2019.
Introduction
Brand equity is defined as desirability and more
value that a brand give to a product compared
to a similar product. Some factors such as the
perceived quality of brand, the perceived value
of brand based on cost, uniqueness of brand
tendency to pay more price, awareness of brand
name, brand popularity organizational links
and stability of brand image are some of
dimensions that form the brand equity.
The brand is a relationship tool in the
management of relating to the customer and it
is valuable from two aspect: first, it decrease
the risk for consumer, the second one is that it
reduces the decision making cost. Also the
brand is one of the effective signals in the
market that the company due to information
asymmetry use of it.
The information asymmetry can be
existing in the services customers. (Sweeney
and Swait 2008) and it leads to customer loss.
So the company in order to preventing of
customer uncertainty satisfies his needs and
perform its commitments in front of the
customer. If the customers be disappointed of a
brand all of the investments and future benefits
of the company will be at risk. Thus the brand
act as a leverage and encourage the company to
act to its commitments. Brand in a long – term
relationship leads to commitment between the
buyer and the seller.
Therefore brand can be used as a
defensive tool of marketing that maintains the
present customers and also acts as a aggressive
tool that attracts new customers. The
importance of the defensive market in the field
of services is determined through this
knowledge that the cost of attraction of the new
customer is very more than maintaining the
present customers. Brand is a signal of the
product situation. The most important
characteristic of a brand as a signal of the
product situation is its credibility (Ardem and
Swait 2004). The brand equity and its effect on
the customers is discussed in the marketing
field the performed studies in the service
sections indicate that brand dimensions
influences on the satisfaction and attitude of the
consumer and finally on the repurchase
intention in the services section (Samadi, et al.
2009).
Such that a brand with more equity
increases the preferences and repurchase
intention of the customer (Kim, et al. 2008).
what is formed in the mind of the customer
with direct(personal usage) and indirect
(through advertisement) experience is regarded
as the bases of purchase decision (Washbern, et
al. 2004). It is a manner that a positive
perception of a brand creats a apportunity for
the customer that selects a brand among
different kinds of a special brand and it
encourage buying a brand and its services
(Dewoys 2010). The general objective of the
present study is investigation and determination
of the brand equity on the repurchase intention
by mediation of the brand attractiveness and
brand trust (case study: Iran insurance
company in Hamedan city).
Theoretical literature review
Brand equity is defined as an increased brand
value for company, business and the consumers
that brand gives to a product (Farquhar,1989),
from late of 1980s after presenting the value
based management philosophy the brand equity
became a marketing key concepts in the
managerial theories and managerial task
field.(Srinivasan et, al 2005). The brand is a
valuable asset that through time we can see that
many investment have been done on it. The
movements that showed for the first time the
brand equity were two unusual movements.
One of them occurred in 1985 and the other
occurred in 1987. In 1985, Reckitt Colman
payed high cost for Air wick good will of ciba –
Geigy and this cost is related to some
unexplainable cases such as name value and
symbol. (Aaker, 1991) This value can be
reflexed in customer’s attitude, Feeling and
action toward a brand and is showed in the
prices, market stock and the benefit that a bring
for a company. The brand equity is an
intangible and very important asset for
companies that has financial and psychological
value (katler keller 2007).
Figure 1 The conceptual model of Aaker brand equity
1996
Brand loyalty
Perceived quality
Brand association
Brand awareness
Brand equity

21
Article ECORFAN Journal- Mexico December 2019 Vol.10 No.23 19-33
ISSN-Print: 2007-1582- ISSN-On line: 2007-3682
ECORFAN® All rights reserved
HASANI-NASAB, Mahmood. Investigation of the effect of the brand
equity on the repurchase intention by mediation of the brand
attractiveness and brand trust. ECORFAN Journal-Mexico. 2019.
Awareness of the brand is the ability
of the buyer in distinction and reminding a
brand that is placed in a special class of
products. It means the informational nodes
strength about a brand in individuals mind
(Keller, 2008).
Association of the brand is defined as
something that guides the brand toward the
customers mind. When a brand is stabled in the
customers mind creating linkage between
associations and the brand will be easier and
accordingly the customers can understand the
difference between brands and decide to
purchase (Aaker, 1991).
The perceived quality is defined as the
customer’s judgment about preference of the
services. Services quality has an abstract and
intangible structure from identity point of view
and it is not identifiable easity (Bamert,wehrli,
kim 2005).
Brand loyalty is defined as customer’s
attachment to the brand.The strong attachment
is the customer’s resistance against brand
changing and brand sustainability in stormy
environments.
Purchase intention: the intention is an
important factor in the attitude structure and can
predict the actual behavior. when the purchase
intention is high the purchase probability will
be increased (Kheyvi, Fathali, 2015).
Repurchase intention is repetitative purchasing
of special goods and services from a shop
(Hellier, 2003) and the main reason of it is the
experiences after purchasing. the companies
can instead of new customers attraction with
lower assessment cost maintain their previous
customers (Zeithaml, 1996). In the marketing
literature there are many studies that mostly
have examined the relationship between the
repurchase intention and the perceived quality
(Alexndris, 2002). In other words the perceived
quality has a positive effect on the repurchase
intention. In a study that has been done in
internet shops and websites kuo stated that the
online services quality has a positive correlation
with continuous using of web, referring other
people and customer loyalty.
Figure 2 The conceptual model of the repurchase
intention khayeri
Source: Fatahli (2015)
The consumers attitude toward the
products. The marketing approach for identify
the attitudes to the products, brands and
services is used to matching the marketing
strategies for reflecting the product. Ajzan and
Fishbin (1980) stated that the marketer can
through creating ideas of the norms and their
definition with new concepts that is resulted in
evaluations changing has influence on the
customer intention (Kheri, Fathali, 1994)
Mental image: An image that a person
has of the objective and subjective phenomena
is defined as mental image (Kheyri, Fathali,
2015).
Perception of the shop brand: The
perception is a canal and viewpoint that we can
observe and understand the external world. The
perception is more complex than feeling. The
conceptual process includes the effect of
selection and organizing and interpreting:
1. The factors of the characteristic of the
preceptor such as attitudes, expectances
interests,experiences and personality
(internal factors).
2. The factors that are related to the
subject, situation, purpose and context
(external factors).
Social effect: Awareness from this
subject that the consumer status is depended on
other people presence can effect on the
consumers performance. The social effect on
purchase intention of merchandises and services
has been discussed and supported by many of
researchers in an experimental method. The
consumers that is adaptable socially are excited
for obtaining a product for showing their social
situation and obtaining social groups.
Customer’s attitude from staff
point of view
Mental image
Services quality
Repurchase
intention
Social effect
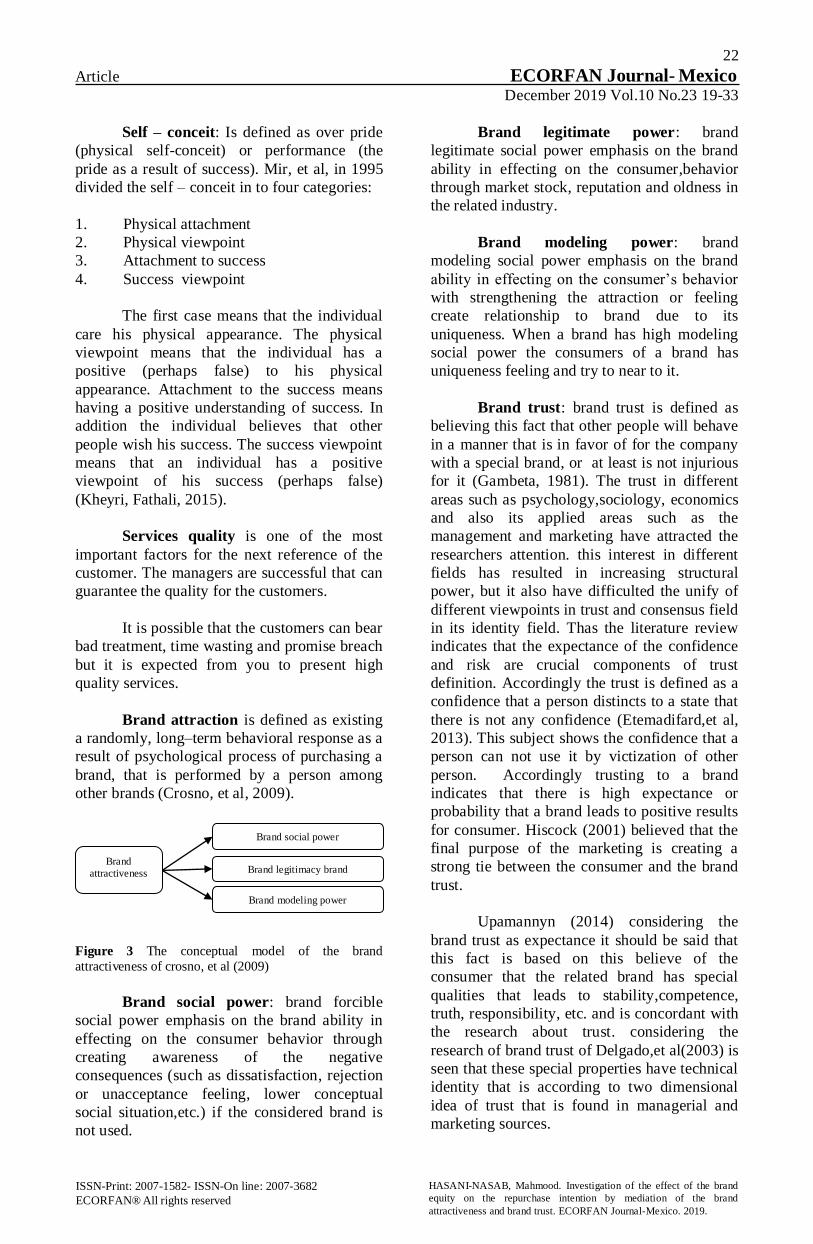
22
Article ECORFAN Journal- Mexico December 2019 Vol.10 No.23 19-33
ISSN-Print: 2007-1582- ISSN-On line: 2007-3682
ECORFAN® All rights reserved
HASANI-NASAB, Mahmood. Investigation of the effect of the brand
equity on the repurchase intention by mediation of the brand
attractiveness and brand trust. ECORFAN Journal-Mexico. 2019.
Self – conceit: Is defined as over pride
(physical self-conceit) or performance (the
pride as a result of success). Mir, et al, in 1995
divided the self – conceit in to four categories:
1. Physical attachment
2. Physical viewpoint
3. Attachment to success
4. Success viewpoint
The first case means that the individual
care his physical appearance. The physical
viewpoint means that the individual has a
positive (perhaps false) to his physical
appearance. Attachment to the success means
having a positive understanding of success. In
addition the individual believes that other
people wish his success. The success viewpoint
means that an individual has a positive
viewpoint of his success (perhaps false)
(Kheyri, Fathali, 2015).
Services quality is one of the most
important factors for the next reference of the
customer. The managers are successful that can
guarantee the quality for the customers.
It is possible that the customers can bear
bad treatment, time wasting and promise breach
but it is expected from you to present high
quality services.
Brand attraction is defined as existing
a randomly, long–term behavioral response as a
result of psychological process of purchasing a
brand, that is performed by a person among
other brands (Crosno, et al, 2009).
Figure 3 The conceptual model of the brand
attractiveness of crosno, et al (2009)
Brand social power: brand forcible
social power emphasis on the brand ability in
effecting on the consumer behavior through
creating awareness of the negative
consequences (such as dissatisfaction, rejection
or unacceptance feeling, lower conceptual
social situation,etc.) if the considered brand is
not used.
Brand legitimate power: brand
legitimate social power emphasis on the brand
ability in effecting on the consumer,behavior
through market stock, reputation and oldness in
the related industry.
Brand modeling power: brand
modeling social power emphasis on the brand
ability in effecting on the consumer’s behavior
with strengthening the attraction or feeling
create relationship to brand due to its
uniqueness. When a brand has high modeling
social power the consumers of a brand has
uniqueness feeling and try to near to it.
Brand trust: brand trust is defined as
believing this fact that other people will behave
in a manner that is in favor of for the company
with a special brand, or at least is not injurious
for it (Gambeta, 1981). The trust in different
areas such as psychology,sociology, economics
and also its applied areas such as the
management and marketing have attracted the
researchers attention. this interest in different
fields has resulted in increasing structural
power, but it also have difficulted the unify of
different viewpoints in trust and consensus field
in its identity field. Thas the literature review
indicates that the expectance of the confidence
and risk are crucial components of trust
definition. Accordingly the trust is defined as a
confidence that a person distincts to a state that
there is not any confidence (Etemadifard,et al,
2013). This subject shows the confidence that a
person can not use it by victization of other
person. Accordingly trusting to a brand
indicates that there is high expectance or
probability that a brand leads to positive results
for consumer. Hiscock (2001) believed that the
final purpose of the marketing is creating a
strong tie between the consumer and the brand
trust.
Upamannyn (2014) considering the
brand trust as expectance it should be said that
this fact is based on this believe of the
consumer that the related brand has special
qualities that leads to stability,competence,
truth, responsibility, etc. and is concordant with
the research about trust. considering the
research of brand trust of Delgado,et al(2003) is
seen that these special properties have technical
identity that is according to two dimensional
idea of trust that is found in managerial and
marketing sources.
Brand social power
Brand legitimacy brand
Brand modeling power
Brand
attractiveness
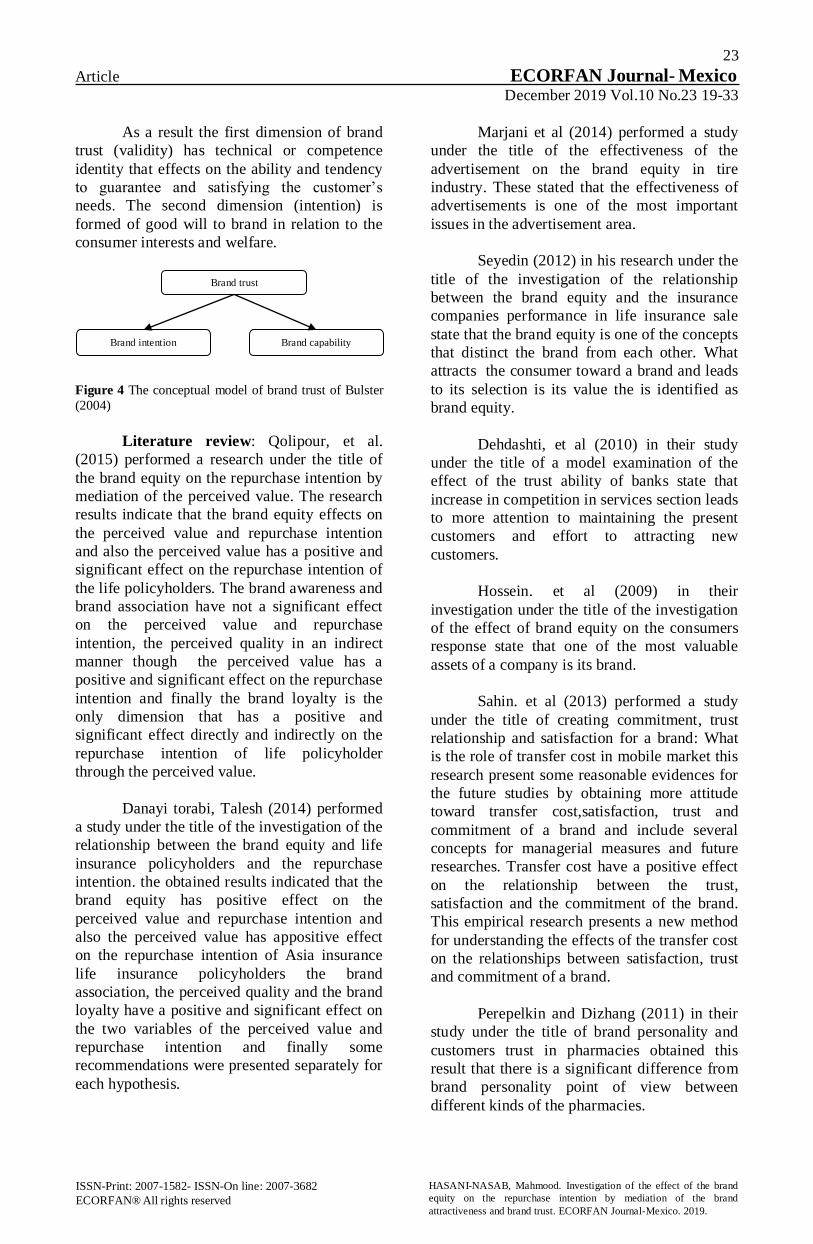
23
Article ECORFAN Journal- Mexico December 2019 Vol.10 No.23 19-33
ISSN-Print: 2007-1582- ISSN-On line: 2007-3682
ECORFAN® All rights reserved
HASANI-NASAB, Mahmood. Investigation of the effect of the brand
equity on the repurchase intention by mediation of the brand
attractiveness and brand trust. ECORFAN Journal-Mexico. 2019.
As a result the first dimension of brand
trust (validity) has technical or competence
identity that effects on the ability and tendency
to guarantee and satisfying the customer’s
needs. The second dimension (intention) is
formed of good will to brand in relation to the
consumer interests and welfare.
Figure 4 The conceptual model of brand trust of Bulster
(2004)
Literature review: Qolipour, et al.
(2015) performed a research under the title of
the brand equity on the repurchase intention by
mediation of the perceived value. The research
results indicate that the brand equity effects on
the perceived value and repurchase intention
and also the perceived value has a positive and
significant effect on the repurchase intention of
the life policyholders. The brand awareness and
brand association have not a significant effect
on the perceived value and repurchase
intention, the perceived quality in an indirect
manner though the perceived value has a
positive and significant effect on the repurchase
intention and finally the brand loyalty is the
only dimension that has a positive and
significant effect directly and indirectly on the
repurchase intention of life policyholder
through the perceived value.
Danayi torabi, Talesh (2014) performed
a study under the title of the investigation of the
relationship between the brand equity and life
insurance policyholders and the repurchase
intention. the obtained results indicated that the
brand equity has positive effect on the
perceived value and repurchase intention and
also the perceived value has appositive effect
on the repurchase intention of Asia insurance
life insurance policyholders the brand
association, the perceived quality and the brand
loyalty have a positive and significant effect on
the two variables of the perceived value and
repurchase intention and finally some
recommendations were presented separately for
each hypothesis.
Marjani et al (2014) performed a study
under the title of the effectiveness of the
advertisement on the brand equity in tire
industry. These stated that the effectiveness of
advertisements is one of the most important
issues in the advertisement area.
Seyedin (2012) in his research under the
title of the investigation of the relationship
between the brand equity and the insurance
companies performance in life insurance sale
state that the brand equity is one of the concepts
that distinct the brand from each other. What
attracts the consumer toward a brand and leads
to its selection is its value the is identified as
brand equity.
Dehdashti, et al (2010) in their study
under the title of a model examination of the
effect of the trust ability of banks state that
increase in competition in services section leads
to more attention to maintaining the present
customers and effort to attracting new
customers.
Hossein. et al (2009) in their
investigation under the title of the investigation
of the effect of brand equity on the consumers
response state that one of the most valuable
assets of a company is its brand.
Sahin. et al (2013) performed a study
under the title of creating commitment, trust
relationship and satisfaction for a brand: What
is the role of transfer cost in mobile market this
research present some reasonable evidences for
the future studies by obtaining more attitude
toward transfer cost,satisfaction, trust and
commitment of a brand and include several
concepts for managerial measures and future
researches. Transfer cost have a positive effect
on the relationship between the trust,
satisfaction and the commitment of the brand.
This empirical research presents a new method
for understanding the effects of the transfer cost
on the relationships between satisfaction, trust
and commitment of a brand.
Perepelkin and Dizhang (2011) in their
study under the title of brand personality and
customers trust in pharmacies obtained this
result that there is a significant difference from
brand personality point of view between
different kinds of the pharmacies.
Brand capability Brand intention
Brand trust

24
Article ECORFAN Journal- Mexico December 2019 Vol.10 No.23 19-33
ISSN-Print: 2007-1582- ISSN-On line: 2007-3682
ECORFAN® All rights reserved
HASANI-NASAB, Mahmood. Investigation of the effect of the brand
equity on the repurchase intention by mediation of the brand
attractiveness and brand trust. ECORFAN Journal-Mexico. 2019.
In other words the consumers have
ranked the independent pharmacies to some
extent more trustable than multinational
merchandises and national chain pharmacies
they also concluded that the truth and
competence have the most significant effect on
the customers trust attraction. They found that
the organizations with creating brand
personality that has truth and competence can
distinct themselves from other organizations
that leads to customers trust attraction.
They also have found that the
organizations should try to cruet brand
personality that is coordinate with the company
purposes in best form.
Figure 5 Research operational model
Research hypothesis of the research
The brand equity has a positive and significant
effect on the repurchase intention with
mediation of brand attractiveness and brand
trust of Iran insurance company in Hamedan.
1. The brand equity has a positive and
significant effect on the repurchase
intention in Iran insurance company in
Hamedan city.
2. The brand equity has a positive and
significant effect on the brand
attractiveness in Iran insurance
company in Hamedan.
3. The brand equity has a positive and
significant effect on the brand trust in
Iran insurance company in Hamedan
city.
4. The brand attractiveness has positive
and significant effect on the repurchase
intention of Iran insurance company in
Hamedan city.
5. The brand trust has a positive and
significant effect on the repurchase
intention in Iran insurance company in
Hamedan city.
6. The brand attractiveness has a positive
and significant effect on the brand trust
in Iran insurance company in Hamedan.
Research methodology
The present research is an applied study from
purpose point of view and is a descriptive
survey from data gathering point of view. The
population of this study includes 188 staff of
Iran insurance company in Hamedan city and
they also are regarded as the customers of this
company.
The sample volume of this research
estimated as 127 people according to the
Morgan table. The simple – random method
was used for sampling. The standard
questionnaire was used as data gathering tool.
the conformational factor analysis method was
used for validity examination that its results
indicated that the factor analysis is suitable for
identifying the factor model structure. The
Cronbach’s alpha was used for reliability
analysis that is more than 0/7 for each one of
the research questionnaire components. The
structural equations modeling was used for data
analysis by LIZREL software.
In order to validity examination the
conformational factor analysis test was used. In
doing the factor analysis of this issue should be
assured that whether. The existing data can be
used for data analysis or not?
In other words whether the number of
the considered data for factor analysis is
suitable or not? At this regard the KMO index
and Bartlett test were used.
According to these tests the data are
suitable for factor analysis if the KMO index is
more than (0/6) and near to and Bartlett test sig
is less than (0/05)
Brand
equity
Repurchase
brand
Brand
attractiveness
Brand trust
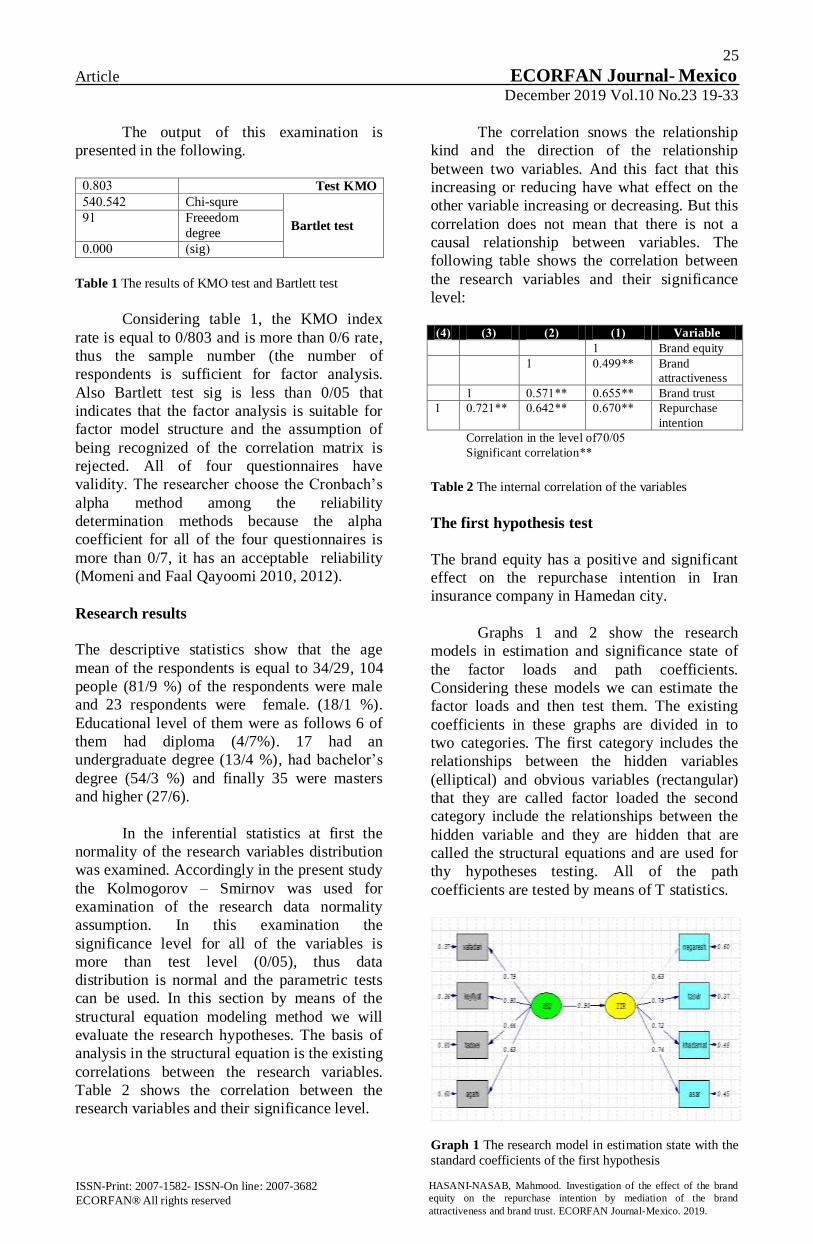
25
Article ECORFAN Journal- Mexico December 2019 Vol.10 No.23 19-33
ISSN-Print: 2007-1582- ISSN-On line: 2007-3682
ECORFAN® All rights reserved
HASANI-NASAB, Mahmood. Investigation of the effect of the brand
equity on the repurchase intention by mediation of the brand
attractiveness and brand trust. ECORFAN Journal-Mexico. 2019.
The output of this examination is
presented in the following.
Test KMO ..8.0
Bartlet test
Chi-squre 04..045
Freeedom
degree
19
)sig( .....
Table 1 The results of KMO test and Bartlett test
Considering table 1, the KMO index
rate is equal to 0/803 and is more than 0/6 rate,
thus the sample number (the number of
respondents is sufficient for factor analysis.
Also Bartlett test sig is less than 0/05 that
indicates that the factor analysis is suitable for
factor model structure and the assumption of
being recognized of the correlation matrix is
rejected. All of four questionnaires have
validity. The researcher choose the Cronbach’s
alpha method among the reliability
determination methods because the alpha
coefficient for all of the four questionnaires is
more than 0/7, it has an acceptable reliability
(Momeni and Faal Qayoomi 2010, 2012).
Research results
The descriptive statistics show that the age
mean of the respondents is equal to 34/29, 104
people (81/9 %) of the respondents were male
and 23 respondents were female. (18/1 %).
Educational level of them were as follows 6 of
them had diploma (4/7%). 17 had an
undergraduate degree (13/4 %), had bachelor’s
degree (54/3 %) and finally 35 were masters
and higher (27/6).
In the inferential statistics at first the
normality of the research variables distribution
was examined. Accordingly in the present study
the Kolmogorov – Smirnov was used for
examination of the research data normality
assumption. In this examination the
significance level for all of the variables is
more than test level (0/05), thus data
distribution is normal and the parametric tests
can be used. In this section by means of the
structural equation modeling method we will
evaluate the research hypotheses. The basis of
analysis in the structural equation is the existing
correlations between the research variables.
Table 2 shows the correlation between the
research variables and their significance level.
The correlation snows the relationship
kind and the direction of the relationship
between two variables. And this fact that this
increasing or reducing have what effect on the
other variable increasing or decreasing. But this
correlation does not mean that there is not a
causal relationship between variables. The
following table shows the correlation between
the research variables and their significance
level:
Variable (1) (2) (3) (4)
Brand equity 9
Brand
attractiveness
**..411 9
Brand trust **..600 **..0.9 9
Repurchase
intention
**..6.. **..645 **...59 9
Correlation in the level of7 .0/.
Significant correlation**
Table 2 The internal correlation of the variables
The first hypothesis test
The brand equity has a positive and significant
effect on the repurchase intention in Iran
insurance company in Hamedan city.
Graphs 1 and 2 show the research
models in estimation and significance state of
the factor loads and path coefficients.
Considering these models we can estimate the
factor loads and then test them. The existing
coefficients in these graphs are divided in to
two categories. The first category includes the
relationships between the hidden variables
(elliptical) and obvious variables (rectangular)
that they are called factor loaded the second
category include the relationships between the
hidden variable and they are hidden that are
called the structural equations and are used for
thy hypotheses testing. All of the path
coefficients are tested by means of T statistics.
Graph 1 The research model in estimation state with the
standard coefficients of the first hypothesis

26
Article ECORFAN Journal- Mexico December 2019 Vol.10 No.23 19-33
ISSN-Print: 2007-1582- ISSN-On line: 2007-3682
ECORFAN® All rights reserved
HASANI-NASAB, Mahmood. Investigation of the effect of the brand
equity on the repurchase intention by mediation of the brand
attractiveness and brand trust. ECORFAN Journal-Mexico. 2019.
Chi-
squre FD ⁄ RMSEA GFI AGFI NFI CFI
.5/55 91 98/5 .01/. 16/. 15/. 1./. 9/.
Table 3 The summary of the goodness of fit for the
conceptual model of the first hypothesis
Graph 2 The research model in the significance state (t
rates) of the first hypothesis
The first
hypothesis Path coefficient
(ß) -Statistic t Result
..1 6..1 Confirmed
Table 4 The results of the examination of the first
hypothesis of the research
The second hypothesis test
The brand equity has a positive and significant
effect on the brand attractiveness of Iran
insurance company in Hamedan city.
Graph 3 The research model in estimation state with the
standard coefficients of the second hypothesis
Chi-
squre FD ⁄ RMSEA GFI AGFI NFI CFI
65/90 90 55/5 .4/. 1./. 10/. 1./. 9/.
Table 5 The summary of the goodness of fit for the
conceptual model of the second hypothesis
Graph 4 The research model in the significance state (t-
vates) of the second hypothesis
The second
hypothesis
Path
coefficient (ß) -Statistic t Result
..19 6.66 Confirmed
Table 6 The results of the examination of the second
hypothesis of the research
The third hypothesis test
The brand equity has appositive and significant
effect an the brand trust in Iran insurance
company in Hamedan city.
Graph 5 The research model in the estimation state with
standard coefficients of the third hypothesis
Chi-
squre FD ⁄ RMSEA GFI AGFI NFI CFI
45/99 8 56/5 .08/. 1./. 15/. 18/. 11/.
Table 7 The summary of the goodness of fit for the
conceptual model of the third hypothesis

27
Article ECORFAN Journal- Mexico December 2019 Vol.10 No.23 19-33
ISSN-Print: 2007-1582- ISSN-On line: 2007-3682
ECORFAN® All rights reserved
HASANI-NASAB, Mahmood. Investigation of the effect of the brand
equity on the repurchase intention by mediation of the brand
attractiveness and brand trust. ECORFAN Journal-Mexico. 2019.
Graph 6 The research model in the significance state (t –
rates) of the third hypothesis
The third
hypothesis
Path
coefficient (ß) -Statistic t Result
..1. 1.04 Confirmed
Table 8 The results of the examination of the third
hypothesis of the research
The fourth hypothesis test
The brand attractiveness has a positive and
significant effect on therepurchase intention in
Iran insurance company in Hamedan city.
Graph 7 The research model in the estimation state with
standard coefficient of the fourth hypothesis
Chi-
squre FD ⁄ RMSEA GFI AGFI NFI CFI
9./50 90 00/5 ..1/. 10/. 81/. 1./. 18/.
Table 9 The summary of the goodness of fit for the
conceptual model of the fourth hypothesis
Graph 8 The research model in the significance state (t –
rates) of the fourth hypothesis
The fourth
hypothesis
Path
coefficient (ß) -Statistic t Result
..1. 6.16 Confirmed
Table 10 The results of the examination of the fourth
hypothesis of the research
The fifth hypothesis test
The brand equity has a positive and significant
effect on the repurchase intention in Iran
insurance company in Hamedan.
Chi-
squre FD ⁄ RMSEA GFI AGFI NFI CFI
0./90 8 48/5 ..0/. 1./. 19/. 16/. 18/.
Table 11 The summary of the goodness of fit for the
conceptual model of the fifth hypothesis
The fifth
hypothesis
Path
coefficient (ß) -Statistic t Result
..8. 0.9. Confirmed
Table 12 The results of the examination of the fifth
hypothesis of the research
Graph 9 The research model in the estimation state with
standard coefficient of the fifth hypothesis
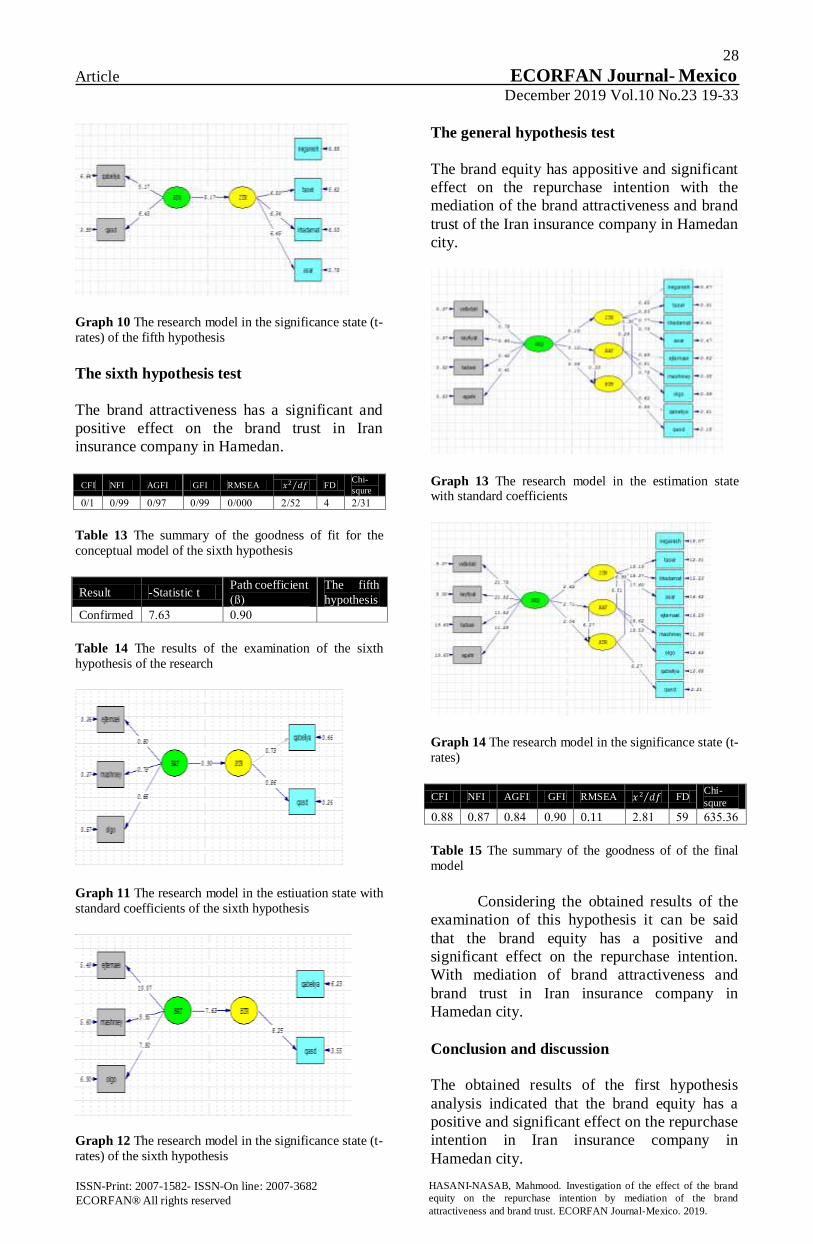
28
Article ECORFAN Journal- Mexico December 2019 Vol.10 No.23 19-33
ISSN-Print: 2007-1582- ISSN-On line: 2007-3682
ECORFAN® All rights reserved
HASANI-NASAB, Mahmood. Investigation of the effect of the brand
equity on the repurchase intention by mediation of the brand
attractiveness and brand trust. ECORFAN Journal-Mexico. 2019.
Graph 10 The research model in the significance state (t-
rates) of the fifth hypothesis
The sixth hypothesis test
The brand attractiveness has a significant and
positive effect on the brand trust in Iran
insurance company in Hamedan.
Chi-
squre FD ⁄ RMSEA GFI AGFI NFI CFI
09/5 4 05/5 .../. 11/. 1./. 11/. 9/.
Table 13 The summary of the goodness of fit for the
conceptual model of the sixth hypothesis
The fifth
hypothesis
Path coefficient
(ß) -Statistic t Result
..1. ..60 Confirmed
Table 14 The results of the examination of the sixth
hypothesis of the research
Graph 11 The research model in the estiuation state with
standard coefficients of the sixth hypothesis
Graph 12 The research model in the significance state (t-
rates) of the sixth hypothesis
The general hypothesis test
The brand equity has appositive and significant
effect on the repurchase intention with the
mediation of the brand attractiveness and brand
trust of the Iran insurance company in Hamedan
city.
Graph 13 The research model in the estimation state with standard coefficients
Graph 14 The research model in the significance state (t-
rates)
Chi-
squre FD ⁄ RMSEA GFI AGFI NFI CFI
600.06 01 5.89 0.11 ..1. ..84 ..8. ..88
Table 15 The summary of the goodness of of the final
model
Considering the obtained results of the
examination of this hypothesis it can be said
that the brand equity has a positive and
significant effect on the repurchase intention.
With mediation of brand attractiveness and
brand trust in Iran insurance company in
Hamedan city.
Conclusion and discussion
The obtained results of the first hypothesis
analysis indicated that the brand equity has a
positive and significant effect on the repurchase
intention in Iran insurance company in
Hamedan city.
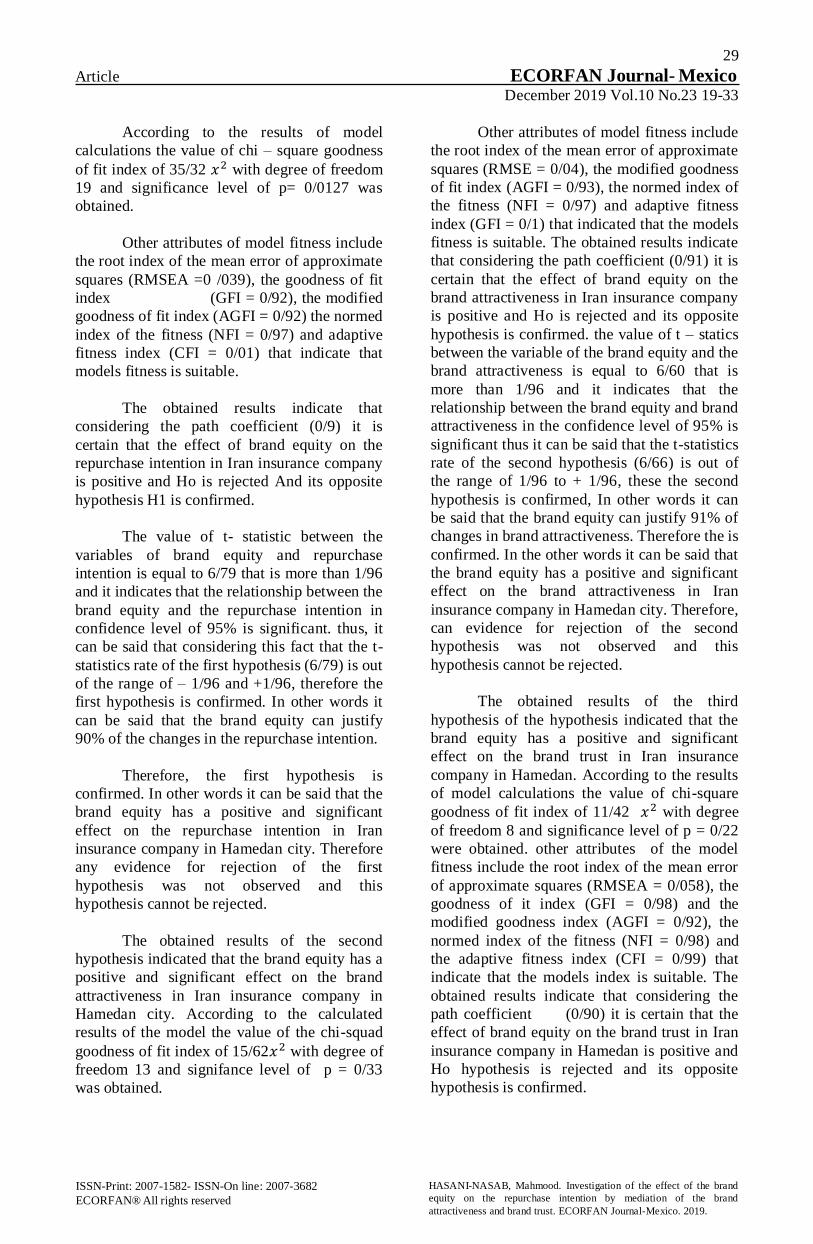
29
Article ECORFAN Journal- Mexico December 2019 Vol.10 No.23 19-33
ISSN-Print: 2007-1582- ISSN-On line: 2007-3682
ECORFAN® All rights reserved
HASANI-NASAB, Mahmood. Investigation of the effect of the brand
equity on the repurchase intention by mediation of the brand
attractiveness and brand trust. ECORFAN Journal-Mexico. 2019.
According to the results of model
calculations the value of chi – square goodness
of fit index of 35/32 with degree of freedom
19 and significance level of p= 0/0127 was
obtained.
Other attributes of model fitness include
the root index of the mean error of approximate
squares (RMSEA =0 /039), the goodness of fit
index (GFI = 0/92), the modified
goodness of fit index (AGFI = 0/92) the normed
index of the fitness (NFI = 0/97) and adaptive
fitness index (CFI = 0/01) that indicate that
models fitness is suitable.
The obtained results indicate that
considering the path coefficient (0/9) it is
certain that the effect of brand equity on the
repurchase intention in Iran insurance company
is positive and Ho is rejected And its opposite
hypothesis H1 is confirmed.
The value of t- statistic between the
variables of brand equity and repurchase
intention is equal to 6/79 that is more than 1/96
and it indicates that the relationship between the
brand equity and the repurchase intention in
confidence level of 95% is significant. thus, it
can be said that considering this fact that the t-
statistics rate of the first hypothesis (6/79) is out
of the range of – 1/96 and +1/96, therefore the
first hypothesis is confirmed. In other words it
can be said that the brand equity can justify
90% of the changes in the repurchase intention.
Therefore, the first hypothesis is
confirmed. In other words it can be said that the
brand equity has a positive and significant
effect on the repurchase intention in Iran
insurance company in Hamedan city. Therefore
any evidence for rejection of the first
hypothesis was not observed and this
hypothesis cannot be rejected.
The obtained results of the second
hypothesis indicated that the brand equity has a
positive and significant effect on the brand
attractiveness in Iran insurance company in
Hamedan city. According to the calculated
results of the model the value of the chi-squad
goodness of fit index of 15/62 with degree of
freedom 13 and signifance level of p = 0/33
was obtained.
Other attributes of model fitness include
the root index of the mean error of approximate
squares (RMSE = 0/04), the modified goodness
of fit index (AGFI = 0/93), the normed index of
the fitness (NFI = 0/97) and adaptive fitness
index (GFI = 0/1) that indicated that the models
fitness is suitable. The obtained results indicate
that considering the path coefficient (0/91) it is
certain that the effect of brand equity on the
brand attractiveness in Iran insurance company
is positive and Ho is rejected and its opposite
hypothesis is confirmed. the value of t – statics
between the variable of the brand equity and the
brand attractiveness is equal to 6/60 that is
more than 1/96 and it indicates that the
relationship between the brand equity and brand
attractiveness in the confidence level of 95% is
significant thus it can be said that the t-statistics
rate of the second hypothesis (6/66) is out of
the range of 1/96 to + 1/96, these the second
hypothesis is confirmed, In other words it can
be said that the brand equity can justify 91% of
changes in brand attractiveness. Therefore the is
confirmed. In the other words it can be said that
the brand equity has a positive and significant
effect on the brand attractiveness in Iran
insurance company in Hamedan city. Therefore,
can evidence for rejection of the second
hypothesis was not observed and this
hypothesis cannot be rejected.
The obtained results of the third
hypothesis of the hypothesis indicated that the
brand equity has a positive and significant
effect on the brand trust in Iran insurance
company in Hamedan. According to the results
of model calculations the value of chi-square
goodness of fit index of 11/42 with degree
of freedom 8 and significance level of p = 0/22
were obtained. other attributes of the model
fitness include the root index of the mean error
of approximate squares (RMSEA = 0/058), the
goodness of it index (GFI = 0/98) and the
modified goodness index (AGFI = 0/92), the
normed index of the fitness (NFI = 0/98) and
the adaptive fitness index (CFI = 0/99) that
indicate that the models index is suitable. The
obtained results indicate that considering the
path coefficient (0/90) it is certain that the
effect of brand equity on the brand trust in Iran
insurance company in Hamedan is positive and
Ho hypothesis is rejected and its opposite
hypothesis is confirmed.
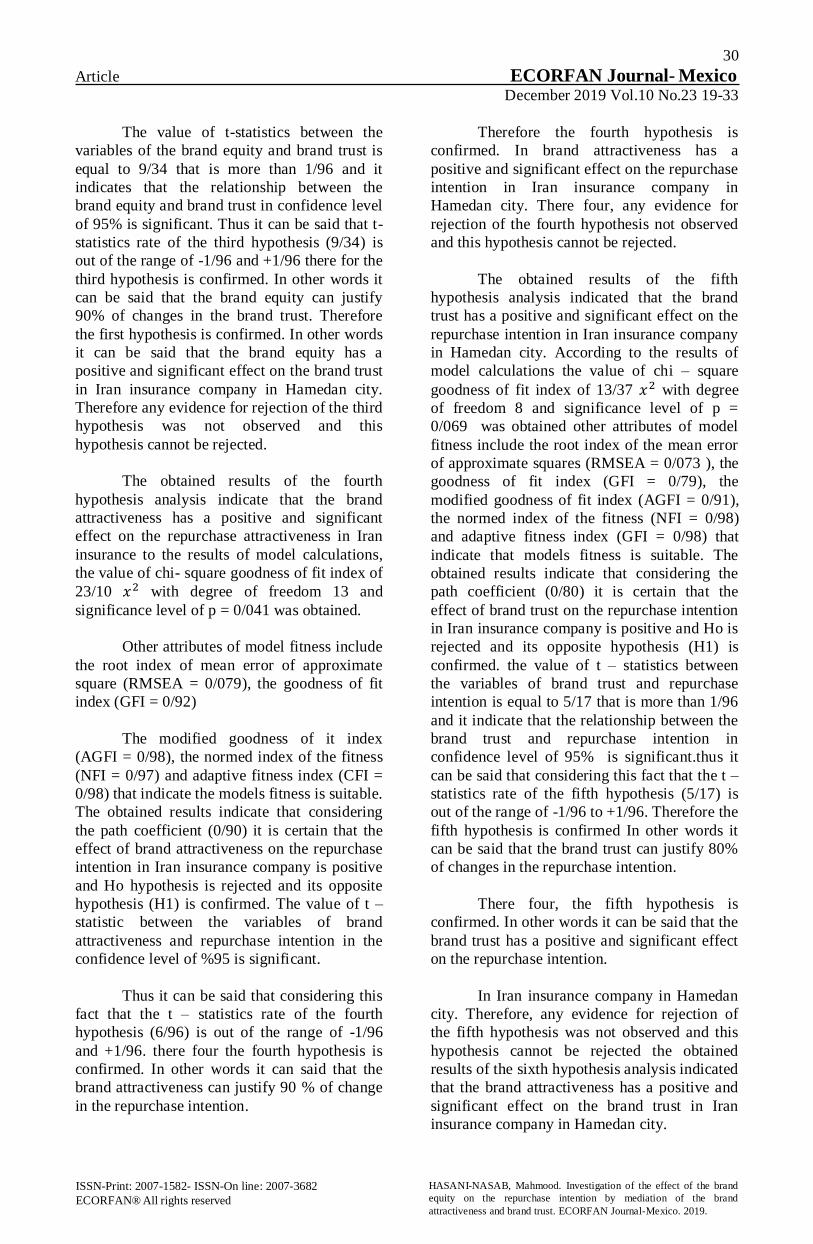
30
Article ECORFAN Journal- Mexico December 2019 Vol.10 No.23 19-33
ISSN-Print: 2007-1582- ISSN-On line: 2007-3682
ECORFAN® All rights reserved
HASANI-NASAB, Mahmood. Investigation of the effect of the brand
equity on the repurchase intention by mediation of the brand
attractiveness and brand trust. ECORFAN Journal-Mexico. 2019.
The value of t-statistics between the
variables of the brand equity and brand trust is
equal to 9/34 that is more than 1/96 and it
indicates that the relationship between the
brand equity and brand trust in confidence level
of 95% is significant. Thus it can be said that t-
statistics rate of the third hypothesis (9/34) is
out of the range of -1/96 and +1/96 there for the
third hypothesis is confirmed. In other words it
can be said that the brand equity can justify
90% of changes in the brand trust. Therefore
the first hypothesis is confirmed. In other words
it can be said that the brand equity has a
positive and significant effect on the brand trust
in Iran insurance company in Hamedan city.
Therefore any evidence for rejection of the third
hypothesis was not observed and this
hypothesis cannot be rejected.
The obtained results of the fourth
hypothesis analysis indicate that the brand
attractiveness has a positive and significant
effect on the repurchase attractiveness in Iran
insurance to the results of model calculations,
the value of chi- square goodness of fit index of
23/10 with degree of freedom 13 and
significance level of p = 0/041 was obtained.
Other attributes of model fitness include
the root index of mean error of approximate
square (RMSEA = 0/079), the goodness of fit
index (GFI = 0/92)
The modified goodness of it index
(AGFI = 0/98), the normed index of the fitness
(NFI = 0/97) and adaptive fitness index (CFI =
0/98) that indicate the models fitness is suitable.
The obtained results indicate that considering
the path coefficient (0/90) it is certain that the
effect of brand attractiveness on the repurchase
intention in Iran insurance company is positive
and Ho hypothesis is rejected and its opposite
hypothesis (H1) is confirmed. The value of t –
statistic between the variables of brand
attractiveness and repurchase intention in the
confidence level of %95 is significant.
Thus it can be said that considering this
fact that the t – statistics rate of the fourth
hypothesis (6/96) is out of the range of -1/96
and +1/96. there four the fourth hypothesis is
confirmed. In other words it can said that the
brand attractiveness can justify 90 % of change
in the repurchase intention.
Therefore the fourth hypothesis is
confirmed. In brand attractiveness has a
positive and significant effect on the repurchase
intention in Iran insurance company in
Hamedan city. There four, any evidence for
rejection of the fourth hypothesis not observed
and this hypothesis cannot be rejected.
The obtained results of the fifth
hypothesis analysis indicated that the brand
trust has a positive and significant effect on the
repurchase intention in Iran insurance company
in Hamedan city. According to the results of
model calculations the value of chi – square
goodness of fit index of 13/37 with degree
of freedom 8 and significance level of p =
0/069 was obtained other attributes of model
fitness include the root index of the mean error
of approximate squares (RMSEA = 0/073 ), the
goodness of fit index (GFI = 0/79), the
modified goodness of fit index (AGFI = 0/91),
the normed index of the fitness (NFI = 0/98)
and adaptive fitness index (GFI = 0/98) that
indicate that models fitness is suitable. The
obtained results indicate that considering the
path coefficient (0/80) it is certain that the
effect of brand trust on the repurchase intention
in Iran insurance company is positive and Ho is
rejected and its opposite hypothesis (H1) is
confirmed. the value of t – statistics between
the variables of brand trust and repurchase
intention is equal to 5/17 that is more than 1/96
and it indicate that the relationship between the
brand trust and repurchase intention in
confidence level of 95% is significant.thus it
can be said that considering this fact that the t –
statistics rate of the fifth hypothesis (5/17) is
out of the range of -1/96 to +1/96. Therefore the
fifth hypothesis is confirmed In other words it
can be said that the brand trust can justify 80%
of changes in the repurchase intention.
There four, the fifth hypothesis is
confirmed. In other words it can be said that the
brand trust has a positive and significant effect
on the repurchase intention.
In Iran insurance company in Hamedan
city. Therefore, any evidence for rejection of
the fifth hypothesis was not observed and this
hypothesis cannot be rejected the obtained
results of the sixth hypothesis analysis indicated
that the brand attractiveness has a positive and
significant effect on the brand trust in Iran
insurance company in Hamedan city.
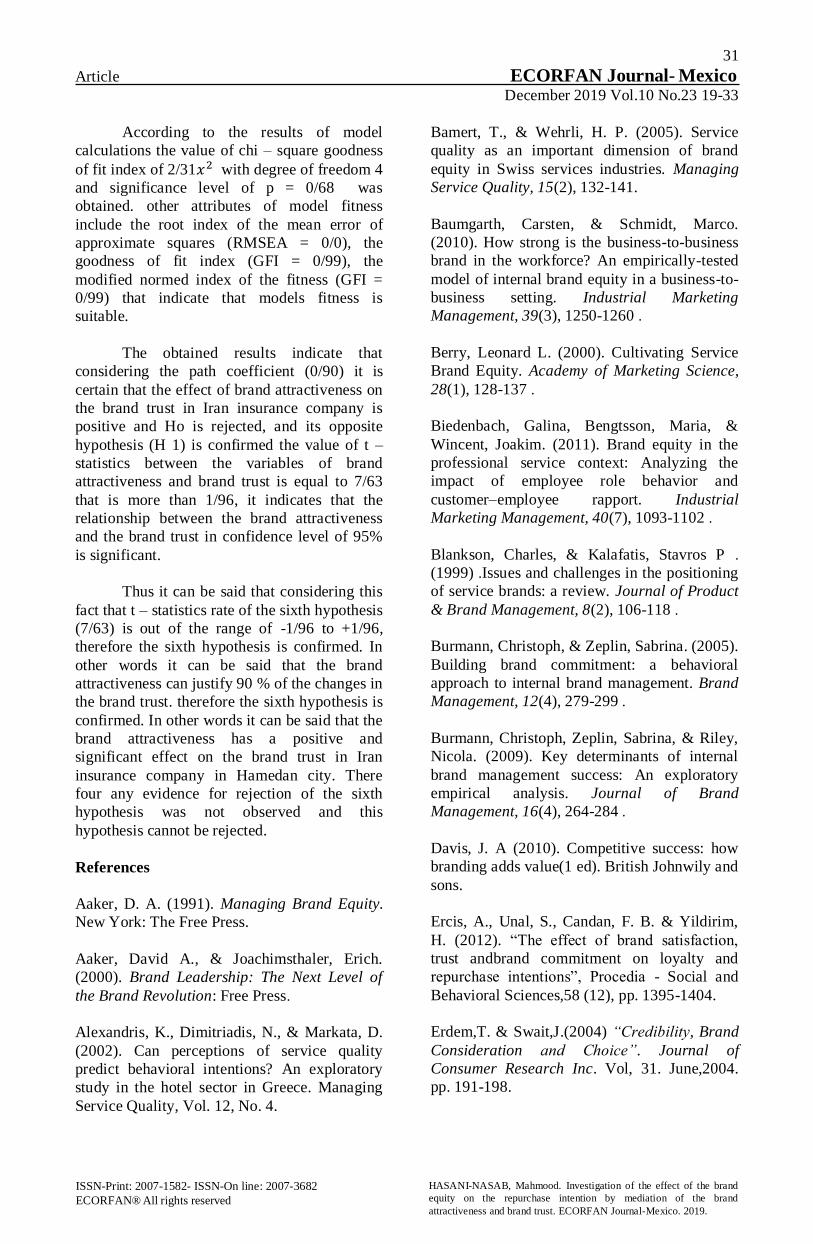
31
Article ECORFAN Journal- Mexico December 2019 Vol.10 No.23 19-33
ISSN-Print: 2007-1582- ISSN-On line: 2007-3682
ECORFAN® All rights reserved
HASANI-NASAB, Mahmood. Investigation of the effect of the brand
equity on the repurchase intention by mediation of the brand
attractiveness and brand trust. ECORFAN Journal-Mexico. 2019.
According to the results of model
calculations the value of chi – square goodness
of fit index of 2/31 with degree of freedom 4
and significance level of p = 0/68 was
obtained. other attributes of model fitness
include the root index of the mean error of
approximate squares (RMSEA = 0/0), the
goodness of fit index (GFI = 0/99), the
modified normed index of the fitness (GFI =
0/99) that indicate that models fitness is
suitable.
The obtained results indicate that
considering the path coefficient (0/90) it is
certain that the effect of brand attractiveness on
the brand trust in Iran insurance company is
positive and Ho is rejected, and its opposite
hypothesis (H 1) is confirmed the value of t –
statistics between the variables of brand
attractiveness and brand trust is equal to 7/63
that is more than 1/96, it indicates that the
relationship between the brand attractiveness
and the brand trust in confidence level of 95%
is significant.
Thus it can be said that considering this
fact that t – statistics rate of the sixth hypothesis
(7/63) is out of the range of -1/96 to +1/96,
therefore the sixth hypothesis is confirmed. In
other words it can be said that the brand
attractiveness can justify 90 % of the changes in
the brand trust. therefore the sixth hypothesis is
confirmed. In other words it can be said that the
brand attractiveness has a positive and
significant effect on the brand trust in Iran
insurance company in Hamedan city. There
four any evidence for rejection of the sixth
hypothesis was not observed and this
hypothesis cannot be rejected.
References
Aaker, D. A. (1991). Managing Brand Equity.
New York: The Free Press.
Aaker, David A., & Joachimsthaler, Erich.
(2000). Brand Leadership: The Next Level of
the Brand Revolution: Free Press.
Alexandris, K., Dimitriadis, N., & Markata, D.
(2002). Can perceptions of service quality
predict behavioral intentions? An exploratory
study in the hotel sector in Greece. Managing
Service Quality, Vol. 12, No. 4.
Bamert, T., & Wehrli, H. P. (2005). Service
quality as an important dimension of brand
equity in Swiss services industries. Managing
Service Quality, 15(2), 132-141.
Baumgarth, Carsten, & Schmidt, Marco.
(2010). How strong is the business-to-business
brand in the workforce? An empirically-tested
model of internal brand equity in a business-to-
business setting. Industrial Marketing
Management, 39(3), 1250-1260 .
Berry, Leonard L. (2000). Cultivating Service
Brand Equity. Academy of Marketing Science,
28(1), 128-137 .
Biedenbach, Galina, Bengtsson, Maria, &
Wincent, Joakim. (2011). Brand equity in the
professional service context: Analyzing the
impact of employee role behavior and
customer–employee rapport. Industrial
Marketing Management, 40(7), 1093-1102 .
Blankson, Charles, & Kalafatis, Stavros P .
(1999) .Issues and challenges in the positioning
of service brands: a review. Journal of Product
& Brand Management, 8(2), 106-118 .
Burmann, Christoph, & Zeplin, Sabrina. (2005).
Building brand commitment: a behavioral
approach to internal brand management. Brand
Management, 12(4), 279-299 .
Burmann, Christoph, Zeplin, Sabrina, & Riley,
Nicola. (2009). Key determinants of internal
brand management success: An exploratory
empirical analysis. Journal of Brand
Management, 16(4), 264-284 .
Davis, J. A (2010). Competitive success: how
branding adds value(1 ed). British Johnwily and
sons.
Ercis, A., Unal, S., Candan, F. B. & Yildirim,
H. (2012). “The effect of brand satisfaction,
trust andbrand commitment on loyalty and
repurchase intentions”, Procedia - Social and
Behavioral Sciences,58 (12), pp. 1395-1404.
Erdem,T. & Swait,J.(2004) “Credibility, Brand
Consideration and Choice”. Journal of
Consumer Research Inc. Vol, 31. June,2004.
pp. 191-198.
32
Article ECORFAN Journal- Mexico December 2019 Vol.10 No.23 19-33
ISSN-Print: 2007-1582- ISSN-On line: 2007-3682
ECORFAN® All rights reserved
HASANI-NASAB, Mahmood. Investigation of the effect of the brand
equity on the repurchase intention by mediation of the brand
attractiveness and brand trust. ECORFAN Journal-Mexico. 2019.
Etemadifard, M., Kafashpoor, A., & Zendehdel,
A., (2013), The Effect of Brand
Communication and Service Quality in the
Creation of BrandLoyalty through Brand Trust (Case Study: Samsung's Representatives Company
inMashhad City), International Journal of
Advanced Studies in Humanities and Social
Science, Volume 1, Issue 8, pp: 1067-1077.
Farquhar, P. H. (1989). Managing brand equity.
Marketing Research, 1(3), 24-33.
Gwinner, K., & Bennett, G., (2013), The
Impact of Brand Cohesiveness and Sport
Identification on Brand Fit in a Sponsorship
Context, Journal of Sport Management, 22, pp:
410-426.
Ha, Y. H., John, J., Janda, S. & Muthaly, S.
(2011). “The effects of advertising spending on
brandloyalty in services”, European Journal of
Marketing, 45 (4), pp. 673-691.
Haenlein, Michael & ,Kaplan, Andreas M.
(2004). A Beginner’s Guide to Partial Least
Squares Analysis. Understanding Statistics,
3(4), 283-297 .
Heidarzadeh, K.., Bigdeli, F., Khanzadeh, M
and Javanbakht, A. (2012).Assessing Patients
Behavioral Intentions through Service Quality
and Perceived Value.J. Basic. Appl. Sci. Res. 2(10)1086-92.
Hong, I.B., Cho, H. (2011). The impact of
consumer trust on attitudinal loyalty and
purchase intentions inB۲C e-marketplaces:
Intermediary trust vs. seller trust. International
Journal of Information Management,31, pp:
469- 479.
Hongwei, H., Yan, L., & Harris, L, (2012),
Social identity perspective on brand loyalty,
Journal of Business Research, 65, pp: 648–657.
Hsu, H. C., Oh, H. & Assaf, G. A. (2012). “A
customer-based brand equity model for upscale
hotels”,Journal of Travel Research, 51 (1), pp. 81-
93.
Hu, H. Cheng, C. C. Chiu, S. l. and Hong,F.Y.
(2011). A Study of CustomerSatisfaction,
Customer Loyalty andQuality Attributes in
Taiwan’s MedicalService Industry, African
Journal of Business Management. 5(1), 187-
195,Available at: http://www.academicjournals.
org/AJBM.
Keller, K. L. (2008). Strategic brand
management: building, measuring and
managing brand equity (3 ed.).
Kim, G., Sun, B. H., & Priluck, R.(2008).
Multidimesional customer – based – Brand
equity and its consequeecesin midpriced hotels,
journal of hospitality & tourism research, 23(2),
235-254.
Kim, G., Sun, B. J., & Kim, H. J. (2008).
Multidimensional Customer-Based Brand
Equity and Its Consequences in Midpriced
Hotels. Journal of Hospitality & Tourism
Research, 23(2), 235-254.
Kimpakorn, Narumon, & Tocquer, Gerard.
(2009). Employees' commitment to brands in
the service sector: Luxury hotel chains in
Thailand. Journal of Brand Management, 16(8),
532-544 .
Kimpakorn, Narumon, & Tocquer, Gerard.
(2010). Service brand equity and employee
brand commitment. Journal of Services
Marketing, 24(5), 378-388 .
King, Ceridwyn, & Grace, Debra. (2006).
Exploring managers’ perspectives of the impact
of brand management strategies on employee
roles within a service firm. Journal of Services
Marketing, 20(6), 369-380 .
King, Ceridwyn, & Grace, Debra. (2009).
Employee Based Brand Equity: A Third
Perspective. Services Marketing Quarterly,
30(2), 122-147 .
King, Ceridwyn, & Grace, Debra. (2010).
Building and measuring employee-based brand
equity. European Journal of Marketing, 44(7/8),
938-971 .
Knox, S., & Walker, D. (2001). Measuring and
managing brand loyalty. Journal of Strategic
Marketing, 9, 111–128.
Punjaisri, Khanyapuss, & Wilson, Alan. (2011).
Internal branding process: key mechanisms,
outcomes and moderating factors. European
Journal of Marketing, 45(9/10), 1521-1537 .
Punjaisri, Khanyapuss, Evanschitzky, Heiner,
& Wilson, Alan. (2009). Internal branding: an
enabler of employees’ brand-supporting
behaviours. Journal of Service Management,
20(2), 209-226 .

33
Article ECORFAN Journal- Mexico December 2019 Vol.10 No.23 19-33
ISSN-Print: 2007-1582- ISSN-On line: 2007-3682
ECORFAN® All rights reserved
HASANI-NASAB, Mahmood. Investigation of the effect of the brand
equity on the repurchase intention by mediation of the brand
attractiveness and brand trust. ECORFAN Journal-Mexico. 2019.
Punjaisri, Khanyapuss, Wilson, Alan, &
Evanschitzky, Heiner. (2008). Exploring the
Influences of Internal Branding on Employees'
Brand Promise Delivery: Implications for
Strengthening Customer-Brand Relationships.
Journal of Relationship Marketing, 7(4), 407-
424 .
Robertson K.R., Wood R.V.; Evaluating
international markets: The importance of
information by industry, by country of
destination and by type of export transaction";
International Marketing Review, Vol. 17, No.
1, 2000.
Santos-Vijande, Marيa Leticia, del Rيo-Lanza,
Ana Belén, Suلrez-ءlvarez, Leticia, & Dيaz-
Martيn, Ana Marيa. (2013). The brand
management system and service firm
competitiveness. Journal of Business Research,
66(2). 148-157.
Schlager, Tobias, Bodderas, Mareike, Maas,
Peter, & Cachelin, Joël Luc. (2011). The
influence of the employer brand on employee
attitudes relevant for service branding: an
empirical investigation. Journal of Services
Marketing, 25(7), 497-508 .
Sweeny, J. & Swait,J.(2008). “The Effects of
Brand Credibility on Customer Loyalty ”.
Journal of Retailing and Consumer
Services.vol,15. No, 8. pp.179-193.
Wallace, Elaine, de Chernatony, Leslie, & Buil,
Isabel. (2013). Building bank brands: How
leadership behavior influences employee
commitment. Journal of Business Research,
66(2), 165-171 .
Washburn,J.H,Till,B.D,Priluck,R(2004) "
Brand alliance and customer – based
customerbased",psychology &
marketing,21(7),487-508.
Zeithaml, V., & Bitner, M. (1996). Services
Marketing: McGraw-Hill
Doayi – H, kazemi.M and Hosseini
Robat.s,(2011).The analysis of the customers
perception effect of marketing on the brand
(study case: Razavi food products), modern
marketing research 104 – 93 (2).
Salari, the customers interests and cost, tadbir
magazine, 2003, No 150, 49 – 57.
Sobhani. M. I and osmani ember (2012), The
study on the relationship between brand
awareness and consumer loyalty.
Zohreh Hejazi, Elahe Bazargan. Abass (2009),
he methods of behavioral sciences, Tehran,
Agah publications.
Sekaran, oma, 2011, The methods of the study
of the management, the translation of the
Mohammad Saebi and Mohammad Shirazi,
Tehran, the eighth edition,the publication of the
president governmental management training
department.
Soltani Mehdi, Mohammedi Esfandiar, pour
Ashraf, Yasanolah and Sayehmiri, Kourosh
(2013), The investigation of the effective
factors in the consumers attitude of the brand
development, Business management period 5,
No. 1 – pp 85 – 104.
Samadi Mansour, Haji pour, Bahman Dehghan,
Meysam (2009), The investigation of the
brand dimensions on the customers repurchase
intention of Refah chain shop in Tehran city.
Andishehye modiriat magazine, third year, the
second number pp – 149 – 165.
Azizi. Shahriai, Jamali – Shahram Sanayi Iman
(2012), Presentation the effective factors on the
staff operation about the brand in banking
industry (case study, keshavarzi bank) Business
management, period 4, No 11. pp 89 – 104.
34
Article ECORFAN Journal- Mexico December 2019 Vol.10 No.23 34-45
The effect of marketing mix on export development with regard to the mediating
role of market competition
El efecto del marketing mix sobre el desarrollo de las exportaciones con respecto al
papel mediador de la competencia en el mercado
HASANI-NASAB, Mahmood† & SHIRAZIAN, Zahra
Islamic Azad University, Department of Management, Malayer Branch, Malayer, Iran
ID 1st Author: Mahmood, Hasani-Nasab / ORC ID: 0000-0003-4507-4313, Researcher ID Thomson: Q-6779-2118 ID
1st Coauthor: Zahra, Shirazian / ORC ID: 0000-0003-2457-9216, Researcher ID Thomson: I-1315-2018
DOI: 10.35429/EJM.2019.23.10.34.45 Received July 26, 2019; Accepted September 15, 2019
Abstract
This study aimed to investigate the effect of marketing
mix on developing product exports with regard to the
mediating role of market competition. The present
research was applied in terms of objective, and a
descriptive survey in the form of field study regarding the
research method. The statistical population of this study
encompassed all furniture show exhibitors and
manufacturers (N=1150) in Malayer, Hamadan Province,
Iran. Using Cochran's alpha formula, 288 persons were
selected through using convenient sampling method and
three questionnaires were distributed among the samples.
The results of the study showed that the marketing mix
(product, price, promotion and place (distribution)) has a
positive and significant effect on boosting export and
competition in Malayer’s furniture market. Market
competition has a positive and significant effect on furniture export development in Malayer as well.
Marketing mix, Export development, Market
competition
Resumen
La presente investigación se aplicó en términos de
objetivos y una encuesta descriptiva en forma de estudio
de campo sobre el método de investigación. La población
estadística de este estudio abarcó a todos los expositores
y fabricantes de exhibiciones de muebles (N = 1150) en
Malayer, provincia de Hamadan, Irán. Utilizando la
fórmula alfa de Cochran, se seleccionaron 288 personas
mediante un método de muestreo conveniente y se
distribuyeron tres cuestionarios entre las muestras. Los
resultados del estudio mostraron que la combinación de
marketing (producto, precio, promoción y lugar
(distribución)) tiene un efecto positivo y significativo en
el impulso de la exportación y la competencia en el
mercado de muebles de Malayer. La competencia en el
mercado también tiene un efecto positivo y significativo
en el desarrollo de la exportación de muebles en Malayer.
Marketing mix, Desarrollo de exportaciones,
Competencia en el mercado
Citation: HASANI-NASAB, Mahmood & SHIRAZIAN, Zahra. The effect of marketing mix on export development with
regard to the mediating role of market competition. ECORFAN Journal-Mexico. 2019, 10-23: 34-45.
† Researcher contributing first author.
© ECORFAN Journal - Mexico www.ecorfan.org

35
Article ECORFAN Journal- Mexico December 2019 Vol.10 No.23 34-45
ISSN-Print: 2007-1582- ISSN-On line: 2007-3682
ECORFAN® All rights reserved
HASANI-NASAB, Mahmood & SHIRAZIAN, Zahra. The effect of
marketing mix on export development with regard to the mediating role
of market competition. ECORFAN Journal-Mexico. 2019.
Introduction
Product exports as an aspect of foreign trade
represent the production capacity of different
countries and provide a special ground for the
realization of economic policies. Exports are
considered as the engines of economic growth
in developing countries. One of the most
important economic issues that many countries
are now facing is a balance of payments deficit
and the lack of currency. Although there are
several ways to secure a currency deficit, the
most systematic and the most appropriate way
is to increase exports (Ranjbarian et al., 2012:
16).
According to some experts, marketing is
regarded as a key to the success of industrial
development in developing countries; hence,
any serious move towards a country's industrial
development requires not only national macro
policies but also the implementation of
scientific marketing principles as a logical link
between producers and consumers (Ahmadi &
Virginiari, 2003: 173).
Nowadays, production and exports in
the global economy play a critical role in the
framework of any healthy economy. Almost all
successful economies spare their efforts to
empower themselves in any export area in
which they have a comparative advantage. On
the other hand, there are new challenges in
today's world, including the increasing rise of
competition, with which the industries are
tackling. With the inclusion of countries into
the World Trade Organization, the gap existing
among the countries is decreased, and as a
result, the products can easily be sent to
different markets in the most remote parts of
the world and reach the consumers. Due to the
expansion of globalization and the increasing
activities of various industries at the
international level, determining the degree of
competition and matching the marketing mix
elements of export goods are of paramount
importance.
Finally, each industry must decide
which strategy to select in order to be able to
achieve the best possible export performance,
depending on the features of the market or
target markets and their similarity and
differences with the domestic market (Jalali,
2011: 52).
In Iran, due to the existence of rich oil
resources and its revenues, the export industry
has always been concentrated on the oil, and the
existence of these oil revenues has downgraded
the other sectors. Given the disadvantages of
relying on oil exports as a source of foreign
exchange earnings, such as single-product
dependence, resulting in fluctuations in world
prices or demand for oil, there is an urgent need
for replacing oil and developing non-oil
exports. At the moment, non-oil exports play a
vital role in Iran’s economy. Meanwhile, Iran
has many potential capabilities in exporting
goods and services and enjoys many
comparative advantages in different sectors
(Jalali, 2011: 53).
The problem is that the environment
where industries are now operating is highly
competitive and growing, and firms and
industries are compelled to compete with
multiple factors at national and international
levels and expand their export activities
(Setayesh & Kargarfard Jahromi, 2011: 14).
Market orientation and attention to the features
of each export-oriented market is one of the
basic and most important principles in exports
(Sarreshteh, 2015: 48).
This study was to examine the effect of
marketing mix one the development of
Malayer’s furniture exports with regard to the
mediating role of market competition due to
lack of expected success in this industry at the
international level.
This industry was considered since the
products of this industry enjoy high and
acceptable quality on the one hence, and on the
other hand, despite such a high quality, it has
reached little success compared to its
competitors at the international level.
Accordingly, the following research question
was raised: Does Marketing mix have any
impact on the development of Malayer’s
furniture exports with regard to the mediating
role of market competition?
Considering the conditions and
competition among companies, their
interactions and the dimensions of business
performance are considered as a critical factor
due to changes in conditions and environmental
opportunities of export performance, according
to which the companies’ success rate in exports
can be assessed (Rezaei, 2017: 130).
36
Article ECORFAN Journal- Mexico December 2019 Vol.10 No.23 34-45
ISSN-Print: 2007-1582- ISSN-On line: 2007-3682
ECORFAN® All rights reserved
HASANI-NASAB, Mahmood & SHIRAZIAN, Zahra. The effect of
marketing mix on export development with regard to the mediating role
of market competition. ECORFAN Journal-Mexico. 2019.
Literature and Background of the Study
A. Marketing mix
The marketing mix components are sets of
controllable marketing variables mixed by
companies to achieve their marketing goals in
the target market and to generate the required
response. It involves any form of measure
adopted by the company to its product in order
to affect demand. These elements are
commonly known as (4P’s): Product, price,
place (distribution), and promotion (Kotler,
2006: 132).
The concept ‘marketing mix’ was first
introduced in the 1950s by Neil Borden and
became known as 4P’s. The marketing mix
dominated on the traditional models and
methods of market management, such as
Alderson’s dynamic functionalism as well as
other systematic methods and Parameter Theory
developed by the University of Copenhagen in
Europe. The same happened to the new
methods such as product vision, functional
vision, and geographical vision. Only a small
number of these models have managed to
survive against 4P’s. Marketing mix
encompasses a set of intervening tools in the
market that are interdependent, so that they
cause the necessary or desired impact on the
market. Marketing mix represents the
fundamental activities of marketing managers.
After selecting a target market, marketing
managers must develop a systematic plan to sell
their products to customers and establish long-
term relations. Marketing plan consists of
decisions regarding product, price, promotion,
and place, as the most significant elements to
which marketing managers allocate the
company’s resources to achieve the sales and
profitability objectives (Sehat et al., 2012:76).
The terms mixture, mix, or combination
imply that there should be a systemic and
coordinated approach to these components in
order to be effective in empowering and
convincing customers. In other words, a
suitable product with a reasonable price for the
customers is associated with proper place and
appropriate promotion methods, and if any of
these components are inconsistent with the
others, the effectiveness and efficiency of the
whole set is decreased, thus preventing the
company from reaching its goals.
Tactics or tools refer to companies’
tools and instruments to compete in the market
and to gain more success than competitors
(Jalali Farahani, 2013: 16).
Product: In a marketing mix, a product
is something presented to the market for
attention, purchase, utilization, or consumption,
which may meet a need or desire. The product
might include a physical object, a service, a
place, an organization, and even an idea or
thought (Moheb Ali, 2002: 58).
Price: In the marketing mix, the price is
the payment to a person or organization for a
product or service. From a wider perspective,
the price is equal to the sum of the values the
consumer loses in return for the benefits of
having a product or service (Kotler&
Amstrong, 2007: 31).
Promotion: Advertising or promotion in
the marketing mix is to connect with the
customers to be informed of and affect their
attitudes and behaviors. Promotion contains any
presentation and offering of ideas, goods, or
services provided by an advertising unit,
individual or institution, which requires
payment (Mohammadian, 2002: 26).
Place (Distribution): In simple words,
distribution or place refers to the delivery of a
desired product to a desired place at the desired
time (Alodari, 2005: 236).
B. Exports
Exports encompass connecting and working
with the professional markets and market
professionals across the borders. Scientific
reviews have proved that the economic growth
in countries is associated with their exports
from several perspectives. The growing trend of
global trade has been accelerated by the use of
active business strategies, the revolution in
information communication technology (ICT),
and the removal of barriers at the international
level; therefore, active participation in global
trade needs no justification (Sadeghi et al.,
2012: 63). Export development has some
important benefits, including mass production,
foreign exchange earnings, employment
growth, quality improvement, and lower prices
for manufactured products.
37
Article ECORFAN Journal- Mexico December 2019 Vol.10 No.23 34-45
ISSN-Print: 2007-1582- ISSN-On line: 2007-3682
ECORFAN® All rights reserved
HASANI-NASAB, Mahmood & SHIRAZIAN, Zahra. The effect of
marketing mix on export development with regard to the mediating role
of market competition. ECORFAN Journal-Mexico. 2019.
Evidently, the use of appropriate models
is essential to maximize the benefits of exports
in order to achieve economic growth and
development. These are some success factors
that can be used to determine the direction of
exports with regard to their thematic scope
(Ghorbani, 2002: 43).
C. Competition
Competition is expressed in terms of business
activity and as a balanced position, and this, in
fact, is an ultimate to the firm's efforts to
dominate the market (Khodadkashi, 2009: 19).
Shleifer and Vishny (1977) argue that
competition in the product market is likely to be
the strongest force driving the world’s economy
towards effectiveness. Competition is one of
the most significant and the most critical
economic concepts. In today's world,
competition has emerged as an intrinsic
phenomenon in financial and commercial
activities and is one of the important factors
determining the fate of organizations and
enterprises in the field of economic activities.
Begsou and Betbegnice (2007) claim that
market competition is a key criterion in
assessing the success rate of countries,
industries, and enterprises in the political,
economic, and business fields; indicating that
each country, industry, or firm with a high
competitive capability in competitive markets is
likely to be more competitive. Accordingly, the
companies reveal behavioral characteristics that
are commensurate with the level of competition
in their industry as competition leads to strong
corporate leadership and reduced representation
problems between managers and shareholders.
On the other hand, the high level of competition
in the product market reduces information
asymmetry and control costs (Setayesh &
Kargarfard Jahromi, 2011: 15).
- Research Background
Mohtaram Ghalati and Movasegh (2018)
conducted a study entitled "The Effect of
Export Market Orientation and Adaptation of
the Marketing Mix on Export Performance."
The results of their study revealed that export
companies in turbulent environments and close
competitive markets psychologically align their
marketing mix with the needs of better foreign
markets.
Export market orientation has a positive
impact and marketing mix has a negative effect
on the company's export performance.
Furthermore, market orientation moderates the
relationship between the two variables
‘marketing mix alignment’ and ‘export
performance’ and plays a supportive role in
making strategic decisions in export companies.
Rezaei (2017) in his research entitled
"The Impact of International Marketing
Strategies on Export Performance" states that
the selection of the entry method is one of the
most important and critical strategic decisions
for companies seeking to expand globally and
to select their target market. The results of data
analysis indicate that international marketing
strategies have a significant effect on export
performance. Secondary hypotheses also show
that the fully- and relatively- standardized
strategies have no significant effect on export
performance; however, a fully adaptive strategy
has a significant effect on export performance
and a relatively adaptive strategy has no
significant effect on export performance as
well.
In his research entitled "The role of
marketing mix in developing product exports,"
Zeynabi (2016) states that exports play a crucial
role in economic independence and boosting,
and that export development policy forms a part
of foreign trade policy in different countries,
whose achievement is the goal of all countries.
Hedayati Dezfuli et al. (2015) conducted
a research entitled "The Effect of Marketing
Mix Elements on the Sale of Companies in
Iran’s Textile Industry". The research findings
suggest that ‘price’ and ‘place’, among the
other marketing mix elements, have the greatest
and lowest impacts on the sales of the
companies involved in this industry,
respectively.
In his research, "The Impact of
Uncertainty on Marketing Mix Strategy of
Exports," Sarreshteh (2013) suggested that
export is now one of the most important tools
for economic growth in developing regions.
The findings of his study suggest that
international entrepreneurship and the use of
networks ensure the better matching of the
marketing mix elements through reducing the
uncertainties.
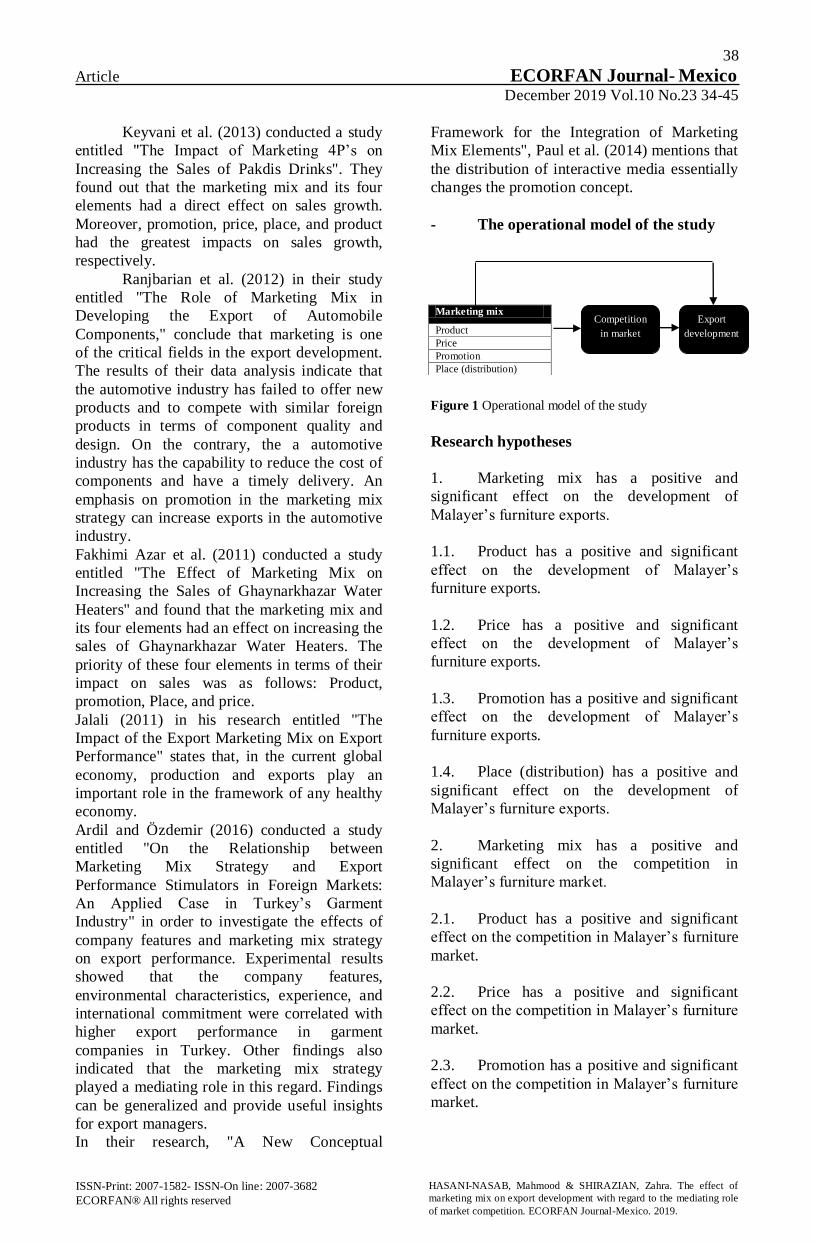
38
Article ECORFAN Journal- Mexico December 2019 Vol.10 No.23 34-45
ISSN-Print: 2007-1582- ISSN-On line: 2007-3682
ECORFAN® All rights reserved
HASANI-NASAB, Mahmood & SHIRAZIAN, Zahra. The effect of
marketing mix on export development with regard to the mediating role
of market competition. ECORFAN Journal-Mexico. 2019.
Keyvani et al. (2013) conducted a study
entitled "The Impact of Marketing 4P’s on
Increasing the Sales of Pakdis Drinks". They
found out that the marketing mix and its four
elements had a direct effect on sales growth.
Moreover, promotion, price, place, and product
had the greatest impacts on sales growth,
respectively.
Ranjbarian et al. (2012) in their study
entitled "The Role of Marketing Mix in
Developing the Export of Automobile
Components," conclude that marketing is one
of the critical fields in the export development.
The results of their data analysis indicate that
the automotive industry has failed to offer new
products and to compete with similar foreign
products in terms of component quality and
design. On the contrary, the a automotive
industry has the capability to reduce the cost of
components and have a timely delivery. An
emphasis on promotion in the marketing mix
strategy can increase exports in the automotive
industry.
Fakhimi Azar et al. (2011) conducted a study
entitled "The Effect of Marketing Mix on
Increasing the Sales of Ghaynarkhazar Water
Heaters" and found that the marketing mix and
its four elements had an effect on increasing the
sales of Ghaynarkhazar Water Heaters. The
priority of these four elements in terms of their
impact on sales was as follows: Product,
promotion, Place, and price.
Jalali (2011) in his research entitled "The
Impact of the Export Marketing Mix on Export
Performance" states that, in the current global
economy, production and exports play an
important role in the framework of any healthy
economy.
Ardil and Özdemir (2016) conducted a study
entitled "On the Relationship between
Marketing Mix Strategy and Export
Performance Stimulators in Foreign Markets:
An Applied Case in Turkey’s Garment
Industry" in order to investigate the effects of
company features and marketing mix strategy
on export performance. Experimental results
showed that the company features,
environmental characteristics, experience, and
international commitment were correlated with
higher export performance in garment
companies in Turkey. Other findings also
indicated that the marketing mix strategy
played a mediating role in this regard. Findings
can be generalized and provide useful insights
for export managers.
In their research, "A New Conceptual
Framework for the Integration of Marketing
Mix Elements", Paul et al. (2014) mentions that
the distribution of interactive media essentially
changes the promotion concept.
- The operational model of the study
Figure 1 Operational model of the study
Research hypotheses
1. Marketing mix has a positive and
significant effect on the development of
Malayer’s furniture exports.
1.1. Product has a positive and significant
effect on the development of Malayer’s
furniture exports.
1.2. Price has a positive and significant
effect on the development of Malayer’s
furniture exports.
1.3. Promotion has a positive and significant
effect on the development of Malayer’s
furniture exports.
1.4. Place (distribution) has a positive and
significant effect on the development of
Malayer’s furniture exports.
2. Marketing mix has a positive and
significant effect on the competition in
Malayer’s furniture market.
2.1. Product has a positive and significant
effect on the competition in Malayer’s furniture
market.
2.2. Price has a positive and significant
effect on the competition in Malayer’s furniture
market.
2.3. Promotion has a positive and significant
effect on the competition in Malayer’s furniture
market.
Marketing mix
Product
Price
Promotion
Place (distribution)
Export
development
Competition
in market

39
Article ECORFAN Journal- Mexico December 2019 Vol.10 No.23 34-45
ISSN-Print: 2007-1582- ISSN-On line: 2007-3682
ECORFAN® All rights reserved
HASANI-NASAB, Mahmood & SHIRAZIAN, Zahra. The effect of
marketing mix on export development with regard to the mediating role
of market competition. ECORFAN Journal-Mexico. 2019.
2.4. Place (distribution) has a positive and
significant effect on the competition in
Malayer’s furniture market.
3. Competition in the market has a positive
and significant effect on the competition in
Malayer’s furniture market.
Research Methodology
The present study was a descriptive survey in
terms of method and applied in terms of
objective. The statistical population of this
study encompassed all furniture show
exhibitors and manufacturers (N=1150) in
Malayer, Hamadan Province, Iran. Sampling
was used to collect data from all furniture show
exhibitors and manufacturers in Malayer using
the Cochran’s formula with a 5% error rate and
the sample size was estimated to be 288. The
data were collected by questionnaires. The first,
second, and third questionnaires were on
marketing mix (Fakhimi Azar et al., 2011),
export development (Tavakoli & Dehghani
Sanij, 2010), and competition in market
(Aghazadeh et al., 2007), respectively. The
three questionnaires encompassed 29 items
scored based on a 5-point Likert scale (I totally
disagree, I disagree, I have no idea, I agree, and
I totally agree). In this study, Cronbach's alpha
was used to measure the reliability of the
questionnaires with the SPSS software. And
since the Cronbach's alpha value was >0.7, the
research variables were reliable. In order to
assess the validity of the questionnaires, the
researcher first submitted the questionnaires to
some experts in the field of management. After
examining and matching the questions with the
measured variables, they commented on the
items. After making the necessary
modifications, the researcher distributed the
questionnaires among 30 participants in order
to enhance the face validity of the
questionnaires. Afterwards, the final
questionnaire was prepared. Furthermore, the
confirmatory factor analysis was also run to
confirm the findings. To this end, KMO index
and Bartlett’s test were used. According to
these two tests, the data are suitable for factor
analysis when the KMO index is > 0.6 and
close to one, and when the significance level of
Bartlett’s test is <0.5. The following table
presents the output of this test.
Test KMO 6.5/.
Bartlett’s test Chi-square 100/.85
df 4.6
Sig. .../.
Table 1 Results of the KMO and Bartlett
Accordingly, factor analysis is
appropriate to identify the model’s factorial
structure.
Findings
A. Descriptive statistics
The research findings showed that the mean age
of the participants was 36.54 years; there were
286 males (99.3%) and 2 females (0.7%) with
the mean work experience of 8.18 years.
Descriptive statistics of the research variables
The mean, standard deviation, variance,
kurtosis, and skewness of the research variables
are presented in Table 3. According to the
results of Table 3, the mean values of the
variables ‘marketing mix’, ‘product’, ‘price’,
‘promotion’, ‘place’, ‘exports’, and ‘market
competition’ are 3.35, 3.20, 3.54, 3.59, 3.20,
3.19, and 3.16, respectively.
Variable N Mean SD Variance kurtosis skewness
Marketing
mix 588 00/0 88./. .8./. 90./.- .04/.-
Product 588 5./0 181/. 1.1/. 095/.- .51/.-
Price 588 04/0 .04/. 006/. .50/.- .45/.-
Promotion 588 01/0 880/. ..1/. 4.5/.- .44/.
Place 588 5./0 .0./. 0.0/. 949/.- 900/.
Export development
588 91/0 8.4/. 64./. 504/.- .09/.-
Market competition
588 96/0 8../. .0./. .00/. 55./.-
Table 2 Descriptive statistics
B. Inferential statistics
Here is tested the normality of the research
variables. To this end, Kolmogorov-Smirnov
test was used. According to the results of the
following table, since the significance level for
all the research variables was >0.05, the normal
distribution of the sample is accepted so that
structural equation modelling was used to test
the effect of variables on each other and the fit
of the conceptual model.
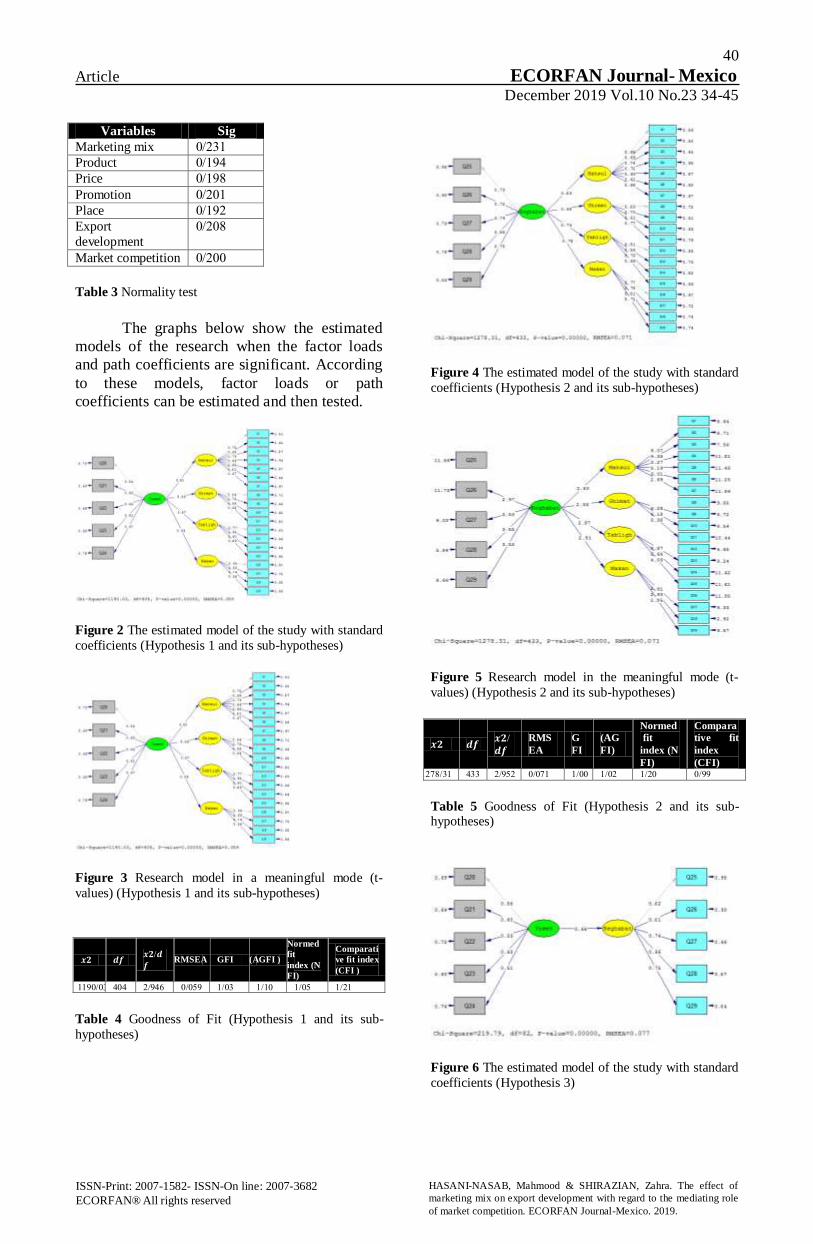
40
Article ECORFAN Journal- Mexico December 2019 Vol.10 No.23 34-45
ISSN-Print: 2007-1582- ISSN-On line: 2007-3682
ECORFAN® All rights reserved
HASANI-NASAB, Mahmood & SHIRAZIAN, Zahra. The effect of
marketing mix on export development with regard to the mediating role
of market competition. ECORFAN Journal-Mexico. 2019.
Variables Sig
Marketing mix 509/.
Product 914/.
Price 918/.
Promotion 5.9/.
Place 915/.
Export
development
5.8/.
Market competition 5../.
Table 3 Normality test
The graphs below show the estimated
models of the research when the factor loads
and path coefficients are significant. According
to these models, factor loads or path
coefficients can be estimated and then tested.
Figure 2 The estimated model of the study with standard
coefficients (Hypothesis 1 and its sub-hypotheses)
Figure 3 Research model in a meaningful mode (t-
values) (Hypothesis 1 and its sub-hypotheses)
𝒙 𝒅𝒇 𝒙 /𝒅
𝒇 RMSEA GFI (AGFI )
Normed
fit
index (N
FI)
Comparati
ve fit index
(CFI )
.0/991. 4.4 146/5 .01/. .0/9 9./9 .0/9 59/9
Table 4 Goodness of Fit (Hypothesis 1 and its sub-
hypotheses)
Figure 4 The estimated model of the study with standard
coefficients (Hypothesis 2 and its sub-hypotheses)
Figure 5 Research model in the meaningful mode (t-
values) (Hypothesis 2 and its sub-hypotheses)
𝒙 𝒅𝒇 𝒙 /
𝒅𝒇
RMS
EA
G
FI
(AG
FI)
Normed
fit
index (N
FI)
Compara
tive fit
index
(CFI) 09/95.8 400 105/5 ..9/. ../9 .5/9 5./9 11/.
Table 5 Goodness of Fit (Hypothesis 2 and its sub-hypotheses)
Figure 6 The estimated model of the study with standard
coefficients (Hypothesis 3)
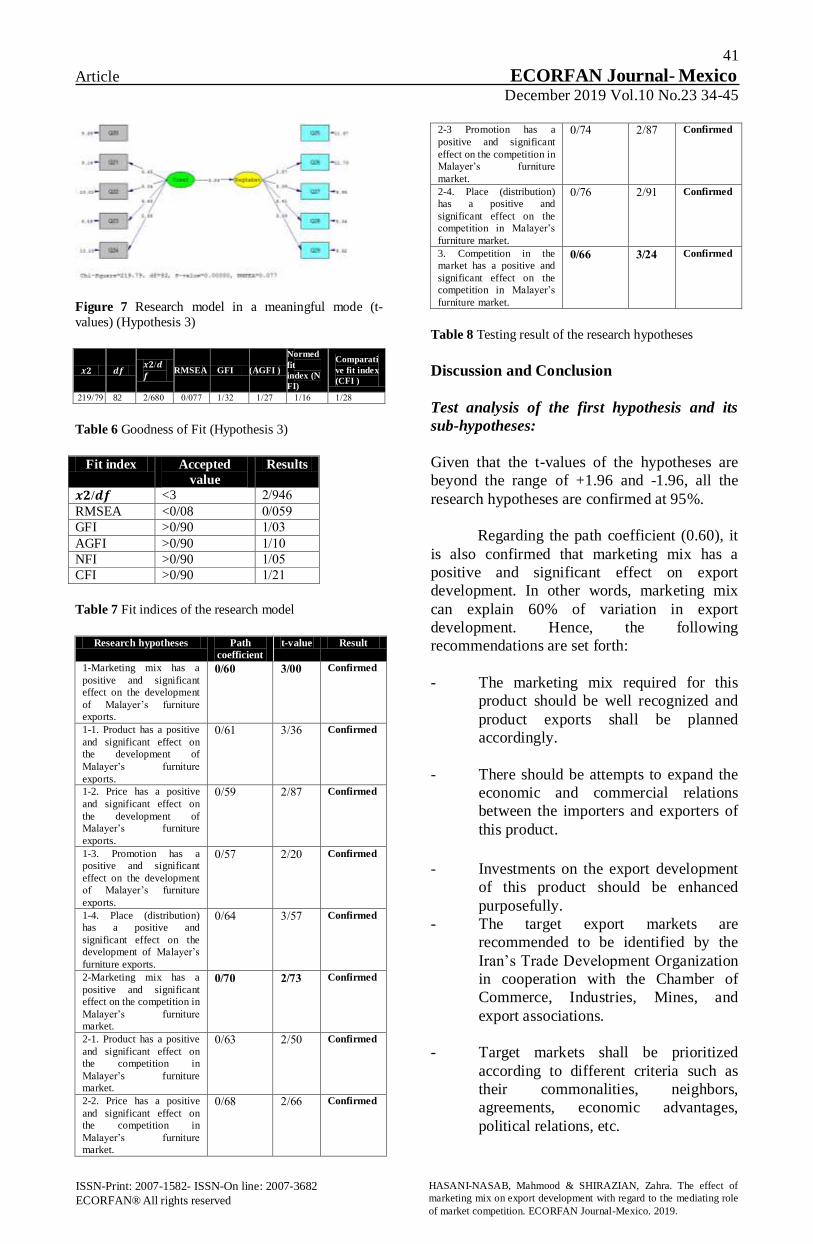
41
Article ECORFAN Journal- Mexico December 2019 Vol.10 No.23 34-45
ISSN-Print: 2007-1582- ISSN-On line: 2007-3682
ECORFAN® All rights reserved
HASANI-NASAB, Mahmood & SHIRAZIAN, Zahra. The effect of
marketing mix on export development with regard to the mediating role
of market competition. ECORFAN Journal-Mexico. 2019.
Figure 7 Research model in a meaningful mode (t-
values) (Hypothesis 3)
𝒙 𝒅𝒇 𝒙 /𝒅
𝒇 RMSEA GFI (AGFI )
Normed
fit
index (N
FI)
Comparati
ve fit index
(CFI )
.1/591 82 68./5 .../. 05/9 5./9 96/9 58/9
Table 6 Goodness of Fit (Hypothesis 3)
Results Accepted
value
Fit index
146/5 <3 𝒙 /𝒅𝒇
.01/. <0/08 RMSEA
.0/9 >0/90 GFI
9./9 >0/90 AGFI
.0/9 >0/90 NFI
59/9 >0/90 CFI
Table 7 Fit indices of the research model
Research hypotheses Path
coefficient
t-value Result
1-Marketing mix has a
positive and significant
effect on the development
of Malayer’s furniture
exports.
06/6 66/3 Confirmed
1-1. Product has a positive
and significant effect on
the development of
Malayer’s furniture
exports.
69/. 06/0 Confirmed
1-2. Price has a positive
and significant effect on
the development of
Malayer’s furniture
exports.
01/. 8./5 Confirmed
1-3. Promotion has a
positive and significant
effect on the development
of Malayer’s furniture
exports.
0./. 5./5 Confirmed
1-4. Place (distribution)
has a positive and
significant effect on the
development of Malayer’s
furniture exports.
64/. 0./0 Confirmed
2-Marketing mix has a
positive and significant
effect on the competition in
Malayer’s furniture
market.
06/6 03/2 Confirmed
2-1. Product has a positive
and significant effect on
the competition in
Malayer’s furniture
market.
60/. 0./5 Confirmed
2-2. Price has a positive
and significant effect on
the competition in
Malayer’s furniture
market.
68/. 66/5 Confirmed
2-3 Promotion has a
positive and significant
effect on the competition in
Malayer’s furniture
market.
.4/. 8./5 Confirmed
2-4. Place (distribution)
has a positive and
significant effect on the
competition in Malayer’s
furniture market.
.6/. 19/5 Confirmed
3. Competition in the
market has a positive and
significant effect on the
competition in Malayer’s
furniture market.
00/6 24/3 Confirmed
Table 8 Testing result of the research hypotheses
Discussion and Conclusion
Test analysis of the first hypothesis and its
sub-hypotheses:
Given that the t-values of the hypotheses are
beyond the range of +1.96 and -1.96, all the
research hypotheses are confirmed at 95%.
Regarding the path coefficient (0.60), it
is also confirmed that marketing mix has a
positive and significant effect on export
development. In other words, marketing mix
can explain 60% of variation in export
development. Hence, the following
recommendations are set forth:
The marketing mix required for this
product should be well recognized and
product exports shall be planned
accordingly.
There should be attempts to expand the
economic and commercial relations
between the importers and exporters of
this product.
Investments on the export development
of this product should be enhanced
purposefully.
The target export markets are
recommended to be identified by the
Iran’s Trade Development Organization
in cooperation with the Chamber of
Commerce, Industries, Mines, and
export associations.
Target markets shall be prioritized
according to different criteria such as
their commonalities, neighbors,
agreements, economic advantages,
political relations, etc.

42
Article ECORFAN Journal- Mexico December 2019 Vol.10 No.23 34-45
ISSN-Print: 2007-1582- ISSN-On line: 2007-3682
ECORFAN® All rights reserved
HASANI-NASAB, Mahmood & SHIRAZIAN, Zahra. The effect of
marketing mix on export development with regard to the mediating role
of market competition. ECORFAN Journal-Mexico. 2019.
Regarding the path coefficient (0.61),
the product has a positive and significant effect
on export development. In other words, the
product can explain 61% of export development
variation. Here are some relevant suggestions:
There should be branding for export
products at three product, firm, and
national levels.
The process of temporary arrival of raw
materials required for exporting
products and restituting their primary
rights needs to be facilitated and
accelerated.
High-quality raw materials should be
used.
Products should be tailored to
individuals’ demands.
With regard to the path coefficient
(0.59), the price has a positive and significant
effect on export development. In other words,
this variable can explain 59% of export
development variance. Here are some
suggestions in this regard:
- Depending on the final price, determine
the profit and the total price of the
product.
- Note that the product price is one of the
key factors in export development.
- There should be more production to
reduce the product costs and set better
prices.
Based on the path coefficient (0.57), the
promotion has a positive and significant effect
on export development. In other words, this
variable can explain 57% of export
development variance. Here are some
recommendations:
- There should be macro-level advertising
and marketing in the target markets for
brands of this product by the
government.
- Use new technologies such as
cyberspace to promote advertising.
- Employ individuals with high
communication skills as marketers.
Considering the path coefficient (0.64),
the place (distribution) has a positive and
significant effect on export development. In
other words, this variable can explain 64% of
export development variation. It is thus
recommended:
Conclude free trade agreements and
preferential tariff agreements with
different countries.
Improve the business environment
through reducing documents, time, and
export costs.
Select appropriate distribution channels.
Test analysis of the second hypothesis and its
sub-hypotheses:
Given that the t-values of the hypotheses are
beyond the range of +1.96 and -1.96, all the
research hypotheses are confirmed at 95%.
Regarding the path coefficient (0.70),
the positive and significant effect of marketing
mix on market competition is also confirmed.
In other words, marketing mix can explain 70%
of variation in market competition. Hence, we
recommend:
Liquidity and working capital of
manufacturing and export units should
be provided by the banking system,
especially development banks such as
the Bank of Industry and Mine and the
Export Development Bank at a one-
digit, competitive rate.
There should be efficient export
subsidies for sent business delegations
and units participating in international
and specific exhibitions of the Islamic
Republic of Iran held in other countries,
as well as for the transportation of
export goods.
During the trips of high-ranked
authorities of the country to target
export markets, in addition to including
the exporters in the composition of the
expeditions, exports should be given
serious attention and support in the
negotiations.

43
Article ECORFAN Journal- Mexico December 2019 Vol.10 No.23 34-45
ISSN-Print: 2007-1582- ISSN-On line: 2007-3682
ECORFAN® All rights reserved
HASANI-NASAB, Mahmood & SHIRAZIAN, Zahra. The effect of
marketing mix on export development with regard to the mediating role
of market competition. ECORFAN Journal-Mexico. 2019.
Based on the path coefficient (0.63), the
product has a positive and significant effect on
market competition. In other words, this
variable can explain 63% of market competition
variation. Here are some recommendations:
The laws and regulations as well as
processes and procedures of exporting
goods and services shall be modified to
facilitate exports, provide transparency,
and establish stability.
There needs to be cautions regarding
product packing.
Provide the customers with product
warranties for quality, price, and so on.
With regard to the path coefficient
(0.68), the price has a positive and significant
effect on market competition. In other words,
this variable can explain 68% of variation in
market competition. Here are some suggestions
in this case:
Postpone payments until the product
approval.
Provide the mass buyers with a great
deal of discounts.
Buyer's credit conditions should be
considered with regard to cash
payments.
Regarding the path coefficient (0.74), it
is inferred that promotion has a positive and
significant effect on market competition. That
is, promotion can justify 74% of variation in
market competition. Tt is thus suggested:
Offer new ideas in product promotions.
Promotion budget should be provided
by the government.
Introduce the real product and avoid
exaggeration.
Considering the path coefficient (0.76),
it is found that the distribution place has a
positive and significant effect on market
competition. In other words, this variable can
justify 76% of the variation in market
competition. Here are some recommendations
set forth based on this findings:
Boost the culture of exports using
different tools in the country.
Promote the social status of economic
activists, including producers and
exporters.
Use appropriate tools in transporting
products.
Inventory of goods should be satisfying.
Test analysis of the third hypothesis:
Regarding the path coefficient (0.66), market
competition has a positive and significant effect
on export development. In other words, market
competition explains 66% of variation in export
development. Hence, we recommend:
Influence and sustainability strategies
should be developed in the target export
markets by the Ministry of Industry,
Mine and Trade in consultation with the
Chamber of Commerce, Industries,
Mines, etc. (Chambers in different
provinces, export associations, and joint
councils and chambers).
Exports shall be completely exempted
from value-added tax since the
procedure of paying value added tax as
well as the process of its refund to
exporters has caused serious challenges
for the exports.
Using the resources of the National
Development Fund, the required
currency credits should be paid to the
manufacturing and export units, in
addition to increasing the funds of the
Export Development Bank of Iran and
the Export Guarantee Fund of Iran.
Provide the exporters of goods,
technical and engineering services, ICT
and economic operators in the field of
tourism with an award and effective
export incentives directly and indirectly.
Discussion
The study findings indicated that the marketing
mix has a significant impact on the
development of Malayer’s furniture exports
with regard to the mediating role of market
competition. Hence any change in the
marketing mix would change the export
development of Malayer’s furniture, and market
competition also has an impact on this variable.

44
Article ECORFAN Journal- Mexico December 2019 Vol.10 No.23 34-45
ISSN-Print: 2007-1582- ISSN-On line: 2007-3682
ECORFAN® All rights reserved
HASANI-NASAB, Mahmood & SHIRAZIAN, Zahra. The effect of
marketing mix on export development with regard to the mediating role
of market competition. ECORFAN Journal-Mexico. 2019.
The findings of this study were
consistent with those of other research studies
(Mohtaram Ghalati & Movasagh, 2018; Rezaei,
2017; Zeynabi, 2016; Hedayati Dezfouli et al.,
2015; Sarreshteh, 2015; Keyvani et al., 2013;
Ranjbarian et al., 2012; Fakhimi Azar et al.,
2011; Jalali, 2011; Jindul et al., 2018; Ardil and
Özdemir, 2016; Paul et al., 2014; and Burdrich
& Touva, 2008).
References
Aghazadeh, H., Estiri, M., Asanlou, B. (2007),
Factors Affecting Firms’ Competitiveness in
Iran, Economic Research, 3.
Ahmadi, M. R., Vaez, S. A., Arman, S. A., &
Dorseh, S. S. (2017). The Effect of Competition
in Product Market on the Price Fall Risk,
Research-Scientific Journal of Financial
Accounting Science, 4 (3).
Alodari, H. (2005), Marketing and Market
Management, Payame Noor University Press,
2nd
Ed.
Allen, F., and Gale, D. (2000). Corporate
Governance and Competition,” published in
Corporate Governance: Theoretical and
Empirical Perspectives, edited by X. Vives,
Cambridge University Press, 23-94.
Andersen, P.H. (2005), Relationship marketing
and brand involvement of professionals through
web-enhanced brand communities: the case of
Coloplast, Industrial Marketing Management,
No. 34, pp. 285– 297.
Brunch, A. E. (2001). Export Marketing
Management. Translated by: M. I. Goharian,
Printing and Publishing Company.
Cundiff, E. & Hilger, M.T.(1988), Marketing in
the International, Environment Printtic- Hall,
p.403.
Jalali Farahani, M. (2013). The Effect of
Selected Marketing Mix Elements on Brand
Value in Sport Services, Applied Research in
Sport Management, 2, 2.
Jalali, E. (2011), The Effect of Export
Marketing Mix on Export Performance,
Master's Thesis, Allameh Tabataba’i
University, Faculty of Management and
Accounting.
Khodadkashi, F. (2009), Different Perspectives
Toward Competition Concept and Theory and
Its Adaptation to the Competition Status in
Iran's Industrial Sector, Quarterly Journal of
Economic Research and Policy, 17 (51).
Fakhimi Azar, S., Akbari Venehabad, M.,
Rasouli, R. (2011), The Effect of Marketing
Mix on Increasing the Sales of Ghaynarkhazar
Water Heaters, Beyond Management, 4, 16.
Kotler, F. (2006), Marketing Management
(Analysis, Programming, Implementation, and
Control), Translated by B. Forouzandeh,
Tehran, Amoukhteh Pub., 3rd
ed.
Keyvani, SH., Poudineh, M., Maleki, M.,
Sanaei Rad, M. S. (2013). The Impact of
Marketing 4P’s on Increasing the Sales of
Pakdis Drinks, 1st International Conference on
Political Epic (with an Approach to
Management and Accounting), Roudehen,
Islamic Azad University, Roudehen Branch.
Kotler, F. & Armstrong, G. (2007), Marketing
principles, Translated by A. Parsaeian, Tehran,
Jahan Noe Pub., 1st ed.
Kotler, F. (2006), Marketing Management
(Analysis, Programming, Implementation, and
Control), Translated by B. Forouzandeh,
Tehran, Amoukhteh Pub., 1st
ed.
Moheb Ali, D. (2002), Market Management,
Amir Kabir Pub., 2nd
ed.
Mohtaram Ghalati, R. & Movasegh, M. (2018).
The Effect of Export Market Orientation and
Adaptation of the Marketing Mix on Export
Performance (Case Study: Non-oil Products
Exporting Companies), Master's Thesis,
University of Tehran University of
Management, 10, 1.
Mohammadian, M. (2003), Managing
Commercial Ads, Horoufiyeh Pub., 2nd
Ed.
Rezaei, R. (2017), The Effect of International
Marketing Strategies on Export Performance,
Research-Scientific Journal of Business
Management Explorations, 9, 17.
Ranjbarian, B., Sadeghi, A., Gholami Karin,
M., Lotfi Jalalabadi, M. (2012), The Role of
Marketing Mix in the Development of
Automobile Export, Business Management
Perspective, 10.

45
Article ECORFAN Journal- Mexico December 2019 Vol.10 No.23 34-45
ISSN-Print: 2007-1582- ISSN-On line: 2007-3682
ECORFAN® All rights reserved
HASANI-NASAB, Mahmood & SHIRAZIAN, Zahra. The effect of
marketing mix on export development with regard to the mediating role
of market competition. ECORFAN Journal-Mexico. 2019.
Setayesh, M. H. & Kargarfard Jahromi, M.
(2011), The Effect of Competition in Product
Market on Capital Structure, Quarterly Journal
of Empirical Financial Accounting Research, 1,
1.
Sarreshteh, S. (2015), The Effect of Uncertainty
on Export Marketing Mix Strategy (Case Study
of the Export of Dried Fruits in East
Azarbayjan province), Master's thesis, Ministry
of Science,
Sadeghi, T., Lashgari, M., Karbalaei Esmaeili,
H. R. (2012), Developing a Model of Main
Factors Affecting Export Success from the
Viewpoint of Exporters in Iran, Journal of
Marketing Management, 17.
Sehat, S., Bajamaloui Rostami, H., &
Kashkouli, M. (2012), The Effect of Marketing
Mix on the Brand Value of the Kar Afarin
Insurance Company, Tehran University,
Faculty of Management, Business
Management, 4, 12.
Zeynabi, H. (2016), The Role of Marketing Mix in
the Development of Product Exports, Second
International Conference on Management and
Information Technology, Tehran, Khadamat
Bartar Co.

46
Article ECORFAN Journal- Mexico December 2019 Vol.10 No.23 46-71
Financial viability and environmental aspects in the selection of energy sources for
sanitary hot water (SHW) and heated swimming pools
Viabilidad financiera y aspectos ambientales en la selección de fuentes de energía
para agua caliente sanitaria (ACS) y piscinas climatizadas
LONGARELA-ARES, Angeles†*
Universidade da Coruña, Regulation Research Group, Economy and Finance (GREFIN), Department of Business, Faculty
of Economics and Business, Elviña, 15071 La Coruna, Spain.
ID 1st Author: Angeles, Longarela-Ares / ORC ID: 0000-0003-0488-4950
DOI: 10.35429/EJM.2019.23.10.46.70 Received July 31, 2019; Accepted September 30, 2019
Abstract
Sustainability and energy efficiency are topics of great
interest, especially in the sports facilities management
sector, due to the high energy costs. One of the most
relevant costs is derived from the consumption of
Sanitary Hot Water (SHW) and swimming pool. The
objective of this work is to study new ways to manage
and reduce these costs through the valuation of the use of
traditional and renewable energy sources and the
necessary investment to contribute to the promotion of a
more sustainable vision of business management. Four
alternative energy installations (Natural Gas, Biomass,
Solar Thermal Combined with Natural Gas or Biomass)
are proposed, it is verified which is more suitable in
terms of financial viability and one of them is selected.
For this purpose, we start from a hypothetical business-
case and a 20-year forecast of the energy consumption,
the costs and initial investment of each alternative is made; viability analysis are performed with the Net
Present Value (NPV) and the obtained results are
compared. The conclusion is that the most appropriate
solution, from a financial point of view, for sports centers
similar to the business-case and with the considered
circumstances, is the installation of Biomass, an option
that, in addition, can be considered respectful with the
environment.
Sanitary Hot Water, Renewable Energies, Sports
Facilities, Financial Evaluation, Business
Sustainability
Resumen
La sostenibilidad y la eficiencia energética son temas de
gran interés, especialmente en el sector de gestión de
instalaciones deportivas, debido a que presentan elevados
costes energéticos. Uno de los costes más relevantes es el
derivado del consumo de Agua Caliente Sanitaria (ACS)
y piscina. Este trabajo tiene como objetivo estudiar
nuevas formas para gestionar y reducir estos costes a
través de la valoración del uso de fuentes de energía
tradicionales y renovables y de la inversión necesaria
para contribuir al fomento de una visión más sostenible
de la gestión empresarial. Se proponen cuatro alternativas
de instalación energética (Gas Natural, Biomasa, Solar
Térmica combinada con Gas Natural o con Biomasa), se
comprueba cual es más adecuada en términos de
viabilidad financiera y se selecciona una de ellas. Para
ello se parte de una hipotética empresa-caso y se hace
una previsión a 20 años de los consumos energéticos y de los costes y desembolso inicial para cada alternativa; se
realizan análisis de viabilidad con el Valor Actual Neto
(VAN) y se comparan los resultados. Se concluye que la
solución más adecuada, desde un punto de vista
financiero, para centros deportivos similares a la
empresa-caso y con las circunstancias consideradas, es la
instalación de Biomasa, una opción que, además, puede
ser considerada respetuosa con el medio ambiente.
Agua Caliente Sanitaria, Energías Renovables,
Instalaciones Deportivas, Evaluación Financiera,
Sostenibilidad Empresarial
Citation: LONGARELA-ARES, Angeles. Financial viability and environmental aspects in the selection of energy sources
for sanitary hot water (SHW) and heated swimming pools. ECORFAN Journal-Mexico. 2019, 10-23: 46-71.
* Correspondence to Author (email: [email protected])
† Researcher contributing first author.
© ECORFAN Journal - Mexico www.ecorfan.org

47
Article ECORFAN Journal- Mexico December 2019 Vol.10 No.23 46-71
ISSN-Print: 2007-1582- ISSN-On line: 2007-3682
ECORFAN® All rights reserved
LONGARELA-ARES, Angeles. Financial viability and environmental
aspects in the selection of energy sources for sanitary hot water (SHW)
and heated swimming pools. ECORFAN Journal-Mexico. 2019
1. Introduction
In recent years, energy prices have been subject
to a gradual increase that has caused companies
to consume energy from a marginal item in
Their cost structure to a considerable part
(ATECYR, 2011). This has led them to Rethink
Their management, without losing the
advantages it grants (higher productivity and
quality) Because business Efforts Have Been
traditionally based on the overall efficiency of
Processes neglecting consumption, something
the current economic Necessary Given
situation.
In sports facilities, energy consumption
is one of the Most Important items of the
company's expenses, Representing the Sanitary
Hot Water (SHW) and the heating of the pool
water (Pool), 25% of the total energy
consumption (Ministry of Economics and
Technological Innovation, 2005). This makes
its management look demeanor if it is not
accompanied by appropriate thermal conditions
in showers and heated pools (Municipal Sports
Foundation, 2011). The choice of a suitable
energy installation can allow the company to
reduce its consumption, making it more
competitive in costs, improving its efficiency
and contributing to a business model that is
respectful of the environment and more
sustainable, Which will have a better brand
image and will grant a competitive and
differentiating advantage.
These questions make interesting the
study of the selection of a SHW installation and
pool water heating, and therefore it was chosen
as the subject of this work.
What is intended is to make a
comparison of four alternatives of ACS and
pool facilities: a conventional installation of
Natural Gas (non-renewable energy), a Biomass
installation (renewable energy based on the
consumption of organic fuel, such as pellets)
and two Solar Thermal installations (combined
with each of the first alternatives, giving rise to
two hybrid installations). The objective is to
select the most appropriate for a sports center
considering the financial evaluation of the
various alternatives and commenting on the
impacts and environmental aspects of each of
them.
The work is structured as Follows:
section 2 presents the state of the art and
description of the business-case; Section 3
shows the methodology; Section 4 sets out the
results; Section 5 comments on the conclusions;
Section 6 collects the bibliography used and
Appendix 1 collects some of the tables With the
data and calculations made, which for reasons
of space, and to facilitate reading, could not be
incorporated into the text
2. State of the art and description of the
company-case
2.1. State of the art
Sports facilities are characterized by special
energy needs different from those of any other
type of business. This peculiarity is due to its
high loads of heat and electricity consumed
(Artuso & Santiangeli, 2008) since they are
usually used by a large number of people who
consume resources, mainly water and energy.
Applying measures that, in addition to
reducing consumption, reduce the
environmental impact, such as the installation
of SHW systems and heating of pool water with
clean energy, will mean responsible action that,
if it is also feasible and economically viable,
can be applied to other types of environments
or sports centers. In Addition, the construction
and rehabilitation of These sports facilities is a
good opportunity for the introduction of
environmental criteria, especially in terms of
energy efficiency, with the impact That These
types of Measures Have on the economic
expenses of the facilities operation (Fraguas
Herrero, 2010).
It becomes interesting to value the
installation of innovative equipment, with high
energy efficiency; maintain these equipment
regularly and change them depending on the
performance evolution and provide energy
supply systems such as active or passive solar
energy, wind engines, heat pumps, etc. (Fraguas
Herrero, 2010). Likewise, regulations Have
Been established, Such as document HE4 of the
Technical Building Code (CTE), Which
Encourage the use of clean energy in new
buildings, When the main source of energy is
not renewable (Natural Gas), of such that there
must be a minimum solar contribution to SHW
and pool water heating.

48
Article ECORFAN Journal- Mexico December 2019 Vol.10 No.23 46-71
ISSN-Print: 2007-1582- ISSN-On line: 2007-3682
ECORFAN® All rights reserved
LONGARELA-ARES, Angeles. Financial viability and environmental
aspects in the selection of energy sources for sanitary hot water (SHW)
and heated swimming pools. ECORFAN Journal-Mexico. 2019
Some of these projects to be evaluated
by companies, and which represent an
important decision that will have an impact on
their future costs, are investment projects in
energy facilities. Probably, The most used
decision rule to choose The most efficient
alternative Among the different projects, to
ASSESS and analyze the viability from a
financial point of view is the net present value
(NPV) or the present value of the benefits less
the present value of the costs used by
economists to defend the adoption of Energy
Efficiency Measures by Individuals and
Organizations (Galan Gonzalez Leal & Varela,
1999; Dhavale & Sarkis, 2015).
Nikolaidis, Chatzis & Poullikkas (2018)
performed a life cycle cost analysis, a NPV
analysis and an uncertainty analysis to assess
the impact of intermittent renewable energy
sources. In order to obtain the components of
the NPV, they considered that the general
expenses of an electrical energy storage facility
include the investment costs or initial cost of
the project or installation, the operation and
maintenance costs.
Chakrabarty and Islam (2011) and Palit,
Malhotra and Kumar (2011) also consider
similar VPN components as those of
Nikolaidis, Chatzis & Poullikkas (2018),
although Chakrabarty and Islam (2011)
complement their study with an eco-efficiency
analysis and Palit, Malhotra and Kumar (2011)
approach it from the perspective that if the
present value of the cost (CPV) of an energy
project based on biomass gasifiers (BGPP) is
less than or at least equal to the present value of
the benefits accrued by the Project
Implementation Agency (PIA) of the electricity
sale (BPV) throughout the life of the project,
this will be financially viable.
There are several studies in esta area.
Some authors focus on a specific type of energy
that usually includes some energy considered
renewable and analyze the viability of Said
project. This is the case of authors: such as
Brittany (2007), Which Focuses on the
financial valuation of a biomass installation,
Condori Yucra (2010) and Corral (2011) That
focus on solar installation, or Noguera (2011)
That Focuses in analyzing a project, which
combines several types of energy: solar
thermal, geothermal and biomass.
On the other hand, other authors choose
to compare several alternatives that allow
selecting among different types of energy the
most appropriate for a given case. This is what
Martínez Sánchez (2011) and Moreno (2012),
which focus, respectively, on comparing a
microgeneration system of thermal energy and
electricity with conventional systems and a
diesel installation with a biomass installation to
consider replace it. O Chakrabarty & Islam
(2011) who Carried out a financial feasibility
analysis of domestic Solar Systems with six
case studies, comparing previous expenditures
on conventional energy sources before
implementing the system.
In any case, the procedure is similar
defining in the first place the Characteristics of
the building or place Where the installation to
be EVALUATED is going to be Implemented,
making calculations of a technical nature and,
subsequently, of a financial nature, Such as the
NPV, to ASSESS the installation, and exposing
the Appropriate conclusions in view of the
results.
There are both real case studies
(Chakrabarty & Islam, 2011; Corral, 2011),
Where the feasibility analysis will be used to
determine Whether to Maintain or change the
Existing facility, Such as business-case studies
Arising from academic projects, business
projects not Carried out yet or studies that are
based on real data of buildings, swimming
pools or sports centers that can serve as a base
(Noguera, 2011), Where analyzing the
feasibility will be used to choose what type of
installation to perform. Some studies focus on
urban buildings (Martínez Sánchez, 2011;
Moreno, 2012), homes (Chakrabarty & Islam,
2011) transferable to the sports field and others
in sports centers or swimming pools (Cloquell,
Artacho and Santamarina, 2009; Condori
Yucra, 2010; Corral, 2011; Noguera, 2011).
Regarding environmental aspects,
projects related to energy facilities can generate
costs borne by Also society, called external
costs, external effects or externalities
(Delacámara, 2008; European Investment Bank,
2013). These externalities can influence When
selecting a type of SHW installation or another.
In the case study, for example, using the solar
energy or a renewable energy source will
reduce negative flows by reducing consumption
and Avoiding costs.

49
Article ECORFAN Journal- Mexico December 2019 Vol.10 No.23 46-71
ISSN-Print: 2007-1582- ISSN-On line: 2007-3682
ECORFAN® All rights reserved
LONGARELA-ARES, Angeles. Financial viability and environmental
aspects in the selection of energy sources for sanitary hot water (SHW)
and heated swimming pools. ECORFAN Journal-Mexico. 2019
However, a financial analysis does not
include the external effects Usually That the
presence of the resource Generates on
economic agents other than ITS owner and / or
user, That is, on society (Delacámara, 2008).
With This in mind, not only financial but
environmental issues Also would come into
play.
To make more complete decisions,
externalities should be duly quantified and
taken into account in the analyzes, counting
them as costs of the decision if their impact is
negative or as benefits thereof, if it is positive.
It could be considered, for example, that
externalities in facilities that use renewable
energy sources above the mandatory percentage
would have a positive impact as the reduction
of pollution is greater, or that the reduction in
fuel consumption or the use of the solar energy
sources, would lead to avoided costs in the
generation of energy, while Maintaining The
Possibility of fully covering the demand
(Delacámara, 2008).
The European Investment Bank (2013)
to Evaluate the costs and benefits for society, it
considers That is Necessary to take into account
externalities and Such, For This, They must be
added Together with the operation and
maintenance costs. This requires an estimate of
the volume of externality (for example, tons of
greenhouse gas Emissions per year) and an
Appropriate unit price, or a marginal estimate
of external cost. Although it may be difficult to
estimate, the European Investment Bank (2013)
has made valuations in euros of some
externalities in the sectors in which it operates
and considers them a negative flow when
calculating the NPV.
Infrastructure Sustainability Council of
Australia (ISCA) (2016) starts from the fact
That the cost-benefit analysis (CBA) is a
financial analysis process to calculate the net
costs and benefits of the options Expressed in
monetary units and That the results can be
express, Among other forms, with the net
present value (NPV). From there, the complete
economic analysis (CEA) is a tool That Allows
expanding the CBA by Including externalities
in the evaluation and calculating the net
benefits (benefits minus costs) of the options
Expressed in monetary units.
However, in the private sector the cost-
benefit analysis and the NPV do not Usually
include externalities When Evaluating some
investment projects, in part, due to the lack of
Relevant data and the limited time, but Also
due to the little emphasis on the external effects
(Karmokolias, 1996). This Makes Incorporating
externalities into the financial feasibility
analyzes can be complicated by the difficulty to
be valued monetarily, in some cases being
Considered as intangible effects (Delacámara,
2008); other environmental effects do not lend
themselves easily to quantification due to their
nature (Karmokolias, 1996) and, although
significant progress has been made in refining
the estimates of values and methods to integrate
them into the analysis, it is still necessary to
expand the range of externalities considered,
not only harmful emissions, but also others
such as loss of biodiversity and ecosystem
services (European Investment Bank, 2013).
Taking into account the considerations
mentioned, this work will focus on the financial
evaluation of various alternatives for an ACS
installation and heated pool, without
considering externalities and environmental
costs at the empirical level. However, the
environmental aspects and impacts of each
alternative will be Discussed by Describing the
level of pollution and CO2 Emissions of the
different alternatives based on the investment
decision in traditional or renewable energy
projects.
2.2. Business-case description
In the present study, a hypothetical business-
case is used, which have the following
characteristics: construction of 3,984 m2 (not
counting the fuel silo, if applicable) located in
lugo. It consists of several units, on two floors,
and special attention will be given to those
involved in the management of shw and pool
water, listed in table 1 below:

50
Article ECORFAN Journal- Mexico December 2019 Vol.10 No.23 46-71
ISSN-Print: 2007-1582- ISSN-On line: 2007-3682
ECORFAN® All rights reserved
LONGARELA-ARES, Angeles. Financial viability and environmental
aspects in the selection of energy sources for sanitary hot water (SHW)
and heated swimming pools. ECORFAN Journal-Mexico. 2019
Sheet of
water Height
Pool
volume
Glass
surface
(walls and
floor)
Indoor
pool or Pool 1
312.5
m2
1.5 m
high at the front
2.5 m
high at the rear
Average
height of
2 m
625 m3 462,50 m2
Splash Pool
Indoor -
Pool 2
70 m2 1.2 m average
height 84 m3 104 m2
Changing
rooms
318 m2 for users and monitors With showers,
toilets and sinks) and auxiliary services (12 m2
With toilets and sinks).
Table 1 Dependencies involved in the management of
hot water and pool water
Source: Self made
Company profile-event is geared to be a
market leader. The sports center begins to be
built in year 0, opens its doors at 21 months of
beginning to be built, that is, on October 1 of
year 1 and Year 2 it is the first full year of
operation and considered as the base year. The
monthly inflow for a total of 12,476 uses /
month, according to forecasts for year 2, based
on guidance from professionals. It is based on
the characteristics of a sports center with a wide
range of courses and supervised activities,
taught at various times to a maximum of people
per session, and free activities (swimming pool,
fitness, paddle, tennis ...).
Uses are considered not sales, because,
for example, a person enrolled in a course of 2
days per week is considered as a single sale, but
as 8 uses per month. For courses and supervised
activities, applications were set at 40% of the
maximum number of people per session that
could come to be, because in the first years of
operation it is usually the common influx and
for free activities are directly estimated the
number was directly estimated of monthly uses,
in accordance with the guidelines of sports
center managers (table 2.1 APPENDIX 1). In
the case of number of subscribers (sales, no
use) is expected up to 5,000 customers as a
stop, growing from 2,000 subscribers (40% of
5,000) is in year 2 50% for year 3 , 33% for 4,
15% for 5 and 5% to 6 reaching 4,817
subscribers.
3. Methodology
The methodology for performing this study is
divided into three phases:
Calculate power in kilowatts (kW) that
is required to have the facility for hot
water and pool water heating and annual
energy consumption in kilowatt hours
(kWh). Investment, initial or installation costs
and operation and maintenance costs of
each type of installation. NPV calculation of each type of
installation.
In addition, relevant environmental
aspects of the alternatives considered, such as
the estimated CO2 emissions for each type of
SHW installation and heated pool valued at
work, will be discussed.
Since the study focuses primarily on a
financial level, not on an assessment of
environmental costs or impact of emissions,
were considered only economic variables such
as prices and investment costs or initial and
installation costs, operating costs and
maintenance costs of each type of installation in
the financial analysis and were complemented
with appropriate justifications according to
which some alternatives are considered more
sustainable than others, based on their CO2
emissions and environmental aspects.
To determine the power and energy
consumption, the formulas of power and energy
contained in Albarracín, Sanabria and Maíllo
(2007), the "Technical Guide Hot Water
Central" ATECYR (2011) and expert technical
advice were used. Likewise, information on
similar academic works was obtained and the
procedure used in these, or any of its steps, was
followed for the different sections (Britain,
2007; Cloquell, Artacho and Santamarina,
2009; Condori Yucra, 2010, Corral, 2011;
Noguera, 2011; Martínez Sánchez, 2011;
Moreno (2012), Also, it was used an energy
efficiency manual by Escobar (2009) and an
audit by Creara (2011), studies that also served
as guidance for financial analysis, in addition to
Chakrabarty and Islam (2011), Palit, Malhotra
and Kumar (2011 ) and Nikolaidis, Chatzis and
Poullikkas (2018), to determine the components
of the NPV.

51
Article ECORFAN Journal- Mexico December 2019 Vol.10 No.23 46-71
ISSN-Print: 2007-1582- ISSN-On line: 2007-3682
ECORFAN® All rights reserved
LONGARELA-ARES, Angeles. Financial viability and environmental
aspects in the selection of energy sources for sanitary hot water (SHW)
and heated swimming pools. ECORFAN Journal-Mexico. 2019
All calculations were made based on
year 2, as it is the first full year of operation of
the sports center, except for the NPV
calculation for which a 20-year forecast is
applied. Although in the future the number of
clients increases, energy facilities should be
based on the most conservative and the early
data, as if estimates are met they can always be
increased. Data used were obtained from
various sources are discussed in detail below,
together with the methodology used in each
phase.
Traditionally assessing the viability of
projects has been carried out based on financial
aspects. However, at present, it is important to
assess how well a project is able not only to
generate profit or be viable, but also to reduce
negative impacts on the environment, and see
how they can take into account the issues and
environmental costs.
To determine the environmental impacts
and CO2 emissions data were applied and
indications and formulations of the Practical
Guide for calculating emissions of greenhouse
gases (ghgs) by the Generalitat de Catalunya
(2011) and IDAE (2019) were followed in the
stage of energy consumption, as well as the
method to value economically CO2 emissions
from European Investment Bank (2013).
3.1. Methodology for calculating power
and energy consumption
To determine the thermal power and energy
consumption, on the one hand, it was calculated
the consumption of liters of SHW and thermal
energy demand which will involve the locker
room and on the other hand, the power and
energy demand of swimming pools, since in
each case will be obtained differently. The
power for hot water, hot water consumed for
health services (showers and toilets, mainly)
was calculated from daily water consumption,
which is given by the daily influx of people to
the center and liters each person consumes. The
daily influx is determined from the monthly
influx. Since it varies every month, especially
in summer, due to the seasonality of use of
sports centers, guidance influx rates were
established, taking 12. 476 uses as the months
in which the monthly inflow level is 100% of
the expected (Table 2.2 Appendix 1).
Subsequently, the monthly uses were
added to know the annual ones and, from these,
the average monthly and daily uses (345
people/day) were obtained.
In respect of pools, they consume hot
water due to 2 main causes: constitute the first
time the pool glass is filled and the heat losses
of the glass due to five factors: evaporation,
radiation, convection, transmission and water
renewal. This will mean having to use hot water
to maintain the temperature at the appropriate
levels (between 24 ºc and 30 ºc, according to
the RITE Wellness and Health Requirement IT
1.1). A temperature of 28ºc was chosen for pool
1 and 30ºc for 2, because according to the RITE
and orientations of real sports centers, pool 2 if
used by babies, senior citizens and pregnant
women, should have a higher temperature.
Energy consumption will be given in
kilowatt hours (kwh). On the one hand, we have
the energy consumption of SHW and, on the
other hand, those of swimming pools. The
annual energy consumption (kwh) shall be
calculated by the product of the installed power
(kw) for the hours that power is expected to be
used annually.
3.2. Methodology for calculating
investment costs or initial installation,
energy costs and maintenance costs
Once the power to be installed was calculated,
the installation costs were determined for each
alternative (Natural Gas, Biomass and Solar
combined with Natural Gas or Biomass), based
on estimates of professionals and catalogs of
boilers and solar panels such as Vaillant rate
catalog or the Herz price generator.
The facilities are adapted to document
HE4 of the Technical Building Code (CTE)
which, since 2006, establishes that, in new
buildings, when the main source of energy is
not renewable (Natural Gas), there must be a
minimum solar contribution to SHW and pool.
In SHW this contribution will depend on the
solar zone (Lugo is Zone II) and the hot water
consumer (between 5,000 and 10,000 liters /
day) that will be 40% of the energy demanded
for SHW. For swimming pool heating it will
depend on the solar zone and will be 30% of the
energy demanded for swimming pools.

52
Article ECORFAN Journal- Mexico December 2019 Vol.10 No.23 46-71
ISSN-Print: 2007-1582- ISSN-On line: 2007-3682
ECORFAN® All rights reserved
LONGARELA-ARES, Angeles. Financial viability and environmental
aspects in the selection of energy sources for sanitary hot water (SHW)
and heated swimming pools. ECORFAN Journal-Mexico. 2019
To determine the number of solar panels
required, the required contribution will be
calculated according to the percentages
mentioned, the heat exchanger savings will be
taken into account and the auropro3.0.1
program of Vaillant will be used to calculate
the number of solar panels needed for SHW and
pool.
In addition, it will be taken into account
in the cost of facilities the subsidies for
renewable energy projects of INEGA 2018,
which for the Biomass boiler is € 360 / kw of
installed power, with a 50% maximum aid
percentage, and for Solar Thermal energy
installations, for the non-mandatory part of the
CTE and being combined with conventional
energies, of € 1500 / kw with a 50% maximum
aid percentage.
From the energy consumption data with
fuel prices biomass set by the IDAE (Institute
for Saving and Energy Diversification), prices
of Natural Gas Endesa (2018) for consumptions
between 100,000 kwh / year and 3 gwh / year
with Rate 3.4. Recommended by Endesa
professionals and document HE4 Building
Technical Code for solar panels, the annual
energy cost of each type of installation is
determined.
To determine the energy cost of
"Natural Gas" annual energy consumption
savings exchanger was used, minus the
mandatory minimum solar contribution, since
this contribution is free. When installing a
condensing boiler must be noted that the yield
is 104%, so that with each kwh produced will
be covered 1.04 kwh and therefore consumption
will be covered with less energy production
(Production = Consumption / Performance).
The production result obtained was multiplied
by the price of the most economical Natural
Gas in the market for consumption between
100,000 kwh / year and 3 gwh / year with the
rate 3.4. (Endesa, 2018), taking into account the
monthly fixed term.
For the cost of consumption of
"biomass", the price of wood pellets in bulk
(one of the fuels of this type of boiler) in € /
kwh with an average price of the A1 certified
pellet in bulk is € 0.0366 / kwh and uncertified
pellet bulk € 0.0352 / kwh, according to the
IDAE liberalized energy prices report (2017-
2018) and professionals in the sector.
The average of both is 0.0359 € / kwh. It
was multiplied by the production of energy
needed to cover annual energy consumption
with savings of discounted exchanger
(production will be greater than consumption,
since it has a Biomass boiler with a yield of
93% that covers 0.93 kwh for each kwh
produced).
For installations with voluntary solar
contribution, the corresponding solar
contribution was subtracted from the annual
energy consumption with exchanger savings. In
the case of the “Solar combined with Natural
Gas” installation, the energy costs were
determined as indicated for installation "Natural
Gas", and for "Solar Biomass" installation, as in
the case of installation "Biomass ".
And, based on estimates of professionals
in the sector, maintenance costs were
calculated. There are common maintenance
costs for any of the alternatives analyzed. On
the one hand, there are the mechanical
maintenance costs related to monthly
preventive operations of checking the energy
equipment (12h / month), of daily operations of
temperature control of the deposits and pool (2h
/ day), and of corrective operations for
assistance or unforeseen events (200h per year)
and, on the other hand, chemical maintenance
costs, performed by an approved laboratory,
such as legionella and PH analysis of SHW and
swimming pool (€ 6,000). The first ones will be
given by the cost / hour of the necessary
personnel and by the hours that are in the center
and the second ones have a fixed price.
Moreover, in the biomass installation there will
have to be a person in charge of removing the
ashes from the fuel weekly (52 hours per year)
and a monitoring plan will be carried out in the
thermal solar installation (cleaning of panels
and control of collectors and circuits) and
maintenance of the collection, accumulation
and exchange systems, hydraulic circuit and
electrical system.
3.3. Methodology for feasibility analysis
(NPV)
Depending on the results, it made a comparison
of the alternatives, paying particular attention to
costs and initial investment, and financial
viability of each option was studied using an
NPV analysis.
53
Article ECORFAN Journal- Mexico December 2019 Vol.10 No.23 46-71
ISSN-Print: 2007-1582- ISSN-On line: 2007-3682
ECORFAN® All rights reserved
LONGARELA-ARES, Angeles. Financial viability and environmental
aspects in the selection of energy sources for sanitary hot water (SHW)
and heated swimming pools. ECORFAN Journal-Mexico. 2019
For the calculation of the NPV, a time
horizon equal to the useful life of the facilities
was established, 20 years, setting as down
payment the cost of the installation (with
subsidy) and as cash flows the annual energy
costs added to the costs of maintenance. Being
disbursement flows will be negative and
therefore the result of NPV too, so that one with
a higher NPV will be proposed as a more
adequate installation, despite being all negative.
To make temporary projections of 20
years the increase in the influx of people to
SHW was taken into account. In year 1 the flow
is the fourth part of year 2, the center being
open for only a quarter. Since the flow 2
increases by 50%, 33%, 15% and 5% in years
3, 4, 5 and 6, respectively, with the same ACS
consumption being maintained since it will vary
in these proportions. The pool will consume the
same every year, except for losses the first year,
to work only during the opening three months
since October, will be the fourth of the year 2.
The first cup filling is made in October and the
following filled year in December. Other years
are filled alternately. After the first filling of
swimming pools in October of the opening year
1, and of the filling of the year 2 calculation
base, the entire pools will be emptied only
when repairs are required, and only a part is
usually emptied for minor repairs. As the
company of this study is a quality benchmark
and to anticipate possible repairs, it was
considered a commissioning every two years.
The NPV formula is shown in table 9 of
Appendix 1. The effect of inflation has not been
considered, since when applying a rate g
multiplying the price of each year n by (1 +
g)^n, in the formula of the NPV the discount
factor (1 + g)^-n must be added, and the same
result would be obtained as without an inflation
rate (Garrido, 2001). The WACC (Weighted
Average Cost of Capital) is considered a
discount rate, based on an estimate of the total
cost of building a sports center with the
characteristics of the business-case and and
from the costs of debt according to orientations
of experts of the sector of management of
sports facilities and advisers of banking entities.
Upgrading to a discount rate of 8.40% WACC
offers the same conclusions as to consider
inflation at 3% and upgrade to a rate of 11, 65%
(taking into account the effect of inflation, (1 +
0.084) * (1 + 0.03)).
This WACC value is appropriate, used
in studies of similar nature in which for an
energy project to be carried out in the company
can be used as the discount rate WACC of this
(Noguera, 2011).
3.4. Methodology for
calculatingenvironmental impacts and
CO2 emissions
The analysis of external costs and
environmental externalities means greater
transparency in the management, more
information about the activities to be analyzed
and less discretion of some decisions. The
literature on the economic valuation of
environmental external costs, agrees on the
need to match two unequal but consistent
methodological approaches: the approach path
impact and life cycle analysis (LCA) and
although sometimes not easy to estimate
externalities by technical ignorance or lack of
means, in any case, it is good to reflect on them
(Linares Llamas, 2002. European Investment
Bank, 2013; Infrastructure Sustainability
Council of Australia (ISCA), 2016).
For energy the life cycle analysis (LCA)
comprises the extraction of fuel, transport,
preparation, construction, operation and
decommissioning of generation, energy
transmission and management of waste
produced. All these steps have environmental
consequences, higher or lower depending on the
type of energy.
In the case of natural gas, emissions
from extraction, transport and generation,
occupation of land, noise and pollutant
discharges are generated. In the case of biomass
it produces emissions in the cultivation,
collection, transportation and generation, waste,
residues and occupation of terrain and in the
case of solar energy it generates solid waste
such as heavy metals in its generation and land
occupation and visual impact, however, it does
not generate CO2 emissions (Linares Llamas,
2002).
In addition, for economic evaluation of
externalities, there are various applicable
methods to quantify in monetary terms damage,
such as the "top-down" method Hohmeyer
(1988), using aggregate data emission and
impacts to estimate external costs of certain
contaminants.

54
Article ECORFAN Journal- Mexico December 2019 Vol.10 No.23 46-71
ISSN-Print: 2007-1582- ISSN-On line: 2007-3682
ECORFAN® All rights reserved
LONGARELA-ARES, Angeles. Financial viability and environmental
aspects in the selection of energy sources for sanitary hot water (SHW)
and heated swimming pools. ECORFAN Journal-Mexico. 2019
Approach "bottom-up" using specific
values for each unit of production or energy
demand (Bernow & Marron, 1990; Ottinger et
al., 1991; Pearce et al., 1992); damage function,
a succession of steps following the impact from
the activity that generates it until the damage
that occurs independently for each activity and
impact considered; a methodology applied by
the European Commission (1995, 1999) for the
externe project ( Linares Llamas, 2002) or as
the European Investment Bank (2013) that
estimates the volume of an externality and an
appropriate unit price, or a marginal estimate of
external cost.
In the consumption stage, which this
study focuses on, natural gas is a fuel that
contributes to increasing CO2 emissions. The
Practical Guide for the calculation of
greenhouse gas (GHG) emissions (Generalitat
de Catalunya, 2011) involves the emission of
2.15 kg CO2 / Nm3 of natural gas.
Biomass is a fuel with emissions
considered practically neutral (Generalitat de
Catalunya, 2011), a zero-emission factor will be
applied (t CO2 / TJ Nm3).
Solar energy means less CO2 emissions,
covering part of the need to produce energy
with other non-renewable sources and is
considered to have zero emissions.
In this paper, to analyze the
environmental impact, it has chosen to focus on
CO2 emissions at the consumption stage only
since when it comes to incorporating the
valuation of externalities in an economic or
financial analysis there are usually several
difficulties. Some difficulties may be of a
technical nature, related to the risk of incurring
double counting of securities, ie incorporate
two or more times the same welfare loss, then
overestimating the externality, and can be
complementary and competitive features for the
same resource (Turner et al., 2003) or problems
with the scale data, since in order to analyze
economically externalities, it may be used
estimations obtained for similar analysis, in
other places or circumstances, and that could
mean not transferring the results properly to
context of the analysis being developed
(Delacámara, 2008).
To determine CO2 emissions at the
consumption stage, the following
considerations were taken into account:
Natural gas, according to the Practical
Guide for calculating emissions of
greenhouse gases (GHGs) (Generalitat
de Catalunya, 2011) involves the
issuance of 2.15 kg CO2 / Nm3 of
natural gas. Biomass is a fuel with emissions
considered practically you neutral
(Generalitat de Catalunya, 2011), are
subject to a zero emission factor (t CO2
/ TJ Nm3).
Solar energy means less CO2 emissions,
covering part of the need to produce
energy with other non-renewable
sources.
In addition, according to the European
Investment Bank (2013), CO2 emissions could
be economically valued in EUR / t CO2e. The
European Investment Bank (2013) makes a
central estimate of the damage associated with
an emission in 2010 of 25 euros per tonne of
carbon dioxide equivalent, plus a high and low
estimate of 40 euros and 10, respectively (all
measured in constant euros of 2006). Reflecting
a common finding that the marginal damages of
emissions increases as a function of
atmospheric carbon concentrations, annual
"adders" are applied after 2010, ie, an absolute
increase in value per year (measured in prices
constant 2006). Therefore, an issue in 2017, the
year of the study, according to the central
estimate would be equal to 25+ (2017-2010) =
32 (Euro 2006). Thus reducing the consumption
of natural gas and bet on hybrid systems
combining solar energy, beyond legally
binding, or betting on biomass installations, you
can assume greater sustainability for the
business-case and a positive impact on the
consumption stage for the environment.
4. Results
4.1. Results of power and energy
consumption
Power
Table 3 summarizes the powers necessary for
hot water and pool and the power to be installed
is collected and then explained as calculated.

55
Article ECORFAN Journal- Mexico December 2019 Vol.10 No.23 46-71
ISSN-Print: 2007-1582- ISSN-On line: 2007-3682
ECORFAN® All rights reserved
LONGARELA-ARES, Angeles. Financial viability and environmental
aspects in the selection of energy sources for sanitary hot water (SHW)
and heated swimming pools. ECORFAN Journal-Mexico. 2019
Table 3 Power installed
Source: Self made
First, the thermal power needed for the
production of SHW was determined by finding
the one hand consumption liters of water and
the thermal energy demand which will provide
the locker and on the other, demand for pools,
since power in kw is obtained differently.
Knowing, therefore, that a month come
to the center 345 people / day and each person
consumes 21 liters of water at 60 ° C
(according to the document HE4 "Power Saver"
CTE) would consumption SHW of 7,245 liters /
day. Therefore, 1 SHW tank of 2,500 liters of
capacity will be installed and a time of 2 hours
will be considered each time the tank is filled,
leaving a necessary power to heat the water at
60ºc of 71.05 kw (Albarracín, Sanabria and
Maíllo, 2007; ATECYR, 2011). As in the base
year it is forecast consumption of 7,245 liters
and the tank is 2,500 liters if the boiler works 6
hours / day for SHW will produce 7,500 liters
in total and, therefore, to 7,245 liters will work
5.8 hours / day. In the event that would increase
the flow to the center, if the same percentages
apply subscriber growth,
As for the pools, the consumed hot
water comes from 2 main causes: constitute the
first time the pool is filled and the heat losses
from the pool vessel. The heat losses of the
pool vessels were calculated (Albarracín,
Sanabria and Maíllo, 2007; ATECYR, 2011)
adding a necessary power of 113.28 kw and,
after filling the pool glasses for the first time,
the power to cover the set-up to be consumed
each time, for repairs, the pools have to be
refilled, it adds a power of 196.89 kw.
The total power required would be
381.23 kw (table 3), considering the
commissioning, the renewal of the water and
the losses power due to evaporation or radiation
(Albarracín, Sanabria and Maíllo, 2007;
ATECYR, 2011). If one takes into account the
punctual use of the commissioning power of the
pool and, thinking that when it is produced, the
renewal power of the water is already covered
and there are practically no losses due to
evaporation or radiation, a boiler would be
installed to covering a power equal to 281.85
kw. The choice is, therefore, a boiler of 300 kw.
Energy consumption
In terms of energy consumption, on the one
hand, if we consider that the SHW power is
71.05 kw and 5.8 hours a day working in year 2
(calculation basis) a daily demand of 412 kwh
will occur and, as the center will be open 365
days a year, there will be an energy demand of
150,309.12 kwh per year. On the other hand,
pools work the following hours:
Renovation and transmission (24 hours
a day, 365 days a year) and radiation (24
hours a day, 362 days a year, 3 days of
setting up the pool vessel) are
discounted.
Commissioning: at the end of year 2 a
pool filling, as it is the basis of
calculation. Year 1 is the initial
warming, and the other years, from 2 *,
one will be filled and no.
Evaporation: only the hours that the
center is open (4,888 hours) minus 72
hours of commissioning are considered,
because at that time the water will not
evaporate, the pools will be covered
with a thermal blanket the rest of the
hours that the center is not open.
In this way, 907,001.17 kwh would be
consumed in the base year (table 4 and table 4.1
complete Appendix 1).
Installed power
(kW)
SHW power 71.05
Power evaporation 63.22
Power radiation 6.62
Convection power 0.00
Power per transmission 13.91
Renewing water power 29.53
Commissioning power pool 196.89
Total 381.23
(Power evaporation + renewal +
radiation)
-99.37
Total installed 281.85
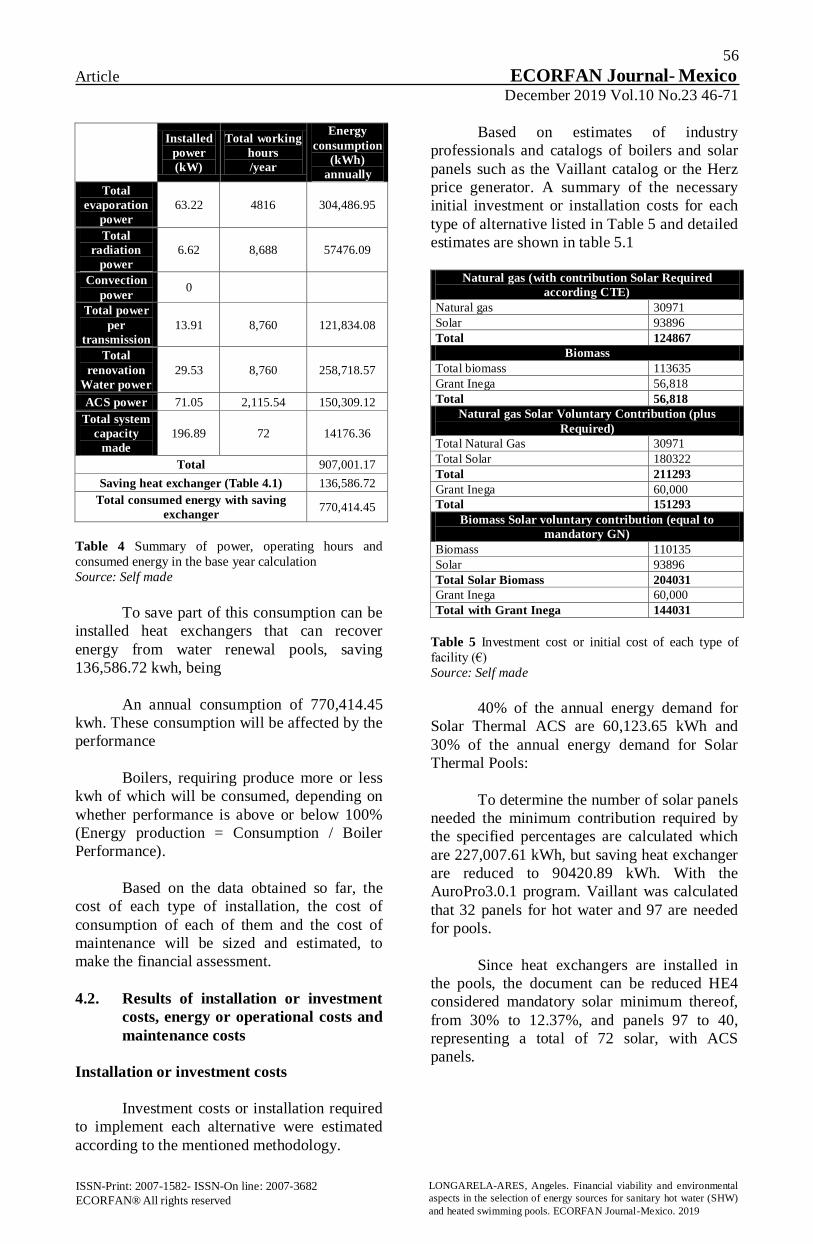
56
Article ECORFAN Journal- Mexico December 2019 Vol.10 No.23 46-71
ISSN-Print: 2007-1582- ISSN-On line: 2007-3682
ECORFAN® All rights reserved
LONGARELA-ARES, Angeles. Financial viability and environmental
aspects in the selection of energy sources for sanitary hot water (SHW)
and heated swimming pools. ECORFAN Journal-Mexico. 2019
Installed
power
(kW)
Total working
hours
/year
Energy
consumption
(kWh)
annually
Total
evaporation
power
63.22 4816 304,486.95
Total
radiation
power
6.62 8,688 57476.09
Convection
power 0
Total power
per
transmission
13.91 8,760 121,834.08
Total
renovation
Water power
29.53 8,760 258,718.57
ACS power 71.05 2,115.54 150,309.12
Total system
capacity
made
196.89 72 14176.36
Total 907,001.17
Saving heat exchanger (Table 4.1) 136,586.72
Total consumed energy with saving
exchanger 770,414.45
Table 4 Summary of power, operating hours and
consumed energy in the base year calculation
Source: Self made
To save part of this consumption can be
installed heat exchangers that can recover
energy from water renewal pools, saving
136,586.72 kwh, being
An annual consumption of 770,414.45
kwh. These consumption will be affected by the
performance
Boilers, requiring produce more or less
kwh of which will be consumed, depending on
whether performance is above or below 100%
(Energy production = Consumption / Boiler
Performance).
Based on the data obtained so far, the
cost of each type of installation, the cost of
consumption of each of them and the cost of
maintenance will be sized and estimated, to
make the financial assessment.
4.2. Results of installation or investment
costs, energy or operational costs and
maintenance costs
Installation or investment costs
Investment costs or installation required
to implement each alternative were estimated
according to the mentioned methodology.
Based on estimates of industry
professionals and catalogs of boilers and solar
panels such as the Vaillant catalog or the Herz
price generator. A summary of the necessary
initial investment or installation costs for each
type of alternative listed in Table 5 and detailed
estimates are shown in table 5.1
Natural gas (with contribution Solar Required
according CTE)
Natural gas 30971
Solar 93896
Total 124867
Biomass
Total biomass 113635
Grant Inega 56,818
Total 56,818
Natural gas Solar Voluntary Contribution (plus
Required)
Total Natural Gas 30971
Total Solar 180322
Total 211293
Grant Inega 60,000
Total 151293
Biomass Solar voluntary contribution (equal to
mandatory GN)
Biomass 110135
Solar 93896
Total Solar Biomass 204031
Grant Inega 60,000
Total with Grant Inega 144031
Table 5 Investment cost or initial cost of each type of
facility (€)
Source: Self made
40% of the annual energy demand for
Solar Thermal ACS are 60,123.65 kWh and
30% of the annual energy demand for Solar
Thermal Pools:
To determine the number of solar panels
needed the minimum contribution required by
the specified percentages are calculated which
are 227,007.61 kWh, but saving heat exchanger
are reduced to 90420.89 kWh. With the
AuroPro3.0.1 program. Vaillant was calculated
that 32 panels for hot water and 97 are needed
for pools.
Since heat exchangers are installed in
the pools, the document can be reduced HE4
considered mandatory solar minimum thereof,
from 30% to 12.37%, and panels 97 to 40,
representing a total of 72 solar, with ACS
panels.

57
Article ECORFAN Journal- Mexico December 2019 Vol.10 No.23 46-71
ISSN-Print: 2007-1582- ISSN-On line: 2007-3682
ECORFAN® All rights reserved
LONGARELA-ARES, Angeles. Financial viability and environmental
aspects in the selection of energy sources for sanitary hot water (SHW)
and heated swimming pools. ECORFAN Journal-Mexico. 2019
In addition, taken into account in the
cost of facilities, subsidies for renewable energy
projects of INEGA (Table 6), which for
biomass boilers are of 310 € / kW of installed
capacity, with 50% of project cost maximum
support (56,818 € maximum) and energy
facilities Solar Thermal, for non-mandatory part
of the CTE and being combined with
conventional energy, 1500 € / kW, with 50% of
the project cost and 60,000 € for project
maximum support (105,647 and 102,016 € € is
50% in the case of solar thermal systems with
more than the minimum required solar panels
and maximum subsidized € 60,000).
Biomass subsidy/grant
Maximum power assistance Maximum support per
project
310 € / kW - (P / 4) for
additional power P of 40 kW <P
≤ 440 kW with automatic
feeding and accumulation volume fuel V ≥ 250 liters and V
<1,000 liters and 50 € / kW if
system automatic cleaning
exchanger
The aid intensity will be
50%.
The maximum amount of aid per project will be €
60,000.
Solar Thermal Grant
Maximum power assistance Maximum support per
project
1500 € / kW
The aid intensity will be
50%. The maximum amount of aid per project
will be € 60,000.
Table 6 INEGA subsidies for renewable energy
Source: Self made
Installation alternatives contemplated
are therefore:
Natural Gas facility that will comply A
Natural Gas facility installation that will
comply with the mandatory solar
minimum including 71 panels and will
not have any subsidy.
An installation exclusively of Biomass,
with a subsidy of € 56,818.
A solar installation combined with
Natural Gas, with solar input higher
than the mandatory one (51% to SHW
and 31% to swimming pool), 142
panels, 71 volunteers, with a subsidy of
€ 60,000.
And a Solar installation combined with
Biomass in which the minimum amount
required for conventional energy will be
taken as a voluntary solar contribution,
with a subsidy of € 60,000.
According to the installation costs (table
5 and table 5.1 Appendix 1) without taking into
account the subsidies, the installation that
requires a smaller investment is the “Biomass”
installation (€ 113,635) followed by “Natural
Gas” (€ 124,867), “Solar combined with
Biomass” (€ 204,031) and “Solar combined
with Natural Gas” (€ 211,293).
If there is no obligation for the CTE to
install a minimum of solar panels when
conventional energy is used, the “Natural Gas”
installation would be the one that would have
the lowest investment costs (€ 30,971), but this
option has not been realizable since 2006.
Taking into account subsidies, the
“Biomass” installation would continue to have
the lowest price (€ 56,818) and the Solar
combined with other energies could be
interesting, since its cost is reduced by almost a
third of the value without subsidy and they are
the alternatives with the highest solar input. In
principle, if we only based the analysis on the
cost of the investment (CAPEX or Capital
Expenditure), the most economical installation
would be the “Biomass”.
However, it should be seen if it
compensates for a larger investment depending
on whether in the long term it allows reducing
the costs of energy consumption and even other
operating expenses (OPEX or Operational
Expenditure), for example, the annual
maintenance of facilities, before settling on one
considering only the investment. In this case,
they consider disbursements arising from
operating expenses.
Energy costs
To determine energy costs indicated
methodology was followed. These costs for the
base year calculation, are shown in Table 7 and
Table 7.1 of Annex 1 of more detailed and
disaggregated form. Accordingly, the facility
would consume less "Solar with Natural Gas",
with a cost of € 22,327.87 in the base year, very
close to the running costs of the "Solar
Biomass" installation.
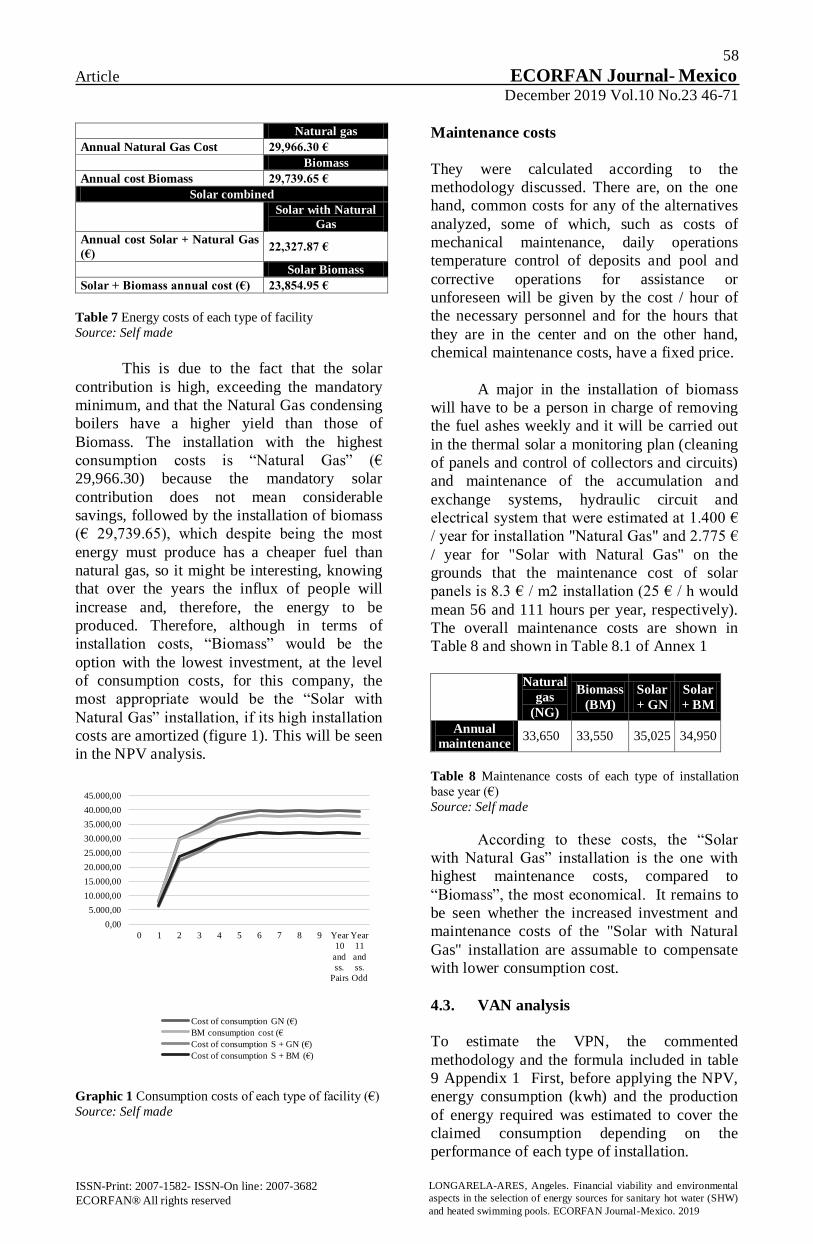
58
Article ECORFAN Journal- Mexico December 2019 Vol.10 No.23 46-71
ISSN-Print: 2007-1582- ISSN-On line: 2007-3682
ECORFAN® All rights reserved
LONGARELA-ARES, Angeles. Financial viability and environmental
aspects in the selection of energy sources for sanitary hot water (SHW)
and heated swimming pools. ECORFAN Journal-Mexico. 2019
Natural gas
Annual Natural Gas Cost 29,966.30 €
Biomass
Annual cost Biomass 29,739.65 €
Solar combined
Solar with Natural
Gas
Annual cost Solar + Natural Gas
(€) 22,327.87 €
Solar Biomass
Solar + Biomass annual cost (€) 23,854.95 €
Table 7 Energy costs of each type of facility
Source: Self made
This is due to the fact that the solar
contribution is high, exceeding the mandatory
minimum, and that the Natural Gas condensing
boilers have a higher yield than those of
Biomass. The installation with the highest
consumption costs is “Natural Gas” (€
29,966.30) because the mandatory solar
contribution does not mean considerable
savings, followed by the installation of biomass
(€ 29,739.65), which despite being the most
energy must produce has a cheaper fuel than
natural gas, so it might be interesting, knowing
that over the years the influx of people will
increase and, therefore, the energy to be
produced. Therefore, although in terms of
installation costs, “Biomass” would be the
option with the lowest investment, at the level
of consumption costs, for this company, the
most appropriate would be the “Solar with
Natural Gas” installation, if its high installation
costs are amortized (figure 1). This will be seen
in the NPV analysis.
Graphic 1 Consumption costs of each type of facility (€)
Source: Self made
Maintenance costs
They were calculated according to the
methodology discussed. There are, on the one
hand, common costs for any of the alternatives
analyzed, some of which, such as costs of
mechanical maintenance, daily operations
temperature control of deposits and pool and
corrective operations for assistance or
unforeseen will be given by the cost / hour of
the necessary personnel and for the hours that
they are in the center and on the other hand,
chemical maintenance costs, have a fixed price.
A major in the installation of biomass
will have to be a person in charge of removing
the fuel ashes weekly and it will be carried out
in the thermal solar a monitoring plan (cleaning
of panels and control of collectors and circuits)
and maintenance of the accumulation and
exchange systems, hydraulic circuit and
electrical system that were estimated at 1.400 €
/ year for installation "Natural Gas" and 2.775 €
/ year for "Solar with Natural Gas" on the
grounds that the maintenance cost of solar
panels is 8.3 € / m2 installation (25 € / h would
mean 56 and 111 hours per year, respectively).
The overall maintenance costs are shown in
Table 8 and shown in Table 8.1 of Annex 1
Natural
gas
(NG)
Biomass
(BM)
Solar
+ GN
Solar
+ BM
Annual maintenance
33,650 33,550 35,025 34,950
Table 8 Maintenance costs of each type of installation
base year (€)
Source: Self made
According to these costs, the “Solar
with Natural Gas” installation is the one with
highest maintenance costs, compared to
“Biomass”, the most economical. It remains to
be seen whether the increased investment and
maintenance costs of the "Solar with Natural
Gas" installation are assumable to compensate
with lower consumption cost.
4.3. VAN analysis
To estimate the VPN, the commented
methodology and the formula included in table
9 Appendix 1 First, before applying the NPV,
energy consumption (kwh) and the production
of energy required was estimated to cover the
claimed consumption depending on the
performance of each type of installation.
0,00
5.000,00
10.000,00
15.000,00
20.000,00
25.000,00
30.000,00
35.000,00
40.000,00
45.000,00
0 1 2 3 4 5 6 7 8 9 Year
10
and
ss.
Pairs
Year
11
and
ss.
Odd
Cost of consumption GN (€)
BM consumption cost (€
Cost of consumption S + GN (€)
Cost of consumption S + BM (€)
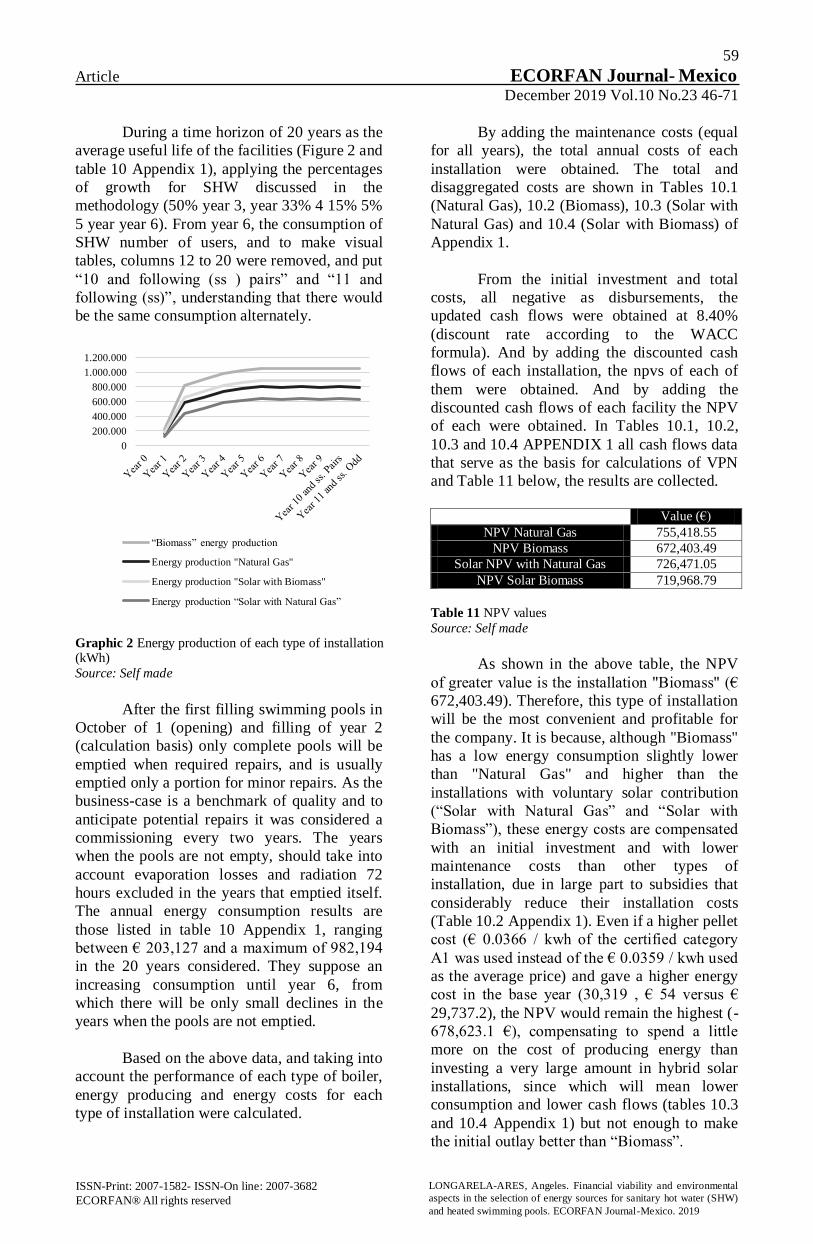
59
Article ECORFAN Journal- Mexico December 2019 Vol.10 No.23 46-71
ISSN-Print: 2007-1582- ISSN-On line: 2007-3682
ECORFAN® All rights reserved
LONGARELA-ARES, Angeles. Financial viability and environmental
aspects in the selection of energy sources for sanitary hot water (SHW)
and heated swimming pools. ECORFAN Journal-Mexico. 2019
During a time horizon of 20 years as the
average useful life of the facilities (Figure 2 and
table 10 Appendix 1), applying the percentages
of growth for SHW discussed in the
methodology (50% year 3, year 33% 4 15% 5%
5 year year 6). From year 6, the consumption of
SHW number of users, and to make visual
tables, columns 12 to 20 were removed, and put
“10 and following (ss ) pairs” and “11 and
following (ss)”, understanding that there would
be the same consumption alternately.
Graphic 2 Energy production of each type of installation (kWh)
Source: Self made
After the first filling swimming pools in
October of 1 (opening) and filling of year 2
(calculation basis) only complete pools will be
emptied when required repairs, and is usually
emptied only a portion for minor repairs. As the
business-case is a benchmark of quality and to
anticipate potential repairs it was considered a
commissioning every two years. The years
when the pools are not empty, should take into
account evaporation losses and radiation 72
hours excluded in the years that emptied itself.
The annual energy consumption results are
those listed in table 10 Appendix 1, ranging
between € 203,127 and a maximum of 982,194
in the 20 years considered. They suppose an
increasing consumption until year 6, from
which there will be only small declines in the
years when the pools are not emptied.
Based on the above data, and taking into
account the performance of each type of boiler,
energy producing and energy costs for each
type of installation were calculated.
By adding the maintenance costs (equal
for all years), the total annual costs of each
installation were obtained. The total and
disaggregated costs are shown in Tables 10.1
(Natural Gas), 10.2 (Biomass), 10.3 (Solar with
Natural Gas) and 10.4 (Solar with Biomass) of
Appendix 1.
From the initial investment and total
costs, all negative as disbursements, the
updated cash flows were obtained at 8.40%
(discount rate according to the WACC
formula). And by adding the discounted cash
flows of each installation, the npvs of each of
them were obtained. And by adding the
discounted cash flows of each facility the NPV
of each were obtained. In Tables 10.1, 10.2,
10.3 and 10.4 APPENDIX 1 all cash flows data
that serve as the basis for calculations of VPN
and Table 11 below, the results are collected.
Value (€)
NPV Natural Gas 755,418.55
NPV Biomass 672,403.49
Solar NPV with Natural Gas 726,471.05
NPV Solar Biomass 719,968.79
Table 11 NPV values
Source: Self made
As shown in the above table, the NPV
of greater value is the installation "Biomass" (€
672,403.49). Therefore, this type of installation
will be the most convenient and profitable for
the company. It is because, although "Biomass"
has a low energy consumption slightly lower
than "Natural Gas" and higher than the
installations with voluntary solar contribution
(“Solar with Natural Gas” and “Solar with
Biomass”), these energy costs are compensated
with an initial investment and with lower
maintenance costs than other types of
installation, due in large part to subsidies that
considerably reduce their installation costs
(Table 10.2 Appendix 1). Even if a higher pellet
cost (€ 0.0366 / kwh of the certified category
A1 was used instead of the € 0.0359 / kwh used
as the average price) and gave a higher energy
cost in the base year (30,319 , € 54 versus €
29,737.2), the NPV would remain the highest (-
678,623.1 €), compensating to spend a little
more on the cost of producing energy than
investing a very large amount in hybrid solar
installations, since which will mean lower
consumption and lower cash flows (tables 10.3
and 10.4 Appendix 1) but not enough to make
the initial outlay better than “Biomass”.
0
200.000
400.000
600.000
800.000
1.000.000
1.200.000
“Biomass” energy production
Energy production "Natural Gas"
Energy production "Solar with Biomass"
Energy production “Solar with Natural Gas”
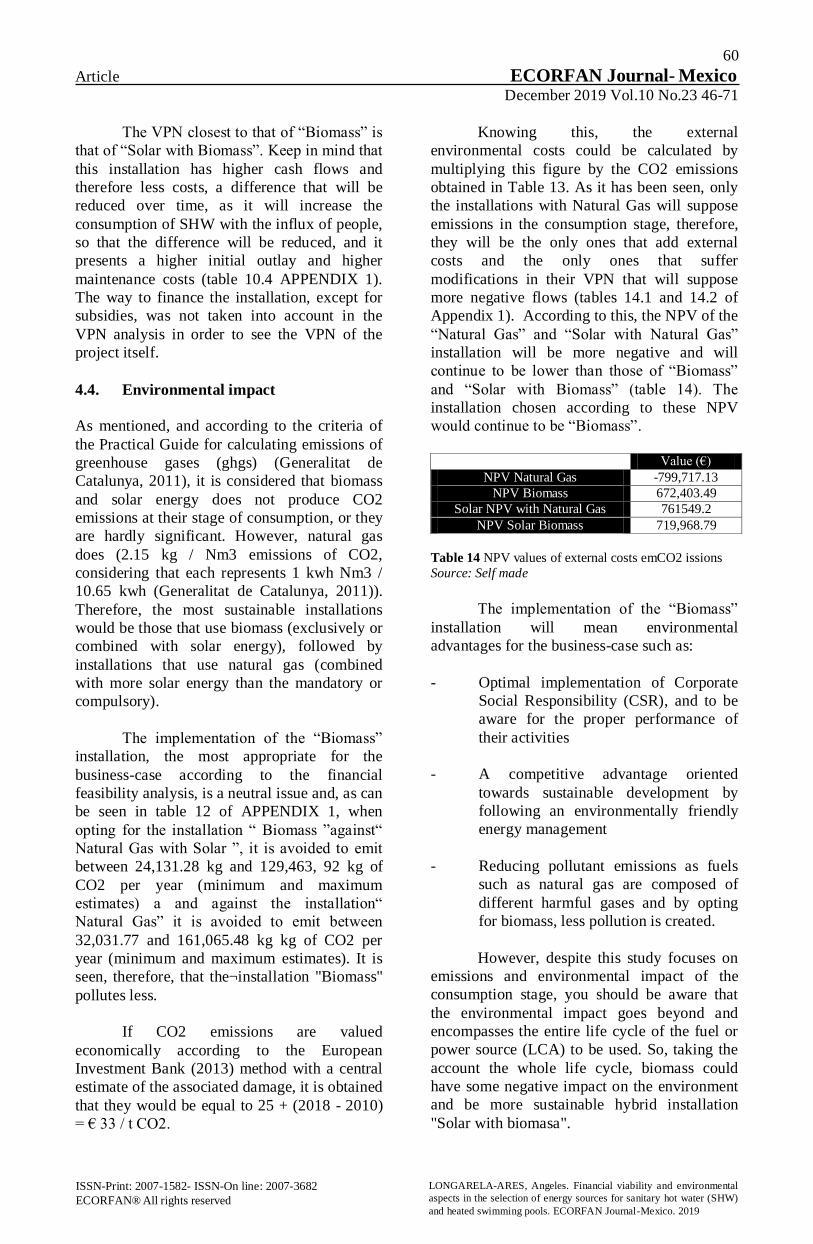
60
Article ECORFAN Journal- Mexico December 2019 Vol.10 No.23 46-71
ISSN-Print: 2007-1582- ISSN-On line: 2007-3682
ECORFAN® All rights reserved
LONGARELA-ARES, Angeles. Financial viability and environmental
aspects in the selection of energy sources for sanitary hot water (SHW)
and heated swimming pools. ECORFAN Journal-Mexico. 2019
The VPN closest to that of “Biomass” is
that of “Solar with Biomass”. Keep in mind that
this installation has higher cash flows and
therefore less costs, a difference that will be
reduced over time, as it will increase the
consumption of SHW with the influx of people,
so that the difference will be reduced, and it
presents a higher initial outlay and higher
maintenance costs (table 10.4 APPENDIX 1).
The way to finance the installation, except for
subsidies, was not taken into account in the
VPN analysis in order to see the VPN of the
project itself.
4.4. Environmental impact
As mentioned, and according to the criteria of
the Practical Guide for calculating emissions of
greenhouse gases (ghgs) (Generalitat de
Catalunya, 2011), it is considered that biomass
and solar energy does not produce CO2
emissions at their stage of consumption, or they
are hardly significant. However, natural gas
does (2.15 kg / Nm3 emissions of CO2,
considering that each represents 1 kwh Nm3 /
10.65 kwh (Generalitat de Catalunya, 2011)).
Therefore, the most sustainable installations
would be those that use biomass (exclusively or
combined with solar energy), followed by
installations that use natural gas (combined
with more solar energy than the mandatory or
compulsory).
The implementation of the “Biomass”
installation, the most appropriate for the
business-case according to the financial
feasibility analysis, is a neutral issue and, as can
be seen in table 12 of APPENDIX 1, when
opting for the installation “ Biomass ”against“
Natural Gas with Solar ”, it is avoided to emit
between 24,131.28 kg and 129,463, 92 kg of
CO2 per year (minimum and maximum
estimates) a and against the installation“
Natural Gas” it is avoided to emit between
32,031.77 and 161,065.48 kg kg of CO2 per
year (minimum and maximum estimates). It is
seen, therefore, that the¬installation "Biomass"
pollutes less.
If CO2 emissions are valued
economically according to the European
Investment Bank (2013) method with a central
estimate of the associated damage, it is obtained
that they would be equal to 25 + (2018 - 2010)
= € 33 / t CO2.
Knowing this, the external
environmental costs could be calculated by
multiplying this figure by the CO2 emissions
obtained in Table 13. As it has been seen, only
the installations with Natural Gas will suppose
emissions in the consumption stage, therefore,
they will be the only ones that add external
costs and the only ones that suffer
modifications in their VPN that will suppose
more negative flows (tables 14.1 and 14.2 of
Appendix 1). According to this, the NPV of the
“Natural Gas” and “Solar with Natural Gas”
installation will be more negative and will
continue to be lower than those of “Biomass”
and “Solar with Biomass” (table 14). The
installation chosen according to these NPV
would continue to be “Biomass”.
Value (€)
NPV Natural Gas -799,717.13
NPV Biomass 672,403.49
Solar NPV with Natural Gas 761549.2
NPV Solar Biomass 719,968.79
Table 14 NPV values of external costs emCO2 issions
Source: Self made
The implementation of the “Biomass”
installation will mean environmental
advantages for the business-case such as:
Optimal implementation of Corporate
Social Responsibility (CSR), and to be
aware for the proper performance of
their activities
A competitive advantage oriented
towards sustainable development by
following an environmentally friendly
energy management
Reducing pollutant emissions as fuels
such as natural gas are composed of
different harmful gases and by opting
for biomass, less pollution is created.
However, despite this study focuses on
emissions and environmental impact of the
consumption stage, you should be aware that
the environmental impact goes beyond and
encompasses the entire life cycle of the fuel or
power source (LCA) to be used. So, taking the
account the whole life cycle, biomass could
have some negative impact on the environment
and be more sustainable hybrid installation
"Solar with biomasa".
61
Article ECORFAN Journal- Mexico December 2019 Vol.10 No.23 46-71
ISSN-Print: 2007-1582- ISSN-On line: 2007-3682
ECORFAN® All rights reserved
LONGARELA-ARES, Angeles. Financial viability and environmental
aspects in the selection of energy sources for sanitary hot water (SHW)
and heated swimming pools. ECORFAN Journal-Mexico. 2019
Conclusions
Based on the above, and the present case, it
could be concluded that the "biomass"
installation is the most appropriate because:
It has the highest NPV of options
analyzed.
Although the costs of energy
consumption of hybrid installations
"Solar with Natural Gas" and "Solar
Biomass" are lower than those of
"biomass", the high investments
required by these installations are not
offset by their costs of energy
consumption or maintenance costs.
The study was based mainly on financial
issues and environmental impacts in the
consumption stage. Between "Biomass"
exclusively or "Solar Biomass", the first option
is the best financially, because, even if it has a
higher consumption, it would be compensated
with the reduced investment that it requires in
front of a hybrid installation. Therefore, the
“Biomass” installation would be the chosen
one, since it requires less initial outlay than the
other installations and, in addition, has reduced
maintenance costs.
For future studies would be interesting
to note if under different circumstances, such as
other characteristics of the subsidies, applying
another type of analysis, including risk factors
or uncertainties or considering alternative
installation of hot water and pool heating, the
option of "biomass" would remain the most
appropriate or optimal. Some methods to
include risk considerations in the analysis could
be to add a risk factor in the discount rate or to
quantify the uncertainty through sensitivity
analysis to present a range of possible outcomes
varying assumptions of risk (Galán, Gonzalez
Leal & Varela, 1999).
At the environmental level, the
consumption stage in which it has based the
study, "Biomass" would also be the option
chosen. However, it might be interesting to note
the benefits of the hybrid system, combining
two sources of renewable energy: solar and
biomass.
In principle, both have less harmful
emissions for the environment than the "Natural
Gas" and "Solar with Natural Gas" installations
but we see that "Biomass" has a greater need to
produce more kwh of energy, not covered by
solar contribution (table 12 Appendix 1).
In addition, although emissions at the
consumption stage are neutral, they are not in
the rest of the life cycle of the energy source
therefore it could also be interesting to apply
and study the usefulness of operational
improvements in managing demand hot water
needed to reduce consumption and analyze the
environmental impact not only taking into
account the emissions generated in the
consumption phase, but throughout the life
cycle because, in that case, the alternative
choice might be different. A more sustainable
option in this regard, which incorporates all
externalities and environmental impact, despite
assuming a higher investment cost, could be the
“Solar with Biomass” alternative because with
the solar contribution the saving in energy use
would reduce the impact environmental,
preserving non-renewable resources, avoiding
the generation of more energy, not requiring the
consumption of so many pellets and reducing
the carbon footprint.
In short, implementing installations in
which renewable energy and sustainability
prevail will help companies to differentiate
themselves, as actions that affect their corporate
social responsibility associated with the
conservation of the environment, taking into
account not only growth and economic savings
but also the social and environmental impact
(Martí, 2012). Betting on energy such as
biomass, solar or combined in hybrid systems,
can be positive since it contributes to greater
long-term economic savings and lower
emissions in the energy consumption stage, but
we must move forward to take into account not
only economic and environmental aspects
impact on the consumption stage, but in general
References
Albarracin, E .; Sanabria, J .; Maíllo, A. (2007).
Energy savings in indoor pools. Ciatesa.
Retrieved June 2018 from
http://www.marioloureiro.net/tecnica/eficiencia
Energ/19-B.EvaMAlbarracin-
CIATESA.pdf

62
Article ECORFAN Journal- Mexico December 2019 Vol.10 No.23 46-71
ISSN-Print: 2007-1582- ISSN-On line: 2007-3682
ECORFAN® All rights reserved
LONGARELA-ARES, Angeles. Financial viability and environmental
aspects in the selection of energy sources for sanitary hot water (SHW)
and heated swimming pools. ECORFAN Journal-Mexico. 2019
Artuso, P .; Santiangeli, A. (2008). Energy
solutions for sports facilities. International
Journal of Hydrogen Energy, 33 (12), 3182-
3187.https://doi.org/10.1016/j.ijhydene.2007.12
.064
ATECYR. Spanish Technical Association of
Air Conditioning and Refrigeration (2011).
technical guide central hot water. Madrid Spain.
ATECYR for the Institute for Diversification
and Saving of Energy (IDEA). Retrieved June
2018 from http: // www.idae.es / publications /
guide-tecnica-hot-water-plant-health
AuroPro3.0.1. Vaillant program.
Bernow, SS and Brown, DB, 1990, "Valuation
of Environmental Externalities for Energy
Planning and Operations" Tellus Institue,
Boston.
Britain, E. (2007). Technical and economic
study of the installation of a biomass plant
electricity generation. PFC. Universidad
Pontificia Comillas. Madrid Spain. Retrieved
June 2018 from https: // is.scribd.com /
document / 207150775 / plant-biomass-pdf
Cloquell, V .; Artacho, M .; Santamarina, C.
(2009). Improving energy efficiency of a sports
complex through the management of their
electricity consumption. XIII International
Congress of Project Engineering in Badajoz.
Polytechnic university of Valencia. Retrieved
June 2018 from http: // www.aeipro.com / files
/ congress / 2009badajoz /
ciip09_1100_1109.2552.pdf
Chakrabarty, S., & Islam, T. (2011). Financial
viability and eco-efficiency of the solar home
systems (SHS) in Bangladesh. Energy, 36 (8),
4821-4827.https://doi.org/10.1016/j.energy.2011.05.016
Condori Yucra, R. (2010). Study for pool
heating and domestic hot water (DHW) solar
energy UNAP. IV Latin American Conference
on Solar Energy and XVII Peruvian
Symposium of Solar Energy (XVII - SPES),
Cusco, Peru. Retrieved June 2018 from
https://is.slideshare.net/robvaler/exposure-iv-
claexviispes2010
Ministry of Economy and Technological
Innovation. Directorate General of Industry,
Energy and Mines (2005): Measures for energy
efficiency in energy-saving Guide gym
(Chapter 02). Madrid. Ministry of Economy
and Technological Innovation. Retrieved June
2018 from http: // www.madrid.org / bvirtual /
BVCM005515.pdf
Corral, D. (2011) Project for a solar thermal
energy in the sports Can Xarau of Cerdanyola
del Valles. PFC. Polytechnic University of
Catalonia. Barcelona. Retrieved June 2018 from
https: // UPCommons.upc.edu / handle / 2099.1
/ 11530? locale = en-attribute
Creara. Specialists in energy saving and
efficiency (2011) Energy Audit of municipal
offices. Municipal energy plan optimization.
City of Jerez de la Frontera. Retrieved June
2018 from http://www.jerez.es/fileadmin/contratacion/POEM% 20Jerez% 202011/4% 20Dependencias% 20municipales/Chair/Resumen_PRESIDENCIA.pdf
Dhavale, D., & Sarkis, J. (2015). Integrating
Carbon Market Uncertainties into a sustainable
manufacturing investment decision: a Bayesian
approach NPV. International Journal of
Production Research, 53 (23), 7104-7117. https://doi.org/10.1080/00207543.2015.1018450
Delacámara, G. (2008). Guide for Policy
Makers - Economic analysis of environmental
externalities. German Agency for Technical
Cooperation. UN.CEPAL. Project documents
200.Retrieved February 2019 from
https://repositorio.cepal.org/handle/11362/3624
Endesa (2018). Tarifa Gas Companies 3.4:
0.048796 € / kWh and fixed term of 80.97 € /
month until 04/15/2018. Retrieved from 2018
https://www.endesaclientes.com/companies/rate
-gas-empresas.html
Escobar, GJ (2009): Manual of energy
efficiency for SMEs. 04. Sport Centers. CNAE
93.1. Manual energy efficiency for SMEs
(pp.91-118). Gas Natural Fenosa and EOI
Business School. Retrieved June 2018 from
https: // docplayer.com / 5926169-Manual-de-
energyefficiency-to-SME-centers-sports-
CNAE- 93-1.html

63
Article ECORFAN Journal- Mexico December 2019 Vol.10 No.23 46-71
ISSN-Print: 2007-1582- ISSN-On line: 2007-3682
ECORFAN® All rights reserved
LONGARELA-ARES, Angeles. Financial viability and environmental
aspects in the selection of energy sources for sanitary hot water (SHW)
and heated swimming pools. ECORFAN Journal-Mexico. 2019
European Commission (1995). DGXII, Science,
Research and Development, JOULE (1995).
Externalities of Fuel Cycles 'ExternE' Project.
Report 2 Methodology.
European Commission (1999). ExternE
Externalities of Energy. Vol 7 - Methodology
Update. A Report produced for the EC - DG
XII, Office of Publications for the European
Communities, Luxembourg.
European Investment Bank (2013). The
Economic Appraisal of Investment Projects at
the EIB. Retrieved February 2019 from
https://www.eib.org/attachments/thematic/econ
omic_appraisal_of_investment_projects_en.pdf
Fraguas Herrero, A. (2010). Sport Commitment
to Sustainable Development. Green Cross
Spain. CONAMA10 National Environmental
Congress. Retrieved June 2018
fromhttp://www.conama10.conama.org/conama
10/download/files/CT%202010/41011.pdf
Municipal Sports Foundation (2011).
Maintenance Manual Sports. Retrieved June
2018 from
https://www.diba.cat/documents/41289/662996
0/Manual+mantenimiento+2011.pdf/45d49263-
3eef-4d1d-9611-629a16d8f173
Galan, A .; González, R .; Leal, J .; Varela, M.
(1999). Cost-benefit analysis of a Biomass
Power Plantin Morocco and Algeria in a
Photovoltaic Installation. 886. Technical Report
Ciemat Institute of Energy Studies. Retrieved
June 2018 from
https://inis.iaea.org/collection/NCLCollectionSt
ore/_Public/30/038/30038694.pdf
Generalitat de Catalunya (2011). PRACTICAL
GUIDE FOR THE CALCULATION OF
EMISSIONS OF GREENHOUSE GASES
(GHG). Retrieved February 2018 from
http://www.caib.es/sacmicrofront/archivopub.d
o?ctrl=MCRST234ZI97531&id=97531
Hohmeyer, O. (1988). Social Costs of Energy
Consumption. External Effects of Electricity
Generation in the Federal Republic of
Germany. Springer-Verlag Berlin Heidelberg.
https://doi.org/10.1007/978-3-642-83499-8
IDEA (2019). EMISSIONS. Retrieved
February 2019 from
https://www.idae.es/tecnologias/energias-
renovables/uso-termico/biomasa/emisiones
I (Institute for Diversification and Saving of
Energy) (2018). Report liberalized energy
prices in the 4th quarter 2017. Retrieved June
2018 from
http://www.idae.es/sites/default/files/estudios_i
nformes_y_estadisticas/informe_precios_bioma
sa_usos_termicos_4t_2017_3.pdf
Infrastructure Sustainability Council of
Australia (ISCA) (2016). Developing a
Business Case for Sustainability Initiatives in
Infrastructure: A 'How To' Guide Page.
Retrieved June 2018 from
http://www.isca.org.au/getmedia/effcfa61-053a-
462e-8918-
1f5af3fbef53/BusinessCaseHowTo_231610_FI
NALFORPUBLISHING.aspx
Karmokolias, Y. (1996). Cost benefit analysis
of private sector, environmental investments: a
case study of the Kunda cement factory
(Inglés). IFC discussion paper no. IFD 30, IFC
working paper series. Washington, DC: The
World Bank. Retrieved June 2018 from
http://documents.worldbank.org/curated/en/548
121468770728632/Cost-benefit-analysis-of-
private-sector-environmental-investments-a-
case-study-of-the-Kunda-cement-factory
Linares Llamas, P. (2002). Externalities of
energy and valuation. Energy, taxation and the
environment in Spain. Alberto Gago Rodríguez
(ed.), Xavier Labandeira Villot (dir.). ISBN 84-
8008-111-2, pp. 63-84.Retrieved February 2019
from
https://www.iit.comillas.edu/pedrol/documents/
gago02.pdf
Nikolaidis, P., Chatzis, S., & Poullikkas, A.
(2018). Renewable energy integration through
optimal unit commitment and electricity storage
in weak power networks. International Journal
of Sustainable Energy 1-17. https://doi.org/10.1080/14786451.2018.1516669

64
Article ECORFAN Journal- Mexico December 2019 Vol.10 No.23 46-71
ISSN-Print: 2007-1582- ISSN-On line: 2007-3682
ECORFAN® All rights reserved
LONGARELA-ARES, Angeles. Financial viability and environmental
aspects in the selection of energy sources for sanitary hot water (SHW)
and heated swimming pools. ECORFAN Journal-Mexico. 2019
Noguera, J. (2011): Air-conditioning an indoor
pool by combining solar thermal energy,
geothermal energy and biomass boiler support.
Màster Interuniversitari UB-UPC d'Enginyeria
into energy. Polytechnic University of
Catalonia. Barcelona, Spain. Retrieved June
2018 from https: // UPCommons.upc.edu /
bitstream / handle / 2099.1 / 12795 /
Memoria.pdf? sequence = 1 & isAllow
ed = y
Martí, DC (2012). Financial and environmental
evaluation of using electric vehicles in
companies for the distribution process. Grade
work of St. Bonaventure University in
Bogota.Retrieved June 2018 from
https://docplayer.es/2549718-Evaluacion-
financiera-y-ambiental.html
Martinez Sanchez, D (2011). Comparative
study on energy efficiency in residential
building with a system of micro thermal energy
and electricity compared to conventional
systems. Thesis. d'edificació Polytechnic
School of Barcelona. EPSEB. CPU. Barcelona,
Spain. Retrieved June 2018 from https: //
UPCommons.upc.edu / handle / 2099.1 / 10909
Moreno, F. (2012). Technical and economic
study for replacement of diesel thermal biomass
in urban buildings. Thesis. Higher Technical
School of Mining and Energy of the University
of Madrid. Madrid Spain. Retrieved June 2018
from http://oa.upm.es/14999/
Technical Regulations Document HE4 the
Captcha code (CTE). Energy saving. Recovered
from
https://www.codigotecnico.org/images/stories/p
df/ahorroEnergia/DccHE.pdf Retrieved June
2018 welfare and hygiene Demanding IT 1.1 of
Royal Decree 1027/2007 of 20 July.
Ottinger, RL, Wooley, DR, Robinson, NA,
Hodas, DR and Babb, SE (1991).
Environmental Costs of Electricity. Pace
University, Center for Environmental Legal
Studies, Oceana Publications, New York.
Pearce, D .; Bann, C .; Georgiou, S. (1992). The
social cost of fuel cycles. Center for Social and
Economic Research on the Global
Environment, London (United Kingdom).
ISBN: 0 11 414288 2.
Regulation of Thermal Installations in
Buildings (RITE). NIDE 3: Pools. Royal
Decree 314/2006 of 17 March, Technical
Building Code (CTE). UNE 94002: 2005 Solar
heating systems for hot water. AENOR.
Turner, RK, Georgiou, S., Brouwer, A.
Bateman, and Langford IJ, IJ (2003) "Towards
an integrated environmental assessment for
wetland and catchment management", The
Geographical Journal 169 (2): 99-116.
https://doi.org/10.1111/1475-4959.04953
Appendix 1
Swimming
courses
Sessions /
week
Users /
session
User /
month
Type 1 29 5 580
type 2 18 10 720
type 3 12 240 960
type 4 40 8 1280
Total 107 3,540
40% Year 2 1,416
Racket courses Grades 1 h
/week
Users /
course
User /
month
Tennis 8 two 64
paddle 12 4 192
Total twenty 6 256
40% Year 2 102
Arts courses Sessions /
week
users users
martial /session /month
Total twenty-one twenty 1680
40% Year 2 672
User / month
Tracks 158
User / month
Free admission 10
User / month
Swimming pool 1,200
User / month
fitness 5,300
Guided activities Weekly
sessions
users users /
1 h /session Month
room 1 16 17 1,088
room 2 37 17 2,516
room 3 40 17 2,720
room 4 40 17 2,720
Total 9,044
40% Year 2 3617.6
Total Monthly
Uses
12,476
Table 2.1 Monthly Inflow in Year 2 with 40%
coverage of the maximum number of people and
100% of the inflow to the center.
Source: Self made
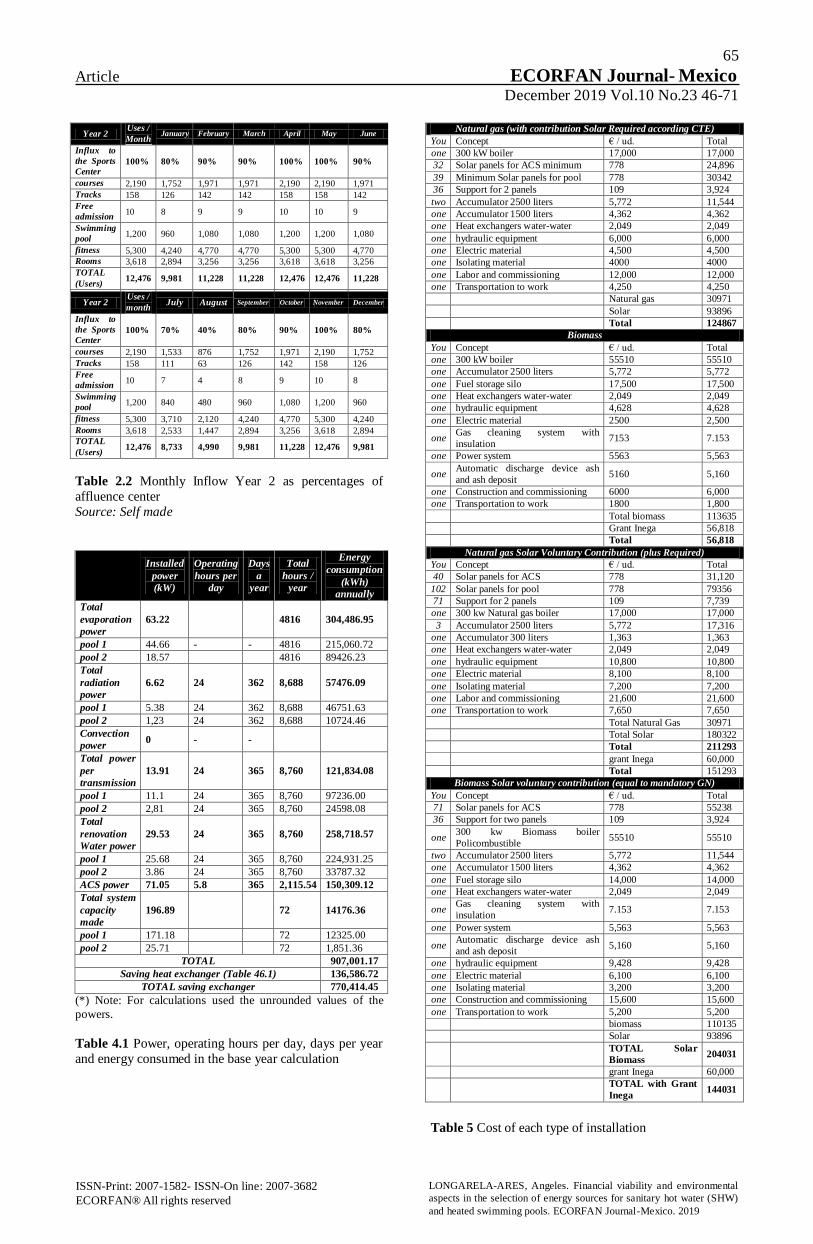
65
Article ECORFAN Journal- Mexico December 2019 Vol.10 No.23 46-71
ISSN-Print: 2007-1582- ISSN-On line: 2007-3682
ECORFAN® All rights reserved
LONGARELA-ARES, Angeles. Financial viability and environmental
aspects in the selection of energy sources for sanitary hot water (SHW)
and heated swimming pools. ECORFAN Journal-Mexico. 2019
Year 2 Uses /
Month January February March April May June
Influx to
the Sports
Center 100% 80% 90% 90% 100% 100% 90%
courses 2,190 1,752 1,971 1,971 2,190 2,190 1,971
Tracks 158 126 142 142 158 158 142
Free
admission 10 8 9 9 10 10 9
Swimming
pool 1,200 960 1,080 1,080 1,200 1,200 1,080
fitness 5,300 4,240 4,770 4,770 5,300 5,300 4,770
Rooms 3,618 2,894 3,256 3,256 3,618 3,618 3,256
TOTAL
(Users) 12,476 9,981 11,228 11,228 12,476 12,476 11,228
Year 2
Uses /
month July August September October November December
Influx to
the Sports
Center 100% 70% 40% 80% 90% 100% 80%
courses 2,190 1,533 876 1,752 1,971 2,190 1,752
Tracks 158 111 63 126 142 158 126
Free
admission 10 7 4 8 9 10 8
Swimming
pool 1,200 840 480 960 1,080 1,200 960
fitness 5,300 3,710 2,120 4,240 4,770 5,300 4,240
Rooms 3,618 2,533 1,447 2,894 3,256 3,618 2,894
TOTAL
(Users) 12,476 8,733 4,990 9,981 11,228 12,476 9,981
Table 2.2 Monthly Inflow Year 2 as percentages of
affluence center
Source: Self made
Installed
power
(kW)
Operating
hours per
day
Days
a
year
Total
hours /
year
Energy
consumption
(kWh)
annually
Total
evaporation
power
63.22
4816 304,486.95
pool 1 44.66 - - 4816 215,060.72
pool 2 18.57
4816 89426.23
Total
radiation
power
6.62 24 362 8,688 57476.09
pool 1 5.38 24 362 8,688 46751.63
pool 2 1,23 24 362 8,688 10724.46
Convection
power 0 - -
Total power
per
transmission
13.91 24 365 8,760 121,834.08
pool 1 11.1 24 365 8,760 97236.00
pool 2 2,81 24 365 8,760 24598.08
Total
renovation
Water power
29.53 24 365 8,760 258,718.57
pool 1 25.68 24 365 8,760 224,931.25
pool 2 3.86 24 365 8,760 33787.32
ACS power 71.05 5.8 365 2,115.54 150,309.12
Total system
capacity
made
196.89
72 14176.36
pool 1 171.18
72 12325.00
pool 2 25.71
72 1,851.36
TOTAL 907,001.17
Saving heat exchanger (Table 46.1) 136,586.72
TOTAL saving exchanger 770,414.45
(*) Note: For calculations used the unrounded values of the
powers.
Table 4.1 Power, operating hours per day, days per year
and energy consumed in the base year calculation
Natural gas (with contribution Solar Required according CTE)
You Concept € / ud. Total
one 300 kW boiler 17,000 17,000
32 Solar panels for ACS minimum 778 24,896
39 Minimum Solar panels for pool 778 30342
36 Support for 2 panels 109 3,924
two Accumulator 2500 liters 5,772 11,544
one Accumulator 1500 liters 4,362 4,362
one Heat exchangers water-water 2,049 2,049
one hydraulic equipment 6,000 6,000
one Electric material 4,500 4,500
one Isolating material 4000 4000
one Labor and commissioning 12,000 12,000
one Transportation to work 4,250 4,250
Natural gas 30971
Solar 93896
Total 124867
Biomass
You Concept € / ud. Total
one 300 kW boiler 55510 55510
one Accumulator 2500 liters 5,772 5,772
one Fuel storage silo 17,500 17,500
one Heat exchangers water-water 2,049 2,049
one hydraulic equipment 4,628 4,628
one Electric material 2500 2,500
one Gas cleaning system with
insulation 7153 7.153
one Power system 5563 5,563
one Automatic discharge device ash
and ash deposit 5160 5,160
one Construction and commissioning 6000 6,000
one Transportation to work 1800 1,800
Total biomass 113635
Grant Inega 56,818
Total 56,818
Natural gas Solar Voluntary Contribution (plus Required)
You Concept € / ud. Total
40 Solar panels for ACS 778 31,120
102 Solar panels for pool 778 79356
71 Support for 2 panels 109 7,739
one 300 kw Natural gas boiler 17,000 17,000
3 Accumulator 2500 liters 5,772 17,316
one Accumulator 300 liters 1,363 1,363
one Heat exchangers water-water 2,049 2,049
one hydraulic equipment 10,800 10,800
one Electric material 8,100 8,100
one Isolating material 7,200 7,200
one Labor and commissioning 21,600 21,600
one Transportation to work 7,650 7,650
Total Natural Gas 30971
Total Solar 180322
Total 211293
grant Inega 60,000
Total 151293
Biomass Solar voluntary contribution (equal to mandatory GN)
You Concept € / ud. Total
71 Solar panels for ACS 778 55238
36 Support for two panels 109 3,924
one 300 kw Biomass boiler
Policombustible 55510 55510
two Accumulator 2500 liters 5,772 11,544
one Accumulator 1500 liters 4,362 4,362
one Fuel storage silo 14,000 14,000
one Heat exchangers water-water 2,049 2,049
one Gas cleaning system with
insulation 7.153 7.153
one Power system 5,563 5,563
one Automatic discharge device ash
and ash deposit 5,160 5,160
one hydraulic equipment 9,428 9,428
one Electric material 6,100 6,100
one Isolating material 3,200 3,200
one Construction and commissioning 15,600 15,600
one Transportation to work 5,200 5,200
biomass 110135
Solar 93896
TOTAL Solar
Biomass 204031
grant Inega 60,000
TOTAL with Grant
Inega 144031
Table 5 Cost of each type of installation
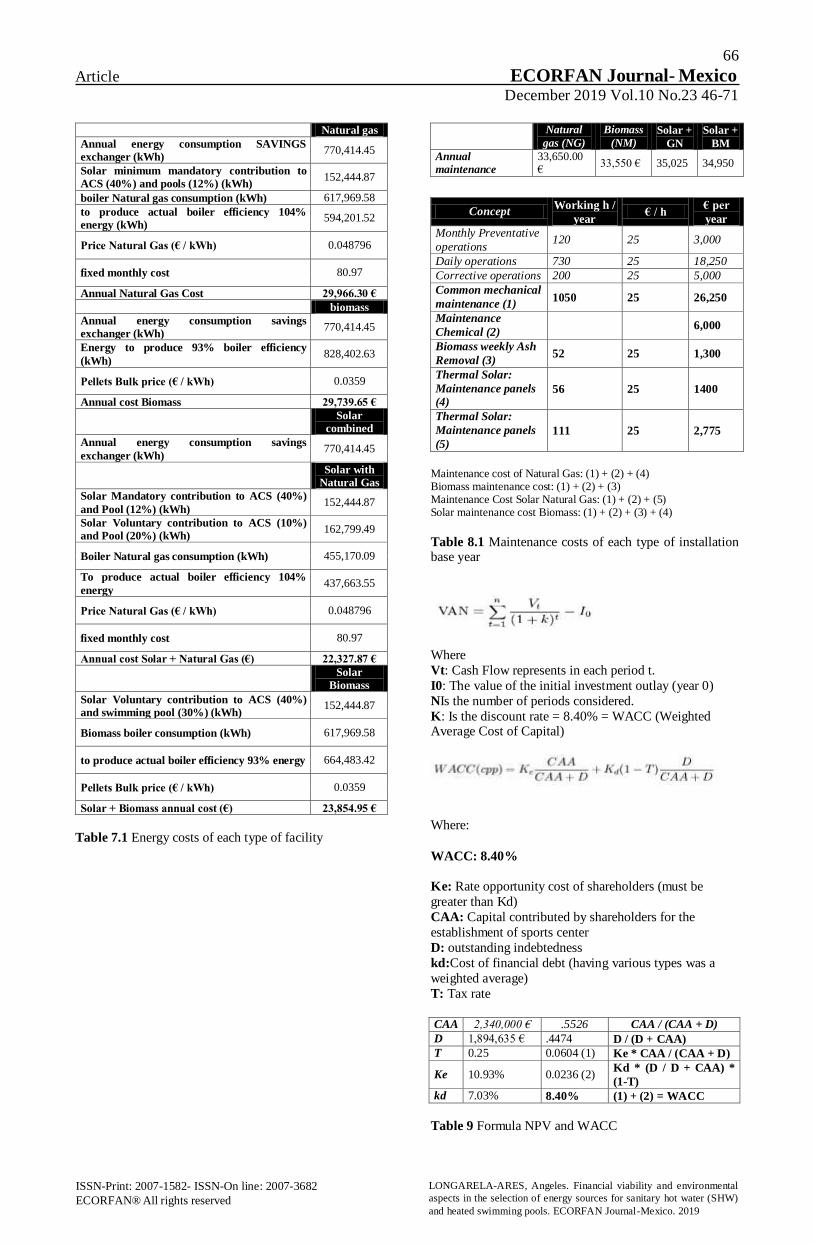
66
Article ECORFAN Journal- Mexico December 2019 Vol.10 No.23 46-71
ISSN-Print: 2007-1582- ISSN-On line: 2007-3682
ECORFAN® All rights reserved
LONGARELA-ARES, Angeles. Financial viability and environmental
aspects in the selection of energy sources for sanitary hot water (SHW)
and heated swimming pools. ECORFAN Journal-Mexico. 2019
Natural gas
Annual energy consumption SAVINGS
exchanger (kWh) 770,414.45
Solar minimum mandatory contribution to
ACS (40%) and pools (12%) (kWh) 152,444.87
boiler Natural gas consumption (kWh) 617,969.58
to produce actual boiler efficiency 104%
energy (kWh) 594,201.52
Price Natural Gas (€ / kWh) 0.048796
fixed monthly cost 80.97
Annual Natural Gas Cost 29,966.30 €
biomass
Annual energy consumption savings
exchanger (kWh) 770,414.45
Energy to produce 93% boiler efficiency
(kWh) 828,402.63
Pellets Bulk price (€ / kWh) 0.0359
Annual cost Biomass 29,739.65 €
Solar
combined
Annual energy consumption savings
exchanger (kWh) 770,414.45
Solar with
Natural Gas
Solar Mandatory contribution to ACS (40%)
and Pool (12%) (kWh) 152,444.87
Solar Voluntary contribution to ACS (10%)
and Pool (20%) (kWh) 162,799.49
Boiler Natural gas consumption (kWh) 455,170.09
To produce actual boiler efficiency 104%
energy 437,663.55
Price Natural Gas (€ / kWh) 0.048796
fixed monthly cost 80.97
Annual cost Solar + Natural Gas (€) 22,327.87 €
Solar
Biomass
Solar Voluntary contribution to ACS (40%)
and swimming pool (30%) (kWh) 152,444.87
Biomass boiler consumption (kWh) 617,969.58
to produce actual boiler efficiency 93% energy 664,483.42
Pellets Bulk price (€ / kWh) 0.0359
Solar + Biomass annual cost (€) 23,854.95 €
Table 7.1 Energy costs of each type of facility
Natural
gas (NG)
Biomass
(NM)
Solar +
GN
Solar +
BM
Annual
maintenance
33,650.00 €
33,550 € 35,025 34,950
Concept Working h /
year € / h
€ per
year
Monthly Preventative
operations 120 25 3,000
Daily operations 730 25 18,250
Corrective operations 200 25 5,000
Common mechanical
maintenance (1) 1050 25 26,250
Maintenance
Chemical (2) 6,000
Biomass weekly Ash
Removal (3) 52 25 1,300
Thermal Solar:
Maintenance panels
(4) 56 25 1400
Thermal Solar:
Maintenance panels
(5)
111 25 2,775
Maintenance cost of Natural Gas: (1) + (2) + (4) Biomass maintenance cost: (1) + (2) + (3) Maintenance Cost Solar Natural Gas: (1) + (2) + (5) Solar maintenance cost Biomass: (1) + (2) + (3) + (4)
Table 8.1 Maintenance costs of each type of installation base year
Where
Vt: Cash Flow represents in each period t.
I0: The value of the initial investment outlay (year 0)
NIs the number of periods considered.
K: Is the discount rate = 8.40% = WACC (Weighted Average Cost of Capital)
Where:
WACC: 8.40%
Ke: Rate opportunity cost of shareholders (must be
greater than Kd)
CAA: Capital contributed by shareholders for the
establishment of sports center
D: outstanding indebtedness
kd:Cost of financial debt (having various types was a
weighted average)
T: Tax rate
CAA 2,340,000 € .5526 CAA / (CAA + D)
D 1,894,635 € .4474 D / (D + CAA)
T 0.25 0.0604 (1) Ke * CAA / (CAA + D)
Ke 10.93% 0.0236 (2) Kd * (D / D + CAA) *
(1-T)
kd 7.03% 8.40% (1) + (2) = WACC
Table 9 Formula NPV and WACC
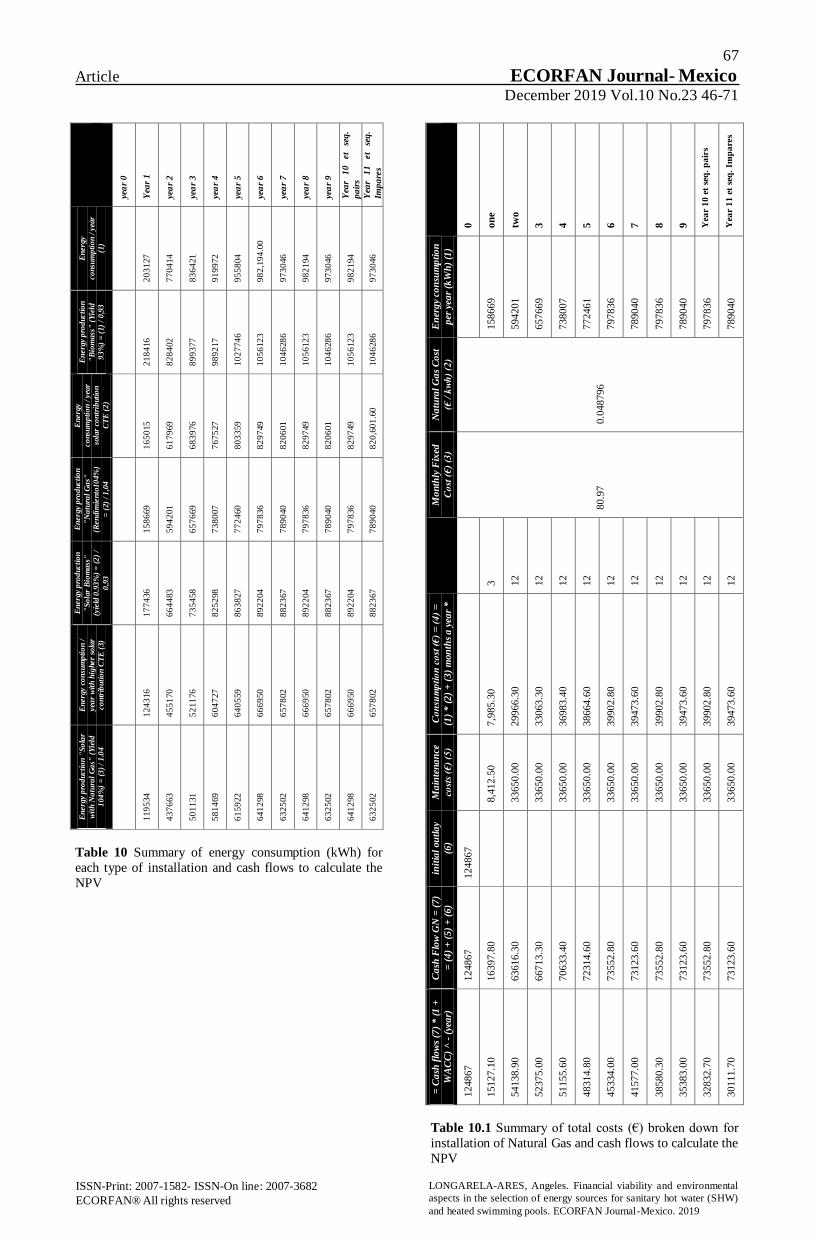
67
Article ECORFAN Journal- Mexico December 2019 Vol.10 No.23 46-71
ISSN-Print: 2007-1582- ISSN-On line: 2007-3682
ECORFAN® All rights reserved
LONGARELA-ARES, Angeles. Financial viability and environmental
aspects in the selection of energy sources for sanitary hot water (SHW)
and heated swimming pools. ECORFAN Journal-Mexico. 2019
yea
r 0
Yea
r 1
yea
r 2
yea
r 3
yea
r 4
yea
r 5
yea
r 6
yea
r 7
yea
r 8
yea
r 9
Yea
r 1
0
et
seq
.
pa
irs
Yea
r 1
1
et
seq
.
Imp
are
s
En
erg
y
co
nsu
mp
tio
n /
yea
r
(1)
20
31
27
77
04
14
83
64
21
91
99
72
95
58
04
98
2,1
94
.00
97
30
46
98
21
94
97
30
46
98
21
94
97
30
46
En
erg
y p
rod
ucti
on
"B
iom
ass
" (
Yie
ld
93
%)
= (
1)
/ 0
,93
21
84
16
82
84
02
89
93
77
98
92
17
10
27
74
6
10
56
12
3
10
46
28
6
10
56
12
3
10
46
28
6
10
56
12
3
10
46
28
6
En
erg
y
co
nsu
mp
tio
n /
yea
r
sola
r co
ntr
ibuti
on
CT
E (
2)
16
50
15
61
79
69
68
39
76
76
75
27
80
33
59
82
97
49
82
06
01
82
97
49
82
06
01
82
97
49
82
0,6
01
.60
En
erg
y p
rod
ucti
on
"N
atu
ral
Ga
s"
(Ren
dim
ien
to10
4%
)
= (
2)
/ 1
,04
15
86
69
59
42
01
65
76
69
73
80
07
77
24
60
79
78
36
78
90
40
79
78
36
78
90
40
79
78
36
78
90
40
En
erg
y p
rod
ucti
on
"S
ola
r B
iom
ass
"
(yie
ld 0
.93
%)
= (
2)
/
0,9
3
17
74
36
66
44
83
73
54
58
82
52
98
86
38
27
89
22
04
88
23
67
89
22
04
88
23
67
89
22
04
88
23
67
En
erg
y c
on
sum
pti
on
/
yea
r w
ith
hig
her
sola
r
co
ntr
ibu
tio
n C
TE
(3)
12
43
16
45
51
70
52
11
76
60
47
27
64
05
59
66
69
50
65
78
02
66
69
50
65
78
02
66
69
50
65
78
02
En
erg
y p
rod
ucti
on
"S
ola
r
wit
h N
atu
ral
Ga
s" (
Yie
ld
104
%)
= (
3)
/ 1
.04
11
95
34
43
76
63
50
11
31
58
14
69
61
59
22
64
12
98
63
25
02
64
12
98
63
25
02
64
12
98
63
25
02
Table 10 Summary of energy consumption (kWh) for
each type of installation and cash flows to calculate the
NPV
0
on
e
two
3
4
5
6
7
8
9
Yea
r 1
0 e
t se
q.
pa
irs
Yea
r 1
1 e
t se
q.
Imp
are
s
En
erg
y co
nsu
mp
tio
n
per
yea
r (k
Wh
) (1
)
15
86
69
59
42
01
65
76
69
73
80
07
77
24
61
79
78
36
78
90
40
79
78
36
78
90
40
79
78
36
78
90
40
Na
tura
l G
as
Co
st
(€ /
kw
h)
(2)
0.0
48
79
6
Mo
nth
ly F
ixed
Co
st (
€)
(3)
80
.97
3
12
12
12
12
12
12
12
12
12
12
Co
nsu
mp
tio
n c
ost
(€
) =
(4
) =
(1)
* (
2)
+ (
3)
mon
ths
a y
ear
*
7,9
85.3
0
29966.3
0
33063.3
0
36983.4
0
38664.6
0
39902.8
0
39473.6
0
39902.8
0
39473.6
0
39902.8
0
39473.6
0
Ma
inte
na
nce
cost
s (€
) (5
)
8,4
12.5
0
33650.0
0
33650.0
0
33650.0
0
33650.0
0
33650.0
0
33650.0
0
33650.0
0
33650.0
0
33650.0
0
33650.0
0
init
ial
ou
tla
y
(6)
124867
Ca
sh F
low
GN
= (
7)
= (
4)
+ (
5)
+ (
6)
12
48
67
16
39
7.8
0
63
61
6.3
0
66
71
3.3
0
70
63
3.4
0
72
31
4.6
0
73
55
2.8
0
73
12
3.6
0
73
55
2.8
0
73
12
3.6
0
73
55
2.8
0
73
12
3.6
0
= C
ash
flo
ws
(7)
* (
1 +
WA
CC
) ^
- (
yea
r)
124867
15127.1
0
54138.9
0
52375.0
0
51155.6
0
48314.8
0
45334.0
0
41577.0
0
38580.3
0
35383.0
0
32832.7
0
30111.7
0
Table 10.1 Summary of total costs (€) broken down for
installation of Natural Gas and cash flows to calculate the
NPV

68
Article ECORFAN Journal- Mexico December 2019 Vol.10 No.23 46-71
ISSN-Print: 2007-1582- ISSN-On line: 2007-3682
ECORFAN® All rights reserved
LONGARELA-ARES, Angeles. Financial viability and environmental
aspects in the selection of energy sources for sanitary hot water (SHW)
and heated swimming pools. ECORFAN Journal-Mexico. 2019
0
on
e
two
3
4
5
6
7
8
9
Yea
r 1
0 e
t se
q.
pa
irs
Yea
r 1
1 e
t se
q.
Imp
ares
En
erg
y co
nsu
mp
tio
n p
er
yea
r (k
Wh
) (1
)
0
21
84
16
82
84
02
89
93
77
98
92
17
10
27
74
6
10
56
12
3
10
46
28
6
10
56
12
3
10
46
28
6
10
56
12
3
10
46
28
6
pel
lets
co
st (
€ /
kw
h)
(2)
0.0
359
0.0
359
0.0
359
0.0
359
0.0
359
0.0
359
0.0
359
0.0
359
0.0
359
0.0
359
0.0
359
Co
nsu
mp
tio
n c
ost
(€)
= (
3)
= (
1)
* (
2)
7,8
41
.10
29
73
9.7
0
32
28
7.7
0
35
51
2.9
0
36
89
6.1
0
37
91
4.8
0
37
56
1.7
0
37
91
4.8
0
37
56
1.7
0
37
91
4.8
0
37
56
1.7
0
Ma
inte
na
nce
cost
s (€
) (4
)
8,3
87
.50
33
55
0.0
0
33
55
0.0
0
33
55
0.0
0
33
55
0.0
0
33
55
0.0
0
33
55
0.0
0
33
55
0.0
0
33
55
0.0
0
33
55
0.0
0
33
,550
init
ial
ou
tla
y
(5)
56
,818
Ca
sh F
low
BM
= (
6)
= (
3)
+ (
4)
+ (
5)
56
81
8
16
22
8.6
0
63
28
9.7
0
65
83
7.7
0
69
06
2.9
0
70
44
6.1
0
71
46
4.8
0
71
11
1.7
0
71
46
4.8
0
71
11
1.7
0
71
46
5
71
11
1.7
0
= C
ash
flo
ws
(6)
* (
1 +
WA
CC
) ^
- (
yea
r)
56
81
8
14
97
1.1
0
53
86
1
51
68
7
50
01
8.2
0
47
06
6.3
0
44
04
7.0
0
40
43
3.0
0
37
48
5.0
0
34
40
9.4
0
31
90
0.6
0
29
28
3
Table 10.2 Summary of total costs (€) for installation of
biomass breakdown and cash flows to calculate the NPV
0
on
e
two
3
4
5
6
7
8
9
Yea
r 1
0 e
t se
q.
pa
irs
Yea
r 1
1 e
t se
q.
Imp
are
s
En
erg
y co
nsu
mp
tio
n
per
yea
r (k
Wh
) (1
)
0
11
95
34
.5
43
76
63
.6
50
11
31
.5
58
14
68
.9
61
59
22
.8
64
12
98
.1
63
25
02
.0
64
12
98
.1
63
25
02
.0
64
12
98
.1
63
25
02
.0
Na
tura
l G
as
Co
st (
€
/ k
wh
) (2
)
0.0
487
96
Mo
nth
ly F
ixed
Co
st (
€)
(3)
80
.97
80
.97
80
.97
80
.97
80
.97
80
.97
80
.97
80
.97
80
.97
80
.97
80
.97
Mo
nth
s a
yea
r
3
12
12
12
12
12
12
12
12
12
12
Co
nsu
mp
tio
n c
ost
(€
) =
(4
) =
(1
)
* (
2)
+ (
3)
mo
nth
s a
yea
r *
6,0
75
.70
22
32
7.9
0
25
42
4.9
0
29
34
5.0
0
31
02
6.2
0
32
26
4.4
0
31
83
5.2
0
32
26
4.4
0
31
83
5.2
0
32
,264
31
83
5.2
0
Ma
inte
na
nce
cost
s (€
) (5
)
0
8,7
56
35
,025
35
,025
35
,025
35
,025
35
,025
35
,025
35
,025
35
,025
35
,025
35
,025
init
ial
ou
tla
y
(6)
15
12
93
Ca
sh F
low
S +
GN
=
(7)
= (
4)
+ (
5)
+ (
6)
15
12
93
14
83
2.0
0
57
35
2.9
0
60
44
9.9
0
64
37
0
66
05
1.2
0
67
28
9
66
86
0
67
28
9.4
0
66
86
0.2
0
67
28
9
66
86
0.2
0
= C
ash
flo
ws
(7)
* (
1 +
WA
CC
) ^
- (
yea
r)
15
12
93
13
68
2.6
0
48
80
8.6
0
47
45
7.8
0
46
61
9
44
13
0
41
47
3
38
01
5
35
29
4.9
0
32
35
2.2
0
30
03
6
27
53
2.5
0
Table 10.3 Summary of total costs (€) disaggregated
Solar Installation with Natural Gas and cash flows to
calculate the NPV
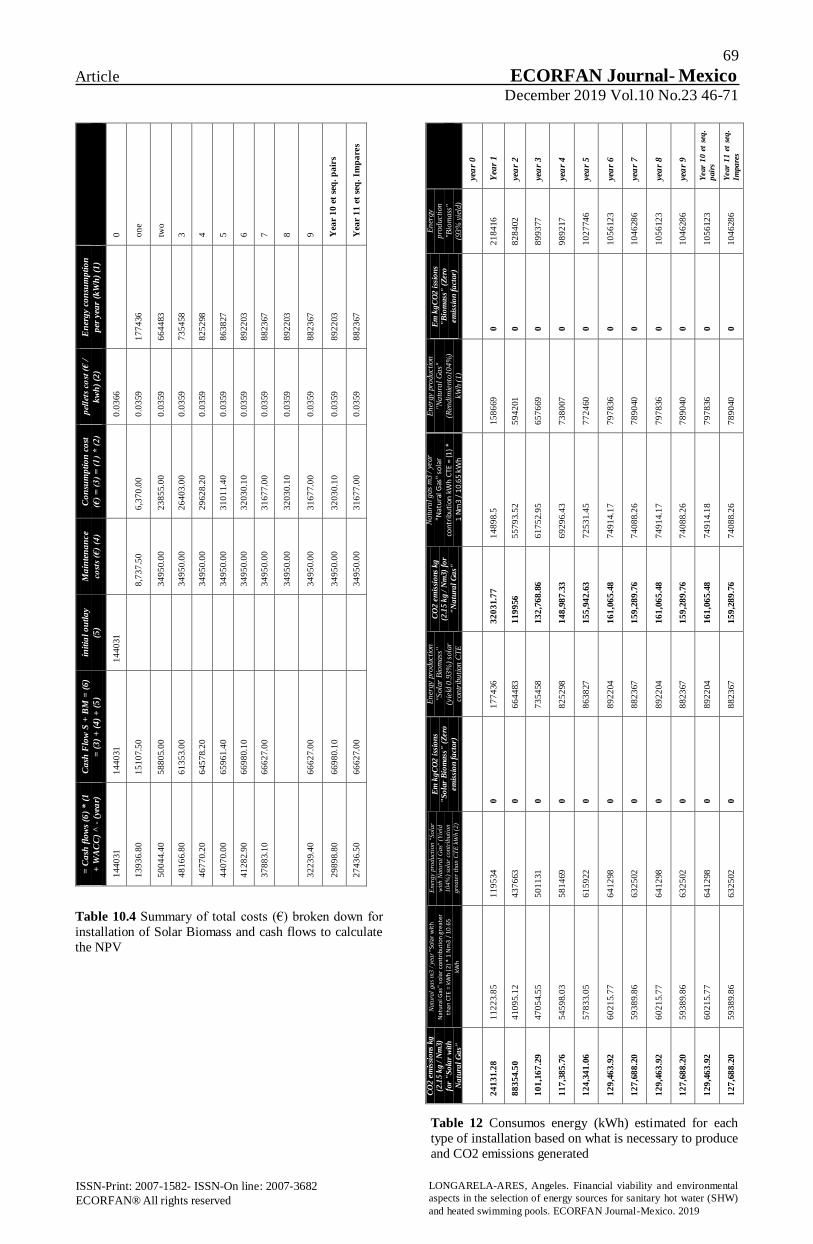
69
Article ECORFAN Journal- Mexico December 2019 Vol.10 No.23 46-71
ISSN-Print: 2007-1582- ISSN-On line: 2007-3682
ECORFAN® All rights reserved
LONGARELA-ARES, Angeles. Financial viability and environmental
aspects in the selection of energy sources for sanitary hot water (SHW)
and heated swimming pools. ECORFAN Journal-Mexico. 2019
0
on
e
two
3
4
5
6
7
8
9
Yea
r 1
0 e
t se
q.
pa
irs
Yea
r 1
1 e
t se
q.
Imp
are
s
En
erg
y co
nsu
mp
tio
n
per
yea
r (k
Wh
) (1
)
17
74
36
66
44
83
73
54
58
82
52
98
86
38
27
89
22
03
88
23
67
89
22
03
88
23
67
89
22
03
88
23
67
pel
lets
co
st (
€ /
kw
h)
(2)
0.0
366
0.0
359
0.0
359
0.0
359
0.0
359
0.0
359
0.0
359
0.0
359
0.0
359
0.0
359
0.0
359
0.0
359
Co
nsu
mp
tio
n c
ost
(€)
= (
3)
= (
1)
* (
2)
6,3
70
.00
23
85
5.0
0
26
40
3.0
0
29
62
8.2
0
31
01
1.4
0
32
03
0.1
0
31
67
7.0
0
32
03
0.1
0
31
67
7.0
0
32
03
0.1
0
31
67
7.0
0
Ma
inte
na
nce
cost
s (€
) (4
)
8,7
37
.50
34
95
0.0
0
34
95
0.0
0
34
95
0.0
0
34
95
0.0
0
34
95
0.0
0
34
95
0.0
0
34
95
0.0
0
34
95
0.0
0
34
95
0.0
0
34
95
0.0
0
init
ial
ou
tla
y
(5)
14
40
31
Ca
sh F
low
S +
BM
= (
6)
= (
3)
+ (
4)
+ (
5)
14
40
31
15
10
7.5
0
58
80
5.0
0
61
35
3.0
0
64
57
8.2
0
65
96
1.4
0
66
98
0.1
0
66
62
7.0
0
66
62
7.0
0
66
98
0.1
0
66
62
7.0
0
= C
ash
flo
ws
(6)
* (
1
+ W
AC
C)
^ -
(ye
ar)
14
40
31
13
93
6.8
0
50
04
4.4
0
48
16
6.8
0
46
77
0.2
0
44
07
0.0
0
41
28
2.9
0
37
88
3.1
0
32
23
9.4
0
29
89
8.8
0
27
43
6.5
0
Table 10.4 Summary of total costs (€) broken down for
installation of Solar Biomass and cash flows to calculate
the NPV
yea
r 0
Yea
r 1
yea
r 2
yea
r 3
yea
r 4
yea
r 5
yea
r 6
yea
r 7
yea
r 8
yea
r 9
Year
10 e
t se
q.
pair
s
Year
11 e
t se
q.
Impa
res
En
ergy
pro
ducti
on
"Bio
mass
"
(93
% y
ield
)
21
84
16
82
84
02
89
93
77
98
92
17
10
27
74
6
10
56
12
3
10
46
28
6
10
56
12
3
10
46
28
6
10
56
12
3
10
46
28
6
Em
kg
CO
2 i
ssio
ns
"B
iom
ass
" (
Zero
em
issi
on
fa
ctor)
0
0
0
0
0
0
0
0
0
0
0
En
ergy p
roducti
on
"N
atu
ral
Ga
s"
(Ren
dim
iento
10
4%
)
kW
h (
1)
15
86
69
59
42
01
65
76
69
73
80
07
77
24
60
79
78
36
78
90
40
79
78
36
78
90
40
79
78
36
78
90
40
Na
tura
l g
as
m3
/ y
ear
"Nat
ura
l Gas
" so
lar
con
trib
uti
on k
Wh
CTE
= (1
) *
1 N
m3
/ 1
0.6
5 kW
h
14
89
8.5
55
79
3.5
2
61
75
2.9
5
69
29
6.4
3
72
53
1.4
5
74
91
4.1
7
74
08
8.2
6
74
91
4.1
7
74
08
8.2
6
74
91
4.1
8
74
08
8.2
6
CO
2 e
mis
sio
ns
kg
(2.1
5 k
g / N
m3)
for
"N
atu
ral
Ga
s"
32
03
1.7
7
11
99
56
13
2,7
68
.86
14
8,9
87
.33
15
5,9
42
.63
16
1,0
65
.48
15
9,2
89
.76
16
1,0
65
.48
15
9,2
89
.76
16
1,0
65
.48
15
9,2
89
.76
En
ergy p
roducti
on
"S
ola
r B
iom
ass
"
(yie
ld 0
.93
%)
sola
r
con
trib
uti
on
CT
E
17
74
36
66
44
83
73
54
58
82
52
98
86
38
27
89
22
04
88
23
67
89
22
04
88
23
67
89
22
04
88
23
67
Em
kg
CO
2 i
ssio
ns
"S
ola
r B
iom
ass
" (
Zero
em
issi
on
fa
ctor)
0
0
0
0
0
0
0
0
0
0
0
Ener
gy
pro
duct
ion "
Sola
r
wit
h N
atu
ral
Gas"
(Y
ield
104%
) so
lar
contr
ibuti
on
gre
ate
r th
an C
TE
kW
h (
2)
11
95
34
43
76
63
50
11
31
58
14
69
61
59
22
64
12
98
63
25
02
64
12
98
63
25
02
64
12
98
63
25
02
Na
tura
l g
as
m3
/ y
ear
"Sol
ar w
ith
Nat
ural
Gas
" so
lar
cont
ribu
tion
gre
ate
r th
an C
TE =
kW
h (2
) * 1
Nm
3 /
10.6
5
kWh
11
22
3.8
5
41
09
5.1
2
47
05
4.5
5
54
59
8.0
3
57
83
3.0
5
60
21
5.7
7
59
38
9.8
6
60
21
5.7
7
59
38
9.8
6
60
21
5.7
7
59
38
9.8
6
CO
2 e
mis
sio
ns
kg
(2.1
5 k
g / N
m3)
for
"S
ola
r w
ith
Na
tura
l G
as"
24
13
1.2
8
88
35
4.5
0
10
1,1
67
.29
11
7,3
85
.76
12
4,3
41
.06
12
9,4
63
.92
12
7,6
88
.20
12
9,4
63
.92
12
7,6
88
.20
12
9,4
63
.92
12
7,6
88
.20
Table 12 Consumos energy (kWh) estimated for each
type of installation based on what is necessary to produce
and CO2 emissions generated
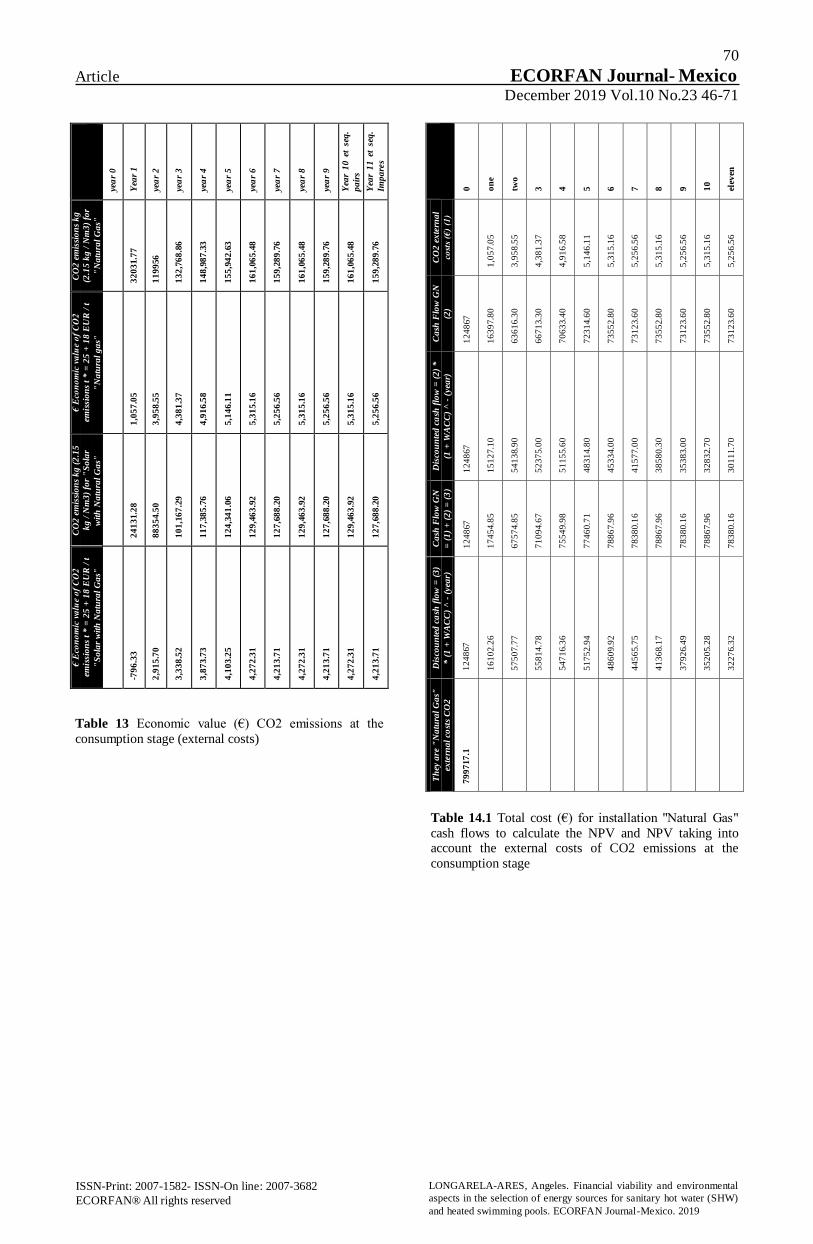
70
Article ECORFAN Journal- Mexico December 2019 Vol.10 No.23 46-71
ISSN-Print: 2007-1582- ISSN-On line: 2007-3682
ECORFAN® All rights reserved
LONGARELA-ARES, Angeles. Financial viability and environmental
aspects in the selection of energy sources for sanitary hot water (SHW)
and heated swimming pools. ECORFAN Journal-Mexico. 2019
yea
r 0
Yea
r 1
yea
r 2
yea
r 3
yea
r 4
yea
r 5
yea
r 6
yea
r 7
yea
r 8
yea
r 9
Yea
r 1
0 e
t se
q.
pa
irs
Yea
r 1
1 e
t se
q.
Imp
are
s
CO
2 e
mis
sio
ns
kg
(2.1
5 k
g /
Nm
3)
for
"N
atu
ral
Ga
s"
32
03
1.7
7
11
99
56
13
2,7
68
.86
14
8,9
87
.33
15
5,9
42
.63
16
1,0
65
.48
15
9,2
89
.76
16
1,0
65
.48
15
9,2
89
.76
16
1,0
65
.48
15
9,2
89
.76
€ E
con
om
ic v
alu
e o
f C
O2
emis
sio
ns
t *
= 2
5 +
18
EU
R /
t
"N
atu
ral
ga
s"
1,0
57
.05
3,9
58
.55
4,3
81
.37
4,9
16
.58
5,1
46
.11
5,3
15
.16
5,2
56
.56
5,3
15
.16
5,2
56
.56
5,3
15
.16
5,2
56
.56
CO
2 e
mis
sio
ns
kg
(2
.15
kg
/ N
m3
) fo
r "
So
lar
wit
h N
atu
ral
Ga
s"
24
13
1.2
8
88
35
4.5
0
10
1,1
67
.29
11
7,3
85
.76
12
4,3
41
.06
12
9,4
63
.92
12
7,6
88
.20
12
9,4
63
.92
12
7,6
88
.20
12
9,4
63
.92
12
7,6
88
.20
€ E
con
om
ic v
alu
e o
f C
O2
emis
sio
ns
t *
= 2
5 +
18
EU
R /
t
"S
ola
r w
ith
Na
tura
l G
as"
-79
6.3
3
2,9
15
.70
3,3
38
.52
3,8
73
.73
4,1
03
.25
4,2
72
.31
4,2
13
.71
4,2
72
.31
4,2
13
.71
4,2
72
.31
4,2
13
.71
Table 13 Economic value (€) CO2 emissions at the
consumption stage (external costs)
0
on
e
two
3
4
5
6
7
8
9
10
elev
en
CO
2 e
xte
rna
l
cost
s (€
) (1
)
1,0
57
.05
3,9
58
.55
4,3
81
.37
4,9
16
.58
5,1
46
.11
5,3
15
.16
5,2
56
.56
5,3
15
.16
5,2
56
.56
5,3
15
.16
5,2
56
.56
Ca
sh F
low
GN
(2)
12
48
67
16
39
7.8
0
63
61
6.3
0
66
71
3.3
0
70
63
3.4
0
72
31
4.6
0
73
55
2.8
0
73
12
3.6
0
73
55
2.8
0
73
12
3.6
0
73
55
2.8
0
73
12
3.6
0
Dis
cou
nte
d c
ash
flo
w =
(2
) *
(1 +
WA
CC
) ^
- (
yea
r)
12
48
67
15
12
7.1
0
54
13
8.9
0
52
37
5.0
0
51
15
5.6
0
48
31
4.8
0
45
33
4.0
0
41
57
7.0
0
38
58
0.3
0
35
38
3.0
0
32
83
2.7
0
30
11
1.7
0
Ca
sh F
low
GN
= (
1)
+ (
2)
= (
3)
12
48
67
17
45
4.8
5
67
57
4.8
5
71
09
4.6
7
75
54
9.9
8
77
46
0.7
1
78
86
7.9
6
78
38
0.1
6
78
86
7.9
6
78
38
0.1
6
78
86
7.9
6
78
38
0.1
6
Dis
cou
nte
d c
ash
flo
w =
(3
)
* (
1 +
WA
CC
) ^
- (
yea
r)
12
48
67
16
10
2.2
6
57
50
7.7
7
55
81
4.7
8
54
71
6.3
6
51
75
2.9
4
48
60
9.9
2
44
56
5.7
5
41
36
8.1
7
37
92
6.4
9
35
20
5.2
8
32
27
6.3
2
Th
ey a
re "
Na
tura
l G
as"
exte
rna
l co
sts
CO
2
79
97
17
.1
Table 14.1 Total cost (€) for installation "Natural Gas"
cash flows to calculate the NPV and NPV taking into account the external costs of CO2 emissions at the
consumption stage
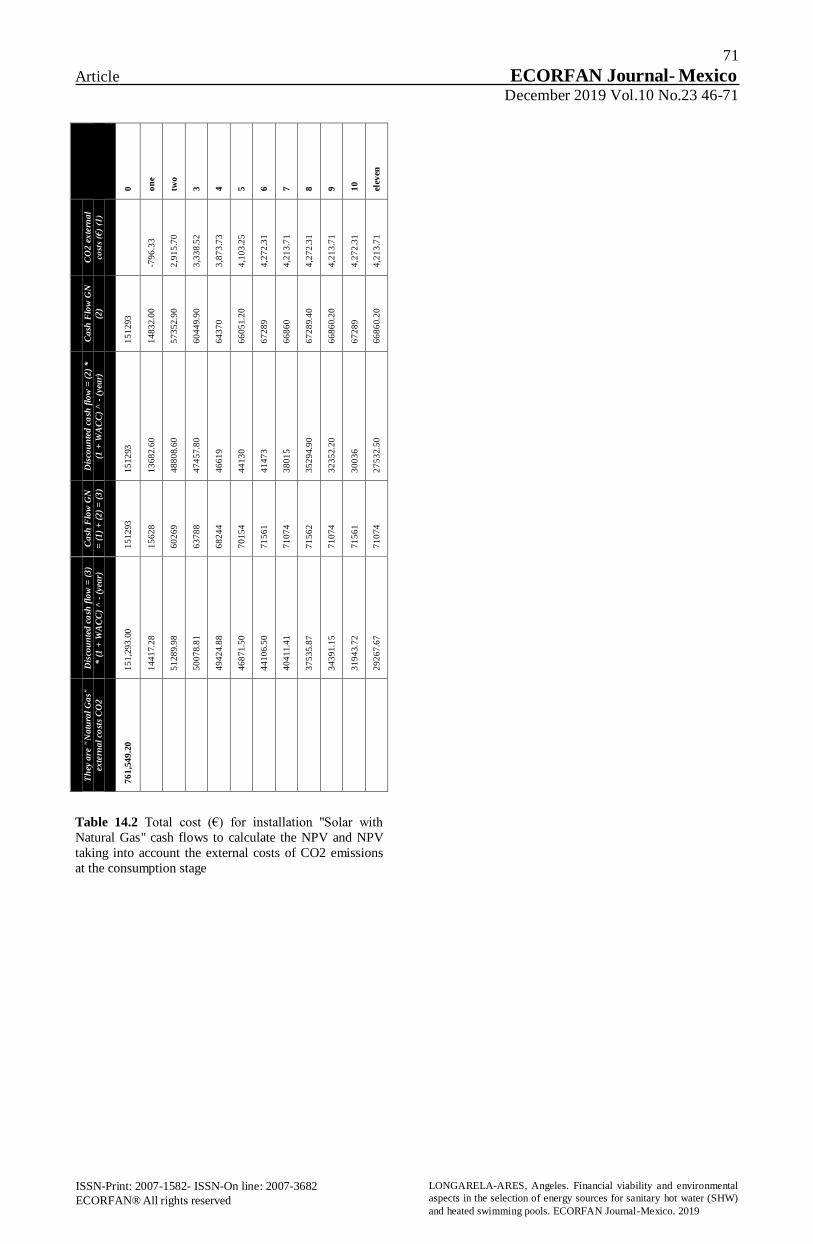
71
Article ECORFAN Journal- Mexico December 2019 Vol.10 No.23 46-71
ISSN-Print: 2007-1582- ISSN-On line: 2007-3682
ECORFAN® All rights reserved
LONGARELA-ARES, Angeles. Financial viability and environmental
aspects in the selection of energy sources for sanitary hot water (SHW)
and heated swimming pools. ECORFAN Journal-Mexico. 2019
0
on
e
two
3
4
5
6
7
8
9
10
elev
en
CO
2 e
xte
rna
l
cost
s (€
) (1
)
-79
6.3
3
2,9
15
.70
3,3
38
.52
3,8
73
.73
4,1
03
.25
4,2
72
.31
4,2
13
.71
4,2
72
.31
4,2
13
.71
4,2
72
.31
4,2
13
.71
Ca
sh F
low
GN
(2)
15
12
93
14
83
2.0
0
57
35
2.9
0
60
44
9.9
0
64
37
0
66
05
1.2
0
67
28
9
66
86
0
67
28
9.4
0
66
86
0.2
0
67
28
9
66
86
0.2
0
Dis
cou
nte
d c
ash
flo
w =
(2
) *
(1 +
WA
CC
) ^
- (
yea
r)
15
12
93
13
68
2.6
0
48
80
8.6
0
47
45
7.8
0
46
61
9
44
13
0
41
47
3
38
01
5
35
29
4.9
0
32
35
2.2
0
30
03
6
27
53
2.5
0
Ca
sh F
low
GN
= (
1)
+ (
2)
= (
3)
15
12
93
15
62
8
60
26
9
63
78
8
68
24
4
70
15
4
71
56
1
71
07
4
71
56
2
71
07
4
71
56
1
71
07
4
Dis
cou
nte
d c
ash
flo
w =
(3
)
* (
1 +
WA
CC
) ^
- (
yea
r)
15
1,2
93
.00
14
41
7.2
8
51
28
9.9
8
50
07
8.8
1
49
42
4.8
8
46
87
1.5
0
44
10
6.5
0
40
41
1.4
1
37
53
5.8
7
34
39
1.1
5
31
94
3.7
2
29
26
7.6
7
Th
ey a
re "
Na
tura
l G
as"
exte
rna
l co
sts
CO
2
76
1,5
49
.20
Table 14.2 Total cost (€) for installation "Solar with
Natural Gas" cash flows to calculate the NPV and NPV
taking into account the external costs of CO2 emissions
at the consumption stage
Article ECORFAN Journal-México
Month, Year Vol.1 No.1 1-15-[Using ECORFAN]
[Title in Times New Roman and Bold No. 14 in English and Spanish]
Surname (IN UPPERCASE), Name 1st Author†*, Surname (IN UPPERCASE), Name 1st Coauthor,
Surname (IN UPPERCASE), Name 2nd Coauthor and Surname (IN UPPERCASE), Name 3rd Coauthor
Institutional Affiliation of Author including Dependency (No.10 Times New Roman and Italic)
International Identification of Science - Technology and Innovation
ID 1st Author: (ORC ID - Researcher ID Thomson, arXiv Author ID - PubMed Author ID - Open ID) and CVU 1st author:
(Scholar-PNPC or SNI-CONACYT) (No.10 Times New Roman)
ID 1st Coauthor: (ORC ID - Researcher ID Thomson, arXiv Author ID - PubMed Author ID - Open ID) and CVU 1st coauthor:
(Scholar or SNI) (No.10 Times New Roman)
ID 2nd Coauthor: (ORC ID - Researcher ID Thomson, arXiv Author ID - PubMed Author ID - Open ID) and CVU 2nd coauthor:
(Scholar or SNI) (No.10 Times New Roman)
ID 3rd Coauthor: (ORC ID - Researcher ID Thomson, arXiv Author ID - PubMed Author ID - Open ID) and CVU 3rd coauthor:
(Scholar or SNI) (No.10 Times New Roman)
(Report Submission Date: Month, Day, and Year); Accepted (Insert date of Acceptance: Use Only ECORFAN)
Abstract (In English, 150-200 words)
Objectives
Methodology
Contribution
Keywords (In English)
Indicate 3 keywords in Times New Roman and Bold No.
10
Abstract (In Spanish, 150-200 words)
Objectives
Methodology
Contribution
Keywords (In Spanish)
Indicate 3 keywords in Times New Roman and Bold No.
10
Citation: Surname (IN UPPERCASE), Name 1st Author, Surname (IN UPPERCASE), Name 1st Coauthor, Surname (IN
UPPERCASE), Name 2nd Coauthor and Surname (IN UPPERCASE), Name 3rd Coauthor. Paper Title. ECORFAN Journal-
Mexico. Year 1-1: 1-11 [Times New Roman No.10]
* Correspondence to Author ([email protected])
† Researcher contributing as first author.
© ECORFAN Journal-México www.ecorfan.org/mexico

Article ECORFAN Journal-México
Month, Year Vol.1 No.1 1-15-[Using ECORFAN]
ISSN 2007-3682
ECORFAN® All rights reserved
Surname (IN UPPERCASE), Name 1st Author, Surname (IN
UPPERCASE), Name 1st Coauthor, Surname (IN UPPERCASE), Name
2nd Coauthor and Surname (IN UPPERCASE), Name 3rd Coauthor. Paper Title ECORFAN Journal-Mexico. Year [Times New Roman No.
8]
Introduction
Text in Times New Roman No.12, single space.
General explanation of the subject and explain
why it is important.
What is your added value with respect to other
techniques?
Clearly focus each of its features
Clearly explain the problem to be solved and the
central hypothesis.
Explanation of sections Article.
Development of headings and subheadings of
the article with subsequent numbers
[Title No.12 in Times New Roman, single
spaced and bold]
Products in development No.12 Times New
Roman, single spaced.
Including graphs, figures and tables-Editable
In the article content any graphic, table and
figure should be editable formats that can change
size, type and number of letter, for the purposes
of edition, these must be high quality, not
pixelated and should be noticeable even
reducing image scale.
[Indicating the title at the bottom with No.10 and
Times New Roman Bold]
Graphic 1 Title and Source (in italics)
Should not be images-everything must be editable.
Figure 1 Title and Source (in italics)
Should not be images-everything must be editable.
Table 1 Title and Source (in italics)
Should not be images-everything must be editable.
Each article shall present separately in 3 folders:
a) Figures, b) Charts and c) Tables in .JPG
format, indicating the number and sequential
Bold Title.
For the use of equations, noted as follows:
Yij = α + ∑ βhXhijrh=1 + uj + eij (1)
Must be editable and number aligned on the right
side.
Methodology
Develop give the meaning of the variables in
linear writing and important is the comparison of
the used criteria.
Results
The results shall be by section of the article.
Annexes
Tables and adequate sources
Thanks
Indicate if they were financed by any institution,
University or company.
Conclusions
Explain clearly the results and possibilities of
improvement.

Article ECORFAN Journal-México
Month, Year Vol.1 No.1 1-15-[Using ECORFAN]
ISSN 2007-3682
ECORFAN® All rights reserved
Surname (IN UPPERCASE), Name 1st Author, Surname (IN
UPPERCASE), Name 1st Coauthor, Surname (IN UPPERCASE), Name
2nd Coauthor and Surname (IN UPPERCASE), Name 3rd Coauthor. Paper Title ECORFAN Journal-Mexico. Year [Times New Roman No.
8]
References
Use APA system. Should not be numbered, nor
with bullets, however if necessary numbering
will be because reference or mention is made
somewhere in the Article.
Use Roman Alphabet, all references you
have used must be in the Roman Alphabet, even
if you have quoted an Article, book in any of the
official languages of the United Nations
(English, French, German, Chinese, Russian,
Portuguese, Italian, Spanish, Arabic), you must
write the reference in Roman script and not in
any of the official languages.
Technical Specifications
Each article must submit your dates into a Word
document (.docx):
Journal Name
Article title
Abstract
Keywords
Article sections, for example:
1. Introduction
2. Description of the method
3. Analysis from the regression demand curve
4. Results
5. Thanks
6. Conclusions
7. References
Author Name (s)
Email Correspondence to Author
References
Intellectual Property Requirements for
editing:
-Authentic Signature in Color of Originality
Format Author and Coauthors
-Authentic Signature in Color of the
Authorization Format of Author and Coauthors

Reservation to Editorial Policy
ECORFAN Journal México reserves the right to make editorial changes required to adapt the Articles to
the Editorial Policy of the Journal. Once the Article is accepted in its final version, the Journal will send
the author the proofs for review. ECORFAN® will only accept the correction of errata and errors or
omissions arising from the editing process of the Journal, reserving in full the copyrights and content
dissemination. No deletions, substitutions or additions that alter the formation of the Article will be
accepted.
Code of Ethics - Good Practices and Declaration of Solution to Editorial Conflicts
Declaration of Originality and unpublished character of the Article, of Authors, on the obtaining
of data and interpretation of results, Acknowledgments, Conflict of interests, Assignment of rights
and Distribution
The ECORFAN-Mexico, S.C Management claims to Authors of Articles that its content must be original,
unpublished and of Scientific, Technological and Innovation content to be submitted for evaluation.
The Authors signing the Article must be the same that have contributed to its conception, realization and
development, as well as obtaining the data, interpreting the results, drafting and reviewing it. The
Corresponding Author of the proposed Article will request the form that follows.
Article title:
– The sending of an Article to ECORFAN Journal México emanates the commitment of the author
not to submit it simultaneously to the consideration of other series publications for it must
complement the Format of Originality for its Article, unless it is rejected by the Arbitration
Committee, it may be withdrawn.
– None of the data presented in this article has been plagiarized or invented. The original data are
clearly distinguished from those already published. And it is known of the test in PLAGSCAN if
a level of plagiarism is detected Positive will not proceed to arbitrate.
– References are cited on which the information contained in the Article is based, as well as theories
and data from other previously published Articles.
– The authors sign the Format of Authorization for their Article to be disseminated by means that
ECORFAN-Mexico, S.C. In its Holding Mexico considers pertinent for disclosure and diffusion
of its Article its Rights of Work.
– Consent has been obtained from those who have contributed unpublished data obtained through
verbal or written communication, and such communication and Authorship are adequately
identified.
– The Author and Co-Authors who sign this work have participated in its planning, design and
execution, as well as in the interpretation of the results. They also critically reviewed the paper,
approved its final version and agreed with its publication.
– No signature responsible for the work has been omitted and the criteria of Scientific Authorization
are satisfied.
– The results of this Article have been interpreted objectively. Any results contrary to the point of
view of those who sign are exposed and discussed in the Article.

Copyright and Access
The publication of this Article supposes the transfer of the copyright to ECORFAN-Mexico, SC in its
Holding Mexico for its ECORFAN Journal México, which reserves the right to distribute on the Web the
published version of the Article and the making available of the Article in This format supposes for its
Authors the fulfilment of what is established in the Law of Science and Technology of the United Mexican
States, regarding the obligation to allow access to the results of Scientific Research.
Article Title:
Name and Surnames of the Contact Author and the Coauthors Signature
1.
2.
3.
4.
Principles of Ethics and Declaration of Solution to Editorial Conflicts
Editor Responsibilities
The Publisher undertakes to guarantee the confidentiality of the evaluation process, it may not disclose
to the Arbitrators the identity of the Authors, nor may it reveal the identity of the Arbitrators at any time.
The Editor assumes the responsibility to properly inform the Author of the stage of the editorial process
in which the text is sent, as well as the resolutions of Double-Blind Review.
The Editor should evaluate manuscripts and their intellectual content without distinction of race, gender,
sexual orientation, religious beliefs, ethnicity, nationality, or the political philosophy of the Authors.
The Editor and his editing team of ECORFAN® Holdings will not disclose any information about
Articles submitted to anyone other than the corresponding Author.
The Editor should make fair and impartial decisions and ensure a fair Double-Blind Review.
Responsibilities of the Editorial Board
The description of the peer review processes is made known by the Editorial Board in order that the
Authors know what the evaluation criteria are and will always be willing to justify any controversy in
the evaluation process.
In case of Plagiarism Detection to the Article the Committee notifies the Authors for Violation to the
Right of Scientific, Technological and Innovation Authorization.
Responsibilities of the Arbitration Committee
The Arbitrators undertake to notify about any unethical conduct by the Authors and to indicate all the
information that may be reason to reject the publication of the Articles. In addition, they must undertake
to keep confidential information related to the Articles they evaluate.
Any manuscript received for your arbitration must be treated as confidential, should not be displayed or
discussed with other experts, except with the permission of the Editor.
The Arbitrators must be conducted objectively, any personal criticism of the Author is inappropriate.
The Arbitrators must express their points of view with clarity and with valid arguments that contribute
to the Scientific, Technological and Innovation of the Author.
The Arbitrators should not evaluate manuscripts in which they have conflicts of interest and have been
notified to the Editor before submitting the Article for Double-Blind Review.

Responsibilities of the Authors
Authors must guarantee that their articles are the product of their original work and that the data has been
obtained ethically.
Authors must ensure that they have not been previously published or that they are not considered in
another serial publication.
Authors must strictly follow the rules for the publication of Defined Articles by the Editorial Board.
The authors have requested that the text in all its forms be an unethical editorial behavior and is
unacceptable, consequently, any manuscript that incurs in plagiarism is eliminated and not considered
for publication.
Authors should cite publications that have been influential in the nature of the Article submitted to
arbitration.
Information services
Indexation - Bases and Repositories
LATINDEX (Scientific Journals of Latin America, Spain and Portugal)
DIALNET (Dialnet Foundation - University of La Rioja, Spain)
CLASS (Citations Social Sciences and Latin American Humanities-UNAM)
DULCINEA (Spanish scientific journals)
HISPANA (Information and Bibliographic Orientation-Spain)
SHERPA (University of Nottingham - England).
SUDOC. (France)
UNIVERSIA (University Library-Madrid)
ESCI (Index of Appointments of Emerging Sources- Thomson Reuters)
RESEARCH GATE (Germany)
GOOGLE SCHOLAR (Citation indices-Google)
REDIB (Ibero-American Network of Innovation and Scientific Knowledge- CSIC)
MENDELEY (Bibliographic References Manager)
Publishing Services
Citation and Index Identification H
Management of Originality Format and Authorization
Testing Article with PLAGSCAN
Article Evaluation
Certificate of Double-Blind Review
Article Edition
Web layout
Indexing and Repository
ArticleTranslation
Article Publication
Certificate of Article
Service Billing
Editorial Policy and Management
143 – 50 Itzopan, Ecatepec de Morelos–Mexico. Phones: +52 1 55 6159 2296, +52 1 55 1260 0355, +52
1 55 6034 9181; Email: [email protected] www.ecorfan.org

ECORFAN®
Chief Editor
SERRUDO-GONZALES, Javier. BsC
Executive Director
RAMOS-ESCAMILLA, María. PhD
Editorial Director
PERALTA-CASTRO, Enrique. MsC
Web Designer
ESCAMILLA-BOUCHAN, Imelda. PhD
Web Diagrammer
LUNA-SOTO, Vladimir. PhD
Editorial Assistant
REYES-VILLAO, Angélica. BsC
Translator
DÍAZ-OCAMPO, Javier. BsC
Philologist
RAMOS-ARANCIBIA, Alejandra. BsC
Advertising & Sponsorship
(ECORFAN® Mexico), [email protected]
Site Licences
03-2010-032610094200-01-For printed material ,03-2010-031613323600-01-For Electronic
material,03-2010-032610105200-01-For Photographic material,03-2010-032610115700-14-For the
facts Compilation,04-2010-031613323600-01-For its Web page,19502-For the Iberoamerican and
Caribbean Indexation,20-281 HB9-For its indexation in Latin-American in Social Sciences and
Humanities,671-For its indexing in Electronic Scientific Journals Spanish and Latin-America,7045008-
For its divulgation and edition in the Ministry of Education and Culture-Spain,25409-For its repository
in the Biblioteca Universitaria-Madrid,16258-For its indexing in the Dialnet,20589-For its indexing in
the edited Journals in the countries of Iberian-America and the Caribbean, 15048-For the international
registration of Congress and Colloquiums. [email protected]
Management Offices
143 – 50 Itzopan, Ecatepec de Morelos–Mexico.
ECORFAN-Journal Mexico
“Does the macroeconomic context condition the prediction of business failure?”
CONTRERAS-FRÍAS, José Guillermo, SEGOVIA-VARGAS, María Jesús,
CAMACHO-MIÑANO, María del Mar and MIRANDA-GARCÍA, Marta
Universidad Complutense de Madrid
Universidad Rey Juan Carlos
“Investigation of the effect of the brand equity on the repurchase intention by
mediation of the brand attractiveness and brand trust”
HASANI-NASAB, Mahmood
Islamic Azad University
“The effect of marketing mix on export development with regard to the mediating
role of market competition”
HASANI-NASAB, Mahmood & SHIRAZIAN, Zahra
Islamic Azad University
“Financial viability and environmental aspects in the selection of energy sources
for sanitary hot water (SHW) and heated swimming pools”
LONGARELA-ARES, Angeles
Universidade da Coruña