« eco-certified contract choice among coffee farmers in brazil ... · maria sylvia macchionne saes...
TRANSCRIPT

« Eco-certified contract choice among coffee farmers in Brazil »
Sylvaine LEMEILLEUR Julie SUBERVIE Anderson EDILSON PRESOTO Roberta de CASTRO SOUZA
Maria Sylvia MACCHIONNE SAES
DR n°2016-09
Eco-certified contract choice among coffee farmers
in Brazil
Sylvaine Lemeilleur∗
Julie Subervie†
Anderson Edilson Presoto‡
Roberta de Castro Souza §
Maria Sylvia Macchione Saes¶
Abstract
We survey Brazilian coffee farmers’ preferences for attributes of voluntary sustainability
standards using a choice experiment. We collected original data from 250 coffee farmers who
live in the state of Minas Gerais who were asked to choose from several hypothetical buying
contracts for eco-certified coffee. Our results suggest that both cash and non-cash payments
may motivate farmers to participate in sustainability standard certification schemes that re-
quire improved agricultural practices. Preferences for non-cash rewards such as long-term
formal contracts or technical assistance, however, appear highly heterogeneous. Results more-
over show that the minimum willingness-to-accept for the adoption of composting is twice
as high as the average price premium for certified coffee in the current context, which may
partly explain why most coffee farmers continue to be reluctant to enter the most stringent
eco-certification schemes such as the organic standard.
Keywords: voluntary sustainability standards, certification, coffee, choice experiment, Brazil,
pesticides, compost, erosion.
JEL codes: Q01, Q15, Q57.
∗CIRAD, UMR MOISA, F-34398 Montpellier, France. email: [email protected]†INRA, UMR 1135 LAMETA, F-34000 Montpellier, France. email: [email protected]‡Universidade de São Paulo, Escola Politécnica, São Paulo, Brazil. email: [email protected]§Universidade de São Paulo, Escola Politécnica, São Paulo, Brazil. email: [email protected]¶Universidade de São Paulo, Faculdade de Economia Administração e Contabilidade, São Paulo, Brazil. email:
1

1 Introduction
It is well known that cash crop production in tropical countries creates a range of serious potential
environmental impacts. Coffee production is an emblematic case of environmental deterioration.
In the 1990s, many coffee growers replaced traditional shade grown coffee cultivation methods
with sun cultivation in order to increase the yield of their coffee. This shift has resulted in millions
of acres of cleared forest. Additionally, sun plantations require greater amounts of fertilizer and
pesticides, which damage the environment1 and lead to topsoil erosion. Approximately 40 percent
of Latin American shade coffee farms have been converted to low shade systems (Rice et al., 1996).
Today, farming systems in Latin America have remained largely unchanged since the 1990s (Jha
et al., 2011).
In many developing countries, the environmental impacts of cash crop production cannot
usually be solved using conventional command-and-control regulation due to weak institutions
and highly atomized production systems (Wehrmeyer and Mulugetta, 1999). The environmen-
tal problems that accompany coffee production would also be difficult to address using payment
for environmental services (PES) schemes.2 Although PES is an increasingly popular conserva-
tion and resource management tool in developing countries (Muradian et al., 2010), the uncer-
tain future availability of land and resources that many poor farmers face remains a key obstacle
to participation in these schemes. Moreover, the implementation of PES schemes is often com-
plex, and the associated transaction costs are usually high. As governments alone cannot be relied
upon to mitigate environmental issues, voluntary sustainability standards, also known as private
standards, have emerged as a promising solution. Sustainability standards can encourage the in-
ternalization of environmental externalities by providing incentives to farmers for implementing
environmentally friendly practices. Their ability to do so, however, depends on several factors,
1Indeed, sun-cultivated coffee often involves intensive pesticide use, which poses serious health and ecologicalconcerns. Shade plantations, in contrast, rely less heavily on pesticides because the variety of plants that surroundthe coffee trees reduce the system’s susceptibility to pests. Weed growth is also reduced with this method due to theshady exposure and fallen leaves that act as a natural mulch.
2PES are payments to farmers who have agreed to take certain actions to manage their land in such a way so asto provide an ecological service; in these schemes, payments are conditional on implementation of these favourablechanges in land use. In this way, the program is similar to providing farmers a subsidy that depends on the amount ofland under PES coverage.
2

including the stringency of the environmental requirements and the extent to which farmers are
willing to comply with the requirement.
Sustainability standards define the principles and criteria that govern the production and pro-
cessing methods for a product.3 These initiatives rely mainly on labels and use a certification
process. Most sustainability standards are enforced by third party auditors who monitor compli-
ance with the criteria and examine product traceability. Labels are designed to enable consumers
to differentiate between products based on environmental and/or social attributes, which facil-
itates the development of a market for products with premium prices (Giovannucci and Ponte,
2005). The coffee sector is generally regarded as a pioneering industry for sustainability standards
and certification (Reinecke, Manning, and von Hagen, 2012). The very first certified coffees were
Organic, Fair Trade, Bird Friendly and Rainforest Alliance. By the mid-2000s, sustainable coffees
came to include certification initiatives such as UTZ Certified and Common Code for the Coffee
Community (4C), as well as certifications used exclusively by individual firms (Starbucks and Ne-
spresso). Environmental requirements vary highly from one standard to another.
There are a variety of reasons why voluntary sustainability standards and certifications may be
effective in resolving the environmental issues that coffee production entails. First, there is grow-
ing consumer demand for coffee that has been produced in an environmentally friendly manner.4
For example, the annual growth rate of coffee sold under the Rainforest Alliance (resp. UTZ) cer-
tification reached 28 % (resp. 25 %) in 2012 (Potts et al., 2014). Second, certification generates
a price premium that can in some cases be quite high, which should create a financial incentive
for farmers to participate in certification schemes (Giovannucci and Ponte, 2005; Blackman and
Rivera, 2010). For the 2011-2012 period, for example, premiums for eco-certified coffee have been
reported at : around +13% for Fairtrade, +10% to +15% for Organic (these premiums have declined
3Some sustainability standards encompass not only environmental protection but also social improvements suchas better employment practices, as well as other economic criteria, in the selling contract. Given the increasing con-cern surrounding the environmental issues associated with coffee production, we focus here on environmental stan-dards.
4Many studies have indeed shown that consumer’s willingness to pay for eco-labelled products is often positive(Bougherara and Combris, 2009). There is, moreover, recent empirical evidence that eco-certification of coffee culti-vation significantly improves environmental performance. Blackman and Naranjo (2012), for example, used detailedfarm-level data in central Costa Rica to show that organic certification significantly reduces chemical input use and in-creases the adoption of several environmentally friendly management practices. Results such as these should furtherencourage consumer demand for eco-certified products.
3

compared to the +25 to +35% of the early to mid-2000s), +2.5% for UTZ Certified and +1% to +2%
for 4C compliant (Potts et al., 2014). Premium data on Rainforest Alliance products are scarce, but
premiums of around +8% were reported in 2009. Third, certification is often viewed as a strat-
egy for strengthening the position of small coffee producers in the value chain.5 In this regard,
downstream operators often play a central role in determining market access for coffee producers
by providing commercial stability through long-term contractual arrangements (Borrella, Mataix,
and Carrasco-Gallego, 2015; Fitter and Kaplinksy, 2001; Vorley and Fox, 2004).
Table 1: Eco-certified coffee produced under 4C, UTZ, Rainforest and Organic
2009 2012tons share (%) tons share(%)
4C 604,086 0.48 1,782,058 0.59UTZ 365,009 0.29 715,648 0.24Rainforest Alliance 168,114 0.13 265,565 0.09Organic 132,058 0.10 248,767 0.08Total 1,269,267 1.00 3,012,038 1.00Source: Potts et al. (2014)
The production of certified coffee has increased significantly in recent years: approximately
1.3 million of metric tons of eco-certified coffee were produced in 2008 (nearly 18% of global cof-
fee production) and more than 3 million of metric tons were produced in 2012 (nearly 40% of
global coffee production). However, most newly-certified farmers opt for the least stringent stan-
dards (Table 1). Indeed, they often choose the new and prevalent standard 4C, which has mod-
erate entry requirements and is widely perceived as a stepping-stone to existing standards. The
4C implementation process provides a transitional approach for producers and focuses mainly on
traceability, efficiency and farmer training. No third party certification is required, as an external
audit only occurs at the cooperative level. Conversely, farmers choose more stringent standards
less frequently. One such standard is Organic, which prohibits all chemical products and encour-
ages the use of organic compost; others are UTZ Certified and Rainforest Alliance, which require
taking steps to prevent soil erosion and water contamination, planting native shade tree species,
5A wide range of literature aims to determine whether private standards tend to include or exclude small-scalefarmers in markets for high-value food items (Asfaw, Mithöfer, and Waibel, 2010; Henson, Masakure, and Cranfield,2011; Maertens and Swinnen, 2009; Minten, Randrianarison, and Swinnen, 2009; Subervie and Vagneron, 2013). Evi-dence is mixed.
4
and reducing reliance on pesticides through integrated pest management. Table 1 shows that Or-
ganic certified coffee comprised the lowest share of eco-certified coffee production worldwide in
2009, which declined again in 2012, while the share of the least stringent standard - 4C certifica-
tion - increased dramatically during the same period. Additionally, growth in Organically certified
coffee sales was the lowest over the 2004-2008 period and remained the lowest over the 2008-2012
period (Table 2). Moreover, it is worth noting that sustainable standard markets exhibit significant
oversupply (standard-compliant sales volumes are far lower - nearly 25% lower - than standard-
compliant production volumes). This oversupply indicates a downward pressure on prices and
suggests that the development of the market for stringent eco-certified coffee may not, in the
end, prove dynamic enough to solve the environmental problems caused by coffee production.
In this paper, we investigate several possible impediments to farmer participation in certification
schemes (such as stringency, knowledge, premiums, outlet uncertainty, etc.).
Table 2: Eco-certified coffee sold under 4C, UTZ, Rainforest and Organic
Compound annual growthrate of sales
2004-2008 2008-20124C 153 48UTZ 30 23Rainforest Alliance 64 21Organic 19 8Source: Potts, van der Meer, and Daitchman (2010) andPotts et al. (2014)
While a vast literature discusses the efficiency of voluntary sustainability standards (Blackman
and Rivera, 2010), studies that examine the acceptability of voluntary sustainability standards are
rather scarce. It has been emphasized that in many cases, the price premiums paid to farmers un-
der these standards may not be high enough to offset the costs of compliance (Giovannucci and
Ponte, 2005; Blackman and Rivera, 2010). Despite this, the factors behind farmers’ decisions to
participate in certification schemes have seldom been the subject of empirical study. As a first
step toward filling that gap, this paper explores coffee farmers’ preferences for attributes of eco-
certified coffee contracts in the Brazilian state of Minas Gerais. This region constitutes the main
5

area for coffee production in Brazil (50% of total Brazilian coffee production). Most of the produc-
tion in this region is currently sun-cultivated, and farmers frequently use chemicals in the pro-
duction process. Another originality of the paper is our focus on the motivations that underlie
participation in voluntary sustainability standards through the use of a choice experiment. This
methodology is often used for studying the acceptability of PES schemes, but surprisingly it has
never been used for other well-developed market-based instruments such as sustainability stan-
dards. We ran a choice experiment (CE) among 250 coffee farmers who were asked to choose
from several hypothetical contracts for eco-certified coffee. In the choice experiment, hypotheti-
cal contracts were represented as combinations of various contract attributes. In our framework,
a contract for certified coffee combines a particular payment amount, payment method and envi-
ronmentally friendly farming practice. The way in which farmers choose between several different
contracts, each with varying levels of individual attributes, is used to quantify their preferences for
these attributes, as well as to quantify overall willingness to accept (WTA) values, i.e. the amount
of money an average farmer would require in order to adopt a particular contract. Our design al-
lows us to examine farmers’ preferences for three environmental practices, namely abandoning
pesticides, composting, and erosion control. We moreover investigate the relevance of non-cash
rewards such as technical assistance and long-term formal contracts. We analyse the data using a
mixed logit regression as well as latent class models.
Consistent with economic theory, the results from the mixed logit model show that the inclu-
sion of environmental requirements reduces the probability of choosing a certification contract,
while all cash and non-cash rewards increase the probability that farmers enter into a certification
contract. Overall, farmers prefer a high price premium, a long-term formal contract, as well as the
provision of technical assistance in order to comply with the environmental requirements that the
contract entails. However, as would be expected, results are not homogeneous among farmers.
Results from the 2-class model show that a subset of farmers, about one third of the sample, be-
have quite differently from other farmers: they place a very low value on technical assistance and
long-term contracts. On average, these farmers are less educated, own larger farms, and are less
specialized in coffee production; they moreover have fewer family members who are also involved
6

in coffee production.
Overall, our findings suggest that the average farmer’s willingness to enter the certified coffee
sector depends heavily on the practices that he is required to adopt, and that most farmers con-
sider composting to be the most stringent of the environmental requirements. We estimate that
the average respondent is willing to accept a contract that involves a composting requirement for
a 32 percentage point increase in the price premium, whereas they are willing to accept a contract
stipulating zero pesticide use for only a 6 percentage point increase in the price premium. Given
that the average price premium for certified coffee reaches at most 15% in the current context, the
minimum WTA that is required by respondents for compost adoption appears to be quite high.
The remainder of this article is organized as follows. Section 2 reviews the main results of
the literature that studies farmers’ motivations to adopt sustainable agricultural practices through
choice experiment methods. Section 3 describes the common practices used in the production of
coffee and the emergence of sustainability standards in the Brazilian coffee sector. We then present
the choice experiment design and the data used in Section 4 and the models used in Section 5. We
then present and discuss the results of the choice experiment analysis in Section 6. We provide
some robustness checks in Section 7, and Section 8 concludes.
2 Literature
There is a growing literature that studies farmers’ motivations to adopt sustainable agricultural
practices. A large number of these studies use choice experiments in which farmers are asked
to state their preferences over hypothetical alternative PES contracts. Just as in the participation
in sustainable standards, participation in PES programs is voluntary. Many studies focus on PES
contracts that have been offered to farmers in order to encourage more eco-friendly practices in
developed countries of the European Union, as farmers have shown less interest in these con-
tracts than was anticipated (Lienhoop and Brouwer, 2015; Villanueva et al., 2015; Schulz, Breust-
edt, and Latacz-Lohmann, 2014; Beharry-Borg et al., 2013; Broch et al., 2013; Broch and Vedel,
2012; Christensen et al., 2011; Espinosa-Goded, Barreiro-Hurle, and Ruto, 2010; Ruto and Garrod,
7

2009). These studies tackle a variety of environmental issues (e.g. water quality, afforestation) that
are likely to be solved by adjusting agricultural land management practices (such as establishing
pest-free areas or adopting nitrogen fixing crops).
Other recent discrete-choice experiments examine the acceptability of biodiversity conserva-
tion contracts in tropical areas. Greiner (2016), for example, use a choice experiment to estimate
the willingness of pastoralists and graziers to sign up for voluntary biodiversity conservation con-
tracts in northern Australia. Pienaar, Jarvis, and Larson (2014) study the willingness of a sample of
farming households to engage in anti-poaching enforcement, revegetation of wildlife habitat and
wildlife monitoring in the framework of a natural resource management program in Botswana.
Mulatu, van der Veen, and van Oel (2014) examine farmers’ preferences for collective and individ-
ual actions to improve water-related ecosystem services in Kenya. Kaczan, Swallow, and Adamow-
icz (2013) study farmers’ preferences for a hypothetical PES program to reduce deforestation in
Tanzania, and Krishna et al. (2013) estimate the cost of farmer participation in a hypothetical PES
scheme for agrobiodiversity conservation in India.
All of these studies are highly context-specific. Consequently, the design of choice experiments
varies greatly from one study to another, making it difficult to infer general results from these anal-
yses. However, we often observe a high heterogeneity in farmer preferences and minimum WTA
requirements for participation in potential PES programs. Moreover, in many cases, the minimum
WTA that is required by respondents varies greatly according to specific scheme requirements.
We contribute to this literature by focusing on the environmental effects of coffee production in
Brazil, which include the erosion of topsoil, biodiversity loss and water pollution due to the inten-
sive use of synthetic pesticides and fertilizers. Note that our analysis differs slightly from previous
studies in the sense that we explore the potential for the development of sustainability standards
rather than a PES program. Both certification schemes and PES schemes belong to the family of
market-based instruments for ecosystem services (Pirard and Lapeyre, 2014). From the point of
view of many farmers, however, the reward provided by certification schemes (which depends on
the quantity of standard-compliant coffee sold) is much more uncertain than the reward provided
through PES schemes (which often offer farmers fixed payments on a per hectare basis).
8

3 Background
3.1 Coffee Agroecosystems in Brazil
Brazil is by far the world’s largest coffee producer and exporter. Some 3.5 million people are in-
volved in the coffee sector, mostly in rural areas (Rice, 2003). These farmers are heavily exposed
to the volatility of world coffee prices. According to the International Coffee Organization, the av-
erage consumer price index of coffee was 1.27 USD per pound in the years 1980-1989 and fell to
0.54 USD per pound in the years 2000-2004. In order to compensate for decreases in their income,
many farmers have abandoned their traditional coffee growing methods, in particular shaded cul-
tivation.
Today, sun-grown farming methods continue to characterize agriculture in Brazil’s coffee sec-
tor, as only a few producers, located in areas such as northern Sao Paulo or Pernambuco, maintain
diverse canopies over their coffee (Jha et al., 2011). The predominant so-called Green Revolution
approach used in the majority of coffee plantations in Brazil is a plantation model that uses high
amounts of synthetic fertilizers and pesticides and grows coffee in full sun or in unshaded systems
(Sales et al., 2013).
3.2 Eco-certified Coffee in Brazil
The 4C Association standard is the most widespread standard in Brazil. It represents over 30% of
the total coffee production in Brazil in 2012.6 However, the 4C Association standard has moderate
entry requirements and should be considered a complementary initiative to existing standards. As
such, the 4C implementation process offers a transitional approach to producers who are either
unfamiliar with or not yet able to comply with more stringent sustainability standards. The stan-
dard generally focuses on traceability, efficiency and farmer training. There is no third-party cer-
tification, simply an external audit at the cooperative level, which may explain why many farmers
are not aware of their own engagement in the standard. One of the objectives of the 4C Associa-
6We obtain this result by calculating the ratio of the quantity of 4C-compliant coffee sold in 2012 (977,096 tonsaccording to Potts et al. (2014)) and the total quantity of coffee sold in Brazil in 2012 (2,952,000 tons according to theAgricultural Trade Office of Sao Paulo).
9

tion is therefore to prepare producers for possible compliance in the future, which explains why
the association requirements appear much less stringent that those of other sustainable standards.
Other common environmental standards in Brazil are UTZ Certified (nearly 8% of the total coffee
production in 2012), Rainforest Alliance (nearly 3%) and the Organic Standard (0.4%).7
Among environmental standards, the most stringent is the Organic standard, since it prohibits
all chemical products and encourages the use of organic compost, which helps eliminate the use of
synthetic fertilizers. This fosters the proliferation of beneficial microorganisms that protect plants
from diseases and pests, which in turn promotes healthy root systems that maintain soil structure,
reducing the likelihood of erosion and decreasing runoff. Regular use of organic compost over
an entire farm, however, can entail a significant amount of labour. Other environmental stan-
dards, such as the UTZ Certified and Rainforest Alliance certifications, appear to be less onerous.
Nonetheless, these certifications also require coffee farmers to take steps to prevent soil erosion
and water contamination, plant native shade tree species and reduce their reliance on pesticides
through integrated pest management.
Although there is growing concern about the environmental impacts of coffee cultivation in
Brazil, the adoption of organic agriculture is still perceived as a risky and very expensive option by
most farmers, who continue to use conventional agriculture methods (Sales et al., 2013).
4 Choice Experiment Design and Data Collection
4.1 Choice Experiment Design
Stated preference methods involve asking individuals to repeatedly state their preferences over
hypothetical alternatives. The choice experiment (CE), initially proposed by Louviere and Hen-
sher (1983) and Louviere and Woodworth (1983), belongs to the group of stated preference meth-
ods.8 In a CE, respondents are asked to undertake a sequence of choice tasks with two or more
7Note that certified farms are often compliant across multiple standards. For example, UTZ multi-certification datareports a 43% overlap with Rainforest Alliance among coffee farms (Potts et al., 2014).
8The major drawback of stated preference methods is their hypothetical nature, as people may not be sufficientlymotivated to reveal their true preferences in such situations. We argue, however, that in our case this is less of aconcern because we select attributes that are familiar to coffee farmers who are aware of the existence of sustainable
10

alternatives. Each alternative in a choice set is characterized by several attributes that can take on
different levels. Variation across the alternatives that make up the choice sets is achieved by select-
ing different levels for each of the attributes. In our CE, we asked respondents to choose between
two hypothetical buying contracts for certified products that are characterized by the attributes
presented in Table 3.
Table 3: Certification scheme attributes and their levels
Attribute Definition LevelsSustainable practice The farmer who chooses to participate in Zero pesticides
the environmental certification scheme Compostingcommits to integrate sustainability Erosion controlrequirements into his practices
Technical assistance The farmer who chooses to participate in Nothe environmental certification scheme Yesmay receive technical assistance to meetthe environmental requirements
Contract length The farmer who chooses to participate in 1-yearthe environmental certification scheme 3-yearsmay sign a long-term contract withthe buyer
Price premium The farmer who chooses to participate in +0 percentthe environmental certification scheme +5 percentmay benefit from a price premium relative +15 percentto the market price
The hypothetical contracts are characterized by the following four attributes: the environmen-
tal requirement, the contract length, the price premium and the provision of technical assistance
from the buyer. The environmental attribute consists of three levels, that is, three sustainable
farming practices that are often required in the context of environmental certifications. These en-
vironmental requirements are: “no pesticide use”, “composting” (instead of using chemical fertiliz-
ers, as in Organic requirements) and “erosion control”. These sustainable practices are all require-
ments that are encountered in existing certification schemes in Brazil. Each of these enhances
compliance with the Forest Code, which requires the maintenance of at least 20 percent of land as
forest.
Three payment attributes are used in the experiment. The primary payment vehicle is a price
standards.
11

premium, which takes on three levels that vary across scenarios: 0 percent, 5 percent or 15 percent
of the market price. These levels were chosen according to the actual potential premiums that
farmers are likely to encounter as payment for compliance with environmental standards. The
second was the provision of technical assistance to help farmers adopt the sustainable practice
required by the certification contract, which takes on two levels (zero or one). Indeed, ever since
the privatization of extension services in Brazil, access to technical assistance has become difficult
for many farmers. The third payment attribute is the provision of a formal contract for a period of
3 years (rather than a traditional annual contract), which is assumed to be a valuable option for
farmers in a market currently characterized by high volatility and an oversupply of sustainability
standards. An example of a choice set is shown in Table 4. The CE applies a fractional factorial
design consisting of 10 choice sets. Indeed, we were unable to use a full factorial design that con-
siders every possible choice set, i.e., each possible combination of the attribute levels, since this
would have required too many sets. Indeed, including two alternative contracts, each character-
ized by two attributes with three levels each and two attributes with two levels each, would lead
to 36 alternatives and 630 possible pairwise choices. Thus, we opted instead for a more practical
fractional factorial design, in which each respondent is only shown a subset of 10 choice situations
from the total number of possible choice situations.
Table 4: An example of a choice set
Which scheme would you prefer? Scheme A Scheme BRequirements Erosion control No PesticidesTech. Assistance Yes NoContract length 3 years 1 yearPremium +15% +5%I would prefer (tick your choice) [ ] [ ]
In order to select this subset of choice situations, we used an orthogonal design that aims to
minimize correlations between attribute levels in the choice situations. The orthogonality crite-
rion requires that the levels of each attribute vary independently from each other so that the effect
of each attribute may be estimated independently from all other effects. This design strategy also
attempts to keep the alternatives within each choice set as different as possible. For example, if an
12
attribute’s number of levels equals the number of alternatives in a choice set, each level appears
exactly once. Complete enumeration moreover conforms to the level balance principle, which re-
quires all levels of each attribute to appear with equal frequency across alternatives. The original
choice set (in Portuguese) used in the experiment is displayed in Appendix 2.
4.2 Data Collection
We collected original data from a total of 249 farmers living in the state of Minas Gerais. In order
to ensure that respondents would fully understand the questions and concepts used in the CE, a
pilot questionnaire was tested in October 2013 with the help of volunteers from the Cooxupé coffee
farmers’ group in Minas Gerais. The CE was then implemented in face-to-face interviews with
farmers in March 2014. Surveying took place in the municipality of Araguari during an agricultural
fair. Visitors in the fair were randomly solicited to participate in the choice experiment. In order
to increase participation, gifts were offered as prizes in a raffle for participants only. Interviewers
were experienced research assistants from the University of Sao Paulo. Surveys were conducted in
Portuguese.
Prior to the choice experiment, the respondents were informed about the attributes and their
levels. The interviewers provided respondents with a 20-minute information session regarding
the attributes and levels before presenting the choice experiment questions. The participants an-
swered survey questions about themselves, their farm and their environmental perceptions, and
then participated in the choice experiment. Each participant completed ten choice sets. A choice
set consisted of two contract alternatives, as well as an option to decline both contracts (i.e. to
choose the status quo).
4.3 Sample Characteristics
The descriptive statistics presented in Table 12 in Appendix 2 reveal that the sample is comprised
of farmers that own an average of 380 hectares of land (although the median farmer owns less than
13

90 hectares).9 They devote about 65 percent of their land to coffee production, and coffee is by far
their primary source of income (70 percent on average). On average, they employ 10 permanent
workers (while the median farmer only employs 3 permanent workers). The average number of
family workers on the farm is 2. Average yields range between 30 and 70 bags of coffee per hectare.
Most respondents (73 percent) are members of a cooperative, which is the main buyer for half of
the sample.
A large number of respondents (40 percent) grow coffee on mountain slopes and may thus be
causing excessive erosion on their plantation. Almost all respondents use pesticides. Most re-
spondents (75 percent) state that they are accustomed to using organic compost, albeit on a small
shares of their farmland. Indeed it is very common for farmers to use compost to encourage the
growth of young coffee plants. As a result, they are often very familiar with the amount of effort
required for this practice. The survey also consists of questions eliciting respondents’ awareness
of environmental issues. The majority of respondents believe that environmental issues are often
taken into account in decisions regarding the cultivation of coffee and that pesticides are used in a
controlled manner in their area. However, only 20 percent of farmers believe that forest biodiver-
sity is threatened by coffee production.
At the time of the survey, some respondents (30 percent) declared that they were certified.
More specifically, 15 percent of surveyed farmers declared that they were Certifica Minas certi-
fied and 8 percent declared that they were Cerrado certified (two kinds of Protected Geographical
Indications), and 5 percent declared that they were 4C certified. Interestingly, some respondents
were already engaged in some type of environmental certification scheme: 12 percent declared
that they were UTZ Certified and 15 percent declared that they were Rainforest Alliance certified.
9This means that large coffee producers are over-represented in our sample compared to the population of Brazil-ian producers (Census of Agriculture 2006). This is not surprising given that we ran the choice experiment in anagricultural show and trade fair, an event that is likely to attract the largest producers. However, since large produc-ers are also more likely to damage the environment through agricultural activity, focusing on these produces seemsappropriate for our study.
14

5 Statistical Models
In our choice experiment, each of the 249 participants faces 10 choice sets (or choice occasions).
A choice set consists of three alternatives: two alternative contracts and an option to decline both
contracts (i.e. to choose the status quo). Each contract is characterized by four attributes, that is,
one sustainable practice and three possible rewards (in the form of a price premium, free technical
assistance and/or a long-term formal contract). It is assumed that farmers lose utility when adopt-
ing a sustainable practice required by a certification contract, and gain utility from the associated
rewards.
We use the framework provided by Revelt and Train (1998), in which a sample of N respondents
have the choice of J alternatives on T choice occasions. In our data, we have N = 249, J = 3 and
T = 10. A farmer is assumed to choose a contract if the net utility from that choosing that contract
is greater than choosing either no certification contract or any of the competing choices. The
utility that farmer n derives from choosing alternative j on choice occasion t is given by Unjt =β′
n xnjt + εnjt , where βn is a vector of individual-specific coefficients, xnjt is a vector of observed
attributes relating to individual n and alternative j on choice occasion t , and εnjt is a random term
that is assumed to be an independently and identically distributed extreme value.
5.1 Standard Logit and Mixed Logit Models
Conditional on knowing βn , the probability of farmer n choosing alternative j on choice occasion
t is given by
Lnjt(βn) = exp(β′n xnjt)∑J
j=1 exp(β′n xnjt)
and the conditional probability that each farmer makes a particular sequence of choices d (with
d = d1,d2, ...dT ) is given by
Snd(βn) =T∏
t=1Lnjt(βn)
These are the standard logit formulas (McFadden, 1974). In addition to the standard logit model,
we use a mixed logit model to analyse our data. The mixed logit model overcomes three draw-
15

backs of the standard logit model by allowing for heterogeneity in tastes, correlation in unobserved
factors over repeated choices made by each individual, and complete relaxation of the indepen-
dence of irrelevant alternatives (IIA) assumption (Train, 1998). As βn is unknown, the uncondi-
tional probability for a sequence of choices d can be expressed by integrating over all values of
β weighted by the density of its distribution, denoted f (β|θ), where θ are the parameters of the
distribution:
Pn(θ) =∫
Snd(βn) f (β|θ)dβ
Note that we assume that all the parameters except the premium attribute follow a normal distri-
bution. The parameter of the premium attribute is treated as a fixed parameter, which allows us
to easily derive the marginal willingness-to-accept (WTA) estimates. Finally, the log likelihood for
the model is given by LL(θ) =∑Nn=1 lnPn(θ). This expression cannot be solved analytically, and it is
therefore approximated using simulation methods (Hole, 2007).10
5.2 Latent Class Model
As encountered in previous literature, we expect a certain degree of heterogeneity in results across
farmers. For this reason, we also employ a latent class model to analyse our data because we be-
lieve that identifying different classes of respondents - if there are any - could be of great practical
use in policy design.11 Unlike the mixed logit model that captures heterogeneity at the individual
level, the latent class model accommodates preference heterogeneity at the group level. The latent
class model can be interpreted as a semi-parametric version of the mixed logit model because it
does not require any assumptions regarding the distributions of the random parameters (Greene
and Hensher, 2003). In such models, each respondent is assumed to belong to a class, c, and farm-
ers’ preferences may vary across, but not within, these classes. Each farmer is assigned to a specific
class based on his characteristics.
If farmer n is in class c, the probability of observing his sequence of choices is a product of
10We implement this model in Stata using the mixlogit command (Hole, 2007) that fits mixed logit models by em-ploying maximum simulated likelihood using Halton draws.
11Moreover, several recent studies stress the potential gains that could be obtained by specifying a discrete ratherthan normal mixing distribution, as in the mixed logit model, including the ability to approximate the true parameterdistribution more flexibly at lower computational costs (Pacifico and il Yoo, 2012).
16

conditional logit formulas:
Pn(βc ) =T∏
t=1
J∏j=1
(exp(β′
c xnjt)∑Jk=1 exp(β′
c xnkt)
)ynjt
where ynjt is a binary variable that equals 1 if farmer n chooses alternative j on choice occasion t .
The unconditional likelihood of farmer n’s choices equals the weighted average of Pn(βc ) over all
classes. The log likelihood is then obtained by summing each farmer’s log unconditional likeli-
hood:
lnL(β,θ) =N∑
n=1ln
C∑c=1
πnc(θ)Pn(βc )
where πnc(θ) denotes the weight for class c.12 The βc parameters can be estimated using the
Expectation-Maximization (EM) algorithm (Pacifico and il Yoo, 2012).13
6 Results
6.1 Mixed Logit Model
In addition to the standard logit model, we estimate a mixed logit model in order to account for
unobserved heterogeneity in the data. Results are displayed in Table 5. Both models provide co-
efficients that are very similar in size. More specifically, the results presented in Columns 1 and 2
show that all variables except one are significant at least at the 5% level.
Consistent with economic theory, requiring compliance with any type of environmental prac-
tice has a negative effect on the probability of choosing a certification, while all cash and non-cash
rewards increase the probability that farmers enter a certification scheme. On average, farmers
prefer higher price premiums, a longer contract length, and the provision of technical assistance
designed to help them comply with environmental requirements. The result regarding technical
assistance makes sense given that farmers generally have poor access to rural extension services,
12The weight for class c is the share of the total population that the class contains. It is modeled as πnc =exp(θc zn )
1+∑C−1l=1 exp(θl zn )
where zn is a vector of farmer-specific characteristics and θ = (θ1,θ2, ..,θl , ..,θC−1) are the parameters
of the class membership model.13We estimate the βc parameters in Stata using the lclogit command which estimates a latent class logit model via
the Expectation-Maximization (EM) algorithm (Pacifico and il Yoo, 2012).
17
Table 5: Standard Logit and Mixed Logit Model Estimates
Standard logit Mixed logit
Coefficient Mean Std.Dev.Composting -2.22 *** -3.25 *** 1.98 ***
(0.18) (0.36) (0.30)No pesticide -0.45 *** -0.60 ** 1.48 ***
(0.17) (0.29) (0.20)Erosion control -0.01 0.28 1.90 ***
(0.16) (0.30) (0.20)Tech. assistance 1.06 *** 1.00 *** 1.54 ***
(0.06) (0.12) (0.14)Long-term contract 0.20 *** 0.21 ** 0.80 ***
(0.06) (0.09) (0.11)Premium 0.09 *** 0.10 ***
(0.01) (0.01)Log-likelihood -3,715.92 -1,967.44Number of observations 7,452 7,452Number of respondents 249 249Notes: ***, ** and * indicate that the estimated coefficients are statisti-cally significant at the 1%, 5%, and 10% levels, respectively. Standarderrors are given in parentheses.
since the government no longer fulfils this function. The result regarding long-term contracts also
seems appropriate given the highly volatile context of the international coffee market.14
We find that respondents tend to reject contracts that require composting more frequently than
contracts that require eliminating pesticides. This result could be explained by the extra work that
spreading compost can entail on large plantations. On average, we fail to detect any significant
interest in the erosion control requirement. In order to further investigate this result, we estimate
individual-level coefficients. We consider E(β|yn , Xn), which is the expected value of parameter β
conditional on a given response pattern yn and a set of alternatives characterized by Xn . Intuitively
this can be thought of as the conditional mean of the distribution of these coefficients for the sub-
group of individuals who face the same alternatives and make the same choices. We implement
the approach suggested by Revelt and Train (2001). The distribution of the individual-level coeffi-
cients associated with the erosion control variable is displayed in Figure 1. The normal distribution
14The world coffee market is generally characterized by considerable instability, with a large crop in one year fre-quently followed by a smaller crop in the next.
18

demonstrates heterogeneity among farmers without over-scattered results: some farmers tend to
reject the erosion control requirement, while others tend to systematically choose contracts that
require erosion control. We study this issue further with a latent class model (Section 6.2).
Figure 1: Distribution of the individual-level coefficient for erosion attribute
Column 3 in Table 5 further suggests that there is significant preference heterogeneity for all
of the attributes of the proposed eco-certified coffee contracts. A likelihood-ratio test for the joint
significance of the standard deviations is reported at the bottom of the table. The associated p-
value is small, which leads us to reject the null hypothesis that all standard deviations are equal
to zero. From the magnitudes of the standard deviations relative to the mean coefficients, we cal-
culate that the majority of respondents (77%) prefer certification contracts that provide technical
assistance and that 62% prefer 3-year formal contracts. Moreover, whereas almost 37% of respon-
dents prefer contracts that stipulate zero pesticides, only 5% of respondents prefer contracts with
a composting requirement. These figures are given by 100∗Φ(bk /sk ) where Φ is the cumulative
standard normal distribution, and bk and sk are the mean (Column 2) and standard deviation
(Column 3), respectively, of the kth coefficient.
Because the price premium is assumed to be fixed in our model, we obtain the following result
19

regarding farmers’ Willingness-To-Accept (WTA) for attribute k:
E(WTAk ) =−E(βk )
βp
where p refers to the price premium. The marginal WTA estimates provide insights on the rel-
ative importance of each attribute. Table 6 reports the estimated WTA associated with each at-
tribute. The environmentally friendly agricultural practice with the highest WTA is the composting
requirement. Results show that the average respondent requires a 32 percentage point increase in
the price premium in order to accept a contract that includes a composting requirement, while an
increase in the price premium of no greater that 6 percentage points will induce him to accept a
contract with an environmental requirement stipulating zero pesticide use. Interestingly, farmers
appear to value technical assistance as equivalent to a 10 percentage point increase in the price
premium, and a 3-year contract as equivalent to a 2 percentage point increase in the price pre-
mium. Given that the average price premium for certified coffee rarely reaches 15% in the context
considered, the minimum WTA that is required by respondents for compost adoption appears to
be quite high. Nonetheless, our results suggest that non-cash payments such as technical assis-
tance may be appropriate substitutes to a price premium to some extent.
Table 6: Willingness to Accept Estimates
Attribute WTA [95% Conf.Int.]Composting 31.91 24.70 39.11No-pesticides 5.87 0.38 11.36Erosion control -2.75 -8.56 3.06Tech. assistance -9.86 -12.57 -7.16Long-term contract -2.04 -3.75 -0.33The confidence intervals are constructed usingthe delta method. The WTA estimates are com-puted using the mixed logit model estimates.
Next we wish to investigate how the probability of choosing an alternative changes when a
reward attribute changes. Focusing on the provision of technical assistance and a long-term for-
mal contract, we calculate the difference between the predicted probability provided by the mixed
logit model when the reward dummy equals one, and the predicted probability that we obtain
20

when the reward dummy equals zero. Results are displayed in Table 7. Results show that the prob-
ability of choosing a certification contract changes significantly when one shifts from no technical
assistance to technical assistance (+11 percentage points), while the probability does not change
significantly when one shifts from no contract to a 3-year contract (+2 percentage points). Results
also suggest that the probability of choosing a certification contract can change dramatically if the
price premium jumps from zero to 15% (+19 percentage points).
Table 7: Probability of choosing certification
Prob. of choosing an alternative (%) Change in prob.
Incentive Obs. With incentive Without incentive (%age point)3-year contract 2490 34.5 32.1 2.4Tech. assistance 2490 40.7 29.4 11.35% premium 2490 33.9 27.9 6.015% premium 2490 46.8 27.9 18.930% premium 2490 65.1 27.9 37.1Note: The reference level of each simulation is ‘no contract’, ‘no technical assis-tance’, ‘no premium’, ‘no premium’ and ‘no premium’ respectively.
6.2 Latent Class Model
We have assumed thus far that the distribution of the coefficients in the model is continuous,
however, given the heterogeneity in responses, identifying different classes of farmers based on
their contract preferences could be of great practical use in policy design. Given our sample size,
we opt for a two-class model.15
Following Pacifico and il Yoo (2012), we compute the average (over respondents) of the high-
est posterior probability of class membership in order to obtain a quantitative measure of how
well the model performs in differentiating between the two classes of preferences.16 The mean
15In empirical applications, it is common to choose the optimal number of latent classes by examining estimationcriteria such as the Akaike information criterion (AIC), the Bayesian information criterion (BIC) and the consistentAkaike information criterion (CAIC). Table 13 in Appendix presents these statistics from a latent-class model in whichthe number of classes ranges from one to five. The case in which there is only one class corresponds to the standardlogit model. Although the AIC, BIC and CAIC are minimized with 4 classes, the marginal improvement in the esti-mation criteria diminishes after the two-class model. Therefore, we select the two-class model as the best fit for thedata.
16The posterior probability is the probability that the agent is in a particular class, taking into account his sequenceof choices. Posterior probabilities are computed by evaluating the following equation using the final estimates for
21

highest posterior probability is about 0.98, meaning that the model does very well in distinguish-
ing between different underlying taste patterns for the observed choice behaviour. The results of
the two-class model estimation are displayed in Table 8. They show significant preference hetero-
geneity for attributes across classes. In particular, farmers from class 1 (which represents about
one third of the sample) do not appear to place a high value on technical assistance and tend to
reject long-term contracts more frequently than the other class. In addition, farmers in class 1
tend to choose contracts that require erosion control practices, while farmers in the other class are
(in accordance with the theory) less likely to choose a contract that involves this environmental
requirement. This last result can be explained by the fact that in our sample the odds that a farmer
has already taken steps to preserve mountaintops are 0.67 for Class 1 and only 0.38 for Class 2.
That is, the odds that farmers in Class 1 have already engaged in this practice are about 80% higher
than the odds for farmers in Class 2.17
Examining the parameters of the class membership model helps to further interpret these re-
sults (Table 9). These parameters show that farmers from class 1 are on average less educated, own
larger farms and are less specialized in coffee production. Moreover, they have a smaller num-
ber of family members who are also involved in coffee production. This suggests that providing
farmers with technical assistance and formal contracts may increase participation in certification
schemes only among certain farmers, namely those who are specialized in coffee production, well-
educated, and who work on family farms. Other farmers seem to consider the issue not important
enough to justify adopting a certification scheme.
7 Robustness checks
One concern with our findings is that they are biased by the subgroup of farmers who had already
obtained one or more environmental certifications at the time we interviewed them. If this were
each class:πnc(θ)Pn(βc )∑C
l=1πnl(θ)Pn(βl )
17In Class 1, 840 farmers declare that they preserve mountaintops while 1,260 declare they do not (840/1,260 = 0.67).In Class 2, 1,050 farmers declare that they preserve mountaintops while 2,790 declare they do not (1,050/2,790 = 0.38).
22

Table 8: Latent Class Model Estimates
Latent Class Model Mixed Logit Model
Class 1 Class 2 Whole sampleComposting -1.76 *** -2.72 *** -3.25 ***
0.43 0.23 0.36No pesticide -0.72 ** -0.93 *** -0.60 **
0.34 0.20 0.29Erosion control 1.57 *** -1.19 *** 0.28
0.35 0.19 0.30Tech. assistance 0.14 0.97 *** 1.00 ***
0.15 0.07 0.12Long-term contract -0.22 * 0.37 *** 0.21 **
0.13 0.07 0.09Premium 0.06 *** 0.08 *** 0.10 ***
0.01 0.01 0.01Nb. Respondents 86 163 249Uncond. Probability 0.43 0.47 -Cond. Probability 0.56 0.54 -Notes: ***, ** and * indicate that the estimated coefficients are sta-tistically significant at the 1%, 5%, and 10% levels, respectively.Standard errors are given in parentheses. The first column displaysthe mixed logit model estimates.
23

Table 9: Class membership model estimates
Variable Coef.The farmer’s age 0.009
(0.012)The farmer has a bachelor degree (yes=1/no=0) -0.883 **
(0.386)Number of permanent family workers -0.255 **
(0.127)Family as percentage of permanent workers 0.586
(0.791)Total of hectares owned by the farmer 0.000 °
(0.000)Share of total farm land allocated to coffee -1.428 **
(0.593)The farmer is certified (yes=1/no=0) -0.184
(0.383)Share of harvest sold to the cooperative 0.000
(0.004)Constant term 0.361
(0.801)Notes: ***, **, * and ° indicate that the estimated coefficients arestatistically significant at the 1%, 5%, 10% and 15% levels, respec-tively. Standard errors are given in parentheses. Estimates are ob-tained from the latent class model. Class 2 is the reference class.
24
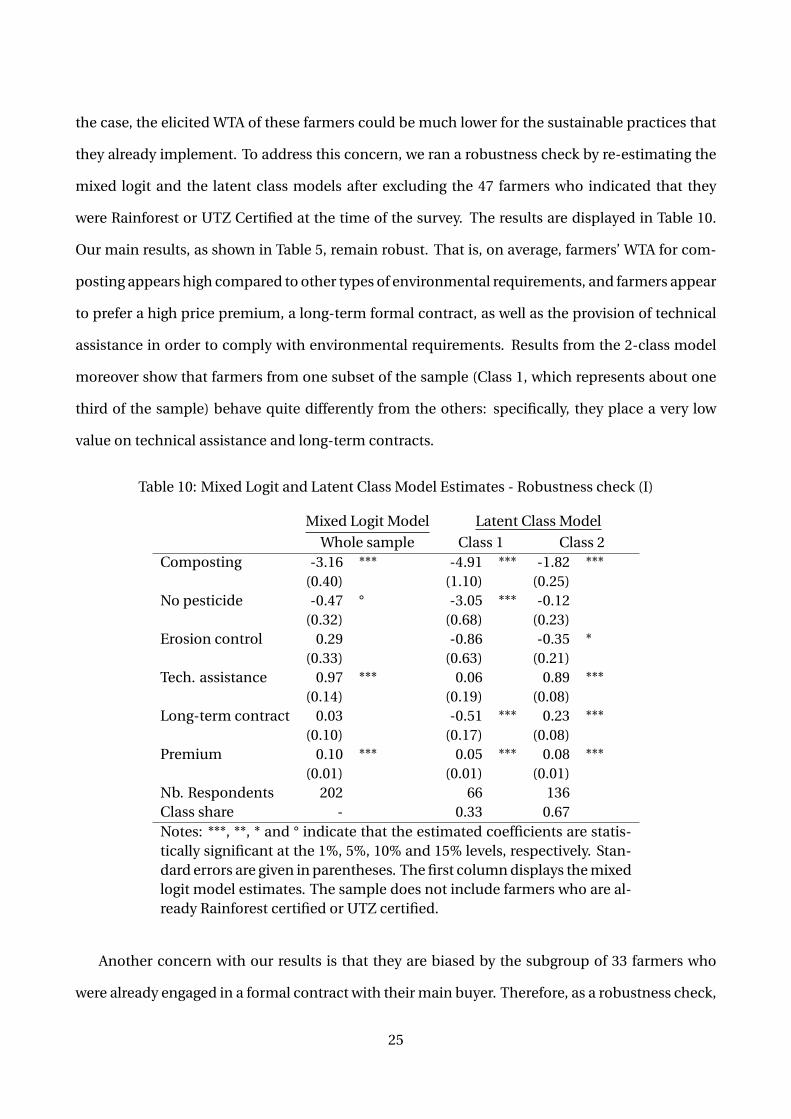
the case, the elicited WTA of these farmers could be much lower for the sustainable practices that
they already implement. To address this concern, we ran a robustness check by re-estimating the
mixed logit and the latent class models after excluding the 47 farmers who indicated that they
were Rainforest or UTZ Certified at the time of the survey. The results are displayed in Table 10.
Our main results, as shown in Table 5, remain robust. That is, on average, farmers’ WTA for com-
posting appears high compared to other types of environmental requirements, and farmers appear
to prefer a high price premium, a long-term formal contract, as well as the provision of technical
assistance in order to comply with environmental requirements. Results from the 2-class model
moreover show that farmers from one subset of the sample (Class 1, which represents about one
third of the sample) behave quite differently from the others: specifically, they place a very low
value on technical assistance and long-term contracts.
Table 10: Mixed Logit and Latent Class Model Estimates - Robustness check (I)
Mixed Logit Model Latent Class Model
Whole sample Class 1 Class 2Composting -3.16 *** -4.91 *** -1.82 ***
(0.40) (1.10) (0.25)No pesticide -0.47 ° -3.05 *** -0.12
(0.32) (0.68) (0.23)Erosion control 0.29 -0.86 -0.35 *
(0.33) (0.63) (0.21)Tech. assistance 0.97 *** 0.06 0.89 ***
(0.14) (0.19) (0.08)Long-term contract 0.03 -0.51 *** 0.23 ***
(0.10) (0.17) (0.08)Premium 0.10 *** 0.05 *** 0.08 ***
(0.01) (0.01) (0.01)Nb. Respondents 202 66 136Class share - 0.33 0.67Notes: ***, **, * and ° indicate that the estimated coefficients are statis-tically significant at the 1%, 5%, 10% and 15% levels, respectively. Stan-dard errors are given in parentheses. The first column displays the mixedlogit model estimates. The sample does not include farmers who are al-ready Rainforest certified or UTZ certified.
Another concern with our results is that they are biased by the subgroup of 33 farmers who
were already engaged in a formal contract with their main buyer. Therefore, as a robustness check,
25

we excluded from the sample those individuals who were already involved in a long-term contact
with their current buyer at the time they were interviewed. The results are displayed in Table 11.
Again, our results remain robust.
Table 11: Mixed Logit and Latent Class Model Estimates - Robustness check (II)
Mixed Logit Model Latent Class Model
Whole sample Class 1 Class 2Composting -2.97 *** -1.65 *** -2.70 ***
(0.37) (0.43) (0.25)No pesticide -0.31 -0.71 ** -0.89 ***
(0.29) (0.33) (0.21)Erosion control 0.61 ** 1.57 *** -1.10 ***
(0.30) (0.34) (0.21)Tech. assistance 0.98 *** 0.21 0.95 ***
(0.13) (0.16) (0.08)Long-term contract 0.16 * -0.41 *** 0.40 ***
(0.09) (0.15) (0.08)Premium 0.10 *** 0.06 *** 0.08 ***
(0.01) (0.01) (0.01)Nb. Respondents 216 76 140Class share - 0.35 0.65Notes: ***, **, * and ° indicate that the estimated coefficients are statis-tically significant at the 1%, 5%, 10% and 15% levels, respectively. Stan-dard errors are given in parentheses. The first column displays the mixedlogit model estimates. The sample does not include farmers who are al-ready involved in a long-term contact with their current buyer.
8 Conclusion
There are a growing number of certified farmers in the coffee sector. However, most of them com-
ply with the least stringent environmental standards – as is the case with the 4C standard in Brazil.
Despite the existence of price premiums, there is little consensus regarding how to best attract
farmers to adopt certification schemes, and in particular to those with the most stringent stan-
dards. In order to provide new insight to this question, we ran a choice experiment in the state of
Minas Gerais in Brazil, surveying 250 coffee farmers who were asked to choose from several hy-
pothetical contracts for the production of eco-certified coffee. Our findings show that both cash
26

and non-cash payments are likely to motivate farmers’ participation in a certification scheme. We
estimate that the average respondent is willing to accept a contract that involves composting for
a 32 percentage point increase in the price premium, whereas he is willing to accept a contract
that involves zero pesticides for not more than a 6percentage point increase in the price premium.
Given that the average price premium for certified coffee rarely reaches 15% in the current con-
text, the minimum WTA necessary to induce respondents to adopt composting practices appears
to be quite high. However, we also found that farmers prefer longer contract lengths as well as
the provision of technical assistance designed to help them comply with environmental require-
ments. In particular, we estimated that the probability of choosing a certification contract changes
significantly (+11 percentage points), when one shifts from no technical assistance to technical
assistance. We also found that farmers from one subset of the sample, representing about two-
thirds of respondents, behave quite differently from the others: specifically, they place a very high
value on technical assistance and long-term contracts. Encouraging the spread of beneficial en-
vironmental practices in coffee agriculture via market-based instruments such as sustainability
standards entails more than merely controlling compliance with particular sets of criteria. The
fact that farmers place a high value on non-cash rewards also suggests that designing effective
certification contracts is an important consideration for organizations that develop sustainability
standards, and that public (re)intervention through technical assistance may become necessary
when the market is unable to provide a price premium high enough to offset the compliance costs
associated with the most stringent environmental requirements.
Acknowledgements
Funding for this research was provided by the French National Research Agency (ANR).
27

References
Asfaw, S., D. Mithöfer, and H. Waibel. 2010. “Agrifood supply chain, private-sector standards, andfarmers’ health: evidence from Kenya.” Agricultural Economics 41:251–263.
Beharry-Borg, N., J.C.R. Smart, M. Termansen, and K. Hubacek. 2013. “Evaluating farmers’ likelyparticipation in a payment programme for water quality protection in the UK uplands.” RegionalEnvironmental Change 13:633–647.
Blackman, A., and M.A. Naranjo. 2012. “Does eco-certification have environmental benefits? Or-ganic coffee in Costa Rica.” Ecological Economics 83:58 – 66, Sustainability in Global ProductChains.
Blackman, A., and J. Rivera. 2010. “The Evidence Base for Environmental and Socioeconomic Im-pacts of Sustainable Certification.” Discussion Papers No. dp-10-10-efd, Resources For the Fu-ture, Mar.
Borrella, I., C. Mataix, and R. Carrasco-Gallego. 2015. “Smallholder Farmers in the Speciality Cof-fee Industry: Opportunities, Constraints and the Businesses that are Making it Possible.” IDSBulletin 46:29–44.
Bougherara, D., and P. Combris. 2009. “Eco-labelled food products: what are consumers payingfor?” European Review of Agricultural Economics 36:321–341.
Broch, S.W., N. Strange, J.B. Jacobsen, and K.A. Wilson. 2013. “Farmers’ willingness to provideecosystem services and effects of their spatial distribution.” Ecological Economics 92:78 – 86,<ce:title>Land Use</ce:title>.
Broch, S.W., and S.E. Vedel. 2012. “Using Choice Experiments to Investigate the Policy Relevanceof Heterogeneity in Farmer Agri-Environmental Contract Preferences.” Environmental and Re-source Economics 51:561–581.
Christensen, T., A.B. Pedersen, H.O. Nielsen, M.R. Morkbak, B. Hasler, and S. Denver. 2011. “De-terminants of farmers’ willingness to participate in subsidy schemes for pesticide-free bufferzones: A choice experiment study.” Ecological Economics 70:1558 – 1564.
Espinosa-Goded, M., J. Barreiro-Hurle, and E. Ruto. 2010. “What Do Farmers Want From Agri-Environmental Scheme Design? A Choice Experiment Approach.” Journal of Agricultural Eco-nomics 61:259–273.
Fitter, R., and R. Kaplinksy. 2001. “Who Gains from Product Rents as the Coffee Market BecomesMore Differentiated? A Value-chain Analysis.” IDS Bulletin 32:69–82.
Giovannucci, D., and S. Ponte. 2005. “Standards as a new form of social contract? Sustainabilityinitiatives in the coffee industry.” Food Policy 30:284 – 301, Private Agri-food Standards: Impli-cations for Food Policy and Agri-food Systems.
Greene, W., and D. Hensher. 2003. “A latent class model for discrete choice analysis: contrasts withmixed logit.” Transportation Research Part B: Methodological 37:681–698.
28
Greiner, R. 2016. “Factors influencing farmers’ participation in contractual biodiversity conserva-tion: a choice experiment with northern Australian pastoralists.” Australian Journal of Agricul-tural and Resource Economics 60:1–21.
Henson, S., O. Masakure, and J. Cranfield. 2011. “Do Fresh Produce Exporters in Sub-SaharanAfrica Benefit from GlobalGAP Certification?” World Development 39:375 – 386.
Hole, A.R. 2007. “Fitting mixed logit models by using maximum simulated likelihood.” The StataJournal 7:388–401.
Jha, S., C.M. Bacon, S.M. Philpott, R.A. Rice, V.E. Méndez, and P. Läderach. 2011. A Review of Ecosys-tem Services, Farmer Livelihoods, and Value Chains in Shade Coffee Agroecosystems, Dordrecht:Springer Netherlands. pp. 141–208.
Kaczan, D., B.M. Swallow, and W.V. Adamowicz. 2013. “Designing a payments for ecosystemservices (PES) program to reduce deforestation in Tanzania: An assessment of payment ap-proaches.” Ecological Economics 95:20 – 30.
Krishna, V.V., A.G. Drucker, U. Pascual, P.T. Raghu, and E.I.O. King. 2013. “Estimating compensa-tion payments for on-farm conservation of agricultural biodiversity in developing countries.”Ecological Economics 87:110–123.
Lienhoop, N., and R. Brouwer. 2015. “Agri-environmental policy valuation: Farmers’ contract de-sign preferences for afforestation schemes.” Land Use Policy 42:568 – 577.
Louviere, J.J., and D.A. Hensher. 1983. “Using Discrete Choice Models with Experimental DesignData to Forecast Consumer Demand for a Unique Cultural Event.” Journal of Consumer Research10:348–361.
Louviere, J.J., and G. Woodworth. 1983. “Design and Analysis of Simulated Consumer Choice orAllocation Experiments: An Approach Based on Aggregate Data.” Journal of Marketing Research20:350–367.
Maertens, M., and J.F. Swinnen. 2009. “Trade, Standards, and Poverty: Evidence from Senegal.”World Development 37:161 – 178.
McFadden, D. 1974. Frontiers in Econometrics, New York: Academic Press, chap. Conditional logitanalysis of qualitative choice behavior. pp. 105–142.
Minten, B., L. Randrianarison, and J.F. Swinnen. 2009. “Global Retail Chains and Poor Farmers: Evi-dence from Madagascar.” World Development 37:1728 – 1741, Agrifood Industry Transformationand Small Farmers in Developing Countries.
Mulatu, D.W., A. van der Veen, and P.R. van Oel. 2014. “Farm households’ preferences for collectiveand individual actions to improve water-related ecosystem services: The Lake Naivasha basin,Kenya.” Ecosystem Services 7:22 – 33.
Muradian, R., E. Corbera, U. Pascual, N. Kosoy, and P.H. May. 2010. “Reconciling theory and prac-tice: An alternative conceptual framework for understanding payments for environmental ser-vices.” Ecological Economics 69:1202 – 1208, Special Section - Payments for Environmental Ser-vices: Reconciling Theory and Practice.
29

Pacifico, D., and H. il Yoo. 2012. “lclogit: A Stata command for fitting latent-class conditional logitmodels via the expectation-maximization algorithm.” The Stata Journal 13:625–639.
Pienaar, E.F., L.S. Jarvis, and D.M. Larson. 2014. “Using a choice experiment framework to valueconservation-contingent development programs: An application to Botswana.” Ecological Eco-nomics 98:39 – 48.
Pirard, R., and R. Lapeyre. 2014. “Classifying market-based instruments for ecosystem services: Aguide to the literature jungle.” Ecosystem Services, pp. –.
Potts, J., M. Lynch, A. Wilkings, G. Huppe, M. Cunningham, and V. Voora. 2014. “The State of Sus-tainability Initiatives Review: Standards and the Green Economy.” Working paper, InternationalInstitute for Sustainable Development (IISD) and the International Institute for Environmentand Development (IIED).
Potts, J., J. van der Meer, and J. Daitchman. 2010. “The State of Sustainability Initiatives Review2010: Sustainability and Transparency.” Working paper, IISD, IIED, Aidenvironment, UNCTADand ENTWINED.
Reinecke, J., S. Manning, and O. von Hagen. 2012. “The Emergence of a Standards Market: Multi-plicity of Sustainability Standards in the Global Coffee Industry.” Organization Studies 33:789–812.
Revelt, D., and K. Train. 2001. “Customer-Specific Taste Parameters and Mixed Logit: Households’Choice of Electricity Supplier.” Econometrics No. 0012001, EconWPA, Jan.
—. 1998. “Mixed Logit With Repeated Choices: Households’ Choices Of Appliance EfficiencyLevel.” The Review of Economics and Statistics 80:647–657.
Rice, R. 2003. “Coffee production in a time of crisis: Social and environmental connections.” SAISReview 23:221–245.
Rice, R.A., J.R. Ward, S.M.B. Center., and N.R.D. Council. 1996. Coffee, conservation, and commercein the Western Hemisphere : how individuals and institutions can promote ecologically soundfarming and forest management in northern Latin America. Smithsonian Migratory Bird Center; Natural Resources Defense Council.
Ruto, E., and G. Garrod. 2009. “Investigating farmers’ preferences for the design of agri-environment schemes: a choice experiment approach.” Journal of Environmental Planning andManagement 52:631–647.
Sales, E.F., V.E. Mendez, F.R. Caporal, and J.C. Faria. 2013. “Agroecological Transition of ConilonCoffee (Coffea canephora) Agroforestry Systems in the State of EspÃrito Santo, Brazil.” Agroecol-ogy and Sustainable Food Systems 37:405–429.
Schulz, N., G. Breustedt, and U. Latacz-Lohmann. 2014. “Assessing Farmers’ Willingness to Ac-cept Greening: Insights from a Discrete Choice Experiment in Germany.” Journal of AgriculturalEconomics 65:26–48.
Subervie, J., and I. Vagneron. 2013. “A Drop of Water in the Indian Ocean? The Impact of GlobalGapCertification on Lychee Farmers in Madagascar.” World Development 50:57–73.
30
Train, K.E. 1998. “Recreation Demand Models with Taste Differences over People.” Land Economics74:230–239.
Villanueva, A., J. Gomez-Limon, M. Arriaza, and M. Rodriguez-Entrena. 2015. “The design of agri-environmental schemes: Farmers’ preferences in southern Spain.” Land Use Policy 46:142 – 154.
Vorley, B., and T. Fox. 2004. “Global Food Chains: Constraints and Opportunities for Smallholders.”Working paper, OECD.
Wehrmeyer, W., and Y. Mulugetta. 1999. Growing Pains: Environmental Management in Develop-ing Countries. Greenleaf.
31

9 Appendix
Figure 2: Choice cards
Rodada 1
Ex
igê
nci
as
Be
ne
fíci
os
Contrato:
3 anos
Obedecer à legislação
brasileira (trabalhista e ambiental)
+ Preservar os topos de
montanhas
Opção A
Premium:
+ 15%
Assistência Técnica:
Sim
Contrato:
Não
Obedecer à legislação
brasileira (trabalhista e ambiental)
+ Zero Pesticida
(Zero Veneno)
Opção B
Premium:
+ 5%
Assistência Técnica:
Não
Decisão
Opção A
Opção B
Nenhuma das Opções
Rodada 2
Ex
igê
nci
as
Be
ne
fíci
os
Contrato:
3 anos
Obedecer à legislação
brasileira (trabalhista e ambiental)
+ Zero Pesticida
(Zero Veneno)
Opção A
Premium:
+ 5%
Assistência Técnica:
Sim
Contrato:
Não
Obedecer à legislação
brasileira (trabalhista e ambiental)
+ Preparação e Aplicação de
Composto Orgânico
Opção B
Premium:
+ 15%
Assistência Técnica:
Não
Decisão
Opção A
Opção B
Nenhuma das Opções
Rodada 3
Ex
igê
nci
as
Be
ne
fíci
os
Contrato:
Não
Obedecer à legislação
brasileira (trabalhista e ambiental)
+ Zero Pesticida
(Zero Veneno)
Opção A
Premium:
+ 15%
Assistência Técnica:
Não
Contrato:
3 anos
Obedecer à legislação
brasileira (trabalhista e ambiental)
+ Preparação e Aplicação de
Composto Orgânico
Opção B
Premium:
0%
Assistência Técnica:
Sim
Decisão
Opção A
Opção B
Nenhuma das Opções
Rodada 4
Ex
igê
nci
as
Be
ne
fíci
os
Contrato:
3 anos
Obedecer à legislação
brasileira (trabalhista e ambiental)
+ Zero Pesticida
(Zero Veneno)
Opção A
Premium:
+ 15%
Assistência Técnica:
Não
Contrato:
Não
Obedecer à legislação
brasileira (trabalhista e ambiental)
+ Preservar os topos de
montanhas
Opção B
Premium:
+ 5%
Assistência Técnica:
Sim
Decisão
Opção A
Opção B
Nenhuma das Opções
32

Tab
le12
:Sam
ple
Ch
arac
teri
stic
s
Var
iab
leN
Mea
nSt
d.D
ev.
Min
.M
ed.
Max
.T
he
farm
er’s
age
232
41.9
14.2
17.0
41.5
80.0
Th
efa
rmer
sto
pp
edaf
ter
elem
enta
rysc
ho
ol(
yes=
1/n
o=0
)24
50.
100.
300
01
Th
efa
rmer
has
ab
ach
elo
rd
egre
e(y
es=1
/no
=0)
245
0.37
0.48
00
1T
he
farm
erh
asfo
llow
edag
ricu
ltu
ralt
rain
ing
(yes
=1/
no
=0)
235
0.61
0.49
01
1To
talo
fhec
tare
sow
ned
by
the
farm
er24
637
6.8
791.
81.
389
.555
00.0
Tota
lofh
ecta
res
cult
ivat
edas
coff
ee24
413
7.1
276.
61.
049
.023
00.0
Shar
eo
fto
talf
arm
lan
dal
loca
ted
toco
ffee
243
0.6
0.3
0.0
0.7
1.0
Co
ffee
area
isb
elow
20h
a(y
es=1
/no
=0)
244
0.20
0.40
00
1C
off
eear
eara
nge
sb
etw
een
20an
d50
ha
(yes
=1/n
o=0
)24
40.
300.
460
01
Co
ffee
area
ran
ges
bet
wee
n50
and
120
ha
(yes
=1/n
o=
0)24
40.
240.
430
01
Co
ffee
area
isab
ove
120
ha
(yes
=1/n
o=0
)24
40.
270.
450.
000.
001.
00N
um
ber
tota
lofp
erm
anen
tem
plo
yees
241
10.4
19.1
0.0
3.0
150.
0N
um
ber
ofp
erm
anen
tfam
ily
wo
rker
s24
42.
12.
60.
02.
030
.0Fa
mil
yas
per
cen
tage
ofp
erm
anen
two
rker
s23
40.
30.
30.
00.
31.
0Su
rfac
ew
ith
mec
han
ized
har
vest
(%)
238
75.8
37.9
0.0
100.
010
0.0
Hig
her
pro
du
ctiv
ity
(bag
s/h
a)22
466
.192
.70.
060
.014
00.0
Low
erp
rod
uct
ivit
y(b
ags/
ha)
225
28.3
47.5
0.0
24.0
700.
0C
off
eere
ven
ue
assh
are
oft
ota
lrev
enu
e(%
)23
170
340
8010
0T
he
farm
eris
mem
ber
ofa
coo
per
ativ
e(y
es=1
/no
=0)
247
0.73
0.45
01
1T
he
farm
er’s
mo
stim
po
rtan
tbu
yer
isth
eco
op
erat
ive
(yes
=1/
no
=0)
249
0.48
0.50
00
1T
he
farm
erse
llsh
isw
ho
leh
arve
stto
the
coo
per
ativ
e(y
es=
1/n
o=0
)24
90.
290.
450
01
Shar
eo
fhar
vest
sold
toth
eco
op
erat
ive
249
41.4
45.0
0.0
20.0
100.
0T
he
farm
erh
asa
lon
g-te
rmco
ntr
actw
ith
the
curr
entb
uye
r(y
es=
1/n
o=0
)24
90.
130.
340
01
Th
efa
rmer
use
so
rgan
icco
mp
ou
nd
(yes
=1/n
o=0
)23
70.
760.
430
11
Th
efa
rmer
use
sp
esti
cid
es(y
es=1
/no
=0)
241
0.98
0.16
01
1T
he
farm
ergr
ows
coff
eeo
nm
ou
nta
insl
op
es(y
es=1
/no
=0)
249
0.41
0.49
00
1T
he
farm
eris
cert
ified
(yes
=1/n
o=0
)24
90.
300.
460
01
Th
efa
rmer
is4C
cert
ified
(yes
=1/n
o=0
)24
90.
050.
210
01
Th
efa
rmer
isC
erti
fica
Min
asce
rtifi
ed(y
es=1
/no
=0)
249
0.15
0.36
00
1T
he
farm
eris
Cer
rad
oce
rtifi
ed(y
es=1
/no
=0)
249
0.08
0.27
00
1
33

Th
efa
rmer
isR
ain
fore
stce
rtifi
ed(y
es=1
/no
=0)
249
0.15
0.36
00
1T
he
farm
eris
UT
Zce
rtifi
ed(y
es=1
/no
=0)
249
0.12
0.33
00
1“D
oyo
ub
elie
veth
at:
envi
ron
men
talp
rob
lem
sar
eco
nsi
der
edin
coff
eep
rod
uct
ion
dec
isio
ns?
”(y
es=1
/no
=0)
249
0.70
0.46
01
1p
esti
cid
esar
eu
sed
ina
con
tro
lled
man
ner
?”(y
es=1
/no
=0)
249
0.59
0.49
01
1fo
rest
bio
div
ersi
tyis
thre
aten
edb
yco
ffee
pro
du
ctio
n?”
(yes
=1/n
o=
0)24
90.
200.
400
01
34

Table 13: Criteria for determining the optimal number of classes
Classes LLF BIC AIC CAIC1 -3715.9 7485.3 7443.8 7443.82 -1720.0 3555.9 3482.0 3576.93 -1666.4 3531.3 3404.7 3567.34 -1595.7 3472.7 3293.3 3523.75 -1599.1 3562.3 3330.1 3628.36 -1561.8 3570.5 3285.6 3651.5
35
Documents de Recherche parus en 2016
DR n°2016 - 01: Nicolas QUEROU, Agnes TOMINI et Christopher COSTELLO
« Spatial concessions with limited tenure» DR n°2016 - 02: Gilles GROLLEAU, Lisette IBANEZ et Nathalie LAVOIE « Cause-Related Marketing of Products with a Negative Externality » DR n°2016 - 03: Nobuyuki HANAKI, Angela SUTAN et Marc WILLINGER « The strategic environment effect in beauty contest games Externality » DR n°2016 - 04: Salvatore Di FALCO, Brice MAGDALOU, David MASCLET, Marie Claire
VILLEVAL et Marc WILLINGER « Can transparency of information reduce embezzlement? Experimental Evidence from TanzaniaExternality »
DR n°2016 - 05: Christopher COSTELLO, Nicolas QUEROU, Agnes TOMINI « Private eradication of mobile public bads » DR n°2016 - 06: Selly Amal KERIM
« Mesure de la pauvreté multidimensionnelle selon l’approche par Counting : application à la Mauritanie »
DR n°2016-07 : Philippe LE COENT, Raphaele PREGET, Sophie THOYER « Compensating environmental losses versus creating environmental gains: Implications for biodiversity offsets » DR n°2016-08 : Karine CONSTANT, Marion DAVIN
« Environmental Policy and Growth when Environmental Awareness is Endogenous »
DR n°2016 - 09: Sylvaine LEMEILLEUR, Julie SUBERVIE, Anderson EDILSON PRESOTO, Roberta de CASTRO SOUZA, Maria Sylvia MACCHIONE SAES « Eco-certified contract choice among coffee farmers in Brazil»

DOCUMENT DE RECHECHE LAMETA :
Conditions d’acceptation : http://www.lameta.univ-montp1.fr/Documents/acceptations.pdf
Contact : [email protected]/ 04 99 61 31 21
