+ do now: 6 minutes 1. get out your “analyzing a graph…” worksheet from yesterday. 2. find the...
TRANSCRIPT
+Do Now: 6 minutes1. Get out your “Analyzing a Graph…”
worksheet from yesterday.
2. Find the poster your didn’t analyze.
3. Finish the worksheet, and hand it in on the front table.
4. Sit down, and take out your notebook. Copy the objective. Smile, it’s Friday!
+
Density of Pennies Lab
+Intensive vs. extensive propertiesIntensive property: a physical property that does NOT depend on how much of a substance you have.Ex: temperature, velocity, melting point
Extensive property: a property that DOES depend on how much you have.Ex: mass, length, volume
+Intensive or extensive?I weigh 130 pounds.
The car is moving 50 miles per hour.
The length of a marathon is 24.6 miles.
The density of water is 1.0 g/mL
Ice melts at 0oC.
I drank one liter of soda. (burp!)
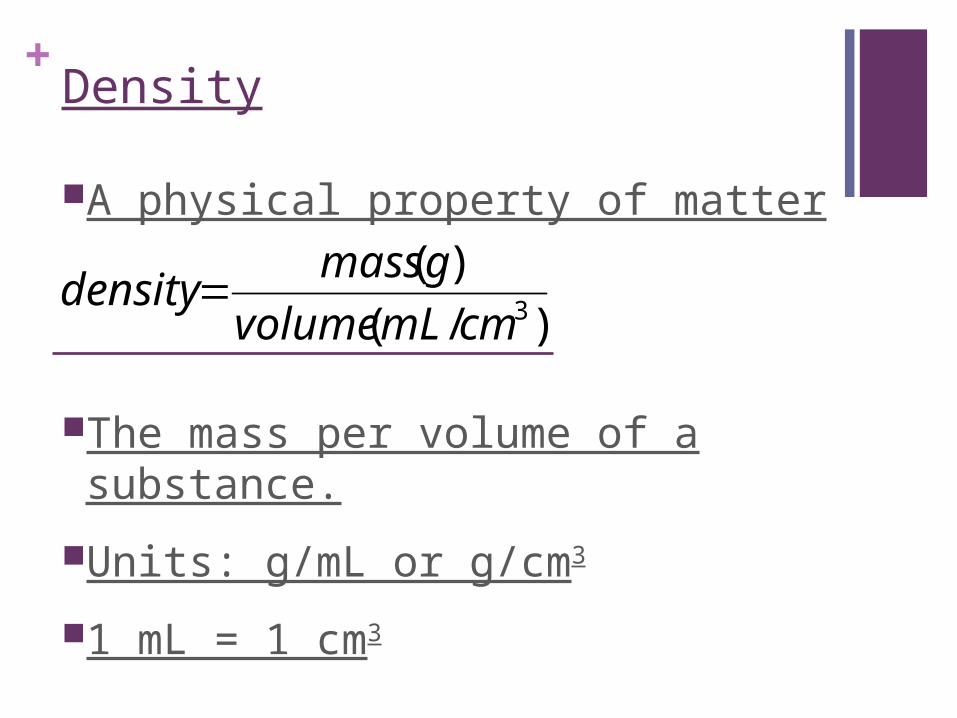
+Density
A physical property of matter
The mass per volume of a substance.
Units: g/mL or g/cm3
1 mL = 1 cm3
density mass(g)
volume(mL /cm3)
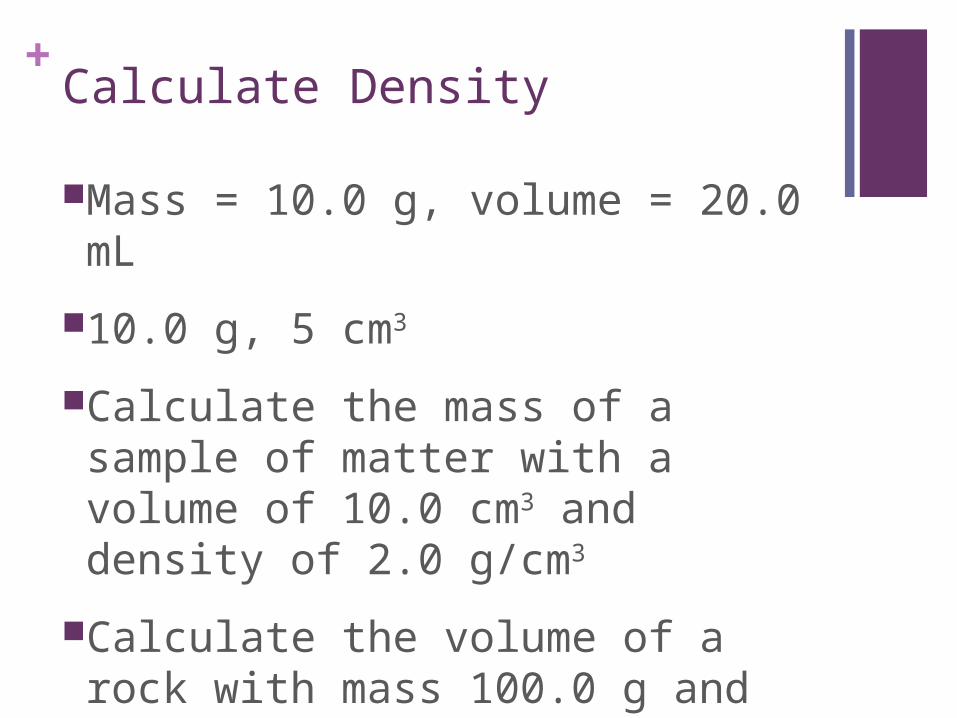
+Calculate Density
Mass = 10.0 g, volume = 20.0 mL
10.0 g, 5 cm3
Calculate the mass of a sample of matter with a volume of 10.0 cm3 and density of 2.0 g/cm3
Calculate the volume of a rock with mass 100.0 g and density 5.00 g/mL.
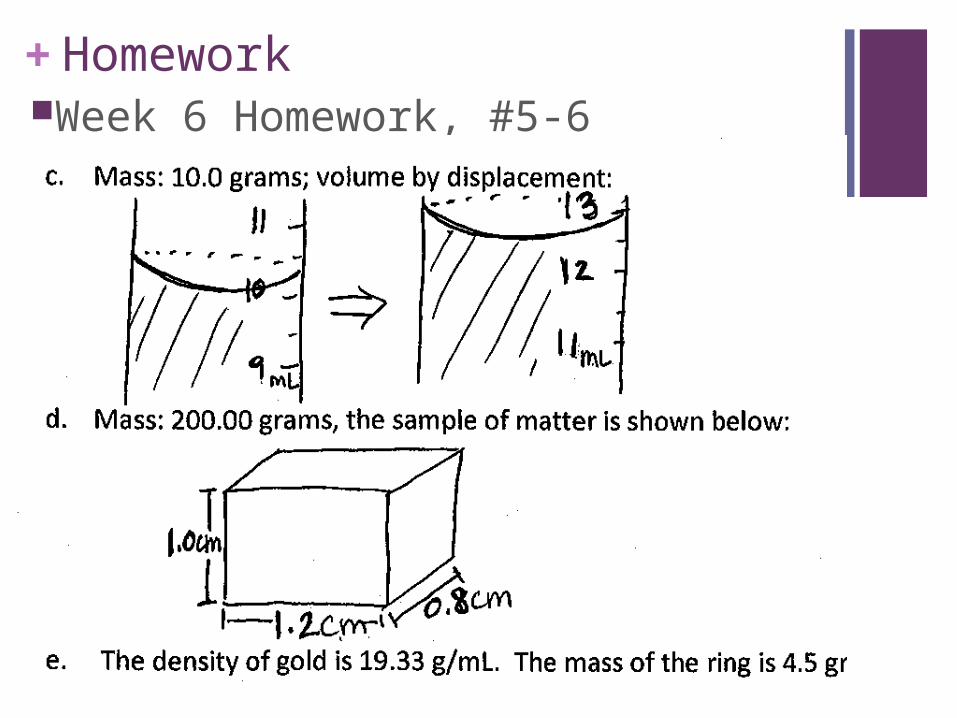
+HomeworkWeek 6 Homework, #5-6
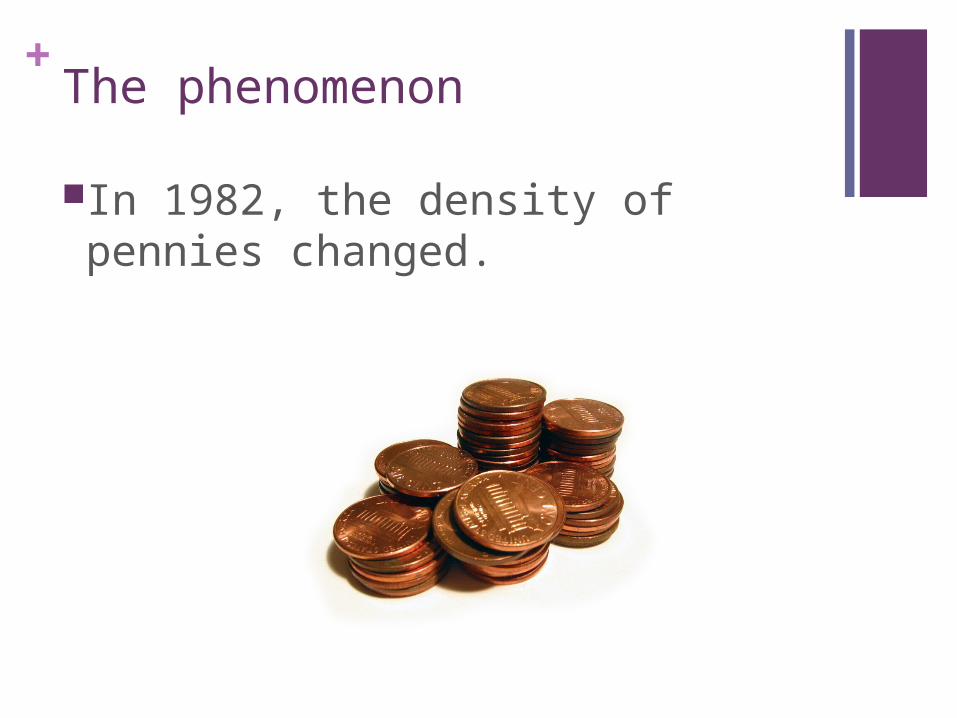
+The phenomenon
In 1982, the density of pennies changed.
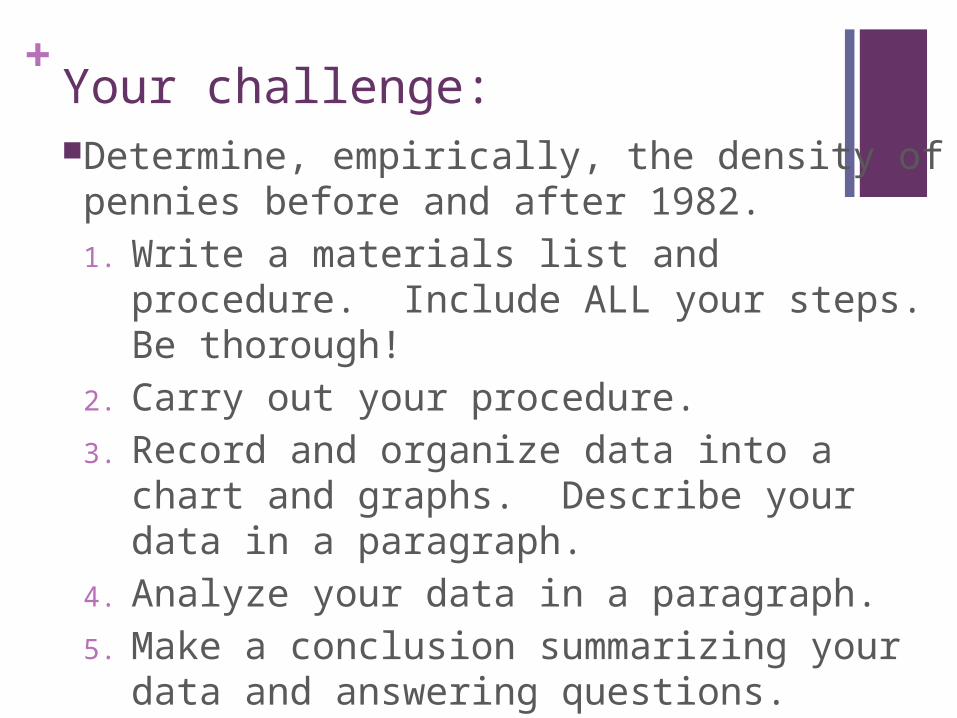
+Your challenge:Determine, empirically, the density of pennies before and after 1982.1. Write a materials list and procedure.
Include ALL your steps. Be thorough!2. Carry out your procedure.3. Record and organize data into a chart
and graphs. Describe your data in a paragraph.
4. Analyze your data in a paragraph.5. Make a conclusion summarizing your
data and answering questions.
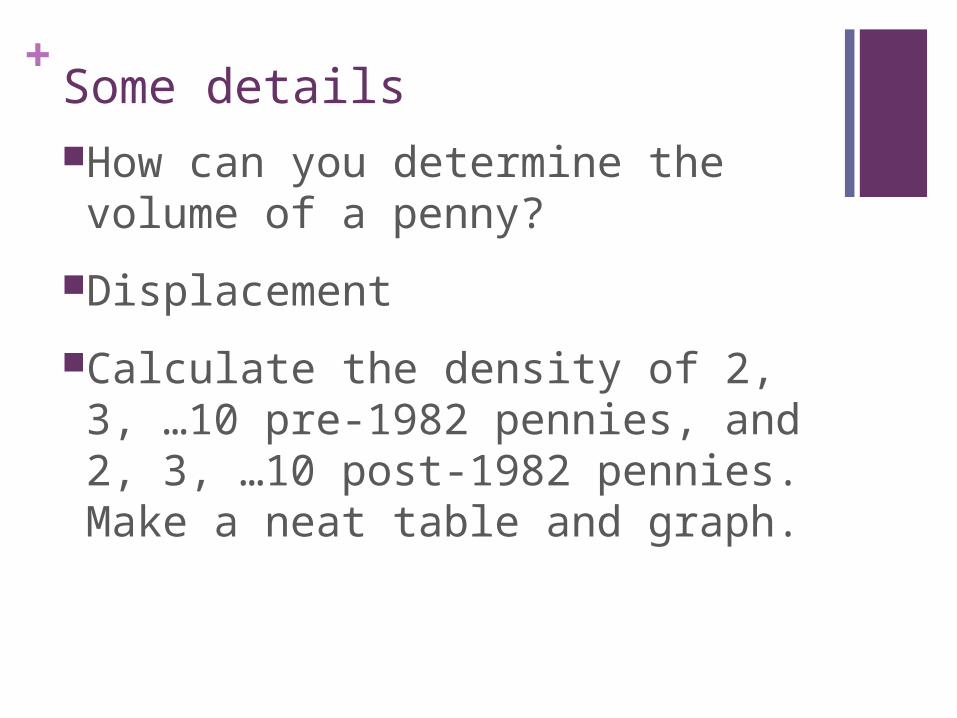
+Some detailsHow can you determine the volume of a penny?
Displacement
Calculate the density of 2, 3, …10 pre-1982 pennies, and 2, 3, …10 post-1982 pennies. Make a neat table and graph.

+
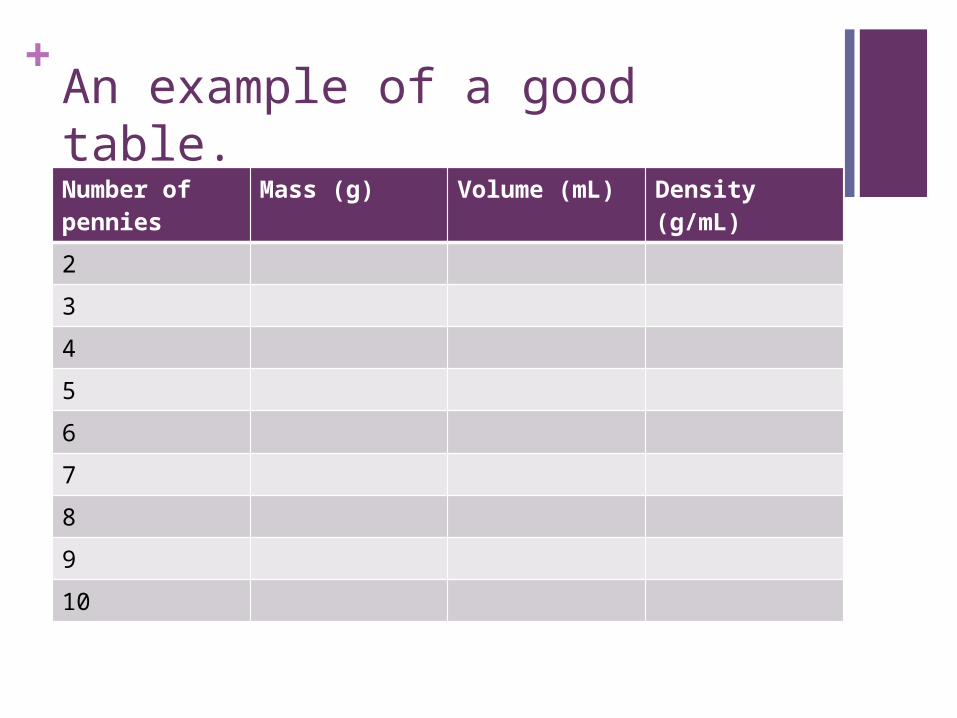
+An example of a good table.Table 1: Mass, volume and density of pre-1982 penniesNumber of pennies
Mass (g) Volume (mL) Density (g/mL)
2
3
4
5
6
7
8
9
10
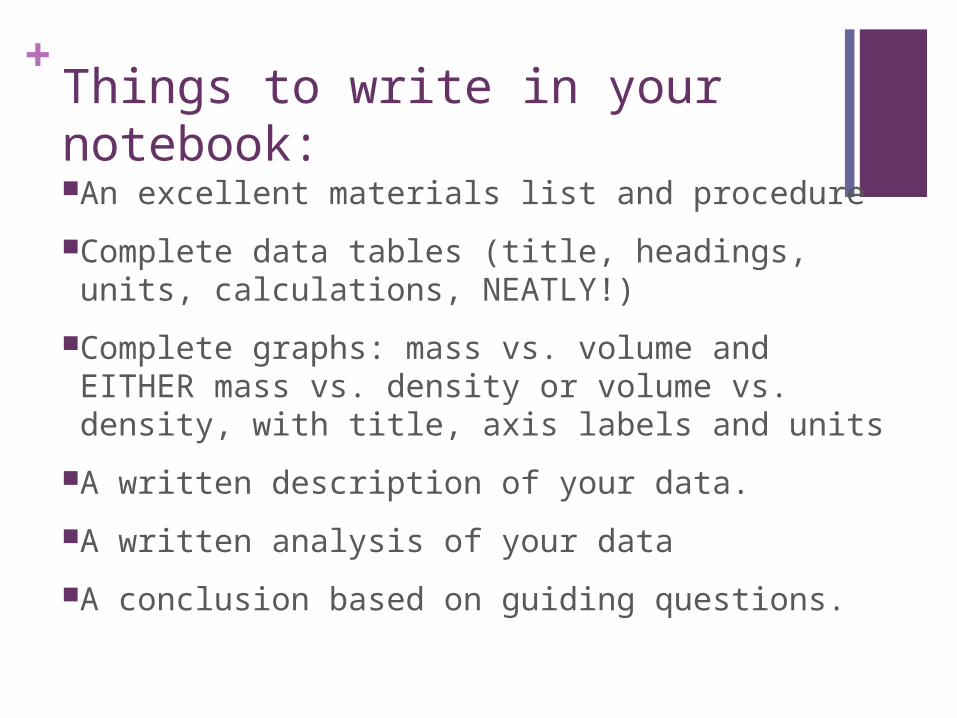
+Things to write in your notebook:An excellent materials list and procedure
Complete data tables (title, headings, units, calculations, NEATLY!)
Complete graphs: mass vs. volume and EITHER mass vs. density or volume vs. density, with title, axis labels and units
A written description of your data.
A written analysis of your data
A conclusion based on guiding questions.
+Your homework
To write a lab report.
First Draft (neatly hand-written or typed) due:
+
So, is density intensive or extensive? How do you know? Discuss your graph, and what a graph of the other type might look like.
+By the end of class…
Materials list and procedure (incl. how to make calculations!)
Data table for pre- and post-1982 pennies
2 graphs: mass vs. volume AND eitherMass vs. density OR volume vs. density
With a sentence describing each graph.
You can start an analysis and conclusion like we practiced yesterday.
+HomeworkWeek 6 Homework: #5-6
2 graphs: mass vs. volume AND eitherMass vs. density OR volume vs. density
With a sentence describing each graph.
You can start an analysis and conclusion like we practiced yesterday.
0 5 10 15 20 25 30 350
0.5
1
1.5
2
2.5
3
3.5
4
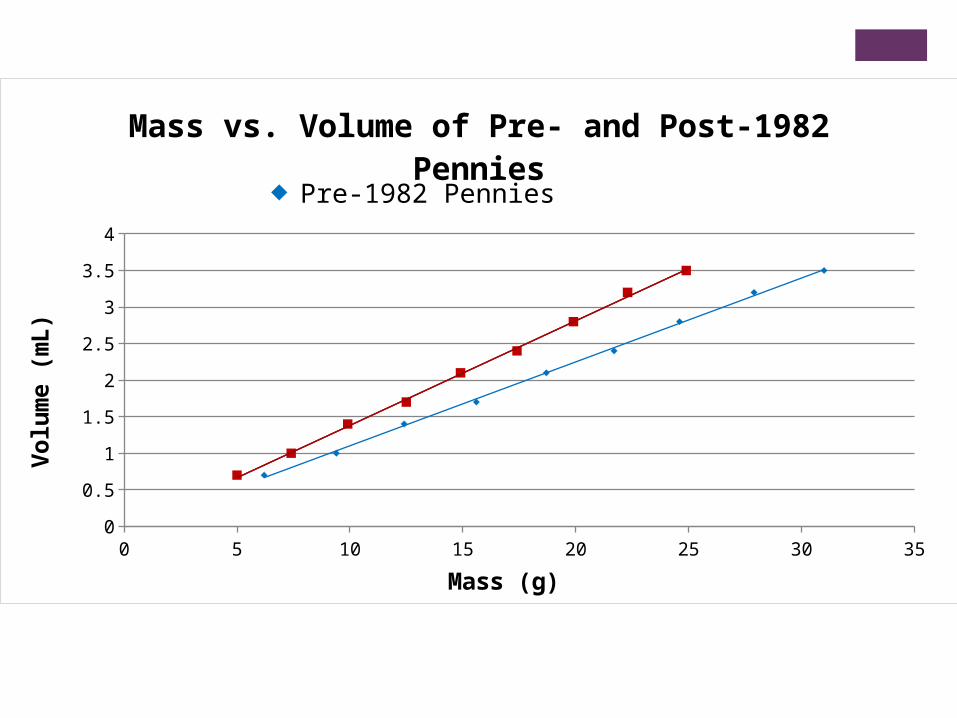
Mass vs. Volume of Pre- and Post-1982 Pennies
Pre-1982 Pennies
Mass (g)
Volu
me (
mL)
0 5 10 15 20 25 30 350.01.02.03.04.05.06.07.08.09.0
10.0
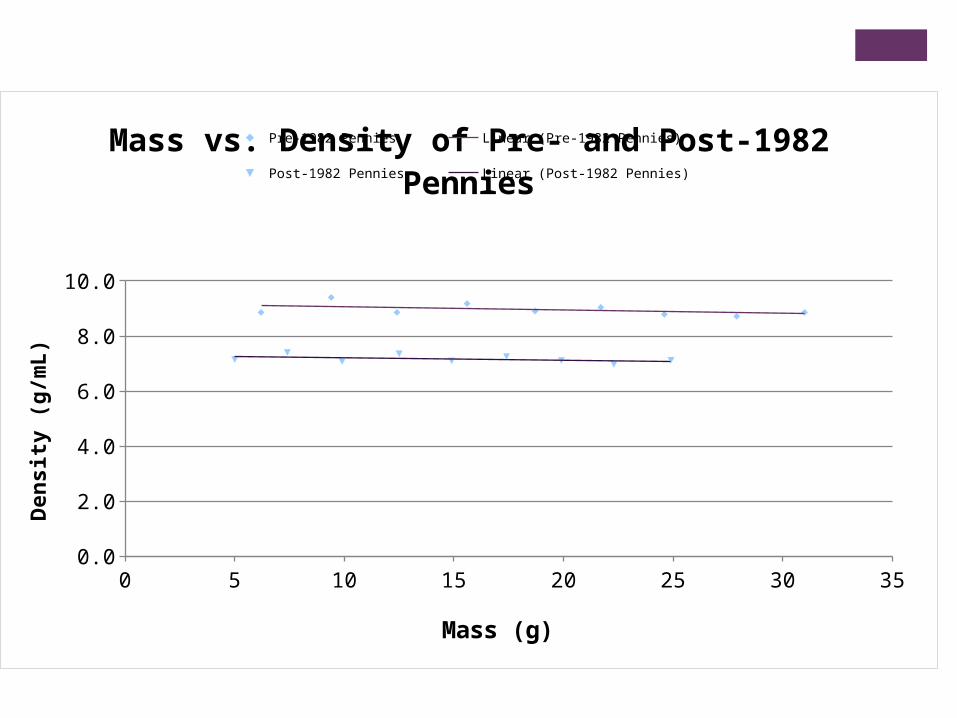
Mass vs. Density of Pre- and Post-1982 Pennies
Pre-1982 Pennies Linear (Pre-1982 Pennies)
Post-1982 Pennies Linear (Post-1982 Pennies)
Mass (g)
Den
sity
(g
/mL)
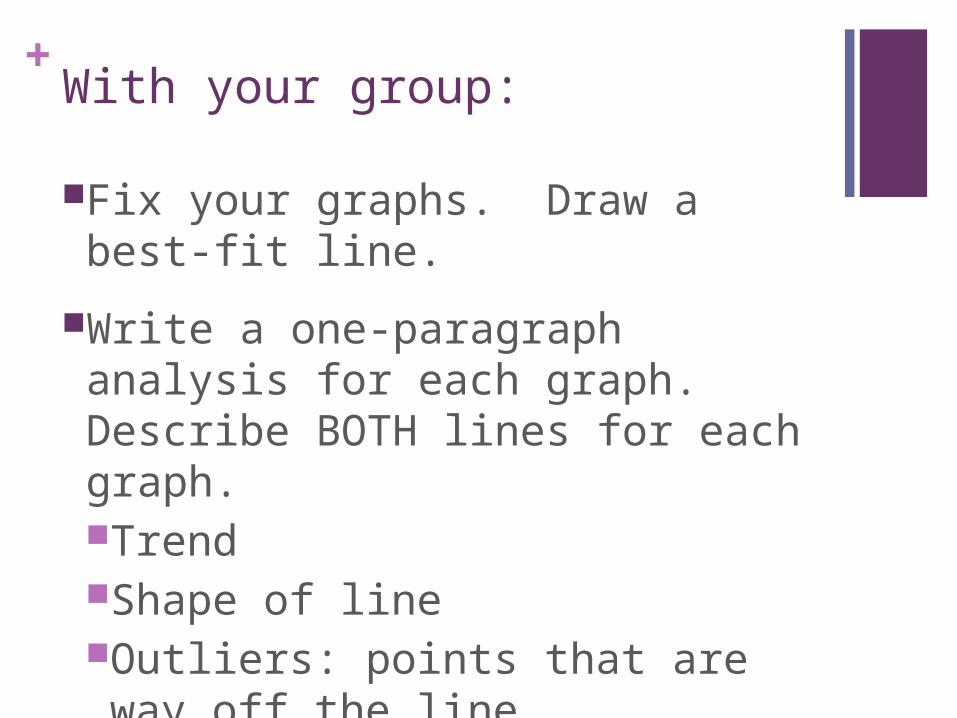
+With your group:
Fix your graphs. Draw a best-fit line.
Write a one-paragraph analysis for each graph. Describe BOTH lines for each graph.TrendShape of lineOutliers: points that are way off the line.
+Title
Your lab report should be titled with a title of your choosing.
It should be relevant to the lab and should not just be the same as the title of a handout your teacher gave you.
Do not have it on a separate title page.
+Background Information
Explain any important concepts that are central to understanding the experiment.
In paragraph form, define any scientific terms necessary for understanding the lab.
+Objective (NO hypothesis)
Explain what the purpose of the experiment or what goals you have in completing the lab. What do you hope to accomplish?
(No hypothesis)
IV: number of pennies
DV: density
+Write a Lab Report
Title (incl. name, data, partner’s names)
Objective (no hypothesis)
Background info (from notes, etc.)
DUE TOMORROW
+Procedure
For a lab where you have designed the procedure, include a detailed and complete account of every single step you completed during the lab, including how to make calculations. Be sure to include proper names for pieces of equipment!
If you have followed a procedure given by your teacher, write a summary of what you did. Do not rewrite the given procedure word for word.
+Data and Results
Include any charts, graphs, tables, technical drawings, observations, or diagrams in this section. Include a one sentence caption for each.
Data should be presented neatly, and with the use of computer software when possible.
If any calculations were necessary during this lab, include them here.
DO NOT explain the data.
+Analysis
Describe any patterns or trends in the data. Point out any relevant characteristics and comparisons that you see. Do not attempt to explain them, simply note them.
Note the existence of any data that does not seem to fit the overall patterns/trends.
+Conclusions
Draw conclusions from the patterns and observations you noted in the analysis section. Explain why the patterns you saw occurred.
Was the experiment successful at completing the objectives above? Explain why or why not.
Reflect on your hypothesis. Was it correct? Why or why not?
Was there any significant error in your experiment? Propose some possible sources of error and explain how they might be improved.
Answer questions (4) in lab handout in paragraph form.
+On a separate sheet of paper…Write the first draft of your lab report.
Work on your own.You may listen to music as long as I can’t hear it.
Label each section.
Be careful to include EVERY part listed in your lab report guide.
First draft due: next Thursday, Oct. 22